1 Boston University Summer Challenge Summer 2015 Electrical Engineering: Smart Lighting Prepared by: Prof. Thomas Little, [email protected], 617-353-9877, PHO 426 with contributions from Dr. Tarik Borogovac Edited by: Mr. Michael Rahaim, [email protected] Mr. Jimmy C. Chau, [email protected] Dr. Hany Elgala, [email protected] Mr. Ben Moll, [email protected] Mr. David Tran, [email protected] Website: hulk.bu.edu/courses/SmartLight

Welcome message from author
This document is posted to help you gain knowledge. Please leave a comment to let me know what you think about it! Share it to your friends and learn new things together.
Transcript

1
Boston University Summer Challenge Summer 2015
Electrical Engineering:
Smart Lighting
Prepared by: Prof. Thomas Little, [email protected], 617-353-9877, PHO 426
with contributions from Dr. Tarik Borogovac
Edited by: Mr. Michael Rahaim, [email protected]
Mr. Jimmy C. Chau, [email protected] Dr. Hany Elgala, [email protected]
Mr. Ben Moll, [email protected] Mr. David Tran, [email protected]
Website: hulk.bu.edu/courses/SmartLight

2
Syllabus
Instructor • Mr. Michael Rahaim - [email protected] - PHO 445 - 617-353-8042
Teaching Assistants • Mr. David Tran • Mr. Cristian Morales • Mr. Than Tsiligkaridis
Website http://hulk.bu.edu/courses/SmartLight/2015
Objectives • To become familiar with:
o basic electrical components, circuits and signals o functionality of some laboratory equipment o light emitting diode (LED) technology o visible light communication (VLC) technology
• To develop engineering communication skills • To develop an understanding of network / communication components • To develop an understanding of contemporary LED and lighting
Outcomes Upon completing this course, you will be able to:
• Use the Analog Discovery hardware platform and WaveForms™ software • Measure electrical and optical characteristics of LEDs • Build and characterize LED and photodiode (PD) circuits • Assemble a printed circuit board (PCB) • Implement software on an Arduino platform • Apply digital and analog modulation to establish a wireless VLC link • Work effectively with teammate(s) • Prepare an engineering lab notebook • Identify leading sources of LED and lighting industry news • Present a technical explanation of an engineering project

3
Schedule
Module Topic Activities
1 Introduction Overview of Electrical Engineering, Networks, Data Communication, and Smart Lighting
2 Analog Discovery Operating the Analog Discovery board, Digital and analog signals in time and frequency
3 Basic Circuits Investigate the operation of resistive and capacitive circuits
4 Light Emitting Diodes Investigate LED operation and electrical characterization
5 Photodiodes and Visible Light Comms
Investigate PD operation and optical channel characterization
6 The Smart Lighting VLC Board
PCB based VLC transceiver assembly Assignment: Presentation Topic Decision
7 Analog Transmission Investigate VLC transmission using analog signals
8 Digital Transmission Investigate VLC transmission using digital signals
9 VLC Applications VLC text messages and presentation rehearsal
10 Presentations Student presentations
Course Structure • Work in assigned teams (2 or 3 students per team). • Work with and help your teammate(s). • Collaborate with other teams. • Keep an individual lab notebook. • Tinkering/experimenting with the tools and components is good! • Modules may change depending on the progress of the class.

4
Laboratory Report Please keep a laboratory report to record your experiments. You should present a suitable lab report to demonstrate your accomplishments in each module. Key entries
• Name / Group Name • Date • Introduction to experiment • Sketches of laboratory setup • Measurements and calculations • Observations • Summary of the experiment • What you learned from the experiment
As a best practice, consider the following as you develop the report:
• Organization of entries in the notebook • Legible entries and clear descriptions • Consistency amongst entries
Having more detail will allow you to go back and reproduce earlier results, and be able to make claims against results that you obtained.
5
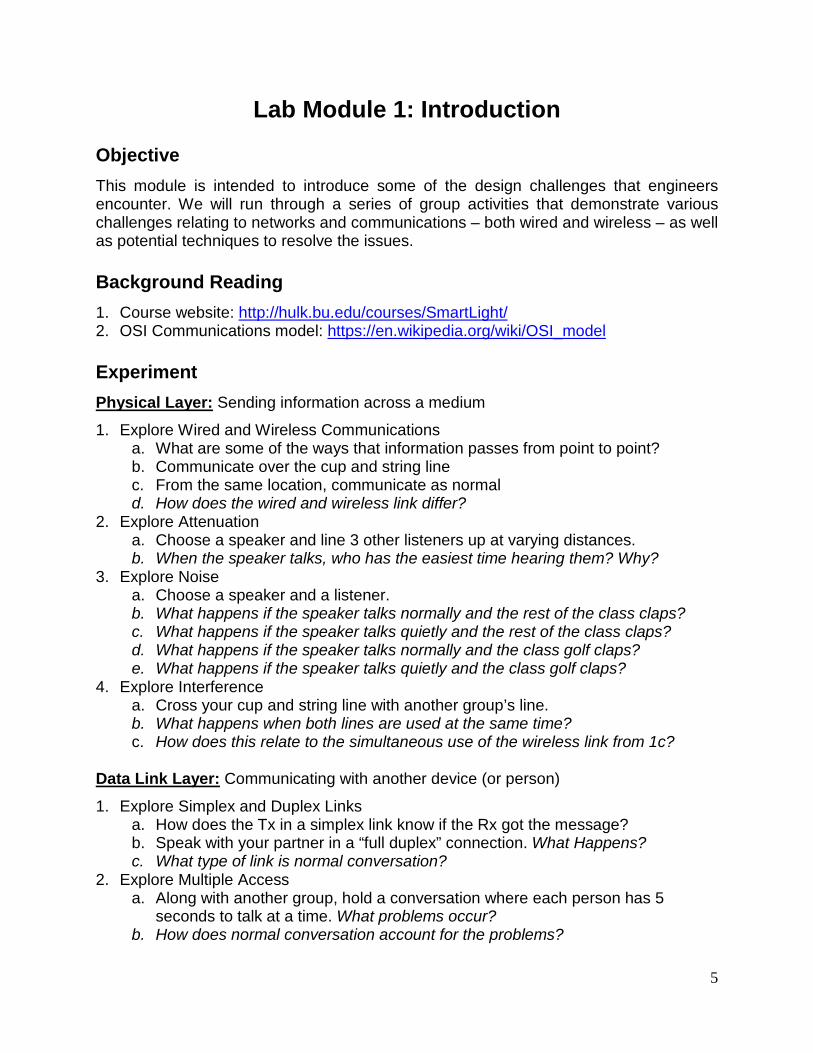
Lab Module 1: Introduction
Objective This module is intended to introduce some of the design challenges that engineers encounter. We will run through a series of group activities that demonstrate various challenges relating to networks and communications – both wired and wireless – as well as potential techniques to resolve the issues.
Background Reading 1. Course website: http://hulk.bu.edu/courses/SmartLight/ 2. OSI Communications model: https://en.wikipedia.org/wiki/OSI_model
Experiment Physical Layer: Sending information across a medium
1. Explore Wired and Wireless Communications a. What are some of the ways that information passes from point to point? b. Communicate over the cup and string line c. From the same location, communicate as normal d. How does the wired and wireless link differ?
2. Explore Attenuation a. Choose a speaker and line 3 other listeners up at varying distances. b. When the speaker talks, who has the easiest time hearing them? Why?
3. Explore Noise a. Choose a speaker and a listener. b. What happens if the speaker talks normally and the rest of the class claps? c. What happens if the speaker talks quietly and the rest of the class claps? d. What happens if the speaker talks normally and the class golf claps? e. What happens if the speaker talks quietly and the class golf claps?
4. Explore Interference a. Cross your cup and string line with another group’s line. b. What happens when both lines are used at the same time? c. How does this relate to the simultaneous use of the wireless link from 1c?
Data Link Layer: Communicating with another device (or person)
1. Explore Simplex and Duplex Links a. How does the Tx in a simplex link know if the Rx got the message? b. Speak with your partner in a “full duplex” connection. What Happens? c. What type of link is normal conversation?
2. Explore Multiple Access a. Along with another group, hold a conversation where each person has 5
seconds to talk at a time. What problems occur? b. How does normal conversation account for the problems?
6
Network Layer: Sending information through a series of links
1. Explore Addressing a. Write a message and attempt to send it to someone across the room. b. How does the message get to the destination?
2. Explore Message Passing a. Generate addresses for every node (i.e., student) in the class b. Generate the links and class graph c. Based on the graph, each student writes down their “routing table”
i. For each other destination address, where should you pass the message? d. Each student writes down 4 messages
i. Fold each message ii. Write the source address (your address) on the front iii. Write the destination address (where you’re sending to) on the front iv. Leave room for the route
e. Begin the message passing! When you receive a message: i. Add your address to the route ii. Keep count of the number of messages you’ve received iii. Determine who you should pass the message to based on the destination
address and your routing table iv. Pass the message
f. What are the trends? i. Did any messages fail to reach their destination? ii. How many messages did you receive? iii. How many messages did you pass? iv. How many nodes did your messages pass through?
Transport Layer: Communication with another device (or person) through the network
1. Explore Multi-packet Messaging a. Generate a message (a single sentence) and split the messages into 5 notes. b. Send the packets one at a time to the destination c. What happens when one of the messages is delayed?
2. Explore end-to-end Handshaking a. Send a multi-packet message, but wait for an acknowledgement to each packet
before sending the next packet. b. What’s the problem with this technique? How can this be resolved?
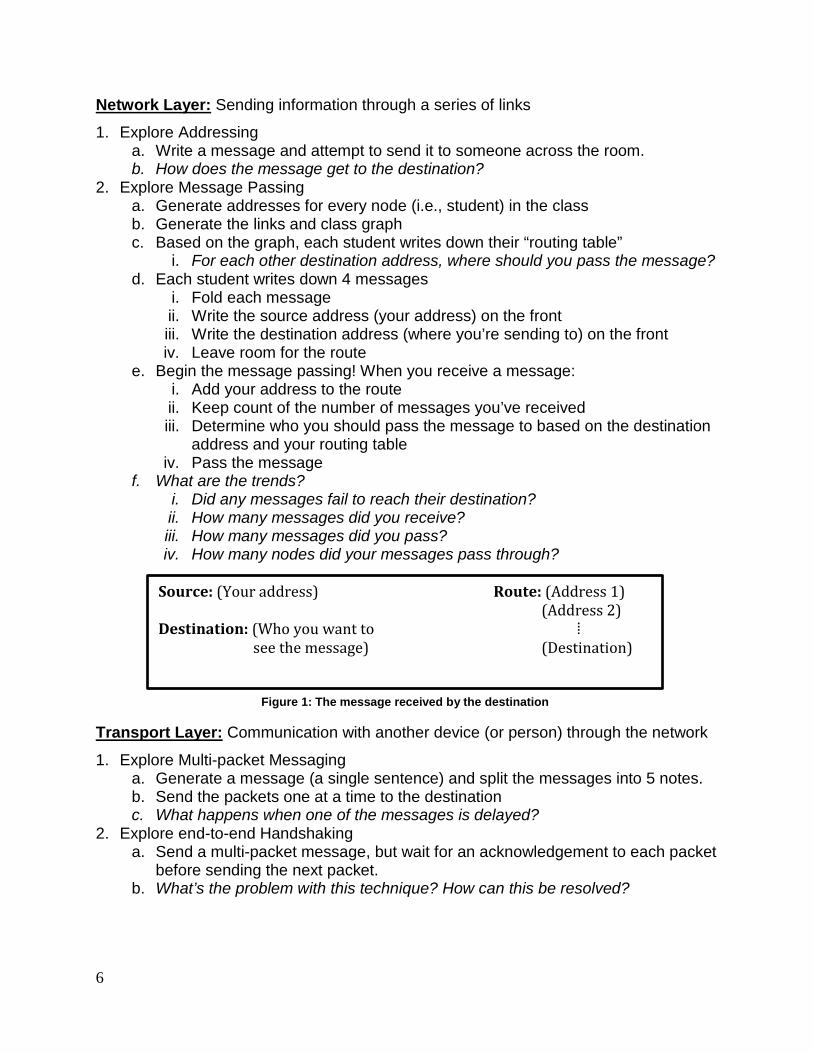
Source: (Your address) Route: (Address 1) (Address 2) Destination: (Who you want to ⁞ see the message) (Destination)
Figure 1: The message received by the destination

7
Lab Module 2(a): The Smart Lighting Kit
Objective In this module, you will explore the contents of the Smart Lighting Kit and the layout of the Analog Discovery board. This kit will be used throughout the course as we explore the basics of electrical circuits, signals, and communication.
Background Reading 1. Analog Discovery Project: www.digilentinc.com/AnalogDiscovery/ 2. Waveforms: www.digilentinc.com/WaveForms/
Figure 2: Contents of the Smart Lighting Kit
Contents of the Smart Lighting Lab Kit • 2 Analog Discovery Boards • 2 Arduino Boards • 2 USB to micro-B USB cables • Headphones • Magnifying Lens • Flashlight • Tape measure • Protractor • 2 Breadboards • 2 Wiring kits • Parts Kit
o Resistors and capacitors o Red, green and white LEDs o Photodiode(PD) o Operational amplifier (Op-Amp) o Exclusive-OR (XOR) gate o Header Pins
8
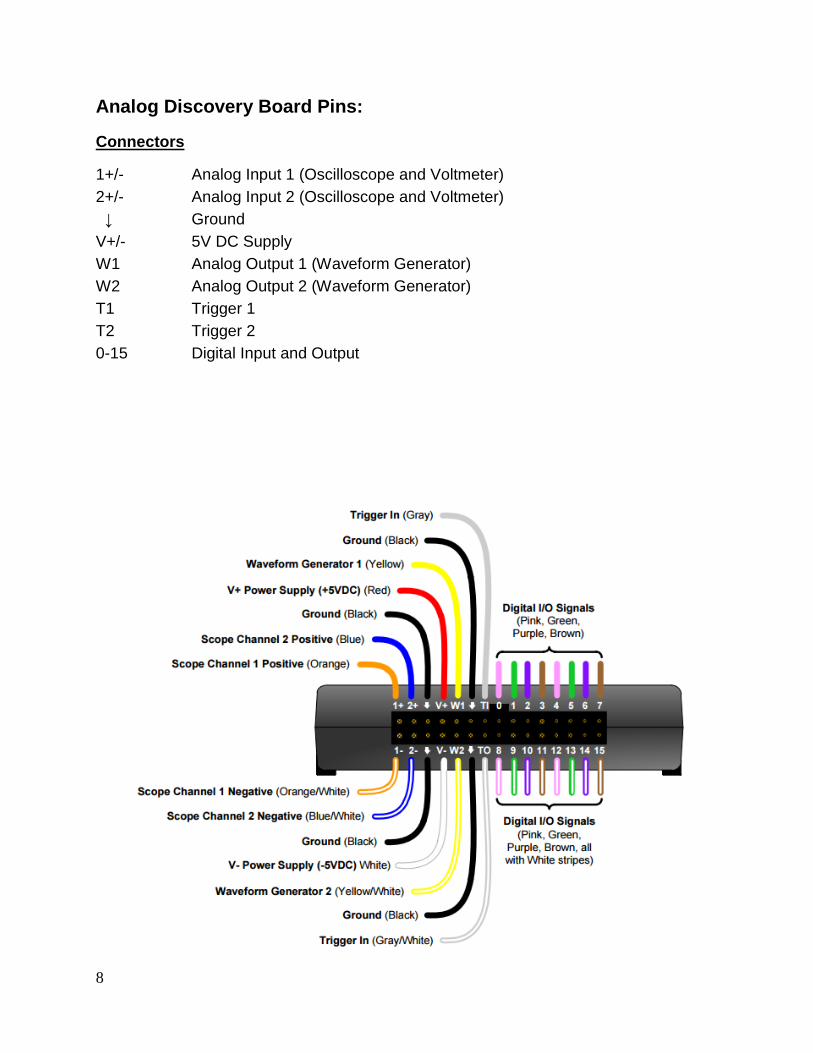
Analog Discovery Board Pins: Connectors
1+/- Analog Input 1 (Oscilloscope and Voltmeter) 2+/- Analog Input 2 (Oscilloscope and Voltmeter) ↓ Ground V+/- 5V DC Supply W1 Analog Output 1 (Waveform Generator) W2 Analog Output 2 (Waveform Generator) T1 Trigger 1 T2 Trigger 2 0-15 Digital Input and Output
9
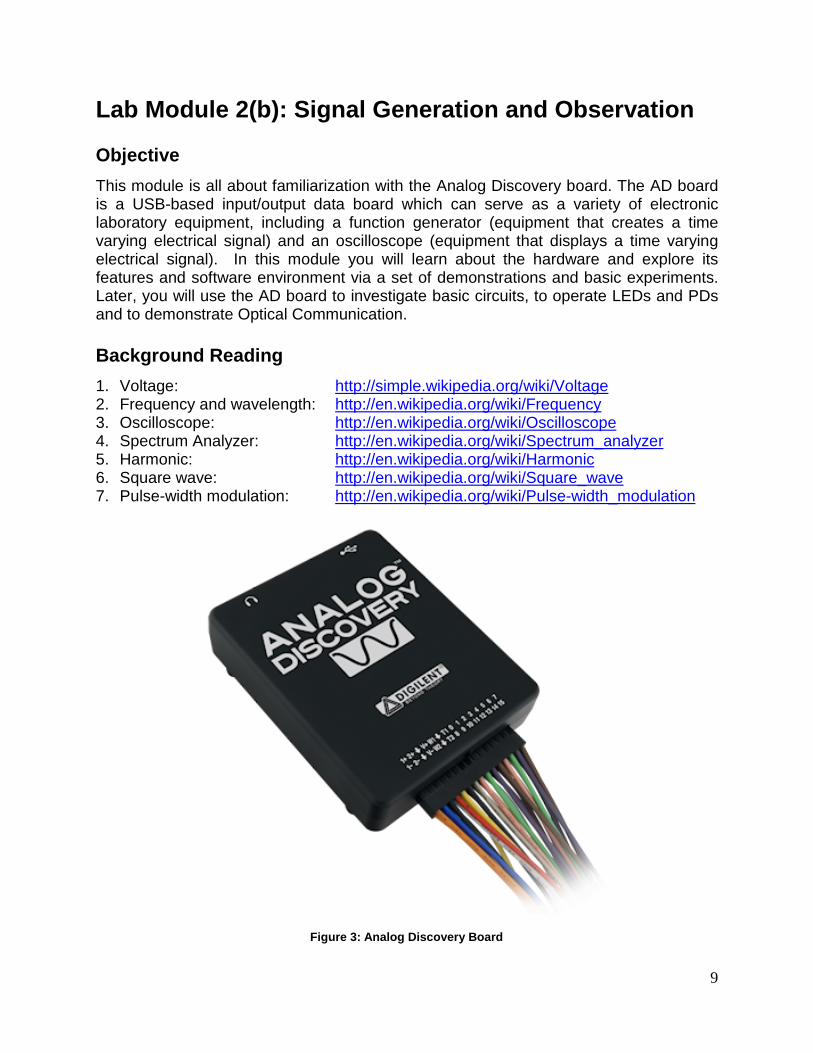
Lab Module 2(b): Signal Generation and Observation
Objective This module is all about familiarization with the Analog Discovery board. The AD board is a USB-based input/output data board which can serve as a variety of electronic laboratory equipment, including a function generator (equipment that creates a time varying electrical signal) and an oscilloscope (equipment that displays a time varying electrical signal). In this module you will learn about the hardware and explore its features and software environment via a set of demonstrations and basic experiments. Later, you will use the AD board to investigate basic circuits, to operate LEDs and PDs and to demonstrate Optical Communication.
Background Reading 1. Voltage: http://simple.wikipedia.org/wiki/Voltage 2. Frequency and wavelength: http://en.wikipedia.org/wiki/Frequency 3. Oscilloscope: http://en.wikipedia.org/wiki/Oscilloscope 4. Spectrum Analyzer: http://en.wikipedia.org/wiki/Spectrum_analyzer 5. Harmonic: http://en.wikipedia.org/wiki/Harmonic 6. Square wave: http://en.wikipedia.org/wiki/Square_wave 7. Pulse-width modulation: http://en.wikipedia.org/wiki/Pulse-width_modulation
Figure 3: Analog Discovery Board
10
AD Board and WaveForms Setup 1. You should log into a machine next to your teammate(s). 2. Unpack your kit. Attach each AD board to a separate computer. 3. Plug your AD board into the USB port and wait for drivers to install. 4. Once drivers have been installed, check for the Waveforms desktop icon and double
click to start. 5. When configuration is done, you will see a window labeled Digilent WaveForms with
a section for Analog and Digital “instruments.”
Software Orientation Here you will be introduced to the various functions provided by WaveForms as an interface to the AD board. The main functions considered in this module are: 1. Arbitrary Waveform Generator: Generates analog waveforms on output pins. 2. Static I/O: Send or receive logic high or low signals on digital pins. 3. Function Generator: Generate regular waveforms (sine, square and triangle). 4. Oscilloscope: Time domain display and measurement of signals. 5. Spectrum Analyzer: Frequency domain display and measurement of signals.
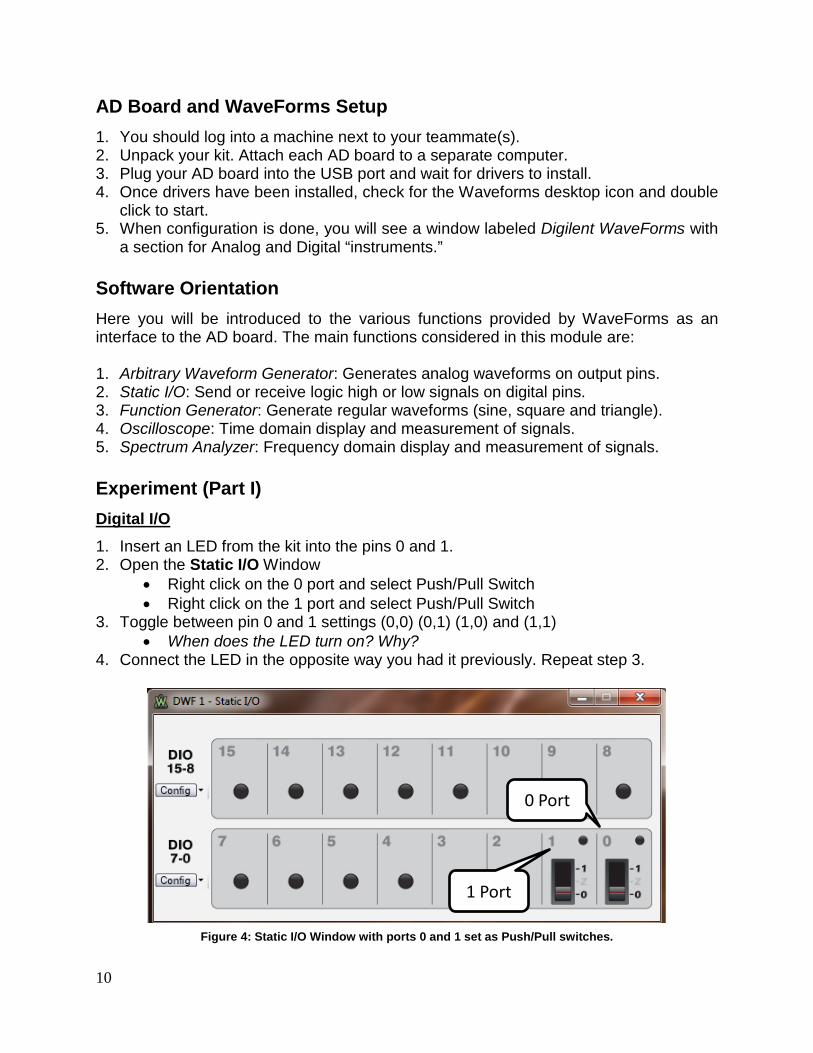
Experiment (Part I) Digital I/O
1. Insert an LED from the kit into the pins 0 and 1. 2. Open the Static I/O Window
• Right click on the 0 port and select Push/Pull Switch • Right click on the 1 port and select Push/Pull Switch
3. Toggle between pin 0 and 1 settings (0,0) (0,1) (1,0) and (1,1) • When does the LED turn on? Why?
4. Connect the LED in the opposite way you had it previously. Repeat step 3.
1 Port
0 Port
Figure 4: Static I/O Window with ports 0 and 1 set as Push/Pull switches.

11
Experiment (Part II) Waveform Generator
1. Setup • Connect the LED between W1 and Ground (polarity matters!). • Open the WaveGen waveform generator. • Select a square wave from the waveform select box. • Set min frequency to 1 Hz and max to 100 Hz. (Set frequency to 1Hz) • Set the amplitude and offset so that that the low signal is at 0V and the high
signal is at 3V. Hint: Observe the Signal Preview 2. Time and Frequency Analysis
• Select Run AWG 1 to start sending the signal. • Vary the Frequency from 1Hz to 100Hz
i. At what frequency do you no longer notice the flicker? • Open the Symmetry slider and vary from 0% to 100% (Duty Cycle)
i. What do you notice about the brightness of the LED? Why? 3. Phase Analysis
• On Channel 1, generate a 10kHz square wave with 1.5V amplitude, 1.5V offset, 50% symmetry and 0deg Phase.
• Enable Channel 2 and generate a similar square wave with a 90 degree phase shift (Open the Phase slider if it’s not already open).
i. How do the two waveforms differ? • Keep this open for the next section.
Waveform Select Signal Preview Setting Sliders
Run/Stop
Channel Select
Figure 5: Waveform Generator Window

12
Oscilloscope
4. Setup • Attach W1 to 1+. Attach W2 to 2+. • Attach 1- and 2- to Ground. • Open the Scope and set the time division (Base) to 100us/div • Set C1 and C2 Range to 1V/div • Set C1 offset to 1V and C2 offset to -4V • Select Run on the oscilloscope and Run All on the Waveform Generator.
5. Time and Frequency Analysis • Observe the received signal on the scope.
i. What is the difference between Channel 1 and 2? ii. Hint: Set the trigger to the middle of the signal to stabilize the output
• Modify various settings and observe the outcome: i. Change the time scale (Base) and signal range on the oscilloscope ii. Change Signal amplitude and frequency on the waveform generator. iii. What is the difference between the changes in i and ii?
6. Signal Analysis • Close Channel 2 on the wavegen and disable it on the oscilloscope. • Generate a 10kHz sine wave with 1V amplitude and 0V offset (Channel 1). • On the scope, change the Trigger condition (Cond.) from Falling to Rising.
i. What happens? • Change the trigger level to 500mV.
i. What happens? • Select Measure from the toolbar. If the Add Measurement window doesn’t
pop up, select +Add in the measurement window. • Add measurements for Channel 1 (Vertical: Voltage, Horizontal: Frequency)
i. Maximum Voltage, Average Voltage, Average Frequency
Run/Sto
Measure
Range
Base
Received Signal View
Trigger Settings
Figure 6: Oscilloscope Window
13
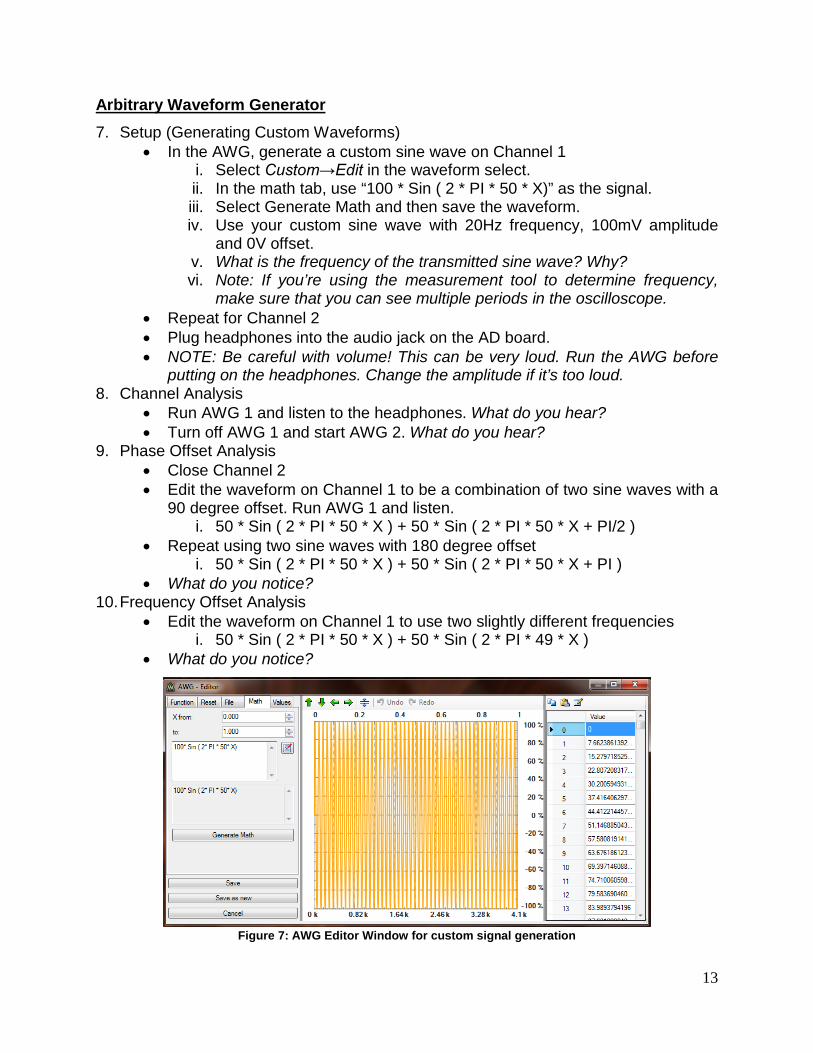
Arbitrary Waveform Generator
7. Setup (Generating Custom Waveforms) • In the AWG, generate a custom sine wave on Channel 1
i. Select Custom→Edit in the waveform select. ii. In the math tab, use “100 * Sin ( 2 * PI * 50 * X)” as the signal. iii. Select Generate Math and then save the waveform. iv. Use your custom sine wave with 20Hz frequency, 100mV amplitude
and 0V offset. v. What is the frequency of the transmitted sine wave? Why? vi. Note: If you’re using the measurement tool to determine frequency,
make sure that you can see multiple periods in the oscilloscope. • Repeat for Channel 2 • Plug headphones into the audio jack on the AD board. • NOTE: Be careful with volume! This can be very loud. Run the AWG before
putting on the headphones. Change the amplitude if it’s too loud. 8. Channel Analysis
• Run AWG 1 and listen to the headphones. What do you hear? • Turn off AWG 1 and start AWG 2. What do you hear?
9. Phase Offset Analysis • Close Channel 2 • Edit the waveform on Channel 1 to be a combination of two sine waves with a
90 degree offset. Run AWG 1 and listen. i. 50 * Sin ( 2 * PI * 50 * X ) + 50 * Sin ( 2 * PI * 50 * X + PI/2 )
• Repeat using two sine waves with 180 degree offset i. 50 * Sin ( 2 * PI * 50 * X ) + 50 * Sin ( 2 * PI * 50 * X + PI )
• What do you notice? 10. Frequency Offset Analysis
• Edit the waveform on Channel 1 to use two slightly different frequencies i. 50 * Sin ( 2 * PI * 50 * X ) + 50 * Sin ( 2 * PI * 49 * X )
• What do you notice?
Figure 7: AWG Editor Window for custom signal generation
14
Experiment (Part III) Spectrum Analyzer
1. Setup • Remove your headphones from the AD board. • Close the Oscilloscope. • Open the Spectrum Analyzer (From more instruments). • Make sure 1+ and 1- are still connected to W1 and Ground. • Run AWG1 from the waveform generator with a 1kHz sine wave with 1V
amplitude and 0V offset. • Run the spectrum analyzer and set the frequency range to “10kHz to
24.42Hz” and the reference level to 0dB. 2. Frequency Domain Analysis
• Explore the frequency components for sine waves of various frequencies. i. What are the frequency components of a sine wave?
• Update the function generator to send a square wave then a triangle wave and observe the frequency response of each. Expand the frequency range to show more detail.
i. What are the frequency components of the square wave? ii. What are the frequency components of the triangle wave?
3. Harmonics Analysis • Generate a custom sine wave and transmit with 1kHz frequency.
i. Hint: The custom sine should be “100 * Sin ( 2 * PI * X)” • Observe the received spectrum. • Add a sine wave at twice the frequency of the first and observe the spectrum.
i. Hint: The first signal, “Sin ( 2 * PI * X)”, has a frequency of 1. How do you add another sine wave with twice the frequency?
ii. Hint: You will need to change the amplitude to make sure the summed signal fits in the range of 0 to 100.
• Add another sine wave at three times the frequency of the first and observe the received spectrum.
• Add another sine wave at four times the frequency of the first and observe the received spectrum.
• How does the received signal spectrum change as you add sine waves? 4. Optional:
• Generate a square wave using multiple sine waves of various amplitudes. i. You can use the equation for sine waves found here:
https://en.wikipedia.org/wiki/Square_wave ii. The solution can be found in Square_Wave.txt in the Module 2 folder
on the course website.
Discussion and Wrap up • Update your laboratory report. • Be prepared to discuss your results with the class.
15
Lab Module 3: Basic Circuits
Objective In this module, you will investigate the operation of basic electronic circuits. You will first work with strictly resistive circuits to analyze series and parallel connections. You will then work with RC circuits to analyze the time varying effect of capacitance.
Background Reading 1. Resistors: http://en.wikipedia.org/wiki/Resistor 2. Resistor Color Code: http://en.wikipedia.org/wiki/Electronic_color_code 3. Resistor-Capacitor Circuit: http://en.wikipedia.org/wiki/RC_circuit
Overview 1. What is a circuit? 2. Current, voltage, resistance and capacitance 3. Ohm’s law 4. Voltage dividers 5. Reading a resistor value 6. Wiring of the breadboard
Experiment (Part I) Static Resistive Circuit
1. Setup • Create a circuit with 2 resistors in series
i. Schematic will be drawn on the board ii. Use a 1K ohm and 2.2K ohm resistor iii. connect one end of the circuit to +V and the other to Ground
• Calculate the expected current through this system of resistors using Ohm’s Law (Write the calculations and results in your lab notebook).
• Calculate the voltage across each resistor (again using Ohm’s law and the calculated current) and put the results in your notebook.
2. Ohms Law and Voltage Measurements • Measure voltage readings in the circuit
i. Open Voltage from the Analog options (5V supply voltage) ii. Turn on the 5V supply (Click on the “Power is OFF” button) iii. Open the Voltmeter from “more instruments” iv. Use 1+ and 1- to probe voltage across each resistor and across both.
• Compare your measured results with your calculations. • Optional: Add a parallel resistor, probe each point and record voltage
16
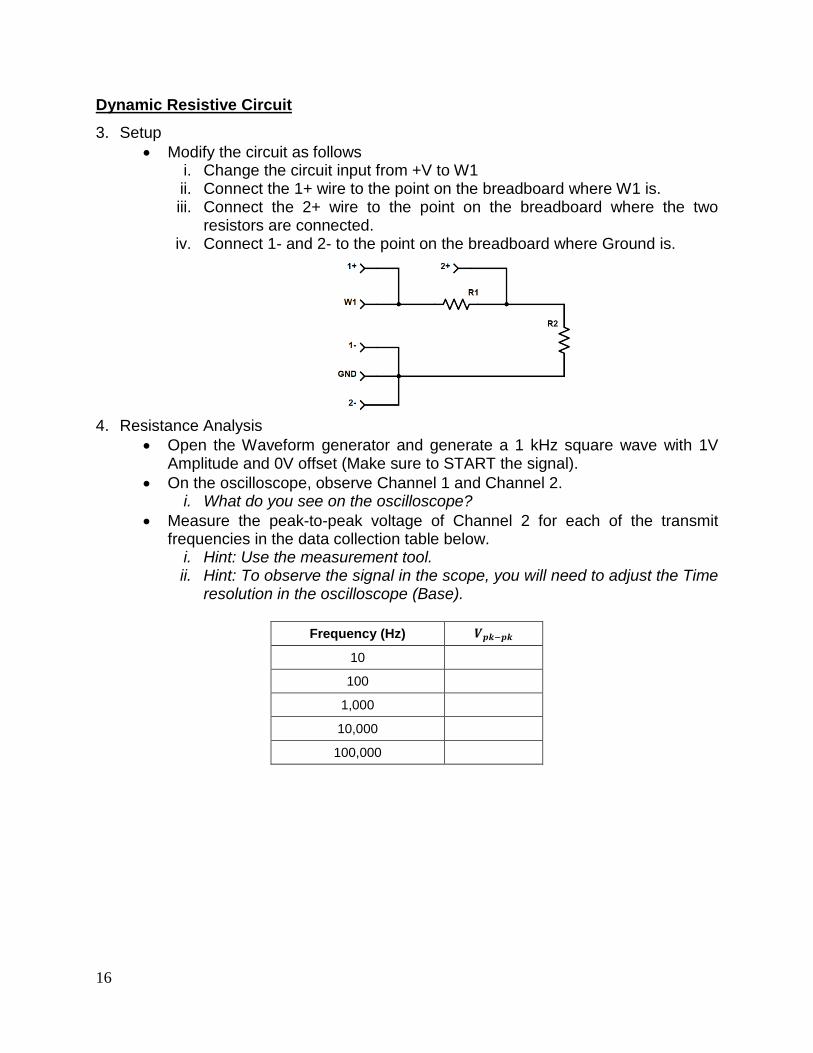
Dynamic Resistive Circuit
3. Setup • Modify the circuit as follows
i. Change the circuit input from +V to W1 ii. Connect the 1+ wire to the point on the breadboard where W1 is. iii. Connect the 2+ wire to the point on the breadboard where the two
resistors are connected. iv. Connect 1- and 2- to the point on the breadboard where Ground is.
4. Resistance Analysis
• Open the Waveform generator and generate a 1 kHz square wave with 1V Amplitude and 0V offset (Make sure to START the signal).
• On the oscilloscope, observe Channel 1 and Channel 2. i. What do you see on the oscilloscope?
• Measure the peak-to-peak voltage of Channel 2 for each of the transmit frequencies in the data collection table below.
i. Hint: Use the measurement tool. ii. Hint: To observe the signal in the scope, you will need to adjust the Time
resolution in the oscilloscope (Base).
Frequency (Hz) 𝑽𝒑𝒑−𝒑𝒑
10
100
1,000
10,000
100,000
17
Experiment (Part II) Static RC Circuit
1. Setup • Move the circuit input from W1 back to the V+ pin. • Replace the 2.2k Ohm resistor with the capacitor.
2. Observe Voltage across the resistor and the capacitor with the voltmeter. 3. Sketch the circuit and write down voltage observed across each component.
• Discuss with instructor or a TA before moving on.
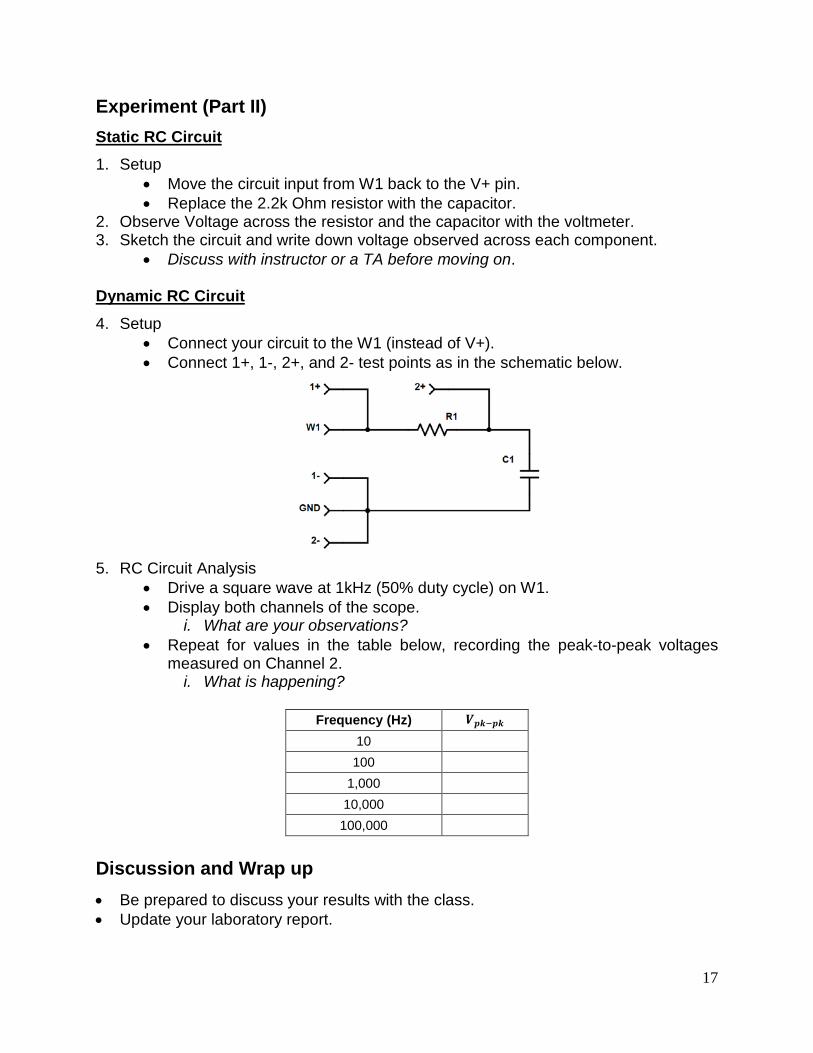
Dynamic RC Circuit
4. Setup • Connect your circuit to the W1 (instead of V+). • Connect 1+, 1-, 2+, and 2- test points as in the schematic below.
5. RC Circuit Analysis
• Drive a square wave at 1kHz (50% duty cycle) on W1. • Display both channels of the scope.
i. What are your observations? • Repeat for values in the table below, recording the peak-to-peak voltages
measured on Channel 2. i. What is happening?
Frequency (Hz) 𝑽𝒑𝒑−𝒑𝒑
10 100
1,000 10,000 100,000
Discussion and Wrap up • Be prepared to discuss your results with the class. • Update your laboratory report.

18
Lab Module 4: LEDs
Objective In this module, you will learn how to drive and characterize an LED. You will also learn to analyze power consumption of the driver.
Background Reading 1. LEDs: http://en.wikipedia.org/wiki/LED 2. Power: https://en.wikipedia.org/wiki/Electric_power
Overview 1. Electrical characteristics of LEDs. 2. LED driver circuit. 3. Electrical power consumption.
Experiment (Part I) LED Circuit
1. Setup • Build the circuit as shown in the schematic below; use the red LED. • Open the waveform generator and set Channel 1 to a 1 kHz sine wave with
3V Amplitude and 0V DC offset (the LED should turn-on). • Open the Oscilloscope tab and observe Channel 1 and 2
i. Volts/Div (Channels 1 and 2): 1V ii. Time/Div: 1ms
• Run the waveform generator and oscilloscope (record a screenshot). 2. Turn on Voltage Analysis
• Can you determine the turn-on voltage of this LED? • Select “Add XY” to open a plot of the voltage across R1 vs W1.
i. Can you determine now? • Replace the red LED with the white LED.
i. What is the turn-on voltage now?

19
Experiment (Part II) Power Consumption
1. Setup • Design an LED driver circuit based on a constant voltage and a desired
current of 33mA. • Assume you will use +5V as a supply voltage, a red LED and a resistor
connected in series with the LED. • Discuss with instructor or a TA before moving on.
2. Power Analysis • Build the circuit you designed.
i. What is the power consumed by the LED? • Replace the +5V with a +4V.
i. How much current flows through the LED? ii. How does this affect the LED brightness? iii. What is the power consumed by the LED now?
• What is the total power consumed by the circuit in each of the cases? • How much power is wasted in both cases?
2. PWM Analysis • Generate a PWM signal using a square wave with symmetry equal to the
desired PWM duty cycle. • Use the PWM signal to drive the same circuit and target LED power
consumption of 13.5mW. i. What is the duty cycle of this signal? ii. Hint: Power can be changed by varying the duty cycle. iii. Hint: use the Math channel.
Discussion and Wrap up • Be prepared to discuss your results with the class. • Update your laboratory report.
20
Lab Module 5: PDs and the Optical Channel
Objective To build a PD receiver circuit and use the circuit to characterize the optical channel and establish a wireless communication link between an LED and a PD using visible light.
Background reading 1. Photodiode: https://en.wikipedia.org/wiki/Photodiode 2. Operational Amplifier: http://en.wikipedia.org/wiki/Operational_amplifier 3. Optical Communications: http://en.wikipedia.org/wiki/Optical_communication
Overview 1. Photodiodes 2. LM741 Operational Amplifier (Op-Amp) 3. Intensity Modulation and Direct Detection (IM/DD) 4. LED biasing 5. Integrated Circuit (IC)
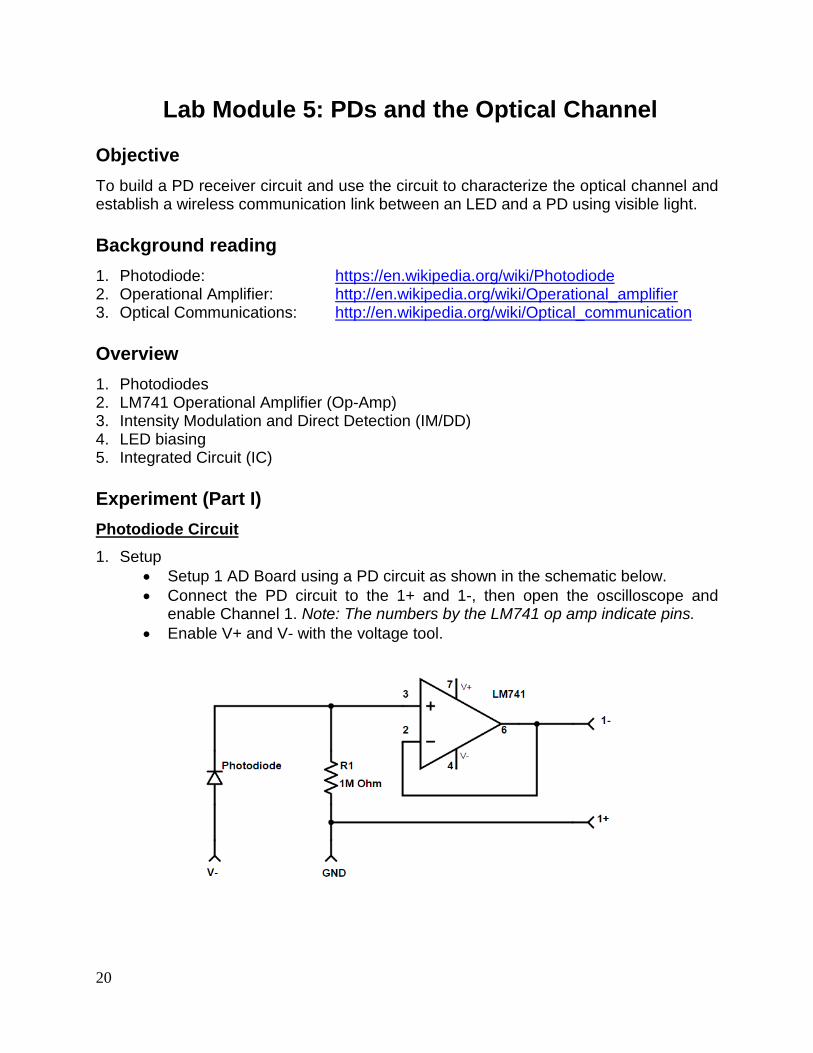
Experiment (Part I) Photodiode Circuit
1. Setup • Setup 1 AD Board using a PD circuit as shown in the schematic below. • Connect the PD circuit to the 1+ and 1-, then open the oscilloscope and
enable Channel 1. Note: The numbers by the LM741 op amp indicate pins. • Enable V+ and V- with the voltage tool.
21
Channel Measurements
2. Qualitative Measurement • Observe the ambient light and make sure it changes when you cover the
photodiode. • Hint: Set your oscilloscope settings to Volts/Div: 1 V and Time/Div: 10 ms
i. What is the ambient light level? ii. How does it change when you cover the PD with your hand?
• Use an optical mouse as a light source. • Take a screenshot of the signal emitted from the optical mouse and
determine its frequency. • Hint: Use the Measurement Window to get the frequency.
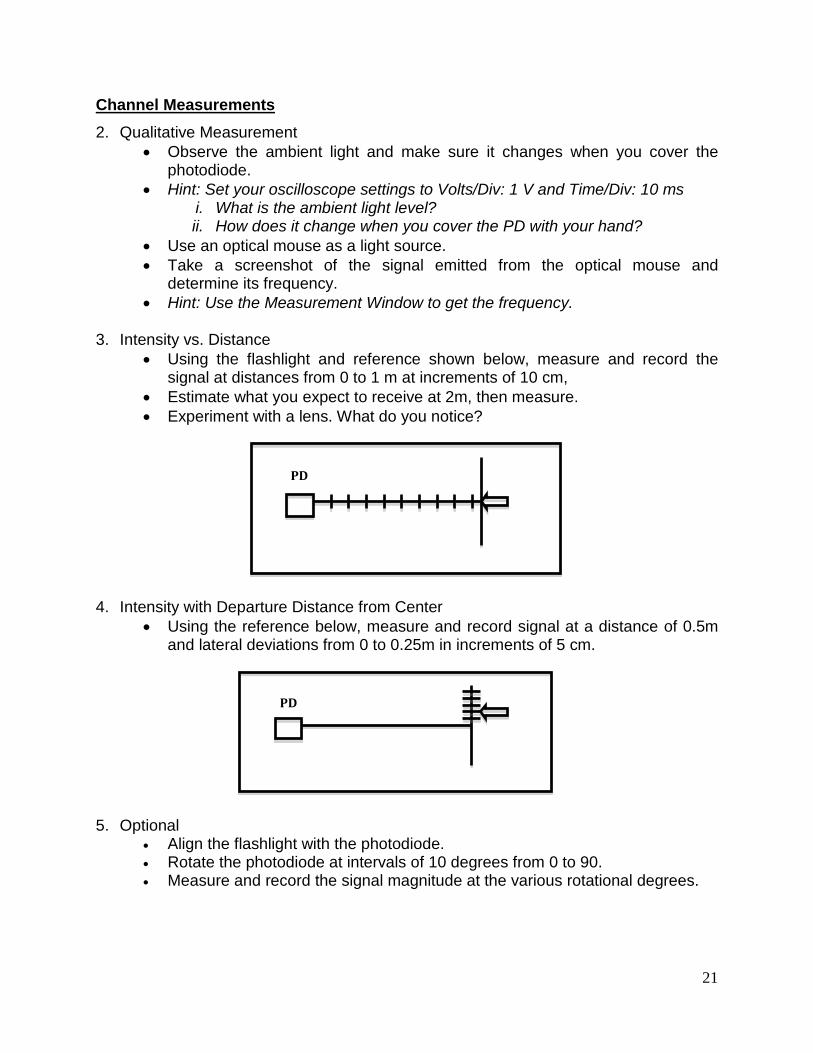
3. Intensity vs. Distance
• Using the flashlight and reference shown below, measure and record the signal at distances from 0 to 1 m at increments of 10 cm,
• Estimate what you expect to receive at 2m, then measure. • Experiment with a lens. What do you notice?
4. Intensity with Departure Distance from Center • Using the reference below, measure and record signal at a distance of 0.5m
and lateral deviations from 0 to 0.25m in increments of 5 cm.
5. Optional • Align the flashlight with the photodiode. • Rotate the photodiode at intervals of 10 degrees from 0 to 90. • Measure and record the signal magnitude at the various rotational degrees.
PD
PD
22
Experiment (Part II) Optical Signals
1. Send square wave modulated light to the receiver. • On a second AD board, connect the red LED to the W1 and GND pins. • Use the Function Generator to produce a 1 kHz square wave with 1.5V
Amplitude and 1.5 V offset. This drives a square wave as an optical output. • Point the LED at the PD (around 10 cm). Take a screenshot. • Observe the output via the spectrum analyzer. You should see a peak at 1
kHz fundamental frequency and harmonics. • Move the LED and notice the effect on the amplitude of the different peaks.
Take screenshots.
2. For the same setup at less than 10 cm distance between the LED and the PD, try with 5 kHz, 10 KHz and 20 KHz square waves.
• Take screenshots and use the Measurement Window to get the peak-to-peak of the signal.
• What do you notice as the frequency increases? • Hints: Manually adjust the Time/Div as you change the frequency.
Discussion and Wrap up • Be prepared to discuss your results with the class. • Update your laboratory report.
23
Module 6: The Smart Lighting Board
Objective In this module, you will assemble a VLC transceiver. The assembled PCB will be used in subsequent modules. If time is available, we will introduce the Arduino.
Background Reading 1. Soldering: http://en.wikipedia.org/wiki/Soldering 2. Soldering Techniques: http://www.elexp.com/t_solder.htm 3. Printed Circuit Board (PCB): http://en.wikipedia.org/wiki/Printed_circuit_board
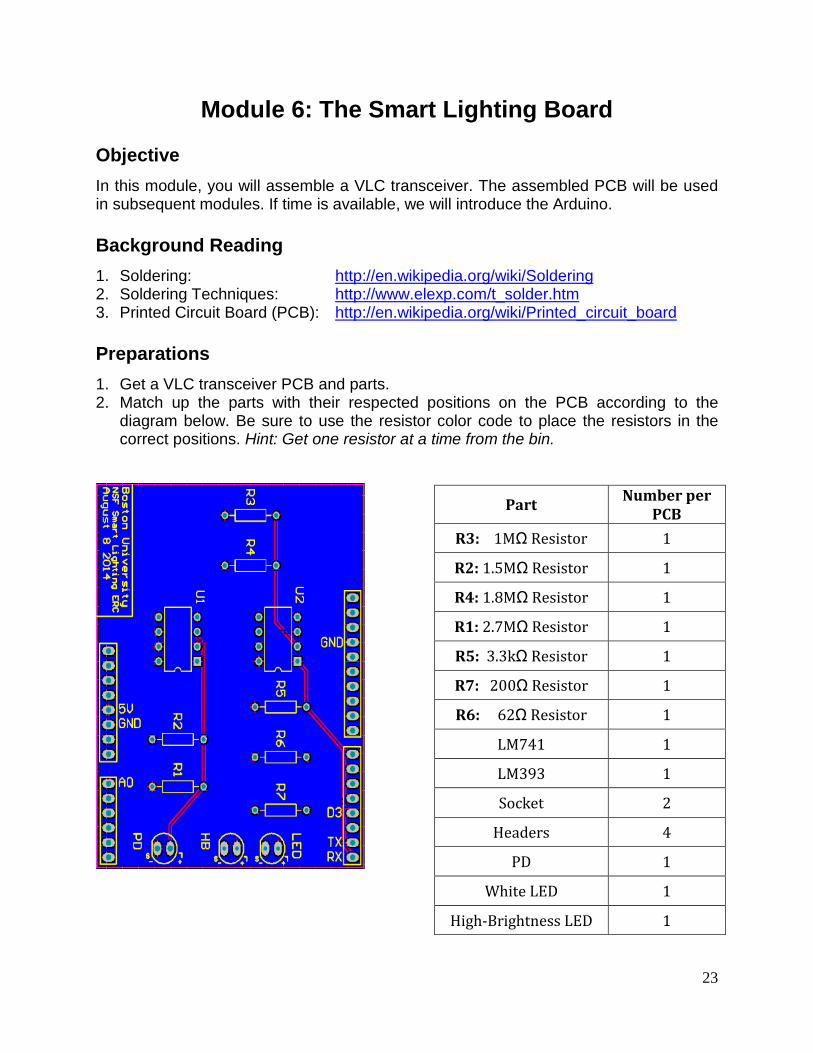
Preparations 1. Get a VLC transceiver PCB and parts. 2. Match up the parts with their respected positions on the PCB according to the
diagram below. Be sure to use the resistor color code to place the resistors in the correct positions. Hint: Get one resistor at a time from the bin.
Part Number per PCB
R3: 1MΩ Resistor 1
R2: 1.5MΩ Resistor 1
R4: 1.8MΩ Resistor 1
R1: 2.7MΩ Resistor 1
R5: 3.3kΩ Resistor 1
R7: 200Ω Resistor 1
R6: 62Ω Resistor 1
LM741 1
LM393 1
Socket 2
Headers 4
PD 1
White LED 1
High-Brightness LED 1

24
Workflow 1. Insert the parts from the top side of the PCB (silkscreen). 2. You can bend long leads to hold the part in place. 3. Turn the PCB over and start soldering. 4. Solder the IC sockets, NOT the actual ICs. 5. Solder the short end of the headers to the PCB. 6. Make sure the LEDs and Photodiode are oriented correctly. 7. Have one of the teaching assistants check your board for shorts. 8. Populate the IC sockets with the associated ICs. 9. Trim long leads and you are done.
25
Lab Module 7: Analog Transmission
Objective In this module, you will investigate LED modulation using analog signals. You will first explore potential limitations including clipping and distortion. You will then implement audio transmission over the optical channel and analyze analog to digital conversion.
Background reading 1. Analog signals: http://en.wikipedia.org/wiki/Analogue_signal 2. Amplitude modulation: http://en.wikipedia.org/wiki/Amplitude_modulation 3. Sampling: http://en.wikipedia.org/wiki/Sampling_(signal_processing)
Overview • The Audio Signal Path • Sampling Theorem • Amplitude modulation; RF vs. VLC
Experiment (Part I) Using the VLC Transceiver
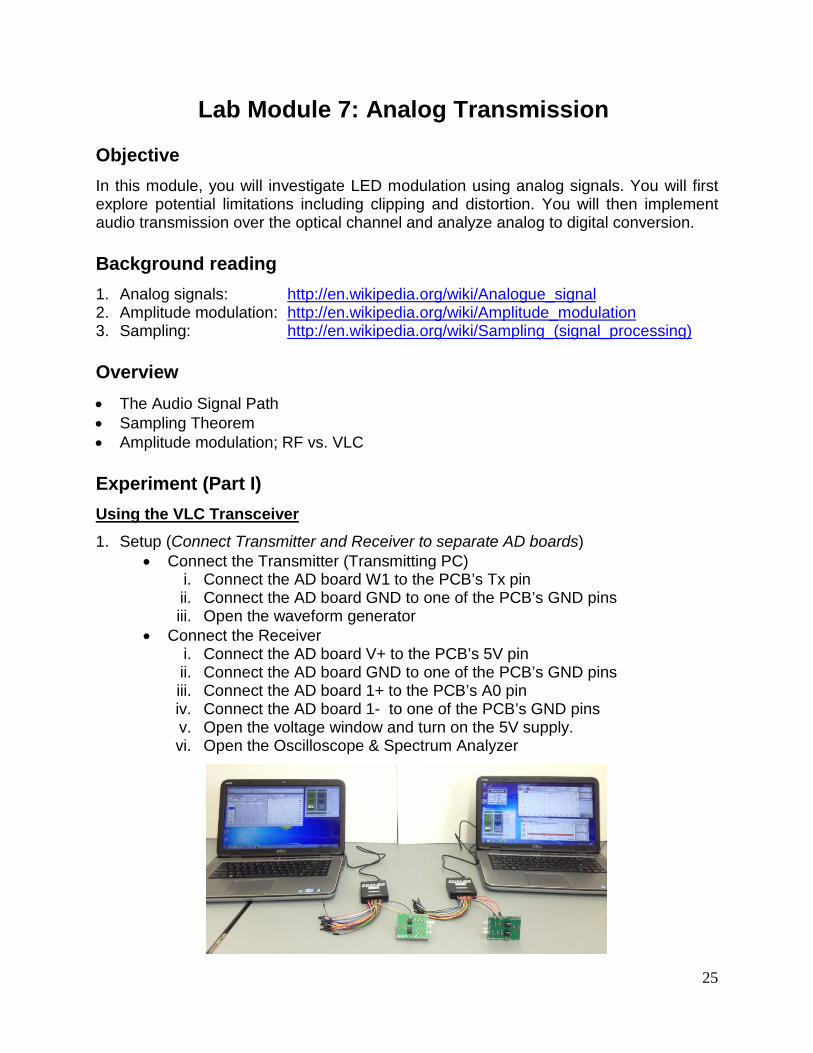
1. Setup (Connect Transmitter and Receiver to separate AD boards) • Connect the Transmitter (Transmitting PC)
i. Connect the AD board W1 to the PCB’s Tx pin ii. Connect the AD board GND to one of the PCB’s GND pins iii. Open the waveform generator
• Connect the Receiver i. Connect the AD board V+ to the PCB’s 5V pin ii. Connect the AD board GND to one of the PCB’s GND pins iii. Connect the AD board 1+ to the PCB’s A0 pin iv. Connect the AD board 1- to one of the PCB’s GND pins v. Open the voltage window and turn on the 5V supply. vi. Open the Oscilloscope & Spectrum Analyzer
26
2. Intensity Modulated Sine Wave • Align the transmitting and receiving PCBs about 10cm apart. • Send a 1kHz sine wave with 80mV amplitude and 3V offset. • Run the oscilloscope (Use 1ms/div and 1V/div) • Take screen shots as you proceed with the following • Adjust the alignment and distance until you see a sine wave at the receiver.
i. Does the frequency response show a pure sine wave? ii. What happens in time and frequency when the receiver moves closer to
the transmitter? Why? • Return the receiver back to where you can see a pure sine wave.
i. What happens in time and frequency when you change the amplitude? ii. What happens when you change the offset?
Experiment (Part II) Audio Transmission
1. Find an audio file (.wav) online and download it to your desktop • The file needs to be relatively small (under 15kB) • You can find some files here: http://www.wavsource.com/
2. Transmitting an audio file • In the waveform generator, select player from the waveform select options. • Click “Add” and find the .wav file you downloaded. • Set the frequency to the same frequency as the file (shown in the waveform
select window) 3. Receiving the audio file
• At the receiver, open the “audio” window (tab at the top of the oscilloscope) • Set “Output” to the frequency of the file you are transmitting • Change the time division (Base) until the “Speed” becomes 1X (or close to it) • Select “Play” From the audio window
4. What happens when two audio signals are received simultaneously by one PD? • Hint: work together with a second team. • Observations?
Discussion and Wrap up • Be prepared to discuss your with the class. • Update your laboratory report.

27
Lab Module 8: Digital Transmission
Objective To investigate LED modulation using pulsed techniques. In the lab you will establish communication using On-Off Keying (OOK) and Manchester encoding. You will also be introduced to the Arduino platform and implement some basic serial communications.
Background reading 1. On-Off Keying: http://en.wikipedia.org/wiki/On-off_keying 2. Manchester Code: http://en.wikipedia.org/wiki/Manchester_code 3. Logic Gate: https://en.wikipedia.org/wiki/Logic_gate 4. Exclusive OR: http://en.wikipedia.org/wiki/Exclusive_or 5. Arduino: www.arduino.cc/
Overview 1. Encoding and On-Off Keying 2. Manchester Coding 3. Logic Gates
Experiment (Part II) OOK Modulation and Manchester Encoding
1. Setup • Define a sequence of 10 bits with an equal number of 0’s and 1’s
i. Call this S1 write the sequence in your notes (e.g., 1001101001) • Define a random sequence of 10 bits with an unequal number of 0’s and 1’s
i. Call this S2 write the sequence in your notes (e.g., 1010000100) • Connect a PCB as a transmitter (In the same way as Module 7 Part I) • Open the WaveGen and create a custom OOK signal representing S1
i. Select “Custom” waveform and edit to open the AWG editor ii. Reset the waveform (Reset tab, 0%, Generate reset) iii. Click and drag your mouse on the signal preview to generate your signal iv. Save the custom waveform
28
2. Optical OOK Signal Analysis • Run the custom signal at 1kHz with 1.5V Amplitude and 1.5V offset. • Create a new custom OOK signal using the data from S2 and run it.
i. What is the difference? ii. Why could this be a problem?
• Generate a custom signal that represents S2 with the Manchester encoding. i. How does the optical power change with different bit combinations?
Logic Gates
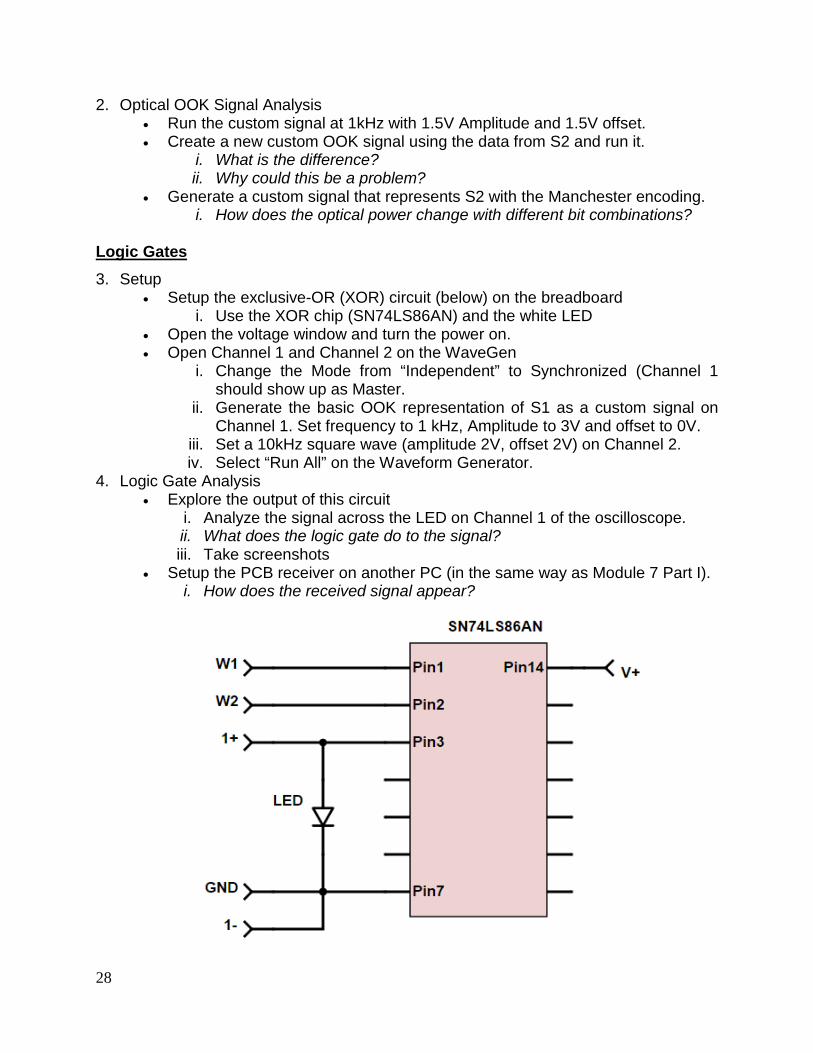
3. Setup • Setup the exclusive-OR (XOR) circuit (below) on the breadboard
i. Use the XOR chip (SN74LS86AN) and the white LED • Open the voltage window and turn the power on. • Open Channel 1 and Channel 2 on the WaveGen
i. Change the Mode from “Independent” to Synchronized (Channel 1 should show up as Master.
ii. Generate the basic OOK representation of S1 as a custom signal on Channel 1. Set frequency to 1 kHz, Amplitude to 3V and offset to 0V.
iii. Set a 10kHz square wave (amplitude 2V, offset 2V) on Channel 2. iv. Select “Run All” on the Waveform Generator.
4. Logic Gate Analysis • Explore the output of this circuit
i. Analyze the signal across the LED on Channel 1 of the oscilloscope. ii. What does the logic gate do to the signal? iii. Take screenshots
• Setup the PCB receiver on another PC (in the same way as Module 7 Part I). i. How does the received signal appear?

29
Experiment (Part II) Arduino
1. Setup • Plug the Arduino into your computer using the USB cable. • Open the Arduino software (there should be a shortcut on the desktop). • Under Tools, select “Arduino Leonardo” as the board. • Under Tools, select the Port labeled “Arduino Leonardo”.
2. Serial Communication with the Arduino • In the setup function, add the following line of code to enable serial
communications with the Arduino when it runs: i. Serial.begin(9600);
• In the loop function, add the code from the figure below. This will make the Arduino check for input characters on the serial line. When a character is available, it will read the character and send the string “Hello!”
i. Note: The lines following “//” are comments. • Select the checkmark in the top left of the window to verify the code
i. You will be asked to name the file (Save to your desktop). • If the code was verified, select the arrow next to the checkmark to upload the
code to the Arduino. This will generate code and store it on the Arduino. • Once the code is uploaded, open the Arduino serial monitor by selecting the
magnifying glass in the top right of the window. • Type a character and hit enter (or Send)
i. The Arduino should reply by sending back “Hello!”
3. Turning on an LED with the Arduino • Connect an LED from pin 10 to GND on the Arduino (Remember polarity!) • In the setup function, enable pin 10 as an output pin with the following:
i. pinMode(10,OUTPUT); • Inside your if statement, add the following line to set pin 10 to 3.3V:
i. digitalWrite(10,HIGH); • Verify and run the code. When you send a character, the LED should turn on! • Optional: Improve the code! Use a variable so that the LED turns off with the
second character received (an on for the third, and so on…)
30
Lab Module 9: VLC Applications
Objective To demonstrate VLC texting between two computers using the PCB-based VLC transceiver assembled earlier in the course and digital transmission. You will drive the VLC transceivers using the serial output of the Arduino and messages can be sent between serial ports on two different computers!
Background Reading 1. Serial Communication: https://en.wikipedia.org/wiki/Serial_communication 2. ASCII: https://en.wikipedia.org/wiki/ASCII
Experiment VLC Text Messaging
1. Setup • Download the sc_code.ino from the course website and save in a folder on
your desktop. (On both computers) • Open Arduino and then open the sc_code.ino file
i. Arduino should ask you to create a folder for the project (select Yes). • Connect two VLC transceivers as follows (same for both transceivers).
i. Ensure that the pins are properly aligned (it will only fit one way). • Go to Tools and ensure that Board is set to Arduino Leonardo and Serial Port
matches the port which the Arduino is attached to. Upload the program. 2. Communicating with another Board
• Open the Serial Monitor and wait for your partner to do the same. i. When you are both set up, type and send a message!
• Change the distance between PCBs in order to receive an accurate message. • You are texting with optical wireless communication! Enjoy!
Discussion and Wrap up • Be prepared to discuss your results with the class. • Update your laboratory report. • Prepare your presentation for tomorrow!

31
Lab Module 10: Final Presentation
Tips on creating the slides • Your goal is to explain to your audience something that is new to them. • Illustrations, photos, graphs and other visuals are effective. • A table is less effective, and should be used judiciously. • A full page of text is usually a bad idea. If absolutely necessary, use a bullet with
a very short phrase. There shouldn’t be more than 10-15 words on a slide.
Tips on presenting • Try to avoid reading from the slide. • Practice aloud beforehand and learn to maintain your pace.
Additional activities for engineering enthusiasts: • Khan Academy: www.khanacademy.org • Code Academy: www.codecademy.com/ • Physics Classroom: www.physicsclassroom.com/class • All about circuits: www.allaboutcircuits.com/ • Arduino: www.arduino.cc/ • Analog Discovery Course: www.digilentinc.com/Classroom/RealAnalog/
32
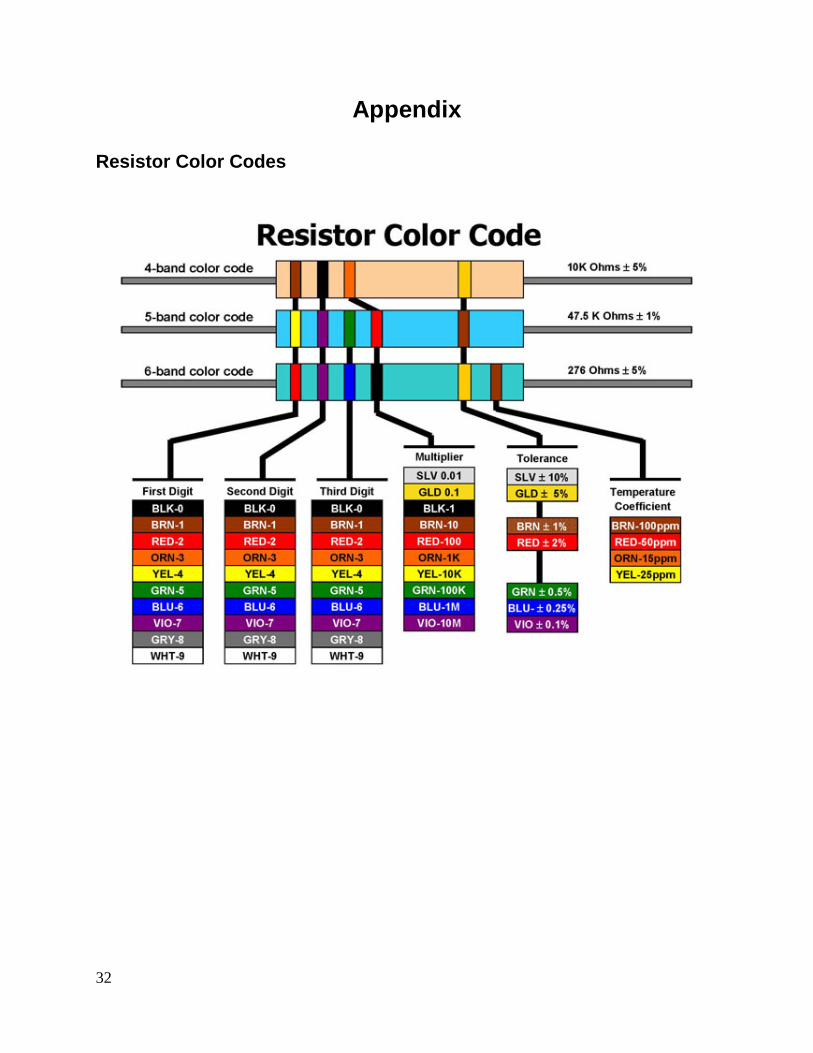
Appendix
Resistor Color Codes
Related Documents


