[Type text] Vidyarthiplus.com Vidyarthiplus.com ELECTRICAL CIRCUITS LABORATORY MANUAL (II - SEMESTER)

Welcome message from author
This document is posted to help you gain knowledge. Please leave a comment to let me know what you think about it! Share it to your friends and learn new things together.
Transcript
[Type text]
Vidyarthiplus.com
Vidyarthiplus.com
ELECTRICAL CIRCUITS LABORATORY MANUAL
(II - SEMESTER)

[Type text]
Vidyarthiplus.com
Vidyarthiplus.com
1
[Type text]
Vidyarthiplus.com
Vidyarthiplus.com
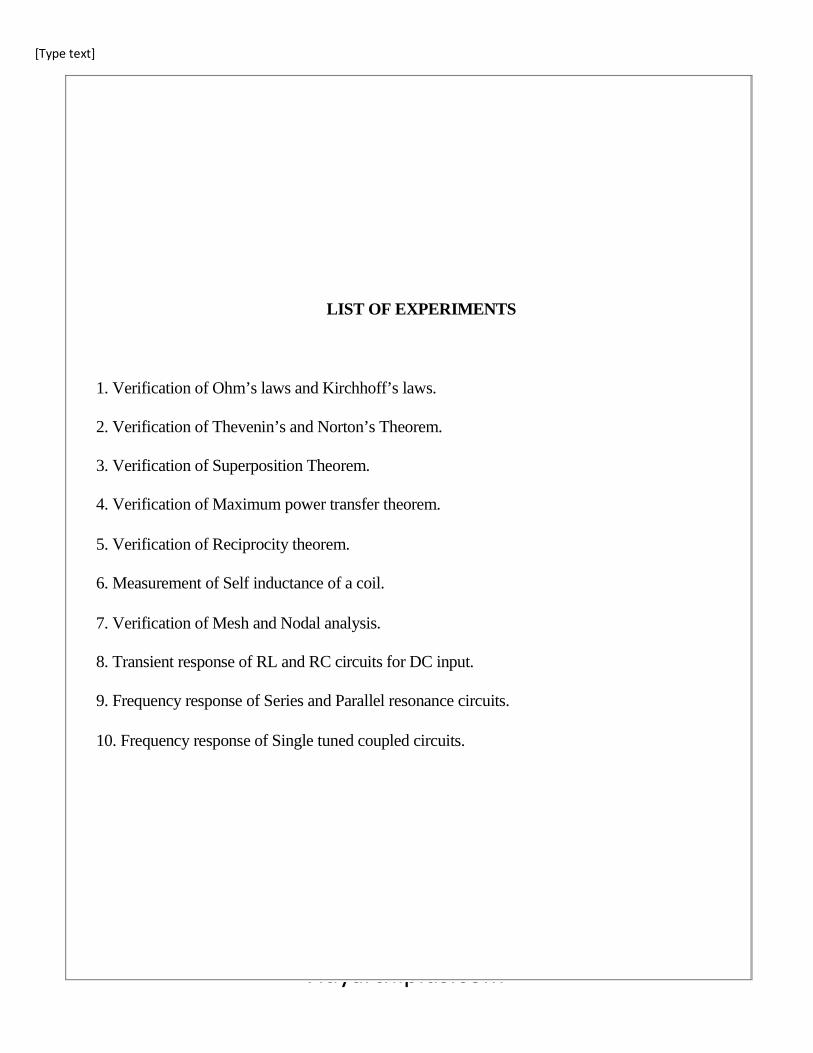
LIST OF EXPERIMENTS 1. Verification of Ohm’s laws and Kirchhoff’s laws.
2. Verification of Thevenin’s and Norton’s Theorem.
3. Verification of Superposition Theorem.
4. Verification of Maximum power transfer theorem. 5. Verification of Reciprocity theorem.
6. Measurement of Self inductance of a coil. 7. Verification of Mesh and Nodal analysis.
8. Transient response of RL and RC circuits for DC input.
9. Frequency response of Series and Parallel resonance circuits. 10. Frequency response of Single tuned coupled circuits.

[Type text]
Vidyarthiplus.com
Vidyarthiplus.com
2
[Type text]
Vidyarthiplus.com
Vidyarthiplus.com
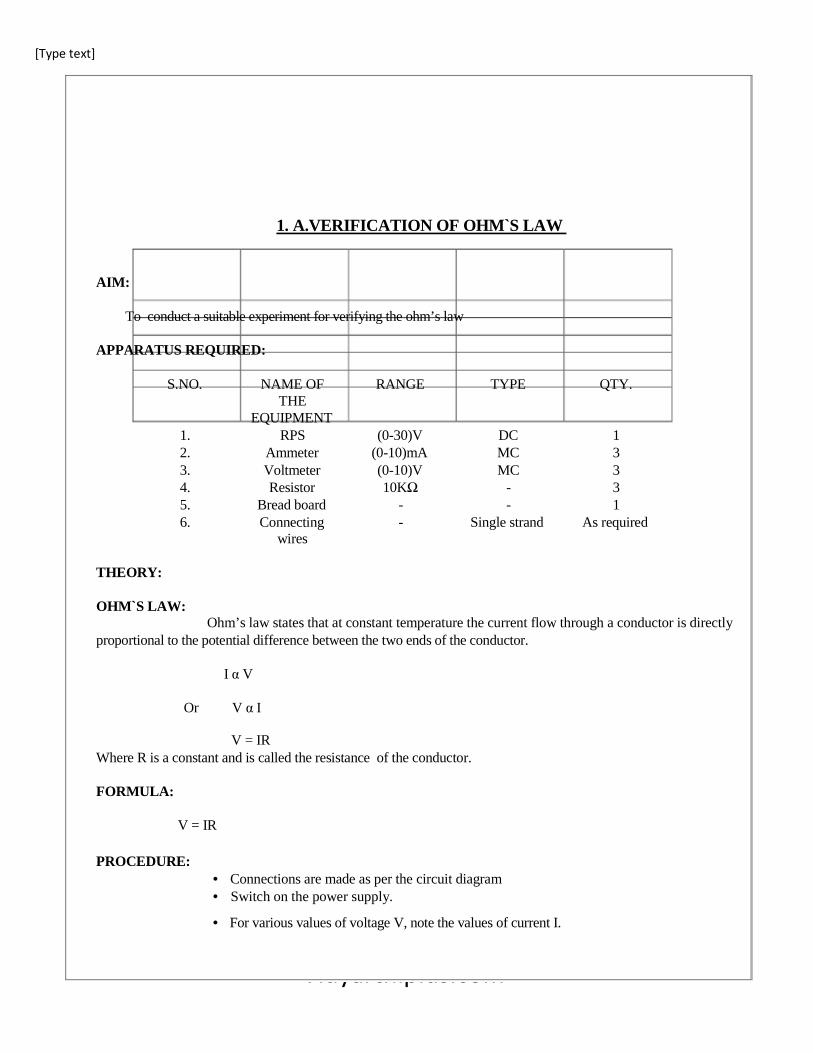
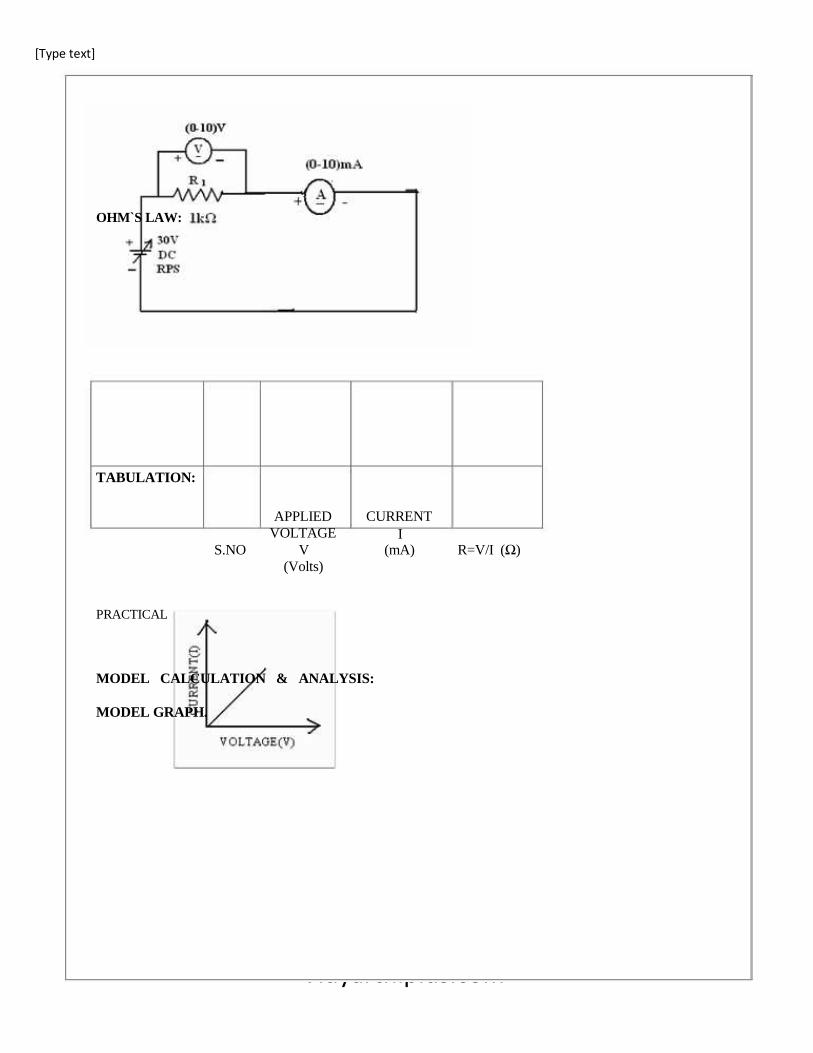
1. A.VERIFICATION OF OHM`S LAW AIM:
To conduct a suitable experiment for verifying the ohm’s law
APPARATUS REQUIRED:
S.NO. NAME OF RANGE TYPE QTY.
THE EQUIPMENT
1. RPS (0-30)V DC 1 2. Ammeter (0-10)mA MC 3 3. Voltmeter (0-10)V MC 3 4. Resistor 10KΩ - 3 5. Bread board - - 1 6. Connecting - Single strand As required
wires THEORY: OHM`S LAW:
Ohm’s law states that at constant temperature the current flow through a conductor is directly proportional to the potential difference between the two ends of the conductor.
I α V
Or V α I
V = IR Where R is a constant and is called the resistance of the conductor. FORMULA:
V = IR
PROCEDURE:
• Connections are made as per the circuit diagram • Switch on the power supply.
• For various values of voltage V, note the values of current I.

[Type text]
Vidyarthiplus.com
Vidyarthiplus.com
• Draw a graph of Voltage Vs Current.
• The Slope of the graph gives the resistance value.
• Ohm’s law is verified by measuring the value of R using multimeter and comparing
with the experimental value.
3
[Type text]
Vidyarthiplus.com
Vidyarthiplus.com
OHM`S LAW:
TABULATION:
APPLIED CURRENT VOLTAGE I
S.NO V (mA) R=V/I (Ω) (Volts)
PRACTICAL
MODEL CALCULATION & ANALYSIS:
MODEL GRAPH.

[Type text]
Vidyarthiplus.com
Vidyarthiplus.com
RESULT:
Thus the ohm’s law is verified.
4

[Type text]
Vidyarthiplus.com
Vidyarthiplus.com
1.B.VERIFICATION OF KVL & KCL
AIM: To verify (i) kirchoff’s current law (ii) kirchoff’s voltage law
(i) KIRCHOFF’S CURRENT LAW: APPARATUS REQUIRED:
S.No Name of the apparatus Range Quantity
1 RPS (0-15)V 1
2 Resistor 1 KΩ 3
3 Ammeter (0-10)mA 3
4 Bread board ------ 1
5 Connecting wires ------ As required THEORY: Kirchoff’s current law:
The algebraic sum of the currents entering in any node is Zero.
The law represents the mathematical statement of the fact change cannot accumulate at a node. A node is not a circuit element and it certainly cannot store destroy (or) generate charge. Hence the current must sum to zero. A hydraulic analog sum is zero. For example consider three water pipes joined pn the shape of Y. we defined free currents as following into each of 3 pipes. If we insists that what is always PROCEDURE:
1. Connections are made as per the circuit diagram. 2. Check your connections before switch on the supply. 3. Vary the regulated supply. 4. Measure the current using ammeter.

[Type text]
Vidyarthiplus.com
Vidyarthiplus.com
5. Note the readings in the tabulation. 6. Compare the observation reading to theoretical value.
5

[Type text]
Vidyarthiplus.com
Vidyarthiplus.com
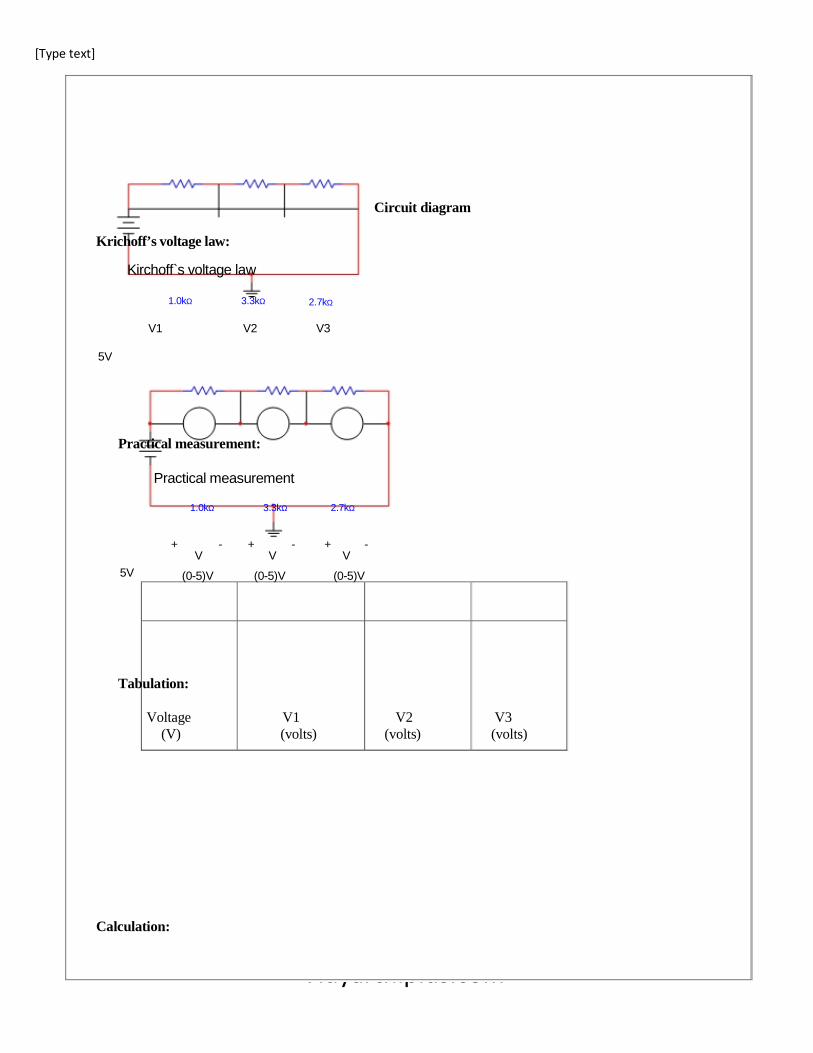
ii) KIRCHOFF’S VOLTAGE LAW:
APPARATUS REQUIRED:
S.No Name of the Range Quantity apparatus
1 RPS (0-15)V 1 2 Resistor 1KΩ,2.2KΩ,3.3KΩ Each 1 3 voltmeter (0-20)V 3 4 Bread board ------ 1 5 Connecting wires ------ As
required THEORY: (i) kirchoff’s voltage law
The algebraic sum of the voltage around any closed path is zero. PROCEDURE:
1. Connections are made as per the circuit diagram. 2. Check your connections before switch on the supply. 3. Vary the regulated supply. 4. Measure the voltage using voltmeter. 5. Note the readings in the tabulation. 6. Compare the observation reading to theoretical value.

[Type text]
Vidyarthiplus.com
Vidyarthiplus.com
6

[Type text]
Vidyarthiplus.com
Vidyarthiplus.com
Circuit diagram 1. krichoff’s current law:
Kirchoff`s current law
1.0kΩ
5V
Practical measurement:
(0-20)mA 1.0kΩ
3.3kΩ
4.7 K
(0-10)mA 3.3kΩ
+ A - + A -
4.7 K 5V +
A (0-10)mA
-
Tabulation: Voltage Total current I1(mA) I 2(mA)
I(mA)

[Type text]
Vidyarthiplus.com
Vidyarthiplus.com
7
[Type text]
Vidyarthiplus.com
Vidyarthiplus.com
Circuit diagram Krichoff’s voltage law:
Kirchoff`s voltage law
1.0kΩ 3.3kΩ 2.7kΩ
V1 V2 V3 5V
Practical measurement:
Practical measurement
1.0kΩ 3.3kΩ 2.7kΩ
+ - + - + - V V V
5V (0-5)V (0-5)V (0-5)V
Tabulation:
Voltage V1 V2 V3 (V) (volts) (volts) (volts)
Calculation:

[Type text]
Vidyarthiplus.com
Vidyarthiplus.com
RESULT:
Thus the kirchoff’s current law and voltage law were verified. 8
[Type text]
Vidyarthiplus.com
Vidyarthiplus.com
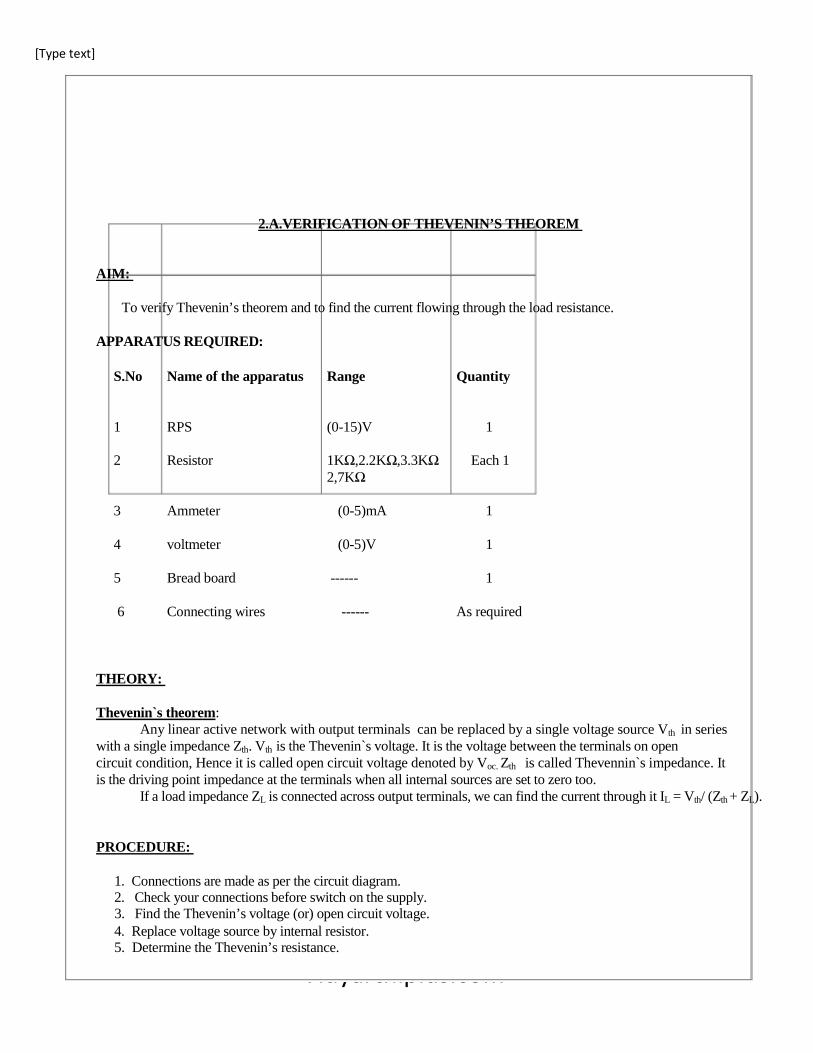
2.A.VERIFICATION OF THEVENIN’S THEOREM AIM:
To verify Thevenin’s theorem and to find the current flowing through the load resistance.
APPARATUS REQUIRED:
S.No Name of the apparatus Range Quantity 1 RPS (0-15)V 1 2 Resistor 1KΩ,2.2KΩ,3.3KΩ Each 1
2,7KΩ 3 Ammeter (0-5)mA 1 4 voltmeter (0-5)V 1 5 Bread board ------ 1 6 Connecting wires ------ As required
THEORY: Thevenin`s theorem:
Any linear active network with output terminals can be replaced by a single voltage source Vth in series with a single impedance Zth. Vth is the Thevenin`s voltage. It is the voltage between the terminals on open circuit condition, Hence it is called open circuit voltage denoted by Voc. Zth is called Thevennin`s impedance. It is the driving point impedance at the terminals when all internal sources are set to zero too. If a load impedance ZL is connected across output terminals, we can find the current through it IL = Vth/ (Zth + ZL). PROCEDURE:
1. Connections are made as per the circuit diagram. 2. Check your connections before switch on the supply. 3. Find the Thevenin’s voltage (or) open circuit voltage. 4. Replace voltage source by internal resistor. 5. Determine the Thevenin’s resistance.

[Type text]
Vidyarthiplus.com
Vidyarthiplus.com
6. Find IL by using Thevenin’s formula. 7. Compare the observation reading to theoretical value. 8. switch off the supply 9. Disconnect the circuit.
9

[Type text]
Vidyarthiplus.com
Vidyarthiplus.com
Thevenin
Circuit diagram To find Rth
1.0kΩ 3.3kΩ 1.0kΩ 3.3kΩ
XMM1
5V 2.2kΩ 2.7kΩ Rth 2.7kΩ
To find IL To find Vth
1.0kΩ 3.3kΩ 1.0kΩ 3.3kΩ
2.2kΩ
5V v 2.7kΩ 5V + 2.7kΩ
A (0-5)mA
-
Equiva1ent ciruitI
Rth
RL
2.2kΩ Vth +
A (0-5)mA

[Type text]
Vidyarthiplus.com
Vidyarthiplus.com
-
10
[Type text]
Vidyarthiplus.com
Vidyarthiplus.com
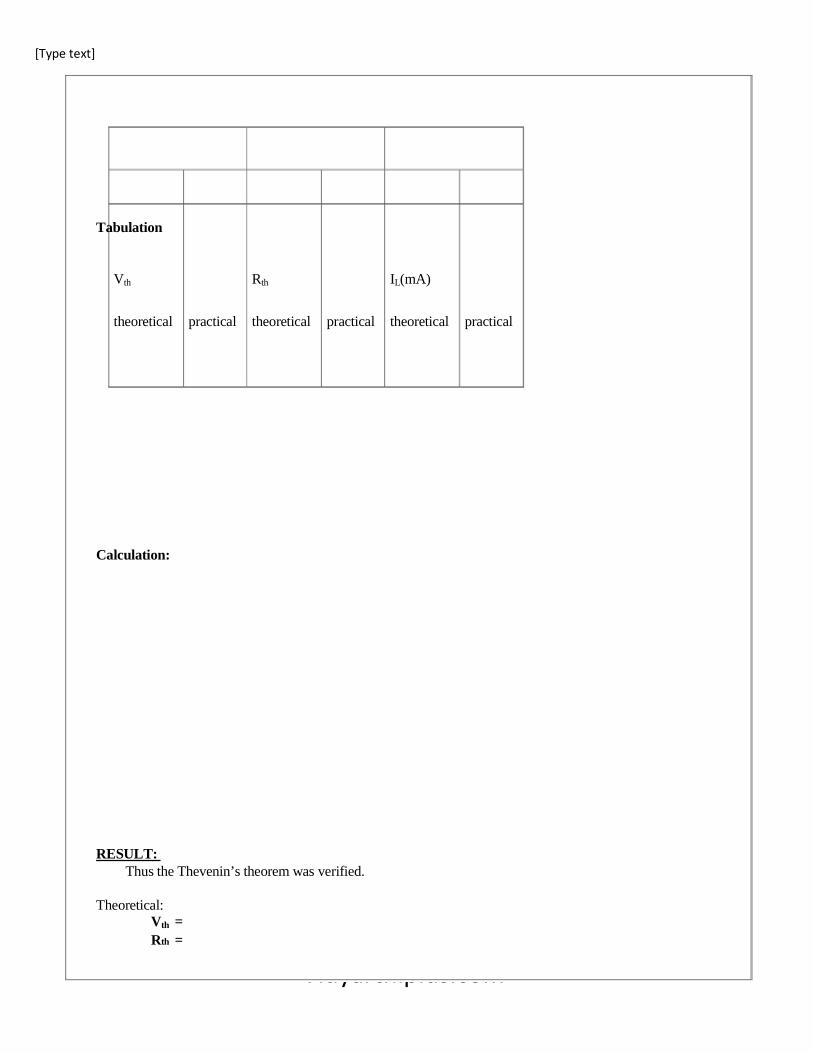
Tabulation Vth Rth IL(mA)
theoretical practical theoretical practical theoretical practical Calculation: RESULT:
Thus the Thevenin’s theorem was verified. Theoretical:
Vth = Rth =

[Type text]
Vidyarthiplus.com
Vidyarthiplus.com
IL = Practical:
Vth = Rth = IL =
11

[Type text]
Vidyarthiplus.com
Vidyarthiplus.com
3.SUPER POSITION THEOREM AIM:
To verify the superposition theorem and determine the current following through the load resistance.
APPARATUS REQUIRED:
S.No Name of the apparatus Range Quantity 1 RPS (0-15)V 1 2 Resistor 1KΩ,220Ω,470Ω Each 1 3 Ammeter (0-1)mA,mc 1
(0-5)mA mc 1 5 Bread board ------ 1 6 Connecting wires ------ As
required Superposition theorem
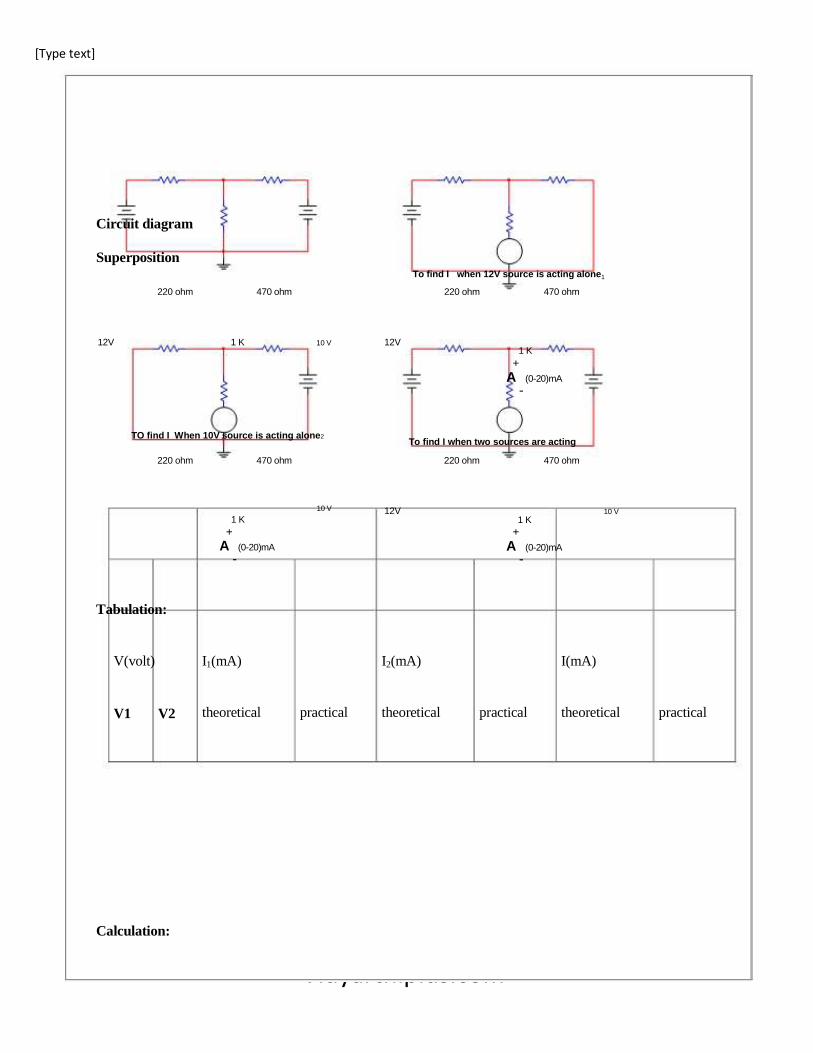
In a linear circuit containing more than one source, the current that flows at any point or the voltage that exists between any two points is the algebraic sum of the currents or the voltages that would have been produced by each source taken separately with all other sources removed. PROCEDURE:
1. Connections are made as per the circuit diagram. 2. Check your connections before switch on the supply. 3. Determine the current through the load resistance. 4. Now one of the sources is shorted and the current flowing through the resistance IL measured by ammeter. 5. Similarly, the other source is shorted and the current flowing through the resistance IL measured by ammeter. 6. Compare the value obtained with the sum of I1&I 2 should equal to I 7. Compare the observation reading to theoretical value.

[Type text]
Vidyarthiplus.com
Vidyarthiplus.com
8. switch off the supply 9. Disconnect the circuit.
12
[Type text]
Vidyarthiplus.com
Vidyarthiplus.com
Circuit diagram Superposition
To find I when 12V source is acting alone1
220 ohm 470 ohm
12V 1 K 10 V
TO find I When 10V source is acting alone2
220 ohm 470 ohm
10 V
1 K +
A (0-20)mA -
Tabulation:
220 ohm 470 ohm
12V 1 K
+ A (0-20)mA
-
To find I when two sources are acting
220 ohm 470 ohm
12V 10 V 1 K
+ A (0-20)mA
-
V(volt) I1(mA) I2(mA) I(mA) V1 V2 theoretical practical theoretical practical theoretical practical
Calculation:

[Type text]
Vidyarthiplus.com
Vidyarthiplus.com
RESULT: Thus the superposition theorem was verified
13
[Type text]
Vidyarthiplus.com
Vidyarthiplus.com
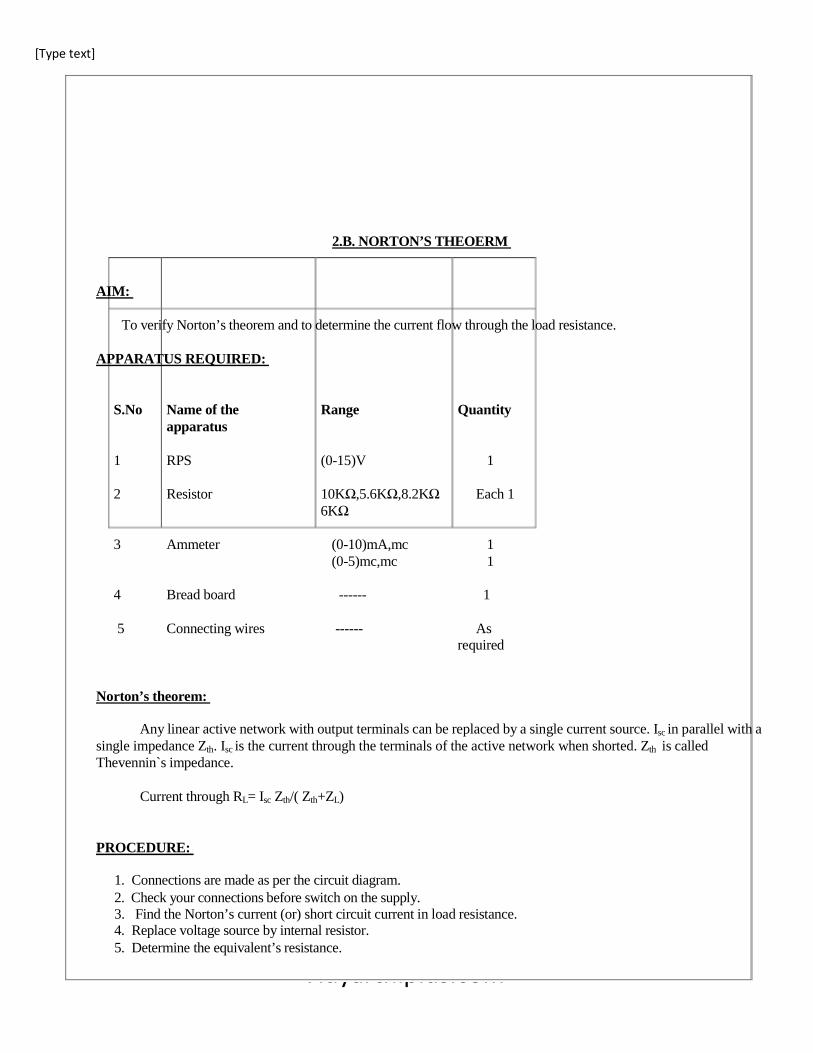
2.B. NORTON’S THEOERM AIM:
To verify Norton’s theorem and to determine the current flow through the load resistance.
APPARATUS REQUIRED:
S.No Name of the Range Quantity
apparatus 1 RPS (0-15)V 1 2 Resistor 10KΩ,5.6KΩ,8.2KΩ Each 1
6KΩ 3 Ammeter (0-10)mA,mc 1
(0-5)mc,mc 1 4 Bread board ------ 1 5 Connecting wires ------ As
required Norton’s theorem:
Any linear active network with output terminals can be replaced by a single current source. Isc in parallel with a single impedance Zth. Isc is the current through the terminals of the active network when shorted. Zth is called Thevennin`s impedance.
Current through RL= Isc Zth/( Zth+ZL)
PROCEDURE:
1. Connections are made as per the circuit diagram. 2. Check your connections before switch on the supply. 3. Find the Norton’s current (or) short circuit current in load resistance. 4. Replace voltage source by internal resistor. 5. Determine the equivalent’s resistance.

[Type text]
Vidyarthiplus.com
Vidyarthiplus.com
6. Find IL by using Norton’s formula. 7. Compare the observation reading to theoretical value. 8. switch off the supply 9. Disconnect the circuit.
14

[Type text]
Vidyarthiplus.com
Vidyarthiplus.com
Circuit diagram
Norton 10K 8K
5V 4.7K 5.6K
XMM1 To find R th
10K 8K Rth
4.7K
Norton`s Equivalent circuit
RL =5.6K
Isc Rth +
To find Isc
10K
5V
To find IL
10K
5V
8K
+Isc
4.7K A (0-500)mA -
8K
4.7K 5.6K +
A (0-500)mA -
A (0-500)mA
-

[Type text]
Vidyarthiplus.com
Vidyarthiplus.com
15
[Type text]
Vidyarthiplus.com
Vidyarthiplus.com
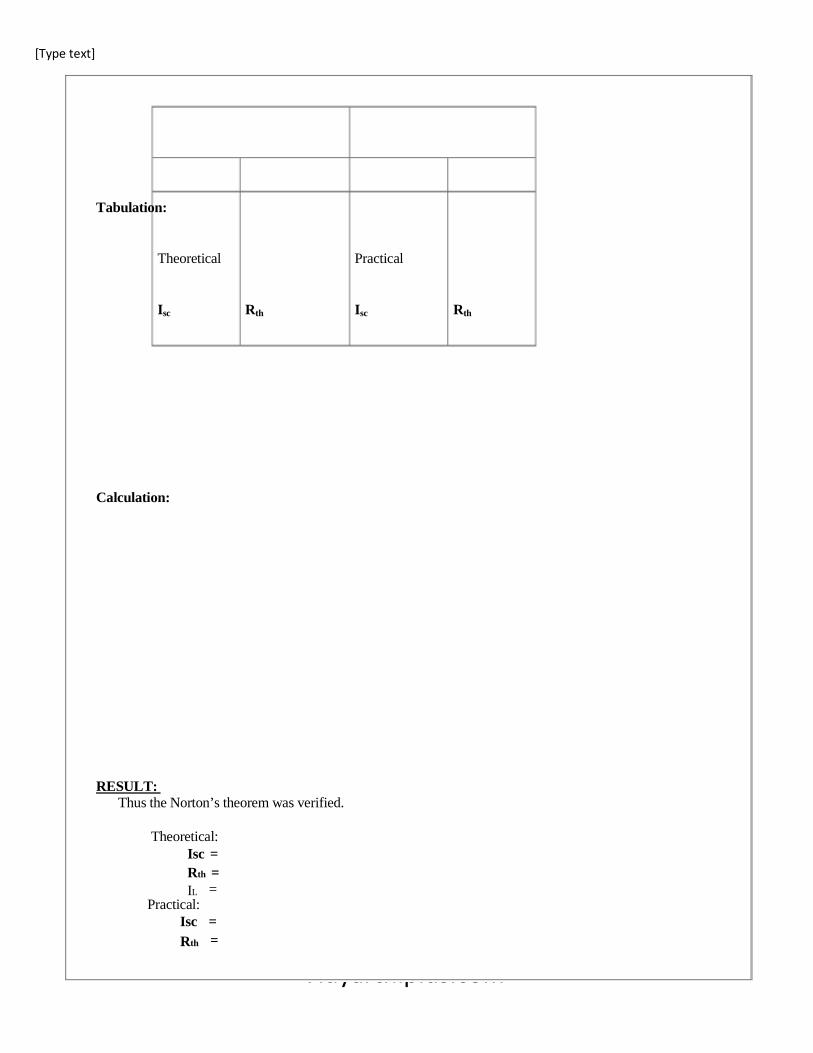
Tabulation: Theoretical Practical I sc Rth I sc Rth
Calculation:
RESULT: Thus the Norton’s theorem was verified.
Theoretical:
Isc = Rth = IL =
Practical: Isc = Rth =

[Type text]
Vidyarthiplus.com
Vidyarthiplus.com
IL =
16

[Type text]
Vidyarthiplus.com
Vidyarthiplus.com
4. VERIFICATION OF MAXIMUM POWER TRANSFER THEOREM AIM:
To find the value of resistance RL in which maximum power is transferred to the load resistance. APPARATUS REQUIRED:
Sl.No Name of the apparatus Range Quantity 1 Resistor 1KΩ,2.2 KΩ 1 2 Ammeter (0-10) mA 1 3 Bread board ----- 1 4 Connecting wires ------ As required 5 RPS (0-30)V 1 6 DRB (0-10)KΩ 1
Maximum power transfer theorem:
Maximum power transfer to the load resistor occurs when it has a value equal to the resistance of the network looking back at it from the load terminals. PROCEDURE:
1. Connections are given as per the circuit diagram. 2. By giving various values of the resistance in DRB, note the ammeter reading. 3. Calculate the power and plot the power Vs resistance graph. 4. Note the maximum power point corresponding resistance from the graph.

[Type text]
Vidyarthiplus.com
Vidyarthiplus.com
17

[Type text]
Vidyarthiplus.com
Vidyarthiplus.com
Circuit diagram Max power transfer theorem
1.0kΩ
5V 2.2kΩ
Theoretical value: Tabulation:
(0-10)mA
+ - A
RL
Theoretical calculation
To find Rth
1.0kΩ
2.2kΩ R th
Resistance Current I(mA) Power =I2RL
(RL)
Theoretical calculation: RESULT:

[Type text]
Vidyarthiplus.com
Vidyarthiplus.com
Thus the value of unknown resistance in which the maximum power is transferred to the load was found. Theoretical load resistance = Practical load resistance = Maximum power =
18
[Type text]
Vidyarthiplus.com
Vidyarthiplus.com
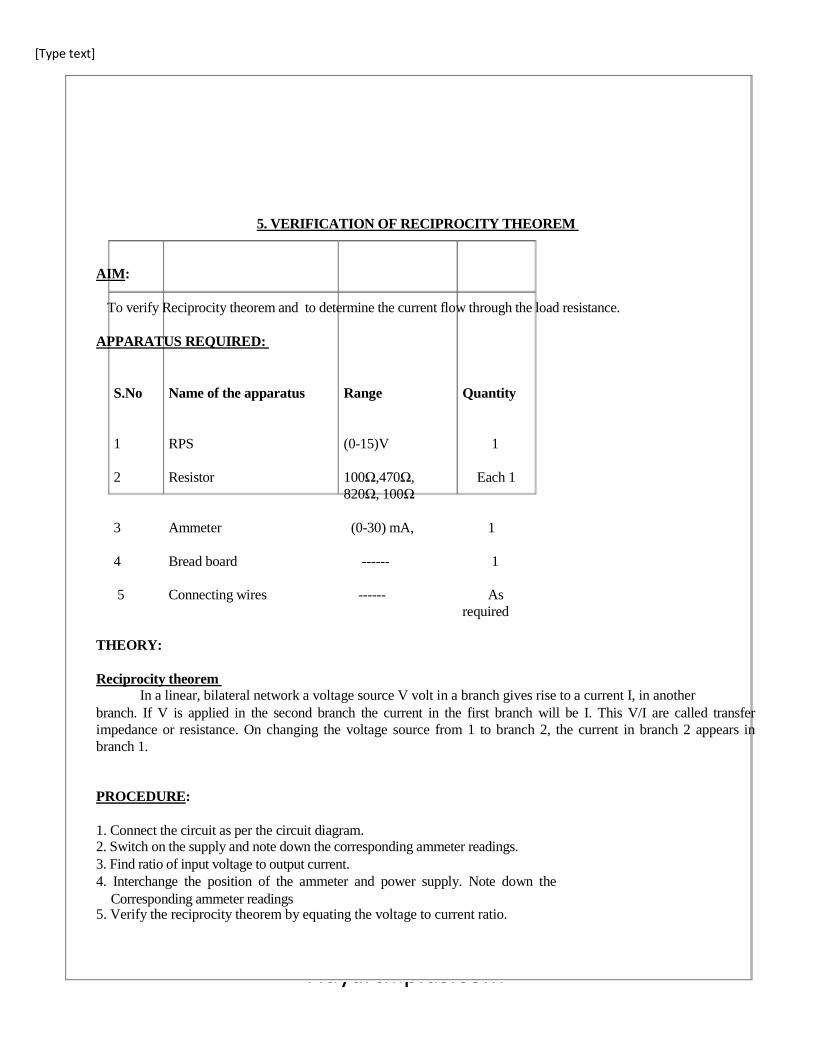
5. VERIFICATION OF RECIPROCITY THEOREM AIM:
To verify Reciprocity theorem and to determine the current flow through the load resistance.
APPARATUS REQUIRED:
S.No Name of the apparatus Range Quantity 1 RPS (0-15)V 1 2 Resistor 100Ω,470Ω, Each 1
820Ω, 100Ω 3 Ammeter (0-30) mA, 1 4 Bread board ------ 1 5 Connecting wires ------ As
required THEORY: Reciprocity theorem
In a linear, bilateral network a voltage source V volt in a branch gives rise to a current I, in another branch. If V is applied in the second branch the current in the first branch will be I. This V/I are called transfer impedance or resistance. On changing the voltage source from 1 to branch 2, the current in branch 2 appears in branch 1. PROCEDURE: 1. Connect the circuit as per the circuit diagram. 2. Switch on the supply and note down the corresponding ammeter readings. 3. Find ratio of input voltage to output current. 4. Interchange the position of the ammeter and power supply. Note down the Corresponding ammeter readings 5. Verify the reciprocity theorem by equating the voltage to current ratio.

[Type text]
Vidyarthiplus.com
Vidyarthiplus.com
19

[Type text]
Vidyarthiplus.com
Vidyarthiplus.com
CIRCUIT DIAGRAM
Reciprocity theorem To find I
940 ohm
(0-30)V
To find I 940 ohm
(0-30)V
100 ohm
470 ohm
100 0hm
470 ohm
940 ohm
+
100 0hm A (0-30)mA
-
100 ohm +
100 ohm
470 ohm 100 ohm
(0-30)V
A (0-30)mA
-
Tabulation: Practical value :( circuit -I)
V(volt) I(mA) Z=V/I

[Type text]
Vidyarthiplus.com
Vidyarthiplus.com
20

[Type text]
Vidyarthiplus.com
Vidyarthiplus.com
Practical value :( circuit -I)
V(volt) I(mA) Z=V/I
Calculation:
RESULT:
Thus the reciprocity theorem was verified

[Type text]
Vidyarthiplus.com
Vidyarthiplus.com
21

[Type text]
Vidyarthiplus.com
Vidyarthiplus.com
6. MEASUREMENT OF SELF INDUCTANCE OF A COIL
AIM:
To determine the values of self inductance using Maxwell’s Bridge. APPARATUS REQUIRED:
S.No. Name of the apparatus Range Quantity
1. Maxwell’s bridge kit - 1
2. Unknown resistance - 1
3. Connecting wires - As required
4. Galvanometer (-50 to 50) 1
THEORY: SELF INDUCTANCE OF A COIL
Maxwell’s bridge is an AC bridge, which is used to measure self inductance. The inductance Maxwell’s bridge can
be inductive or inductance - capacitance Bridge.
FORMULA USED: Unknown inductance L1=R2R3C1 Henry.

[Type text]
Vidyarthiplus.com
Vidyarthiplus.com
22

[Type text]
Vidyarthiplus.com
Vidyarthiplus.com
PROCEDURE: 1. Connect the oscillator to the Maxwell’s Inductance Bridge. 2. Connect the unknown inductance coil to the Maxwell’s Inductance Bridge. 3. Switch on the oscillator power supply. 4. Patch the Head phone.
5. If noise is produced in the head phone, tune the capacitance
value to reduce the noise and the bridge is kept in balanced
condition.
6. Note down the resistance and capacitance value.
7. The unknown inductance is calculated using formula:-
L1=R2R3C4 (Henry)
CIRCUIT DIAGRAM

[Type text]
Vidyarthiplus.com
Vidyarthiplus.com
23

[Type text]
Vidyarthiplus.com
Vidyarthiplus.com
L1 -Unknown Inductance
R2 -Variable resistance
C4-Standard capacitor
R1 -Effective resistance of inductance L1 R3,
R4- Known resistance
E- AC source G- Null detector
Unknown inductance L1=R2R3C1 Henry. RESULT:

[Type text]
Vidyarthiplus.com
Vidyarthiplus.com
Thus the self inductance is measured using Maxwell’s bridge.
24

[Type text]
Vidyarthiplus.com
Vidyarthiplus.com
7. VERIFICATION OF MESH & NODAL ANALYSIS . AIM:
To Verify Mesh & nodal analysis for a given electrical network.
APPARATUS REQUIRED:
S.No. Name of the apparatus Range Type Quantity
1. Ammeter (0-10)mA MC 2
2. Voltmeter (0-10)V MC 2
3. RPS (0-30)V - 1
4. Resistors 1kΩ, Carbon 5
5. Breadboard 10kΩ - 4
6. Connecting wires - As required
THEORY:
Mesh is defined as a loop which does not contain any other loops within it. It is a basic important
technique to find solutions in a network. If network has large number of voltage sources, it is useful to use mesh
analysis.
Node is defined as a point where two or more elements meet together .But only nodes with
three or more elements are considered. If the circuits consists of `N` nodes including the reference node, then
(N-1) nodal equation is obtained.
To apply Mesh analysis :
Select mesh currents .
Write the mesh equation using KVL.
Solve the equation to find the mesh currents

[Type text]
Vidyarthiplus.com
Vidyarthiplus.com
To apply nodal analysis:
Identify & mark the node assign node voltages.
Write the kirchoffs current law equations in terms of unknowns .Solve them to find the
node voltages. 25
[Type text]
Vidyarthiplus.com
Vidyarthiplus.com
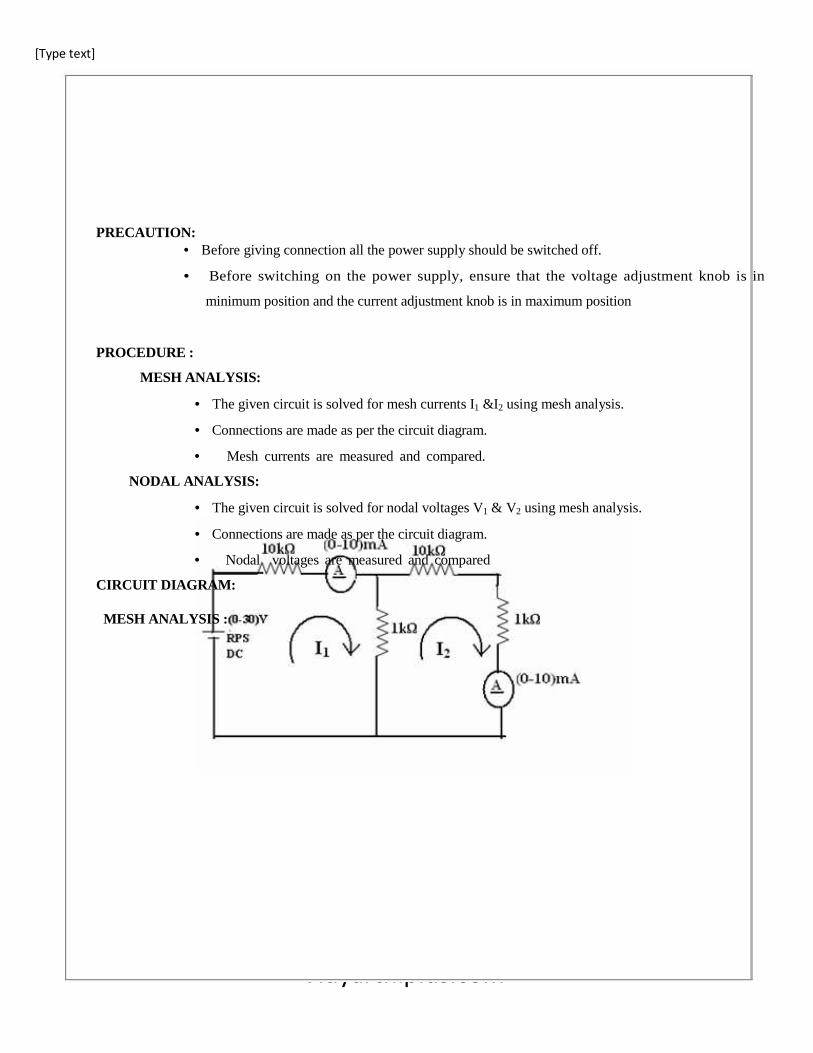
PRECAUTION: • Before giving connection all the power supply should be switched off.
• Before switching on the power supply, ensure that the voltage adjustment knob is in
minimum position and the current adjustment knob is in maximum position PROCEDURE :
MESH ANALYSIS:
• The given circuit is solved for mesh currents I1 &I 2 using mesh analysis.
• Connections are made as per the circuit diagram.
• Mesh currents are measured and compared.
NODAL ANALYSIS:
• The given circuit is solved for nodal voltages V1 & V2 using mesh analysis.
• Connections are made as per the circuit diagram.
• Nodal voltages are measured and compared
CIRCUIT DIAGRAM:
MESH ANALYSIS :

[Type text]
Vidyarthiplus.com
Vidyarthiplus.com
26

[Type text]
Vidyarthiplus.com
Vidyarthiplus.com
CIRCUIT DIAGRAM: NODAL ANALYSIS : TABULATION: MESH ANALYSIS: Input voltage Mesh currents
V1 (V)
I1(A) I2(A)
Measured value Theoretical Measured value Theoretical value value
MODEL CALCULATION & ANALYSIS: NODAL ANALYSIS:
Input voltage Nodal voltages V1 (V)
Measured value Theoretical value V1 V2 V3 V1 V2 V3
(V) (V) (V) (V) (V) (V)
MODEL CALCULATION & ANALYSIS:

[Type text]
Vidyarthiplus.com
Vidyarthiplus.com
RESULT:
Thus the mesh & nodal analysis are verified.
27

[Type text]
Vidyarthiplus.com
Vidyarthiplus.com
8. TRANSIENT RESPONSE OF RC AND RL CIRCUITS FOR DC INPUT’S. AIM:
To construct RL & RC transient circuit and to draw the transient curves. APPARATUS REQUIRED:
S.NO. NAME OF RANGE TYPE QTY. THE
EQUIPMENT 1. RPS (0-30)V DC 1 2. Ammeter (0-10)mA MC 1 3. Voltmeter (0-10)V MC 1 4. Resistor 10 KΩ - 3
5. Capacitor 1000 µ F - 1 6. Bread board - - 1 7. Connecting - Single strand As required
wires
THEORY:
Electrical devices are controlled by switches which are closed to connect supply to the device, or
opened in order to disconnect the supply to the device. The switching operation will change the current and
voltage in the device. The purely resistive devices will allow instantaneous change in current and voltage.
An inductive device will not allow sudden change in current and capacitance device will not allow sudden
change in voltage. Hence when switching operation is performed in inductive and capacitive devices, the current &
voltage in device will take a certain time to change from pre switching value to steady state value after switching. This
phenomenon is known as transient. The study of switching condition in the circuit is called transient analysis.The state
of the circuit from instant of switching to attainment of steady state is called transient state. The time duration from
the instant of switching till the steady state is called transient period. The current & voltage of circuit elements during
transient period is called transient response.
FORMULA: Time constant of RC circuit = RC

[Type text]
Vidyarthiplus.com
Vidyarthiplus.com
PROCEDURE: • Connections are made as per the circuit diagram.
• Before switching ON the power supply the switch S should be in off position
• Now switch ON the power supply and change the switch to ON position.
28

[Type text]
Vidyarthiplus.com
Vidyarthiplus.com
• The voltage is gradually increased and note down the reading of ammeter and voltmeter for
each time duration in RC.In RL circuit measure the Ammeter reading.
• Tabulate the readings and draw the graph of Vc(t)Vs t
CIRCUIT DIAGRAM:
RL CIRCUIT:
TABULATION: S.NO. TIME CHARGING DISCHARGING
(msec) CURRENT (I) A CURRENT (I) A
MODEL CALCULATION & ANALYSIS:

[Type text]
Vidyarthiplus.com
Vidyarthiplus.com
29

[Type text]
Vidyarthiplus.com
Vidyarthiplus.com
MODEL GRAPH:
CIRCUIT DIAGRAM:
RC CIRCUIT:
MODEL GRAPH: CHARGING DISCHARGING

[Type text]
Vidyarthiplus.com
Vidyarthiplus.com
30

[Type text]
Vidyarthiplus.com
Vidyarthiplus.com
TABULATION:
CHARGING:
S.NO. TIME VOLTAGE CURRENT (msec) ACROSS ‘C’ THROUGH
(volts) ‘C’ (mA)
MODEL CALCULATION & ANALYSIS: TABULATION:
DISCHARGING : S.NO. TIME VOLTAGE CURRENT
(msec) ACROSS ‘C’ THROUGH (volts) ‘C’
(mA) MODEL CALCULATION & ANALYSIS :

[Type text]
Vidyarthiplus.com
Vidyarthiplus.com
RESULT:
Thus the transient response of RL & RC circuit for DC input was verified.
31
[Type text]
Vidyarthiplus.com
Vidyarthiplus.com
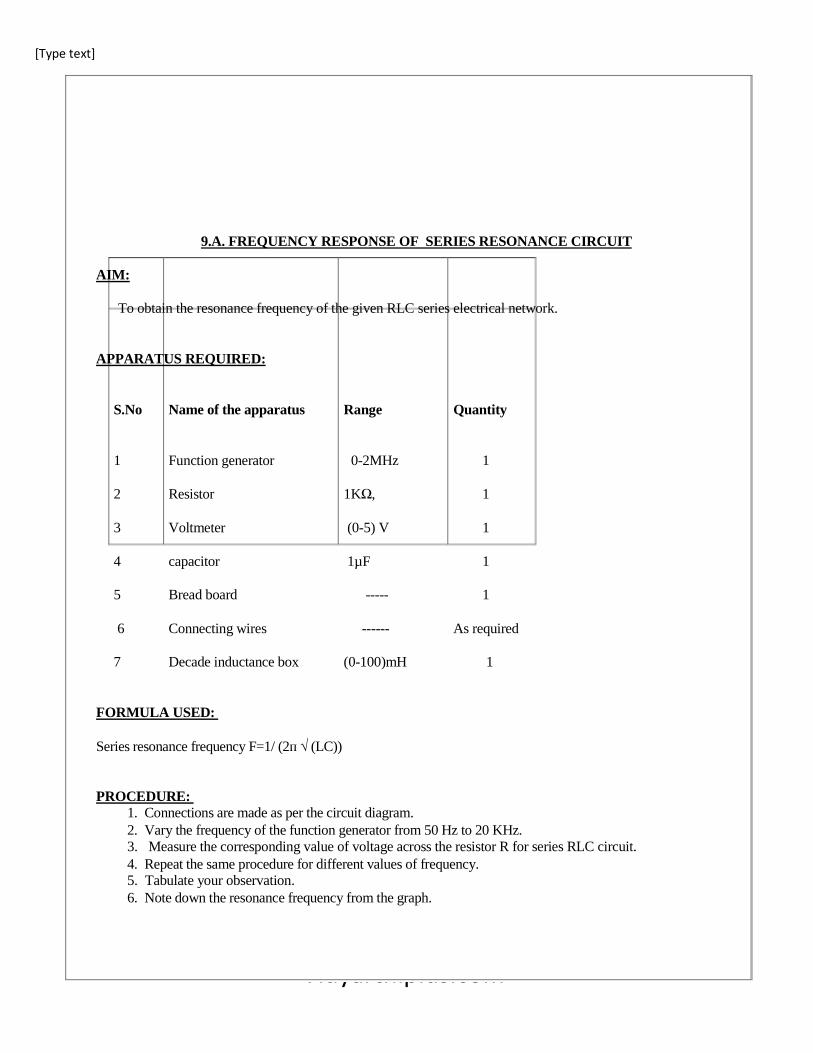
9.A. FREQUENCY RESPONSE OF SERIES RESONANCE CIRCUIT AIM:
To obtain the resonance frequency of the given RLC series electrical network. APPARATUS REQUIRED:
S.No Name of the apparatus Range Quantity
1 Function generator 0-2MHz 1
2 Resistor 1KΩ, 1
3 Voltmeter (0-5) V 1
4 capacitor 1µF 1
5 Bread board ----- 1
6 Connecting wires ------ As required
7 Decade inductance box (0-100)mH 1 FORMULA USED: Series resonance frequency F=1/ (2п √ (LC)) PROCEDURE:
1. Connections are made as per the circuit diagram. 2. Vary the frequency of the function generator from 50 Hz to 20 KHz. 3. Measure the corresponding value of voltage across the resistor R for series RLC circuit. 4. Repeat the same procedure for different values of frequency. 5. Tabulate your observation. 6. Note down the resonance frequency from the graph.

[Type text]
Vidyarthiplus.com
Vidyarthiplus.com
32

[Type text]
Vidyarthiplus.com
Vidyarthiplus.com
Circuit diagram: Series resonance
1.0uF 50 mH
C
Fn. gen
Tabulation:
L
R 1.0kΩ V (0-5)V
Frequency (Hz) VR(volt)
Calculation: RESULT:
Thus the resonance frequency of series RLC circuit is obtained.

[Type text]
Vidyarthiplus.com
Vidyarthiplus.com
Practical value = Theoretical value =
33

[Type text]
Vidyarthiplus.com
Vidyarthiplus.com
9.B. FREQUENCY RESPONSE OF PARALLEL RESONANCE CIRCUIT AIM:
To obtain the resonance frequency of the given RLC parallel electrical network.
APPARATUS REQUIRED:
Sl.No Name of the apparatus Range Quantity 1 Function generator 0-3MHz 1 2 Resistor 1KΩ, 1 3 Voltmeter (0-5) V 1 4 capacitor 1µF 1 5 Bread board ----- 1 6 Connecting wires ------ As required 7 Decade inductance box (0-100)mH 1
FORMULA USED: Parallel resonance frequency F=1/ (2п √ (LC) PROCEDURE:
1. Connections are made as per the circuit diagram. 2. Vary the frequency of the function generator from 50 Hz to 20 KHz. 3. Measure the corresponding value of voltage across the resistor R for series RLC circuit. 4. Repeat the same procedure for different values of frequency. 5. Tabulate your observation. 6. Note down the resonance frequency from the graph.

[Type text]
Vidyarthiplus.com
Vidyarthiplus.com
34

[Type text]
Vidyarthiplus.com
Vidyarthiplus.com
Circuit diagram Parallel resonance Fn. gen V (0-5)V
Tabulation:
R 1.0kΩ
C L 1.0uF
50 mH
Frequency (Hz) VR(volt)
Calculation: RESULT:

[Type text]
Vidyarthiplus.com
Vidyarthiplus.com
Thus the resonance frequency of series RLC circuit is obtained. Practical value =
Theoretical value =
35

[Type text]
Vidyarthiplus.com
Vidyarthiplus.com
10. FREQUENCY RESPONSE OF SINGLE TUNED COUPLED CIRCUIT AIM:
To determine the frequency response of a single tuned coupled circuits.
APPARATUS REQUIRED:
S.No. Name of the apparatus Range Quantity
1. Single tuned coupled - 1 circuits.
2. - As required Connecting wires
THEORY:
When two coils are placed nearby and current passes through any one or both of the coils, they become
magnetically coupled. Then the coils are known as coupled coils. If the coils are part of a circuit, the circuit is known as
a coupled circuit. A Single tuned to resonance.
FREQUENCY RESPONSE OF SINGLE TUNED CIRCUITS:
The variation of the amplification factor or output voltage with frequency is called the frequency response.
It can be observed that the output voltage, current and amplification depend on mutual inductance at resonance
frequency. The maximum amplification depends on M and it occurs at resonance frequency. Amplification factor
is given by,

[Type text]
Vidyarthiplus.com
Vidyarthiplus.com
36
[Type text]
Vidyarthiplus.com
Vidyarthiplus.com
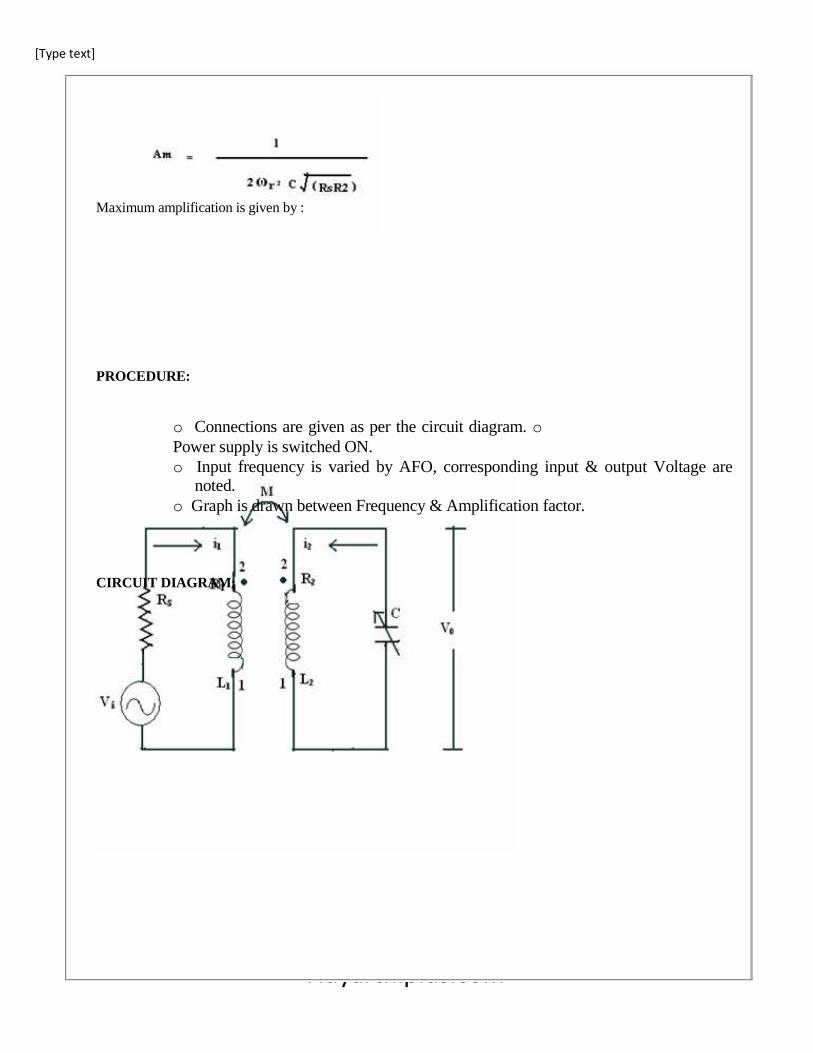
Maximum amplification is given by :
PROCEDURE:
o Connections are given as per the circuit diagram. o Power supply is switched ON. o Input frequency is varied by AFO, corresponding input & output Voltage are noted. o Graph is drawn between Frequency & Amplification factor.
CIRCUIT DIAGRAM:

[Type text]
Vidyarthiplus.com
Vidyarthiplus.com
37

[Type text]
Vidyarthiplus.com
Vidyarthiplus.com
TABULATION: Frequency (w) Output Voltage Input voltage Amplification
in Hz V0 (V) Vi (V) factor MODEL CALCULATION & ANALYSIS: MODEL GRAPH:

[Type text]
Vidyarthiplus.com
Vidyarthiplus.com
RESULT: The frequency of single tuned coupled circuits was verified.
38
Related Documents