Electrical Machines-II laboratory 1 Department of Electrical and Electronics Engineering E E L L E E C C T T R R I I C C A A L L C C I I R R C C U U I I T T S S L L A A B B O O R R A A T T O O R R Y Y M M A A N N U U A A L L DEPARTMENT OF ELECRICAL & ELECTRONICS ENGINEERING BALAJI INSTITUTE OF TECHNOLOGY AND SCIENCE NARSAMPET, WARANGAL.

Welcome message from author
This document is posted to help you gain knowledge. Please leave a comment to let me know what you think about it! Share it to your friends and learn new things together.
Transcript

Electrical Machines-II laboratory
1 Department of Electrical and Electronics Engineering
EELLEECCTTRRIICCAALL CCIIRRCCUUIITTSS
LLAABBOORRAATTOORRYY
MM AA NN UU AA LL
DDEEPPAARRTTMMEENNTT OOFF EELLEECCRRIICCAALL && EELLEECCTTRROONNIICCSS EENNGGIINNEEEERRIINNGG
BBAALLAAJJII IINNSSTTIITTUUTTEE OOFF TTEECCHHNNOOLLOOGGYY AANNDD SSCCIIEENNCCEE
NNAARRSSAAMMPPEETT,, WWAARRAANNGGAALL..

Electrical Machines-II laboratory
2 Department of Electrical and Electronics Engineering
Vision and Mission of EEE Department
Vision:
To nurture excellence in the field of Electrical & Electronics Engineering by imparting core values to the
learners and to mould the institution into a centre of academic excellence and advanced research.
Mission:
M1: To impart students with high technical knowledge to make globally adept to the new Technologies
M2: To create, disseminate and integrate knowledge of engineering, science and technology that expands
the electrical engineering knowledge base towards research
M3: To provide the students with a platform for developing new products and systems that can help
industry and society as a whole.
Program Outcomes

Electrical Machines-II laboratory
3 Department of Electrical and Electronics Engineering
PO1 Engineering knowledge: Apply the knowledge of basic sciences and fundamental engineering concepts in solving engineering problems.
PO 2 Problem analysis: Identify and define engineering problems, conduct experiments and investigate to analyze and interpret data to arrive at substantial conclusions.
PO 3 Design/development of solutions: Propose an appropriate solution for engineering problems complying with functional constraints such as economic, environmental, societal, ethical, safety and sustainability.
PO 4 Conduct investigations of complex problems: Perform investigations, design and conduct experiments, analyze and interpret the results to provide valid conclusions.
PO 5 Modern tool usage: Select/ develop and apply appropriate techniques and IT tools for the design and analysis of the systems.
PO 6 The engineer and society: Give reasoning and assess societal, health, legal and cultural issues with competency in professional engineering practice.
PO 7 Environment and sustainability: Demonstrate professional skills and contextual reasoning to assess environmental/ societal issues for sustainable development.
PO 8 Ethics: An ability to apply ethical principles and commit to professional ethics and responsibilities and norms of the engineering practice.
PO 9 Individual and team work: Function effectively as an individual and as a member or leader in diverse teams and in multi-disciplinary situations.
PO 10 Communication: An ability to communicate effectively.
PO 11 Project management and finance: Demonstrate apply engineering and management principles in their own / team projects in multi-disciplinary environment.
PO 12 Life-long learning: An ability to do the needs of current technological trends at electrical industry by bridging the gap between academic and industry.
Electrical Machines-II laboratory
4 Department of Electrical and Electronics Engineering
Program Specific Outcomes
PSO1 Apply fundamental knowledge to identify, analyze diverse problems associated with electrical and electronic circuits, power electronics drives and power systems.
PSO2 Understand the current technological developments in Electrical & Electronics Engineering and develop the innovative products/software to cater to the needs of society & Industry.
Program Educational Objectives
PEO1 To prepare students with solid foundation in Mathematics, Sciences and Basic Engineering to cover multi-disciplinary subjects enabling them to comprehend, analyze Electrical & Electronics Engineering problems and develop solutions.
PEO2 To design and develop an electrical system component or process to meet the needs of society and industry with in realistic constraints.
PEO3
To prepare students with technical competence to use advance techniques, skills and modern engineering tools that allow them to work effectively as electrical and electronics engineer.
ATTAINMENT OF PROGRAM OUTCOMES & PROGRAM SPECIFIC OUTCOMES

Electrical Machines-II laboratory
5 Department of Electrical and Electronics Engineering
Exp .No
Name of the Experiment
Program Outcomes Attained
Program Specific
Outcomes Attained
1 Verification of Thevenin’s and Norton’s Theorems PO1,PO2,PO3,PO9 PSO1
2 Verification of Superposition ,Reciprocity and Maximum Power Transfer theorems
PO1,PO2,PO3,PO9 PSO1
3 Locus Diagrams of RL and RC Series Circuits PO1,PO2,PO3,PO9 PSO1
4 Series and Parallel Resonance PO1,PO2,PO3,PO9 PSO1
5 Time response of first order RC / RL network for periodic non – sinusoidal inputs – Time constant and Steady state error determination.
PO1,PO2,PO3,PO9 PSO1
6 Two port network parameters – Z – Y parameters, Analytical verification.
PO1,PO2,PO3,PO9 PSO1
7 Two port network parameters – A, B, C, D & Hybrid parameters, Analytical
PO1,PO2,PO3,PO9 PSO1
8 Separation of Self and Mutual inductance in a Coupled Circuit. Determination of Coefficient of Coupling
PO1,PO2,PO3,PO9 PSO1
9 Verification of compensation & Milliman’s theorems PO1,PO2,PO3,PO9 PSO1
10 Harmonic Analysis of non-sinusoidal waveform signals using Harmonic Analyzer, and plotting frequency spectrum.
PO1,PO2,PO3,PO9 PSO1
11 Determination of form factor for non-sinusoidal waveform PO1,PO2,PO3,PO9 PSO1
12 Measurement of Active Power for Star and Delta connected balanced loads
PO1,PO2,PO3,PO9 PSO1
14 Measurement of Reactive Power for Star and Delta connected balanced loads
PO1,PO2,PO3,PO9 PSO1

Electrical Machines-II laboratory
6 Department of Electrical and Electronics Engineering
Prepared by
S. SRIDHAR S. MALLIKARJUN REDDY M.Tech(Power Electronics) M.Tech(Power Engineering)
Asst. Professor Head of the Department EEED EEED
Verified by
Head of the department
Electrical Machines-II laboratory
7 Department of Electrical and Electronics Engineering
PREFACE
This Laboratory book in Electrical Measurements has been revised in order to be up to date with
Curriculum changes, laboratory equipment upgrading and the latest circuit simulation.
Every effort has been made to correct all the known errors, but nobody is perfect, if you
find any additional errors or anything else you think is an error, please contact the HOD/EEE
The Authors thanked all the staff members from the department for their valuable
Suggestion and contribution.
The author would welcome the advice and suggestions leading to the improvement of the book.
The Authors,
Department of EEE.

Electrical Machines-II laboratory
8 Department of Electrical and Electronics Engineering
Safety Rules and operating Procedures
Laboratory Safety information
Guidelines for Laboratory Notebook
Troubleshooting Hints
I
II
III
IV
LABORATORY PRACTICE

Electrical Machines-II laboratory
9 Department of Electrical and Electronics Engineering
SAFETY RULES
1. SAFETY is of paramount importance in the Electrical Engineering Laboratories.
2. Electricity NEVER EXECUSES careless persons. So, exercise enough care and attention in handling electrical equipment and follow safety practices in the laboratory. (Electricity is a good servant but a bad master).
3. Avoid direct contact with any voltage source and power line voltages. (Otherwise, any such contact may subject you to electrical shock)
4. Wear rubber-soled shoes. (To insulate you from earth so that even if you accidentally contact a live point, current will not flow through your body to earth and hence you will be protected from electrical shock)
5. Wear laboratory-coat and avoid loose clothing. (Loose clothing may get caught on an equipment/instrument and this may lead to an accident particularly if the equipment happens to be a rotating machine)
6. Girl students should have their hair tucked under their coat or have it in a knot.
7. Do not wear any metallic rings, bangles, bracelets, wristwatches and neck chains. (When you move your hand/body, such conducting items may create a short circuit or may touch a live point and thereby subject you to Electrical shock)
8. Be certain that your hands are dry and that you are not standing on wet floor. (Wet parts of the body reduce the contact resistance thereby increasing the severity of the shock)
9. Ensure that the power is OFF before you start connecting up the circuit. (Otherwise you will be touching the live parts in the circuit).
10. Get your circuit diagram approved by the staff member and connect up the circuit strictly as per the approved circuit diagram.
11. Check power chords for any sign of damage and be certain that the chords use safety plugs and do not defeat the safety feature of these plugs by using ungrounded plugs.
12. When using connection leads, check for any insulation damage in the leads and avoid such defective leads.
13. Do not defeat any safety devices such as fuse or circuit breaker by shorting across it. Safety devices protect YOU and your equipment.
14. Switch on the power to your circuit and equipment only after getting them checked up and approved by the staff member.

Electrical Machines-II laboratory
10 Department of Electrical and Electronics Engineering
15. Take the measurement with one hand in your pocket. (To avoid shock in case you accidentally touch two points at different potentials with your two hands)
16. Do not make any change in the connection without the approval of the staff member.
17. In case you notice any abnormal condition in your circuit (like insulation heating up, resistor heating up etc), switch off the power to your circuit immediately and inform the staff member.
18. Keep hot soldering iron in the holder when not in use.
19. After completing the experiment show your readings to the staff member and switch off the power to your circuit after getting approval from the staff member.
20. Determine the correct rating of the fuse/s to be connected in the circuit after understanding correctly the type of the experiment to be performed: no-load test or full-load test, the maximum current expected in the circuit and accordingly use that fuse-rating.(While an over-rated fuse will damage the equipment and other instruments like ammeters and watt-meters in case of over load, an under-rated fuse may not allow one even to start the experiment)
21. Moving iron ammeters and current coils of wattmeters are not so delicate and hence these can stand short time overload due to high starting current. Moving iron meters are cheaper and more rugged compared to moving coil meters. Moving iron meters can be used for both a.c. and d.c. measurement. Moving coil instruments are however more sensitive and more accurate as compared to their moving iron counterparts and these can be used for d.c. measurements only. Good features of moving coil instruments are not of much consequence for you as other sources of errors in the experiments are many times more than those caused by these meters.
22. Some students have been found to damage meters by mishandling in the following ways:
i. Keeping unnecessary material like books, labrecords, unused meters etc. causing meters to fall down the table.
ii. Putting pressure on the meter (especially glass) while making connections or while talking or listening somebody.
STUDENTS ARE STRICTLY WARNED THAT FULL COST OF THE METER WILL BE RECOVERED FROM THE INDIVIDUAL WHO HAS DAMAGED IT IN SUCH A MANNER.
Copy these rules in your Lab Record. Observe these yourself and help your friends to observe.

Electrical Machines-II laboratory
11 Department of Electrical and Electronics Engineering
I have read and understand these rules and procedures. I agree to abide by these rules and
procedures at all times while using these facilities. I understand that failure to follow these rules and
procedures will result in my immediate dismissal from the laboratory and additional disciplinary action
may be taken.
Signature Date Lab

DEVI ELECTRONICS
12 Department of Electrical and Electronics Engineering
GUIDELINES FOR LABORATORY NOTEBOOK
The laboratory notebook is a record of all work pertaining to the experiment. This record should be sufficiently complete so that you or anyone else of similar technical background can duplicate the experiment and data by simply following your laboratory notebook. Record everything directly into the notebook during the experiment. Do not use scratch paper for recording data. Do not trust your memory to fill in the details at a later time.
Organization in your notebook is important. Descriptive headings should be used to separate and identify the various parts of the experiment. Record data in chronological order. A neat, organized and complete record of an experiment is just as important as the experimental work.
1. Heading: The experiment identification (number) should be at the top of each page.Your name and date should be at the top of the first page of each day's experimental work.
2. Object: A brief but complete statement of what you intend to find out or verify in the experiment should be at the beginning of each experiment
3. Diagram: A circuit diagram should be drawn and labeled so that the actual experiment circuitry could be easily duplicated at any time in the future. Be especially careful to record all circuit changes made during the experiment.
4. Equipment List: List those items of equipment which have a direct effect on the accuracy of the data. It may be necessary later to locate specific items of equipment for rechecks if discrepancies develop in the results. 5. Procedure: In general, lengthy explanations of procedures are unnecessary. Be brief. Short commentaries alongside the corresponding data may be used. Keep in mind the fact that the experiment must be reproducible from the information given in your notebook. 6. Data: Think carefully about what data is required and prepare suitable data tables. Record instrument readings directly. Do not use calculated results in place of direct data; however, calculated results may be recorded in the same table with the direct data. Data tables should be clearly identified and each data column labeled and headed by the proper units of measure. 7. Calculations: Not always necessary but equations and sample calculations are often given to illustrate the treatment of the experimental data in obtaining the results. 8. Graphs: Graphs are used to present large amounts of data in a concise visual form. Data to be presented in graphical form should be plotted in the laboratory so that any questionable data points can be checked while the experiment is still set up. The grid lines in the notebook can be used for most graphs. If special graph paper is required, affix the graph permanently into the notebook. Give all graphs a short descriptive title. Label and scale the axes. Use units of measure. Label each curve if more than one on a graph.

DEVI ELECTRONICS
13 Department of Electrical and Electronics Engineering
9. Results: The results should be presented in a form which makes the interpretation easy. Large amounts of numerical results are generally presented in graphical form. Tables are generally used for small amounts of results. Theoretical and experimental results should be on the same graph or arrange in the same table in a way for easy correlation of these results.
10. Conclusion: This is your interpretation of the results of the experiment as an engineer. Be brief and specific. Give reasons for important discrepancies.
TROUBLE SHOOTING HINTS
1. Be Sure that the power is turned ON
2. Be sure the ground connections are common
3. Be sure the circuit you build is identical to your circuit diagram (Do a node by node check)
4. Be sure that the supply voltages are correct
5. Be sure that the equipment is set up correctly and you are measuring the correct parameters
6. If steps 1 through 5 are correct then you probably have used a component with the wrong value or one that doesn’t work. It is also possible that the equipment does not work (although this is not probable) or the protoboard you are using may have some unwanted paths between nodes. To find your problem you must trace through the voltages in your circuit node by node and compare the signal you expect to have. Then if they are different use your engineering judgment to decide what is causing the different or ask your lab assistant.
EELLEECCTTRRIICCAALL CCIIRRCCUUIITTSS LLAABBOORRAATTOORRYY

DEVI ELECTRONICS
14 Department of Electrical and Electronics Engineering
LIST OF EXPERIMENTS
1 Verification of Thevenin’s and Norton’s Theorems
2 Verification of Superposition ,Reciprocity and Maximum Power Transfer theorems
3 Locus Diagrams of RL and RC Series Circuits
4 Series and Parallel Resonance
5 Time response of first order RC / RL network for periodic non – sinusoidal inputs – Time constant and Steady state error determination.
6 Two port network parameters – Z – Y parameters, Analytical verification.
7 Two port network parameters – A, B, C, D & Hybrid parameters, Analytical
8 Separation of Self and Mutual inductance in a Coupled Circuit. Determination of Coefficient of Coupling
9 Verification of compensation & Milliman’s theorems
10 Harmonic Analysis of non-sinusoidal waveform signals using Harmonic Analyzer, and plotting frequency spectrum.
11 Determination of form factor for non-sinusoidal waveform
12 Measurement of Active Power for Star and Delta connected balanced loads
14 Measurement of Reactive Power for Star and Delta connected balanced loads
THEVENIN’S THEOREM
Aim: To verify and prove the Thevenin’s Theorem

DEVI ELECTRONICS
15 Department of Electrical and Electronics Engineering
Apparatus Required:
Sl.no Name of the equipment Range/Type Quantity
1 Dual Regulated power supply
(0-30V)/2A
DC
1 no.
2 Digital multimeter
Modes DC ammeter
DC volt meter
Ohmmeter
(0-200mA)
(0-20V)
(0- 2kΩ)
1 no.
3 Resistors R1 =120
R2 =330
R3=560
R4=680
R5=820
1 No. each
4 Bread board ----- 1No.
5 Connecting Wires ----- Required
Theory:
Thevenin’s Theorem: It is defined as that in any two terminal linear bilateral network which contains one are more sources can be replaced by a single voltage source with a series resistor.
Circuit Diagrams:

DEVI ELECTRONICS
16 Department of Electrical and Electronics Engineering
Fig.1
Fig.2
Procedure:
1. Connect the circuit as per the circuit diagram shown in fig(1).
2. By applying the input voltage and connecting the load resistance at the output terminals measure the load current IL1 as shown in fig (1).
3. Connect the circuit diagram shown in fig (2) measure the thevenin’s voltage Vth. 4. Connect the circuit diagram shown in fig (3) and Measure the thevenin’s resistance using digital multimeter. 5. Connect the thevenin’s equivalent circuit and measure the load current IL2 . (IL1= IL2)
Tabular Form:
Vth

DEVI ELECTRONICS
17 Department of Electrical and Electronics Engineering
Source Voltage
(Vs)
Thevenin’s voltage Vth.
Thevenin’s Resistance
Rth
Current(IL1) mA
(fig-1)
Current(IL2) mA
(fig-4) Theoretical values
Practical values
Result: Hence the Thevenin’s theorem is verified theoretically and practically.
THEVENINS THEOREM
Practice problems:
Question 1: Using Thevenin’s theorem, find the current through branch AB for the below circuit?
Question 2: Using Thevenin’s theorem, find the current through branch AB in which a
galvanometer is connected for the below circuit?
Question 3: Using Thevenin’s theorem, find the current through branch AB in the below circuit?
DEVI ELECTRONICS
18 Department of Electrical and Electronics Engineering
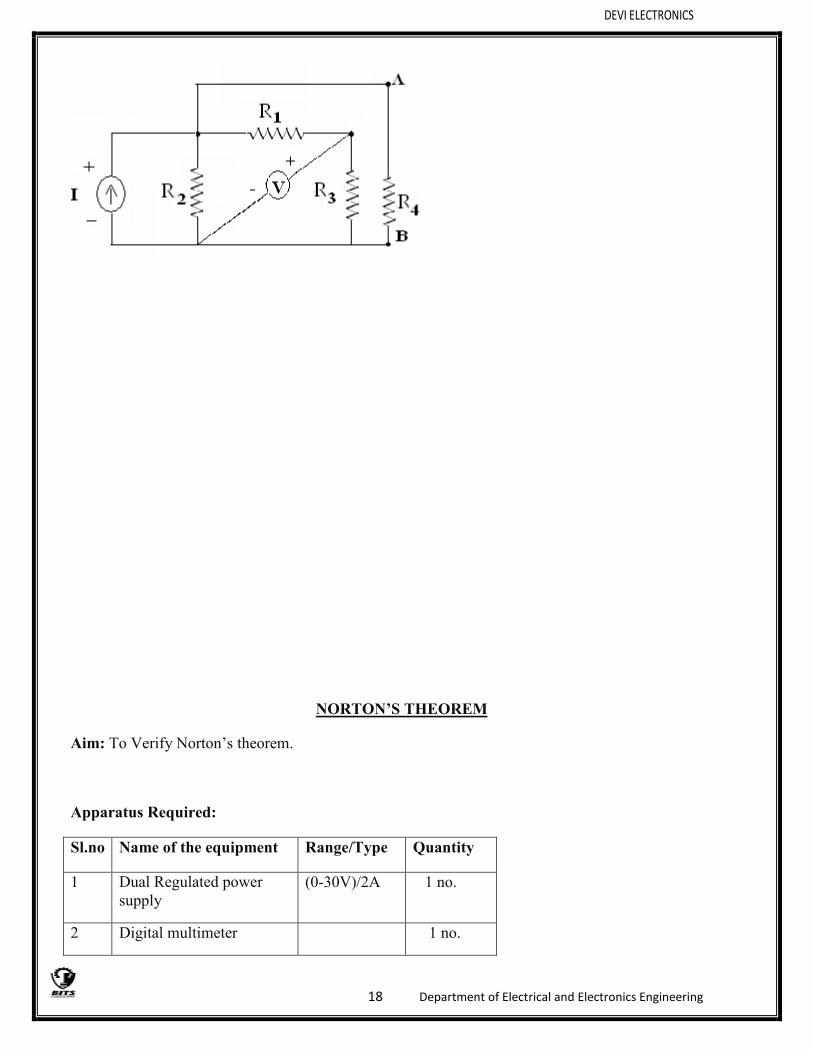
NORTON’S THEOREM
Aim: To Verify Norton’s theorem.
Apparatus Required:
Sl.no Name of the equipment Range/Type Quantity
1 Dual Regulated power supply
(0-30V)/2A 1 no.
2 Digital multimeter 1 no.
DEVI ELECTRONICS
19 Department of Electrical and Electronics Engineering
Modes DC ammeter
DC volt meter
Ohmmeter
(0-200mA)
(0-20V)
(0- 2kΩ)
3 Resistors R1 = 120
R2 =330
R3=560
R4=680
R5=820
1No. each
4 Connecting Wires ----- Required
5 Breadboard ----- 1No
Norton’s Theorem:
It is defined as that in any two terminal linear bilateral network which contains one are more sources can be replaced by a single current source with a parallel resistor.
Circuit Diagram:
Fig.1

DEVI ELECTRONICS
20 Department of Electrical and Electronics Engineering
Fig. 2
Fig.3
Procedure:
1. Connect the circuit diagram as shown in fig.1 and measure the load current IL1.
2. Connect the circuit diagram as shown in fig.2 and measure the Norton’s equivalent current IN
3. Connect the Norton’s equivalent circuit and determine the load current IL2.
4. Verify IL1= IL2.
Tabular Form:
Source Voltage (Vs)
Norton’s current IN(mA).
Current(IL1) mA
Current(IL2) mA
Theoretical values
Practical values

DEVI ELECTRONICS
21 Department of Electrical and Electronics Engineering
Result:
Hence Norton’s theorem is verified theoretically and practically.
NORTON’S THEOREM
Practice Problems:
Question 1: Using Norton’s theorem, find the current through branch AB for the below circuit?
Question 2: Find Vo in the circuit using Norton’s Theorem?
Question 3: Find the current through RL resistor, using Norton’s Theorem?

DEVI ELECTRONICS
22 Department of Electrical and Electronics Engineering
RECIPROCITY THEOREM
Aim: To verify reciprocity theorem.
Apparatus required:
Sl. No Name of equipment range quantity
1 Dual Regulated power supply ( 0–30 V)/ 2A 1 no
2 Digital Multimeter
Voltmeter mode
Ammeter mode
0-20V
0-200 mA
1 no
3 Resistors
R1
R2
R3
510ohm
1kohm
220ohm
1 no. each
DEVI ELECTRONICS
23 Department of Electrical and Electronics Engineering
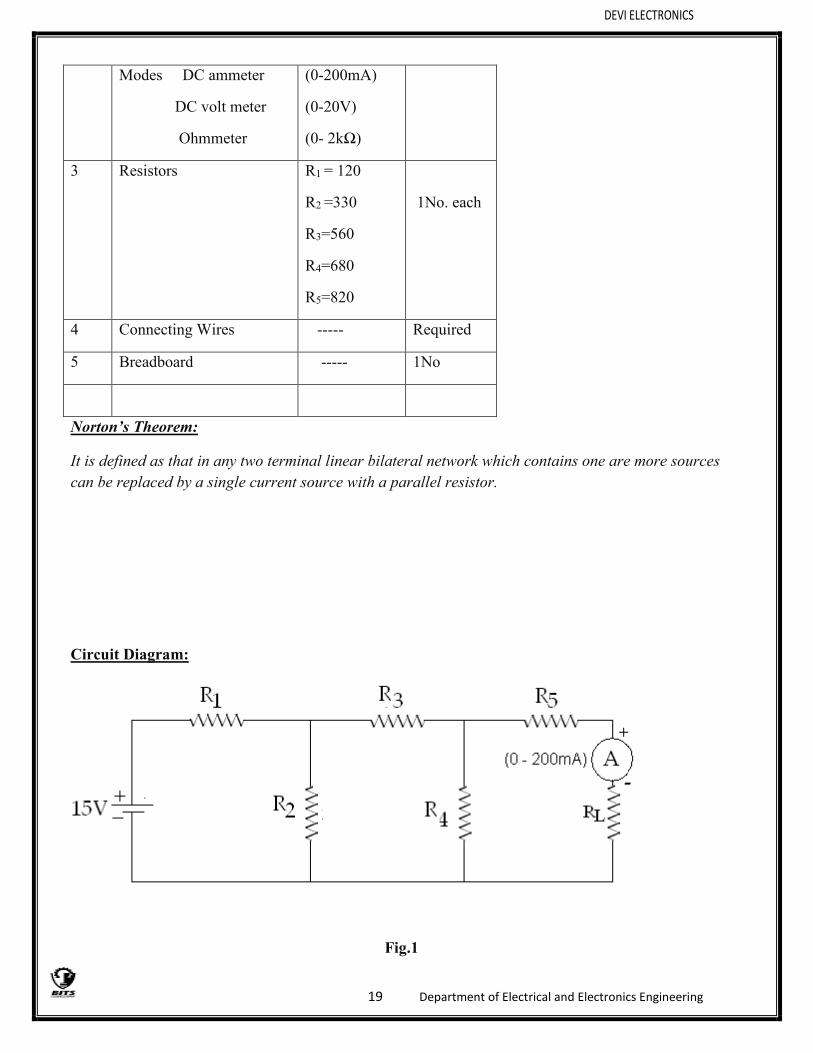
Statement of Reciprocity Theorem:
In any branch of a network, the current due to a single source of voltage(V) elsewhere in the network is equal to the current through the branch in which the source was originally placed when the source is placed in the branch in which the current (I)was originally obtained.
Theory:
In a linear, bilateral, single source network if a voltage at any point in the network produces a current at
some other point in the network, then the same voltage at the other point produces the same current at
the first point.
The ratio of response to excitation is same. Reciprocity theorem is applicable for single voltage
and single current source networks only.
Voltage V1 across AA1 produces current I1 at BB1. Now if the positions of the source and
responses are interchanged, by connecting the voltage source across BB1, the resultant current I2 will
4 Bread Board ------ 1 no.
5 Connecting wires ------ Required

DEVI ELECTRONICS
24 Department of Electrical and Electronics Engineering
be at terminals AA1. According to reciprocity theorem, the ratio of response to excitation is same in
both the cases.
i.e. I1 / V1 = I2 / V2
The location of the voltage source and the through current may be interchanged with out change in current. However, the polarity of the voltage source should have the identicality with the direction of branch current in each position.
According to this theorem if the source voltage and zero resistance ammeter are changed, the magnitude of the current through the ammeter will be same, no matter how completed the network. In other words, in a linear passive network, supply voltage V & current I are mutually transferable. The ratio of V and I is called the transfer resistance.
The limitation of this theorem is that it is only applicable to single source networks and not in multisource network. More over the network should not have any time varying element.
Circuit diagram
Fig (i)
Fig (ii)
DEVI ELECTRONICS
25 Department of Electrical and Electronics Engineering
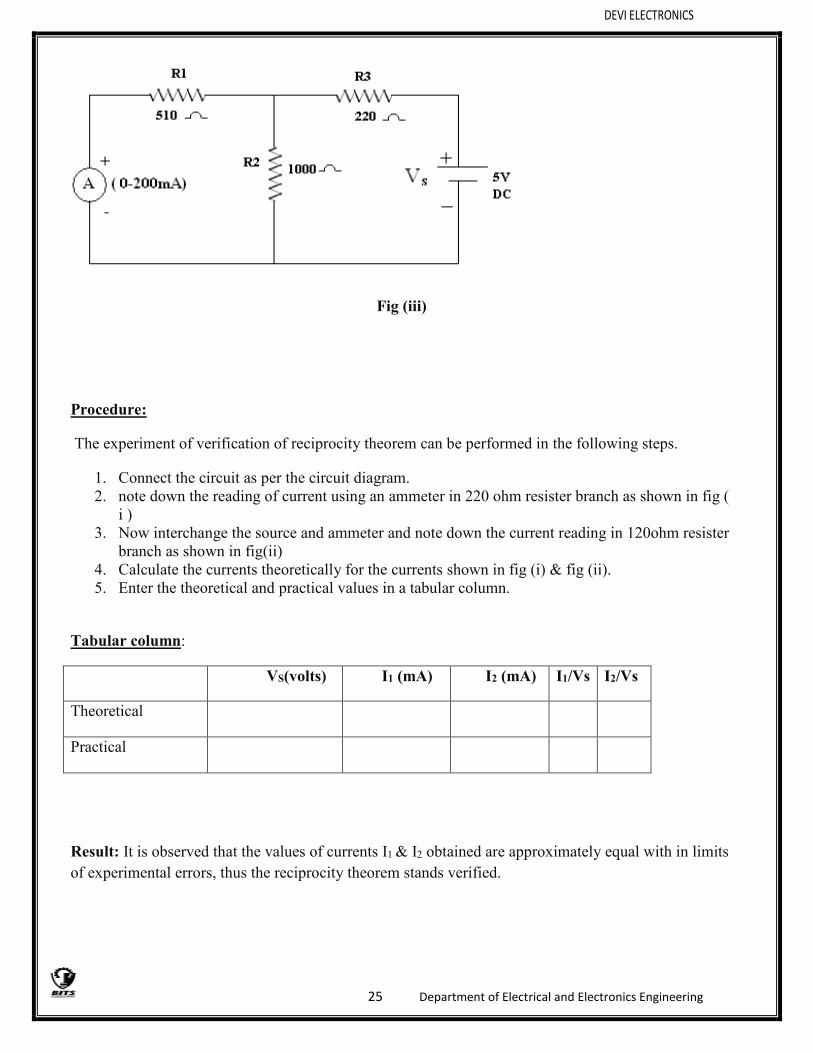
Fig (iii)
Procedure:
The experiment of verification of reciprocity theorem can be performed in the following steps.
1. Connect the circuit as per the circuit diagram. 2. note down the reading of current using an ammeter in 220 ohm resister branch as shown in fig (
i ) 3. Now interchange the source and ammeter and note down the current reading in 120ohm resister
branch as shown in fig(ii) 4. Calculate the currents theoretically for the currents shown in fig (i) & fig (ii). 5. Enter the theoretical and practical values in a tabular column.
Tabular column:
VS(volts) I1 (mA) I2 (mA) I1/Vs I2/Vs
Theoretical
Practical
Result: It is observed that the values of currents I1 & I2 obtained are approximately equal with in limits of experimental errors, thus the reciprocity theorem stands verified.
DEVI ELECTRONICS
26 Department of Electrical and Electronics Engineering
SUPERPOSITION THEORM
Aim :- To verify the superposition theorem.
Apparatus required :-
Sl.no. Name of equipment range quantity 1 Dual Regulated power supply (0-30 V)/2A 1 no 2 Digital Multimeter
Voltmeter mode Ammeter mode
0-20V 0-200mA
1 no
3 Resistors R1 R2 R3
510 Ω 1k Ω 220 Ω
1 no. each
4 Bread board ---- 1 no 5 Connecting wires ----- Required
DEVI ELECTRONICS
27 Department of Electrical and Electronics Engineering
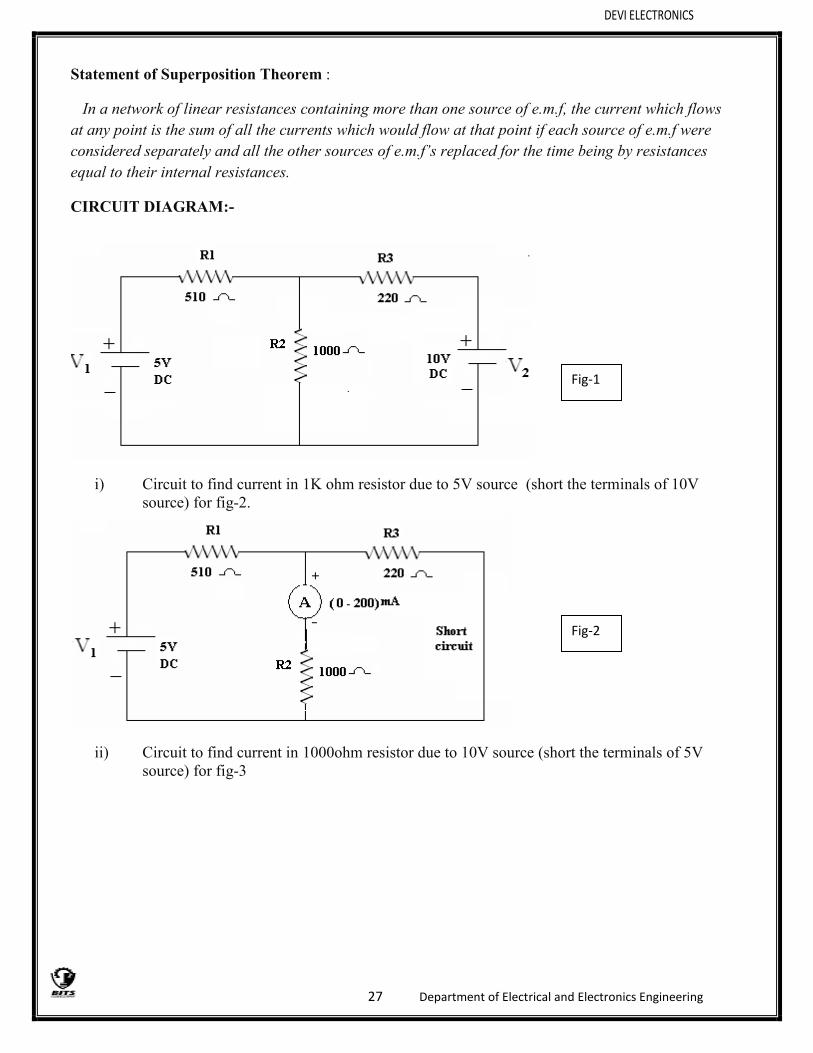
Statement of Superposition Theorem :
In a network of linear resistances containing more than one source of e.m.f, the current which flows at any point is the sum of all the currents which would flow at that point if each source of e.m.f were considered separately and all the other sources of e.m.f’s replaced for the time being by resistances equal to their internal resistances.
CIRCUIT DIAGRAM:-
i) Circuit to find current in 1K ohm resistor due to 5V source (short the terminals of 10V source) for fig-2.
ii) Circuit to find current in 1000ohm resistor due to 10V source (short the terminals of 5V source) for fig-3
Fig-1
Fig-2

DEVI ELECTRONICS
28 Department of Electrical and Electronics Engineering
iii) Circuit to find current in 1000ohm resistor due to 10V source & 5V source acting simultaneously for fig-4.
Procedure :-
1. Make the connections as per circuit diagram. 2. Short circuit the 10V source and take the reading of current in 1000ohm resistor using
an ammeter due to 5V source (as seen in fig(i)) 3. Now shortcircuit the 5V source and note down the reading of current in 1000ohm
resistor using an ammeter due to 10V source(as seen in fig(ii)) 4. Note down the reading of current using an ammeter in 1000ohm resistor due to 10V
source and 5V source acting simultaneously. 5. Theoritical calculations of currents due to individual sources and both sources acting
simultaneously are to be taken. 6. Compare theoretical (I1, I2, & I) and practical values and these are to be tabulated.
Observation table :-
I1 (mA) I2 (mA) I = I1 + I2 (mA)
Fig-4
Fig-3

DEVI ELECTRONICS
29 Department of Electrical and Electronics Engineering
Theoritical
Practical
RESULT: - It is observed that the values of currents I1 & I2 obtained are approximately equal with in limits of experimental errors, thus the superposition theorem stands verified.
MAXIMUM POWER TRANSFER THEOREM
Aim: To Verify the maximum power transfer theorem.
Apparatus Required:
Sl.no Name of the equipment Range/Type Quantity 1 Dual Regulated power
supply (0-30V)/2A DC
1 no.
2 Digital multimeter Modes DC ammeter DC volt meter Ohmmeter
(0-200mA) (0-20V) (0- 2kΩ)
1 no.
3 Resistors R1 = 100 Ω R2 = 100 Ω R3=560 Ω
1 no. each
4 Decay Resistance Box ----- 1 no.
5 Connecting Wires ----- Required
Statement of Max. Power Transfer Theorem: A resistive load will abstract maximum power from a network when the load resistance is equal to the resistance of the network as viewed from the output terminls, with all the energy sources removed leaving behind their internal resistance.
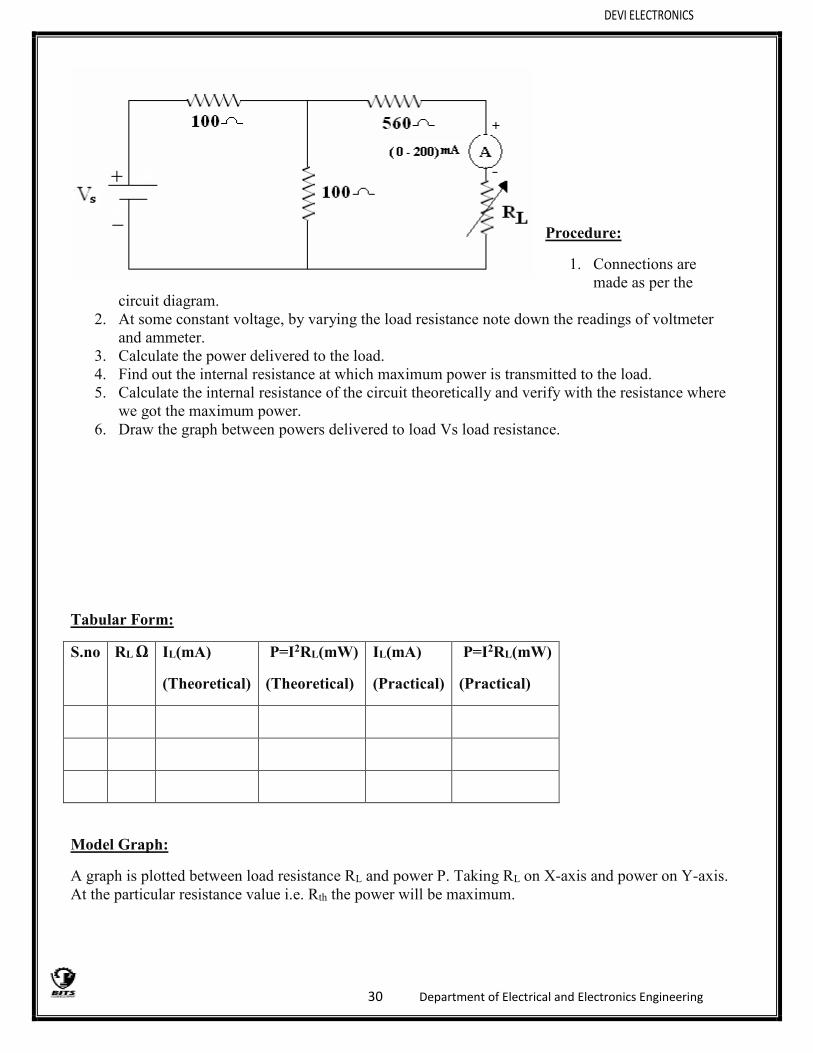
Circuit Diagram:
DEVI ELECTRONICS
30 Department of Electrical and Electronics Engineering
Procedure:
1. Connections are made as per the
circuit diagram. 2. At some constant voltage, by varying the load resistance note down the readings of voltmeter
and ammeter. 3. Calculate the power delivered to the load. 4. Find out the internal resistance at which maximum power is transmitted to the load. 5. Calculate the internal resistance of the circuit theoretically and verify with the resistance where
we got the maximum power. 6. Draw the graph between powers delivered to load Vs load resistance.
Tabular Form:
S.no RL Ω IL(mA)
(Theoretical)
P=I2RL(mW)
(Theoretical)
IL(mA)
(Practical)
P=I2RL(mW)
(Practical)
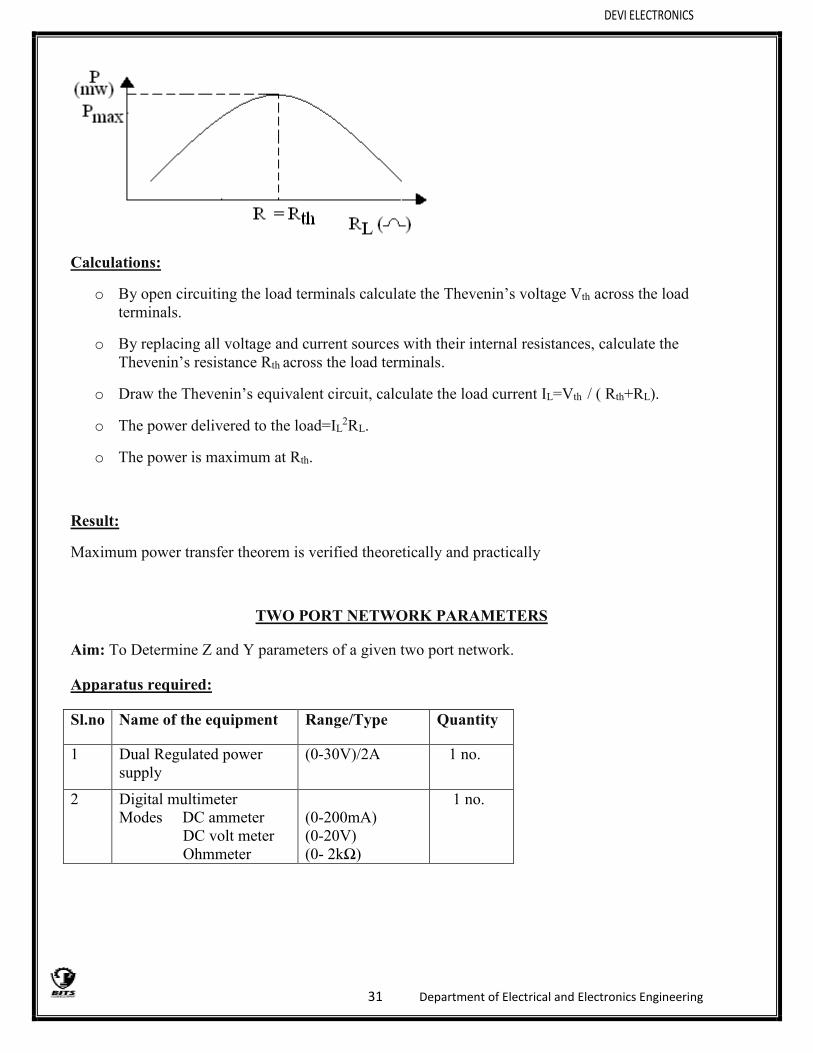
Model Graph:
A graph is plotted between load resistance RL and power P. Taking RL on X-axis and power on Y-axis. At the particular resistance value i.e. Rth the power will be maximum.
DEVI ELECTRONICS
31 Department of Electrical and Electronics Engineering
Calculations:
o By open circuiting the load terminals calculate the Thevenin’s voltage Vth across the load terminals.
o By replacing all voltage and current sources with their internal resistances, calculate the Thevenin’s resistance Rth across the load terminals.
o Draw the Thevenin’s equivalent circuit, calculate the load current IL=Vth / ( Rth+RL).
o The power delivered to the load=IL2RL.
o The power is maximum at Rth.
Result:
Maximum power transfer theorem is verified theoretically and practically
TWO PORT NETWORK PARAMETERS
Aim: To Determine Z and Y parameters of a given two port network.
Apparatus required:
Sl.no Name of the equipment Range/Type Quantity
1 Dual Regulated power supply
(0-30V)/2A 1 no.
2 Digital multimeter Modes DC ammeter DC volt meter Ohmmeter
(0-200mA) (0-20V) (0- 2kΩ)
1 no.
DEVI ELECTRONICS
32 Department of Electrical and Electronics Engineering
3 Resistors R1 = 100 Ω R2 = 100 Ω R3=560 Ω
4 Decay Resistance Box(option)
----- 1 no.
5 Connecting Wires ----- Req.
Z Parameters:
Theory: Z Parameters are also known as open circuit or impedance parameters. In Z parameters V1
and V2 are dependent variables and I1 and I2 are independent variables.
V1 = Z11I1 + Z12I2
V2 = Z21I1 + Z22I2
Where Z11, Z12, Z21, Z22 are the network functions and are known as impedance parameters.
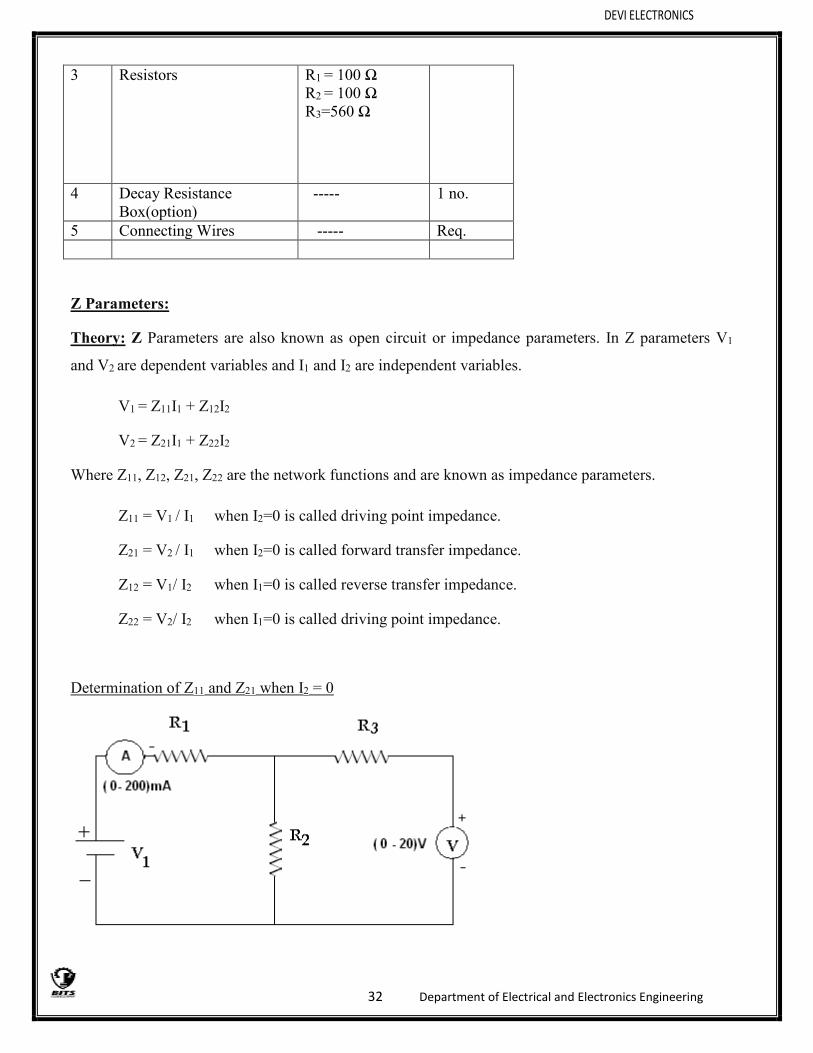
Z11 = V1 / I1 when I2=0 is called driving point impedance.
Z21 = V2 / I1 when I2=0 is called forward transfer impedance.
Z12 = V1/ I2 when I1=0 is called reverse transfer impedance.
Z22 = V2/ I2 when I1=0 is called driving point impedance.
Determination of Z11 and Z21 when I2 = 0

DEVI ELECTRONICS
33 Department of Electrical and Electronics Engineering
Fig.1
Tabular Form:
Parameter V1 I1 V2
Theoretical
Practical
Determination of Z12 and Z22 when I1 = 0
Fig.2
Tabular Form:
Procedure:
1. For measuring Z11 and Z21 make the connections as shown in Fig(1). 2. Connect port 1 to RPS, apply 10V at port 1 and measure I1 and V2.
3. For measuring Z12 and Z22 make the connections as shown in Fig (2).
4. Connect RPS to port 2, apply 10 V at port 2 and measure I2, V2.
Parameter V2 V1 I2
Theoretical
Practical

DEVI ELECTRONICS
34 Department of Electrical and Electronics Engineering
5. Determine the Z Parameters.
Z – Parameters:
Parameter Z11 = V1 / I1 Z12 = V1 / I2 Z21 = V2 / I1 Z22 = V2 / I2
Theoretical
Practical
Y PARAMETERS:
Theory:
Y Parameters are also known as short circuit or admittance parameters. In Y Parameters I1 and I2 are
dependent variable and V1, V2 are independent variables.
I1 = Y11V1 + Y12V2
I2 = Y21V1 + Y22V2
Here Y11, Y12, Y21, Y22 are the network functions called as admittance parameters.
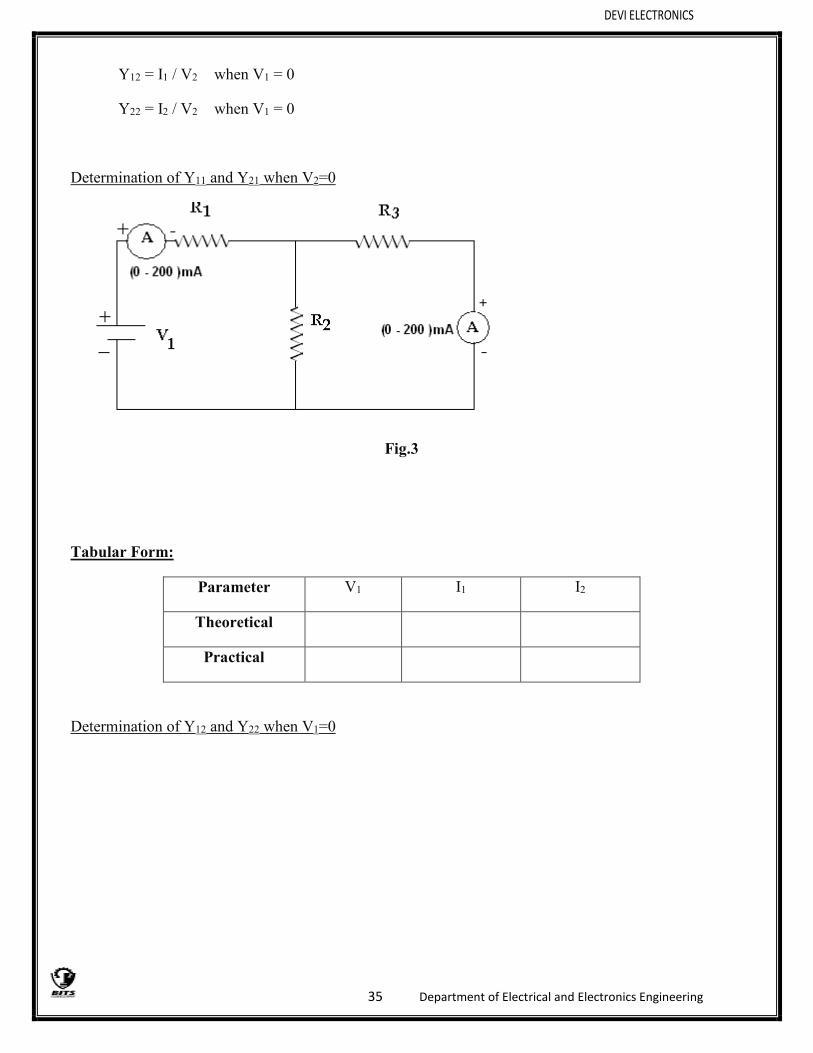
Y11 = I1 / V1 when V2 = 0
Y21 = I2 / V1 when V2 = 0
DEVI ELECTRONICS
35 Department of Electrical and Electronics Engineering
Y12 = I1 / V2 when V1 = 0
Y22 = I2 / V2 when V1 = 0
Determination of Y11 and Y21 when V2=0
Fig.3
Tabular Form:
Parameter V1 I1 I2
Theoretical
Practical
Determination of Y12 and Y22 when V1=0

DEVI ELECTRONICS
36 Department of Electrical and Electronics Engineering
Fig.4
Tabular Form:
Parameter I1 I2 V2
Theoretical
Practical
Procedure:
1. For measuring Y11, Y21 make the connections as shown in Fig (3).
2. Connect port 1 to RPS; apply 10 V at port 1 and short circuit the port 2 through an ammeter.
Note down V1, I1 and I2 values.
3. For measuring Y12, Y22 make the connections as shown in Fig (4).
4. Connect port 2 to RPS, apply 10 V at port 2 and short circuit the port 1 through an ammeter.
Note down V2, I2, I1 values.
5. Calculate the Y Parameters.
Y Parameters:

DEVI ELECTRONICS
37 Department of Electrical and Electronics Engineering
Parameter Y11 = I1 / V1 Y12 = I1 / V2 Y21 = I2 / V1 Y22 = I2 / V2
Theoretical
Practical
Result: It is observed that the values of parameters obtained are approximately equal with in limits of experimental errors, thus the Y & Z parameters stands verified.
MAXIMUM POWER TRANSFER THEOREM
Practice Problems:
Question 1: Find the Value of RL for the maximum power to transfer from source to load?

DEVI ELECTRONICS
38 Department of Electrical and Electronics Engineering
Question 2: Find the Value of R in the circuit such that Max. Power transfer takes place. What is the amount of this power?
SUPERPOSITON THEOREM
Practice Problems:
Question 1: Find the current through the R3 Resister using Superposition theorem?

DEVI ELECTRONICS
39 Department of Electrical and Electronics Engineering
Question 2: Using Superposition, find current in R4 Resister?
RECIPROCITY THEOREM
Practice Problems:
Question 1: Verify the Reciprocity theorem at the branch AB for the below circuit?

DEVI ELECTRONICS
40 Department of Electrical and Electronics Engineering
Question 2: Verify reciprocity theorem, at the terminals AB for a network when excited by a single source?
MILLMANN’S THEOREM
Practice Problems:
Question 1: Calculate the voltage across RL resister in the network using Millmann’s theorem?

DEVI ELECTRONICS
41 Department of Electrical and Electronics Engineering
Question 2: use Millmann’s theorem to calculate the voltage developed across the load resister R4 in the network?
COMPENSATION THEOREM
Practice Problems
Question 1: If the resistance of R2 branch increases to (R2 + ΔR) Ω, determine the compensation
source and verify the results?

DEVI ELECTRONICS
42 Department of Electrical and Electronics Engineering
Question 2: verify the compensation theorem if there is a change in R4 resister due to the temperature variation ?
Admittance, Impedance , Transmission, and Hybrid Parameters
Practice Problems:
Question 1: Find out the Parameters for the below circuits?

DEVI ELECTRONICS
43 Department of Electrical and Electronics Engineering
Fig. B
Fig. A
fig.C
Fig. D
Fig. E

DEVI ELECTRONICS
44 Department of Electrical and Electronics Engineering
Fig. F
SELF AND MUTUAL INDUCTANCE OF A COUPLED COIL
Aim: To Determine the self and mutual inductance of a given coupled coil and also to determine the coefficient of coupling(K)
Apparatus Required:
Sl.no Name of the equipment Range/Type Quantity
1 Single phase Supply (0-230V)/5A,

DEVI ELECTRONICS
45 Department of Electrical and Electronics Engineering
50Hz
2 Voltmeter (0-300)V / MI 1 no.
3 Ammeter (0-5) A /MI 1 no.
4 Wattmeter 300V, 5A, LPF 1 no.
5 1-Φ Transformer 230/115, 2KVA 1 no.
6 1-Φ Variac (0-250)V / 6A 1 no.
Theory:
Circuit diagram to find Coefficient of coupling
Fig. A

DEVI ELECTRONICS
46 Department of Electrical and Electronics Engineering
Fig.B
Procedure:
1. Make the connections as per the circuit diagram.
2. Apply different voltages to every winding with the help of 1-Φ variac. Note down the reading of ammeter, Voltmeter and wattmeter.
3. Calculate Coreloss current (Ic)
Ic=Io COS Φo
Wo=V1IoCOSΦo
COS Φo = W/(V1 * Io)
Magnetising Current (Im) = √(Io2-Ic
2)
E1=jwMIm
M=E1/(jwIm)=E1/(2ΠfIm)
3. Calculate inductance on load side
LLV=V1/(2*Π*f*Im)
4. Make the connections as shown in the figure(b). apply Different Voltages to the HV windings, and note down thw readings of ammeter, Voltmeter and wattmeter in a tabular column.
5. Calculate the magnetizing current (Im) by applying tha above formula.
6. Caqlculte the inductance (L) and mutual inductance (M) on the LV side.
LHV= V2/(2ΠfIm)
M= E1 / (2ΠfIm)
LHV= V2 / (2ΠfIm)
M= E2 / (2ΠfIm)
7. Calculate the coefficient of coupling (K)
K= M/ √ (LHV LLV)

DEVI ELECTRONICS
47 Department of Electrical and Electronics Engineering
Theoritical Formulae:
For Figure (a): For Figure(b):
Ic = Io COS Φo Ic = Io COS Φo
Wo = V1IoCOSΦo Wo = V1IoCOSΦo
(Im) = √(Io2-Ic
2) (Im) = √(Io2-Ic
2
M= E1 / (2ΠfIm) M= E2 / (2ΠfIm)
LLV=V1/(2*Π*f*Im) LHV=V1/(2*Π*f*Im)
Table 1:
s.no V1(V) E1(V) Io(A) Wo(W) Ic(A) Im(A) M(H) LLV (H)
Table 2:
s.no V2(V) E2(V) Io(A) Wo(W) Ic(A) Im(A) M(H) LHV (H)
Result:
The self and Mutual Inductance of a given coupled coil are calculated and the co-efficient of coupling (K) is also calculated.

DEVI ELECTRONICS
48 Department of Electrical and Electronics Engineering
SERIES AND PARALELL RESONANCE
Series Resonance
Aim: To obtain the resonance frequency, frequency curve, bandwidth, quality factor.
Apparatus Required:
Sl.no Name of the equipment Range/Type Quantity
1 Function Generator & CRO Probes
----- 1 no
2 Digital Multimeter ----- 1 no.
3 Resister 1 K ohm 1 no.
4 Inductor 100 mH 1 no.
5 Capacitor 5uF 1 no.
6 Connecting wires -----

DEVI ELECTRONICS
49 Department of Electrical and Electronics Engineering
Required
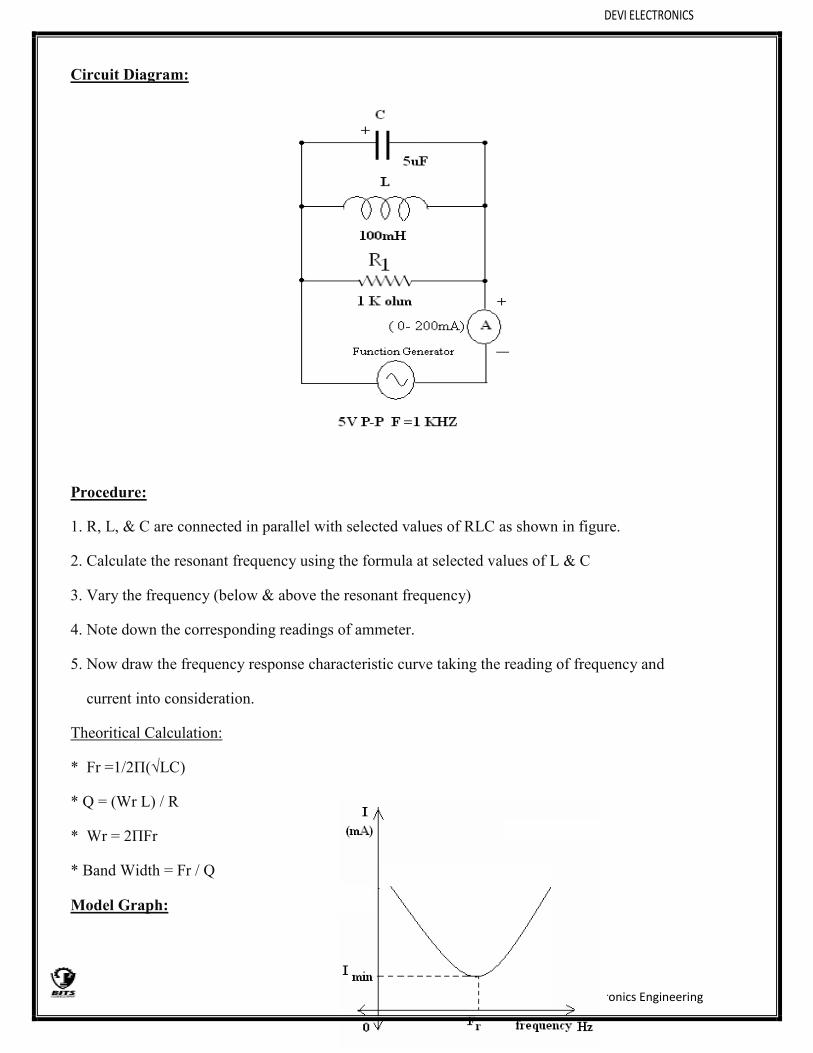
Circuit Diagram:
Procedure:
1. R, L, & C are connected in with selected values of RLC as shown in figure.
2. Calculate the resonant frequency using the formula at selected values of L & C
3. Vary the frequency (below & above the resonant frequency)
4. Note down the corresponding readings of ammeter.
5. Now draw the frequency response characteristic curve taking the reading of frequency and
current into consideration.
Theoritical Calculation:
* Fr =1/2Π(√LC)
* Q = (Wr L) / R
* Wr = 2ΠFr
* Band Width = Fr / Q
Model Graph:

DEVI ELECTRONICS
50 Department of Electrical and Electronics Engineering
Tabular Column
Sl. No Frequency (Hz) I (mA)
Result: For the given series RLC circuit bandwidth, quality factor are calculated theoretically and practically and frequency response characteristics are obtained.
Parallel Resonance
Aim: To obtain the resonance frequency, frequency curve, bandwidth, quality factor.
Apparatus Required:
Sl.no Name of the equipment Range/Type Quantity
1 Function Generator & CRO Probes
----- 1 no
2 Digital Multimeter ----- 1 no.
3 Resister 1 K ohm 1 no.
4 Inductor 100 mH 1 no.
5 Capacitor 5uF 1 no.
6 Connecting wires ----- Required
DEVI ELECTRONICS
51 Department of Electrical and Electronics Engineering
Circuit Diagram:
Procedure:
1. R, L, & C are connected in parallel with selected values of RLC as shown in figure.
2. Calculate the resonant frequency using the formula at selected values of L & C
3. Vary the frequency (below & above the resonant frequency)
4. Note down the corresponding readings of ammeter.
5. Now draw the frequency response characteristic curve taking the reading of frequency and
current into consideration.
Theoritical Calculation:
* Fr =1/2Π(√LC)
* Q = (Wr L) / R
* Wr = 2ΠFr
* Band Width = Fr / Q
Model Graph:

DEVI ELECTRONICS
52 Department of Electrical and Electronics Engineering
abular Column
Sl. No Frequency (Hz) I (mA)
Result: For the given parallel RLC circuit bandwidth, quality factor are calculated theoretically and practically and frequency response characteristics are obtained.
TITLE: MEASUREMENT OF ACTIVE POWER CONSUMED BY 3-Ф
BALANCED STAR AND DELTA LOAD
Aim: To measure active power and power in a balanced 3-Ф circuit using two single
phase wattmeter’s.
Apparatus required:
Sl.No Name of the Equipment Range Type quantity 1 3-Ф power supply 415 v ,
50 Hz --
2 3-Ф Auto transformer 415v , 50Hz
0-460v 1 No
3 ammeter 0-20 A MI 1 No 4 voltmeter 0-600v MI 1 No 5 Wattmeter 0-10A, UPF,MI 2 No. 6 3-Ф variable load ---- ----- 1 No. 7 Connecting wires Required
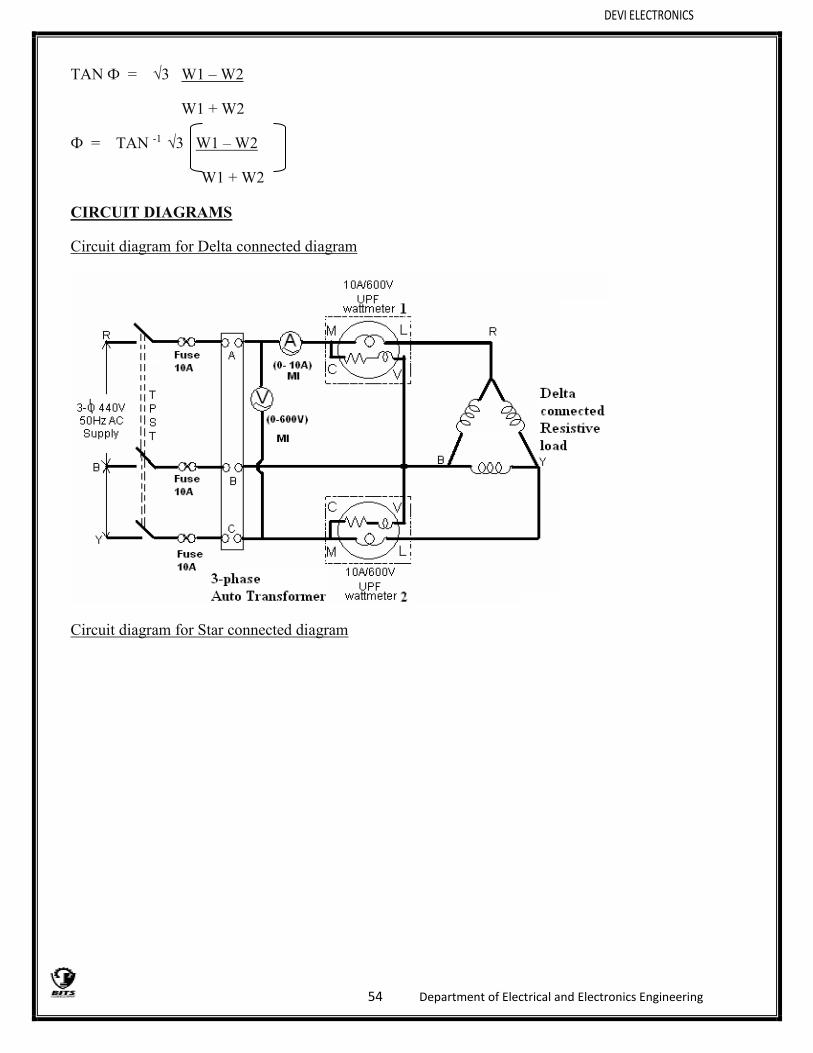
Theory:
Total power consumed by 3-Ф balanced load can be measured by using two watmeters.
The wattmeter’s consists of two coils namely pressure coil(PC) and current coil(CC).

DEVI ELECTRONICS
53 Department of Electrical and Electronics Engineering
The current coils are connected with any two of the lines say R and B. the pressure coils of the two wattmeters are connected between that line and the second line.i.e. Y line.
Considering a balanced 3-Ф load at a PF cosФ lagging, the three line currents IR, IY & IB will have the same magnitude and each will be lagging by angle Ф its corresponding voltage.
Assuming a Y connected system we have IL=Iph and VL=√3 Vph. Thus we have IR=IY=IB=Iph. Similarly, for the voltages, VR = VY = VB = Vph.
We know that the line voltages VRY= VR-VY, and line Voltage V BY=VB-VY. By phasor method we can determine line voltage VRY VBY as shown in fig. The line VRY is seen to be leading VR by 30o and line voltage VBY seen to be lagging VB by 30o. Thus the phase angle between the line voltage VRY and line current IR is 30o + Ф . Similarly, the phase angle between the line voltage VBY and line current IB is 30o+Ф. Therefore, the power in 2 wattmeters is given by,
W1=VRY*IR*COS (30o + Ф) = √ 3 Vph Iph COS (30o + Ф).
W2=VBY*IB*COS (30o - Ф) = √ 3 Vph Iph COS (30o - Ф).
The addition of two powers gives
W1 + W2 = √ 3 Vph Iph COS (30o + Ф) + √ 3 Vph Iph COS (30o - Ф).
= 3 Vph Iph COS Ф.
For ‘Y’ load:
Vph = VL / √3 , Iph = IL
W1 + W2 = 3 (VL / √3) IL COS Ф = √3 VL IL COS Ф
For ‘∆’ load:
Vph = VL, Iph = IL / √3
W1 + W2 = 3 VL ( IL / √3) COS Ф = √3 VL IL COS Ф
Power factor
W1 = COS (30o + Ф)
W2 COS (30o - Ф)
W1 – W2 = COS (30o + Ф) - COS (30o - Ф)
W1 + W2 COS (30o + Ф) + COS (30o - Ф)
= 2 SIN30o SIN Ф = TAN 30oTAN Ф
2 COS 30o COS Ф
DEVI ELECTRONICS
54 Department of Electrical and Electronics Engineering
TAN Ф = √3 W1 – W2
W1 + W2
Ф = TAN -1 √3 W1 – W2
W1 + W2
CIRCUIT DIAGRAMS
Circuit diagram for Delta connected diagram
Circuit diagram for Star connected diagram

DEVI ELECTRONICS
55 Department of Electrical and Electronics Engineering
PROCEDURE:
1) Make the connections as shown in figure. 2) Keep the three phase auto transformer at its zero position. 3) Keep the three phase variable load so as to have maximum impedance. 4) Switch ON the 3- Ф supply mains. 5) Increase the voltage supplied to the circuit by changing the position of variac so that all the meters
give readable deflection. 6) Note down the readings of all meters. 7) Change the supply voltage and repeat the step 5 and 6 for at least 5 times. 8) If changing the supply voltage does not give sufficient number of readings the 3-Ф load can also
be changed to take different readings. 9) Decrease the voltage supplied to the circuit autotransformer. 10) Switch OFF the supply.
Precautions:
1. All the connections should be tight. 2. The readings in ammeters should not exceed the current ratings of wattmeters. 3. During the experiment one of the wattmeters may give give negative deflection. In this case the
connections of either the current coil or the pressure coil of the wattmeter should be reversed, the wattmeter will give positive deflection. The reading of that wattmeter should now be recorded with negative sign.

DEVI ELECTRONICS
56 Department of Electrical and Electronics Engineering
Observations:
Sl.no V
(volts)
I
(amp)
W1
(watts)
W2
(watts)
P =W1+W2
(watts)
P =W1-W2
(watts)
COS Ф
(deg)
Rssults:
EXPERIMENT
DETERMINATION OF SELF, MUTUAL INDUCTANCE AND COEFFICIENT OF COUPLING
AIM:
To determine self, mutual inductance and coefficient of coupling of a mutually coupled circuit.
APPARATUS:
S. No. Name of the Equipment Range Type Quantity
1 Ammeter
2 Voltmeter
3 1-phase Transformer
4 1-phase Variac
5 1-ph A.C. Supply
6 Connecting Wires

DEVI ELECTRONICS
57 Department of Electrical and Electronics Engineering
Circuit diagram:
Fig. A
Fig.B
14.1 PROCEDURE:
1. Connect the circuit as shown in fig.14.1 and measure the self inductance of coil 1
i.e. L1 by noting the voltmeter and ammeter readings.
2. Connect the circuit as shown in fig.14.2 and measure the self inductance of coil 2

DEVI ELECTRONICS
58 Department of Electrical and Electronics Engineering
i.e. L2 by noting the voltmeter and ammeter readings.
3. Connect the circuit as shown fig.14.3 and note down voltmeter (V) and
ammeter (A) readings and determine equivalent inductance Leq. 4. Calculate coefficient of coupling.
14.2 THEORETICAL CALCULATIONS: (Neglect winding resistance) Leq = L1+L2±2M
Mutual Inductance M=[(Leq – (L1+L2))/2]
Coefficient of Coupling K = M/√ (L1L2) Where L1 and L2 are determined as follows
Determination of L1 From fig.A
XL1= voltmeter reading
/ammeter reading XL1= ωL1
= 2ΠfL1
L1 = XL1/2Πf (Henry)
Determination of L2 From fig B
XL2 = Voltmeter reading /Ammeter reading XL2= ωL2 = 2ΠfL2
L2= XL2 / 2Πf (Henry)
Determination of Leq From fig 14.3
XLeq = Voltmeter reading
/Ammeter reading XLeq =
ωLeq = 2ΠfLeq
Leq = XLeq/2Πf (Henry)
TABULAR COLUMN: For XL1
S. No. Voltmeter Reading Ammeter Reading XL1 =V/I
1

DEVI ELECTRONICS
59 Department of Electrical and Electronics Engineering
2
3
4
For XL2
S. No. Voltmeter Reading Ammeter Reading XL2 =V/I
1
2
3
4
For Xeq
S. No Voltmeter Reading Ammeter Reading XLeq =V/I 1 2 3 4
RESULT: PRE LAB VIVA QUESTIONS:
1. What is self inductance? 2. What is mutual inductance? 3. Define coefficient of coupling. 4. What is the formula for coefficient of coupling? 5. Define self induced emf. 6. Define mutually induced emf.
LAB ASSIGNMENT: 7. Derive the expression between self inductance of two coils, mutual inductance
between them and coefficient of coupling. 8. State and explain Faraday’s law of electromagnetic induction. 9. Two coils of self inductances L1 and L2 are connected in series and M is the

DEVI ELECTRONICS
60 Department of Electrical and Electronics Engineering
mutual inductance between them, derive the expression for the net inductance
of the coil.
POST LAB VIVA QUESTIONS: 10. Using dot convention, discuss the coupling in a simple magnetic circuit? 11. What is statically induce emf and dynamically induce emf? 12. Compare electric and magnetic circuit. 13. What is Lenz’s law?

DEVI ELECTRONICS
61 Department of Electrical and Electronics Engineering
PSPICE
INTRODUCTION
The acronym PSPICE stands for - Simulation Program with Integrated Circuit Emphasis.
SPICE is a general purpose circuit diagram that simulates electronics circuits. Spice can perform various analyses of electronics circuits namely operating point of transistor, a time domain response, a small signal frequency response etc. It is a versatile program.
It contains certain models for common circuit elements, active as well as passive and is capable of simulating most electronic circuits.
The algorithms of spice are general in nature but are robust and powerful for simulating electrical and electronics circuits. The input syntax for spice is a free format style, it does not require that data be entered in fixed columns locations. Spice assumes reasonable default values for unspecified circuit parameters. In addition, it performs considerable amount of error checking to ensure that a circuit has been entered correctly.
A circuit is described by statements that are stored in a file called circuit file. It is normally typed from the keyboard. The circuit file is read by Pspice simulator. Each statement is self contained and independent, the statements do not interact with each other.
The circuit file contains the circuit details of components and elements, the information about thee sources and the command for what to calculate and what to provide as output.
The circuit file is the input file to the Spice program which after executing the commands, produces the results in another file called the output file.
Types of analysis : PSpice allows various types of analysis
DC Analysis: It is used for circuits with time –invariant sources. It calculates all node voltages and branch currents over a range of values.
.DC --- DC sweep of an input voltage / current source over a range of values
.OP --- DC operating point to obtain all node voltages
Transient analysis: It is used for circuits with time variant sources. It calculates all node voltages and branch currents over a time interval, and their instantaneous values are the outputs.
.TRAN --- circuit behaviour in response to time varying sources.

DEVI ELECTRONICS
62 Department of Electrical and Electronics Engineering
AC analysis: It is used for small signal analysis of circuits with sources of variable frequencies. It calculates all node voltages and branch currents over a range of frequencies.
.AC --- circuit over arrange of source frequencies.
Circuit description:
A circuit must be specified in terms of elements names, element values, nodes, variable parameters and sources.
For a circuit that is to be simulated for calculating all node voltages and currents, the user has to show the required:
1) How to describe this circuit to spice. 2) How to specify the type of analysis to be performed 3) How to define the required output variables.
Element values:
The element values are written in standard floating point notation with optional scale and unit suffixes. There are two types of suffixes: scale suffix , unit suffix.
RECOGNISED SCALE SUFFIXES:
N=1E-9, U =1E-6, M=1E-3, K=1E3, 1MEG=1E6,
RECOGNISED SCALE SUFFIXES:
V=volt, A=amp, HZ=hertz, OHM=ohm, H= henry, F= farad, DEG=degree
NODES:
The location of the element is identified by the node numbers. Each element is connected between two nodes. Node numbers are assigned in the circuit. Node 0 ids predefined as ground.
The node numbers to which an element is connected are specified after the name of an element.
Format for describing passive elements:
< element name > < positive node > < negative node > < value >
Symbols of circuit elements and sources;
C----------capacitor
D----------Diode

DEVI ELECTRONICS
63 Department of Electrical and Electronics Engineering
I------------Independent cuurent source
L-----------Inductor
R-----------Resistor
V----------Independent Voltage source
Format for describing source elements :
< source name > < positive node > < negative node > < source model >
The model for a simple dc source is : DC < value>
Ex: VS 1 0 DC 20V
Output variables:
To print or plot output voltages or currents spice permits certain types.
V(4,0) – voltage of node 4 w.r.t to node 0 i.e, ground.
Spice can give the current of a voltage source as an output by dummy voltage source of 0V
VX 3 0 DC 0V ; measures current through node 3 element.
Commands:
.PROBE : Probe is a graphical waveform analyzer for PSpice
.PLOT : This command generates the plot on the output file
.PRINT : This command gives a table of data on the output file
.END : End of file statement
.
TITLE: SIMULATION OF DC CIRCUIT

DEVI ELECTRONICS
64 Department of Electrical and Electronics Engineering
Aim: To simulate the circuit on Pspice and to find out the node voltages and respective
branch currents.
Software: PSPICE
Version: MICROSIM EVALUATION 8.0
Circuit diagram:
Program:
VS 1 0 DC 20V
IS 0 4 DC 50MA
R1 6 2 500
R2 2 5 800
R3 2 3 1KOHM
R4 4 0 200
VX 3 0 DC 0V

DEVI ELECTRONICS
65 Department of Electrical and Electronics Engineering
VY 5 4 DC 0V
VZ 1 6 DC 0V
.DC VS 10V 30V 10V
.PRINT DC V(4) I(VX) I(VY) I(VZ)
.END
Output file
RESULT:
THEORITICAL CALCULATIONS:
Note :File name is given with < file name .cir >extension
TITLE : TRANSIENT RESPONSE OF A DC CIRCUIT
Aim: To find the dc transient response of a series RLC circuit for a PULSE input.

DEVI ELECTRONICS
66 Department of Electrical and Electronics Engineering
Software: PSPICE
Version: MICROSIM EVALUATION 8.0
Circuit diagram:
Program:
VIN 1 0 PULSE(-220 220 0 0 1NS 1NS 100US 200US)
R1 1 2 2
L1 2 3 50UH
C1 3 0 10UF
.TRAN 1US 400US
.PROBE
.END
Output file:
RESULT:
DC TRANSIENT RESPONSE OF A SERIES RLC CIRCUIT FOR A STEP INPUT.
Aim: To find the dc transient response of a series RLC circuit for a STEP input.
Software: PSPICE
Version: MICROSIM EVALUATION 8.0
Circuit diagram:

DEVI ELECTRONICS
67 Department of Electrical and Electronics Engineering
Program:
VI1 1 0 PWL (0 0 1NS 1V 1MS 1V) VI2 4 0 PWL (0 0 1NS 1V 1MS 1V) VI3 7 0 PWL (0 0 1NS 1V 1MS 1V) R1 1 2 2 L1 2 3 50UH C1 3 0 10UF R2 4 5 1 L2 5 6 50UH C2 6 0 10UF R3 7 8 8 L3 8 9 50UH C3 9 0 10UF .TRAN 1US 400US .PROBE .END
Output file:
RESULT:
DC TRANSIENT RESPONSE OF A SERIES RLC CIRCUIT FOR A SINE INPUT
Aim: To find the dc transient response of a series RLC circuit for a SINE input.
Software: PSPICE
Version: MICROSIM EVALUATION 8.0
Circuit diagram:

DEVI ELECTRONICS
68 Department of Electrical and Electronics Engineering
Program:
VIN 1 2 SIN(0 10V 5KHZ) R1 1 2 2 L1 2 3 50UH C1 3 0 10UF .TRAN 1US 500US .PLOT TRAN V(3) V(7) .PROBE .END Output file:
RESULT:

DEVI ELECTRONICS
69 Department of Electrical and Electronics Engineering
Harmonic Analysis and Determination of Form Factor
AIM:-
Sl.No Experiment Name
1 Harmonic Analysis of non-sinusoidal waveform signals using Harmonic Analyzer and plotting spectrum.
2
Determination of form factor for non-sinusoidal waveform
APPARATUS REQUIRED:-
Si.No Apparatus name Qty 01 Harmonic Analyzer (THDPM-1) 01 02 Test bench setup 01 03 LED bulb 5W 01 04 CFL Bulb 15W 01 05 Connecting wires. As required
THEORY:-
By using Total Harmonics Distortion Power Meter we can analyze the harmonics present in
different types of electrical apparatus.
DEVI ELECTRONICS
70 Department of Electrical and Electronics Engineering
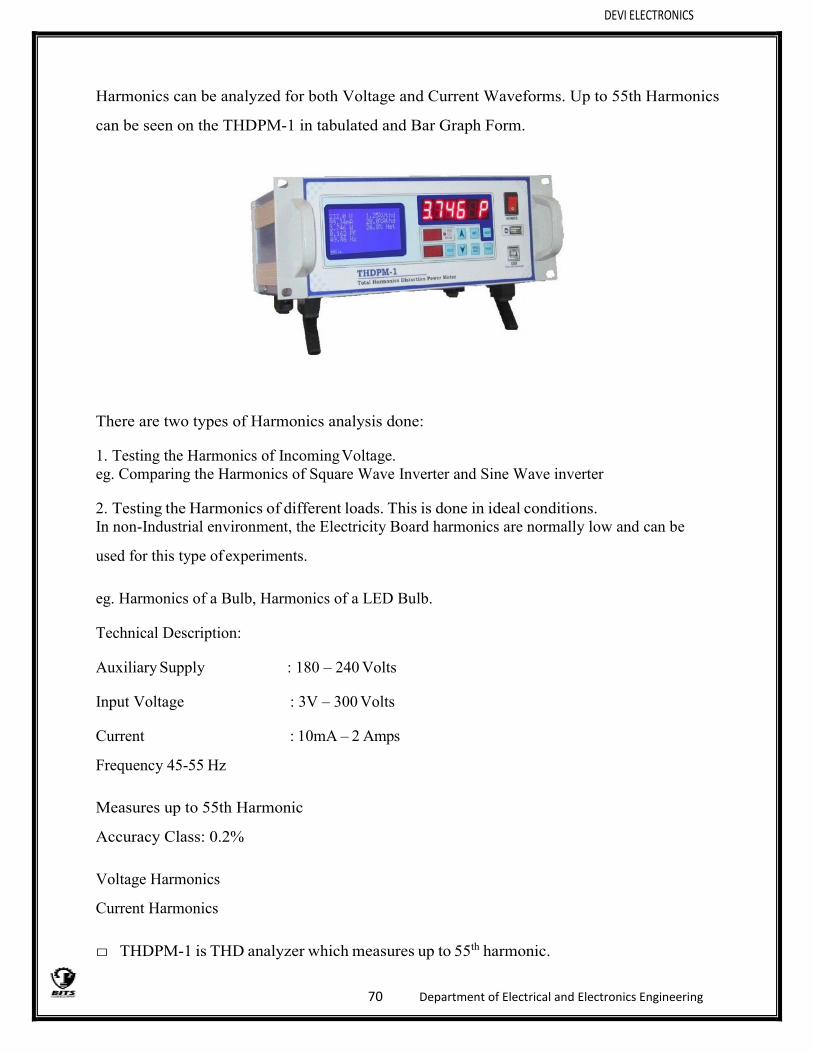
Harmonics can be analyzed for both Voltage and Current Waveforms. Up to 55th Harmonics
can be seen on the THDPM-1 in tabulated and Bar Graph Form.
There are two types of Harmonics analysis done:
1. Testing the Harmonics of Incoming Voltage. eg. Comparing the Harmonics of Square Wave Inverter and Sine Wave inverter
2. Testing the Harmonics of different loads. This is done in ideal conditions. In non-Industrial environment, the Electricity Board harmonics are normally low and can be
used for this type of experiments.
eg. Harmonics of a Bulb, Harmonics of a LED Bulb.
Technical Description:
Auxiliary Supply : 180 – 240 Volts
Input Voltage : 3V – 300 Volts
Current : 10mA – 2 Amps
Frequency 45-55 Hz
Measures up to 55th Harmonic
Accuracy Class: 0.2%
Voltage Harmonics
Current Harmonics
THDPM-1 is THD analyzer which measures up to 55th harmonic.

DEVI ELECTRONICS
71 Department of Electrical and Electronics Engineering
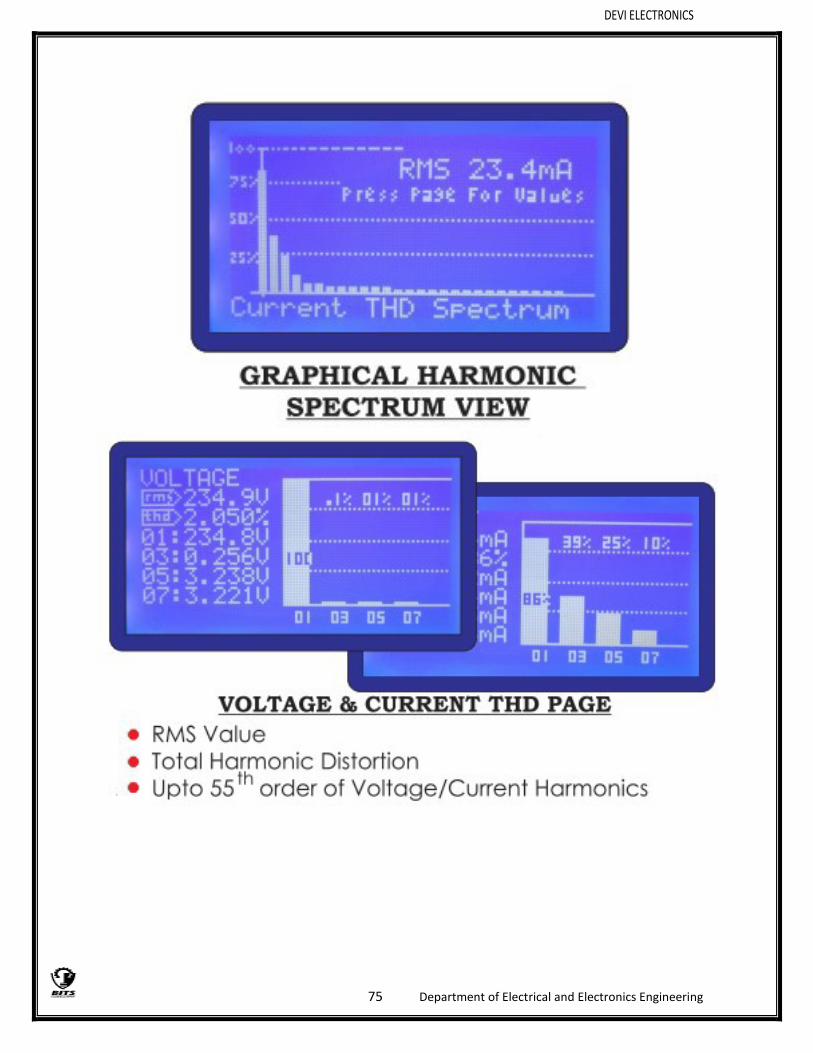
It provides Voltage and Current THD.
It shows the net effect on THD due to load. It also shows following parameters
Voltage
Current
Watt
Frequency
Power Factor
It is useful for testing of LED Drivers, SMPS, CFL, CHOKES, Charger, AC to DC Converter, UPS etc.
Fig 1: Panel View

DEVI ELECTRONICS
72 Department of Electrical and Electronics Engineering
Fig 2: Test bench setup
Fig 3: Circuit Diagram

DEVI ELECTRONICS
73 Department of Electrical and Electronics Engineering
PROCEDURE:-
For Experiment No: 1
HARMONIC ANALYSIS OF NON-SINUSOIDAL WAVEFORM SIGNALS USING HARMONIC ANALYZER AND PLOTTING SPECTRUM.
1. Switch ON the Harmonic Analyzer kit. 2. Connect the Circuit as per the circuit diagram as shown in fig. 3. Connect the source terminals of Harmonic Analyzer to source terminals
provided on the panel. 4. Connect the Load terminals of Harmonic Analyzer to Load terminals
provided on the panel. 5. Now, switch ON CFL bulb using switch provided. 6. Observe the readings displayed on Harmonic Analyzer kit main page. 7. Note down the voltage Harmonics and 𝑽𝑽𝑻𝑻𝑯𝑯𝑫𝑫 % level. 8. Note down the Current Harmonics and 𝑨𝑨𝑻𝑻𝑯𝑯𝑫𝑫 % level. 9. Tabulate the readings in tabular column. 10. Observe the Harmonic Spectrum graph displayed on Harmonic Analyzer kit. 11. Repeat the above procedure for LED bulb also. 12. Repeat the above procedure for CFL and LED bulb combination.
For Experiment No: 2
DETERMINATION OF FORM FACTOR FOR NON-SINUSOIDAL WAVEFORM
1. Switch ON the Harmonic Analyzer kit. 2. Connect the Circuit as per the circuit diagram as shown in fig. 3. Connect the source terminals of Harmonic Analyzer to source terminals
provided on the panel. 4. Connect the Load terminals of Harmonic Analyzer to Load terminals
provided on the panel. 5. Now, switch ON CFL/LED bulb using switch provided. 6. Observe the Form factor and crest factor displayed on Harmonic Analyzer. 7. Using the formula determine the form factor and note down the readings.

DEVI ELECTRONICS
74 Department of Electrical and Electronics Engineering
DEVI ELECTRONICS
75 Department of Electrical and Electronics Engineering

DEVI ELECTRONICS
76 Department of Electrical and Electronics Engineering
READINGS FROM THE THD METER:
Voltage and Current Harmonics up to 55th Harmonics

DEVI ELECTRONICS
77 Department of Electrical and Electronics Engineering
OBSERVATION TABLES:-
Voltage: Current: Power: Power Factor: Frequency: 𝑽𝑽𝑻𝑻𝑯𝑯𝑫𝑫 %: 𝑨𝑨𝑻𝑻𝑯𝑯𝑫𝑫 %:
Exp. 1
Type of load: LED bulb. (Voltage and Current Harmonics up to 55th Harmonics)
Harmonics Voltage THD Voltage THD %
Harmonics Current THD Current THD %

DEVI ELECTRONICS
78 Department of Electrical and Electronics Engineering
Exp. 2
Type of load: CFL bulb. (Voltage and Current Harmonics up to 55th Harmonics)
Harmonics Voltage THD Voltage THD %
Harmonics Current THD Current THD %
Exp. 3
Type of load: CFL & LED bulb. (Voltage and Current Harmonics up to 55th Harmonics)
Harmonics Voltage THD Voltage THD %
Harmonics Current THD Current THD %

Electrical Circuits and Simulation Laboratory
Department of Electrical &Electronics Engineering
For Experiment No: 2
DETERMINATION OF FORM FACTOR FOR NON-SINUSOIDAL WAVEFORM
Related Documents