Electrical and electromagnetic interference shielding properties of flow-induced oriented carbon nanotubes in polycarbonate Mohammad Arjmand a , Mehdi Mahmoodi b , Genaro A. Gelves a , Simon Park b , Uttandaraman Sundararaj a, * a Department of Chemical and Petroleum Engineering, University of Calgary, Calgary, Canada b Department of Mechanical and Manufacturing Engineering, University of Calgary, Calgary, Canada ARTICLE INFO Article history: Received 31 January 2011 Accepted 13 April 2011 Available online 20 April 2011 ABSTRACT The electrical and electromagnetic interference shielding effectiveness (EMI SE) properties of multi-walled carbon nanotubes/polycarbonate (MWCNT/PC) composites are investi- gated. The composites were prepared by diluting masterbatch (15 wt.% MWCNT) using a Haake mixer and then injection-molded into a dog-bone mold. Various MWCNT alignments were created by changing operating conditions. Electrical resistivity measurements were carried out at three different areas at both parallel and perpendicular to the flow direction. The results showed higher resistivity and percolation threshold at higher alignments in both parallel and perpendicular to the flow direction. By applying Ohm’s law it was seen that after percolation, the field emission mechanisms are more important at higher orien- tations. Higher MWCNT alignments were observed in areas with higher resistivities, and this was verified using SEM, TEM and Raman spectroscopy techniques. Additionally, EMI SE measurements were done on compression-molded samples at different concentrations and thicknesses. The results showed that both EMI SE by reflection and absorption increased with increase in MWCNT loading and shielding material thickness. Ó 2011 Elsevier Ltd. All rights reserved. 1. Introduction Owing to their unique properties such as excellent electrical and mechanical properties, low density and high aspect ratio, carbon nanotubes (CNTs) have outstanding potential to be used as nanofiller for polymer composites [1–3]. Conductive network formation in conductive polymer composites (CPCs) is better understood based on the concept of percolation threshold [4]. Percolation means that at least one pathway forms to allow the electrical current to pass through the sam- ple which alters the material from insulative to conductive. Electrical percolation at very low filler concentration in CNT/polymer composites leads to production of cost-effective composites. Electrostatic discharge (ESD) dissipation and electromag- netic interference shielding effectiveness (EMI SE) are the ma- jor applications for CPCs [5]. The surface resistivity or volume resistivity of filled polymer defines its application. For ESD dissipation, typically a surface resistivity of 10 6 –10 9 X sq 1 is required while for EMI SE applications, a surface resistivity of lower than 10 X sq 1 and EMI SE of at least 30 dB is needed [6]. If a part has conductivity in the ESD dissipation range, it can be utilized to bleed off charge to avert harmful arcing dis- charges. ESD applications comprise chip and circuit board 0008-6223/$ - see front matter Ó 2011 Elsevier Ltd. All rights reserved. doi:10.1016/j.carbon.2011.04.039 * Corresponding author. Address: University of Calgary, Department of Chemical and Petroleum Engineering, Calgary, Alberta Canada T2N 1N4. Fax: +1 403 284 4852. E-mail address: [email protected] (U. Sundararaj). CARBON 49 (2011) 3430 – 3440 available at www.sciencedirect.com journal homepage: www.elsevier.com/locate/carbon

Welcome message from author
This document is posted to help you gain knowledge. Please leave a comment to let me know what you think about it! Share it to your friends and learn new things together.
Transcript
C A R B O N 4 9 ( 2 0 1 1 ) 3 4 3 0 – 3 4 4 0
. sc iencedi rec t .com
avai lab le at wwwjournal homepage: www.elsev ier .com/ locate /carbon
Electrical and electromagnetic interference shieldingproperties of flow-induced oriented carbon nanotubesin polycarbonate
Mohammad Arjmand a, Mehdi Mahmoodi b, Genaro A. Gelves a, Simon Park b,Uttandaraman Sundararaj a,*
a Department of Chemical and Petroleum Engineering, University of Calgary, Calgary, Canadab Department of Mechanical and Manufacturing Engineering, University of Calgary, Calgary, Canada
A R T I C L E I N F O
Article history:
Received 31 January 2011
Accepted 13 April 2011
Available online 20 April 2011
0008-6223/$ - see front matter � 2011 Elsevidoi:10.1016/j.carbon.2011.04.039
* Corresponding author. Address: University o1N4. Fax: +1 403 284 4852.
E-mail address: [email protected]
A B S T R A C T
The electrical and electromagnetic interference shielding effectiveness (EMI SE) properties
of multi-walled carbon nanotubes/polycarbonate (MWCNT/PC) composites are investi-
gated. The composites were prepared by diluting masterbatch (15 wt.% MWCNT) using a
Haake mixer and then injection-molded into a dog-bone mold. Various MWCNT alignments
were created by changing operating conditions. Electrical resistivity measurements were
carried out at three different areas at both parallel and perpendicular to the flow direction.
The results showed higher resistivity and percolation threshold at higher alignments in
both parallel and perpendicular to the flow direction. By applying Ohm’s law it was seen
that after percolation, the field emission mechanisms are more important at higher orien-
tations. Higher MWCNT alignments were observed in areas with higher resistivities, and
this was verified using SEM, TEM and Raman spectroscopy techniques. Additionally, EMI
SE measurements were done on compression-molded samples at different concentrations
and thicknesses. The results showed that both EMI SE by reflection and absorption
increased with increase in MWCNT loading and shielding material thickness.
� 2011 Elsevier Ltd. All rights reserved.
1. Introduction
Owing to their unique properties such as excellent electrical
and mechanical properties, low density and high aspect ratio,
carbon nanotubes (CNTs) have outstanding potential to be
used as nanofiller for polymer composites [1–3]. Conductive
network formation in conductive polymer composites (CPCs)
is better understood based on the concept of percolation
threshold [4]. Percolation means that at least one pathway
forms to allow the electrical current to pass through the sam-
ple which alters the material from insulative to conductive.
Electrical percolation at very low filler concentration in
er Ltd. All rights reserved
f Calgary, Department of C
(U. Sundararaj).
CNT/polymer composites leads to production of cost-effective
composites.
Electrostatic discharge (ESD) dissipation and electromag-
netic interference shielding effectiveness (EMI SE) are the ma-
jor applications for CPCs [5]. The surface resistivity or volume
resistivity of filled polymer defines its application. For ESD
dissipation, typically a surface resistivity of 106–109 X sq�1 is
required while for EMI SE applications, a surface resistivity
of lower than 10 X sq�1 and EMI SE of at least 30 dB is needed
[6]. If a part has conductivity in the ESD dissipation range, it
can be utilized to bleed off charge to avert harmful arcing dis-
charges. ESD applications comprise chip and circuit board
.
hemical and Petroleum Engineering, Calgary, Alberta Canada T2N
C A R B O N 4 9 ( 2 0 1 1 ) 3 4 3 0 – 3 4 4 0 3431
carries for shipping of electronic equipments [7]. Many elec-
tronic devices innately emit electromagnetic signals. Since
these signals can interfere with the operation of other elec-
tronic devices, related agencies have applied regulations for
electromagnetic compatibility of electronic housings. Electro-
magnetic compatibility (EMC) means that a device does not
affect itself or other devices by emitted emissions. Therefore,
EMC standards must be met or exceeded for saleable electron-
ics products [8,9].
Understanding the shielding mechanisms is critical to de-
sign the CPCs appropriately to avoid overshielding which re-
sults in higher product cost and to avoid undershielding
which may cause failure in the final material application
[10]. Reflection, absorption and multiple-reflection are three
dominant mechanisms of EMI SE in CPCs [11]. To reflect or ab-
sorb electromagnetic waves, shielding materials should hold
mobile charge carriers to interact with the incoming electro-
magnetic waves [12–14]. The third mechanism of shielding
is multiple-reflection which represents internal reflections
within the shielding material. Multiple-reflection usually oc-
curs when there are numerous surface areas or interfacial
areas in conductive material like filler-added or foamed mate-
rial. It is worthwhile to mention that reflection and absorp-
tion increase the overall EMI SE whereas multiple-reflection
decreases the overall EMI SE.
Generally speaking, parameters such as aspect ratio, con-
ductivity, orientation, dispersion and concentration of con-
ductive filler influence percolation threshold, conductivity
and EMI SE of CPCs [15]. Processing method is another signif-
icant factor that can influence the above mentioned parame-
ters. Accordingly, having a good comprehension of processing
methods gives direction to researchers to control the final
properties appropriately. Usually, homogeneous dispersion
cannot be attained because of high van der Waals interactions
between CNTs which leads to tangled intertwined agglomer-
ates. To exploit CNT properties, including electrical proper-
ties, efficiently, these fillers should be dispersed in polymer
well. Among the known methods to disperse CNT, melt mix-
ing is the most popular due to its compatibility with current
industrial methods and because it is environmentally benign.
It has been reported that composites filled with higher aspect
ratio fibers have higher EMI SE and conductivity [16,17] and
lower percolation threshold than those with lower aspect ra-
tio fibers; therefore, the blending conditions should be opti-
mized to have best dispersion and lowest aspect ratio loss
to get best electrical properties.
CNT alignment can affect the electrical properties of CPCs
greatly. Alignment of one dimensional CNTs leads to strong
anisotropy in mechanical, electrical and even optical proper-
ties of composites [18–25]. Behnam et al. [26] simulated the
dispersion of high aspect ratio conductive filler and alleged
that minimum resistivity occurs for partially aligned nano-
tubes. Abbasi et al. [19] studied the influence of nanotube
alignment on electrical properties of CNT-based polycarbon-
ate nanocomposites using micro-injection molding and com-
pared the results with compression-molded samples. They
reported that the high degree of alignment achieved by mi-
cro-injection molding led to higher percolation threshold
than that seen in compression-molded samples.
The focus of this paper is the effect of multi-walled carbon
nanotube (MWCNT) alignment on electrical properties of
MWCNT/polycarbonate (PC) system using dog-bone samples
made via injection molding. Flow-induced alignment of
MWCNTs was achieved by applying intensive drag/shear
force during the molding process. The degrees of alignment
were investigated using SEM, TEM and Raman spectroscopy.
The data were compared with the alignment data for com-
pression-molded rectangular samples, which give random
distribution of MWCNT. Besides, EMI SE of rectangular com-
pression-molded samples was measured and corresponding
shielding mechanisms were analyzed.
2. Experimental
2.1. Composite preparation and molding
In this study, 15 wt.% MWCNT/PC masterbatch was pur-
chased from Hyperion Catalysis International, Cambridge,
MA, USA. The pristine polycarbonate used was Lexan 141,
kindly provided by Sabic Innovative Plastics, with melt flow
index of 10.5 g/min and density of 1.19 g/cm3. Prior to mixing,
all the materials were dried under vacuum at 120 �C for 4 h.
A Haake rheomix series 600 batch mixer was used to dilute
the PC/MWCNT masterbatch to make samples with 0.1, 0.3,
0.5, 1.0, 1.5, 2.0, 3.5, 5.0, 7.5 and 10 wt.% MWCNT. Granular
polycarbonate was first mixed for 5 min at 300 �C and
50 rpm, and then masterbatch was added to the melt and
mixed for additional 10 min. In all cases, the amount of mate-
rial added filled 78% of the mixer volume at the mixer temper-
ature. To prepare the material for use in the injection molding
system, the mixed compound was ground using a Retsch
Brinkmann grinder with a 3 mm sieve while liquid nitrogen
was poured into the grinding system to avoid overheating
and morphology alteration.
An injection molding machine (Boy 12A) was used to inject
the material into a two-cavity mold according to the ASTM
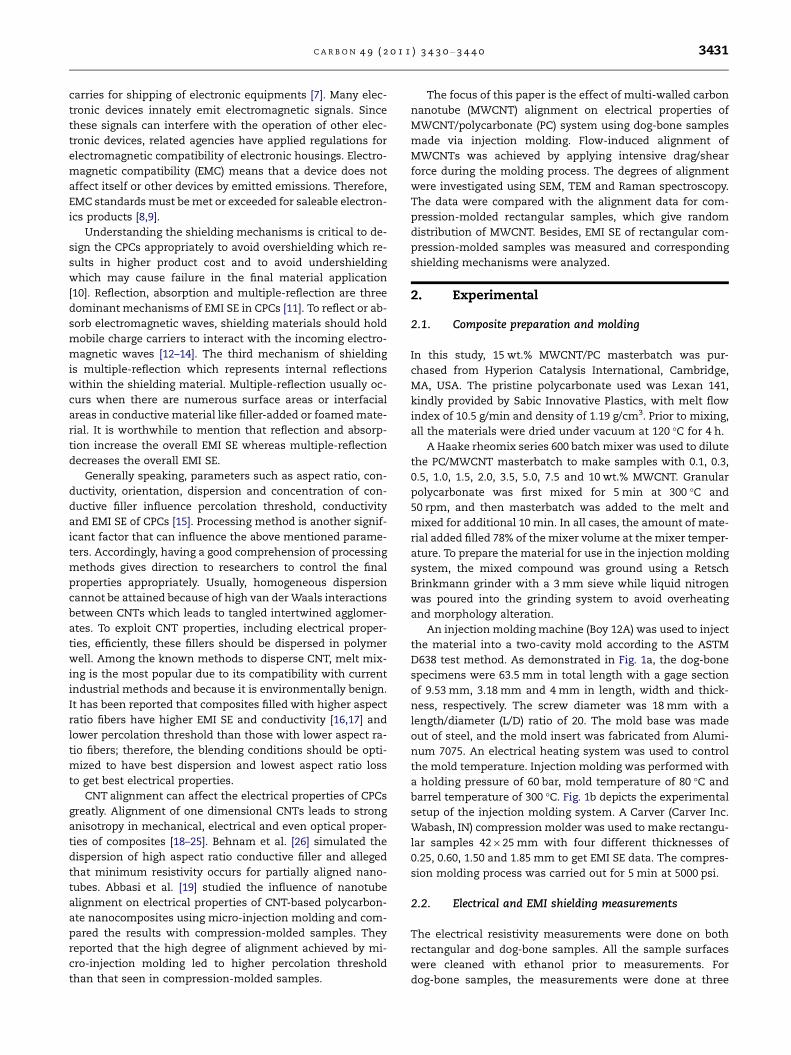
D638 test method. As demonstrated in Fig. 1a, the dog-bone
specimens were 63.5 mm in total length with a gage section
of 9.53 mm, 3.18 mm and 4 mm in length, width and thick-
ness, respectively. The screw diameter was 18 mm with a
length/diameter (L/D) ratio of 20. The mold base was made
out of steel, and the mold insert was fabricated from Alumi-
num 7075. An electrical heating system was used to control
the mold temperature. Injection molding was performed with
a holding pressure of 60 bar, mold temperature of 80 �C and
barrel temperature of 300 �C. Fig. 1b depicts the experimental
setup of the injection molding system. A Carver (Carver Inc.
Wabash, IN) compression molder was used to make rectangu-
lar samples 42 · 25 mm with four different thicknesses of
0.25, 0.60, 1.50 and 1.85 mm to get EMI SE data. The compres-
sion molding process was carried out for 5 min at 5000 psi.
2.2. Electrical and EMI shielding measurements
The electrical resistivity measurements were done on both
rectangular and dog-bone samples. All the sample surfaces
were cleaned with ethanol prior to measurements. For
dog-bone samples, the measurements were done at three
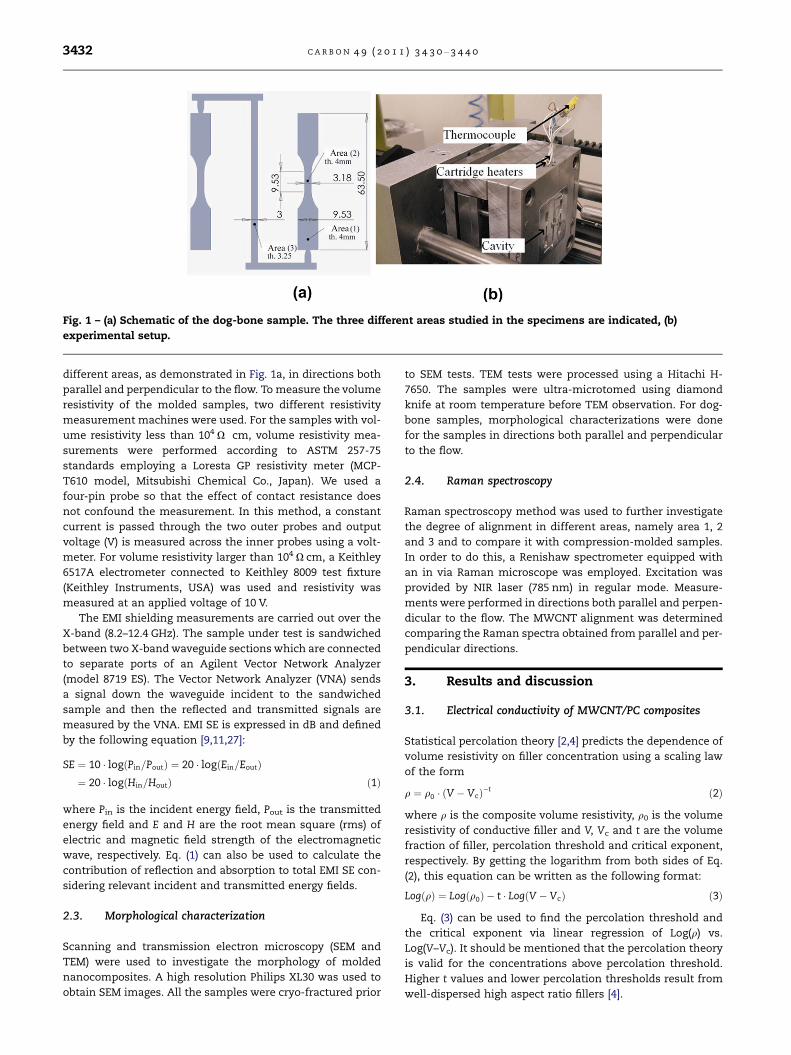
Fig. 1 – (a) Schematic of the dog-bone sample. The three different areas studied in the specimens are indicated, (b)
experimental setup.
3432 C A R B O N 4 9 ( 2 0 1 1 ) 3 4 3 0 – 3 4 4 0
different areas, as demonstrated in Fig. 1a, in directions both
parallel and perpendicular to the flow. To measure the volume
resistivity of the molded samples, two different resistivity
measurement machines were used. For the samples with vol-
ume resistivity less than 104 X Æ cm, volume resistivity mea-
surements were performed according to ASTM 257-75
standards employing a Loresta GP resistivity meter (MCP-
T610 model, Mitsubishi Chemical Co., Japan). We used a
four-pin probe so that the effect of contact resistance does
not confound the measurement. In this method, a constant
current is passed through the two outer probes and output
voltage (V) is measured across the inner probes using a volt-
meter. For volume resistivity larger than 104 X cm, a Keithley
6517A electrometer connected to Keithley 8009 test fixture
(Keithley Instruments, USA) was used and resistivity was
measured at an applied voltage of 10 V.
The EMI shielding measurements are carried out over the
X-band (8.2–12.4 GHz). The sample under test is sandwiched
between two X-band waveguide sections which are connected
to separate ports of an Agilent Vector Network Analyzer
(model 8719 ES). The Vector Network Analyzer (VNA) sends
a signal down the waveguide incident to the sandwiched
sample and then the reflected and transmitted signals are
measured by the VNA. EMI SE is expressed in dB and defined
by the following equation [9,11,27]:
SE ¼ 10 � logðPin=PoutÞ ¼ 20 � logðEin=EoutÞ¼ 20 � logðHin=HoutÞ ð1Þ
where Pin is the incident energy field, Pout is the transmitted
energy field and E and H are the root mean square (rms) of
electric and magnetic field strength of the electromagnetic
wave, respectively. Eq. (1) can also be used to calculate the
contribution of reflection and absorption to total EMI SE con-
sidering relevant incident and transmitted energy fields.
2.3. Morphological characterization
Scanning and transmission electron microscopy (SEM and
TEM) were used to investigate the morphology of molded
nanocomposites. A high resolution Philips XL30 was used to
obtain SEM images. All the samples were cryo-fractured prior
to SEM tests. TEM tests were processed using a Hitachi H-
7650. The samples were ultra-microtomed using diamond
knife at room temperature before TEM observation. For dog-
bone samples, morphological characterizations were done
for the samples in directions both parallel and perpendicular
to the flow.
2.4. Raman spectroscopy
Raman spectroscopy method was used to further investigate
the degree of alignment in different areas, namely area 1, 2
and 3 and to compare it with compression-molded samples.
In order to do this, a Renishaw spectrometer equipped with
an in via Raman microscope was employed. Excitation was
provided by NIR laser (785 nm) in regular mode. Measure-
ments were performed in directions both parallel and perpen-
dicular to the flow. The MWCNT alignment was determined
comparing the Raman spectra obtained from parallel and per-
pendicular directions.
3. Results and discussion
3.1. Electrical conductivity of MWCNT/PC composites
Statistical percolation theory [2,4] predicts the dependence of
volume resistivity on filler concentration using a scaling law
of the form
q ¼ q0 � ðV � VcÞ�t ð2Þ
where q is the composite volume resistivity, q0 is the volume
resistivity of conductive filler and V, Vc and t are the volume
fraction of filler, percolation threshold and critical exponent,
respectively. By getting the logarithm from both sides of Eq.
(2), this equation can be written as the following format:
LogðqÞ ¼ Logðq0Þ � t � LogðV � VcÞ ð3Þ
Eq. (3) can be used to find the percolation threshold and
the critical exponent via linear regression of Log(q) vs.
Log(V–Vc). It should be mentioned that the percolation theory
is valid for the concentrations above percolation threshold.
Higher t values and lower percolation thresholds result from
well-dispersed high aspect ratio fillers [4].
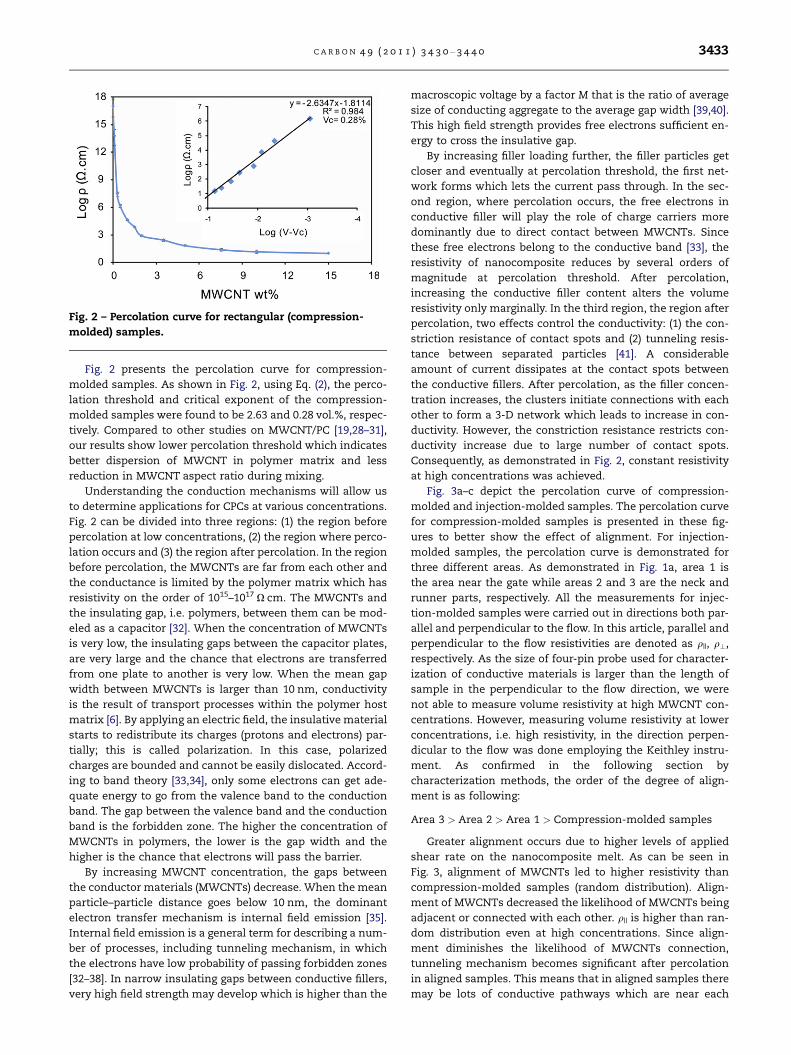
Fig. 2 – Percolation curve for rectangular (compression-
molded) samples.
C A R B O N 4 9 ( 2 0 1 1 ) 3 4 3 0 – 3 4 4 0 3433
Fig. 2 presents the percolation curve for compression-
molded samples. As shown in Fig. 2, using Eq. (2), the perco-
lation threshold and critical exponent of the compression-
molded samples were found to be 2.63 and 0.28 vol.%, respec-
tively. Compared to other studies on MWCNT/PC [19,28–31],
our results show lower percolation threshold which indicates
better dispersion of MWCNT in polymer matrix and less
reduction in MWCNT aspect ratio during mixing.
Understanding the conduction mechanisms will allow us
to determine applications for CPCs at various concentrations.
Fig. 2 can be divided into three regions: (1) the region before
percolation at low concentrations, (2) the region where perco-
lation occurs and (3) the region after percolation. In the region
before percolation, the MWCNTs are far from each other and
the conductance is limited by the polymer matrix which has
resistivity on the order of 1015–1017 X cm. The MWCNTs and
the insulating gap, i.e. polymers, between them can be mod-
eled as a capacitor [32]. When the concentration of MWCNTs
is very low, the insulating gaps between the capacitor plates,
are very large and the chance that electrons are transferred
from one plate to another is very low. When the mean gap
width between MWCNTs is larger than 10 nm, conductivity
is the result of transport processes within the polymer host
matrix [6]. By applying an electric field, the insulative material
starts to redistribute its charges (protons and electrons) par-
tially; this is called polarization. In this case, polarized
charges are bounded and cannot be easily dislocated. Accord-
ing to band theory [33,34], only some electrons can get ade-
quate energy to go from the valence band to the conduction
band. The gap between the valence band and the conduction
band is the forbidden zone. The higher the concentration of
MWCNTs in polymers, the lower is the gap width and the
higher is the chance that electrons will pass the barrier.
By increasing MWCNT concentration, the gaps between
the conductor materials (MWCNTs) decrease. When the mean
particle–particle distance goes below 10 nm, the dominant
electron transfer mechanism is internal field emission [35].
Internal field emission is a general term for describing a num-
ber of processes, including tunneling mechanism, in which
the electrons have low probability of passing forbidden zones
[32–38]. In narrow insulating gaps between conductive fillers,
very high field strength may develop which is higher than the
macroscopic voltage by a factor M that is the ratio of average
size of conducting aggregate to the average gap width [39,40].
This high field strength provides free electrons sufficient en-
ergy to cross the insulative gap.
By increasing filler loading further, the filler particles get
closer and eventually at percolation threshold, the first net-
work forms which lets the current pass through. In the sec-
ond region, where percolation occurs, the free electrons in
conductive filler will play the role of charge carriers more
dominantly due to direct contact between MWCNTs. Since
these free electrons belong to the conductive band [33], the
resistivity of nanocomposite reduces by several orders of
magnitude at percolation threshold. After percolation,
increasing the conductive filler content alters the volume
resistivity only marginally. In the third region, the region after
percolation, two effects control the conductivity: (1) the con-
striction resistance of contact spots and (2) tunneling resis-
tance between separated particles [41]. A considerable
amount of current dissipates at the contact spots between
the conductive fillers. After percolation, as the filler concen-
tration increases, the clusters initiate connections with each
other to form a 3-D network which leads to increase in con-
ductivity. However, the constriction resistance restricts con-
ductivity increase due to large number of contact spots.
Consequently, as demonstrated in Fig. 2, constant resistivity
at high concentrations was achieved.
Fig. 3a–c depict the percolation curve of compression-
molded and injection-molded samples. The percolation curve
for compression-molded samples is presented in these fig-
ures to better show the effect of alignment. For injection-
molded samples, the percolation curve is demonstrated for
three different areas. As demonstrated in Fig. 1a, area 1 is
the area near the gate while areas 2 and 3 are the neck and
runner parts, respectively. All the measurements for injec-
tion-molded samples were carried out in directions both par-
allel and perpendicular to the flow. In this article, parallel and
perpendicular to the flow resistivities are denoted as q||, q?,
respectively. As the size of four-pin probe used for character-
ization of conductive materials is larger than the length of
sample in the perpendicular to the flow direction, we were
not able to measure volume resistivity at high MWCNT con-
centrations. However, measuring volume resistivity at lower
concentrations, i.e. high resistivity, in the direction perpen-
dicular to the flow was done employing the Keithley instru-
ment. As confirmed in the following section by
characterization methods, the order of the degree of align-
ment is as following:
Area 3 > Area 2 > Area 1 > Compression-molded samples
Greater alignment occurs due to higher levels of applied
shear rate on the nanocomposite melt. As can be seen in
Fig. 3, alignment of MWCNTs led to higher resistivity than
compression-molded samples (random distribution). Align-
ment of MWCNTs decreased the likelihood of MWCNTs being
adjacent or connected with each other. q|| is higher than ran-
dom distribution even at high concentrations. Since align-
ment diminishes the likelihood of MWCNTs connection,
tunneling mechanism becomes significant after percolation
in aligned samples. This means that in aligned samples there
may be lots of conductive pathways which are near each
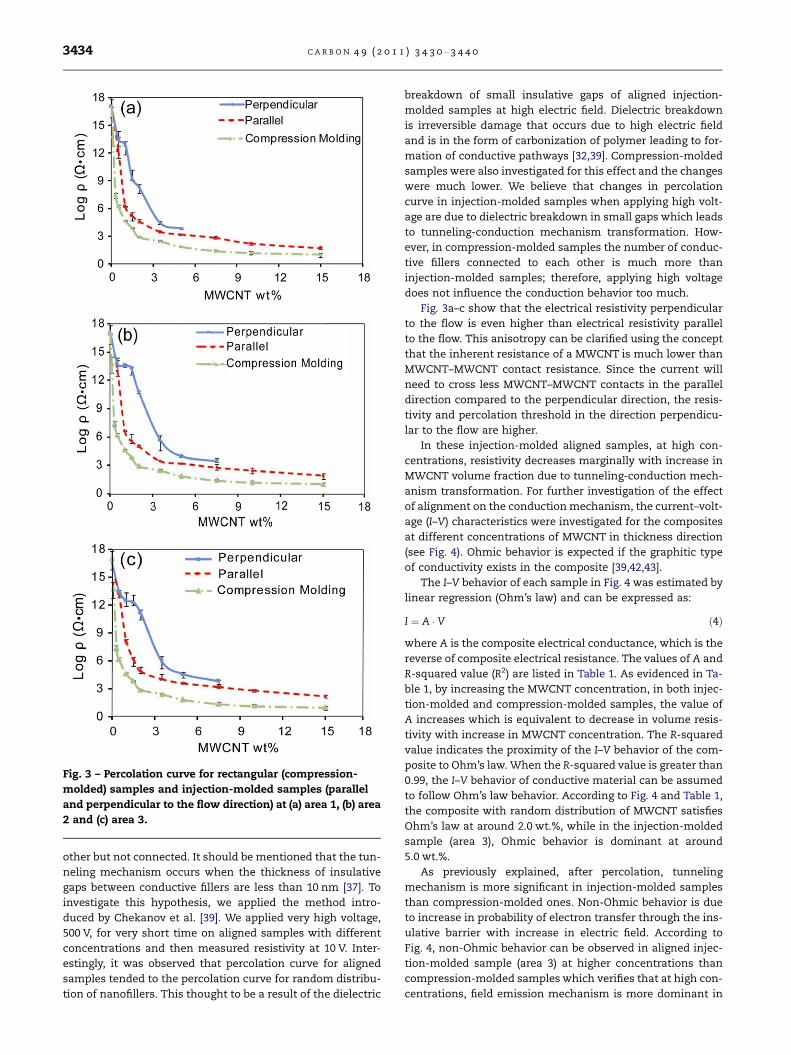
Fig. 3 – Percolation curve for rectangular (compression-
molded) samples and injection-molded samples (parallel
and perpendicular to the flow direction) at (a) area 1, (b) area
2 and (c) area 3.
3434 C A R B O N 4 9 ( 2 0 1 1 ) 3 4 3 0 – 3 4 4 0
other but not connected. It should be mentioned that the tun-
neling mechanism occurs when the thickness of insulative
gaps between conductive fillers are less than 10 nm [37]. To
investigate this hypothesis, we applied the method intro-
duced by Chekanov et al. [39]. We applied very high voltage,
500 V, for very short time on aligned samples with different
concentrations and then measured resistivity at 10 V. Inter-
estingly, it was observed that percolation curve for aligned
samples tended to the percolation curve for random distribu-
tion of nanofillers. This thought to be a result of the dielectric
breakdown of small insulative gaps of aligned injection-
molded samples at high electric field. Dielectric breakdown
is irreversible damage that occurs due to high electric field
and is in the form of carbonization of polymer leading to for-
mation of conductive pathways [32,39]. Compression-molded
samples were also investigated for this effect and the changes
were much lower. We believe that changes in percolation
curve in injection-molded samples when applying high volt-
age are due to dielectric breakdown in small gaps which leads
to tunneling-conduction mechanism transformation. How-
ever, in compression-molded samples the number of conduc-
tive fillers connected to each other is much more than
injection-molded samples; therefore, applying high voltage
does not influence the conduction behavior too much.
Fig. 3a–c show that the electrical resistivity perpendicular
to the flow is even higher than electrical resistivity parallel
to the flow. This anisotropy can be clarified using the concept
that the inherent resistance of a MWCNT is much lower than
MWCNT–MWCNT contact resistance. Since the current will
need to cross less MWCNT–MWCNT contacts in the parallel
direction compared to the perpendicular direction, the resis-
tivity and percolation threshold in the direction perpendicu-
lar to the flow are higher.
In these injection-molded aligned samples, at high con-
centrations, resistivity decreases marginally with increase in
MWCNT volume fraction due to tunneling-conduction mech-
anism transformation. For further investigation of the effect
of alignment on the conduction mechanism, the current–volt-
age (I–V) characteristics were investigated for the composites
at different concentrations of MWCNT in thickness direction
(see Fig. 4). Ohmic behavior is expected if the graphitic type
of conductivity exists in the composite [39,42,43].
The I–V behavior of each sample in Fig. 4 was estimated by
linear regression (Ohm’s law) and can be expressed as:
I ¼ A � V ð4Þ
where A is the composite electrical conductance, which is the
reverse of composite electrical resistance. The values of A and
R-squared value (R2) are listed in Table 1. As evidenced in Ta-
ble 1, by increasing the MWCNT concentration, in both injec-
tion-molded and compression-molded samples, the value of
A increases which is equivalent to decrease in volume resis-
tivity with increase in MWCNT concentration. The R-squared
value indicates the proximity of the I–V behavior of the com-
posite to Ohm’s law. When the R-squared value is greater than
0.99, the I–V behavior of conductive material can be assumed
to follow Ohm’s law behavior. According to Fig. 4 and Table 1,
the composite with random distribution of MWCNT satisfies
Ohm’s law at around 2.0 wt.%, while in the injection-molded
sample (area 3), Ohmic behavior is dominant at around
5.0 wt.%.
As previously explained, after percolation, tunneling
mechanism is more significant in injection-molded samples
than compression-molded ones. Non-Ohmic behavior is due
to increase in probability of electron transfer through the ins-
ulative barrier with increase in electric field. According to
Fig. 4, non-Ohmic behavior can be observed in aligned injec-
tion-molded sample (area 3) at higher concentrations than
compression-molded samples which verifies that at high con-
centrations, field emission mechanism is more dominant in
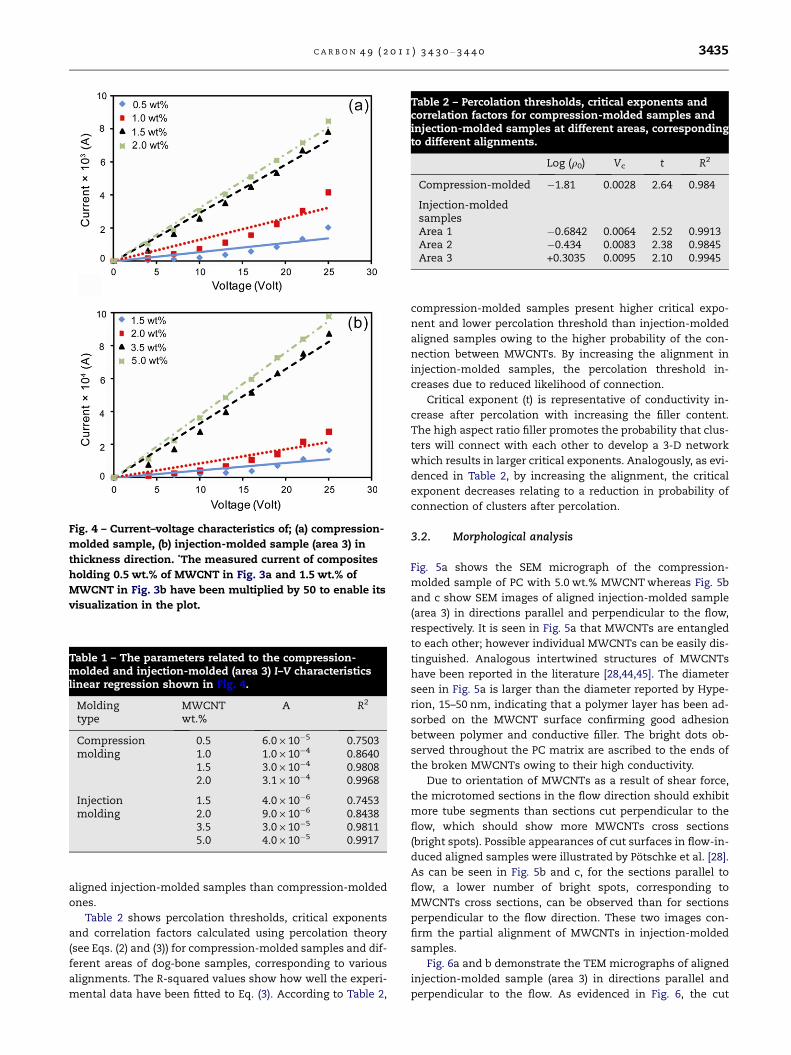
Table 2 – Percolation thresholds, critical exponents andcorrelation factors for compression-molded samples andinjection-molded samples at different areas, correspondingto different alignments.
Log (q0) Vc t R2
Compression-molded �1.81 0.0028 2.64 0.984
Injection-moldedsamplesArea 1 �0.6842 0.0064 2.52 0.9913Area 2 �0.434 0.0083 2.38 0.9845Area 3 +0.3035 0.0095 2.10 0.9945
Fig. 4 – Current–voltage characteristics of; (a) compression-
molded sample, (b) injection-molded sample (area 3) in
thickness direction. *The measured current of composites
holding 0.5 wt.% of MWCNT in Fig. 3a and 1.5 wt.% of
MWCNT in Fig. 3b have been multiplied by 50 to enable its
visualization in the plot.
Table 1 – The parameters related to the compression-molded and injection-molded (area 3) I–V characteristicslinear regression shown in Fig. 4.
Moldingtype
MWCNTwt.%
A R2
Compressionmolding
0.5 6.0 · 10�5 0.75031.0 1.0 · 10�4 0.86401.5 3.0 · 10�4 0.98082.0 3.1 · 10�4 0.9968
Injectionmolding
1.5 4.0 · 10�6 0.74532.0 9.0 · 10�6 0.84383.5 3.0 · 10�5 0.98115.0 4.0 · 10�5 0.9917
C A R B O N 4 9 ( 2 0 1 1 ) 3 4 3 0 – 3 4 4 0 3435
aligned injection-molded samples than compression-molded
ones.
Table 2 shows percolation thresholds, critical exponents
and correlation factors calculated using percolation theory
(see Eqs. (2) and (3)) for compression-molded samples and dif-
ferent areas of dog-bone samples, corresponding to various
alignments. The R-squared values show how well the experi-
mental data have been fitted to Eq. (3). According to Table 2,
compression-molded samples present higher critical expo-
nent and lower percolation threshold than injection-molded
aligned samples owing to the higher probability of the con-
nection between MWCNTs. By increasing the alignment in
injection-molded samples, the percolation threshold in-
creases due to reduced likelihood of connection.
Critical exponent (t) is representative of conductivity in-
crease after percolation with increasing the filler content.
The high aspect ratio filler promotes the probability that clus-
ters will connect with each other to develop a 3-D network
which results in larger critical exponents. Analogously, as evi-
denced in Table 2, by increasing the alignment, the critical
exponent decreases relating to a reduction in probability of
connection of clusters after percolation.
3.2. Morphological analysis
Fig. 5a shows the SEM micrograph of the compression-
molded sample of PC with 5.0 wt.% MWCNT whereas Fig. 5b
and c show SEM images of aligned injection-molded sample
(area 3) in directions parallel and perpendicular to the flow,
respectively. It is seen in Fig. 5a that MWCNTs are entangled
to each other; however individual MWCNTs can be easily dis-
tinguished. Analogous intertwined structures of MWCNTs
have been reported in the literature [28,44,45]. The diameter
seen in Fig. 5a is larger than the diameter reported by Hype-
rion, 15–50 nm, indicating that a polymer layer has been ad-
sorbed on the MWCNT surface confirming good adhesion
between polymer and conductive filler. The bright dots ob-
served throughout the PC matrix are ascribed to the ends of
the broken MWCNTs owing to their high conductivity.
Due to orientation of MWCNTs as a result of shear force,
the microtomed sections in the flow direction should exhibit
more tube segments than sections cut perpendicular to the
flow, which should show more MWCNTs cross sections
(bright spots). Possible appearances of cut surfaces in flow-in-
duced aligned samples were illustrated by Potschke et al. [28].
As can be seen in Fig. 5b and c, for the sections parallel to
flow, a lower number of bright spots, corresponding to
MWCNTs cross sections, can be observed than for sections
perpendicular to the flow direction. These two images con-
firm the partial alignment of MWCNTs in injection-molded
samples.
Fig. 6a and b demonstrate the TEM micrographs of aligned
injection-molded sample (area 3) in directions parallel and
perpendicular to the flow. As evidenced in Fig. 6, the cut
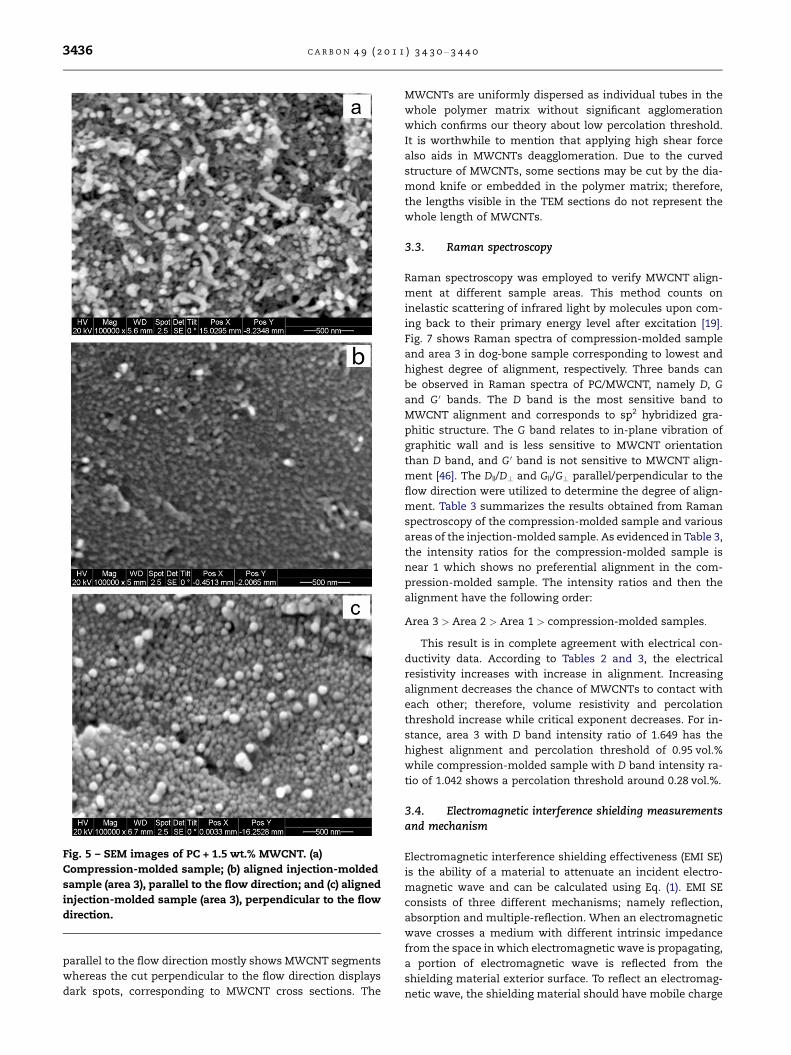
Fig. 5 – SEM images of PC + 1.5 wt.% MWCNT. (a)
Compression-molded sample; (b) aligned injection-molded
sample (area 3), parallel to the flow direction; and (c) aligned
injection-molded sample (area 3), perpendicular to the flow
direction.
3436 C A R B O N 4 9 ( 2 0 1 1 ) 3 4 3 0 – 3 4 4 0
parallel to the flow direction mostly shows MWCNT segments
whereas the cut perpendicular to the flow direction displays
dark spots, corresponding to MWCNT cross sections. The
MWCNTs are uniformly dispersed as individual tubes in the
whole polymer matrix without significant agglomeration
which confirms our theory about low percolation threshold.
It is worthwhile to mention that applying high shear force
also aids in MWCNTs deagglomeration. Due to the curved
structure of MWCNTs, some sections may be cut by the dia-
mond knife or embedded in the polymer matrix; therefore,
the lengths visible in the TEM sections do not represent the
whole length of MWCNTs.
3.3. Raman spectroscopy
Raman spectroscopy was employed to verify MWCNT align-
ment at different sample areas. This method counts on
inelastic scattering of infrared light by molecules upon com-
ing back to their primary energy level after excitation [19].
Fig. 7 shows Raman spectra of compression-molded sample
and area 3 in dog-bone sample corresponding to lowest and
highest degree of alignment, respectively. Three bands can
be observed in Raman spectra of PC/MWCNT, namely D, G
and G 0 bands. The D band is the most sensitive band to
MWCNT alignment and corresponds to sp2 hybridized gra-
phitic structure. The G band relates to in-plane vibration of
graphitic wall and is less sensitive to MWCNT orientation
than D band, and G 0 band is not sensitive to MWCNT align-
ment [46]. The D||/D? and G||/G? parallel/perpendicular to the
flow direction were utilized to determine the degree of align-
ment. Table 3 summarizes the results obtained from Raman
spectroscopy of the compression-molded sample and various
areas of the injection-molded sample. As evidenced in Table 3,
the intensity ratios for the compression-molded sample is
near 1 which shows no preferential alignment in the com-
pression-molded sample. The intensity ratios and then the
alignment have the following order:
Area 3 > Area 2 > Area 1 > compression-molded samples:
This result is in complete agreement with electrical con-
ductivity data. According to Tables 2 and 3, the electrical
resistivity increases with increase in alignment. Increasing
alignment decreases the chance of MWCNTs to contact with
each other; therefore, volume resistivity and percolation
threshold increase while critical exponent decreases. For in-
stance, area 3 with D band intensity ratio of 1.649 has the
highest alignment and percolation threshold of 0.95 vol.%
while compression-molded sample with D band intensity ra-
tio of 1.042 shows a percolation threshold around 0.28 vol.%.
3.4. Electromagnetic interference shielding measurementsand mechanism
Electromagnetic interference shielding effectiveness (EMI SE)
is the ability of a material to attenuate an incident electro-
magnetic wave and can be calculated using Eq. (1). EMI SE
consists of three different mechanisms; namely reflection,
absorption and multiple-reflection. When an electromagnetic
wave crosses a medium with different intrinsic impedance
from the space in which electromagnetic wave is propagating,
a portion of electromagnetic wave is reflected from the
shielding material exterior surface. To reflect an electromag-
netic wave, the shielding material should have mobile charge
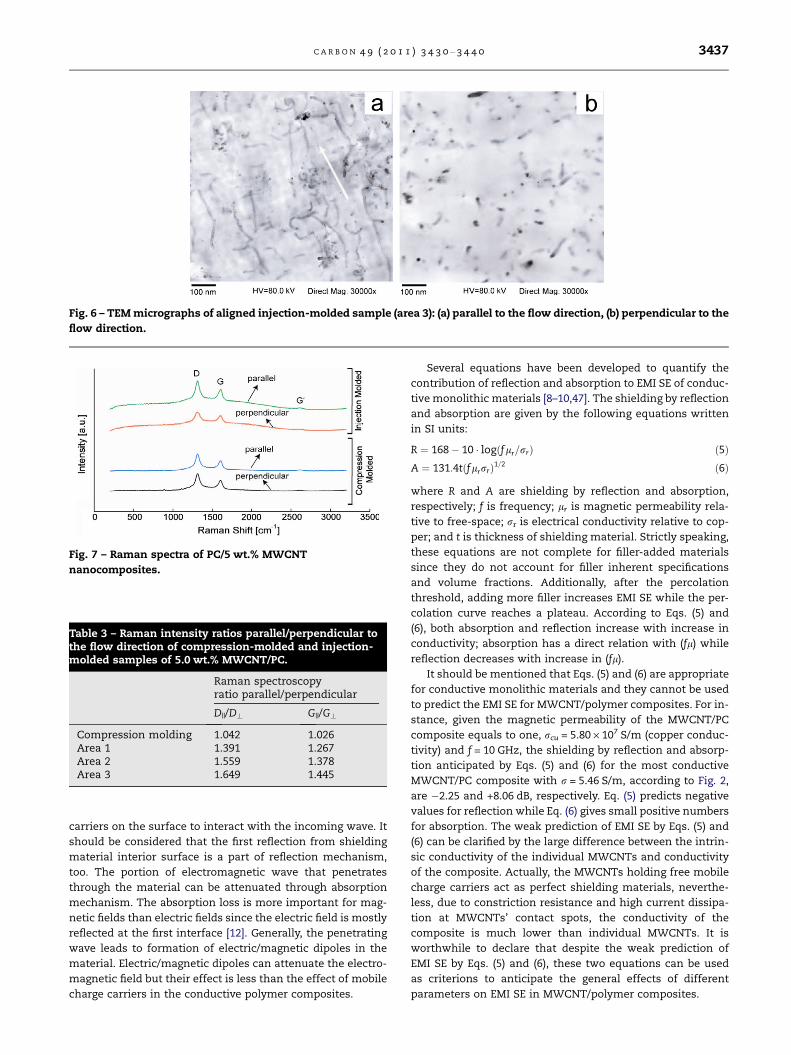
Fig. 6 – TEM micrographs of aligned injection-molded sample (area 3): (a) parallel to the flow direction, (b) perpendicular to the
flow direction.
Fig. 7 – Raman spectra of PC/5 wt.% MWCNT
nanocomposites.
Table 3 – Raman intensity ratios parallel/perpendicular tothe flow direction of compression-molded and injection-molded samples of 5.0 wt.% MWCNT/PC.
Raman spectroscopyratio parallel/perpendicular
D||/D? G||/G?
Compression molding 1.042 1.026Area 1 1.391 1.267Area 2 1.559 1.378Area 3 1.649 1.445
C A R B O N 4 9 ( 2 0 1 1 ) 3 4 3 0 – 3 4 4 0 3437
carriers on the surface to interact with the incoming wave. It
should be considered that the first reflection from shielding
material interior surface is a part of reflection mechanism,
too. The portion of electromagnetic wave that penetrates
through the material can be attenuated through absorption
mechanism. The absorption loss is more important for mag-
netic fields than electric fields since the electric field is mostly
reflected at the first interface [12]. Generally, the penetrating
wave leads to formation of electric/magnetic dipoles in the
material. Electric/magnetic dipoles can attenuate the electro-
magnetic field but their effect is less than the effect of mobile
charge carriers in the conductive polymer composites.
Several equations have been developed to quantify the
contribution of reflection and absorption to EMI SE of conduc-
tive monolithic materials [8–10,47]. The shielding by reflection
and absorption are given by the following equations written
in SI units:
R ¼ 168� 10 � logðflr=rrÞ ð5ÞA ¼ 131:4tðflrrrÞ1=2 ð6Þ
where R and A are shielding by reflection and absorption,
respectively; f is frequency; lr is magnetic permeability rela-
tive to free-space; rr is electrical conductivity relative to cop-
per; and t is thickness of shielding material. Strictly speaking,
these equations are not complete for filler-added materials
since they do not account for filler inherent specifications
and volume fractions. Additionally, after the percolation
threshold, adding more filler increases EMI SE while the per-
colation curve reaches a plateau. According to Eqs. (5) and
(6), both absorption and reflection increase with increase in
conductivity; absorption has a direct relation with (fl) while
reflection decreases with increase in (fl).
It should be mentioned that Eqs. (5) and (6) are appropriate
for conductive monolithic materials and they cannot be used
to predict the EMI SE for MWCNT/polymer composites. For in-
stance, given the magnetic permeability of the MWCNT/PC
composite equals to one, rcu = 5.80 · 107 S/m (copper conduc-
tivity) and f = 10 GHz, the shielding by reflection and absorp-
tion anticipated by Eqs. (5) and (6) for the most conductive
MWCNT/PC composite with r = 5.46 S/m, according to Fig. 2,
are �2.25 and +8.06 dB, respectively. Eq. (5) predicts negative
values for reflection while Eq. (6) gives small positive numbers
for absorption. The weak prediction of EMI SE by Eqs. (5) and
(6) can be clarified by the large difference between the intrin-
sic conductivity of the individual MWCNTs and conductivity
of the composite. Actually, the MWCNTs holding free mobile
charge carriers act as perfect shielding materials, neverthe-
less, due to constriction resistance and high current dissipa-
tion at MWCNTs’ contact spots, the conductivity of the
composite is much lower than individual MWCNTs. It is
worthwhile to declare that despite the weak prediction of
EMI SE by Eqs. (5) and (6), these two equations can be used
as criterions to anticipate the general effects of different
parameters on EMI SE in MWCNT/polymer composites.
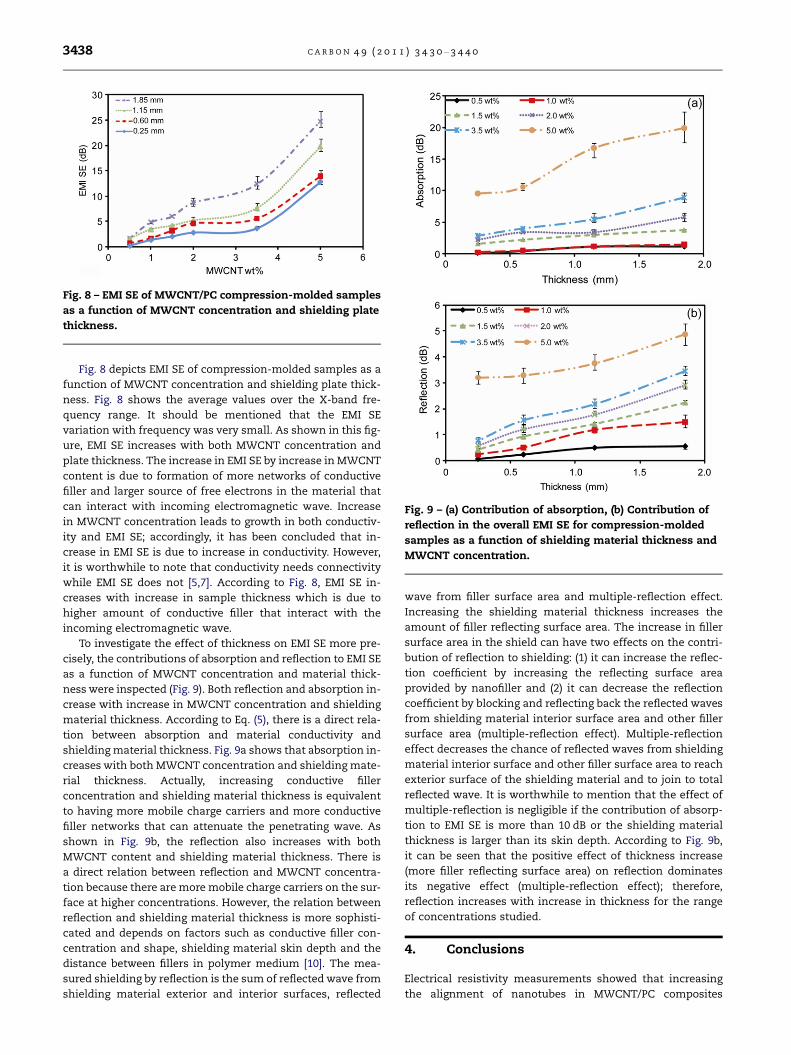
Fig. 8 – EMI SE of MWCNT/PC compression-molded samples
as a function of MWCNT concentration and shielding plate
thickness.
Fig. 9 – (a) Contribution of absorption, (b) Contribution of
reflection in the overall EMI SE for compression-molded
samples as a function of shielding material thickness and
MWCNT concentration.
3438 C A R B O N 4 9 ( 2 0 1 1 ) 3 4 3 0 – 3 4 4 0
Fig. 8 depicts EMI SE of compression-molded samples as a
function of MWCNT concentration and shielding plate thick-
ness. Fig. 8 shows the average values over the X-band fre-
quency range. It should be mentioned that the EMI SE
variation with frequency was very small. As shown in this fig-
ure, EMI SE increases with both MWCNT concentration and
plate thickness. The increase in EMI SE by increase in MWCNT
content is due to formation of more networks of conductive
filler and larger source of free electrons in the material that
can interact with incoming electromagnetic wave. Increase
in MWCNT concentration leads to growth in both conductiv-
ity and EMI SE; accordingly, it has been concluded that in-
crease in EMI SE is due to increase in conductivity. However,
it is worthwhile to note that conductivity needs connectivity
while EMI SE does not [5,7]. According to Fig. 8, EMI SE in-
creases with increase in sample thickness which is due to
higher amount of conductive filler that interact with the
incoming electromagnetic wave.
To investigate the effect of thickness on EMI SE more pre-
cisely, the contributions of absorption and reflection to EMI SE
as a function of MWCNT concentration and material thick-
ness were inspected (Fig. 9). Both reflection and absorption in-
crease with increase in MWCNT concentration and shielding
material thickness. According to Eq. (5), there is a direct rela-
tion between absorption and material conductivity and
shielding material thickness. Fig. 9a shows that absorption in-
creases with both MWCNT concentration and shielding mate-
rial thickness. Actually, increasing conductive filler
concentration and shielding material thickness is equivalent
to having more mobile charge carriers and more conductive
filler networks that can attenuate the penetrating wave. As
shown in Fig. 9b, the reflection also increases with both
MWCNT content and shielding material thickness. There is
a direct relation between reflection and MWCNT concentra-
tion because there are more mobile charge carriers on the sur-
face at higher concentrations. However, the relation between
reflection and shielding material thickness is more sophisti-
cated and depends on factors such as conductive filler con-
centration and shape, shielding material skin depth and the
distance between fillers in polymer medium [10]. The mea-
sured shielding by reflection is the sum of reflected wave from
shielding material exterior and interior surfaces, reflected
wave from filler surface area and multiple-reflection effect.
Increasing the shielding material thickness increases the
amount of filler reflecting surface area. The increase in filler
surface area in the shield can have two effects on the contri-
bution of reflection to shielding: (1) it can increase the reflec-
tion coefficient by increasing the reflecting surface area
provided by nanofiller and (2) it can decrease the reflection
coefficient by blocking and reflecting back the reflected waves
from shielding material interior surface area and other filler
surface area (multiple-reflection effect). Multiple-reflection
effect decreases the chance of reflected waves from shielding
material interior surface and other filler surface area to reach
exterior surface of the shielding material and to join to total
reflected wave. It is worthwhile to mention that the effect of
multiple-reflection is negligible if the contribution of absorp-
tion to EMI SE is more than 10 dB or the shielding material
thickness is larger than its skin depth. According to Fig. 9b,
it can be seen that the positive effect of thickness increase
(more filler reflecting surface area) on reflection dominates
its negative effect (multiple-reflection effect); therefore,
reflection increases with increase in thickness for the range
of concentrations studied.
4. Conclusions
Electrical resistivity measurements showed that increasing
the alignment of nanotubes in MWCNT/PC composites
C A R B O N 4 9 ( 2 0 1 1 ) 3 4 3 0 – 3 4 4 0 3439
significantly reduces the likelihood of contact between
MWCNTs. Accordingly, higher percolation thresholds and
lower critical exponents were achieved at greater MWCNT
alignments. At the same filler loading, higher electrical resis-
tivity was observed in the direction perpendicular to the flow
relative to the direction parallel to the flow at all areas of the
dog-bone samples. Verifying Ohm’s law after percolation
showed that the field emission mechanism is much more
dominant in injection-molded aligned samples than those
with random distribution of MWCNT. Characterization meth-
ods like SEM, TEM and Raman spectroscopy confirmed higher
orientation in areas with larger electrical resistivities.
For the samples with random distribution of MWCNT,
shielding by reflection and absorption increased with increase
in MWCNT concentration and shielding material thickness.
Increase in shielding by absorption through increasing
MWCNT concentration and shielding material thickness is
expected due to greater conductive filler content and higher
conductivity. However, increase in shielding effectiveness by
reflection with increasing thickness indicates that the posi-
tive effect of thickness increase (more filler reflecting surface
area) on shielding by reflection is dominant over its negative
influence (multiple-reflection) for the range of concentrations
studied.
Acknowledgements
The authors thank the Natural Sciences and Engineering Re-
search Council of Canada (NSERC) for funding for the project.
We would like to thank Dr. Samaneh Abbasi of Ecole Polytech-
nique (Montreal, Canada) for assistance with Raman spec-
troscopy. The authors would like to acknowledge Mr.
Thomas Apperley for EMI shielding measurement and Mr.
Wei Xiang Dong and Dr. Tobias Furstenhaupt for preparation
of TEM specimens by ultramicrotoming. The authors would
also thank Dr. Michael Schoel for assistance with SEM
imaging.
R E F E R E N C E S
[1] Thostenson ET, Ren Z, Chou TW. Advances in science andtechnology of carbon nanotubes and their composites: areview. Compos Sci Technol 2001;61(13):1899–912.
[2] Bauhofer W, Kovacs JZ. A review and analysis of electricalpercolation in carbon nanotube polymer composites.Compos Sci Technol 2009;69(10):1486–98.
[3] Spitalski Z, Tasis D, Papagelis K, Galiotis C. Carbon nanotube-polymer composites: chemistry, processing, mechanical andelectrical properties. Prog Polym Sci 2009;35(3):357–401.
[4] Weber M, Kamal MR. Estimation of volume resistivity ofelectrically conductive composites. Polym Compos1997;18(6):711–25.
[5] Al-Saleh MH, Sundararaj U. Electromagnetic interference(EMI) shielding effectiveness of PP/PS polymer blendscontaining high structure carbon black. Macromol Mater Eng2008;293(7):621–30.
[6] Yang SY, Lozano K, Lomeli A, Foltz HD, Jones R.Electromagnetic interference shielding effectiveness ofcarbon nanofiber/LCP composites. Compos Part A
2005;36(5):691–7.[7] Strumpler R, Glatz-Reichenbach J. Conducting polymercomposites. J Electroceram 1999;3(4):329–46.
[8] Chung DDL. Materials for electromagnetic interferenceshielding. JMEPEG 2000;9(3):350–2.
[9] Huang JC. EMI shielding plastics – A review. Adv PolymTechnol 1995;14(2):137–50.
[10] Al-Saleh MH, Sundararaj U. Electromagnetic interferenceshielding mechanisms of CNT/polymer composites. Carbon2009;47(7):1738–46.
[11] Colaneri NF, Shacklette LW. EMI shielding measurements ofconductive polymer blends. IEEE Trans Instrum Meas1992;41(2):291–7.
[12] Kaiser KL. Electromagnetic shielding. Boca Raton, FL: CRCPress; 2006. p. 1–52.
[13] Schulz RB, Plantz VC, Brush DR. Shielding theory andpractice. Electromagnetic compatibility. IEEE Trans1998;30(3):187–201.
[14] Sadchikov VV, Prudnikova ZG. Amorphous materials inelectromagnetic shields. Stal’. 4, 1997. p. 66–69.
[15] Bright PF, Crownson RJ, Folkes MJ. Study of effect of injectionspeed on fiber orientation in simple moldings of short glassfiber-filled polypropylene. J Mater Sci 1978;13(11):2497–506.
[16] Huang Y, Li N, Ma YF. The influence of single-walled carbonnanotube structure on the electromagnetic interferenceshielding efficiency of its epoxy composites. Carbon2007;45(8):1614–21.
[17] Tolokan RP, Nablo JC. EMI shielding via stainless-steel fibers.Plast Eng 1985;41(8):31–4.
[18] Jou WS, Wu TL, Chiu SK, Cheng WH. The influence of fiberorientation on electromagnetic shielding in liquid-crystalpolymers. J Electron Mater 2002;31(3):178–84.
[19] Abbasi S, Carreau PJ, Derdouri A. Flow induced orientation ofmulti-walled carbon nanotubes in polycarbonatenanocomposites: rheology, conductivity and mechanicalproperties. Polymer 2010;51(4):922–35.
[20] Jou WS, Cheng HZ, Hsu CF, editors. The electromagneticshielding effectiveness of carbon nanotubes polymercomposites. Special issue. J Alloys Compd 2007; 434: 641–45.
[21] Haggenmueller R, Gommans HH, Rinzler AG, Fischer JE,Winey KI. Aligned single-wall carbon nanotubes incomposites by melt processing method. Chem Phys Lett2009;330(3–4):219–25.
[22] Shi D, He P, Lian J, Chaud X, Budko SL, Beaugnon E, et al.Magnetic alignment of carbon nanofibers in polymercomposites and anisotropy of mechanical properties. J ApplPhys 2005;97(6):064312-1–5.
[23] Du F, Fischer JE, Winey KI. Effect of nanotube alignment onpercolation conductivity in carbon nanotube/polymercomposites. Phys Rev B 2005;72(12):121404-1–4.
[24] Xie XL, Mai YW, Zhou XP. Dispersion and alignment of carbonnanotubes in polymer matrix: a review. Mater Sci Eng2005;49(4):89–112.
[25] Jin L, Bower C, Zhou O. Alignment of carbon nanotubes inpolymer matrix by mechanical stretching. Appl Phys Lett1998;73(9):1197–9.
[26] Behnam A, Guo J, Ural A. Effects of nanotube alignment andmeasurements direction on percolation in single-wall carbonnanotube films. J Appl Phys 2007;102(4):1–7.
[27] Li N, Huang Y, Du F, He X, Lin X, Gao H, et al. Electromagneticinterference (EMI) shielding of single-walled carbonnanotube epoxy composites. Nano Lett 2006;6(6):1141–5.
[28] Potschke P, Bhattacharyya AR, Janke A. Melt mixing ofpolycarbonate with multi-walled carbon nanotubes:microscopic studies on the state of dispersion. Eur Polym J2004;40(1):137–48.
[29] Chen L, Pang XJ, Yu ZL. Study on polycarbonate/multi-walledcarbon nanotubes composite produced by melt processing.Mater Sci Eng A 2007;457(1–2):287–91.
3440 C A R B O N 4 9 ( 2 0 1 1 ) 3 4 3 0 – 3 4 4 0
[30] Potschke P, Fornes TD, Paul DR. Rheological behavior ofmulti-walled carbon nanotube/polycarbonate composites.Polymer 2002;43(11):3247–55.
[31] Potschke P, Abdel-Goad M, Alig I, Dudkin S, Lellinger D.Rheological and dielectrical characterization of melt-mixedpolycarbonate-multi-walled carbon nanotube composites.Polymer 2004;45(26):8863–70.
[32] Blythe T, Bloor D. Electrical properties of polymers. 2nded. New York: Cambridge University Press; 2005.
[33] Blythe AR. Electrical properties of polymers. 1st ed. London:Cambridge University Press; 1979. p. 90–104.
[34] Raju GG. Dielectrics in electric field. Headquarters, NewYork: Marcel Dekker, Inc.; 2003.
[35] Beek V, Pul V. Non-ohmic behavior of carbon black-loadedrubbers. Carbon 1964;2(2):121–6.
[36] Beek V. Internal field emission in carbon black-loaded naturalrubber vulcanizates. J Appl Polym Sci 1962;6(24):651–5.
[37] Balberg I. Tunneling and nonuniversal conductivity incomposite materials. Phys Rev Lett 1987;59(12):1305–8.
[38] Sheng P. Fluctuation-induced tunneling conduction indisordered materials. Phys Rev B 1980;21(6):2180–95.
[39] Chekanov Y, Ohnogi R, Asai S, Sumita M. Electrical propertiesof epoxy resin filled with carbon fibers. J Mater Sci1999;34(22):5589–92.
[40] Sichel EK, Gittleman JI, Sheng P. Transport properties of thecomposite-material carbon-poly(vinyl chloride). Phys Rev B1978;18(10):5712–6.
[41] Ruschau GR, Yoshikawa S, Newnham RE. Resistivities ofconductive composites. J Appl Phys 1992;72(3):953–9.
[42] Al-Saleh MH. Nanostructured conductive polymericmaterials, Ph.D. thesis. Edmonton, AB, Canada: University ofAlberta; 2008.
[43] Medalia AL. Electrical-conduction in carbon-blackcomposites. Rubb Chem Technol 1986;59(3):432–54.
[44] Potschke P, Bhattacharyya AR, Janke A. Carbon nanotube-filledpolycarbonate composites produced by melt mixing and theiruse in blends with polyethylene. Carbon 2004;42(5–6):965–9.
[45] Shaffer MSP, Windle AH. Fabrication and characterization ofcarbon nanotube poly(vinyl alcohol) composites. Adv Mater1999;11(11):937–41.
[46] Bulusheva LG, Okotrub AV, Kinloch IA, Asanov IP, KurenyaAG, Kudasgov AG, et al. Effect of nitrogen doping on Ramanspectra of multi-walled carbon nanotubes. Phys Status Solidi(B) 2008;245(10):1971–4.
[47] Liu Z, Bai G, Huang Y, Ma Y, Du F, Li F, et al. Reflection andabsorption contributions to the electromagnetic interferenceshielding of single-walled carbon nanotube/polyurethanecomposites. Carbon 2007;45(4):821–7.
Related Documents