The Tensile Behavior of Polycarbonate and Polycarbonate-Glass Bead Composites M. E. J. DEKKERS and D. HEIKENS, Eindhouen University of Technology, Laboratory of Polymer Technology, P.O. Box 513, 5600 MB Eindhouen, The Netherlands Synopsis The tensile behavior at 2oOC of unfilled polycarbonate and polycarbonate-glass bead com- posites (90/10 ~01%) has been investigated by tensile testing with simultaneous volume change measurements. Both the effect of the bead size and the degree of interfacial adhesion on the tensile behavior of the composites has been studied. A simple model has been applied to obtain quantitative information on the separate contributions of several possible deformation mech- anisms to the total deformation. For unfilled polycarbonate and the polycarbonate-glass bead composites with excellent interfacial adhesion, shear deformation is found to be the only significant non-Hookean deformation mechanism. By means of strain recovery experiments it is shown that the shear deformation is highly elastic in character. For the composites with poor interfacial adhesion, besides shear deformation also dewetting cavitation contributes to the non-Hookean deformation. The differences in tensile behavior between the composites with excellent and poor interfacial adhesion are explained by the different mechanisms for shear band formation at excellently and poorly adhering glass beads. INTRODUCTION When a glass bead-filled polycarbonate (PC) sample is subjected to un- iaxial tension, shear bands form at the stress concentrating glass beads. In a recent study' this shear band formation has been investigated by micro- scopic in situ observation in the course of a tensile test. It was found that the degree of interfacial adhesion between the glass beads (diameter about 30 pm) and the PC matrix has a profound effect on the mechanism for shear band formation. At an excellently adhering glass bead the shear bands form near the surface of the bead at an angle of 45" from the poles defined by the symmetry axis of the stressed sphere. These are regions of maximum principal shear stress and of maximum distortion strain energy density. At a poorly adhering glass bead, shear band formation is preceded by dewetting along the interface between bead and matrix. At dewetting a pair of small cap-shaped cavities is formed at the poles of the bead. As the tensile test proceeds, the edges of these cavities shift into the direction of the equator until, at an angle of about 60" from the pole, shear bands originate at the edges of the cavities. This feature is clearly illustrated by Figure 1 where the shadows at the poles of the beads indicate that cap-shaped cavities are formed. Neither in the case of poor adhesion nor in the case of excellent adhesion was craze formation at the glass beads observed. In the present work the effect of interfacial adhesion, and thus of the mechanism for shear band formation, on the macroscopic tensile behavior of PGglass bead composites (90/10 vol %) is studied. This is done for two Journal of Applied Polymer Science, Vol. 30,2389-2400 (1985) 0 1985 John Wiley & Sons, Inc. CCC 0021-8995/85/062389-12$04.00

Welcome message from author
This document is posted to help you gain knowledge. Please leave a comment to let me know what you think about it! Share it to your friends and learn new things together.
Transcript
The Tensile Behavior of Polycarbonate and Polycarbonate-Glass Bead Composites
M. E. J. DEKKERS and D. HEIKENS, Eindhouen University of Technology, Laboratory of Polymer Technology, P.O. Box 513, 5600 MB
Eindhouen, The Netherlands
Synopsis
The tensile behavior at 2oOC of unfilled polycarbonate and polycarbonate-glass bead com- posites (90/10 ~ 0 1 % ) has been investigated by tensile testing with simultaneous volume change measurements. Both the effect of the bead size and the degree of interfacial adhesion on the tensile behavior of the composites has been studied. A simple model has been applied to obtain quantitative information on the separate contributions of several possible deformation mech- anisms to the total deformation. For unfilled polycarbonate and the polycarbonate-glass bead composites with excellent interfacial adhesion, shear deformation is found to be the only significant non-Hookean deformation mechanism. By means of strain recovery experiments it is shown that the shear deformation is highly elastic in character. For the composites with poor interfacial adhesion, besides shear deformation also dewetting cavitation contributes to the non-Hookean deformation. The differences in tensile behavior between the composites with excellent and poor interfacial adhesion are explained by the different mechanisms for shear band formation at excellently and poorly adhering glass beads.
INTRODUCTION
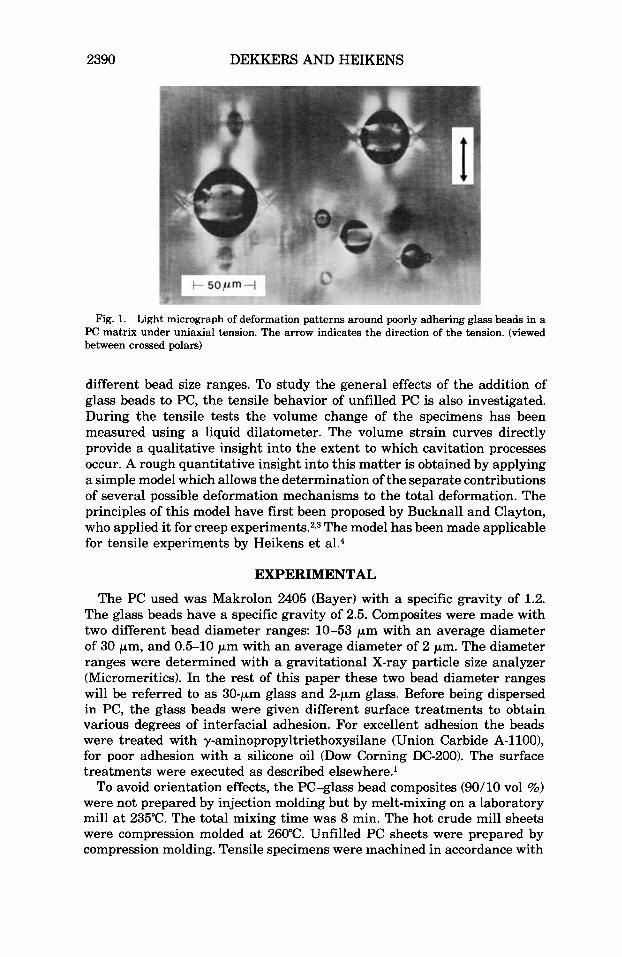
When a glass bead-filled polycarbonate (PC) sample is subjected to un- iaxial tension, shear bands form at the stress concentrating glass beads. In a recent study' this shear band formation has been investigated by micro- scopic in situ observation in the course of a tensile test. It was found that the degree of interfacial adhesion between the glass beads (diameter about 30 pm) and the PC matrix has a profound effect on the mechanism for shear band formation. At an excellently adhering glass bead the shear bands form near the surface of the bead at an angle of 45" from the poles defined by the symmetry axis of the stressed sphere. These are regions of maximum principal shear stress and of maximum distortion strain energy density. At a poorly adhering glass bead, shear band formation is preceded by dewetting along the interface between bead and matrix. At dewetting a pair of small cap-shaped cavities is formed at the poles of the bead. As the tensile test proceeds, the edges of these cavities shift into the direction of the equator until, at an angle of about 60" from the pole, shear bands originate at the edges of the cavities. This feature is clearly illustrated by Figure 1 where the shadows at the poles of the beads indicate that cap-shaped cavities are formed. Neither in the case of poor adhesion nor in the case of excellent adhesion was craze formation at the glass beads observed.
In the present work the effect of interfacial adhesion, and thus of the mechanism for shear band formation, on the macroscopic tensile behavior of PGglass bead composites (90/10 vol %) is studied. This is done for two
Journal of Applied Polymer Science, Vol. 30, 2389-2400 (1985) 0 1985 John Wiley & Sons, Inc. CCC 0021-8995/85/062389-12$04.00
2390 DEKKERS AND HEIKENS
Fig. 1. Light micrograph of deformation patterns around poorly adhering glass beads in a PC matrix under uniaxial tension. The arrow indicates the direction of the tension. (viewed between crossed polars)
different bead size ranges. To study the general effects of the addition of glass beads to PC, the tensile behavior of unfilled PC is also investigated. During the tensile tests the volume change of the specimens has been measured using a liquid dilatometer. The volume strain curves directly provide a qualitative insight into the extent to which cavitation processes occur. A rough quantitative insight into this matter is obtained by applying a simple model which allows the determination of the separate contributions of several possible deformation mechanisms to the total deformation. The principles of this model have first been proposed by Bucknall and Clayton, who applied it for creep experiment^.^.^ The model has been made applicable for tensile experiments by Heikens et al.4
EXPERIMENTAL
The PC used was Makrolon 2405 (Bayer) with a specific gravity of 1.2. The glass beads have a specific gravity of 2.5. Composites were made with two different bead diameter ranges: 10-53 pm with an average diameter of 30 pm, and 0.5-10 pm with an average diameter of 2 pm. The diameter ranges were determined with a gravitational X-ray particle size analyzer (Micromeritics). In the rest of this paper these two bead diameter ranges will be referred to as 30-pm glass and 2-pm glass. Before being dispersed in PC, the glass beads were given different surface treatments to obtain various degrees of interfacial adhesion. For excellent adhesion the beads were treated with y-aminopropyltriethoxysilane (Union Carbide A-1100), for poor adhesion with a silicone oil (Dow Corning DC-200). The surface treatments were executed as described e1sewhere.l
To avoid orientation effects, the PC-glass bead composites (90/10 vol %) were not prepared by injection molding but by melt-mixing on a laboratory mill at 235°C. The total mixing time was 8 min. The hot crude mill sheets were compression molded at 260°C. Unfilled PC sheets were prepared by compression molding. Tensile specimens were machined in accordance with
PC-GLASS BEAD COMPOSITES 2391
ASTM D 638 I11 from the compression-molded sheets. To reduce thermal stresses, the specimens were annealed at 80°C for 24 h. Then conditioned at 20°C and 55% relative humidity for at least 48 h before testing.
The tensile tests were performed on an Instron tensile tester at 20°C. The strain rate was 0.04 min-'. A liquid dilatometer system, mounted on the crosshead of the tensile tester, was used to measure the volume change of the specimens. A detailed description of this dilatometer can be found else- where.5
RESULTS
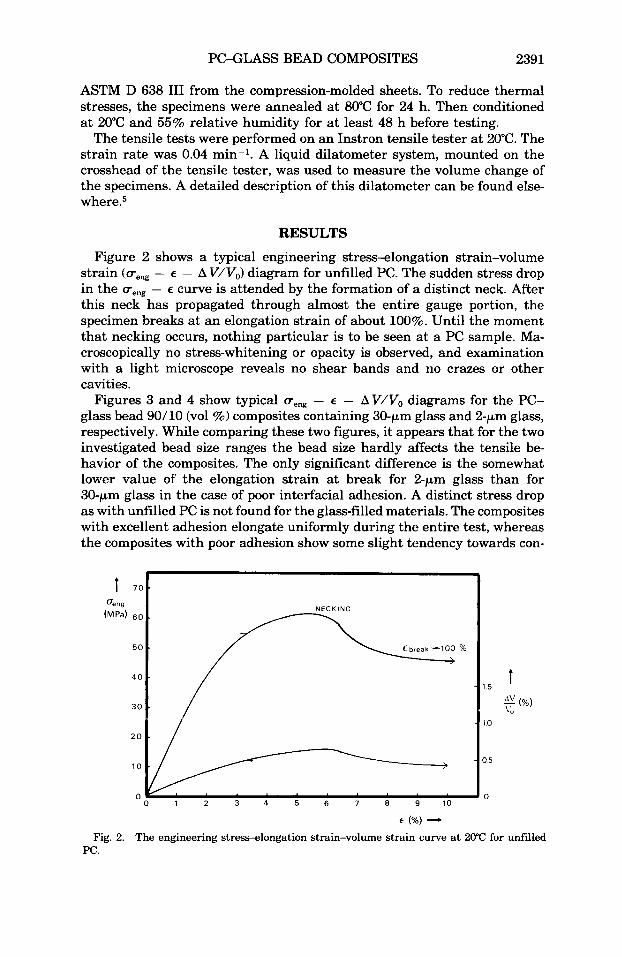
Figure 2 shows a typical engineering stress-elongation strain-volume strain (ueng - E - A V/Vo) diagram for unfilled PC. The sudden stress drop in the ueng - E curve is attended by the formation of a distinct neck. After this neck has propagated through almost the entire gauge portion, the specimen breaks at an elongation strain of about 100%. Until the moment that necking occurs, nothing particular is to be seen at a PC sample. Ma- croscopically no stress-whitening or opacity is observed, and examination with a light microscope reveals no shear bands and no crazes or other cavities.
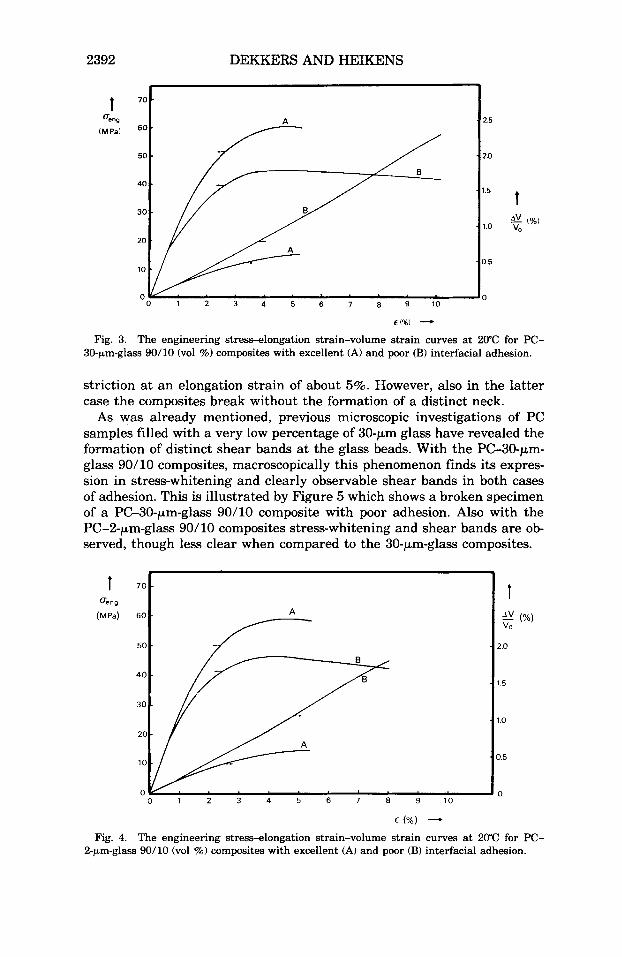
Figures 3 and 4 show typical ueng - E - AV/Vo diagrams for the PC- glass bead 90/10 (vol %) composites containing 30-pm glass and 2-pm glass, respectively. While comparing these two figures, it appears that for the two investigated bead size ranges the bead size hardly affects the tensile be- havior of the composites. The only significant difference is the somewhat lower value of the elongation strain at break for 2-pm glass than for 30-pm glass in the case of poor interfacial adhesion. A distinct stress drop as with unfilled PC is not found for the glass-filled materials. The composites with excellent adhesion elongate uniformly during the entire test, whereas the composites with poor adhesion show some slight tendency towards con-
t PA) - Fig. 2. The engineering stress-elongation strain-volume strain curve at 20°C for unfilled
PC.
2392 DEKKERS AND HEIKENS
t %",
(MPal
t 1x1
VO
€(%I -+
Fig. 3. The engineering stress-elongation strain-volume strain curves at 20°C for PC- 30-ym-glass 90/10 (vol %) composites with excellent (A) and poor (B) interfacial adhesion.
striction at an elongation strain of about 5%. However, also in the latter case the composites break without the formation of a distinct neck.
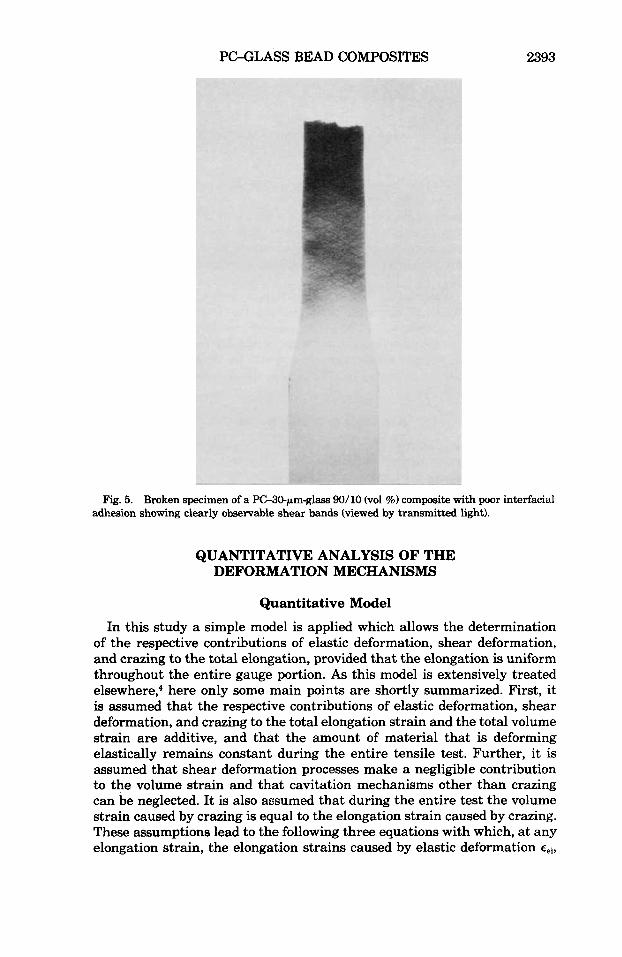
As was already mentioned, previous microscopic investigations of PC samples filled with a very low percentage of 30-pm glass have revealed the formation of distinct shear bands at the glass beads. With the PC-30-pm- glass 90/ 10 composites, macroscopically this phenomenon finds its expres- sion in stress-whitening and clearly observable shear bands in both cases of adhesion. This is illustrated by Figure 5 which shows a broken specimen of a PC-30-pm-glass 90/10 composite with poor adhesion. Also with the PC-2-pm-glass 90/10 composites stress-whitening and shear bands are ob- served, though less clear when compared to the 30-pm-glass composites.
€ Ph) - Fig. 4. The engineering stress-elongation strain-volume strain curves at 20°C for PC-
2-pm-glass 90/10 (vol %) composites with excellent (A) and poor (B) interfacial adhesion.
PGGLASS BEAD COMPOSITES 2393
Fig. 5. Broken specimen of a PWO-pm-glass 90/10 ( ~ 0 1 % ) composite with poor interfacial adhesion showing clearly observable shear bands (viewed by transmitted light).
QUANTITATIVE ANALYSIS OF THE DEFORMATION MECHANISMS
Quantitative Model
In this study a simple model is applied which allows the determination of the respective contributions of elastic deformation, shear deformation, and crazing to the total elongation, provided that the elongation is uniform throughout the entire gauge portion. As this model is extensively treated el~ewhere,~ here only some main points are shortly summarized. First, it is assumed that the respective contributions of elastic deformation, shear deformation, and crazing to the total elongation strain and the total volume strain are additive, and that the amount of material that is deforming elastically remains constant during the entire tensile test. Further, it is assumed that shear deformation processes make a negligible contribution to the volume strain and that cavitation mechanisms other than crazing can be neglected. It is also assumed that during the entire test the volume strain caused by crazing is equal to the elongation strain caused by crazing. These assumptions lead to the following three equations with which, at any elongation strain, the elongation strains caused by elastic deformation eel,
2394 DEKKERS AND HEIKENS
shear deformation E,h, and crazing E,, can be calculated from the ueng - E - AV/Vo diagram:
where u is the true stress, E is the Young’s modulus, and v is the Poisson’s ratio. E and v are calculated from the initial slopes of the veng - E and AV/Vo - E curves, respectively. The true stress can be calculated because the change in the cross-sectional area of the specimen is known at every elongation strain.
It is important to realize that this model is a simple one based on a considerable number of assumptions. Especially the assumption that the amount of material deforming elastically remains constant during the en- tire tensile test is not completely exact since, when crazing or shear defor- mation takes place, this amount must decrease. In the next section the consequences of this assumption on the results of the quantitative analysis will be considered.
Application of the Model
One of the assumptions of the model is that cavitation mechanisms other than crazing can be neglected. This makes the model inapplicable for the PC-glass composites with poor interfacial adhesion because in that case cap-shaped cavities are formed as a result of dewetting. Another condition for application of the model is that the specimen elongates uniformly throughout the entire gauge portion. Therefore, for unfilled PC the model may only be applied up to an elongation strain of about 5.5% because after that, neck formation occurs.
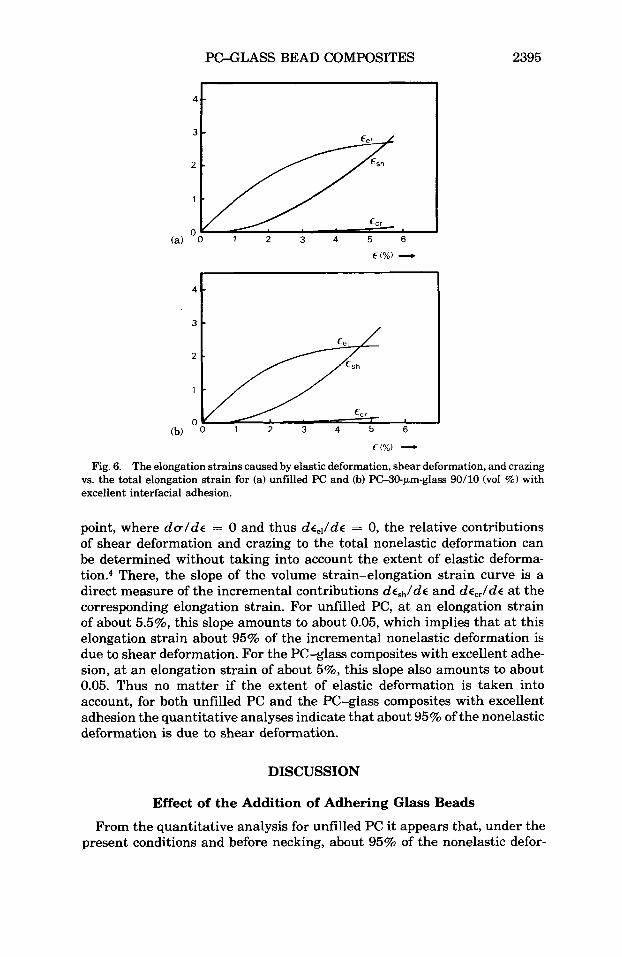
Figures 6(a) and 6(b) show for unfilled PC and the PC-30-pm-glass com- posite with excellent adhesion the elongation strains caused by the various deformation mechanisms as a function of the total elongation strain as calculated with eqs. (1)-(3). Calculations for the PC-2-pm-glass composite with excellent adhesion give the same results as for the 30-pm-glass com- posite. From these figures it appears that for both unfilled PC and the PC- glass composites with excellent adhesion shear deformation is by far the dominant “nonelastic” (non-Hookean) deformation mechanism. For both cases the ratio E , , , / ( E ~ , , + E,,) amounts to about 0.95, which implies that about 95% of the nonelastic deformation is due to shear deformation. It must be realized that the calculated curves shown in Figure 6 are based upon the assumption that the amount of material deforming elastically remains con- stant during the entire tensile test while, in practice, this amount must decrease as the tensile test proceeds. Therefore, at high strains the splitting up of the elastic and nonelastic deformation as shown in Figure 6 becomes uncertain. This assumption, however, has no significant effect on the cal- culated relative contributions of shear deformation and crazing to the total nonelastic deformation as appears from the following analyses. At the yield
PC-GLASS BEAD COMPOSITES 2395
3 -
2 -
2 3 4 5 6
~~
4 -
3 -
2 -
2 3 4 5 6
t (%) - Fig. 6. The elongation strains caused by elastic deformation, shear deformation, and crazing
vs. the total elongation strain for (a) unfilled PC and (b) PC-SO-pm-glass 90/10 (vol %) with excellent interfacial adhesion.
point, where dulde = 0 and thus dce,/de = 0, the relative contributions of shear deformation and crazing to the total nonelastic deformation can be determined without taking into account the extent of elastic deforma- t i ~ n . ~ There, the slope of the volume strain-elongation strain curve is a direct measure of the incremental contributions dEShlde and de,,lde at the corresponding elongation strain. For unfilled PC, at an elongation strain of about 5.5%, this slope amounts to about 0.05, which implies that at this elongation strain about 95% of the incremental nonelastic deformation is due to shear deformation. For the PC-glass composites with excellent adhe- sion, at an elongation strain of about 5%, this slope also amounts to about, 0.05. Thus no matter if the extent of elastic deformation is taken into account, for both unfilled PC and the PC-glass composites with excellent adhesion the quantitative analyses indicate that about 95% of the nonelastic deformation is due to shear deformation.
DISCUSSION
Effect of the Addition of Adhering Glass Beads
From the quantitative analysis for unfilled PC it appears that, under the present conditions and before necking, about 95% of the nonelastic defor-
2396 DEKKERS AND HEIKENS
mation is due to shear deformation. Taking into account the experimental accuracy and the simplicity of the applied model, it can thus be concluded that cavitation and particularly crazing hardly occur and that the volume strain is mainly caused by elastic deformation. This conclusion is supported by light microscopic investigation which reveals no crazes or other cavities before necking. Because light microscopic investigation neither reveals dis- tinct shear bands and macroscopically no stress-whitening or opacity is observed, unfilled PC may be said to deform by “diffuse shearing”: the shear processes are not clearly localized but take place throughout the whole stressed region.
The quantitative analyses for the PC-glass composites with excellent interfacial adhesion give the same results as for unfilled PC. This indicates that the addition of adhering glass beads to PC does not affect the extent to which shear processes contribute to the total deformation, although local stress fields within the material change completely and the shear processes become more localized into shear bands around the beads. Comparison of the O,,~-E-AV/V,, diagram for unfilled PC with the diagrams for the com- posites with excellent adhesion shows that, up to an elongation strain of about 5%, the tensile behavior is very similar, apart, of course, from a somewhat lower value of the Young’s modulus for unfilled PC. It is espe- cially remarkable that the deviation of linear elastic behavior begins at about the same stress level of about 25 MPa. Obviously, the addition of adhering glass beads to PC does not measurably decrease the applied stress level required to start shear deformation, in spite of the fact that the beads give rise to substantial shear stress concentration.’S6 This behavior is in sharp contrast to glassy polymers that deform by crazing such as polysty- rene. With those materials, the addition of adhering stress concentrating glass beads’ or rubber particles* results in a much lower applied stress level required to start crazing and, consequently, in a completely different tensile behavior.
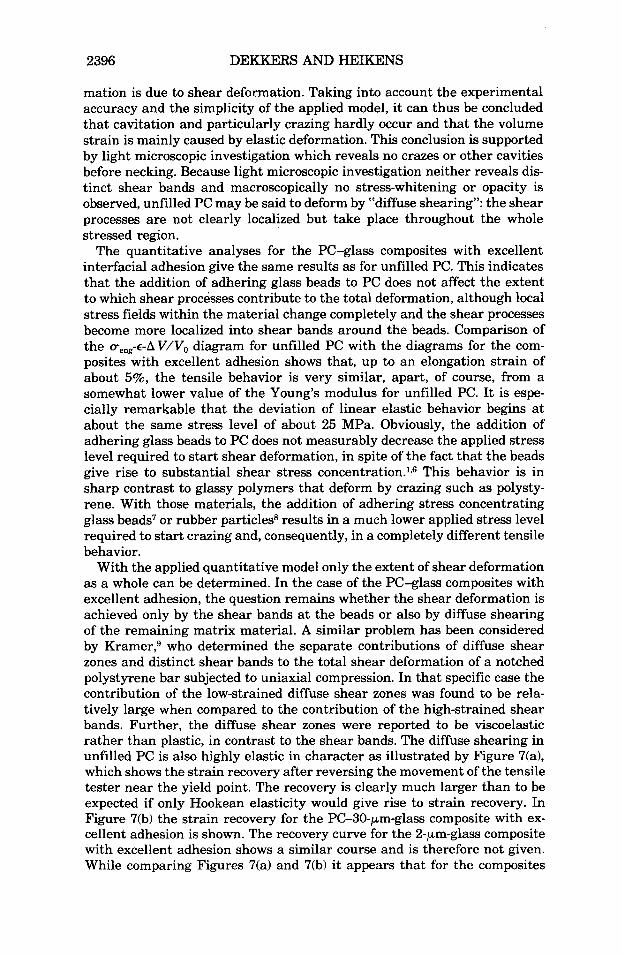
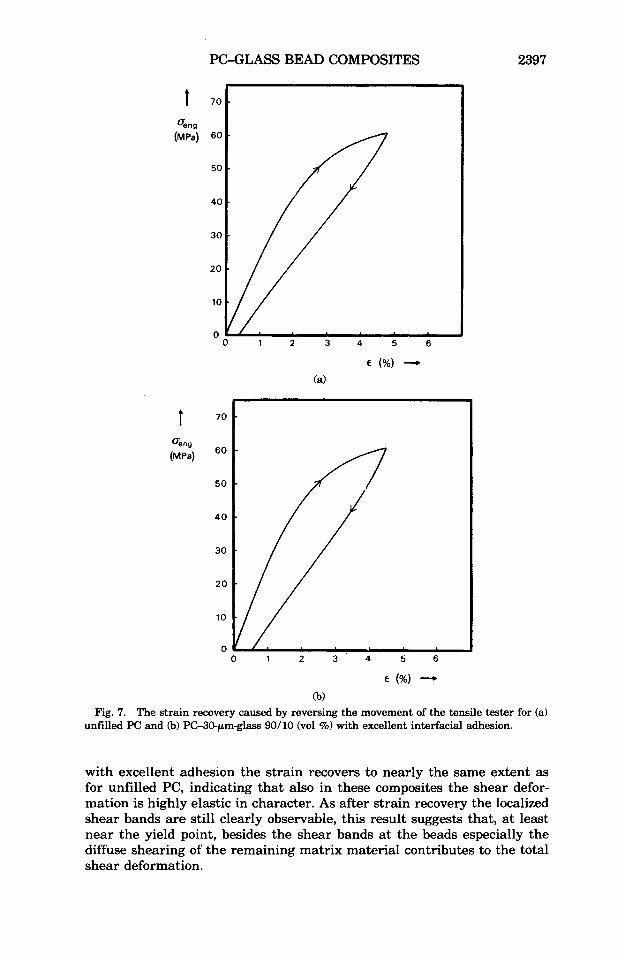
With the applied quantitative model only the extent of shear deformation as a whole can be determined. In the case of the PC-glass composites with excellent adhesion, the question remains whether the shear deformation is achieved only by the shear bands at the beads or also by diffuse shearing of the remaining matrix material. A similar problem has been considered by Kramer? who determined the separate contributions of diffuse shear zones and distinct shear bands to the total shear deformation of a notched polystyrene bar subjected to uniaxial compression. In that specific case the contribution of the low-strained diffuse shear zones was found to be rela- tively large when compared to the contribution of the high-strained shear bands. Further, the diffuse shear zones were reported to be viscoelastic rather than plastic, in contrast to the shear bands. The diffuse shearing in unfilled PC is also highly elastic in character as illustrated by Figure 7(a), which shows the strain recovery after reversing the movement of the tensile tester near the yield point. The recovery is clearly much larger than to be expected if only Hookean elasticity would give rise to strain recovery. In Figure 7(b) the strain recovery for the PC-30-pm-glass composite with ex- cellent adhesion is shown. The recovery curve for the 2-pm-glass composite with excellent adhesion shows a similar course and is therefore not given. While comparing Figures 7(a) and 7(b) it appears that for the composites
PC-GLASS BEAD COMPOSITES
t 70
%Q
(MPa) 60
50
40
30
20
10
0
t 7o
50
4 0
30
20
10
2397
0 0 1 2 3 4 5 6
E (%I - (b)
Fig. 7. The strain recovery caused by reversing the movement of the tensile tester for (a) unfilled PC and (b) PG30-pm-glass 90/10 (vol %) with excellent interfacial adhesion.
with excellent adhesion the strain recovers to nearly the same extent as for unfilled PC, indicating that also in these composites the shear defor- mation is highly elastic in character. As after strain recovery the localized shear bands are still clearly observable, this result suggests that, at least near the yield point, besides the shear bands at the beads especially the diffuse shearing of the remaining matrix material contributes to the total shear deformation.
2398 DEKKERS AND HEIKENS
Effect of Interfacial Adhesion
In the case of poor interfacial adhesion, shear band formation is preceded by dewetting and cap-shaped cavities are formed at the poles of the beads. From previous microscopic in situ observation during a tensile test it is known that these cavities are still very small at the moment that shear bands originate at the edges of the cavities and that they grow substantially as the tensile test proceeds. From the volume strain curves it is evident that dewetting cavitation occurs: After the deviation of linear elastic be- havior, the volume strain for poor adhesion is considerably larger than for excellent adhesion (Figs. 3 and 4). The size of the beads appears to have no significant effect on the extent of dewetting cavitation, indicating that this extent is determined by the occupied volume of the beads rather than by the number or the specific area.
The separate contributions of dewetting cavitation and shear deformation to the total elongation of the composites with poor adhesion cannot be easily determined. The quantitative model applied for unfilled PC and the com- posites with excellent adhesion considers crazing to be the only cavitation mechanism. If crazing is excluded and dewetting cavitation is considered to be the only cavitation mechanism, then still the proportionality factor between the volume strain caused by dewetting cavitation and the elon- gation strain caused by dewetting cavitation must be known at every stage of the tensile test. For crazing, the volume strain was simply assumed to be equal to the elongation strain during the entire tensile test. For dewetting cavitation, however, the volume strain and the elongation strain cannot be related in such as simple way; although the precise shape of each cavity and its instantaneous behavior under continued straining are not exactly known, it can easily be seen that the proportionality factor may not be assumed to be constant but that its value will change under continued straining. So, as yet an accurate determination of the separate contributions of dewetting cavitation and shear deformation is not possible. However, from the macroscopically observable shear bands (Fig. 5 ) it is evident that besides dewetting cavitation also shear deformation contributes signifi- cantly to the total deformation of the composites with poor adhesion.
Figures 3 and 4 demonstrate that the degree of interfacial adhesion has a profound effect on the stress level at which nonlinear deformation takes place. In the case of excellent adhesion, shear deformation starts at about 25 MPa because at about this stress level the stress-elongation strain curve begins to deviate from linear elastic behavior. The yield stress is reached at about 60 MPa. In the case of poor adhesion, the deviation of linear elastic behavior already begins at about 18 MPa and the yield stress is reached at about 45 MPa. Of course, these differences must be attributed to the dif- ferent mechanisms for shear band formation. First, an important factor is that in case of poor adhesion dewetting cavitation contributes to the total deformation and as a result the elongation imposed externally does not have to be achieved by elastic deformation and shear deformation only. There might be, however, a second contributing factor related to the fact that the stress situation at the location at which the shear bands form is different for excellent and poor adhesion. The exact formulation of the
PC-GLASS BEAD COMPOSITES 2399
criterion for shear band formation is unknown, but it has been demonstrated previously’ that shear band formation is ruled by the major principal shear stress T~ and/or the distortion strain energy density W,. Thus, if the values of T~ and w d near the edge of the dewetting cavity of a poorly adhering glass sphere are higher than the maximum values of T~ and w d at an excellently adhering sphere, this could result in a lower applied stress level required to start shear band formation in the case of poor adhesion. In a recent theoretical study,1° it has been shown that the values of T~ and W, near the edge of the dewetting cavity are not necessarily higher, but that this depends strongly on the extent of interfacial slip along that part of the interface where sphere and matrix still remain in contact after application of the uniaxial tension. If there is no resistance to interfacial slip at all, the values of T~ and w d near the edge of the cavity were found to be of the same order of magnitude as the maximum values at an adhering sphere. If the resistance to interfacial slip is increased, the values of T~ and w d
were found to become clearly higher. However, in the physical reality of a poorly adhering glass sphere in a polycarbonate matrix, the extent and character of the interfacial slip and the forces that oppose slip are not precisely known. Therefore, as yet definite conclusions on whether shear band formation occurs at a lower applied stress level for poor adhesion than for excellent adhesion cannot be made.
Necking and the Elongation Strain at Break
Finally, Figures 2-4 illustrate that the addition of glass beads and the degree of interfacial adhesion both affect the ultimate elongation strain at break, es. Unfilled PC can reach such a high value for eB (about 100%) because of its ability to form a stable neck that propagates through almost the entire gauge portion. On adding 10 vol % of glass beads, stable neck formation is suppressed which reduces eB drastically. This phenomenon has been reported for several other “ductile” polymers as well.11J2 Possibly the nearly undeformable glass beads obstruct the orientation processes involved in necking. The values of eB are higher for the composites with poor adhesion than for the composites with excellent adhesion. The cause of this must be sought in the contribution of dewetting cavitation to the total deformation in case of poor adhesion and the lower stress level at which shear defor- mation and fracture take place compared with excellent adhesion.
References
1. M. E. J. Dekkers and D. Heikens, J. Muter. Sci., 19, 3271 (1984). 2. C. B. Bucknall and D. Clayton, Nuture(Phys. Sci.), 231, 107 (1971). 3. C. B. Bucknall and D. Clayton, J. Muter. Sci., 7 , 202 (1972). 4. D. Heikens, S. D. Sjoerdsma, and W. J. Coumans, J. Muter. Sci., 16, 429 (1981). 5. W. J. Coumans and D. Heikens, Polymer, 21, 957 (1980). 6. M. E. J. Dekkers and D. Heikens, J. Muter. Sci., 18, 3281 (1983). 7. M. E. J. Dekkers and D. Heikens, J. Appl. Polym. Sci., 28, 3809 (1983). 8. C. B. Bucknall, Toughened Plastics, Applied Science, London, 1977, p. 182. 9. E. J. Kramer, J. Macromol. Sci., B10, 191 (1974).
2400 DEKKERS AND HEIKENS
10. M. E. J. Dekkers and D. Heikens, J. Mater. Sci., to appear. 11. D. C. Phillips and B. Harris, in Polymer Engineering Composites, M. 0. W. Richardson,
12. H. J. Weiss, Plaste Kautschuk, 24,684 (1977). Ed., Applied Science, London, 1977, p. 45.
Received September 7, 1984 Accepted September 26, 1984
Related Documents