© Fraunhofer ISI Simon Hirzel, Tim Hettesheimer, Marcus Schröter ECEEE 2014 Industrial Summer Study, Arnhem, 3 rd of June 2014 Electric or Pneumatic? Comparing Electric and Pneumatic Linear Drives with Regard to Energy Efficiency and Costs

Welcome message from author
This document is posted to help you gain knowledge. Please leave a comment to let me know what you think about it! Share it to your friends and learn new things together.
Transcript
© Fraunhofer ISI
Simon Hirzel, Tim Hettesheimer, Marcus Schröter
ECEEE 2014 Industrial Summer Study, Arnhem, 3rd of June 2014
Electric or Pneumatic? Comparing Electric and Pneumatic Linear Drives with Regard to Energy
Efficiency and Costs
© Fraunhofer ISI Seite 2
1. Background & aim
2. Methodology
3. Outline of the analysis
4. Results
5. Discussion, Conclusions & Outlook
Out l ine
© Fraunhofer ISI Seite 3
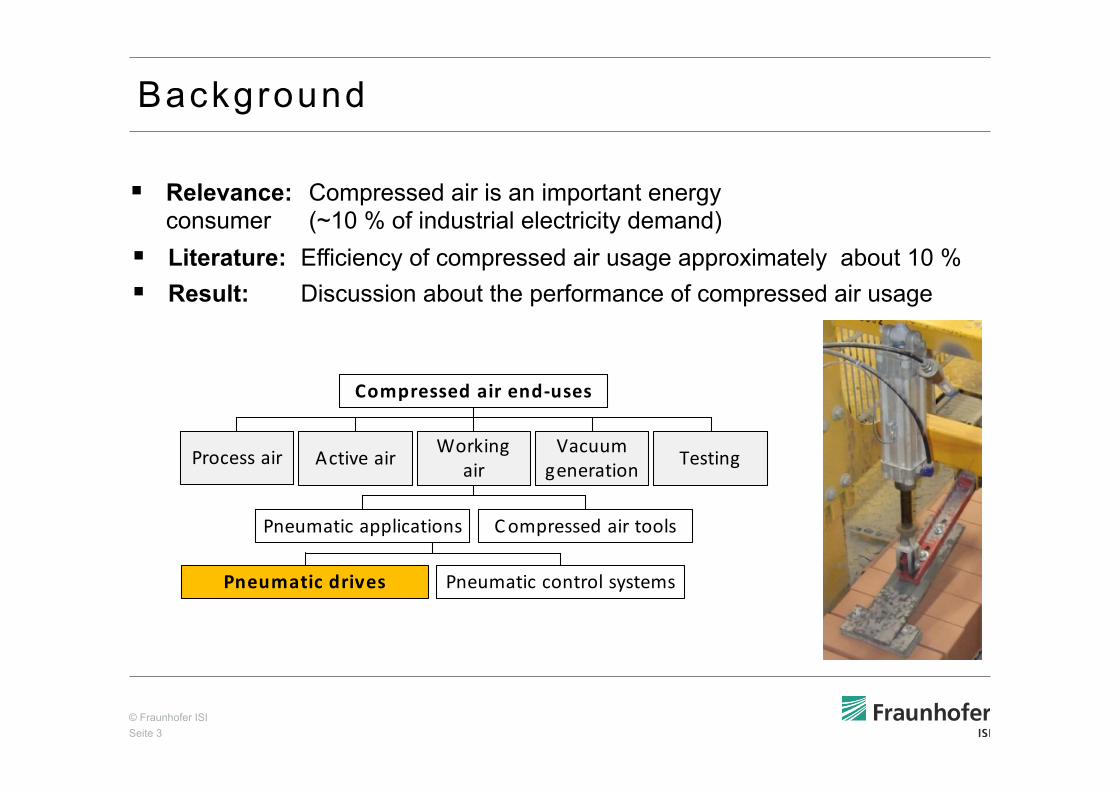
§ Relevance: Compressed air is an important energy consumer (~10 % of industrial electricity demand)
Background
§ Literature: Efficiency of compressed air usage approximately about 10 % § Result: Discussion about the performance of compressed air usage
Working airActive airProcess air Vacuum
generation Testing
Pneumatic applications Compressed air tools
Pneumatic control systems
Compressed air end-‐uses
Pneumatic drives
Working airActive airProcess air Vacuum
generation Testing
Pneumatic applications Compressed air tools
Pneumatic control systems
Compressed air end-‐uses
Pneumatic drives
© Fraunhofer ISI Seite 4
P rob lem & Aim
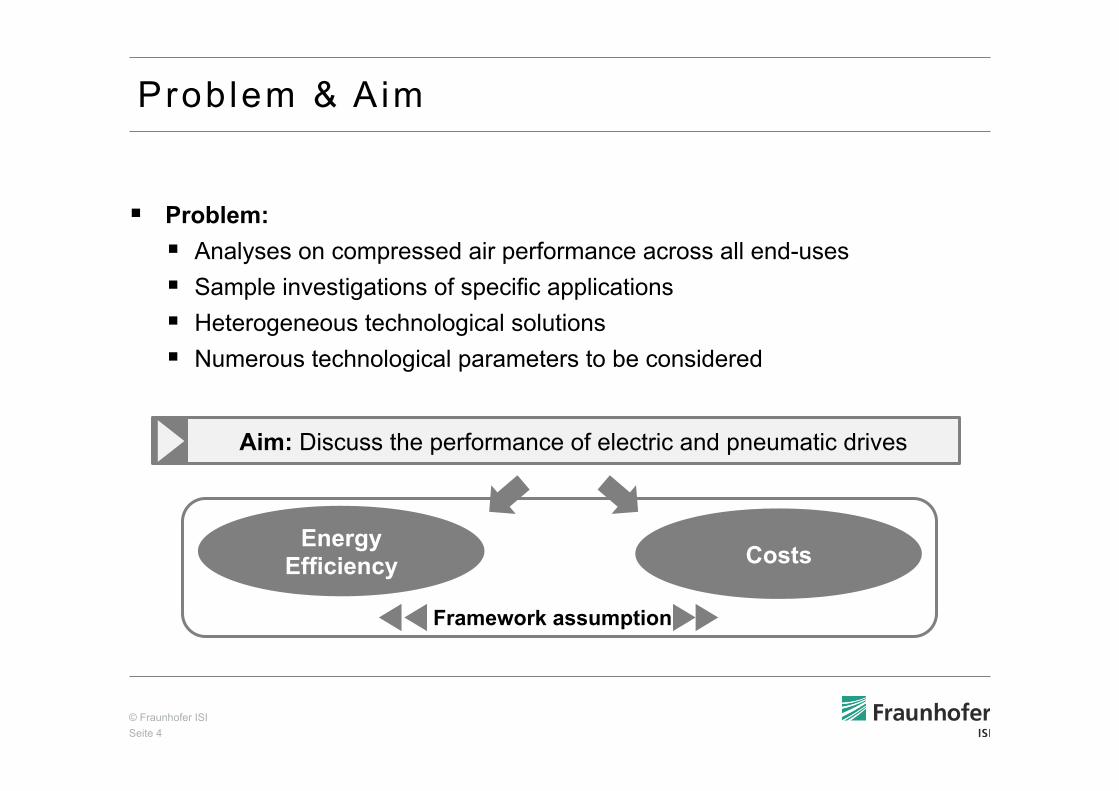
§ Problem: § Analyses on compressed air performance across all end-uses § Sample investigations of specific applications § Heterogeneous technological solutions § Numerous technological parameters to be considered
Aim: Discuss the performance of electric and pneumatic drives
Energy Efficiency Costs
Framework assumption
© Fraunhofer ISI Seite 5
1. Background & aim
2. Methodology
3. Outline of the analysis
4. Results
5. Discussion, Conclusions & Outlook
Out l ine
© Fraunhofer ISI Seite 6
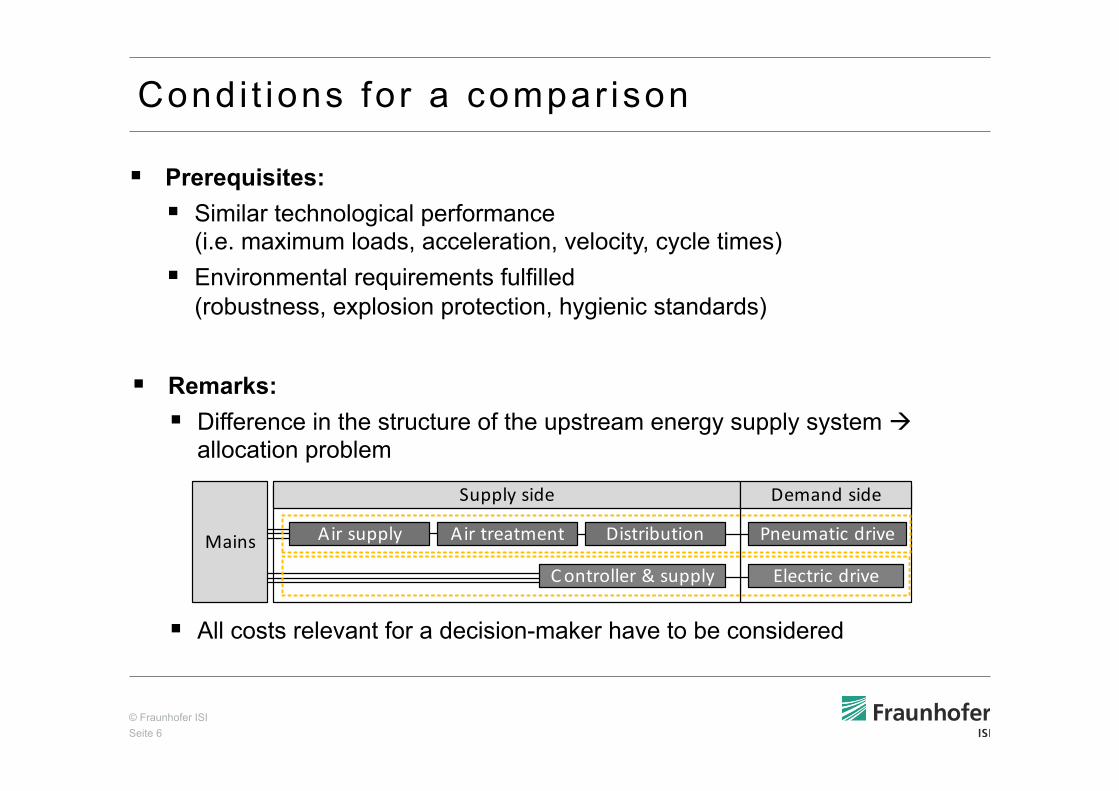
§ Prerequisites: § Similar technological performance
(i.e. maximum loads, acceleration, velocity, cycle times) § Environmental requirements fulfilled
(robustness, explosion protection, hygienic standards)
Condi t ions for a compar ison
Air supply Air treatment Distribution Pneumatic drive
Electric drive
Supply side
Mains
Controller & supply
Demand side
§ Remarks: § Difference in the structure of the upstream energy supply system à
allocation problem
§ All costs relevant for a decision-maker have to be considered
© Fraunhofer ISI Seite 7
pn elE E=
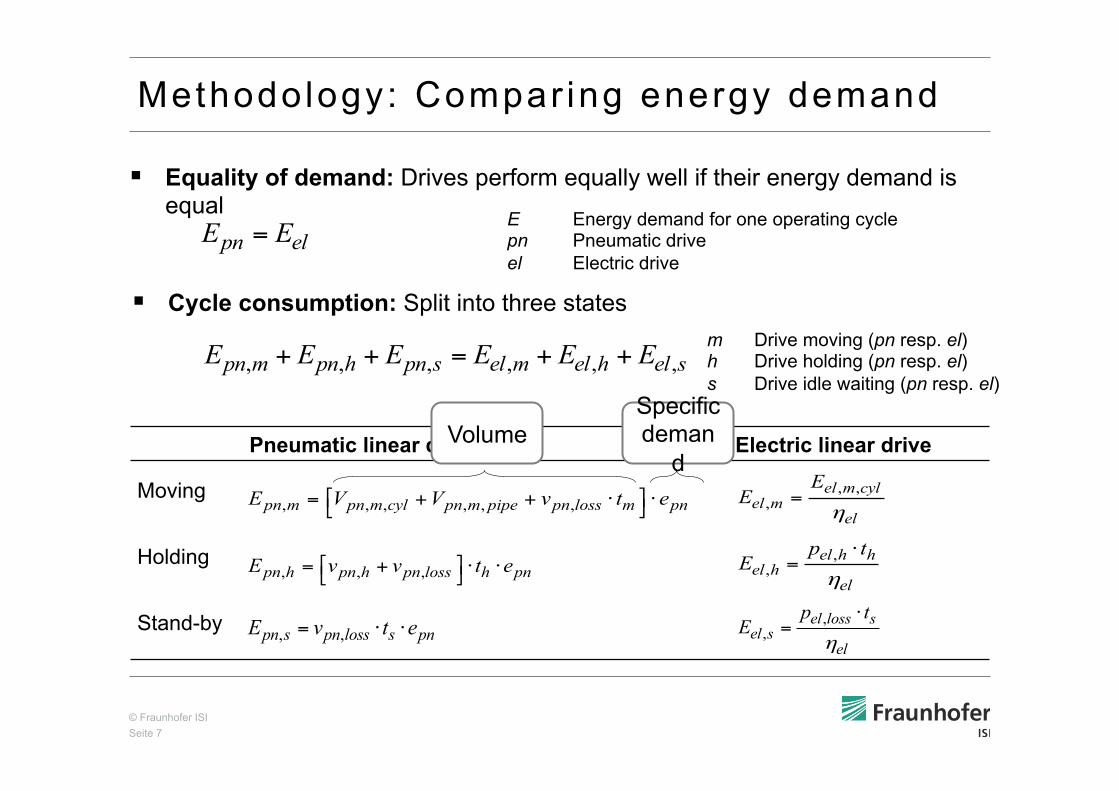
§ Equality of demand: Drives perform equally well if their energy demand is equal
Methodology: Compar ing energy demand
Pneumatic linear drive Electric linear drive
Moving
Holding
Stand-by
, , , , , ,pn m pn m cyl pn m pipe pn loss m pnE V V v t e⎡ ⎤= + + ⋅ ⋅⎣ ⎦
, , ,pn h pn h pn loss h pnE v v t e⎡ ⎤= + ⋅ ⋅⎣ ⎦
, , , , , ,pn m pn h pn s el m el h el sE E E E E E+ + = + +m Drive moving (pn resp. el) h Drive holding (pn resp. el) s Drive idle waiting (pn resp. el)
E Energy demand for one operating cycle pn Pneumatic drive el Electric drive
, ,pn s pn loss s pnE v t e= ⋅ ⋅
, ,,
el m cylel m
el
EE
η=
,,
el h hel h
el
p tE
η
⋅=
,,
el loss sel s
el
p tE
η
⋅=
§ Cycle consumption: Split into three states
Volume Specific deman
d
© Fraunhofer ISI Seite 8
Methodology: Compar ing costs
pn elC C=
pn pn el elI c T I c T+ ⋅ = + ⋅
( ), 1pn pn cyl pnI I β= ⋅ +
yearel el el
cyc
tc E p
t= ⋅ ⋅
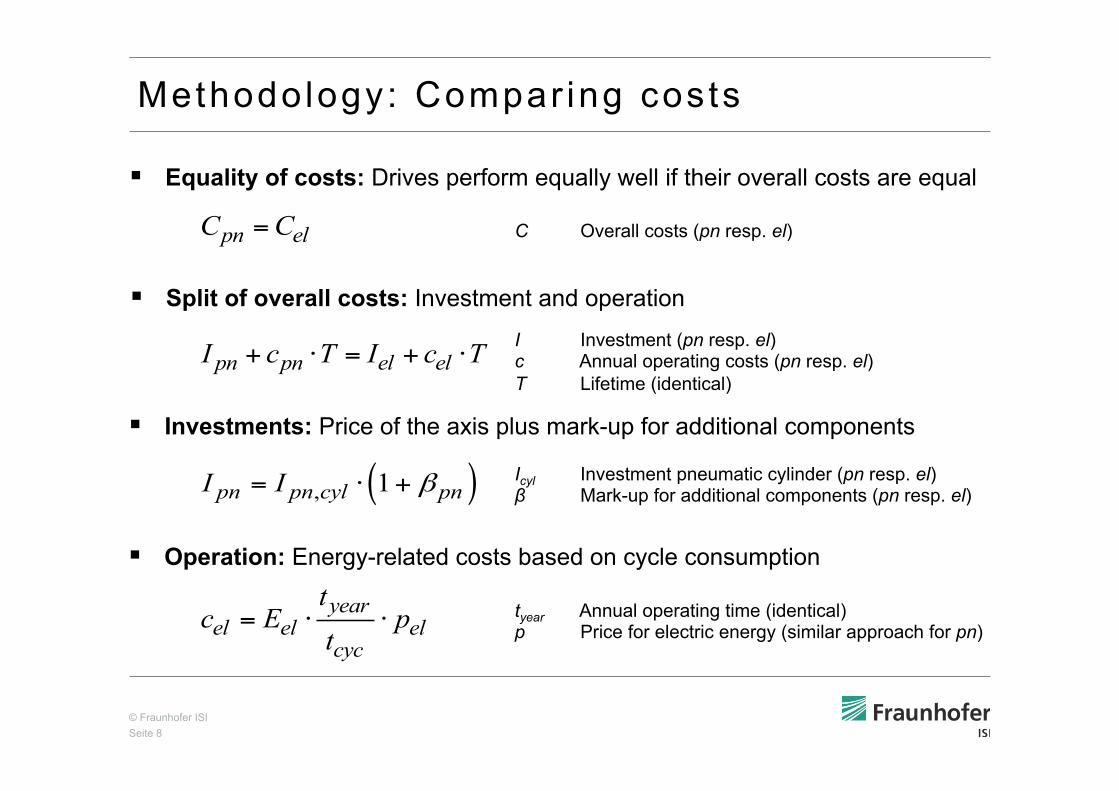
§ Equality of costs: Drives perform equally well if their overall costs are equal
§ Split of overall costs: Investment and operation
I Investment (pn resp. el) c Annual operating costs (pn resp. el) T Lifetime (identical)
C Overall costs (pn resp. el)
§ Investments: Price of the axis plus mark-up for additional components
Icyl Investment pneumatic cylinder (pn resp. el) β Mark-up for additional components (pn resp. el)
§ Operation: Energy-related costs based on cycle consumption
tyear Annual operating time (identical) p Price for electric energy (similar approach for pn)
© Fraunhofer ISI Seite 9
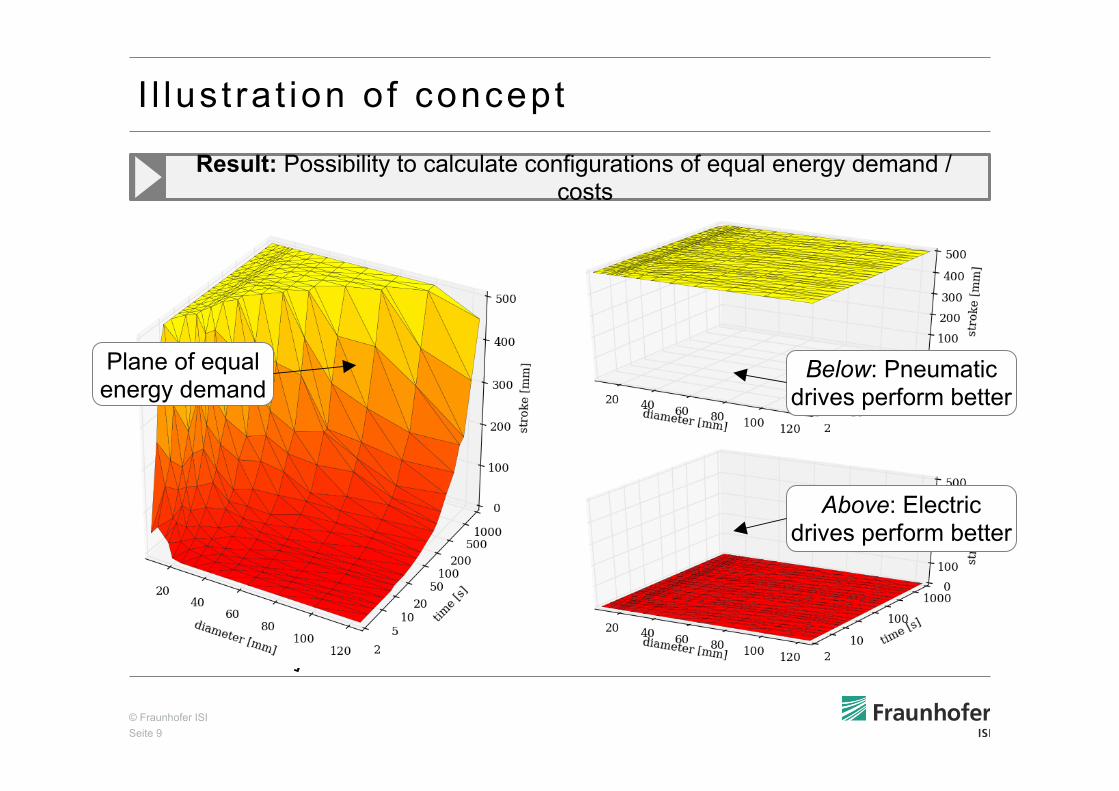
I l lus t ra t ion of concept
Result: Possibility to calculate configurations of equal energy demand / costs
stor
ke [m
m]
0
500
1000
2 125
8
Plane of equal energy demand
Below: Pneumatic drives perform better
Above: Electric drives perform better
© Fraunhofer ISI Seite 10
1. Background & aim
2. Methodology
3. Outline of the analysis
4. Results
5. Discussion, Conclusions & Outlook
Out l ine
© Fraunhofer ISI Seite 11
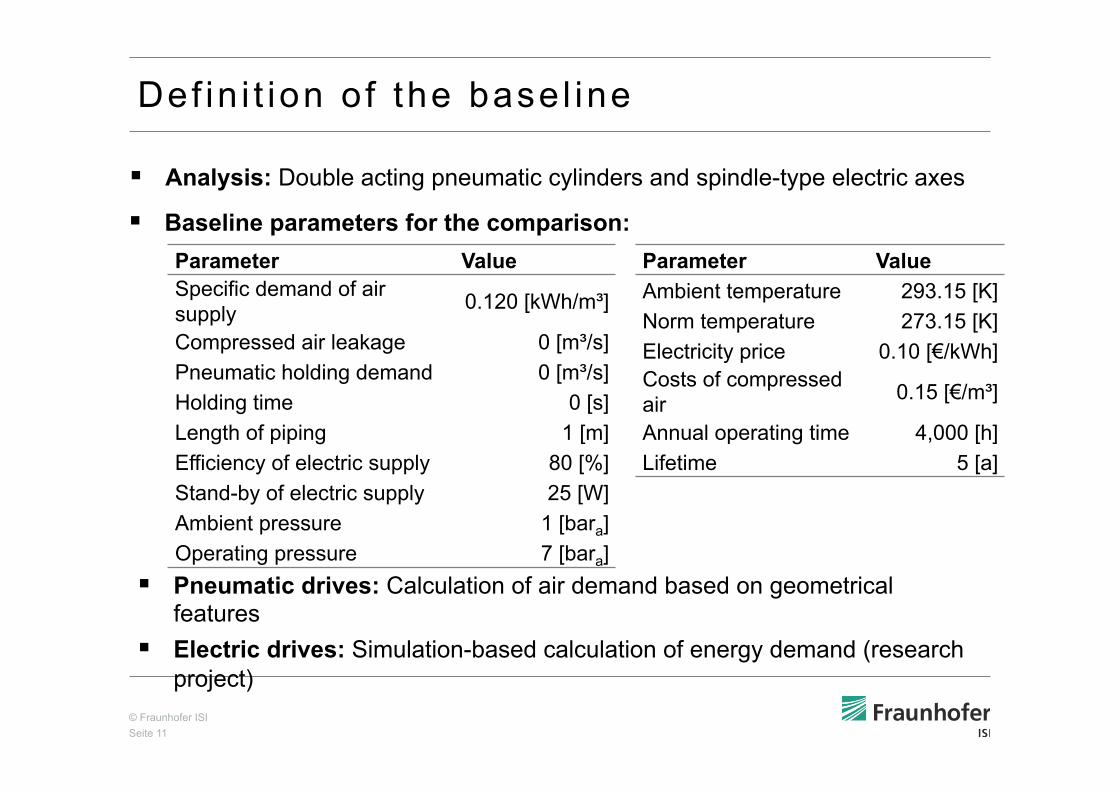
Def in i t ion of the basel ine
Parameter Value Specific demand of air supply 0.120 [kWh/m³]
Compressed air leakage 0 [m³/s] Pneumatic holding demand 0 [m³/s] Holding time 0 [s] Length of piping 1 [m] Efficiency of electric supply 80 [%] Stand-by of electric supply 25 [W] Ambient pressure 1 [bara] Operating pressure 7 [bara]
§ Analysis: Double acting pneumatic cylinders and spindle-type electric axes
§ Baseline parameters for the comparison:
§ Pneumatic drives: Calculation of air demand based on geometrical features
§ Electric drives: Simulation-based calculation of energy demand (research project)
Parameter Value Ambient temperature 293.15 [K] Norm temperature 273.15 [K] Electricity price 0.10 [€/kWh] Costs of compressed air 0.15 [€/m³]
Annual operating time 4,000 [h] Lifetime 5 [a]
© Fraunhofer ISI Seite 12
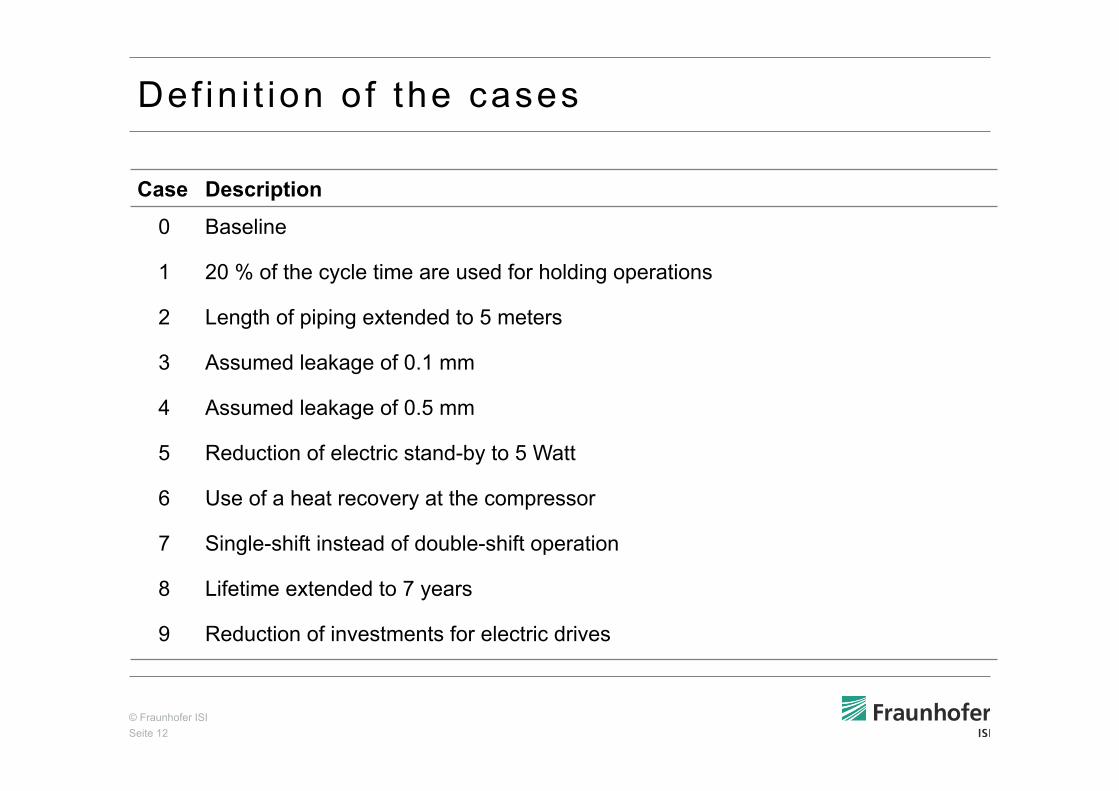
Def in i t ion of the cases
Case Description
0 Baseline
1 20 % of the cycle time are used for holding operations
2 Length of piping extended to 5 meters
3 Assumed leakage of 0.1 mm
4 Assumed leakage of 0.5 mm
5 Reduction of electric stand-by to 5 Watt
6 Use of a heat recovery at the compressor
7 Single-shift instead of double-shift operation
8 Lifetime extended to 7 years
9 Reduction of investments for electric drives
© Fraunhofer ISI Seite 13
1. Background & aim
2. Methodology
3. Outline of the analysis
4. Results
5. Discussion, Conclusions & Outlook
Out l ine
© Fraunhofer ISI Seite 14
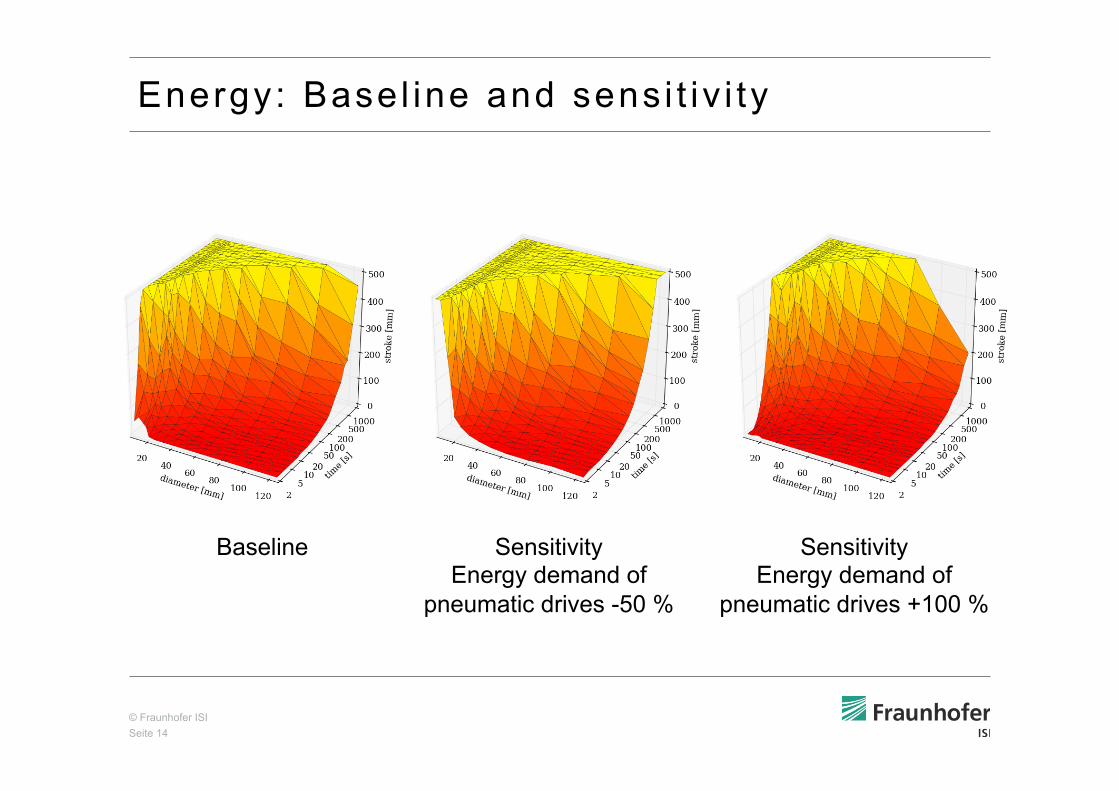
Energy: Basel ine and sens i t iv i ty
Baseline Sensitivity Energy demand of
pneumatic drives -50 %
Sensitivity Energy demand of
pneumatic drives +100 %
© Fraunhofer ISI Seite 15
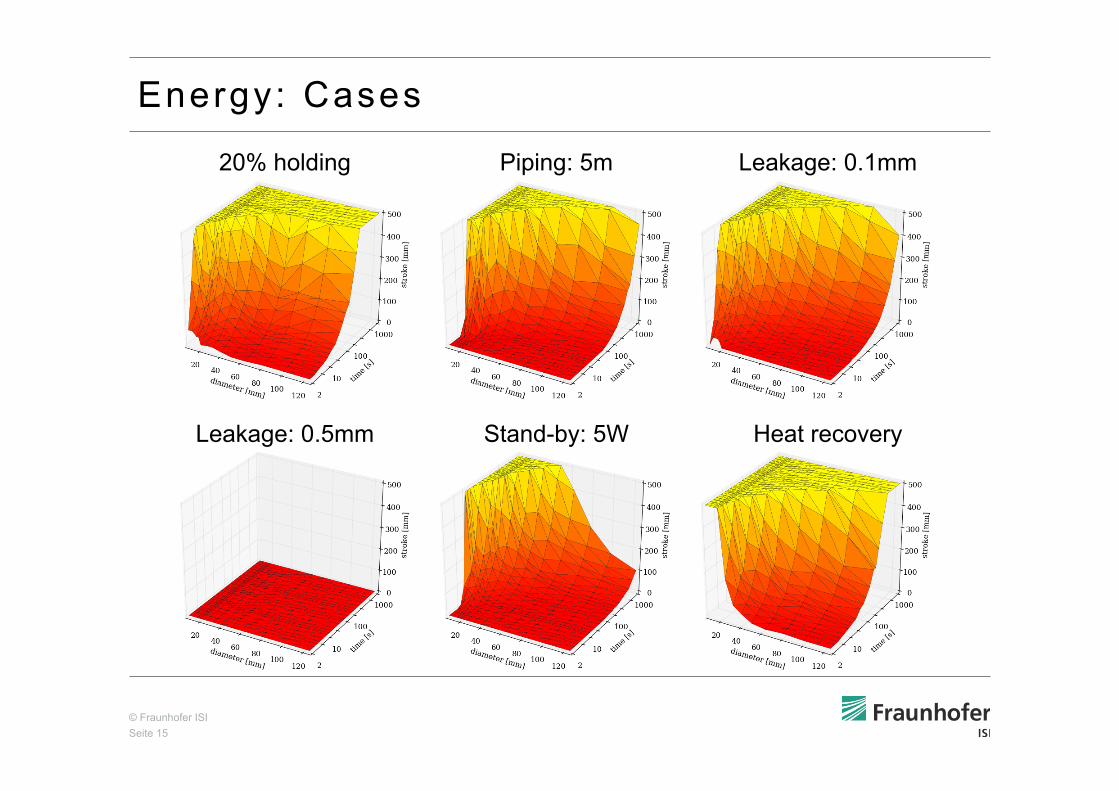
Energy: Cases
20% holding Piping: 5m Leakage: 0.1mm
Leakage: 0.5mm Stand-by: 5W Heat recovery
© Fraunhofer ISI Seite 16
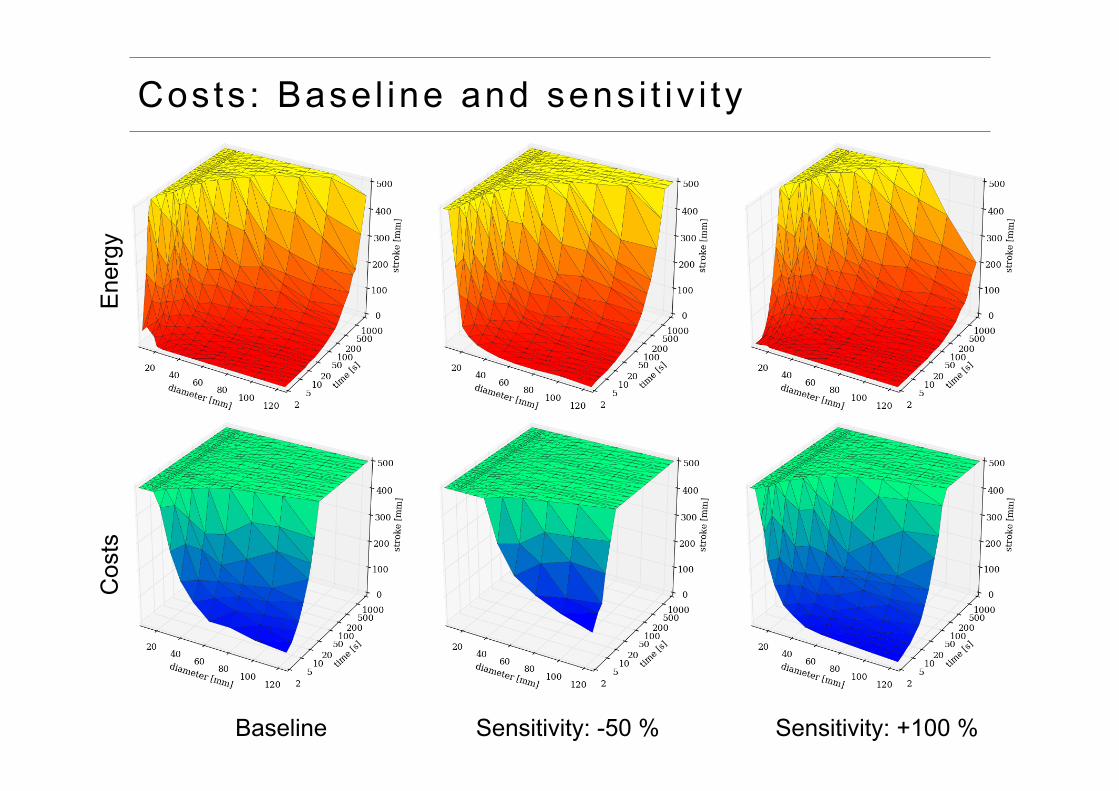
Costs : Basel ine and sens i t iv i ty
Baseline Sensitivity: -50 % Sensitivity: +100 %
Ene
rgy
Cos
ts
© Fraunhofer ISI Seite 17
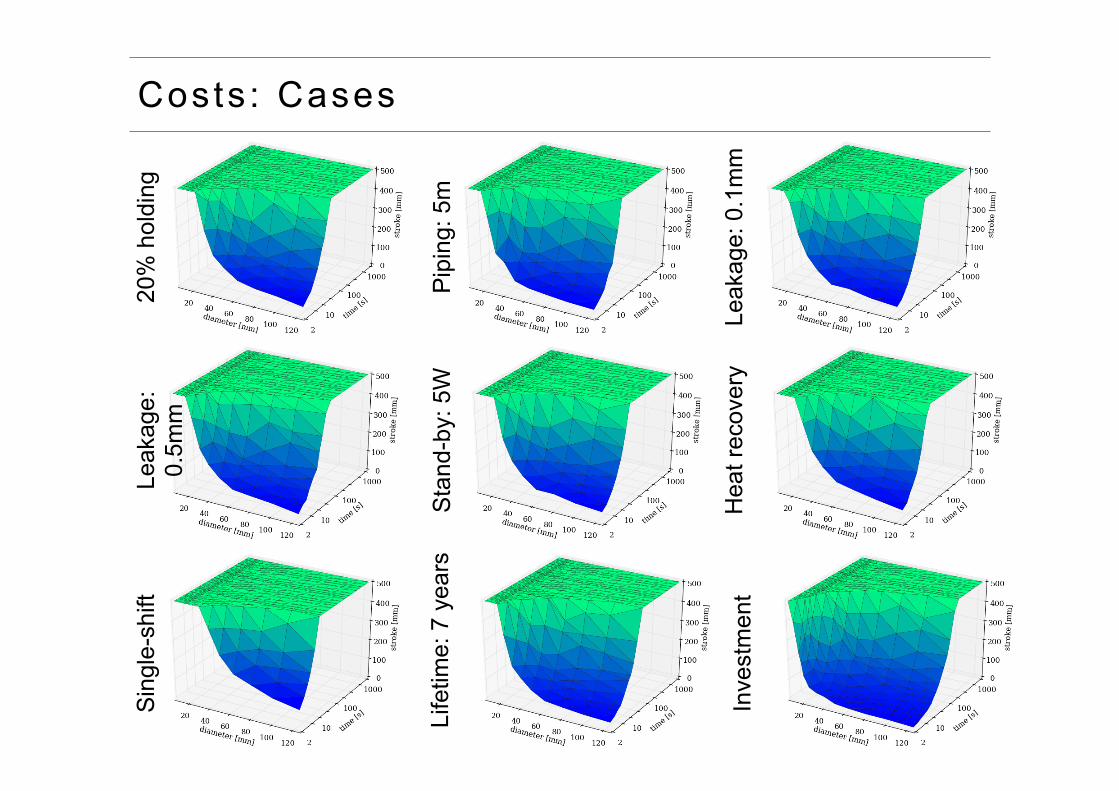
Costs : Cases S
ingl
e-sh
ift
Inve
stm
ent
Life
time:
7 y
ears
20%
hol
ding
Pip
ing:
5m
Leak
age:
0.1
mm
Leak
age:
0.
5mm
Sta
nd-b
y: 5
W
Hea
t rec
over
y
© Fraunhofer ISI Seite 18
1. Background & aim
2. Methodology
3. Outline of the analysis
4. Results
5. Discussion, Conclusions & Outlook
Out l ine
© Fraunhofer ISI Seite 19
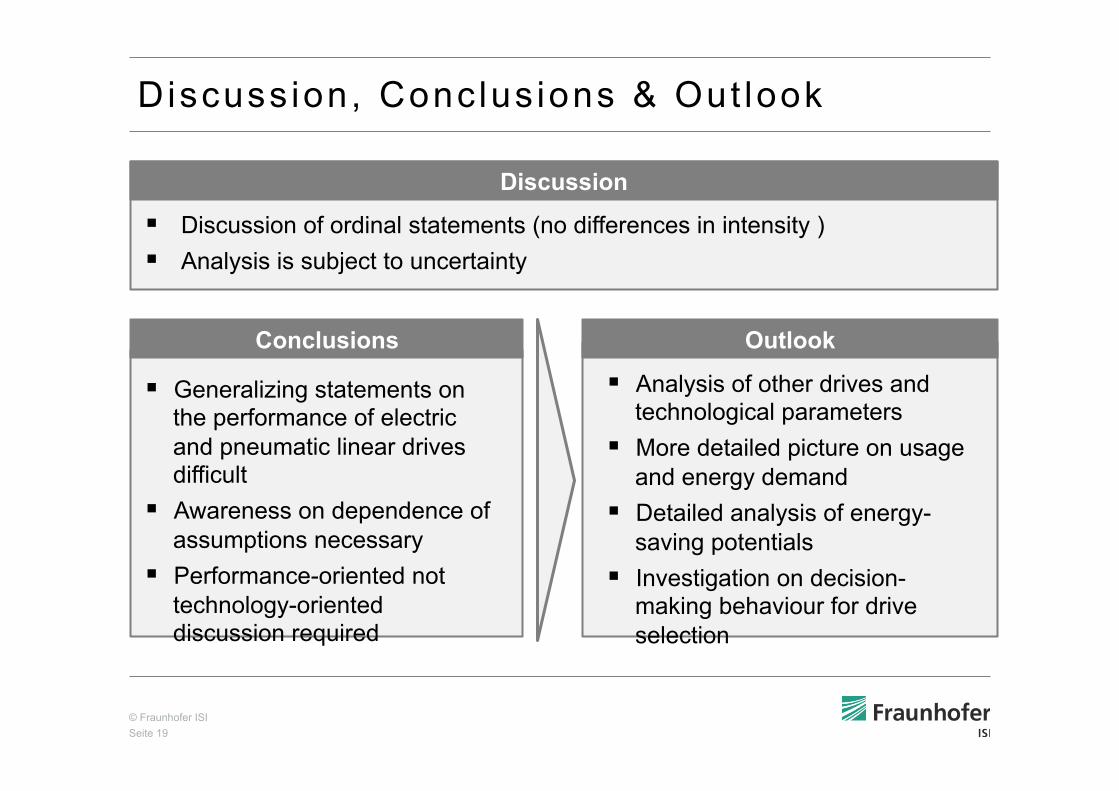
§ Generalizing statements on the performance of electric and pneumatic linear drives difficult
§ Awareness on dependence of assumptions necessary
§ Performance-oriented not technology-oriented discussion required
D iscuss ion, Conclus ions & Out look
§ Analysis of other drives and technological parameters
§ More detailed picture on usage and energy demand
§ Detailed analysis of energy-saving potentials
§ Investigation on decision-making behaviour for drive selection
Conclusions Outlook
§ Discussion of ordinal statements (no differences in intensity ) § Analysis is subject to uncertainty
Discussion
© Fraunhofer ISI Seite 20
Thank you for your attention !
Related Documents