Modern Environmental Science and Engineering (ISSN 2333-2581) February 2019, Volume 5, No. 2, pp. 125-136 Doi: 10.15341/mese(2333-2581)/02.05.2019/002 Academic Star Publishing Company, 2019 www.academicstar.us Electric Cars vs Diesel and Gasoline: A Comparative LCA Ranging from Micro-Car to Family Car Pierpaolo Girardi, and Paola Cristina Brambilla RSE - Ricerca Sistema Energetico, Via Rubattino 54, 20134 Milano, Italy Abstract: The purpose of this paper is to compare the environmental performances of electric vehicles and homologous gasoline and diesel vehicles, taking into account the overall life cycle potential impacts of the analyzed vehicles, in a Life Cycle Assessment (LCA) perspective. To this aim, a wide range of vehicles were taken into account: Smart Fortwo, Chevrolet Spark, Fiat 500, Volkswagen Golf, Ford Focus and Kia Soul. Considering different vehicle models - from the small city car to the family car — highlighted that advantages and disadvantages of the electric vehicle do not depend on the category to which the vehicle belongs. The analysis shows that electric vehicles perform better than traditional ones, in terms of greenhouse gases emissions, depletion of non-renewable resources and emissions of atmospheric pollutants affecting urban areas. Nonetheless, electric vehicles prove to be non-competitive for Life Cycle Impact categories like water eutrophication and human toxicity, for which the environmental impacts due to the battery life cycle play a decisive role. Key words: LCA, electric vehicle, internal combustion engine vehicle, LCIA regionalization, geographical distribution of pollutants 1. Introduction It is widely spread the idea, among the general public, that electric vehicles in general — and electric vehicles for private transport in particular — can play an important role in a sustainable road transport system, being able to reduce emissions of both greenhouse gases and atmospheric pollutants. The growing awareness towards these themes involves both press and government bodies. In fact, if numerous general press releases have been published on this subject, a growing interest of the government authorities towards these themes is also to be registered. Moreover, there is a general consensus within the scientific community about Life Cycle Assessment (LCA) being the more suitable methodology to be adopted to investigate the potential Corresponding author: Pierpaolo Girardi, Eng.; research areas/interests: LCA and external cost evaluation, power generation, renewable energy sources, energy savings, electricity transport, road transport, electric vehicles, smart cities assets. E-mail: [email protected]. improvements due to the substitution of traditional vehicles (both gasoline and diesel fuelled) with electric ones [1, 2]. In fact, a wide number of LCA studies have been developed on this theme. T. Hawkins et al. [1] and later A. Nordelöf et al. [2] made a review of about 50 and 70 studies respectively and found out that none of them were to be considered satisfying. The main critical aspects were due on one hand to the limited number of potential impacts considered in the assessment phase and on the other hand to an inadequate characterization of the electrical charging mix, i.e. the mix of energy sources and conversion technologies used to produce the recharging mix. Although recent studies developed in the framework of the Research Fund for the Italian Electrical System [5] have been recognised to bridge these gaps [6], it is clear that some issues may need to be further addressed. Regular updating is of capital importance in LCA of electric automobile sector,

Welcome message from author
This document is posted to help you gain knowledge. Please leave a comment to let me know what you think about it! Share it to your friends and learn new things together.
Transcript

Modern Environmental Science and Engineering (ISSN 2333-2581) February 2019, Volume 5, No. 2, pp. 125-136 Doi: 10.15341/mese(2333-2581)/02.05.2019/002 Academic Star Publishing Company, 2019 www.academicstar.us
Electric Cars vs Diesel and Gasoline: A Comparative
LCA Ranging from Micro-Car to Family Car
Pierpaolo Girardi, and Paola Cristina Brambilla
RSE - Ricerca Sistema Energetico, Via Rubattino 54, 20134 Milano, Italy
Abstract: The purpose of this paper is to compare the environmental performances of electric vehicles and homologous gasoline and diesel vehicles, taking into account the overall life cycle potential impacts of the analyzed vehicles, in a Life Cycle Assessment (LCA) perspective. To this aim, a wide range of vehicles were taken into account: Smart Fortwo, Chevrolet Spark, Fiat 500, Volkswagen Golf, Ford Focus and Kia Soul. Considering different vehicle models - from the small city car to the family car — highlighted that advantages and disadvantages of the electric vehicle do not depend on the category to which the vehicle belongs.
The analysis shows that electric vehicles perform better than traditional ones, in terms of greenhouse gases emissions, depletion of non-renewable resources and emissions of atmospheric pollutants affecting urban areas. Nonetheless, electric vehicles prove to be non-competitive for Life Cycle Impact categories like water eutrophication and human toxicity, for which the environmental impacts due to the battery life cycle play a decisive role.
Key words: LCA, electric vehicle, internal combustion engine vehicle, LCIA regionalization, geographical distribution of pollutants
1. Introduction
It is widely spread the idea, among the general
public, that electric vehicles in general — and electric
vehicles for private transport in particular — can play
an important role in a sustainable road transport
system, being able to reduce emissions of both
greenhouse gases and atmospheric pollutants.
The growing awareness towards these themes
involves both press and government bodies. In fact, if
numerous general press releases have been published
on this subject, a growing interest of the government
authorities towards these themes is also to be
registered. Moreover, there is a general consensus
within the scientific community about Life Cycle
Assessment (LCA) being the more suitable
methodology to be adopted to investigate the potential
Corresponding author: Pierpaolo Girardi, Eng.; research
areas/interests: LCA and external cost evaluation, power generation, renewable energy sources, energy savings, electricity transport, road transport, electric vehicles, smart cities assets. E-mail: [email protected].
improvements due to the substitution of traditional
vehicles (both gasoline and diesel fuelled) with
electric ones [1, 2]. In fact, a wide number of LCA
studies have been developed on this theme. T.
Hawkins et al. [1] and later A. Nordelöf et al. [2]
made a review of about 50 and 70 studies respectively
and found out that none of them were to be considered
satisfying. The main critical aspects were due on one
hand to the limited number of potential impacts
considered in the assessment phase and on the other
hand to an inadequate characterization of the electrical
charging mix, i.e. the mix of energy sources and
conversion technologies used to produce the
recharging mix.
Although recent studies developed in the
framework of the Research Fund for the Italian
Electrical System [5] have been recognised to bridge
these gaps [6], it is clear that some issues may need to
be further addressed. Regular updating is of capital
importance in LCA of electric automobile sector,
Electric Cars vs Diesel and Gasoline: A Comparative LCA Ranging from Micro-Car to Family Car
126
characterised by rapidly changing developments and
innovations.
As already highlighted in the past [7], in a Life
Cycle perspective, the environmental performances of
electric and conventional vehicles are influenced by a
number of parameters, among which the most relevant
are fuel and energy consumptions and power mix.
Recently, an interesting review [8] identifies other
important factors such as climatic conditions, the
capillarity of the charging infrastructures, the driving
conditions, the mobility policies and the vehicles
typologies.
Starting from this last consideration, the present
paper deals with two aspects still little investigated.
First, , the study doesn’t consider generic and ideal
electric and internal combustion engine vehicles, but
real vehicles, already present on the 2015 Italian
market in the three motorisations: electric diesel and
gasoline. For these vehicles, real characteristics
(weight, fuel and energy consumptions, range,
expected lifetime, etc.) were considered. The wide
range of vehicles involved in the analysis, ranging
from micro cars to family cars, allowed to investigate
if there were a particular vehicle size for which the
transition towards electric vehicles were to be
considered more (or less) favourable. Last, the
performance of the vehicles are compared on the basis
of energy consumptions and emission factors of a
urban driving cycle as urban areas are the place of
choice for the use of electric vehicles (thanks to the
absence of tailpipe emissions and because of their
limited range).
2. Material and Methods
The following paragraphs describe the assumptions
and results of the LCA study in accordance with the
ISO 14040 [3]: goal and scope definition, inventory
analysis, impact assessment and interpretation of the
results.
2.1 Goal and Scope Definition
The aim of the study is to compare the
environmental performances of electric vehicles with
homologous gasoline and diesel fuelled vehicles,
taking into account commercial models for which the
three motorisations are available. The vehicles under
analysis are representative of different sizes, ranging
from micro cars to family cars, and cover the main
market segments related to the private passenger
transport in urban area. The selected car types are:
Smart For Two, Chevrolet Spark, Fiat 500,
Volkswagen Golf, Ford Focus and Kia Soul. All the
electric vehicles considered are equipped with Li-ion
batteries and all the internal combustion engine
vehicles considered belong to the Euro 6 category, with
the exception of the Fiat 500 Diesel (Euro 5), because
at the time of preparation of the study, official data
concerning the real pollutant emissions per kilometer
were not available.
2.1.1 Functional Unit
The functional unit represents the unit of
measurement of the service provided by the analysed
system. The service provided by a private vehicle is the
passenger transport. Accordingly, the functional unit of
the study is based on the kilometers travelled by the
vehicles, that is 1 km*passenger, considering an
average vehicle load factor of 1.62 passenger/vehicle.
The load factor doesn’t have a direct effect on the
vehicles comparison, as it doesn’t vary from one type
of vehicle to another. Nonetheless, it helps in
comparing different transport modes (bicycle,
motorcycle, public transport, etc.). Moreover, the load
factor affects the pollutants emissions in the use phase
of the vehicles [10], both directly (for what concerns
brake, tyre and road wear) and indirectly (as it
determines fuel/energy consumptions). The load factor
used in this study is consistent with the assumptions
made by the Environmental Protection Agency (EPA
www.fueleconomy.gov) for the estimation of fuel
consumptions and with the main new type-approval
test cycles. The functional unit is the unit of scale on
which all the inputs and outputs in the Life Cycle

Electric Cars vs Diesel and Gasoline: A Comparative LCA Ranging from Micro-Car to Family Car
127
Inventory phase and all the potential impacts in the Life
Cycle Impact Assessment phase are expressed. This
means that, in this article, all the impacts, for all the life
cycle phases, are referred to 1 km travelled.
2.1.2 Choice of the Impact Categories
The impact categories considered in this study
address issues such as greenhouse gas emissions and
atmospheric pollutants emissions (especially in urban
areas), as these aspects represent the main drivers for
the transition towards electric mobility. With regard to
this last aspect, the study evaluates the potential
impacts related to air acidification, photochemical
ozone formation potential and particulate matter
formation potential. Other aspects such as water and
soil eutrophication and human toxicity (both cancer
and non-cancer effects) are analysed in the study
because they are identified as a weakness in the electric
vehicles performances [11]. These Life Cycle Impact
Assessment indicators are quantified in accordance
with the methods suggested by the Joint Research
Centre [12], in the framework of the European
Platform on Life Cycle Assessment.
2.1.3 System Boundary
The approach chosen to describe and analyse the
system is a cradle to grave approach and it considers:
vehicles production and dismantling; battery
production and dismantling (calculated separately only
for the electric vehicles); complete energy carrier
supply chains (including primary energy sources
production); vehicles use phase; vehicles maintenance
phase and road maintenance.
2.2 Inventory
As regard background processes, most of the
secondary data used in this study derives from
Ecoinvent database, v3 [13], the most used database for
LCA applications. Assumptions and primary data used
to represent the main phases are described in the
following paragraphs.
2.2.1 Vehicles Production (and Dismantling)
To better represent the characteristics of the
analysed vehicles, the production (and dismantling) of
the vehicles is distinguished between powertrain (i.e.,
all the components which are required for generating
and transmitting the propulsive energy for the vehicle)
and glider (i.e., all the remaining components of the
vehicle which are not strictly related to the propulsion
technology).
Moving from one type of vehicle to another, the
relative weight of the powertrain compared to the
glider varies. In Ecoinvent v3 database, being 100 the
vehicle weights, the allocation between glider and
powertrain is 91% glider and 9% powertrain for
electric vehicles, 74% glider and 26% powertrain for
gasoline fuelled vehicles and 70% glider and 30%
powertrain for diesel fuelled vehicles. In this study,
only for electric vehicles, the proportion between glider
and powertrain has been changed, assuming that the
powertrain weight is proportional to the engine power.
Moreover, Ecoinvent provide data related to the
production of average vehicles representative of an
average world market. Vice versa, in this study, for
each type of vehicle, a country of production for the
electric version is identified and, for the analysis, the
gasoline and diesel version of the vehicle are supposed
to be produced in the same place as the electric version.
To this aim, the average world data were adapted to
represent the specific country of production, at least for
what concerns the power mix used during the vehicles
assembly phase. This assumption assured that
homologous vehicles were compared on the basis of
the same production (and dismantling) conditions and,
at the same time, it allowed to differentiate impacts for
vehicles coming from different geographical areas.
Table 1 shows, for each type of vehicle, the country
where the production process takes place.
A relevant aspect to consider, when carrying out this
kind of analysis, is represented by the vehicle lifetime.
Efforts have been made to obtain vehicles more and
more energy-efficient, with low environmental impacts.

Electric Cars vs Diesel and Gasoline: A Comparative LCA Ranging from Micro-Car to Family Car
128
Table 1 Country where the vehicles are produced.
Vehicle Country
Smart Fortwo France
Kia Soul South Korea
Chevrolet Spark South Korea
Ford Focus USA - Michigan
Volkswagen Golf Germany
Fiat 500 Mexico
Accordingly, the impacts due to the vehicles
construction phase play increasingly significant roles,
both in absolute terms and as a percentage of the
overall life cycle impacts. Of course, the more the
vehicle lifetime is short, the heavier the effect of these
impacts is and underestimations of the real vehicle
lifetime bring to overestimations of the impacts
generated from vehicles characterised by greater
production impacts (i.e., electric vehicles). Conversely,
assuming excessively long vehicles lifetimes could
bring to an underestimation of the impacts. The
vehicles lifetime assumed in Ecoinvent v3 is of 150000
km, regardless the vehicle segment or the fuel used. In
this study, the vehicle lifetime is reasonably assumed to
be dependent both on the vehicle segment and on the
type of fuel used, according to the more recent studies
[14, 15] on this subject. The following table shows the
vehicles lifetimes assumed in the present paper as a
function of vehicle size and motorisation
Table 2 Average lifetime (km) assumed in this study, as a function of vehicles size and motorization.
Size Gasoline [km]
Diesel [km]
Electric [km]
Vehicles considered in
this study micro 150000 200000 175000 Smart Fortwo
mini 180000 210000 200000 Chevrolet Spark, Fiat 500
medium 210000 240000 230000 VW Golf, Ford Focus
big 210000 240000 230000 Kia Soul
2.2.2 Battery Production (and Dismantling)
Ecoinvent v3 considers, for a vehicle lifetime of
150000 km, a battery lifetime of 100000 km [16]. In
literature, many different assumptions are used on the
subject [17], in relation to the battery lifetime and to
the option of substituting the battery during the vehicle
lifetime. Nevertheless, when drawing up this paper, no
scientific evidence has been found about the battery
lifetime being 100000 or 150000 km. Studies of ageing
of Li-ion batteries seem to indicate that, at present, the
electric vehicles end-of-life (i.e. when they have lost 20%
of their capacity) could be reasonably set to 200000 km
[18]. Besides, a behavioral study [19] shows that
batteries continue to meet daily travel needs of drivers
well beyond a capacity fade of 80% and that most of
drivers would not perceive a service loss when the
battery capacity fade is 80, 70 or 60% of the original
energy capacity. As a consequence, drivers would
continue to use the vehicle even if the battery has
conventionally reached its end-of-life.
The discussion forum Electrek 1 has recently
published an analysis developed on around 350 Tesla
Model S and X that highlights that, for this car, the
battery end-of-life could be of over 300000 km. Fig. 1
shows the battery decay of Testa Model S and Model X
as a result of the distance travelled.
Therefore, it would appear appropriate, according to
the authors’ opinion, to consider the useful battery
lifetime as long as the vehicle lifetime. This
assumption has been adopted for this study.
2.2.3 Vehicles Use Phase
As regard the vehicles use phase, vehicles fuel
consumptions are derived from measures published by
the Environmental Protection Agency (EPA)2, because
in this database, consumptions are calculated using a
common methodology for all vehicles. Moreover, EPA
database offers the possibility to compare the vehicles
performances on the basis of a urban driving cycle. As
regard Internal Combustion Engine Vehicles (ICEV)
1 https://electrek.co/2018/04/14/tesla-battery-degradation-data/. 2 http://www.fueleconomy.gov.

Electric Cars vs Diesel and Gasoline: A Comparative LCA Ranging from Micro-Car to Family Car
129
the main emission factors are derived from the
application of COPERT Model [20] for the elaboration
of the Italian National Emissions Inventory [21]. The
non-exhaust emissions (i.e., tyre, brake and road wear
emissions due to the movement of the vehicle) are
calculated as a function of the gross vehicle weight
[10]. Results are in accordance with the National
Emissions Inventory data [21].
Fig. 1 Battery decay for Tesla S and X Models as a result of the distance travelled.
2.2.4 Energy Carrier Supply Chain
As regard internal combustion engine vehicles,
given the relevance of potential impacts due to the
fossil fuels (gasoline and diesel oil) supply chains and
given the excessive approximations in the Ecoinvent
v3 crude oil dataset, a crude oil production mix referred
to Italy was created, according to the official data
published by the Ministry of Economic Development
[22, 23]. For what concerns electric vehicles, the
recharging mix was built as marginal mix, according to
the data related to the Index of Marginal Technology
published by GME (Gestore dei Mercati Energetici) for
the year 2014 [24], as suggested in a recent research
[5]. In other words, rather than considering an average
power mix, this study takes into account a mix
composed by the combination of energy sources and
technologies that have been marginal during the
charging time, in accordance with the hourly charging
profile shown in Fig. 2.
Thus, the recharging mix is the power mix that
would meet the demand of additional energy during the
hours in which the recharging process takes place. This
mix is characterised by a percentage of renewable
energy sources far below the national average mix and
it constitutes a high conservative assumption [5]).
The marginal technologies efficiency derive from
national official data [4] while emission factors for the
regulated pollutants emissions (CO2, NOx, SOx,
Particulate) of the thermal power plants are derived
from the annual declaration of the Italian EMAS
registered power plants [26]. Finally, the mix of natural
gas import has been corrected to reflect the Italian mix
of import, according to ENI declarations for year 2013
[27].

Electric Cars vs Diesel and Gasoline: A Comparative LCA Ranging from Micro-Car to Family Car
130
3. Results and Discussion: Life Cycle Impact Assessment
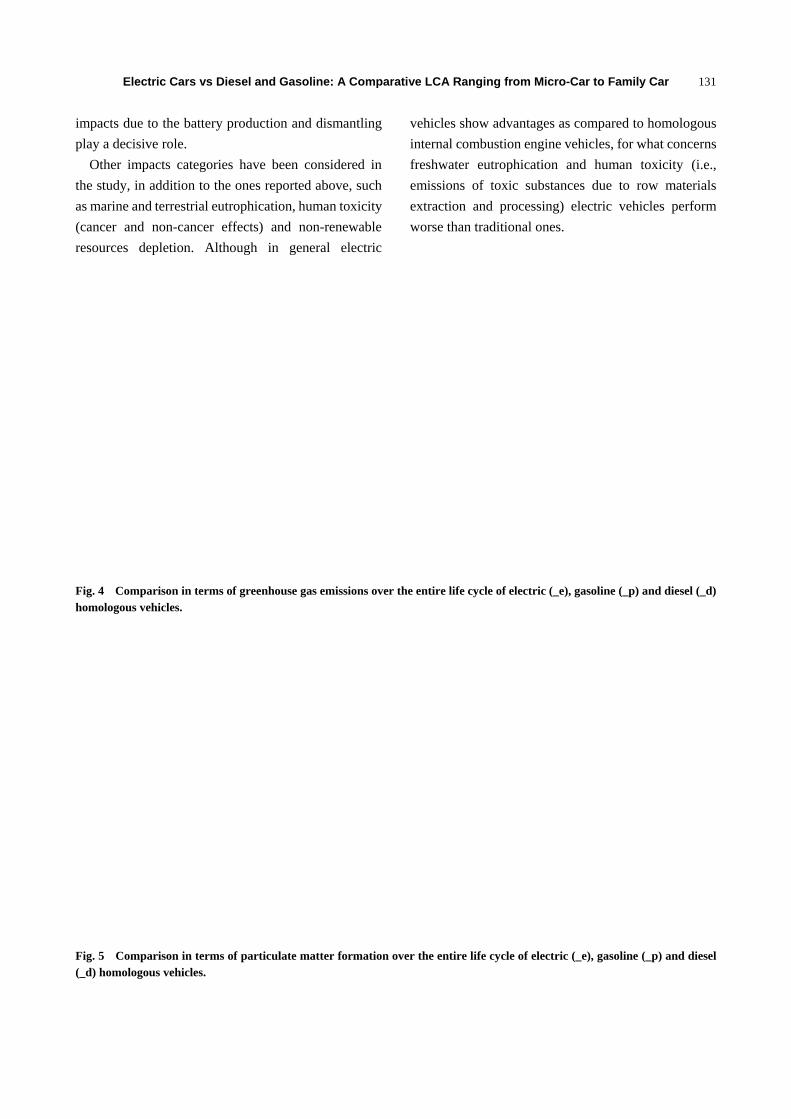
Under the assumptions described above, that
represent as good as possible the Italian context, the
study highlights that electric vehicles perform better
than traditional vehicles for what concerns greenhouse
gas emissions, as they are able to reduce by about half
these emissions if compared with homologous gasoline
vehicles (Fig. 4).
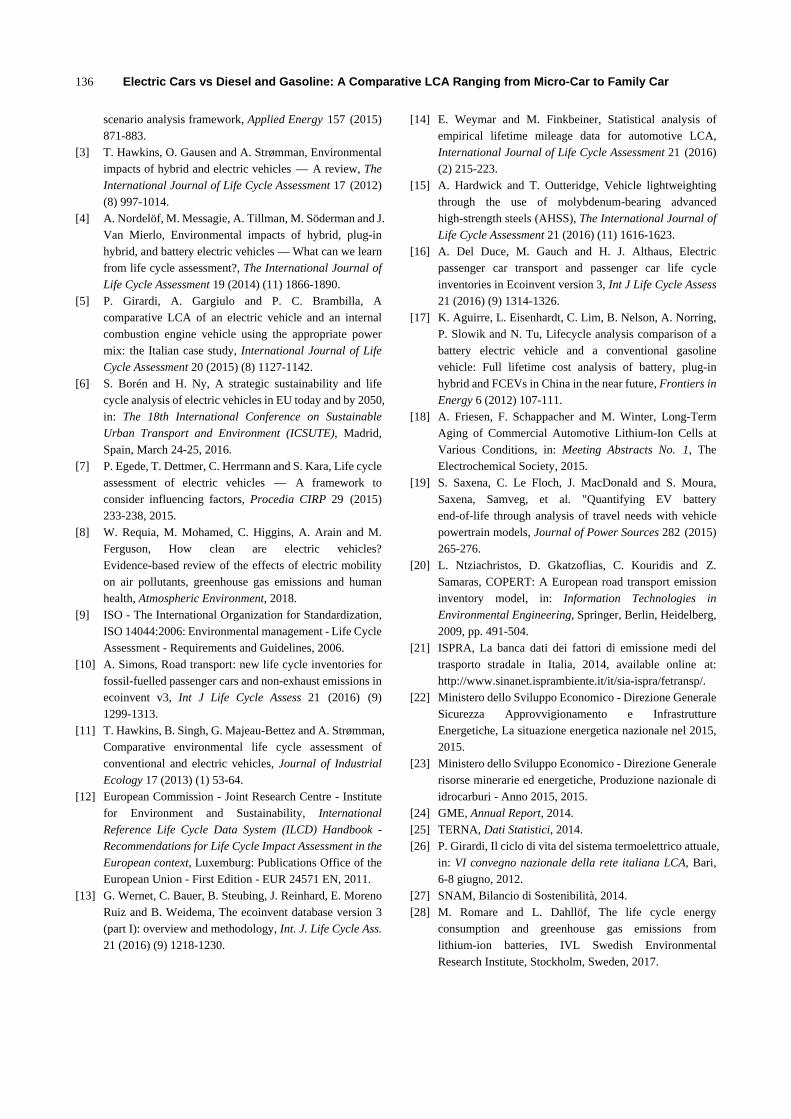
As regard particulate matter formation (Fig. 5
electric vehicles still perform better than both gasoline
and diesel ones. Exceptions are represented by Fiat 500
and Ford Focus. The Fiat 500 0.9 TwinAir (gasoline
fuelled) presents performances that are similar to the
electric model thanks to the high level of efficiency of
the gasoline model and because of the unusual (for its
segment) heavy weight of the electric version. As
regard Ford Focus, the electric model (2015 model) is
again really heavy for its category and this seriously
penalize the performances of the electric model if
compared to the internal combustion engine models.
Fig. 2 Hourly charging profile (as percentage of energy recharged) used for the electric vehicle.
Fig. 3 Mix 2014 considered in this study (on the right).
As regard photochemical ozone formation (Fig. 6 ),
electric vehicles clearly perform better than internal
combustion engine vehicles in all the analysed cases.
However, electric vehicles are not currently
competitive for indicators like freshwater
eutrophication or human toxicity, for which the
Electric Cars vs Diesel and Gasoline: A Comparative LCA Ranging from Micro-Car to Family Car
131
impacts due to the battery production and dismantling
play a decisive role.
Other impacts categories have been considered in
the study, in addition to the ones reported above, such
as marine and terrestrial eutrophication, human toxicity
(cancer and non-cancer effects) and non-renewable
resources depletion. Although in general electric
vehicles show advantages as compared to homologous
internal combustion engine vehicles, for what concerns
freshwater eutrophication and human toxicity (i.e.,
emissions of toxic substances due to row materials
extraction and processing) electric vehicles perform
worse than traditional ones.
Fig. 4 Comparison in terms of greenhouse gas emissions over the entire life cycle of electric (_e), gasoline (_p) and diesel (_d) homologous vehicles.
Fig. 5 Comparison in terms of particulate matter formation over the entire life cycle of electric (_e), gasoline (_p) and diesel (_d) homologous vehicles.

Electric Cars vs Diesel and Gasoline: A Comparative LCA Ranging from Micro-Car to Family Car
132
Fig. 6 Comparison in terms of Photochemical ozone formation over the entire life cycle of electric (_e), gasoline (_p) and diesel (_d) homologous vehicles.
It would be interesting, from a policy-maker point of
view, to compare technologies in terms not only of
per-phase contributions, but also of geographical
distribution of the impacts. This analysis has been
developed for the VW Golf models, considered as
representative of the most widely used middle size
vehicle on the market.
To this aim, the impacts have been allocated to four
areas:
• Italy, where the use phase of the vehicles takes
place, as well as the maintenance and end-of-life
of vehicles and Li-ion battery. Besides, also the
fossil fuels refining and distribution processes
take place in Italy;
• Germany, where VW Golf vehicles are
produced and the eGolf battery is actually
assembled;
• European Union, where most of the
semi-finished products (steel, glass, plastics, etc.)
are produced;
• Extra EU, where most of row materials and
fossil fuels come from and where the Li-ion
battery cells are produced (more specifically in
South Korea).
Fig. 7, Fig. 8 and Fig. 9, show the geographical
distribution of respectively CO2eq emissions,
particulate matter formation and photochemical ozone
formation. The figures indicate that, considering the
only impacts that take place in Italy leaves the ranking
among the vehicles performances unchanged.
Moreover, the “environmental” gap between the
electric vehicle and the traditional ones is even greater.
3.1 Sensitivity Analysis
The robustness of the results of the study has been
evaluated through a sensitivity analysis, as suggested
by the ISO 14040 for comparative LCAs. The
sensitivity analysis investigated the effect of
parameters that can heavily influence the
environmental performance of vehicles. The first
scenario considers that the electric vehicle is recharged
by photovoltaic production during the day (36% of the
total energy used in average by the electric vehicle) and
by the marginal power mix during the night. The
second scenario assumes a battery lifetime of 150000
km (regardless of the vehicles lifetime). Finally, the
third and fourth scenarios consider that the electric
vehicles lifetime are equal to the homologous gasoline
and diesel vehicles lifetime respectively.

Electric Cars vs Diesel and Gasoline: A Comparative LCA Ranging from Micro-Car to Family Car
133
Fig. 7 Geographical distribution of pollutant emissions that contribute to climate change.
Fig. 8 Geographical distribution of pollutant emissions that contribute to the particulate matter formation (PM2.5).
Fig. 9 Geographical distribution of pollutant emissions that contribute to the photochemical ozone formation (tropospheric ozone).
In all the analyzed scenarios, the ranking among the
vehicles performances remain unchanged. In other
words, even considering conditions adverse to electric
vehicles, internal combustion engine vehicles show
higher environmental impacts than electric ones, in
terms of both climate change and atmospheric

Electric Cars vs Diesel and Gasoline: A Comparative LCA Ranging from Micro-Car to Family Car
134
pollutants (i.e., particulate matter and tropospheric
ozone).
Particular attention has been paid, lately, to the
CO2eq emissions due to the battery life cycle, even by
general press An illustrative example is represented by:
https://www.focus.it/tecnologia/motori/quanto-
inquina-davvero-l-auto-elettrica.
Most of these communications refer to a recent study
[28] that identifies a very wide range of variation for
emissions of CO2eq due to the battery production.
Under the assumptions discussed above and with
reference to the data published by Ecoinvent v3, we
estimated for the production and dismantling processes
of the eGolf 2016 a CO2eq emission of about 2 t (1972
kg). It should be noted that the allocation system used
for this study is the one called Ecoinvent default
(APOS, at the point of substitution) and provides that
about the 25% of the material constituting the battery
can be recovered and reused for the production of new
batteries. This battery is characterised by a capacity of
24.2 kWh and a weight of 312 kg. This means that the
specific emissions of CO2eq is equal to about 81.5 kg
CO2eq/kWh of capacity or 6.3 CO2eq/kg of battery.
According to our hypotheses and assuming that the
average distance travelled could be reasonably set to
15000 km, the pay-back time for the surplus of CO2eq
emissions due to the battery lifecycle could be set in
about one year of vehicle use (seeFig. 10).
The above-mentioned study [28] indicates 115-200 kg
CO2eq/kWh as a more realistic range of values. The
latter value is almost three times higher than the one
used in the present study (81.5 kg CO2eq/kWh). The
reasons for this difference could be various, but it
should be surely noted that [5] considers technologies
available in a period from 2011 to 2016 and that more
recent studies considered in their review show lower
values. Anyway, in a sensitivity analysis perspective,
even considering a value of 200 kg CO2eq/kWh (see
“battery max” in Fig. 11) it can be seen that the CO2eq
emissions due to the battery life cycle do not
compromise the advantages of the electric vehicle use.
Fig. 10 Pay-back time for the surplus of CO2eq emissions per life cycle phases due to the battery lifecycle. Assuming that the average distance travelled is 15000 km, the pay-back time is equal to about 1 year.
Fig. 11 CO2eq emissions due to the battery lifecycle. The value associated to “battery” is referred to a battery with specific emissions of 81.5 kg CO2eq/kWh capacity, while “battery-max” + “battery” is referred to a battery with specific emissions of 200 kg CO2eq/kWh capacity.

Electric Cars vs Diesel and Gasoline: A Comparative LCA Ranging from Micro-Car to Family Car
135
Besides, it should be noted that, in order to assess
future scenarios, it may not be entirely justifiable to
extrapolate emissions data referred to the kWh of the
battery capacity.
If this kind of analysis is appropriate for the
evaluation of technological alternatives ceteris paribus,
this is not true if the aim of the analysis is to determine
future emissions of greater batteries (from 50 or 100
kWh). Indeed, emissions due to the battery life cycle
strongly depend more on materials used to produce the
battery itself (and thus on the battery weight) rather
than on the energy density of the battery. In other
words, for a given weight, the more the energy density
of the battery grows, the more the battery capacity
grows. As a consequence, CO2eq emissions due to
battery production and dismantling are likely to remain
almost unchanged or at least to have a less than linear
growth with capacity. A concrete example is
represented by the 2016 eGolf (considered in this study)
that is equipped with a battery of 24.2 kWh capacity,
with a weight of 312 kg. The 2017 version of the
vehicle is equipped with a battery of 35.8 kWh capacity
(almost 50% more than 2016), with a weight of 318 kg.
Moreover, Kreisel Electric 3 claims to be able to
produce a battery of 55.7 kWh capacity, with a weight
of 330 kg and a lifetime of more than 400000 km.
4. Conclusion
The analysis carried out confirms that, for all the
considered sizes – from micro cars to family cars,
passing through small and compact, electric vehicles
present environmental impacts lower than the
homologous internal combustion engine vehicles. This
is particularly true if we consider Climate Change and
pollutants emissions that contribute to impact
categories such as Particulate Matter formation, Air
Acidification or Photochemical Ozone formation.
Moreover, regardless of the size, electric vehicles are
not able to prevail, at present, for aspects that concern
Freshwater Eutrophication or Human Toxicity for 3 http://www.kreiselelectric.com/en/projects/electric-golf/.
which an important role is played by the impacts due to
the battery life cycle. In general, the environmental
impacts of the electric vehicles are dependent on the
vehicle weight (that influences both consumptions and
vehicles production). In that regard, it should be
pointed out that this study considers electric vehicles
that are derived from the homologous internal
combustion engine versions rather than specifically
designed.. The choice of the vehicles has been driven
by the goal of comparing electric vehicles with
homologous diesel and gasoline vehicles that were
present on the market, i.e. offering, as far as possible,
the same service to users. One interesting point for
future studies should be to investigate the
environmental performances of vehicles designed ex
novo, examining in depth aspects concerning vehicle
design and materials used, especially in the production
phase of the vehicle. Nevertheless, this consideration
opens the issue of how to consider cross technological
improvements, namely those improvements (i.e., low
rolling resistance tyres, body in carbon fibre) that could
be applied also to internal combustion engine vehicles,
being independent from the propulsion system.
Acknowledgments
This work has been financed by the Research Fund
for the Italian Electrical System under the Contract
Agreement between RSE S.p.A. and the Ministry of
Economic Development — General Directorate for
the Electricity Market, Renewable Energy and Energy
Efficiency, Nuclear Energy in compliance with the
Decree of March 8, 2006.
References
[1] G. Jungmeier, J. Dunn, A. Elgowainy, E. Ozdemir, S. Ehrenberger, H. Althaus and R. Widmer, Key issues in life cycle assessment of electric vehicles—Findings in the International Energy Agency (IEA) on Hybrid and Electric Vehicles (HEV), in: Electric Vehicle Symposium and Exhibition (EVS27), World, 2013, pp. 1-7.
[2] C. Bauer, J. Hofer, H. Althaus, A. Del Duce and A. Simons, The environmental performance of current and future passenger vehicles: life cycle assessment based on a novel
Electric Cars vs Diesel and Gasoline: A Comparative LCA Ranging from Micro-Car to Family Car
136
scenario analysis framework, Applied Energy 157 (2015) 871-883.
[3] T. Hawkins, O. Gausen and A. Strømman, Environmental impacts of hybrid and electric vehicles — A review, The International Journal of Life Cycle Assessment 17 (2012) (8) 997-1014.
[4] A. Nordelöf, M. Messagie, A. Tillman, M. Söderman and J. Van Mierlo, Environmental impacts of hybrid, plug-in hybrid, and battery electric vehicles — What can we learn from life cycle assessment?, The International Journal of Life Cycle Assessment 19 (2014) (11) 1866-1890.
[5] P. Girardi, A. Gargiulo and P. C. Brambilla, A comparative LCA of an electric vehicle and an internal combustion engine vehicle using the appropriate power mix: the Italian case study, International Journal of Life Cycle Assessment 20 (2015) (8) 1127-1142.
[6] S. Borén and H. Ny, A strategic sustainability and life cycle analysis of electric vehicles in EU today and by 2050, in: The 18th International Conference on Sustainable Urban Transport and Environment (ICSUTE), Madrid, Spain, March 24-25, 2016.
[7] P. Egede, T. Dettmer, C. Herrmann and S. Kara, Life cycle assessment of electric vehicles — A framework to consider influencing factors, Procedia CIRP 29 (2015) 233-238, 2015.
[8] W. Requia, M. Mohamed, C. Higgins, A. Arain and M. Ferguson, How clean are electric vehicles? Evidence-based review of the effects of electric mobility on air pollutants, greenhouse gas emissions and human health, Atmospheric Environment, 2018.
[9] ISO - The International Organization for Standardization, ISO 14044:2006: Environmental management - Life Cycle Assessment - Requirements and Guidelines, 2006.
[10] A. Simons, Road transport: new life cycle inventories for fossil-fuelled passenger cars and non-exhaust emissions in ecoinvent v3, Int J Life Cycle Assess 21 (2016) (9) 1299-1313.
[11] T. Hawkins, B. Singh, G. Majeau-Bettez and A. Strømman, Comparative environmental life cycle assessment of conventional and electric vehicles, Journal of Industrial Ecology 17 (2013) (1) 53-64.
[12] European Commission - Joint Research Centre - Institute for Environment and Sustainability, International Reference Life Cycle Data System (ILCD) Handbook - Recommendations for Life Cycle Impact Assessment in the European context, Luxemburg: Publications Office of the European Union - First Edition - EUR 24571 EN, 2011.
[13] G. Wernet, C. Bauer, B. Steubing, J. Reinhard, E. Moreno Ruiz and B. Weidema, The ecoinvent database version 3 (part I): overview and methodology, Int. J. Life Cycle Ass. 21 (2016) (9) 1218-1230.
[14] E. Weymar and M. Finkbeiner, Statistical analysis of empirical lifetime mileage data for automotive LCA, International Journal of Life Cycle Assessment 21 (2016) (2) 215-223.
[15] A. Hardwick and T. Outteridge, Vehicle lightweighting through the use of molybdenum-bearing advanced high-strength steels (AHSS), The International Journal of Life Cycle Assessment 21 (2016) (11) 1616-1623.
[16] A. Del Duce, M. Gauch and H. J. Althaus, Electric passenger car transport and passenger car life cycle inventories in Ecoinvent version 3, Int J Life Cycle Assess 21 (2016) (9) 1314-1326.
[17] K. Aguirre, L. Eisenhardt, C. Lim, B. Nelson, A. Norring, P. Slowik and N. Tu, Lifecycle analysis comparison of a battery electric vehicle and a conventional gasoline vehicle: Full lifetime cost analysis of battery, plug-in hybrid and FCEVs in China in the near future, Frontiers in Energy 6 (2012) 107-111.
[18] A. Friesen, F. Schappacher and M. Winter, Long-Term Aging of Commercial Automotive Lithium-Ion Cells at Various Conditions, in: Meeting Abstracts No. 1, The Electrochemical Society, 2015.
[19] S. Saxena, C. Le Floch, J. MacDonald and S. Moura, Saxena, Samveg, et al. "Quantifying EV battery end-of-life through analysis of travel needs with vehicle powertrain models, Journal of Power Sources 282 (2015) 265-276.
[20] L. Ntziachristos, D. Gkatzoflias, C. Kouridis and Z. Samaras, COPERT: A European road transport emission inventory model, in: Information Technologies in Environmental Engineering, Springer, Berlin, Heidelberg, 2009, pp. 491-504.
[21] ISPRA, La banca dati dei fattori di emissione medi del trasporto stradale in Italia, 2014, available online at: http://www.sinanet.isprambiente.it/it/sia-ispra/fetransp/.
[22] Ministero dello Sviluppo Economico - Direzione Generale Sicurezza Approvvigionamento e Infrastrutture Energetiche, La situazione energetica nazionale nel 2015, 2015.
[23] Ministero dello Sviluppo Economico - Direzione Generale risorse minerarie ed energetiche, Produzione nazionale di idrocarburi - Anno 2015, 2015.
[24] GME, Annual Report, 2014. [25] TERNA, Dati Statistici, 2014. [26] P. Girardi, Il ciclo di vita del sistema termoelettrico attuale,
in: VI convegno nazionale della rete italiana LCA, Bari, 6-8 giugno, 2012.
[27] SNAM, Bilancio di Sostenibilità, 2014. [28] M. Romare and L. Dahllöf, The life cycle energy
consumption and greenhouse gas emissions from lithium-ion batteries, IVL Swedish Environmental Research Institute, Stockholm, Sweden, 2017.
Related Documents