Diane Whitmore Schanzenbach, Lauren Bauer, and Audrey Breitwieser ECONOMIC FACTS | APRIL 2017 Eight Economic Facts on Higher Education WWW.HAMILTONPROJECT.ORG

Welcome message from author
This document is posted to help you gain knowledge. Please leave a comment to let me know what you think about it! Share it to your friends and learn new things together.
Transcript

Diane Whitmore Schanzenbach, Lauren Bauer, and Audrey Breitwieser
ECONOMIC FACTS | APRIL 2017
Eight Economic Facts on Higher Education
W W W . H A M I L T O N P R O J E C T . O R G
The Hamilton Project seeks to advance America’s promise of
opportunity, prosperity, and growth. The Project’s economic
strategy reflects a judgment that long-term prosperity is best
achieved by fostering economic growth and broad participation
in that growth, by enhancing individual economic security, and by
embracing a role for effective government in making needed public
investments. We believe that today’s increasingly competitive
global economy requires public policy ideas commensurate with
the challenges of the 21st century. Our strategy calls for combining
increased public investments in key growth-enhancing areas, a
secure social safety net, and fiscal discipline. In that framework,
the Project puts forward innovative proposals from leading
economic thinkers — based on credible evidence and experience,
not ideology or doctrine — to introduce new and effective policy
options into the national debate.
The Project is named after Alexander Hamilton, the nation’s
first treasury secretary, who laid the foundation for the modern
American economy. Consistent with the guiding principles of
the Project, Hamilton stood for sound fiscal policy, believed
that broad-based opportunity for advancement would drive
American economic growth, and recognized that “prudent aids
and encouragements on the part of government” are necessary to
enhance and guide market forces.
MISSION STATEMENT
The Hamilton Project is grateful to Matthew Chingos, David Dreyer,
Joy Fox, Robert Kelchen, Ofer Malamud, Kriston McIntosh, and
Ryan Nunn for their insightful comments and discussions, as
well as to Laura Giuilano, Ayushi Narayan, and Gregory Fortelny
for providing the data for figure 6. Finally, it is grateful to Megan
Mumford, Greg Nantz, and William Pratt for excellent research
assistance.
ACKNOWLEDGMENTS

The Hamilton Project • Brookings i
Eight Economic Facts on Higher Education
Introduction
Higher education provides extensive benefits to students, including higher wages, better health, and a lower likelihood of requiring disability payments (Oreopoulos and Petronijevic 2013). A population that is more highly educated also confers wide-ranging benefits to the economy, such as lower rates of unemployment (Greenstone and Looney 2011) and higher wages even for workers without college degrees (Moretti 2004).
A postsecondary degree can also serve as a buffer against unemployment during economic downturns. Those with postsecondary degrees saw more steady employment through the Great Recession (Autor 2014), and the vast majority of net jobs created during the economic recovery went to college-educated workers (Carnevale, Jayasundera, and Gulish 2016).
In recognition of the personal and social benefits of higher education, the federal government provides incentives to young people to attain a higher education credential, as well as policies that encourage additional training, reskilling, on-the-job professional development, or credentialing after a spell in the labor market. A large and growing number of Americans participate in these programs. In the fall of 2015, about 20 million students were enrolled in degree-granting institutions of higher education, double the 8.5 million enrolled in the fall of 1970 (National Center for Education Statistics [NCES] 2015, 2016).
The higher education sector itself is an important piece of the U.S. economy. In the fall of 2013, institutions of higher education that participated in Title IV federal financial aid programs employed almost 4 million people (NCES 2015). The higher education sector also confers a large advantage to the United States in the global market for talent. In the 2015–16 academic year, more than 1 million international students studied at U.S. colleges and universities. These students contributed more than $32 billion to the economy and supported more than 400,000 jobs (NAFSA 2016).
Diane Whitmore Schanzenbach, Lauren Bauer, and Audrey Breitwieser
ii Eight Economic Facts on Higher Education
Introduction continued from page i
The substantial federal and state support for higher education flows both through students and directly to public institutions. State support for public institutions of higher education made up an average of 10.1 percent of state budgets in fiscal year 2016, at a total cost of $197 billion (National Association of State Budget Officers [NASBO] 2016, tables 12 and 13). Federal grants and loans to students peaked at $192 billion in the 2010–11 school year.
The investment calculation that students make when deciding whether and where to enroll in postsecondary education involves determining the amount the student will need to borrow to finance her degree, and the value that the degree itself will provide in enabling the student to pay down her education-related debt. In the fourth quarter of 2016
outstanding student loan debt was second only to mortgage debt in total volume, at $1.31 trillion (Federal Reserve Bank of New York 2017). On the other hand, two thirds of undergraduate borrowers borrow less than $20,000 to finance their education (CEA 2016).
The Hamilton Project has previously offered analysis on related topics, including education and economic opportunity (Schanzenbach et al. 2016), education and social mobility (Greenstone et al. 2013), and K–12 education (Greenstone et al. 2012), highlighting the central role that education plays in supporting broad-based economic growth. In these Economic Facts, the Hamilton Project offers evidence of the value a postsecondary education has to people and to the economy.
The Hamilton Project • Brookings iii
Table of Contents
INTRODUCTION i
FACTS
1. The median lifetime earnings for individuals with bachelor’s degrees are twice that 1 of those with high school diplomas.
2. Federal tax credits generally do not increase college enrollment. 2
3. For the past twenty years, women have outpaced men in college attendance and 3 degree attainment.
4. More than a quarter of low-income students who enroll in a four-year institution 4 drop out by the end of the second year.
5. Student financial aid has increased dramatically over the past 15 years, while state 5 direct aid to institutions has stagnated.
6. Two thirds of undergraduate borrowers receive less than $20,000 in loans and 6 90 percent borrow less than $40,000.
7. In 2015, 3.5 million students over the age of 30 were enrolled in higher education. 7
8. The vast majority of defaulters have less than $10,000 in student loan debt. 8
TECHNICAL APPENDIX 9
REFERENCES 10
SELECTED HAMILTON PROJECT PAPERS ON EDUCATION 12

iv Eight Economic Facts on Higher Education
The Hamilton Project • Brookings 1
The median lifetime earnings for individuals with bachelor’s degrees are twice that of those with high school diplomas.
1.
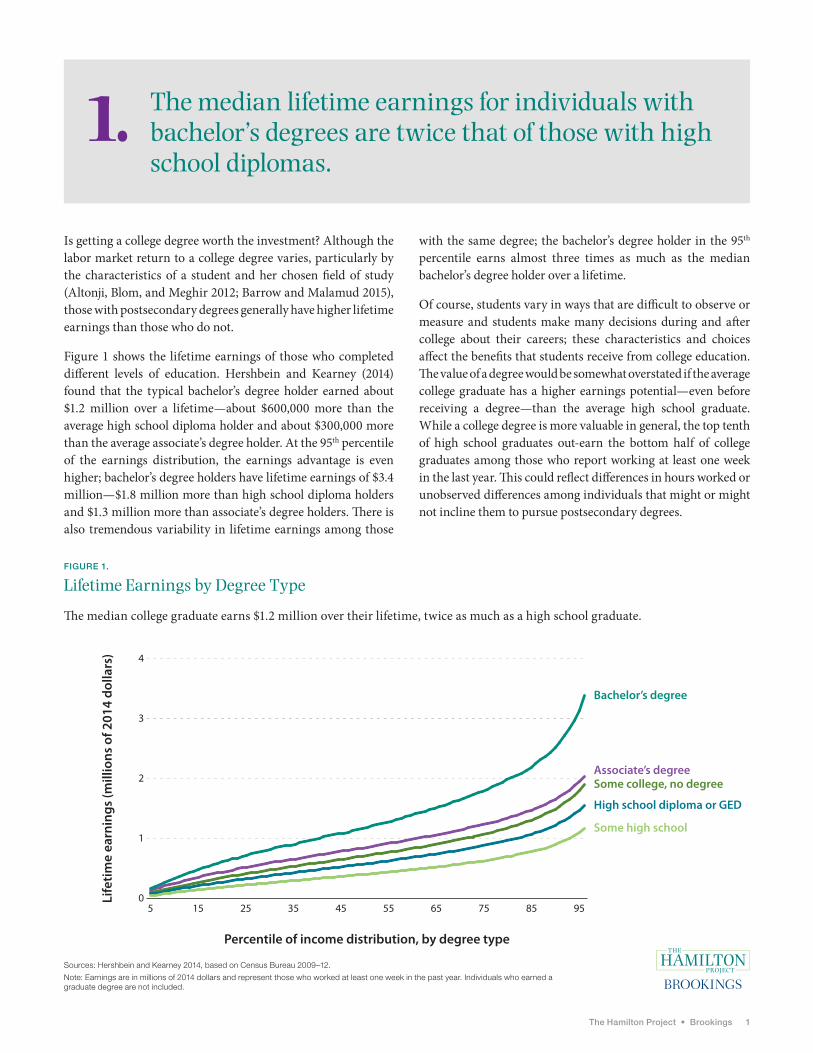
Is getting a college degree worth the investment? Although the labor market return to a college degree varies, particularly by the characteristics of a student and her chosen field of study (Altonji, Blom, and Meghir 2012; Barrow and Malamud 2015), those with postsecondary degrees generally have higher lifetime earnings than those who do not.
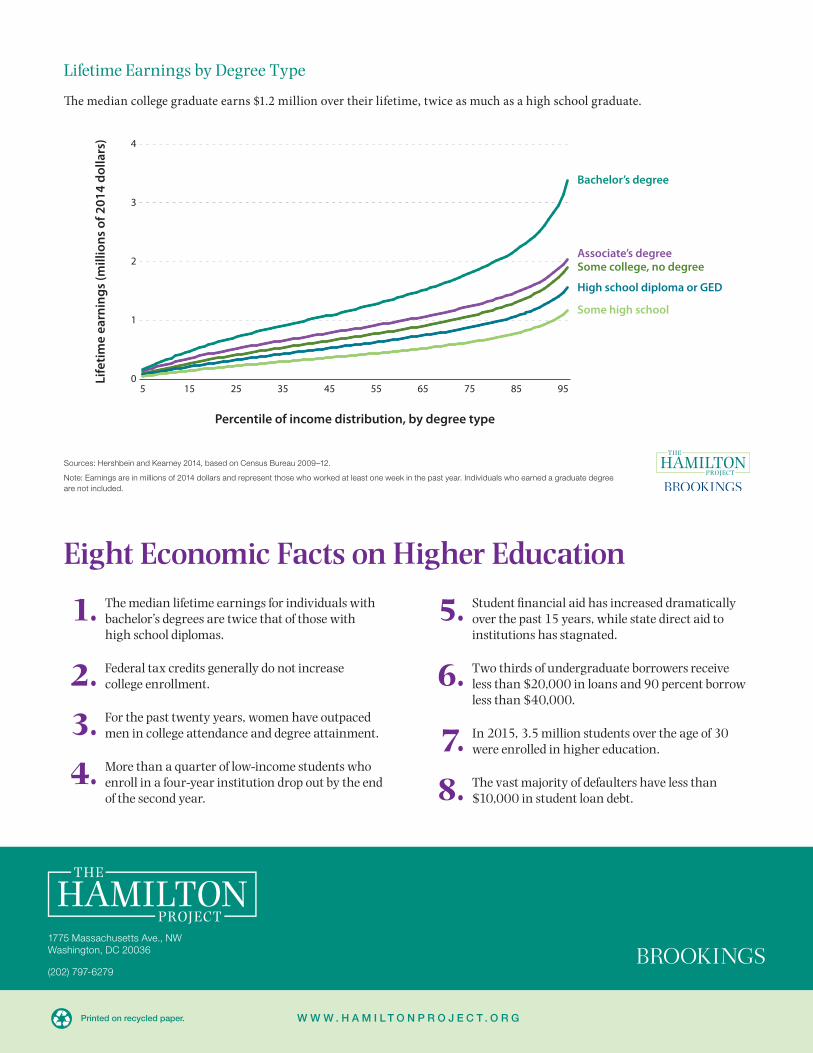
Figure 1 shows the lifetime earnings of those who completed different levels of education. Hershbein and Kearney (2014) found that the typical bachelor’s degree holder earned about $1.2 million over a lifetime—about $600,000 more than the average high school diploma holder and about $300,000 more than the average associate’s degree holder. At the 95th percentile of the earnings distribution, the earnings advantage is even higher; bachelor’s degree holders have lifetime earnings of $3.4 million—$1.8 million more than high school diploma holders and $1.3 million more than associate’s degree holders. There is also tremendous variability in lifetime earnings among those
with the same degree; the bachelor’s degree holder in the 95th percentile earns almost three times as much as the median bachelor’s degree holder over a lifetime.
Of course, students vary in ways that are difficult to observe or measure and students make many decisions during and after college about their careers; these characteristics and choices affect the benefits that students receive from college education. The value of a degree would be somewhat overstated if the average college graduate has a higher earnings potential—even before receiving a degree—than the average high school graduate. While a college degree is more valuable in general, the top tenth of high school graduates out-earn the bottom half of college graduates among those who report working at least one week in the last year. This could reflect differences in hours worked or unobserved differences among individuals that might or might not incline them to pursue postsecondary degrees.
FIGURE 1.
Lifetime Earnings by Degree Type
The median college graduate earns $1.2 million over their lifetime, twice as much as a high school graduate.
Sources: Hershbein and Kearney 2014, based on Census Bureau 2009–12.
Note: Earnings are in millions of 2014 dollars and represent those who worked at least one week in the past year. Individuals who earned a graduate degree are not included.
Some high school
Associate’s degreeSome college, no degree
High school diploma or GED
Bachelor’s degree
Life
time
earn
ings
(mill
ions
of 2
014
dolla
rs)
Percentile of income distribution, by degree type
0
1
2
3
4
5 15 25 35 45 55 65 75 85 95
2 Eight Economic Facts on Higher Education
Federal tax credits generally do not increase college enrollment.2.
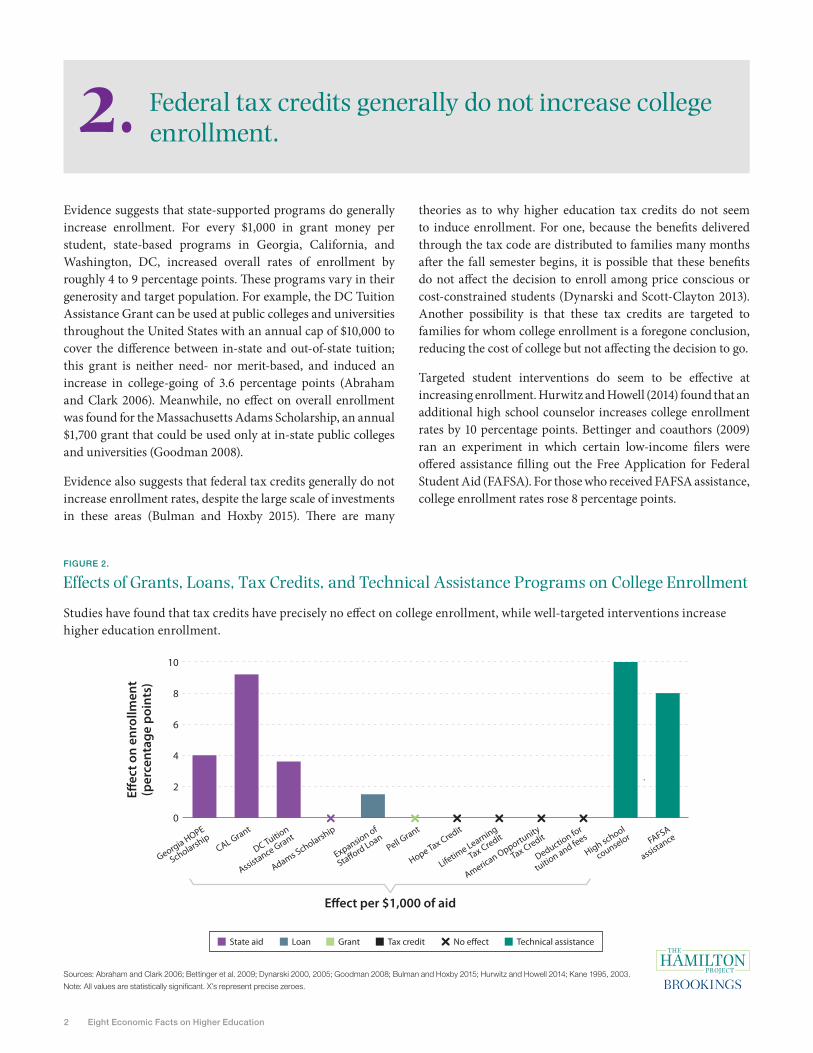
Evidence suggests that state-supported programs do generally increase enrollment. For every $1,000 in grant money per student, state-based programs in Georgia, California, and Washington, DC, increased overall rates of enrollment by roughly 4 to 9 percentage points. These programs vary in their generosity and target population. For example, the DC Tuition Assistance Grant can be used at public colleges and universities throughout the United States with an annual cap of $10,000 to cover the difference between in-state and out-of-state tuition; this grant is neither need- nor merit-based, and induced an increase in college-going of 3.6 percentage points (Abraham and Clark 2006). Meanwhile, no effect on overall enrollment was found for the Massachusetts Adams Scholarship, an annual $1,700 grant that could be used only at in-state public colleges and universities (Goodman 2008).
Evidence also suggests that federal tax credits generally do not increase enrollment rates, despite the large scale of investments in these areas (Bulman and Hoxby 2015). There are many
theories as to why higher education tax credits do not seem to induce enrollment. For one, because the benefits delivered through the tax code are distributed to families many months after the fall semester begins, it is possible that these benefits do not affect the decision to enroll among price conscious or cost-constrained students (Dynarski and Scott-Clayton 2013). Another possibility is that these tax credits are targeted to families for whom college enrollment is a foregone conclusion, reducing the cost of college but not affecting the decision to go.
Targeted student interventions do seem to be effective at increasing enrollment. Hurwitz and Howell (2014) found that an additional high school counselor increases college enrollment rates by 10 percentage points. Bettinger and coauthors (2009) ran an experiment in which certain low-income filers were offered assistance filling out the Free Application for Federal Student Aid (FAFSA). For those who received FAFSA assistance, college enrollment rates rose 8 percentage points.
FIGURE 2.
Effects of Grants, Loans, Tax Credits, and Technical Assistance Programs on College Enrollment
Studies have found that tax credits have precisely no effect on college enrollment, while well-targeted interventions increase higher education enrollment.
Sources: Abraham and Clark 2006; Bettinger et al. 2009; Dynarski 2000, 2005; Goodman 2008; Bulman and Hoxby 2015; Hurwitz and Howell 2014; Kane 1995, 2003.
Note: All values are statistically significant. X’s represent precise zeroes.
0
2
4
6
8
10
No e�ect
E�ect per $1,000 of aid
E�ec
t on
enro
llmen
t(p
erce
ntag
e po
ints
)
FAFSA
assistance
High school
counselor
Deduction for
tuition and fees
American Opportunity
Tax Credit
Lifetime Learning
Tax Credit
Hope Tax Credit
Pell Grant
Expansion of
Sta�ord Loan
Adams Scholarship
DC Tuition
Assistance GrantCAL Grant
Georgia HOPE
Scholarship
State aid Loan Grant Tax credit Technical assistance

The Hamilton Project • Brookings 3
For the past twenty years, women have outpaced men in college attendance and degree attainment.3.
Figure 3a shows rates of enrollment in two- and four-year degree programs among 18–24 year-olds. Since 1980, enrollment rates among men have increased by almost 11 percentage points. In 1991, rates of college enrollment among women overtook those of men, and have increased by almost 18 percentage points since 1980. Since 2000, enrollment rates for women at two- and four-year institutions have been about 6 percentage points higher than for men.
Figure 3b shows rates of four-year degree attainment among 25–29 year-olds. Women have overtaken men in rates of four-year degree attainment, increasing by 16 percentage points since 1980. In the last three decades, four-year degree attainment rates have increased by 7 percentage points among men, reaching just over 30 percent in 2014.
It is critical to note that these figures represent rates of enrollment among all 18–24 year-olds and rates of four-year attainment among all 25–29 year-olds. These calculations are not conditional on completing high school or on having even attempted postsecondary education, nor do they capture those who enrolled in or attained a four-year degree outside of the age-range, or who attained a different postsecondary credential. Bailey and Dynarski (2011) and Bound, Lovenheim, and Turner (2010) have found that as overall rates of enrollment have rsien, rates of completion have stalled. Fact 7 documents that many students over the age of 25 are enrolling in postsecondary education, and fact 4 reports that low-income students are disproportionately likely to drop out of postsecondary programs without a credential.
Since 1980, four-year degree attainment rates have increased 7 percentage points among men and 16 percentage points among women.
FIGURE 3A.
Rates of Postsecondary Enrollment by Gender, 1980–2014
FIGURE 3B.
Rates of Four-Year Degree Completion by Gender, 1980–2014
Source: NCES 2015.
Perc
ent e
nrol
led,
age
s 18
–24
Perc
ent c
ompl
eted
, age
s 25
–29
0
10
20
30
40
50
0
10
20
30
40
50
1980 1990 2000 2010 2014 1980 1990 2000 2010 2014
Men Women
4 Eight Economic Facts on Higher Education
More than a quarter of low-income students who enroll in a four-year institution drop out by the end of the second year.
4.
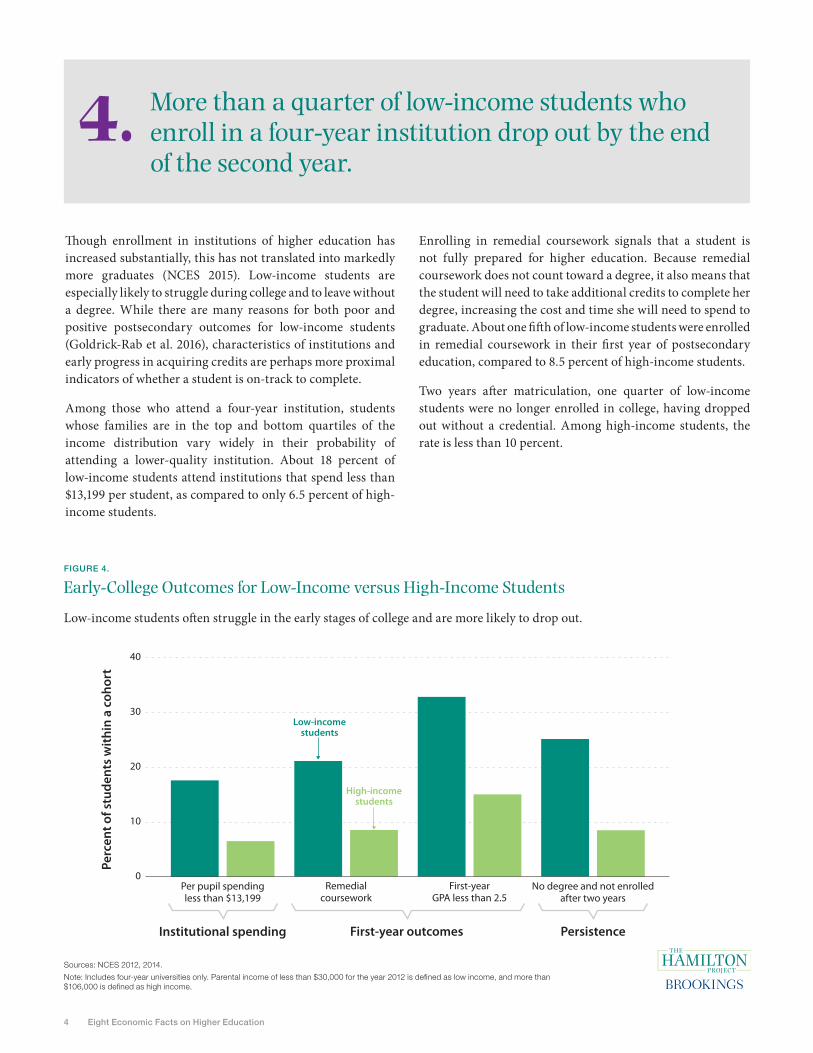
Though enrollment in institutions of higher education has increased substantially, this has not translated into markedly more graduates (NCES 2015). Low-income students are especially likely to struggle during college and to leave without a degree. While there are many reasons for both poor and positive postsecondary outcomes for low-income students (Goldrick-Rab et al. 2016), characteristics of institutions and early progress in acquiring credits are perhaps more proximal indicators of whether a student is on-track to complete.
Among those who attend a four-year institution, students whose families are in the top and bottom quartiles of the income distribution vary widely in their probability of attending a lower-quality institution. About 18 percent of low-income students attend institutions that spend less than $13,199 per student, as compared to only 6.5 percent of high-income students.
Enrolling in remedial coursework signals that a student is not fully prepared for higher education. Because remedial coursework does not count toward a degree, it also means that the student will need to take additional credits to complete her degree, increasing the cost and time she will need to spend to graduate. About one fifth of low-income students were enrolled in remedial coursework in their first year of postsecondary education, compared to 8.5 percent of high-income students.
Two years after matriculation, one quarter of low-income students were no longer enrolled in college, having dropped out without a credential. Among high-income students, the rate is less than 10 percent.
FIGURE 4.
Early-College Outcomes for Low-Income versus High-Income Students
Low-income students often struggle in the early stages of college and are more likely to drop out.
Sources: NCES 2012, 2014.
Note: Includes four-year universities only. Parental income of less than $30,000 for the year 2012 is defined as low income, and more than $106,000 is defined as high income.
Low-incomestudents
High-incomestudents
Per pupil spendingless than $13,199
Institutional spending
Remedialcoursework
First-yearGPA less than 2.5
No degree and not enrolledafter two years
Persistence
Perc
ent o
f stu
dent
s w
ithin
a c
ohor
t
First-year outcomes
0
10
20
30
40
The Hamilton Project • Brookings 5
Student financial aid has increased dramatically over the past 15 years, while state direct aid to institutions has stagnated.
5.
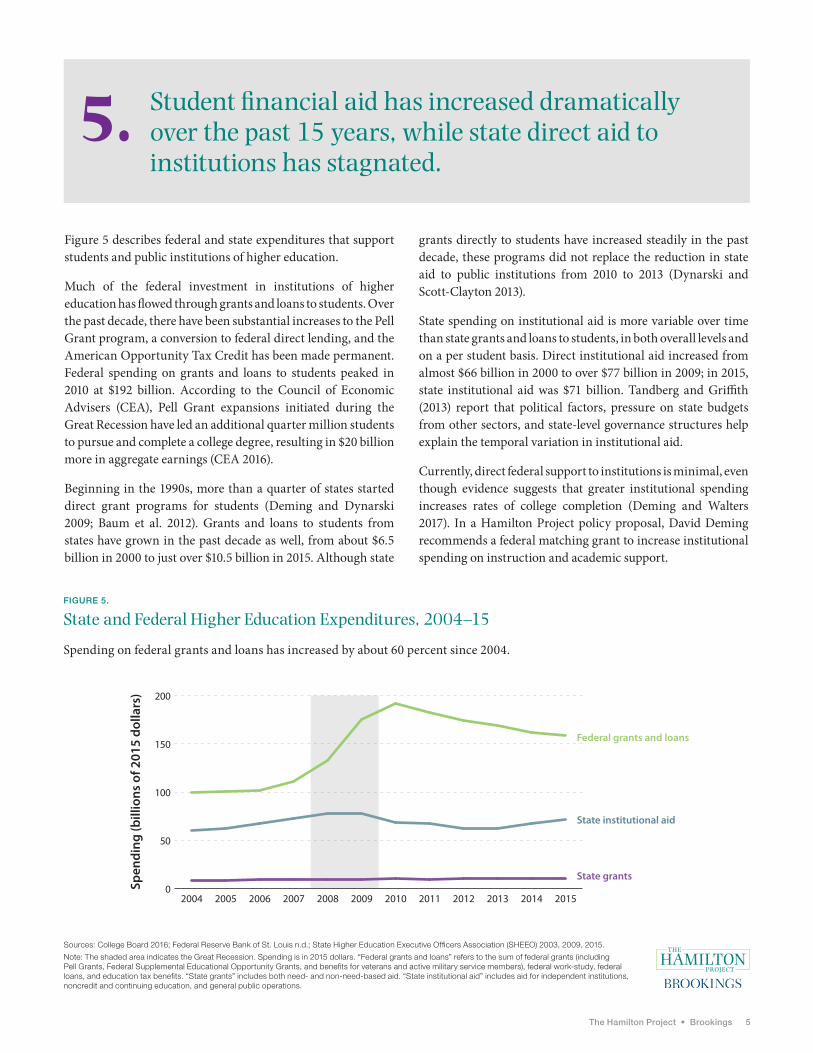
Figure 5 describes federal and state expenditures that support students and public institutions of higher education.
Much of the federal investment in institutions of higher education has flowed through grants and loans to students. Over the past decade, there have been substantial increases to the Pell Grant program, a conversion to federal direct lending, and the American Opportunity Tax Credit has been made permanent. Federal spending on grants and loans to students peaked in 2010 at $192 billion. According to the Council of Economic Advisers (CEA), Pell Grant expansions initiated during the Great Recession have led an additional quarter million students to pursue and complete a college degree, resulting in $20 billion more in aggregate earnings (CEA 2016).
Beginning in the 1990s, more than a quarter of states started direct grant programs for students (Deming and Dynarski 2009; Baum et al. 2012). Grants and loans to students from states have grown in the past decade as well, from about $6.5 billion in 2000 to just over $10.5 billion in 2015. Although state
grants directly to students have increased steadily in the past decade, these programs did not replace the reduction in state aid to public institutions from 2010 to 2013 (Dynarski and Scott-Clayton 2013).
State spending on institutional aid is more variable over time than state grants and loans to students, in both overall levels and on a per student basis. Direct institutional aid increased from almost $66 billion in 2000 to over $77 billion in 2009; in 2015, state institutional aid was $71 billion. Tandberg and Griffith (2013) report that political factors, pressure on state budgets from other sectors, and state-level governance structures help explain the temporal variation in institutional aid.
Currently, direct federal support to institutions is minimal, even though evidence suggests that greater institutional spending increases rates of college completion (Deming and Walters 2017). In a Hamilton Project policy proposal, David Deming recommends a federal matching grant to increase institutional spending on instruction and academic support.
FIGURE 5.
State and Federal Higher Education Expenditures, 2004–15
Spending on federal grants and loans has increased by about 60 percent since 2004.
Sources: College Board 2016; Federal Reserve Bank of St. Louis n.d.; State Higher Education Executive Officers Association (SHEEO) 2003, 2009, 2015.
Note: The shaded area indicates the Great Recession. Spending is in 2015 dollars. “Federal grants and loans” refers to the sum of federal grants (including Pell Grants, Federal Supplemental Educational Opportunity Grants, and benefits for veterans and active military service members), federal work-study, federal loans, and education tax benefits. “State grants” includes both need- and non-need-based aid. “State institutional aid” includes aid for independent institutions, noncredit and continuing education, and general public operations.
2004 2005 2006 2007 2008 2009 2010 2011 2012 2013 2014 2015
Federal grants and loans
State grants
State institutional aid
Spen
ding
(bill
ions
of 2
015
dolla
rs)
0
50
100
150
200
6 Eight Economic Facts on Higher Education
Two thirds of undergraduate borrowers receive less than $20,000 in loans and 90 percent borrow less than $40,000.
6.
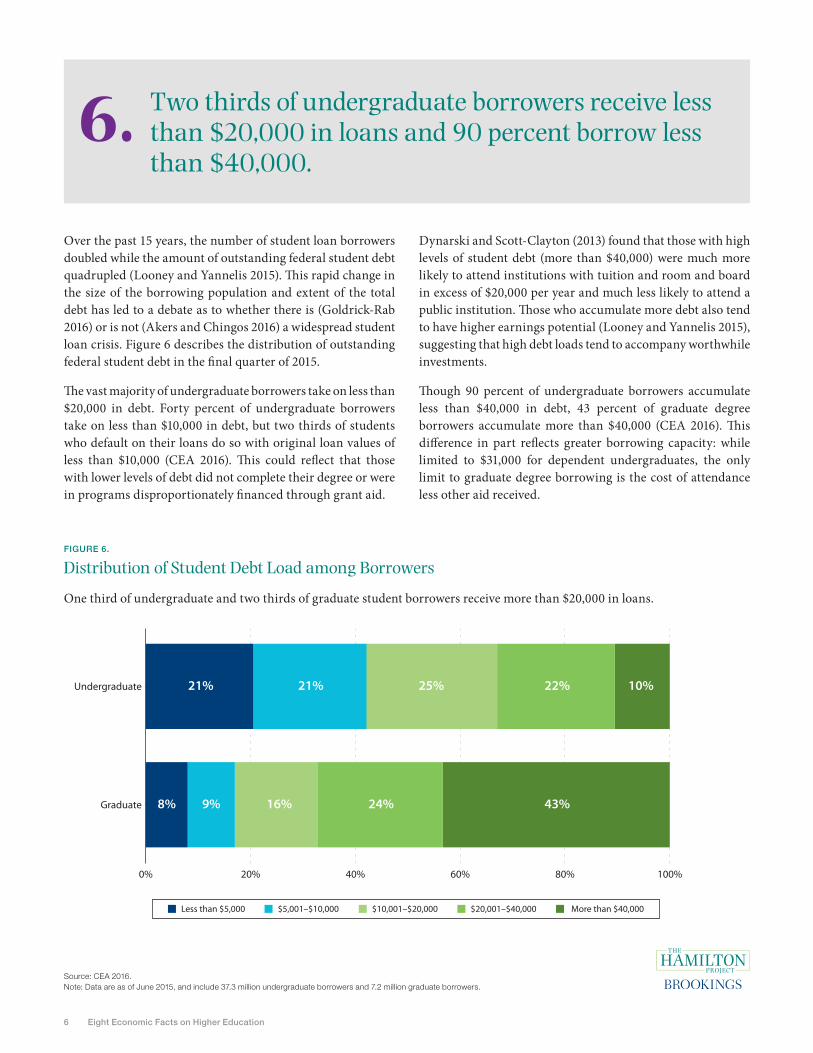
Over the past 15 years, the number of student loan borrowers doubled while the amount of outstanding federal student debt quadrupled (Looney and Yannelis 2015). This rapid change in the size of the borrowing population and extent of the total debt has led to a debate as to whether there is (Goldrick-Rab 2016) or is not (Akers and Chingos 2016) a widespread student loan crisis. Figure 6 describes the distribution of outstanding federal student debt in the final quarter of 2015.
The vast majority of undergraduate borrowers take on less than $20,000 in debt. Forty percent of undergraduate borrowers take on less than $10,000 in debt, but two thirds of students who default on their loans do so with original loan values of less than $10,000 (CEA 2016). This could reflect that those with lower levels of debt did not complete their degree or were in programs disproportionately financed through grant aid.
Dynarski and Scott-Clayton (2013) found that those with high levels of student debt (more than $40,000) were much more likely to attend institutions with tuition and room and board in excess of $20,000 per year and much less likely to attend a public institution. Those who accumulate more debt also tend to have higher earnings potential (Looney and Yannelis 2015), suggesting that high debt loads tend to accompany worthwhile investments.
Though 90 percent of undergraduate borrowers accumulate less than $40,000 in debt, 43 percent of graduate degree borrowers accumulate more than $40,000 (CEA 2016). This difference in part reflects greater borrowing capacity: while limited to $31,000 for dependent undergraduates, the only limit to graduate degree borrowing is the cost of attendance less other aid received.
FIGURE 6.
Distribution of Student Debt Load among Borrowers
One third of undergraduate and two thirds of graduate student borrowers receive more than $20,000 in loans.
Source: CEA 2016.Note: Data are as of June 2015, and include 37.3 million undergraduate borrowers and 7.2 million graduate borrowers.
Less than $5,000 $5,001–$10,000 $10,001–$20,000 $20,001–$40,000 More than $40,000
Undergraduate
Graduate
0% 20% 40% 60% 80% 100%
21% 21% 25% 22% 10%
8% 9% 16% 24% 43%
The Hamilton Project • Brookings 7
In 2015, 3.5 million students over the age of 30 were enrolled in higher education.7.
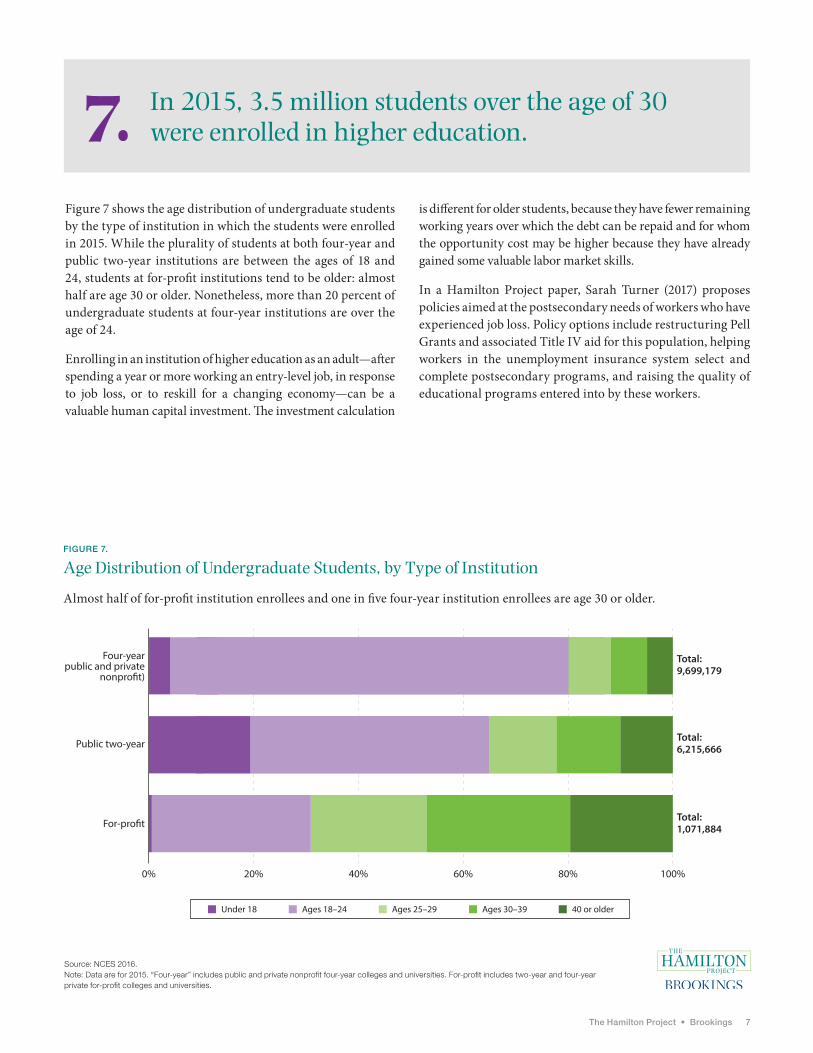
Figure 7 shows the age distribution of undergraduate students by the type of institution in which the students were enrolled in 2015. While the plurality of students at both four-year and public two-year institutions are between the ages of 18 and 24, students at for-profit institutions tend to be older: almost half are age 30 or older. Nonetheless, more than 20 percent of undergraduate students at four-year institutions are over the age of 24.
Enrolling in an institution of higher education as an adult—after spending a year or more working an entry-level job, in response to job loss, or to reskill for a changing economy—can be a valuable human capital investment. The investment calculation
is different for older students, because they have fewer remaining working years over which the debt can be repaid and for whom the opportunity cost may be higher because they have already gained some valuable labor market skills.
In a Hamilton Project paper, Sarah Turner (2017) proposes policies aimed at the postsecondary needs of workers who have experienced job loss. Policy options include restructuring Pell Grants and associated Title IV aid for this population, helping workers in the unemployment insurance system select and complete postsecondary programs, and raising the quality of educational programs entered into by these workers.
FIGURE 7.
Age Distribution of Undergraduate Students, by Type of Institution
Almost half of for-profit institution enrollees and one in five four-year institution enrollees are age 30 or older.
Source: NCES 2016. Note: Data are for 2015. “Four-year” includes public and private nonprofit four-year colleges and universities. For-profit includes two-year and four-year private for-profit colleges and universities.
Four-year(public and private
nonpro�t)
Public two-year
For-pro�t
Total:9,699,179
Total:6,215,666
Total:1,071,884
0% 20% 40% 60% 80% 100%
Ages 18–24 Ages 25–29Under 18 Ages 30–39 40 or older

8 Eight Economic Facts on Higher Education
The vast majority of defaulters have less than $10,000 in student loan debt.8.
Figure 8 describes the distribution of the amount of debt on which students who entered repayment in 2011 defaulted on their debt. Defaulting on federal student loans has consequences for borrowers beyond affecting credit scores. There are direct financial consequences to default such as wage garnishment and offsets of tax refunds and Social Security payments. Among those who defaulted on their student loans, two thirds defaulted on less than $10,000.
Those who borrow small amounts of money are less likely to have finished their degree, regardless of what type of institution they attended (CEA 2016). Defaulters are also more likely to have attended a for-profit institution relative to those who do not default. Almost half of students who enrolled in a for-profit institution in the fall of 2009 had defaulted on
their loans five years later, compared to about forty percent of students who were enrolled in two-year colleges and about one quarter of students enrolled in non-selective four-year colleges (Looney and Yannelis 2015).
In order to improve repayment outcomes for students, institutions should have a stake in students’ success. A Hamilton Project proposal by Tiffany Chou, Adam Looney, and Tara Watson suggests a policy for risk-sharing between institutions and students to improve loan outcomes for students and protect taxpayer investments. This proposal would require institutions of higher education to partially reimburse taxpayers when their students’ loan repayment rates fall below a minimum threshold.
FIGURE 8.
Fraction of Defaulters, by Amount of Student Loan Debt
More than one third of people who default on their student loans had less than $5,000 of debt.
Source: CEA 2016. Note: Loan balance is measured at the time the borrower entered repayment in 2010–11.
Less than $5,000, 35% $5,001 to $10,000, 31% $20,001 to $40,000, 11%
$10,001 to $20,000, 18%
More than$40,000, 4%

The Hamilton Project • Brookings 9
Technical Appendix
Fact 1. The median lifetime earnings for individuals with bachelor’s degrees are twice that of those with high school diplomas.For more-detailed methodology, see Hershbein and Kearney (2014, Appendix 2: Technical Details).
Fact 4. More than a quarter of low-income students who enroll in a four-year institution drop out by the end of the second year.Data are only for four-year institutions. The “No degree, not enrolled after two years” category measures this variable for June of 2014. Parental income of less than $30,000 for the year 2012 is defined as low income, and more than $106,000 is defined as high income.
Fact 5. Student financial aid has increased dramatically over the past 15 years, while state direct aid to institutions has stagnated. Data are in 2015 dollars. Data for federal grants and loans and for state grants are for academic years, whereas data for state institutional aid are for fiscal years. The Great Recession is
defined as comprising 2008 and 2009. “State institutional aid” sums the categories “Independent institutions,” “Non-credit and continuing education,” and “General public operations” in table 1 of the 2009 and 2015 State Higher Education Finance Reports from the State Higher Education Executive Officers Association (SHEEO). Federal aid and state grants data come from College Board (2016, table 1).
Fact 6. Two thirds of undergraduate borrowers receive less than $20,000 in loans and 90 percent borrow less than $40,000.Data come from the Council of Economic Advisers (2016). The U.S. Department of Education Office of Federal Student Aid calculated the figures and shared results with The Hamilton Project at the latter’s request.
Fact 7. In 2015, 3.5 million students over the age of 30 were enrolled in higher education.Data are for undergraduate students in the year 2015 and come from the National Center for Education Statistics (2016, table 303.50).
10 Eight Economic Facts on Higher Education
References
Abraham, Katharine G., and Melissa A. Clark. 2006. “Financial Aid and Students’ College Decisions Evidence from the District of Columbia Tuition Assistance Grant Program.” Journal of Human Resources 41 (3): 578–610.
Akers, Beth, and Matthew M. Chingos. 2016. Game of Loans: The Rhetoric and Reality of Student Debt. Princeton, NJ: Princeton University Press.
Altonji, Joseph G., Erica Blom, and Costas Meghir. 2012. “Heterogeneity in Human Capital Investments: High School Curriculum, College Major, and Careers.” Annual Review of Economics 4 (1): 185–223.
The American Association of Collegiate Registrars and Admissions Officers (AACRAO). 2017. “Trending Topics Survey: International Applicants for Fall 2017 – Institutional & Applicant Perceptions (Early Release of Key Findings).” The American Association of Collegiate Registrars and Admissions Officers, Washington, DC.
Autor, David H. 2014. “Skills, Education, and the Rise of Earnings Inequality Among the ‘Other 99 Percent.’” Science 6186 (344): 843–51.
Bailey, Martha J., and Susan M. Dynarski. 2011. “Gains and Gaps: Changing Inequality in U.S. College Entry and Completion.” Working Paper 17633, National Bureau of Economic Research, Cambridge, MA.
Barrow, Lisa, and Ofer Malamud. 2015. “Is College a Worthwhile Investment?” Annual Review of Economics 7 (1): 519–55.
Baum, Sandy et al. 2012. “Beyond Need and Merit: Strengtherning State Grant Programs.” Brown Center on Education Policy, Brookings Institution, Washington, DC.
Bettinger, Eric, Bridget Terry Long, Philip Oreopoulos, and Lisa Sanbonmatsu. 2009. “The Role of Simplifications and Information in College Decisions: Results from the H&R Block FAFSA Experiment.” Working Paper 15361, National Bureau of Economic Research, Cambridge, MA.
Bound, John, Michael Lovenheim, and Sarah Turner. 2009. “Why Have College Completion Rates Declined? An Analysis of Changing Student Preparation and Collegiate Resources.” Working Paper 15566, National Bureau of Economic Research, Cambridge, MA.
Bulman, George B., and Caroline M. Hoxby. 2015. “The Returns to the Federal Tax Credits for Higher Education.” Tax Policy and the Economy 29 (1): 13–88.
Carnevale, Anthony P., Tamara Jayasundera, and Artem Gulish. 2016. “America’s Divided Recovery: College Haves and Have-Nots.” Georgetown University Center on Education and the Workforce, McCourt School of Public Policy, Georgetown University, Washington, DC.
Census Bureau. 2009–12. “American Community Survey.” Census Bureau, U.S. Department of Commerce, Washington, DC.
College Board. 2016. Trends in Student Aid. New York, NY: The College Board.
Council of Economic Advisers (CEA). 2016, July. “Investing in Higher Education: Benefits, Challenges, and the State of Student Debt.” Council of Economic Advisers, Executive Office of the President, Washington, DC.
Deming, David, and Susan Dynarski. 2009. “Into College, Out of Poverty? Policies to Increase the Postsecondary Attainment of the Poor.” Working Paper 15387, National Bureau of Economic Research, Cambridge, MA.
Deming, David, and Chris Walters. 2017. “The Impacts of Price and Spending Subsidies on US Postsecondary Attainment.” Unpublished working paper, Harvard Graduate School of Education, Cambridge, MA.
Dynarski, Susan. 2000. “Hope for Whom? Financial Aid for the Middle Class and Its Impact on College Attendance.” National Tax Journal 53 (3): 629–62.
———. 2005. “Loans, Liquidity and Schooling Decisions.” Unpublished manuscript. Kennedy School of Government, Harvard University, Cambridge, MA.
Dynarski, Susan, and Judith Scott-Clayton. 2013. “Financial Aid Policy: Lessons from Research.” Working Paper 18710, National Bureau of Economic Research, Cambridge, MA.
Federal Reserve Bank of New York. 2017, February. “Quarterly Report on Household Debt and Credit.” Research and Statistics Group, Microeconomic Studies, Federal Reserve Bank of New York, New York, NY.
Federal Reserve Bank of St. Louis. n.d. FRED Economic Data. Federal Reserve Bank of St. Louis, St. Louis, MO.
Goldrick-Rab, Sara. 2016. Paying the Price: College Costs, Financial Aid, and the Betrayal of the American Dream. Chicago, IL, and London, United Kingdom: University of Chicago Press.
Goldrick-Rab, Sara, Robert Kelchen, Douglas N. Harris, and James Benson. 2016. “Reducing Income Inequality in Educational Attainment: Experimental Evidence on the Impact of Financial Aid on College Completion 1.” American Journal of Sociology 121 (6): 1762–1817.

The Hamilton Project • Brookings 11
Goodman, Joshua. 2008. “Who Merits Financial Aid?: Massachusetts’ Adams Scholarship.” Journal of Public Economics 92 (10): 2121–31.
Greenstone, Michael and Adam Looney. 2011. “How Do Recent College Grads Really Stack Up? Employment and Earnings for Graduates of the Great Recession.” The Hamilton Project, Brookings Institution, Washington, DC.
Greenstone, Michael, Adam Looney, Max Harris, Karen Li, and Jeremy Patashnik. 2012. “A Dozen Economic Facts about K–12 Education.” The Hamilton Project, Brookings Institution, Washington, DC.
Greenstone, Michael, Adam Looney, Jeremy Patashnik, and Muxin Yu. 2013. “Thirteen Economic Facts about Social Mobility and the Role of Education.” The Hamilton Project, Brookings Institution, Washington, DC.
Hershbein, Brad, and Melissa Kearney. 2014. “Major Decisions: What Graduates Earn Over Their Lifetimes.” The Hamilton Project, Brookings Institution, Washington, DC.
Higher Education Act of 1965, Pub. L. 89-329, 79 Stat. (1965).
Hurwitz, Michael, and Jessica Howell. 2014. “Estimating Causal Impacts of School Counselors with Regression Discontinuity Designs.” Journal of Counseling & Development 92 (3): 316–27.
Jaschik, Scott, and Doug Lederman. 2017. “2017 Survey of College and University Presidents.” Inside Higher Ed, Washington, DC.
Kane, Thomas J. 1995. “Rising Public College Tuition and College Entry: How Well Do Public Subsidies Promote Access to College?” Working Paper 5164, National Bureau of Economic Research, Cambridge, MA.
———. 2003. “A Quasi-Experimental Estimate of the Impact of Financial Aid on College-Going.” Working Paper 9703, National Bureau of Economic Research, Cambridge, MA.
Looney, Adam, and Constantine Yannelis. 2015. “A Crisis in Student Loans?: How Changes in the Characteristics of Borrowers and in the Institutions They Attended Contributed to Rising Loan Defaults.” Brookings Papers on Economic Activity 2015 (2): 1–89.
Moretti, Enrico. 2004. “Estimating the Social Return to Higher Education: Evidence from Longitudinal and Repeated Cross-Sectional Data.” Journal of Econometrics 121 (1): 175–212.
NAFSA. 2016. “The Economic Benefits of International Student Enrollment to the United States: A Ten-Year Trend.” Association of International Educations, NAFSA, Washington, DC.
National Association of State Budget Officers (NASBO). 2016. State Expenditure Report: Examining Fiscal 2014–16 State Spending. National Association of State Budget Officers, Washington, DC.
National Center for Education Statistics (NCES). 2012. “2011–12 Beginning Postsecondary Students Longitudinal Study.” National Center for Education Statistics, U.S. Department of Education, Washington, DC.
———. 2014. “2012–14 Beginning Postsecondary Students Longitudinal Study, First Follow-up (BPS:12/14).” National Center for Education Statistics, U.S. Department of Education, Washington, DC.
———. 2015. “Digest of Education Statistics.” National Center for Education Statistics, U.S. Department of Education, Washington, DC.
———. 2016. “Digest of Education Statistics.” National Center for Education Statistics, U.S. Department of Education, Washington, DC.
Oreopoulos, Philip, and Uros Petronijevic. 2013. “Making College Worth It: A Review of the Returns to Higher Education.” Future of Children 23 (1): 41–65.
Saul, Stephanie. 2017. “Amid ‘Trump Effect’ Fear, 40% of Colleges See Dip in Foreign Applications.” The New York Times, March 16.
Schanzenbach, Diane, David Boddy, Megan Mumford, and Greg Nantz. 2016. “Fourteen Economic Facts on Education and Economic Opportunity.” The Hamilton Project, Brookings Institution, Washington, DC.
State Higher Education Officers Association (SHEEO). 2003. State Higher Education Finance Report: FY 2003. Boulder, CO: State Higher Education Officers Association.
———. 2009. State Higher Education Finance Report: FY 2009. Boulder, CO: State Higher Education Officers Association.
———. 2015. State Higher Education Finance Report: FY 2015. Boulder, CO: State Higher Education Officers Association.
Tandberg, David A., and Casey Griffith. 2013. “State Support of Higher Education: Data, Measures, Findings, and Directions for Future Research.” Higher Education: Handbook of Theory and Research 28 (1): 613–85.
12 Eight Economic Facts on Higher Education
Selected Hamilton Project Papers on Education
ECONOMIC FACTS
• “Seven Facts on Noncognitive Skills from Education to the Labor Market”In the past 30 years, the U.S. labor market has shifted dramatically toward increasing demand and reward for noncognitive skills. These noncognitive skills include qualities like perseverance, conscientiousness, self-control, social skills, and leadership ability. In this set of economic facts, The Hamilton Project explores the development of noncognitive skills in education and the returns to noncognitive skills in the labor market.
• “Fourteen Economic Facts on Education and Economic Opportunity”There are many factors at work in determining educational outcomes; some of these are more easily addressed by policy reforms than others, and not all can be addressed directly within the K–12 education system. To illustrate the payoffs from increasing educational attainment, the challenges faced by our nation’s K–12 schools, and the promise of targeted childhood interventions, The Hamilton Project offers the following fourteen facts on education and economic opportunity.
• “Thirteen Economic Facts about Social Mobility and the Role of Education”In this set of economic facts, The Hamilton Project examines the relationship between growing income inequality and social mobility in the United States. The memo explores the growing gap in educational opportunities and outcomes for students based on family income and the great potential of education to increase upward mobility for all Americans.
POLICY PROPOSALS ON HIGHER EDUCATION
• “Increasing College Completion with a Federal Higher Education Matching Grant”David J. DemingThe federal government largely invests in higher education through aid to students that aims to lower the effective price of college. However, David J. Deming finds that increases in institutional spending per-pupil are particularly important for increasing degree completion. Based on this work, the author proposes a federal matching grant for spending by public institutions in states that implement free college proposals. The proposal would give states an incentive to rein in college costs while maintaining or increasing spending levels in the core spending categories of instruction and academic support.
• “A Risk-Sharing Proposal for Student Loans”Tiffany Chou, Adam Looney, and Tara WatsonTiffany Chou, Adam Looney, and Tara Watson propose a risk-sharing system for the student loan program. Institutions
with low repayment rates, as measured by a new cohort-based repayment metric, would be asked to pay a fee in proportion to the degree to which they miss repayment rate targets. This fee is intended to encourage institutions to raise program quality, increase completion rates, and improve the match between students and programs.
• “Labor Force to Lecture Hall: Postsecondary Policies in Response to Job Loss”Sarah Turner Currently, Pell Grants are designed to meet the needs of recent high school graduates. In this proposal, Sarah Turner explores the possibility of better tailoring Pell Grant eligibility and needs assessment to the circumstances of the adult unemployed. In addition to improving Pell access for these individuals, facilitating better matches between unemployment insurance recipients and post-secondary programs has the potential to enhance long-term labor market outcomes, which the author proposes be carefully evaluated.
• “Informing Students about Their College Options: A Proposal for Broadening the Expanding College Opportunities Project”Caroline M. Hoxby and Sarah TurnerCaroline M. Hoxby and Sarah Turner propose a national intervention to expand college opportunities for high-achieving students from diverse economic backgrounds and to allow better access to research data in order to more efficiently target and benefit more students.
• “Redesigning the Pell Grant Program for the Twenty-First Century”Sandy Baum and Judith Scott-ClaytonSandy Baum and Judith Scott-Clayton propose three major structural reforms to the current Pell Grant system, each tailored to the different circumstances of independent and dependent students.
• “Loans for Educational Opportunity: Making Borrowing Work for Today’s Students”Susan Dynarski and Daniel KreismanSusan Dynarski and Daniel Kreisman propose the creation of a new, income-based system of student-loan repayment to replace current federal loan programs. In this increasingly competitive global labor market, it is more important than ever that student-loan policy be designed to help make a college education accessible to all students.
• “Simplifying Estimates of College Costs”Phillip LevinePhillip Levine proposes expanding Wellesley’s Quick College Cost Estimator nationwide in order to provide prospective applicants with an estimate of the price they may be expected to pay for attending an institution.
ADVISORY COUNCIL
GEORGE A. AKERLOFKoshland Professor of EconomicsUniversity of California, Berkeley
ROGER C. ALTMANFounder & Senior ChairmanEvercore
KAREN ANDERSONSenior Advisor, Results for AmericaExecutive Director, Results for All
ALAN S. BLINDERGordon S. Rentschler Memorial Professor of Economics & Public AffairsPrinceton UniversityVisiting FellowThe Brookings Institution
ROBERT CUMBYProfessor of EconomicsGeorgetown University
STEVEN A. DENNINGChairmanGeneral Atlantic
JOHN DEUTCHEmeritus Institute ProfessorMassachusetts Institute of Technology
CHRISTOPHER EDLEY, JR.Co-President and Co-FounderThe Opportunity Institute
BLAIR W. EFFRONCo-FounderCenterview Partners LLC
DOUGLAS W. ELMENDORFDean & Don K. Price Professor of Public PolicyHarvard Kennedy School
JUDY FEDERProfessor & Former DeanMcCourt School of Public PolicyGeorgetown University
ROLAND FRYERHenry Lee Professor of EconomicsHarvard University
JASON FURMANSenior FellowPeterson Institute for International Economics
MARK T. GALLOGLYCofounder & Managing PrincipalCenterbridge Partners
TED GAYERVice President & DirectorEconomic StudiesThe Brookings Institution
TIMOTHY F. GEITHNERPresidentWarburg Pincus
RICHARD GEPHARDTPresident & Chief Executive OfficerGephardt Group Government Affairs
ROBERT GREENSTEINFounder & PresidentCenter on Budget and Policy Priorities
MICHAEL GREENSTONEMilton Friedman Professor in EconomicsDirectorEnergy Policy Institute at ChicagoUniversity of ChicagoNonresident Senior FellowThe Brookings Institution
GLENN H. HUTCHINSChairmanNorth IslandCo-FounderSilver Lake
JAMES A. JOHNSONChairman Johnson Capital Partners
LAWRENCE F. KATZElisabeth Allison Professor of EconomicsHarvard University
MELISSA S. KEARNEYProfessor of EconomicsUniversity of MarylandNonresident Senior FellowThe Brookings Institution
LILI LYNTONFounding PartnerBoulud Restaurant Group
HOWARD S. MARKSCo-ChairmanOaktree Capital Management, L.P.
MARK MCKINNONFormer Advisor to George W. BushCo-Founder, No Labels
ERIC MINDICHChief Executive Officer & Founder Eton Park Capital Management
SUZANNE NORA JOHNSONFormer Vice ChairmanGoldman Sachs Group, Inc.
PETER ORSZAGManaging Director & Vice Chairman of Investment BankingLazardNonresident Senior FellowThe Brookings Institution
RICHARD PERRYManaging Partner & Chief Executive OfficerPerry Capital
MEEGHAN PRUNTY Managing DirectorBlue Meridian PartnersEdna McConnell Clark Foundation
ROBERT D. REISCHAUERDistinguished Institute Fellow & President EmeritusUrban Institute
ALICE M. RIVLINSenior FellowThe Brookings Institution Professor of Public PolicyGeorgetown University
DAVID M. RUBENSTEIN Co-Founder & Co-Chief Executive OfficerThe Carlyle Group
ROBERT E. RUBINCo-Chair, Council on Foreign RelationsFormer U.S. Treasury Secretary
LESLIE B. SAMUELSSenior CounselCleary Gottlieb Steen & Hamilton LLP
SHERYL SANDBERGChief Operating Officer Facebook
RALPH L. SCHLOSSTEINPresident & Chief Executive OfficerEvercore
ERIC SCHMIDTExecutive Chairman Alphabet Inc.
ERIC SCHWARTZChairman and CEO76 West Holdings
THOMAS F. STEYERBusiness Leader and Philanthropist
LAWRENCE H. SUMMERSCharles W. Eliot University Professor Harvard University
PETER THIELEntrepreneur, Investor, and Philanthropist
LAURA D’ANDREA TYSONProfessor of Business Administration and EconomicsDirectorInstitute for Business & Social ImpactBerkeley-Haas School of Business
DIANE WHITMORE SCHANZENBACHDirector
W W W . H A M I L T O N P R O J E C T . O R G
W W W . H A M I L T O N P R O J E C T . O R G
1775 Massachusetts Ave., NW Washington, DC 20036
(202) 797-6279
Printed on recycled paper.
1. The median lifetime earnings for individuals with bachelor’s degrees are twice that of those with high school diplomas.
2. Federal tax credits generally do not increase college enrollment.
3. For the past twenty years, women have outpaced men in college attendance and degree attainment.
4. More than a quarter of low-income students who enroll in a four-year institution drop out by the end of the second year.
5. Student financial aid has increased dramatically over the past 15 years, while state direct aid to institutions has stagnated.
6. Two thirds of undergraduate borrowers receive less than $20,000 in loans and 90 percent borrow less than $40,000.
7. In 2015, 3.5 million students over the age of 30 were enrolled in higher education.
8. The vast majority of defaulters have less than $10,000 in student loan debt.
Eight Economic Facts on Higher Education
Lifetime Earnings by Degree Type
The median college graduate earns $1.2 million over their lifetime, twice as much as a high school graduate.
Sources: Hershbein and Kearney 2014, based on Census Bureau 2009–12.
Note: Earnings are in millions of 2014 dollars and represent those who worked at least one week in the past year. Individuals who earned a graduate degree are not included.
Some high school
Associate’s degreeSome college, no degree
High school diploma or GED
Bachelor’s degree
Life
time
earn
ings
(mill
ions
of 2
014
dolla
rs)
Percentile of income distribution, by degree type
0
1
2
3
4
5 15 25 35 45 55 65 75 85 95
Related Documents