Welcome message from author
This document is posted to help you gain knowledge. Please leave a comment to let me know what you think about it! Share it to your friends and learn new things together.
Transcript


E-SNC
E-SNC
EGYPT SECOND NATIONAL COMMUNICATION
EGYPT SECOND NATIONAL COMMUNICATION
Under the United Nations Framework Convention on Climate Change
This report is the Second National Communication of Egypt submitted to the United Nations Framework Convention on Climate Change (UNFCCC).
i
May, 2010

E-SNC
E-SNC
E-SNC
E-SNC
EGYPT SECOND NATIONAL COMMUNICATION
Acknowledgement
The contribution of the late Professor Mohamed El-Shahawy to the efforts of preparing the Second National Communication must be recognized. His serious engagement in the initial stages of the process, and his strong commitment to it, formed a solid basis for the completion of this document.
iii
E-SNC
E-SNC
E-SNC
E-SNC
EGYPT SECOND NATIONAL COMMUNICATION
Table of Contents
List of Figures ..............................................................................................................ixList of Tables ................................................................................................................xiAbbreviations ........................................................................................................... xiiiExecutive Summary .................................................................................................xviiCHAPTER I. NATIONAL CIRCUMSTANCES ......................................................1 I. 1. Introduction ......................................................................................................3 1. 2. Geographic Situation .......................................................................................3
1. 3. Climate Profile..................................................................................................41. 4. Population .........................................................................................................61. 5. Government Structure .....................................................................................71. 6. Egyptian Economy ...........................................................................................71. 7. Egypt Natural Resources ............................................................................... 111. 7. 1. Land.........................................................................................................................................11
1. 7. 2. Water Resources ..................................................................................................................... 12
1. 7. 3. Coastal Zones ........................................................................................................................ 13
1. 8. Profile of the Key Sectors ..............................................................................131. 8. 1. Energy .................................................................................................................................... 13
1. 8. 2. Industry .................................................................................................................................. 16
1. 8. 3. Agriculture.............................................................................................................................. 16
1. 8. 4. Waste ...................................................................................................................................... 18
I. 9. Institutional Framework for Climate Change .............................................20CHAPTER II. NATIONAL GREENHOUSE GAS INVENTORY .......................23
II. 1. Introduction ...................................................................................................25II. 2. Elements of Egypt’s GHG Inventory ..........................................................26II. 3. GHG Inventory by Sector ............................................................................30II. 3. 1. The Energy Sector ................................................................................................................. 30
II. 3. 2. The Industry Sector ............................................................................................................... 34
II. 3. 3. Agriculture Sector .................................................................................................................. 36
II. 3. 4. Waste Sector .......................................................................................................................... 40
II. 4. Summary........................................................................................................43
CHAPTER III. PROGRAMS CONTAINING MEASURES TO MITIGATE CLIMATE CHANGE ................................................................................................47
III. 1. Introduction .................................................................................................49
v
TAbLE Of CONTENTS
E-SNC
E-SNC
E-SNC
E-SNC
III. 2. Current Strategies, Programs and Policies Containing Measures for Mitigating GHGs Emissions by Key Sectors .......................................................51III. 2. 1. Energy Sector ....................................................................................................................... 51
III. 2. 2. Industrial Sector ................................................................................................................... 58
III. 2. 3. Transport Sector ................................................................................................................... 60
III. 2. 4. Agriculture Sector ................................................................................................................ 61
III. 2. 5. Waste Sector ......................................................................................................................... 62
CHAPTER IV. VULNERABILITY AND ADAPTATION TO CLIMATE CHANGE ....................................................................................................................67
IV. 1. Introduction ..................................................................................................69IV. 2. Water Resources ...........................................................................................69IV. 2. 1. Vulnerability ......................................................................................................................... 69
IV. 2. 2. Adaptation ............................................................................................................................ 75
IV. 3. Agriculture Sector ........................................................................................76IV. 3. 1. Vulnerability ......................................................................................................................... 77
IV. 3. 2. Adaptation ............................................................................................................................ 81
IV. 3. 3. General Remarks and Recommendations for Adaptation Planning in Agriculture ............. 82
IV. 4. Coastal Zones ...............................................................................................83IV. 4. 1. Vulnerability ......................................................................................................................... 86
IV. 4. 2. Adaptation ............................................................................................................................ 88
IV. 5. Tourism Sector ..............................................................................................89IV. 5. 1. Vulnerability ......................................................................................................................... 89
IV. 5. 2. Adaptation ............................................................................................................................ 91
IV. 6. Housing and Roads ......................................................................................91IV. 6. 1. Housing ................................................................................................................................ 91
IV. 6. 2. Roads .................................................................................................................................... 92
IV. 7. Health Sector ................................................................................................93IV. 7. 1. Vulnerability ......................................................................................................................... 93
IV. 7. 2. Adaptation ............................................................................................................................ 96
CHAPTER V. ACHIEVEMENT OF THE OBjECTIVES OF THE CONVENTION ..........................................................................................................99 V. 1. Efforts Exerted .............................................................................................101
V. 1. 1. Transfer of Technology ........................................................................................................ 101
V. 1. 2. Research, Systematic Observation and Networking ............................................................ 101
V. 1. 3. Education, Training and Public Awareness .......................................................................... 107
V .2 .Needs for Mitigating the Effects of Climate Change ...............................108
V. 2. 1. Transfer of Technology ....................................................................................................... 108
vi

E-SNC
E-SNC
E-SNC
E-SNC
EGYPT SECOND NATIONAL COMMUNICATION
V. 2. 2. Research Needs .................................................................................................................... 108
V. 2. 3. Systematic Observation Needs .............................................................................................110
V. 2. 4. Modelling Needs ...................................................................................................................110
V. 2. 5. Adaptation Needs .................................................................................................................110
V. 2. 6. Institutional Needs ................................................................................................................110
V. 2. 7. Other Needs ..........................................................................................................................111
CHAPTER VI. FINANCIAL, TECHNICAL AND CAPACITY BUILDING NEEDS ...................................................................................................................... 113
VI. 1. Introduction ............................................................................................... 115
VI. 2. Projects Needed in Egypt .......................................................................... 116
VI. 2. 1. Research Programs/Projects................................................................................................116
VI. 2. 2. Programs/Projects for Systematic Observation and Information Technologies .................118
VI. 2. 3. Programs/Projects for Raising Capacity in Education, Training and Public Awareness ....118
VI. 2. 4. Programs/Projects for Adaptation .......................................................................................119
VI. 2. 5. Programs/Projects for Mitigation ....................................................................................... 120
References .................................................................................................................121
List of Contributors .................................................................................................127
vii

E-SNC
E-SNC
EGYPT SECOND NATIONAL COMMUNICATION
E-SNC
E-SNC
Figure (I . 1) : Map of Egypt 3Figure (I . 2) : Average annual mean of daily temperature (°C) 4Figure (I . 3) : Annual mean of daily relative humidity (%) 4Figure (I . 4) : Mean annual precipitation (mm) 5Figure (I . 5) : The growth rate of Egypt’s real Gross Domestic Product
(GDP) in LE 9Figure (I .6) : Implemented investment, 1995/96 to 2006/07 at market price
in billion LE 9Figure (I .7) : Crude oil and natural gas reserves in Egypt, 1990 to 2005 14Figure (I. 8) : Production of primary petroleum energy, including crude
oil, condensates, liquefied petroleum gas and natural gas in million tons, 1991/92 to 2005/06 14
Figure (I .9) : Consumption of petroleum products and natural gas in Mt tons, 1990/91 to 2005/06 15
Figure (II.1) : Egypt’s GHG emissions by gas type for the year 2000 in Mt CO2e 26
Figure (II.2) : Egypt’s GHG emissions by sector for the year 2000, in Mt
CO2e 27Figure (II.3) : GHGs emissions from fuel combustion by gas type, 2000/01 30Figure (II.4) : GHGs emissions from petroleum fuels and NG, 2000/01 31Figure (II.5) : GHG emissions from fuel combustion of different sectors,
2000/01 31Figure (II.6) : GHG Emissions trend for the period 1991/92–2004/05 32Figure (II.7) : GHG emissions by different industrial sectors, according to
gas type, 2000 35Figure (II.8) : Total CH4 emissions (Mt) from livestock categories due to
enteric fermentation, 2000 38Figure (II.9) : Total CH4 emissions (Mt) from livestock categories due to
manure management, 2000 39Figure (II.10) : Emissions and relative weight of GHG for the waste sector,
2000 40Figure (II.11) : GHGs emissions and relative weight of different source
categories for the waste sector, 2000 40Figure (II.12) : Total CO2e emissions (1000 ton CO2e/year) from solid waste
disposal sites 41Figure (II.13) : Total emissions (1000 ton CO2e/year) from wastewater
handling 42
ix
List of Figures

E-SNC
E-SNC
EGYPT SECOND NATIONAL COMMUNICATION
E-SNC
E-SNC
Table (I.1) : Gross National Product (GNP) for the period 1997 to 2006, at market prices in US$ 8
Table (I.2) : Sectors percentage shares in the GDP of Egypt 10Table (I.3) : Sector consumption of liquefied petroleum products 15Table (I.4) : Industry share in the GDP of Egypt at 1980/81 fixed prices 16Table (II.1) : Egypt’s GHG emissions by gas type for the year 2000 26Table (II.2) : Egypt’s GHG emissions by sector for the year 2000 27Table (II.3) : Changes in contributions to the GHG inventory of different
sectors 28Table (II.4) : Changes in the total GHG indicators 28Table (II.5) : Growth of key activities resulting in GHG emissions 29Table (II.6) : GHGs emissions from fuel combustion by gas type,
2000/01 30Table (II.7) : GHG emissions from fuel combustion of different sectors,
2000/01 31Table (II.8) : Direct CO2 emissions from international aviation and marine
bunkers for 2000 33Table (II.9) : International aviation emissions in Egypt by gas type for
2000 33Table (II.10) : GHG emissions by different industrial sectors, according to
gas type, 2000 35Table (II.11) : Egypt indicators for the Industrial sector 36Table (II.12) : Total GHG emissions from the agricultural sector by gas
type, 2000 36Table (II.13) : Total GHGs emissions of the five key sources of GHGs in
agricultural sector, 2000 37Table (II.14) : Total N2O emissions from agricultural soil, 2000 38Table (II.15) : Summary of GHG emissions for Egypt, 2000 44Table (III.1) : Policies and measures for GHG emissions reduction in
Egypt during the last decade 50Table (III.2) : Total GHGs emissions for each of the three scenarios of
forecast 53Table (III.3) : Climate change mitigation matrix for the energy sector 54Table (III.4) : Mitigation options for GHGs abatement in the industrial
sector 59Table (III.5) : Transport sector opportunities for mitigation options 61Table (III.6) : Summary of identified mitigation measures for solid waste 63Table (III.7) : Summary of identified mitigation measures for wastewater 63
xi
List of Tables

LIST Of TAbLES
E-SNC
E-SNC
E-SNC
E-SNC
Table (IV.1) : Change of flow corresponding to uniform change in rainfall for Nile sub-basins 70
Table (IV.2) : Nile flows under sensitivity analysis 70Table (IV.3) : Nile flows under GCM scenarios 71Table (IV.4) : Projected changes in crop production of some major crops
in Egypt under climate change conditions 77Table (IV.5) : Total affected area and its percentage of the Nile Delta area,
A1F1 scenario 87Table (IV.6) : Total affected area and its percentage of the Nile Delta area,
A1F1 scenario, without Mohamed Ali Sea Wall and zero level for lake’s borders 87
Table (IV.7) : Total affected area and its percentage of the Nile Delta area, A1F1 scenario, with Mohamed Ali Sea Wall and zero level for lake’s borders 87
Table (V.1) : Tide gauge stations in the Delta and on the Mediterranean coast 105
Table (VI.1) : Investments by the Egyptian Environmental Affairs Agency including bilateral and multilateral assistance agencies contributions 115
xii

E-SNC
E-SNC
EGYPT SECOND NATIONAL COMMUNICATION
E-SNC
E-SNC
ARC Agricultural Research CenterARE Arab Republic of EgyptBAU Business As UsualCAPMAS Central Agency for Public Mobilization and StatisticsCCS Carbon Capture and StorageCDC Communicable Disease Control CenterCDM Clean Development MechanismCH4 MethaneCLAC Central Laboratory for Agriculture ClimateCNG Compressed Natural GasCO Carbon monoxideCO2 Carbon dioxide CO2e Equivalent carbon dioxide COP Conference of PartiesCoRI Coastal Research Institute DSM Demand Side ManagementEEAA Egyptian Environmental Affairs AgencyEEHC Egyptian Electricity Holding CompanyEGAS Egyptian Gas Holding CompanyEGP Egyptian PoundEGPC Egyptian General Petroleum CorporationEHMC Environmental Hazards and Mitigation Center, Cairo UniversityEMA Egyptian Meteorological AuthorityEOR Enhanced Oil RecoveryFAO Food and Agriculture OrganizationFDI Foreign Direct Investment FEI Federation of the Egyptian IndustryGCM Global Circulation ModelsGDP Gross Domestic ProductGEF Global Environment FacilityGFDL Geophysical Fluid Dynamic LaboratoryGHG Greenhouse GasGISS Goddard Institute for Space StudiesGNP Gross National ProductGWP Global Warming Potential hPa hector-Pascal, unit pressure = 100 PascalIAEA International Atomic Energy Agency
xiii
Abbreviations

AbbrEvIATIONS
E-SNC
E-SNC
E-SNC
E-SNC
ICE Internal Combustion EngineICZM Integrated Coastal Zone ManagementIDA Industrial Development AssociationIFAD International Fund for Agricultural DevelopmentIGSR Institute for Graduate Studies and Research, Alexandria
UniversityINC Initial National CommunicationIPCC Inter-governmental Panel on Climate ChangeIWMI International Water Management InstituteKt Thousand tonskWh Kilo-Watt hourkWe Kilo-Watt electricalLE Egyptian poundLPG Liquified petroleum gasMbbl Million barrelsMBOE Million Barrels of Oil EquivalentMALR Ministry of Agriculture and Land ReclamationMJ Mega JoulesMSW Municipal Solid WasteMt Million tonsMTOE Million Ton of Oil EquivalentMW MegawattMWe Megawatt electricalMWRI Ministry of Water Resources and IrrigationN2O Nitrous oxideNARSS National Authority of Remote Sensing and Space SciencesNASA National Aeronautics and Space AdministrationNCCM National Council for Childhood and MotherhoodNEAP National Environmental Action Plan NG Natural GasNGOs Non Governmental OrganizationsNH3 AmmoniaNIOF National Institute of Oceanography and FisheriesNIS National Institute for StandardizationNMVO Non-methane volatile organicsNOAA National Oceanic and Atmospheric AdministrationNOx Nitrogen oxidesOECD Organization for Economic Cooperation and Development
xiv

E-SNC
E-SNC
EGYPT SECOND NATIONAL COMMUNICATION
E-SNC
E-SNC
Oile Oil equivalent, hypothetical fuel with high heating value of 10,000 kilo-Calories per kilogram
PFC’s PerfluorocarbonsPHEV Plug-in hybrid electric vehiclePPP Private-Public PartnershipPV PhotovoltaicR&D Research & DevelopmentRD&D Research, Development and DeploymentRDF Refuse Derived FuelSADS Sustainable Agricultural Development StrategySBSTA Subsidiary Body for Scientific and Technological AdviceSeaWif Sea-viewing wide field-of-view sensorSFD Social Fund for DevelopmentSNAP Support for National Action PlanSPA Shore Protection AuthoritySPOT Satellite Pour l’Observation de la TerreSRES Special Report on Emissions ScenariosSTT Satellite communication Transportable TerminalSWDS Solid Waste Disposal SitesTCF Trillion Cubic FeetTg Teragrams (1012 grams, equivalent to mega tonne)TSP Total Suspended ParticlesUKMO United Kingdom Meteorological OfficeUNDP United Nations Development ProgramUNFCCC United Nations Framework Convention on Climate ChangeUSA Unites States of AmericaUS$ United States dollarsVOC Volatile Organic CompoundWW WastewaterWWTP Centralized Wastewater Treatment Plant
xv

E-SNC
E-SNC
EGYPT SECOND NATIONAL COMMUNICATION
E-SNC
E-SNC
Executive Summary
Egypt lies between Latitude 22° and 32°, and the country’s maximum distances are 1,024 km from north to south, and 1,240 km from east to west. Egypt is boarded by the Mediterranean Sea to the north, by Sudan to the south, by the Red Sea, Palestine and Israel to the east, and by Libya to the west. The total area of Egypt is 1,001,450 km2, with a land area of 995,450 km2 and a coastline of 3,500 km on the Mediterranean and the Red Sea. The surface level extremes range from 133 m below sea level in the Western Desert to 2,629 m above sea level in Sinai Peninsula.
The general climate of Egypt is dry, hot, and desertic, with a mild winter season with rain over the coastal areas, and a hot and dry summer season. Data collected by the Egyptian Meteorological Authority and local universities for the period 1961-2000 indicate that there is a general trend towards warming of the air temperature, with increases in the number of hazy days, the misty days, turbidity of the atmosphere, frequency of sand storms and hot days.
At the time of the last census (2006), the total Egyptian population amounted to 76.5 million, with an average growth rate of about 2.3% per year. In 2006, the GDP and the GNP amounted to about 107 billion US$ and 113 billion US$ respectively. Egypt is categorized as a lower middle income country, with its GNP per capita being 1,556 US$ in 2006. The average yearly economic growth rate for the period 1990 to 2007 was 4.47%. For the fiscal year 1995/96 the share of the public sector in the total investment in Egypt was about 62%, with the rest representing the share of the private sector. By 2006/07 the situation was reversed with the private sector share of total investment becoming about 63%. The shares of the basic economic sectors of agriculture, industry, electricity, construction and transportation in Egypt’s GDP decreased, with the sectors of petroleum, the Suez Canal, tourism, social insurance and social services growing.
About 97% of the population in Egypt lives on the Nile Valley and the Delta, and area representing about 4% of Egypt’s total area. This yields an average population density of 1,435 persons per km2. In this respect, a plan to construct several new cities in desert areas by 2017, aims to increase the populated area in Egypt to about 25%. The construction in these new cities is expected to follow the green building code, and this can therefore be considered as part of the adaptation activities to climate change in Egypt.
Egypt total fresh water yearly budget is estimated at about 58 billion m3, consisting of 55.5 billion m3 from River Nile, 1.0 billion m3 from deep aquifers, and 1.2 billion m3 from rain. In this respect, River Nile represents 95% of the annual water budget, with deep water aquifers and rainfall averages representing 1.5% and 3.5%, respectively. Total yearly water consumption in Egypt is about 78 billion m3. Agriculture consumes 80% with municipal drinking water and industry consuming each 10%. The difference between the water budget and the amounts consumed yearly is about 20 billion m3. This is covered by recycling of agricultural drainage, blending it with the Nile fresh water, abstraction from shallow aquifer which is actually dissipated water from the Nile, and treatment of municipal sewage.
xvii
ExECUTIvE SUMMArY
E-SNC
E-SNC
E-SNC
E-SNC
The coastal zones of Egypt extend for over 3,500 km in length along the Mediterranean and Red Sea coasts. The Mediterranean shoreline is most vulnerable to sea level rise due to its relative low elevation compared to the land around it. The Delta and its north coast are hosts to several main towns and cities such as Alexandria, Port Said, Damietta, and Rosetta, accommodating several millions of population, and large investments in industrial, touristic and agricultural activities as well as in the infra structure serving these activities. These are all vulnerable to sea level rise.
As for Egypt’s energy, fossil fuels; petroleum products and natural gas represent the main sources for the primary energy. Since the early 1990s, large amounts of natural gas reserves have been discovered, and in consequence, there has been a trend for the substitution of petroleum products by natural gas as an alternative fuel. Energy production and use represent the main sources of GHG emissions in Egypt. Renewable energy sources currently include hydropower, representing about 11% of energy production in Egypt for 2006/07, generated mostly by the High Dam in Aswan, wind energy; with six grid connected wind farms with a total of 360 MW established at Zafarana with another 120 MW wind farm under construction to be operational by 2010. Moreover, there are significant potentials for solar energy, and biomas energy.
Regarding Egypt’s industrial sector, the value of industrial production increased from about 6 billion LE in 1990/91 to about 13 billion in 2006/07 at 1980/81 prices. Foreign direct investment in Egypt is attracted to highly fossil fuels consuming industries and associated energy-intensive products such as the cement and fertilizers industries. The impact of such industrial sectors on GHG emissions in Egypt will be felt in the near future. In response to climate change, in 2006, Egypt developed an industrial plan aiming at achieving a gradual shift from resource-based and low-technology industries to medium and high-technology industries.
Agricultural activities in Egypt engages about 55% of the labor force, while contributing about 14% to the GDP (for 2006), and consuming about 80% of the fresh water resources. The “Old-land” which comprises the lands of the Nile Valley and the Nile Delta represents about 80% of the cultivated area, with “New-land”, the recently reclaimed areas, representing the rest. The cultivated land base of Egypt is about 3.5 million hectares, with a total annual cropping area of about 6.2 million hectares. Livestock production is primarily meat production. The high level technology in agriculture is still not feasible for use in the Nile Valley and the Delta because of the high operating costs in the prevailing small areas ownerships. The Ministry of Agriculture and Land Reclamation and the Ministry of Water Resources and Irrigation set an integrated plan for land reclamation through several large projects targeting about 1.4 million hectares to be reclaimed by 2017. This strategy considers two types of mechanisms to procure the required water resources for reclaiming the targeted areas. The first entails increasing the efficiency of the current agricultural water use, minimizing irrigation water losses, while the second entails increasing non-conventional water resources share in agriculture.
xviii
E-SNC
E-SNC
EGYPT SECOND NATIONAL COMMUNICATION
E-SNC
E-SNC
The total amount of solid waste generated yearly in Egypt is about 17 million tons from municipal sources, 6 million tons from industrial sources and 30 million tons from agricultural sources, according to estimates for the year 2000. Approximately 8% of municipal solid waste is composted, 2% recycled, 2% land-filled and 88% disposed of in uncontrolled dumpsites. Agricultural wastes are used in the production of organic fertilizers, animal fodder and food or energy production. A large amount of agricultural waste is openly burned in the fields and national efforts are being exerted to minimize this practice.
The total amount of municipal wastewater generated yearly is approximately 4 billion m3, according to estimates from year 2000. About 45% of the generated domestic wastewater is treated in wastewater treatment plants, with the rest either remaining untreated or treated through on-site facilities such as septic tanks. Industrial wastewater is well controlled by successive laws developed since 1962, and which limit the concentrations of pollutants in the effluents.
Assessment of GHG emissions for Egypt in the year 2000 revealed that the total emissions in the year 2000 were about 193 MtCO2e, compared to about 117 MtCO2e in 1990, representing an average increase of 5.1% annually. Estimated total GHG emissions in 2008 are about 288 MtCO2e. GHG emissions by gas type reveal that CO2 represents 66% of emissions, with CH4 representing 20%, N2O representing 13%, PFCs representing 1%, SF6 representing 0.06% and HFCs representing 0.03%. The energy sector is the primary contributor to emissions of GHGs in Egypt, followed by agriculture, industrial processes and then the waste sector. GHG emissions per capita show 37% increase in the year 2000 relative to 1990. Meanwhile, GHG emissions per thousand US$ of Egypt GDP went down from 3.32 ton CO2e to 1.98 ton CO2e indicating the use of low carbon activities. The share of Egypt in the total world GHG emissions in 1990 was 0.4% and was still limited to 0.58% in 2000.
As a non-annex I country, Egypt is not required to meet any specific emission reduction or limitation targets in terms of its commitments under the UNFCCC or the Kyoto protocol. However, mitigation measures based on national plans are already in progress, and accelerated developments are taking place for introducing renewable sources of energy, for fuel switching in industry and transport from oil to natural gas, for the implementation of domestic and industrial energy efficiency programs, for energy-efficient buildings, and for agriculture and plantation schemes enhancing public participation and cooperation with the aim of creating low carbon economic structure that prioritizes energy efficiency.
Since the late 1990s the most significant mitigation measures implemented by the energy sector comprised fuel substitution of oil with natural gas in the electricity generation and the industrial sector, combined heat and power generation, efficient lighting systems, the use of large-scale grid-connected wind farms in electricity generation, steam condensate recovery, the use of solar thermal energy in electricity generation, the use of natural gas in commercial vehicles as well as extending the underground metro lines, mitigation of CO2 and CH4 emissions from rice cultivation and livestock, and increasing the country’s CO2 absorptive capacity through planting trees.
xix

ExECUTIvE SUMMArY
E-SNC
E-SNC
E-SNC
E-SNC
In October 2007, the Supreme Council for Energy adopted a strategy for energy supply and use, which comprehensively integrates the main policies and measures that could meet the longer term challenges facing the national energy industry. The strategy confirms the ongoing activities, adding to them nuclear power generation, carbon capture and storage, the reduction of electricity losses through transmission and distribution systems and demand-side management.
Over years, a series of policies and measures have been adopted to result in a general decrease in GHG emissions per unit of product in industrial processes and product use (excluding those related to energy). The main barriers that currently prevent the industrial sector from achieving full energy conservation and considerable GHG emissions reduction include a lack of information about GHG emissions reduction opportunities in the sector, long payback periods on some GHG emissions reduction investments, and financial barriers such as the lack of access to investment capital and/or high interest rate on investments.
Energy intensity in the transport sector in Egypt is particularly high due to the low efficient-engines using hydrocarbons fuels, and the fact that it relies heavily on road transport as the main means of transportation in Egypt.
Based on a Cabinet of Ministers decision, the Ministry of Transport adopted a strategy for improving national transport and urban traffic, in addition to achieving the control of exhaust emissions from road-going vehicles. The strategy includes improving public transport, improving energy efficiency, fuel switching, the development and use of new propulsion technologies, the development of rail transport and new methods for freight transport, the development of power train technologies, shifting from diesel to electrified railways, and the development and use of fuel cells technology.
In the agricultural sector, national efforts yielded positive impacts on the mitigation of GHGs from paddy rice cultivation, livestock production, and soil management. Other mitigation efforts include improving feeding patterns and technologies to enhance veterinary care, and improving breeding programs for livestock production, sustaining rice cultivated areas under 1.47 million acres, then reducing these to 1.26 million acres by 2017 while switching from conventional cultivars to short duration cultivars, applying intermittent irrigation. Barriers of implementing mitigation policies in the agriculture sector include institutional capacity constraints, and the limited awareness of the sector stakeholders of the threats of climate change, the limited ability of the agriculture sector to get support from the current UNFCCC and Kyoto Protocol mitigation fund mechanisms, as well as the limited knowledge and technology levels of the small farmers.
In the waste sector, the Egyptian relevant ministries, in collaboration with concerned governorates, have developed several plans and programs over the past ten years to improve the process of collection, reuse and recycling of waste, yet there are several barriers to achieving the goals of these programs. These include financial constraints for the mitigation of GHGs emissions from the waste sector; the significant dependence on external financial support, as grants and concessionary loans, complicating the
xx
E-SNC
E-SNC
EGYPT SECOND NATIONAL COMMUNICATION
E-SNC
E-SNC
planning process and slowing down implementation, limited public awareness about the economic benefits of reuse and recycling of waste leads, leading to the hesitation of funding institutions to consider waste management activity as a viable option; the need of technology transfer and high investments for some waste treatment options, such as anaerobic digestion; the weak enforcement of existing laws and regulations for violations in handling waste.
As for the vulnerability and adaptation measures to climate change in Egypt, these comprise the following:
For water resources, as mentioned above, the total fresh water budget is estimated at about 58 billion m3 per year, with a total yearly consumption of 78 billion m3. The annual per capita share of fresh water is 700 m3 per year. By considering the expected population growth, this value is estimated to become 350 m3 in 2040, without considering climate change impacts on Egypt’s water resources. The vulnerability of Egypt’s water resources to climate change entails those affecting Nile flows (hypersensitivity to Ethiopian rain; sensitivity to temperature increase in equatorial lakes and Bahr El Ghazal, and uncertainty due to significant differences in the Global Circulation Models output of water flow into the Nile), rainfall (the possibility of a 50% reduction of rainfall on Egypt’s Mediterranean coast), and ground water (increased levels and salinity due to sea level rise and consequent sea water intrusion). Different ideas are being considered for the adaptation to the reduction of water resources or the increase of Nile flows. These primarily include: keeping the water level in Lake Nasser low; increasing water storage capacity; improving irrigation and draining systems; changing cropping patterns and farm irrigation systems; reducing surface water evaporation by a redesign of canal cross section; developing new water resources through upper Nile projects, rain harvesting, desalination, wastewater recycling, increased use of deep groundwater reservoirs; and using a number of soft interventions such as increasing public awareness about the need for rational use of water, enhancing precipitation measurement networks in upstream countries of the Nile Basin, encouraging data exchange between Nile Basin countries, and developing Circulation Models for the prediction of the impact of climate change on the local and regional water resources.
For the agriculture sector, climate change studies predict a reduction in the productivity of two major crops in Egypt - wheat and maize - by 15% and 19% respectively by 2050. Losses in crop productivity are mainly attributed to the projected temperature increase, crop-water stress, pests and disease, as well as the inundation and Stalinization of 12% to 15% of the most fertile arable land in the Nile Delta as a result of sea level rise and salt water intrusion. Projected future temperature rises are likely to increase crop-water requirements thereby directly decreasing crop water use efficiency and increase irrigation demands of the agriculture sector. Crop water requirements of the important strategic crops in Egypt are expected to increase by a range of 6% to 16% by 2100. The high vulnerability of on-farm irrigation systems in Egypt is attributed to low efficacy and irrigation management patterns.
xxi
ExECUTIvE SUMMArY
E-SNC
E-SNC
E-SNC
E-SNC
For livestock production, current evidence shows that temperature increases induce harmful heat stress impacts on animals’ productivity. New animal diseases emerged in Egypt, and have strong negative impacts on livestock production. These are the blue tongue disease and rift valley fever. Both are attributed to some observed changes in the Egyptian climate. The availability of fodder is subject to decrease due to climate change impacts on crops productivity, and higher competition for land and water resources between fodder and cereal crops.
Climate change is expected to increase sea temperature causing fish distribution to shift northwards and to go into deeper waters. In addition, increased water salinity in the coastal lakes in Egypt is expected to affect fish species in these lakes.
Modest efforts and steps are taking place in scientific research related to climate change mitigation and adaptation in the agriculture sector in Egypt. Changing sowing dates and management practices are among the important adaptation measures oriented to mitigate the impact of climate change. Changing cultivars to those tolerant to heat, salinity and pests, and changing crop pattern are the most promising adaptation measures at the national level. Moreover, using different combinations of different levels of improved surface irrigation system efficiencies and applying deficit irrigation are considered as means of increasing the capacity of surface irrigation system in old land in order to overcome the negative impacts of climate change. For livestock, improving the current low productivity cattle and buffalos breeds and the feeding programs are being considered. No clear adaptation options have been defined for fisheries. Further studies on the impacts, vulnerability, and adaptation to climate change are still needed in the agriculture sector in order to be able to develop an adaptation strategy for the sector addressing the barriers to implementing adaptation measures. These barriers include limited scientific information; policy perceptions; poor adaptive capacity and lack of financial support.
Coastal resources are expected to suffer direct impacts through sea level rise and inundation of low elevation areas. It is estimated that a sea level rise of 50 cm combined with local Nile Delta subsidence present serious impacts on low land Delta regions and adjacent highly populated cities such as Alexandria and Port Said. Coastal zones are also expected to suffer from indirect impacts such as salt water intrusion and contamination of ground water resources, exacerbating soil salinity and affecting food security. In addition, the increase in frequency and severity of storm surges will definitely impact coastal structures. Furthermore, coastal areas below sea level constitute high risk areas. Direct and indirect impacts are expected to lead to the immigration of 6 to 7 million people from the Nile Delta. As for adaptation options, it is realized that these are site dependant. However, changes in land use, integrated coastal zone management, and proactive planning for protecting coastal zones, are necessary adaptation policies. The creation of job opportunities in safe areas is considered an important priority for successfully absorbing migrant populations.
xxii
E-SNC
E-SNC
EGYPT SECOND NATIONAL COMMUNICATION
E-SNC
E-SNC
For the tourism sector, coral reefs, constituting a major attraction in Red Sea resorts, are highly vulnerable to climate change. On the other hand, sea level rise on the low elevation Mediterranean coast will definitely lead to losses of beaches. In addition the impact of increasing temperatures and frequencies and severity of extreme events are expected to negatively impact the archaeological heritage in Egypt.
As for urban areas and roads, heat islands, originating from hot air arising from heated buildings in cities and towns, represent the main concern in hot arid climates. Egypt’s urban centers largely suffer from this effect. An increase in temperatures as a result of climate change will exacerbate the situation. Such an increase will also seriously affect roads causing more significant deformations.
For the health sector, climate change will contribute to the burden of diseases in Egypt through direct and indirect effects. Direct impacts are perceived to include heat strokes and heat related phenomena especially to the elderly and children, skin cancers, eye cataracts and deaths. The indirect impacts are perceived to be mainly linked with the shortage of water supply and decreased agricultural land area leading to shortage of essential food with the possible emergence of malnutrition. Increased incidence of diseases associated with climate change include communicable diseases; such as parasitic, bacterial and viral diseases, and non-communicable diseases; such as cardiovascular diseases, respiratory diseases, cancers, and malnutrition.
The following additional adaptation policies and measures are being considered by national authorities in Egypt: building institutional capacities for integrated monitoring and geographic data collection and analysis, identifying indicators and carrying out full assessment of vulnerable sectors, sites and stakeholders; enforcing environmental regulations, identifying and carrying out protection measures of vulnerable touristic and archeological sites and roads against extreme events (flash floods, dust storms and storm surges); building capacities on regional circulation models, proactive planning, integrated coastal zone management and risk reduction; upgrading resilience of stakeholders through increased awareness of energy and water conservation needs, improving health and socioeconomic infrastructure, establishing employment opportunities in safe areas, strengthening research institutions particularly in areas of renewable energy and the establishment of early warning systems, as well as improving the management of Red Sea diving sites.
xxiii
E-SNC
E-SNC
1
EGYPT SECOND NATIONAL COMMUNICATION
E-SNC
E-SNC
CHAPTER I. NATIONAL CIRCUMSTANCES
1. Introduction
2. Geographic Situation
3. Climate Profile
4. Population
5. Government Structure
6. Egyptian Economy
7. Egypt Natural Resources
8. Profile of the Key Sectors
9. Institutional Framework for Climate Change
E-SNC
E-SNC
3
EGYPT SECOND NATIONAL COMMUNICATION
E-SNC
E-SNC
I. NATIONAL CIRCUMSTANCES
I. 1. Introduction
Based on decision 17/CP.8 Guidelines, this report is an update of the «Initial National Communication» (INC) of Egypt issued in 1999, for which the cutoff date was 1996. The current report, with a cutoff date of 2007, reflects the significant changes in Egypt’s national circumstances, relevant to climate change and the classification of Egypt as a developing country in the UNFCCC.
I. 2. Geographic Situation
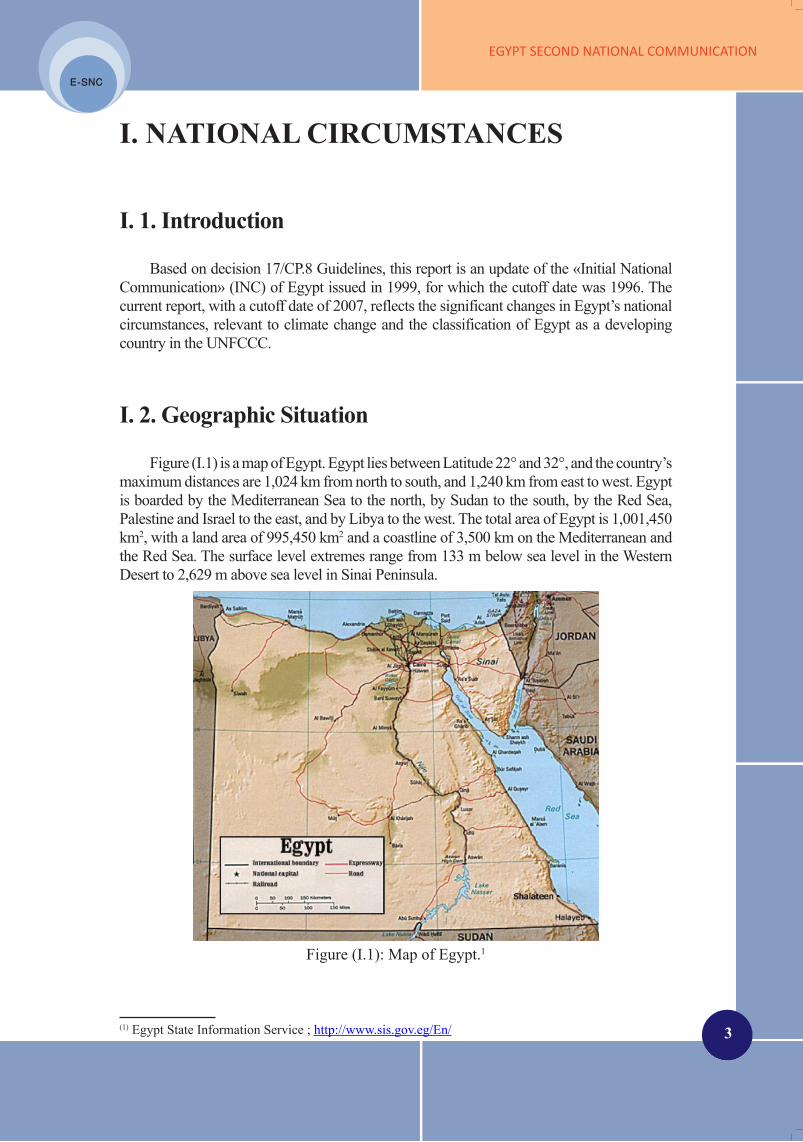
Figure (I.1) is a map of Egypt. Egypt lies between Latitude 22° and 32°, and the country’s maximum distances are 1,024 km from north to south, and 1,240 km from east to west. Egypt is boarded by the Mediterranean Sea to the north, by Sudan to the south, by the Red Sea, Palestine and Israel to the east, and by Libya to the west. The total area of Egypt is 1,001,450 km2, with a land area of 995,450 km2 and a coastline of 3,500 km on the Mediterranean and the Red Sea. The surface level extremes range from 133 m below sea level in the Western Desert to 2,629 m above sea level in Sinai Peninsula.
Figure (I.1): Map of Egypt.1
(1) Egypt State Information Service ; http://www.sis.gov.eg/En/

4
CHAPTEr I NATIONAL CIrCUMSTANCES
E-SNC
E-SNC
E-SNC
E-SNC
I. 3. Climate Profile
The general climate of Egypt is dry, hot, and desertic. During the winter season (December – February), Lower Egypt’s climate is mild with some rain, primarily over the coastal areas, while Upper Egypt’s climate is practically rainless with warm sunny days and cool nights. During the summer season (June-August), the climate is hot and dry all over Egypt. Figures (I.2) to (I.4) illustrate the mean air temperature, relative humidity and precipitation over the Egyptian territory.
Figure (I.2): Average annual mean of daily temperature (°C).2
Figure (I.3): Annual mean of daily relative humidity (%).2
(2) Egyptian Environmental Affairs Agency (2001), “The National Environmental Action Plan (NEAP)”, Cairo, Egypt.
E-SNC
E-SNC
5
EGYPT SECOND NATIONAL COMMUNICATION
E-SNC
E-SNC
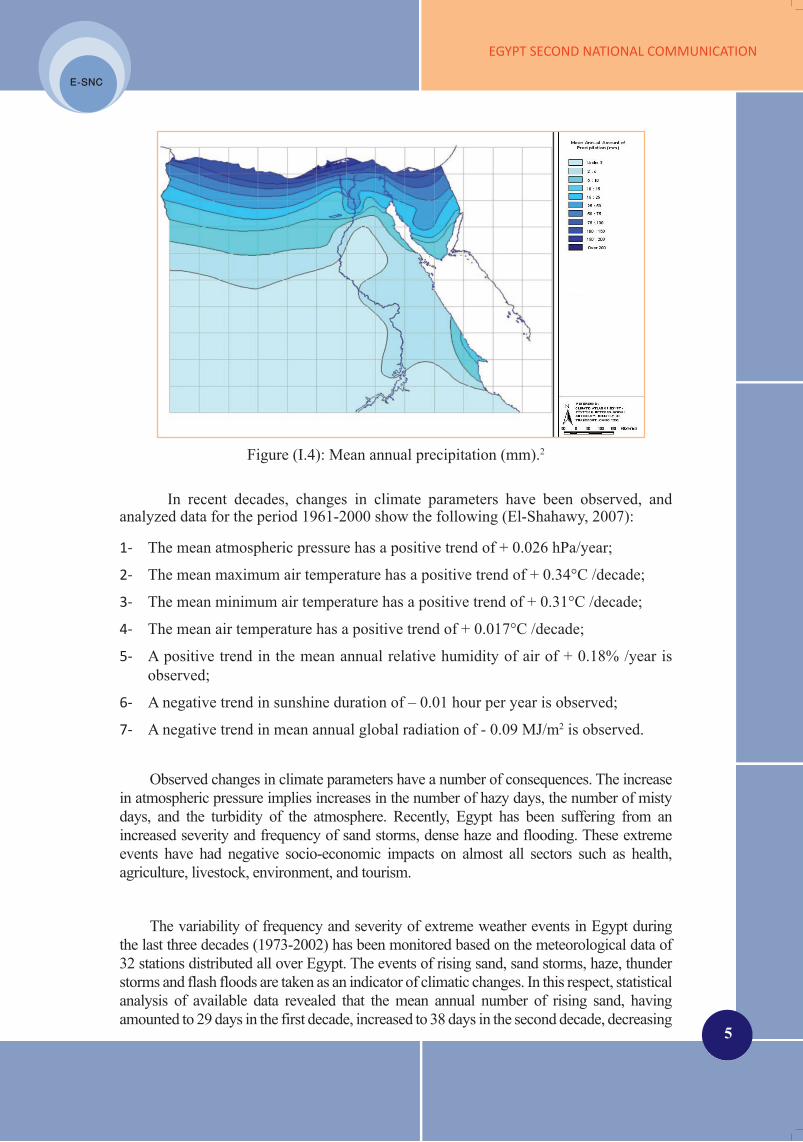
Figure (I.4): Mean annual precipitation (mm).2
In recent decades, changes in climate parameters have been observed, and analyzed data for the period 1961-2000 show the following (El-Shahawy, 2007):
The mean atmospheric pressure has a positive trend of + 0.026 hPa/year;1-
The mean maximum air temperature has a positive trend of + 0.34°C /decade; 2-
The mean minimum air temperature has a positive trend of + 0.31°C /decade; 3-
The mean air temperature has a positive trend of + 0.017°C /decade;4-
A positive trend in the mean annual relative humidity of air of + 0.18% /year is 5- observed;
A negative trend in sunshine duration of – 0.01 hour per year is observed;6-
A negative trend in mean annual global radiation of - 0.09 MJ/m7- 2 is observed.
Observed changes in climate parameters have a number of consequences. The increase in atmospheric pressure implies increases in the number of hazy days, the number of misty days, and the turbidity of the atmosphere. Recently, Egypt has been suffering from an increased severity and frequency of sand storms, dense haze and flooding. These extreme events have had negative socio-economic impacts on almost all sectors such as health, agriculture, livestock, environment, and tourism.
The variability of frequency and severity of extreme weather events in Egypt during the last three decades (1973-2002) has been monitored based on the meteorological data of 32 stations distributed all over Egypt. The events of rising sand, sand storms, haze, thunder storms and flash floods are taken as an indicator of climatic changes. In this respect, statistical analysis of available data revealed that the mean annual number of rising sand, having amounted to 29 days in the first decade, increased to 38 days in the second decade, decreasing
6
CHAPTEr I NATIONAL CIrCUMSTANCES
E-SNC
E-SNC
E-SNC
E-SNC
to 33 days in the third decade. With regards to sand storm days, these amounted to 29 days, 17 days and 13 days in the first, second and third decade respectively. The continuous decrease of the mean number of sand storm days could be interpreted as a reflection in an increased atmospheric stability. Consistent with these findings are the records for mean annual number of hazy days over Egypt which increased from 20 days in the first decade to 61 days in the second decade, and 67 days in the third decade. The occurrence of hazy days in the third decade exceeded 200 days in the Greater Cairo area as well as in Tanta city and Luxor city. The prevalence of air pollution episodes in these cities could also be an indicator for growing atmospheric stability, in addition to increased emissions from industries, traffic and other human activities.
The number of days of maximum temperature equaling to or exceeding 45 °C have increased in Upper Egypt from 50 days in the first decade to 52 days in the second decade, reaching 69 days in the third decade. In addition, the extremely hot days in the Western Desert amounted to 37 days in the third decade, compared to 22 days in each of the prior decades. The rest of Egypt did not experience increase in the number of days with a peak temperature of 45 °C or more.
The Mediterranean coast of Egypt experienced successive increases in the amount of annual rainfall during the last three decades. The mean trend over the area is + 0.76 mm per year.
I. 4. Population
At the time of the last census (2006), the total Egyptian population amounted to 76.5 million with 72.6 million living inside Egypt and 3.9 million living abroad. This compares with a total Egyptian population of 61.5 million in 1996. In 2008, the total population reached 79 million, with a recorded average growth rate of about 2.3% per year, stable for the past 10 years.
If the fertility rate remains unchanged, the projection for Egypt’s population is 82 million by 2010, 100 million by 2020 and 119 million by 2030. On the other hand, if the population control strategy is successfully implemented, the population of Egypt is expected to be 92 million by 2020 and 104 million by 2030. These high rates of natural population growth have placed profound pressures on both the environment and the economy, given the limited available natural resources. This is reflected by the following:
Encroachment on the limited agricultural land by more inhabitants and a higher 1- population density. For 2005, cultivated land amounted to 8.3 million acres, with a cultivated land area being 0.1 acre per capita;Serious regression of the per capita annual share of water. Considering Egypt’s 2- fixed share of Nile water (55.5 billion m3 annually), the share of fresh water per

E-SNC
E-SNC
7
EGYPT SECOND NATIONAL COMMUNICATION
E-SNC
E-SNC
capita in the early nineties was 1000 m3, and it is estimated to reach 554 m3 by 2020 and 468 m3 by 2030, assuming the population growth rate remains unchanged;Handicapping size of the national budget necessary for basic population needs 3- such as housing, sanitation, job creation, education, roads, transportation, energy, electricity, etc;
Difficulty to ensure basic food supply and the implementation of poverty alleviation 4- programs.
I. 5. Government Structure
Egypt has been a republic since 18 June 1953. A referendum in 1970 approved the Constitution of Egypt, which was amended in 1980, 2005 and 2007. The Egyptian constitution declares Egypt to be a “democratic republic”, operating under a “multiparty system”.
The Government of Egypt consists of an executive branch, a legislative branch and a judiciary branch. The President’s powers stem from his ability to appoint the Prime Minister and one or more Vice-Presidents. However, the President’s choice of the Prime Minister has to yield and maintain the approval of the People’s Assembly (Parliament).
The People’s Assembly meets for a nine-month session each year, and under special circumstances the President can call for additional sessions. The Assembly sits for a five-year term, but can be dissolved earlier by the President. The Shura Council, a 264-member second house of Parliament, established in 1980, has limited legislative powers.
The European, primarily French, legal system and methods provide the basis for the Egyptian judicial system. In the past few decades, the courts have demonstrated increasing independence, and the principles of due process and judicial review have gained greater respect. The Napoleonic Code is the source of the legal code in Egypt.
I. 6. Egyptian Economy
The profile and indicators of the Egyptian economy are typical of a developing country in the middle income category. Table (I.1) presents the Egyptian Gross National Product (GNP) per capita through the period 1997 to 2006. The Egyptian population inside Egypt was 61.5 million in 1996, increasing to 72.6 in 2006. The Gross Domestic Product (GDP) was 78.44 billion US$ in 1996, increasing to 107.43 billion US$ in 2006. The Egyptian workers’ remittances and other Egyptian external incomes are added to the GDP to produce a slight increase in the Gross National Product (GNP). The values of the GNP were 82.65 billion US$ in 1997, increasing to 112.94 billion US$ in 2006.

8
CHAPTEr I NATIONAL CIrCUMSTANCES
E-SNC
E-SNC
E-SNC
E-SNC
In 2008, the World Bank introduced its criteria for countries’ economic development (World Bank, 2008). The document was issued following the changes in terminology adopted by the World Bank in its 1993 System of National Accounts (SNA) where the terminology «Gross National Product, GNP” is substituted by a new terminology “Gross National Income, GNI”. According to this, countries are categorized as low income counties with a GNP per capita of $975 or less, lower middle income countries with a GNP per capita of $976 - $3,855, and upper middle income countries with a GNP per capita of $3,856 - $11,905. High income countries are those with a GNP of $11,906 or more.
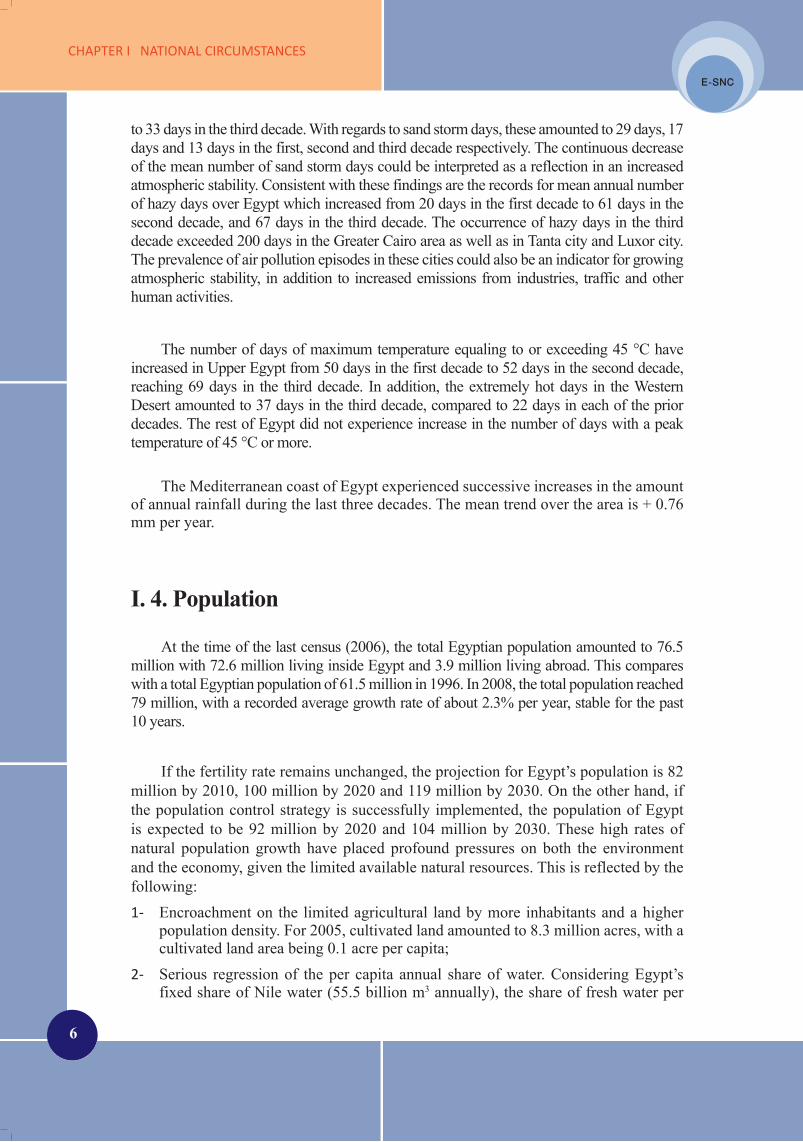
The GNP per capita in Egypt was 1,391 US$ in 1997, increasing to 1,556 US$ in 2006. In this respect, Egypt is categorized as a lower middle income country. Figure (I.5) presents the growth rate of Egypt’s GDP based on 1981/82 fixed prices. It can be seen that the growth rate ranged from 1.15% to 7.28% in the period from 1990 to 2007, with an average growth rate of 4.47%.for this same period.
Table (I.1): Gross National Product (GNP) for the period 1997 to 2006, at market prices in US$.
Year
Egyptian population
inside Egypt*
(million)
GDP** market price,
(billionLE)
GNP** market price
(billion LE)
Average Exchange Rate***
(LE/US$)
GDP market price
(billion US$)
GNP market price
(billion US$)
GNP per
Capita (US$)
1997 59.4 265.9 280.2 3.39 78.44 82.65 1,3911998 60.7 287.4 304.1 3.39 84.78 89.71 1,4781999 62.0 307.6 323.8 3.39 90.74 95.52 1,5412000 63.3 340.1 356.1 3.41 99.74 104.43 1,6502001 64.7 358.7 373.6 3.68 97.47 101.52 1,5692002 66.0 378.9 393.1 4.45 85.15 113.94 1,7262003 67.3 417.5 432.2 5.15 81.15 84.00 1,2482004 68.6 485.3 502.8 6.17 78.65 81.49 1,1882005 70.0 538.5 563.1 6.01 89.60 93.69 1,3382006 72.6 617.7 649.4 5.75 107.43 112.94 1,556
* CAPMAS Bulletins. ** Ministry of Economic Development (2007), “Series of Basic Data of Production, Investment, Employment and Wages, 1981-2007”, Cairo, Egypt. *** Average Exchange rate is determined based on data from the Central Bank of Egypt.
E-SNC
E-SNC
9
EGYPT SECOND NATIONAL COMMUNICATION
E-SNC
E-SNC
Figure (I.5): The growth rate of Egypt’s Real Gross Domestic Product (GDP) in LE.3
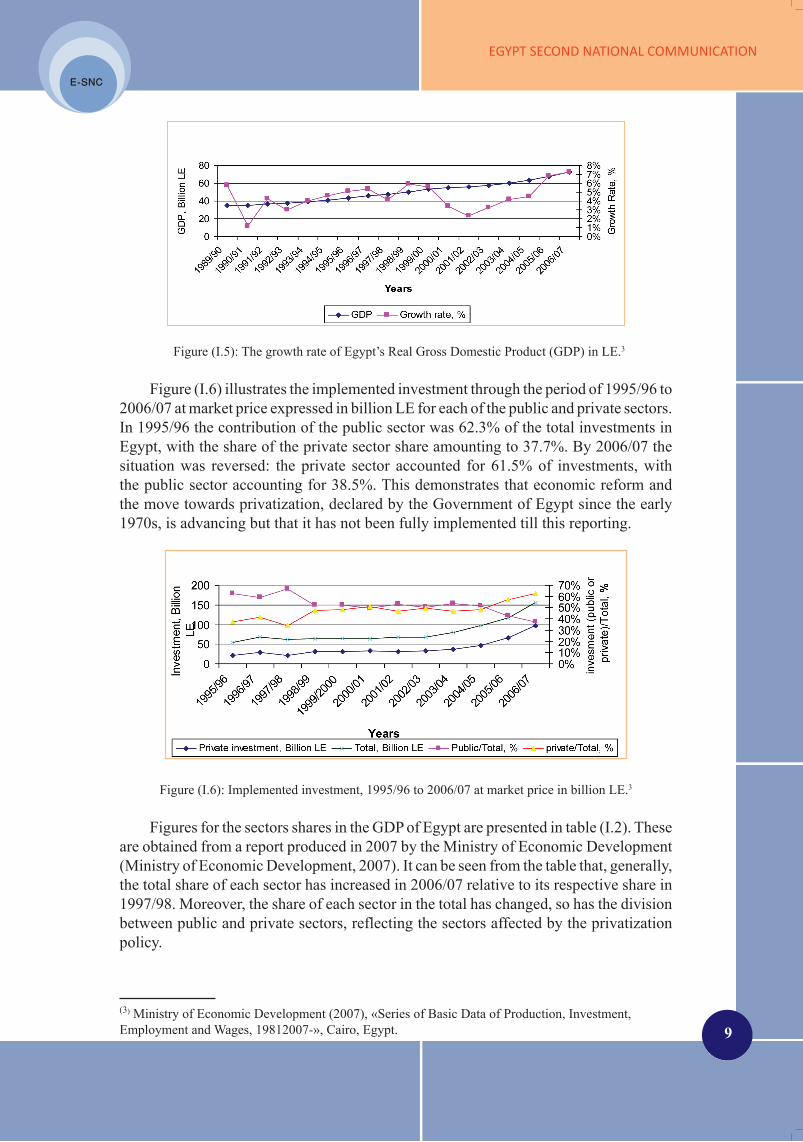
Figure (I.6) illustrates the implemented investment through the period of 1995/96 to 2006/07 at market price expressed in billion LE for each of the public and private sectors. In 1995/96 the contribution of the public sector was 62.3% of the total investments in Egypt, with the share of the private sector share amounting to 37.7%. By 2006/07 the situation was reversed: the private sector accounted for 61.5% of investments, with the public sector accounting for 38.5%. This demonstrates that economic reform and the move towards privatization, declared by the Government of Egypt since the early 1970s, is advancing but that it has not been fully implemented till this reporting.
Figure (I.6): Implemented investment, 1995/96 to 2006/07 at market price in billion LE.3
Figures for the sectors shares in the GDP of Egypt are presented in table (I.2). These are obtained from a report produced in 2007 by the Ministry of Economic Development (Ministry of Economic Development, 2007). It can be seen from the table that, generally, the total share of each sector has increased in 2006/07 relative to its respective share in 1997/98. Moreover, the share of each sector in the total has changed, so has the division between public and private sectors, reflecting the sectors affected by the privatization policy.
(3) Ministry of Economic Development (2007), «Series of Basic Data of Production, Investment, Employment and Wages, 19812007-», Cairo, Egypt.

10
CHAPTEr I NATIONAL CIrCUMSTANCES
E-SNC
E-SNC
E-SNC
E-SNC
Table (I.2): Sectors percentage shares in the GDP of Egypt.
Sectors1997/1998 2006/2007
Public(%)
Private(%)
Total(%)
Public(%)
Private(%)
Total(%)
Agriculture 0.1 17.0 17.1 0.0 13.8 13.8Industry and Mining 3.6 14.7 18.3 1.7 14.3 16.0
Petroleum & its Products 5.0 0.8 5.8 13.3 2.7 16.0
Electricity 1.6 0.0 1.6 1.2 0.2 1.4
Construction 2.1 3.0 5.1 0.5 3.9 4.4
Transportation 1.3 4.3 5.6 0.9 3.4 4.3
Communications 1.2 0.0 1.2 1.1 1.0 2.1
Suez Canal 2.3 0.0 2.3 4.1 0.0 4.1
Trading 0.8 16.4 17.2 0.4 11.0 11.4Finance 3.9 1.6 5.5 3.2 1.7 4.9
Private Insurance 0.1 0.0 0.1 0.2 0.1 0.3
Hotels & Restaurants 0.0 1.2 1.2 0.0 3.6 3.6
Housing & Real Estate 0.1 1.7 1.8 0.1 1.5 1.6
Public Facilities 0.4 0.0 0.4 0.4 0.0 0.4
Social Insurance 0.1 0.0 0.1 1.9 0.0 1.9
Social, Governmental and Personal Services
8.9 7.8 16.7 9.5 4.3 13.8
Total 31.5 68.5 100.0 38.5 61.5 100.0
The shares of the basic economical sectors; agriculture, industry, electricity, construction and transportation, have slightly decreased for 2006/07 relative to 1997/98. The growing sectors have been the sectors of petroleum, Suez Canal, tourism (hotels and restaurants), social insurance and social services. Starting 2001/02, the private sector has taken a share in the electricity sector for the first time, with this share increasing to 0.2% in the GDP for 2006/07. A 7% increase in the total share in the GDP was realized by the public sector, which seems inconsistent with privatization reforming. However, this is due to the substantial growth in the petroleum sector: the shares of the public sector for Petroleum and its Products increased from 5.0% in 1997/98 to 13.3% in 2006/07.
E-SNC
E-SNC
11
EGYPT SECOND NATIONAL COMMUNICATION
E-SNC
E-SNC
I. 7. Egypt Natural Resources
Egypt’s natural resources can be classified as land, water and coasts. Their uses, as well as issues relevant to climate change, are presented in this section.
I. 7. 1. Land
The population density in Egypt is among the highest in the world. About 97% of the population lives on an estimated 4% (40,080 km2) of the total area of Egypt. This yields an average population density of 1,435 persons per km2. This national average, however, conceals wide variations among governorates, and between urban and rural areas within a single governorate.
The Initial National Communication specified that four comprehensive development 5-year plans have been developed by the Government of Egypt. The plans were launched for implementation in 1996 to continue till 2017. Part of these plans is the construction of new cities in desert areas for resettling millions of Egyptians beyond the narrow Nile Valley, so that the populated areas will cover 25% of Egypt’s land area, rather than 4%.
In the decade of 1996 to 2006, five large new cities were constructed by the Ministry of Housing, Utilities, and Urban Communities around Greater Cairo, to be centers for industry and services. They encompass the 6th of October, 15th of May, El-Obour, the 10th of Ramadan and El Sadat. Some of the old cities in the Nile Valley, the Mediterranean coastal zone and the Red Sea coast underwent restructuring and new extensions. Some of these cities have been developed as centers for serving agribusinesses, such as Al-Mahala Al-Koubra and El-Mansoura, while others were developed as centers for transportation services and ports, such as Suez and Port Said, and a third group was developed for recreational and tourism facilities, such as Sharm El-Sheikh, Hurghada and Luxor. In addition, extensions of old cities in the Nile Valley have been developed and constructed in desert areas just outside the Nile Valley, whenever possible, in order to attract populations out to these new cities, which have their own facilities and industrial zones, and which are designed for low population densities. This is particularly noticeable in Upper Egypt starting from Beni Sueif to Aswan. These new cities are expected to decrease the loss of agricultural land to urbanization. Construction carried in these new cities generally follows the green building criteria of minimum air conditioning, maximum natural lighting and local building materials. In this respect, these new cities can be considered as part of the adaptation activities to climate change.
In parallel to the construction of new cities, a large network of roads has been developed. This network covers and connects all urban areas in Egypt, and as a result of its size, it is expected to present a burden for maintenance against the expected excessive heat due to climate change.

12
CHAPTEr I NATIONAL CIrCUMSTANCES
E-SNC
E-SNC
E-SNC
E-SNC
I. 7. 2. Water Resources
Egypt’s water resources are limited to the natural flow of River Nile which presents about 95% of the country’s water budget. The remaining 5% are constituted from groundwater and rainfall. The country’s quota of Nile water is fixed at 55.5 billion m3 per year according to an agreement signed in 1959. Inflowing Nile water is stored in Lake Nasser shared between Egypt and Sudan, a lake which can store more than 160 billion m3 of water at its full storage capacity (El Quosy, 2007). There are two non-renewable aquifers of groundwater namely the Nubian Sandstone aquifer and the Limestone aquifer. They cover more than 50% of the area of the country. Rain falls on the Mediterranean coastal line, with maximum intensity occurring during the winter season. The rainfall does not exceed 130-170 mm on the coast and decreases inland.
In light of the above information, Egypt’s total water budget is estimated at about 58 billion m3, with the shares of water resources being 95% for River Nile, 1.5% for water aquifers and 3.5% for rainfall. Additional to the 55.5 billion m3 per year of Nile water, safe abstraction from deep aquifers may reach 1.0 billion m3 annually. The maximum possible use of water from both deep and shallow aquifers may reach 6.0 billion m3
annually. Rainfall does not exceed 1.2 billion m3 per year, however, effective rain is much less than this amount.
Currently, recycling of some used waters is carried out with the objective of covering the deficit between Egypt’s water supply and demand. Most agricultural drainage waters of the upper part of Egypt returns back to the main course of the Nile. This amount is estimated at 4.0 billion m3 per year. Another 4.0 billion m3 per year of agricultural drainage water are reused in the southern part of the Nile Delta through mixing with fresh water. In this respect, total recycled waters amount to 8.0 billion m3
annually. By the completion of Al Salam Canal Project, an additional 3.0 billion m3 of water annually will be recycled per year, and the current annual rate of abstraction from the shallow aquifer is about 4.0 billion m3 per year, totaling the recycled water volume to an estimated 15.0 billion m3 annually.
Treated sewage and industrial effluent form part of the water budget in Egypt. The order of magnitude of treated wastewater is expected to reach 3 to 4 billion m3 per year in the near future. Most of summer and winter resorts on the Red Sea, in the Sinai Peninsula, and on the North West coast are provided with desalination plants of small and moderate sizes.
In summary, the total yearly water budget in Egypt is composed of 58 billion m3 of fresh water, 15 billion m3 of recycled water and 4 billion m3 of treated sewage water, thus amounting to a total of 77 billion m3 of available waters for use per year.
Regarding water demand, agriculture is the main consumer of water in Egypt, using about 62 billion m3 per year, which represent about 80% of the country’s water budget. Drinking water, covering more than 95% of the Egyptian population, uses almost 8 billion m3 per year, representing about 10% of the country’s water budget. Industrial water consumption amounts to about 7.5 billion m3 annually, representing another 10% of the country’s water budget. Thus, currently, Egypt’s total water demand
E-SNC
E-SNC
13
EGYPT SECOND NATIONAL COMMUNICATION
E-SNC
E-SNC
is critically covered by recycling agriculture drainage water and the use of treated municipal sewage water. Demand-side management requires expensive development of agriculture irrigation methods, and any expansions in the water budget would require the development of expensive water treatment methods.
I. 7. 3. Coastal Zones
The coastal zones of Egypt extend for over 3,500 km in length along the Mediterranean and Red Sea coasts. The Mediterranean shoreline is most vulnerable to sea level rise due to its relative low elevation in Egypt compared to the land around it. The wetlands of the Nile delta constitute about 25% of the total area of wetlands in the Mediterranean region, and produce over 60% of the fish catch of Egypt. The northern coastal zone of Egypt is about 1200 km long. The Mediterranean coast is developed for recreational tourism, with the six cities of El-Arish, Port Said, Damietta, Rosetta, Alexandria and Mersa Matrouh. Alexandria, Port Said and Damietta are also industrial towns. The Red Sea and South Sinai coasts are international tourism zones, with diving being the main activity. In addition to increased tourism activities, a tremendous move towards building new industrial complexes is in progress in the northern and the eastern coasts. An international road connecting the most eastern and western towns in Egypt, Rafah and El-Salloum, respectively, was constructed parallel to the northern coast. The road specifications and level are not designed for protecting the land from sea level rise caused by global warming.
The coastal zones of Egypt suffer from a number of serious problems including unplanned development, land subsidence, excessive erosion rates, water logging, salt water intrusion, soil salinization and ecosystem degradation. Given Egypt’s growing population, its limited fertile land, and the concentration of a sizable part of its economic activities in the coastal zones, the potential social and economic impacts of climate change would be serious on the country’s future.
I. 8. Profile of the Key Sectors
The main key sectors relevant to climate change entail the sectors of energy, transportation, industry, agriculture and waste. Their activities produce GHG emissions, and climate change represents a potential threat to them.
I. 8.1. Energy
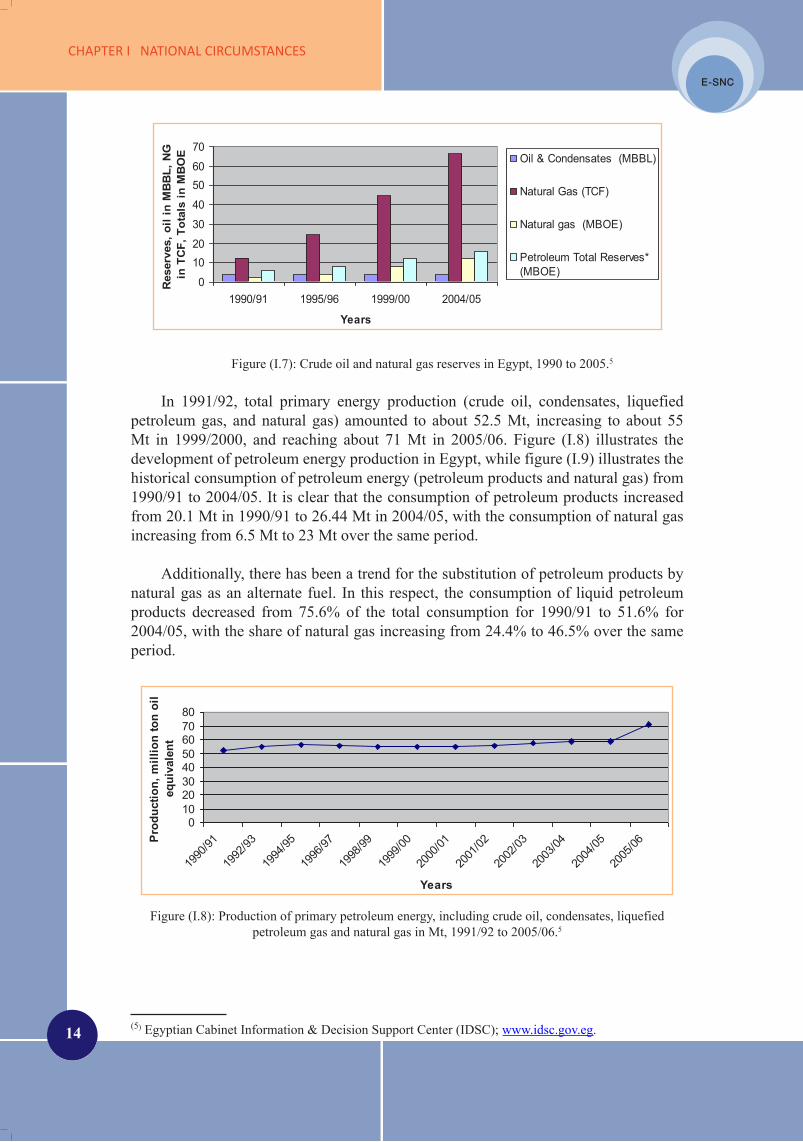
Currently and in recent decades, fossil fuels of petroleum products and natural gas have represented the main sources of primary energy in Egypt. Figure (I.7) illustrates the crude oil and natural gas reserves in Egypt for 1990-2005. The petroleum oil reserves are almost constant at 3.7 million barrels4. Since the early 1990’s, large amounts of natural gas reserves have been discovered. These reserves increased from 12.3 trillion ft3 in 1990/91 to 66.3 ft3 in 2004/05.(4) 1 ton crude oil = 7.3 crude barrels crude, 1 barrel equivalent natural gas = 5000 cubic feet (ft3)
natural gas.
14
CHAPTEr I NATIONAL CIrCUMSTANCES
E-SNC
E-SNC
E-SNC
E-SNC
Figure (I.7): Crude oil and natural gas reserves in Egypt, 1990 to 2005.5
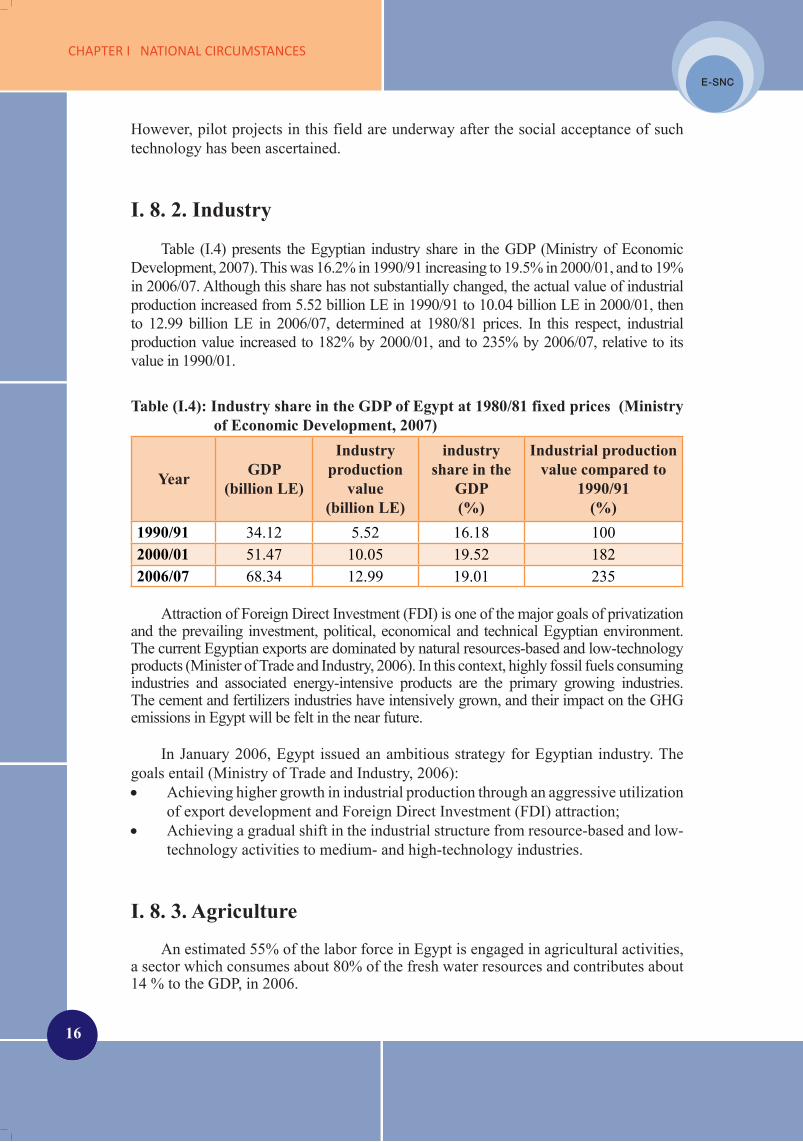
In 1991/92, total primary energy production (crude oil, condensates, liquefied petroleum gas, and natural gas) amounted to about 52.5 Mt, increasing to about 55 Mt in 1999/2000, and reaching about 71 Mt in 2005/06. Figure (I.8) illustrates the development of petroleum energy production in Egypt, while figure (I.9) illustrates the historical consumption of petroleum energy (petroleum products and natural gas) from 1990/91 to 2004/05. It is clear that the consumption of petroleum products increased from 20.1 Mt in 1990/91 to 26.44 Mt in 2004/05, with the consumption of natural gas increasing from 6.5 Mt to 23 Mt over the same period.
Additionally, there has been a trend for the substitution of petroleum products by natural gas as an alternate fuel. In this respect, the consumption of liquid petroleum products decreased from 75.6% of the total consumption for 1990/91 to 51.6% for 2004/05, with the share of natural gas increasing from 24.4% to 46.5% over the same period.
Figure (I.8): Production of primary petroleum energy, including crude oil, condensates, liquefied petroleum gas and natural gas in Mt, 1991/92 to 2005/06.5
(5) Egyptian Cabinet Information & Decision Support Center (IDSC); www.idsc.gov.eg.
All Petroleum Production (Oil, Condensate, LPG and NG))
01020304050607080
1990
/91
1992
/93
1994
/95
1996
/97
1998
/99
1999
/00
2000
/01
2001
/02
2002
/03
2003
/04
2004
/05
2005
/06
Years
Prod
uctio
n, m
illio
n to
n oi
l eq
uiva
lent
Total Consumption oil and NG
0102030405060
1990/91 1995/96 1999/00 2004/05
Years
Cons
umpt
ion,
mill
ion
ton
oil e
quiv
alen
t
Petroleum Products Natural gas Total Petroleum & Gas Energy
Oil and NG Reserves in Egypt
010203040506070
1990/91 1995/96 1999/00 2004/05
Years
Res
erve
s, o
il in
MB
BL,
NG
in
TC
F, T
otal
s in
MB
OE Oil & Condensates (MBBL)
Natural Gas (TCF)
Natural gas (MBOE)
Petroleum Total Reserves*(MBOE)

E-SNC
E-SNC
15
EGYPT SECOND NATIONAL COMMUNICATION
E-SNC
E-SNC
Figure (I.9): Consumption of petroleum products and natural gas in Mt, 1990/91 to 2005/06.5
Table (I.3) presents sector consumption of liquefied petroleum products, where the transportation sector represents the main consumer with a share of total consumption of liquefied petroleum products of 36.8% in 1991/92, increasing to 41% in 2004/05. In this respect, there has been a 175% increase in the number of registered vehicles for the period of 1990 to 2005. Table (I.3): Sector consumption of liquefied petroleum products
Year Industry(MTOE)
Transport(MTOE)
Agriculture(MTOE)
Residential& Commercial
(MTOE)
Electricity(MTOE)
Petroleum industries(MTOE)
Total(MTOE)
1991/92 5.1 7.5 0.2 3.1 4.2 0.3 20.4
2000/01 7.1 9.9 0.1 3.7 2.0 1.0 23.8
2004/05 5.9 11.3 1.7 4.1 3.9 0.6 27.5
Most of the available hydropower resources in Egypt are generated by the High Dam at Aswan. Hydropower represented about 11% of the total energy generated in Egypt for 2006/07. Coal production is about 1.2 Mt per year, primarily used for Helwan steel works.
Regarding solar power, Egypt enjoys sunshine all year round, with direct solar radiation varying between 1,970 kWh/m2/year and 3,200 kWh/m2/year, representing considerable potential for solar energy utilization. Currently, there are serious efforts for promoting efficiency and decreasing the cost of solar energy utilization, in order to render solar power financially competitive with traditional energy resources.
Large wind energy potential is available on the western coast of the Gulf of Suez. Zaafarana has been selected for setting up large-scale grid-connected wind farms. Currently, six grid-connected wind farms of 60 MW each are in operation with another 120 MW wind farm under construction to be operational by 2010.
The total biomass energy currently used in Egypt is estimated at about 3.6 million TOE per year originating from sugar cane and agricultural crop residues, as well as animal and solid waste. Biogas has so far been given low priority in energy policies.
All Petroleum Production (Oil, Condensate, LPG and NG))
01020304050607080
1990
/91
1992
/93
1994
/95
1996
/97
1998
/99
1999
/00
2000
/01
2001
/02
2002
/03
2003
/04
2004
/05
2005
/06
Years
Prod
uctio
n, m
illio
n to
n oi
l eq
uiva
lent
Total Consumption oil and NG
0102030405060
1990/91 1995/96 1999/00 2004/05
Years
Cons
umpt
ion,
mill
ion
ton
oil e
quiv
alen
t
Petroleum Products Natural gas Total Petroleum & Gas Energy
Oil and NG Reserves in Egypt
010203040506070
1990/91 1995/96 1999/00 2004/05
Years
Res
erve
s, o
il in
MB
BL,
NG
in
TC
F, T
otal
s in
MB
OE Oil & Condensates (MBBL)
Natural Gas (TCF)
Natural gas (MBOE)
Petroleum Total Reserves*(MBOE)
16
CHAPTEr I NATIONAL CIrCUMSTANCES
E-SNC
E-SNC
E-SNC
E-SNC
However, pilot projects in this field are underway after the social acceptance of such technology has been ascertained.
I. 8. 2. Industry
Table (I.4) presents the Egyptian industry share in the GDP (Ministry of Economic Development, 2007). This was 16.2% in 1990/91 increasing to 19.5% in 2000/01, and to 19% in 2006/07. Although this share has not substantially changed, the actual value of industrial production increased from 5.52 billion LE in 1990/91 to 10.04 billion LE in 2000/01, then to 12.99 billion LE in 2006/07, determined at 1980/81 prices. In this respect, industrial production value increased to 182% by 2000/01, and to 235% by 2006/07, relative to its value in 1990/01.
Table (I.4): Industry share in the GDP of Egypt at 1980/81 fixed prices (Ministry of Economic Development, 2007)
Year GDP(billion LE)
Industry production
value(billion LE)
industry share in the
GDP(%)
Industrial production value compared to
1990/91(%)
1990/91 34.12 5.52 16.18 1002000/01 51.47 10.05 19.52 1822006/07 68.34 12.99 19.01 235
Attraction of Foreign Direct Investment (FDI) is one of the major goals of privatization and the prevailing investment, political, economical and technical Egyptian environment. The current Egyptian exports are dominated by natural resources-based and low-technology products (Minister of Trade and Industry, 2006). In this context, highly fossil fuels consuming industries and associated energy-intensive products are the primary growing industries. The cement and fertilizers industries have intensively grown, and their impact on the GHG emissions in Egypt will be felt in the near future.
In January 2006, Egypt issued an ambitious strategy for Egyptian industry. The goals entail (Ministry of Trade and Industry, 2006):
Achieving higher growth in industrial production through an aggressive utilization •of export development and Foreign Direct Investment (FDI) attraction;Achieving a gradual shift in the industrial structure from resource-based and low-•technology activities to medium- and high-technology industries.
I. 8. 3. Agriculture
An estimated 55% of the labor force in Egypt is engaged in agricultural activities, a sector which consumes about 80% of the fresh water resources and contributes about 14 % to the GDP, in 2006.

E-SNC
E-SNC
17
EGYPT SECOND NATIONAL COMMUNICATION
E-SNC
E-SNC
Egyptian agricultural land can be classified into: “Old-land” comprising the lands of the Nile Valley and the Nile Delta which have been irrigated and intensively cultivated since ancient times, and which represent about 80% of the cultivated area; “New-land” entailing lands that have been reclaimed relatively recently or are in the process of being reclaimed now (International Fund for Agricultural Development, 2005), representing about 20% of the cultivated area. The cultivated land base of Egypt is about 3.5 million hectares, with a total annual cropping area of about 6.2 million hectares, representing 176% of the total cultivated land area (Ministry of Agriculture and Land Reclamation, 2005).
Cultivation and modern irrigation in new lands can be classified as medium to high level. Due to the different conditions of soil, availability and quality of water and climatic conditions, there are two main cropping seasons a year, namely, winter and summer cultivation seasons. In some cases, farmers tend to cultivate a third crop during the period between summer and winter, termed “Nili” season, which may extend for about two months. At the same time, fruit trees are the most important perennial crops. Field crops cultivated in Egypt include maize, rice, cotton and sugarcane as main summer crops, while alfalfa, wheat, barley, green bean, clover, and sugar beet are the main winter field crops. Field crops in Egypt have a superior productivity, which has been improved through the last two decades as a result of switching to new cultivars, applying modern technologies and improving management programs (Allam, 2002). Currently, the crop productivity of new lands is less than that of old lands by a small fraction (Allam and Abdel-Azim, 2007).
Livestock production occupies a prominent stage in agricultural activities. Meat production is much greater than milk production under Egyptian conditions. The main animal types are cows, buffaloes, sheep, goats and camels.
The main agricultural operations relying on machinery in Egypt are soil preparation/tillage, harvesting of field crops, livestock housing. The high level technology is still not feasible for use in the Nile Valley and the Nile Delta because of the high operating costs in the prevailing small areas ownerships.
Limiting factors for agricultural growth in Egypt, some of which raising the vulnerability to climate changes, are:
Egypt’s irrigation system sustains full irrigation for more than 95% of the total 1- cultivated area. The high vulnerability of the agriculture system to climate change impacts in Egypt is attributed to the current critical situation of water consumption in agriculture (Abou Zeid, 2002). The high reliance on low efficiency on-farm irrigation systems, and the lack of land leveling decreases irrigation efficiency to 30% or less. This produces more pressure on both agricultural and water sources sectors (El-Gindy, et al., 2001). Ongoing expansion of irrigated areas will reduce the ability of Egypt to cope with future fluctuations in the Nile River water flow (Conway, 2005).
The fertility and the quality of the Old-lands are severely affected by poor water 2- management and agricultural practices. 2.5 million acres in the irrigated areas suffer from salinization and water logging problems. The majority of salt-affected
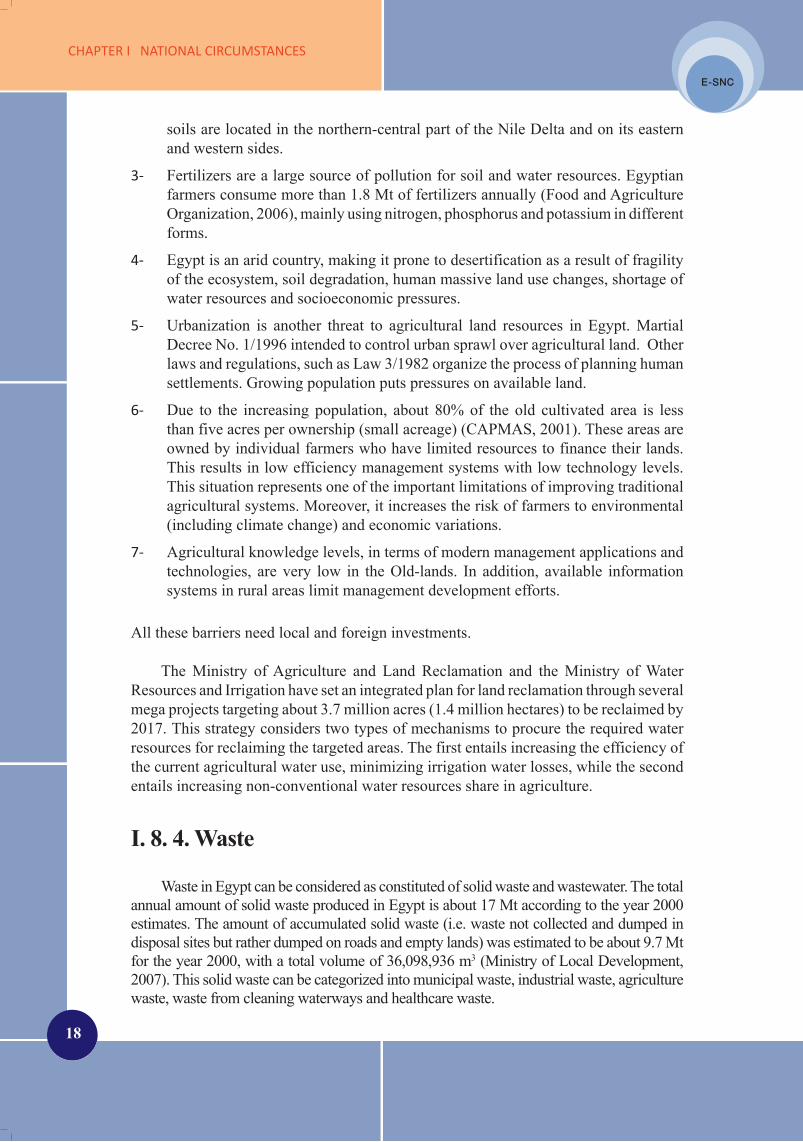
18
CHAPTEr I NATIONAL CIrCUMSTANCES
E-SNC
E-SNC
E-SNC
E-SNC
soils are located in the northern-central part of the Nile Delta and on its eastern and western sides.
Fertilizers are a large source of pollution for soil and water resources. Egyptian 3- farmers consume more than 1.8 Mt of fertilizers annually (Food and Agriculture Organization, 2006), mainly using nitrogen, phosphorus and potassium in different forms.
Egypt is an arid country, making it prone to desertification as a result of fragility 4- of the ecosystem, soil degradation, human massive land use changes, shortage of water resources and socioeconomic pressures.
Urbanization is another threat to agricultural land resources in Egypt. Martial 5- Decree No. 1/1996 intended to control urban sprawl over agricultural land. Other laws and regulations, such as Law 3/1982 organize the process of planning human settlements. Growing population puts pressures on available land.
Due to the increasing population, about 80% of the old cultivated area is less 6- than five acres per ownership (small acreage) (CAPMAS, 2001). These areas are owned by individual farmers who have limited resources to finance their lands. This results in low efficiency management systems with low technology levels. This situation represents one of the important limitations of improving traditional agricultural systems. Moreover, it increases the risk of farmers to environmental (including climate change) and economic variations.
Agricultural knowledge levels, in terms of modern management applications and 7- technologies, are very low in the Old-lands. In addition, available information systems in rural areas limit management development efforts.
All these barriers need local and foreign investments.
The Ministry of Agriculture and Land Reclamation and the Ministry of Water Resources and Irrigation have set an integrated plan for land reclamation through several mega projects targeting about 3.7 million acres (1.4 million hectares) to be reclaimed by 2017. This strategy considers two types of mechanisms to procure the required water resources for reclaiming the targeted areas. The first entails increasing the efficiency of the current agricultural water use, minimizing irrigation water losses, while the second entails increasing non-conventional water resources share in agriculture.
I. 8. 4. Waste
Waste in Egypt can be considered as constituted of solid waste and wastewater. The total annual amount of solid waste produced in Egypt is about 17 Mt according to the year 2000 estimates. The amount of accumulated solid waste (i.e. waste not collected and dumped in disposal sites but rather dumped on roads and empty lands) was estimated to be about 9.7 Mt for the year 2000, with a total volume of 36,098,936 m3 (Ministry of Local Development, 2007). This solid waste can be categorized into municipal waste, industrial waste, agriculture waste, waste from cleaning waterways and healthcare waste.
E-SNC
E-SNC
19
EGYPT SECOND NATIONAL COMMUNICATION
E-SNC
E-SNC
Household waste constitutes about 60% of the total municipal waste quantities, with the remaining 40% being generated by commercial establishments, service institutions, streets and gardens, hotels and other entertainment sector entities. Per capita generation rates in Egyptian cities, villages and towns vary from lower than 0.3 kg for low socio-economic groups and rural areas, to more than 1 kg for higher living standards in urban centers. On a nationwide average, the composition is about 50-60% food wastes, 10-20% paper, and 1-7% each of metals, cloth, glass, and plastics, and the remainder is basically inorganic matter and others.
Currently, solid waste quantities handled by waste management systems are estimated at about 40,000 tons per day, with 30,000 tons per day being produced in cities, and the rest generated from the pre-urban and rural areas. Various studies indicate low waste collection efficiencies, varying between less than 35% in small provincial towns to 77% in large cities.
Final destinations of municipal solid waste entail about 8% of the waste being composted, 2% recycled, 2% landfilled, and 88% dumped in uncontrolled open dumps. In this respect, 16 landfills exist in Egypt: 7 in the Greater Cairo Region, 5 in the Delta governorates and 4 in Upper Egypt. Their capacities range between 0.5 and 12 Mt per day. They are usually operated by private entities. Recently, 53 sites have been identified for new landfills, and the construction of 56 composting plants throughout the country is underway.
Industrial waste is estimated to about 6.2 Mt annually (about 17,000 tons per day). Estimates show that between 80,000 to 300,000 tons of the industrial waste produced is classified as hazardous. Most of the industrial solid waste is produced by 13 industrial cities recently established and 65 industrial zones distributed between the different governorates.
Egypt produces around 25 to 30 Mt of agriculture waste annually (around 66,000 tons per day). Some of this waste is used in the production of organic fertilizers, animal fodder, food production, energy production, or other useful purposes.
Healthcare waste is estimated to about 120,000 tons annually of which about 15,000 tons are hazardous waste. New treatment and disposal units for healthcare waste have been installed in the largest hospitals. They amount to 31 units, handling 2.5-5% of the total amount of healthcare waste generated.
The cost of environmental degradation resulting from solid wastes was estimated as 0.25% of Egypt’s GDP for 2001 (Mediterranean Environmental Technical Assistance Program, 2005), representing a major challenge.
As for wastewater, the National Holding Company of Water and Wastewater manages 147 wastewater treatment plants in the largest towns in Egypt. Their total installed capacity is 10.718 million m3 per day. The total municipal wastewater discharge is estimated to be 13.882 million m3 per day, with the difference of more than
20
CHAPTEr I NATIONAL CIrCUMSTANCES
E-SNC
E-SNC
E-SNC
E-SNC
3 million m3 per day remaining untreated. Other wastewater treatment plants (70 plants) are operated under the supervision of the National Authority for Water and Wastewater, treating 1.745 million m3 per day of wastewater (Osama, “National Circumstances Waste Sector”, 2007), with the rest of produced wastewater, amounting to about 55% of domestic wastewater generated in Egypt, being treated through on-site facilities such as septic tanks. By the end of year 2009, the Holding Company of Water and Wastewater estimates that 100% of the population in Egyptian cities and 11% of village population will be served by sanitary networks.
Industrial wastewater constitutes 39% of the environmental problems of the industrial sector, as it contains dissolved industrial organic and inorganic wastes, solids and metals, all having negative and hazardous impacts with direct reflection on human health (Egyptian Environmental Affairs Agency, 2003). Currently, there are 87 industrial wastewater treatment plants constructed in industrial areas in order to comply with the various relevant laws (Egyptian Environmental Affairs Agency, 2004). Industrial wastewater treatment plants have been introduced in 116 major industrial establishments, and in 2007, funds were allocated for the remaining 25 major polluting industrial establishments to treat 19.6 million m3 of industrial wastewater (Ministry of State for Environmental Affairs, 2007).
The cost of environmental degradation resulting from wastewater was estimated as 1% of Egypt’s GDP for 2001 (Mediterranean Environmental Technical Assistance Program, 2005).
I. 9. Institutional Framework for Climate Change
Non-governmental organizations (NGOs) in Egypt play a key role in formulating and implementing environmental conservation efforts. The Government of Egypt facilitates the growth of the private sector through increasing the scope of incentives aimed at responding to investors’ needs for being fully integrated into the Egyptian economy. The Egyptian Environmental Affairs Agency (EEAA) also encourages the use of cleaner technologies through environmentally-friendly industrial zones and processes aiming at increasing the efficiency of the use of resources, including reuse, recovery and recycling in order to reduce the amounts of waste generated from production activities. However, investment offices in governorates are still needed to facilitate private sector participation. EEAA signed a protocol with the Federation of the Egyptian Industry (FEI) to promote cooperation for environmental protection in Egypt.
Labor unions and political parties are vital in facilitating better environmental management due, in part, to their experience in addressing industrial change, in protecting the workplace and related natural environment, and in promoting socially responsible economic development.
A number of challenges face environmental management and protection in Egypt. One such challenge has been the need for the revision of Law 4/1994 following gained experiences in enforcement and compliance. For example, limit values stated in the
E-SNC
E-SNC
21
EGYPT SECOND NATIONAL COMMUNICATION
E-SNC
E-SNC
executive regulations were found to be vague, therefore needing to be revised in order to improve enforcement and compliance. In this respect, EEAA introduced amendments, including them in the new environmental Law 9/2009.
The most significant constraint to effective environmental policy making and implementation in Egypt is the lack of reliable and timely information indicating how various sectors of society impact the environment and whether development is becoming more sustainable or not. Various constraints related to the processes of environmental information collection, production and dissemination are evident in Egypt. These include uncoordinated institutional set-ups for monitoring activities, the absence of a common information system for monitoring organizations to feed data and findings into, the absence of comprehensive systematic methodologies for monitoring, the absence of valuation, and/or the undervaluation, of many natural resources, and the lack of financial resources for maintaining monitoring processes.
The coordination required to reach comprehensive and integrated environmental activities is significant because of the cross-sectoral nature of environmental issues. Although EEAA has the primary responsibility for coordination, numerous other entities are partners in environmental policies, playing roles in implementation and/or monitoring.
EEAA has the responsibility of implementing national environmental policies and of setting up environmental standards for cases of conflicting interests. In this respect, the Agency established inter-ministerial committees on each of the major relevant crosscutting environmental issues, such as water, energy, and climate change. These are chaired by the Minister of State for Environmental Affairs, and coordinate between multiple competent authorities for the different specific environmental processes of concern.
Prime Minister renewed the “National Committee for Climate Change” that established in 1997 by his Decree No. 272 in 2007. The Minister of environment heads the new Inter-Ministerial National Committee for Climate Change. The members represent a wide range of governmental, experts and non-governmental stakeholders. Recently, Ministry of State for Environmental Affairs scaled up the “Climate Change Unit” to strengthen climate change institutional framework on the national level, to be a Central Department in Egyptian Environmental Affairs Agency in 2009. Meanwhile, on the sectoral level attempts to strengthen the institutional framework led to establishing two committees in Ministry of Agriculture and Land Reclamation and Ministry of Water Resources and Irrigation, in addition to establishing a climate change information centre for Agriculture Sector, and conducting an adaptation program in Agriculture Sustainable Development Strategy up to 2030.
On the other hand, Egypt ratified Kyoto protocol on 12/1/2005 followed by establishing the Egyptian Designated National Authority for Clean Development Mechanism “DNA-CDM”. Investment costs of initially approved 55 projects in 2009 are USD 1243 million. These projects will reduce GHG by almost 8.3 Million ton CO2 equivalent. They include reduction of nitrous oxide emission from fertilizer industry, renewable energy, fuel switching, methane capture and flaring from waste and energy efficiency improvement.

E-SNC
E-SNC
23
EGYPT SECOND NATIONAL COMMUNICATION
E-SNC
E-SNC
CHAPTER II. NATIONAL GREENHOUSE GAS INVENTORY
1. Introduction
2. Elements of Egypt’s GHG
Inventory
3. GHG Inventory by Sector
4. Summary

E-SNC
E-SNC
25
EGYPT SECOND NATIONAL COMMUNICATION
E-SNC
E-SNC
II. NATIONAL GREENHOUSE GAS INVENTORY
II. 1. IntroductionThe core elements of the national communications for both Annex I and non-
Annex I Parties encompass information on emissions and removals of greenhouse gases (GHGs), as well as details of the activities undertaken to implement the Convention. The data and procedures need to be consistent, transparent and well documented to the most possible extent.
In the inception report data sources were identified. They entailed Egyptian governmental institutions as well as reputable international data sources. Identified Egyptian institutions are ones with data collection and archiving being a primary responsibility, such as CAPMAS, information centers and information banks, and governmental institutions issuing licenses to targeted entities relevant to the GHG inventory. These licenses include essential technical information about capacity, technology, raw materials and fuel consumptions. Data used in this chapter pertain to activities of the year 2000, unless otherwise indicated.
In the methodology for the current GHG inventory, the data received from the sources are reliable with minimum uncertainty. Processing is based on the considered IPCC default methodologies and default emission factors (IPCC, 1996; IPCC, 2000). In consequence, information in this chapter can be classified as falling within the Tier 1 level.
Estimating the GHG emissions in all sections of this chapter is carried out following the default methodology of the “Revised 1996 IPCC Guidelines for National Greenhouse Gas Inventories” (IPCC, 1996) and the ”Good Practice Guidance and Uncertainty Management in National Greenhouse Gas Inventories” (IPCC, 2000). GHG emissions due to energy used in any sector including industry are calculated in the energy sector. GHG emissions in the industry sector are only emissions due to industrial processes. All calculations in the present report use the Global Warming Potential (GWP) of GHGs for 100 years, of table 2.9 of the ”IPCC Second Assessment Report”, following the incorporation of the provisions of decision 14/CP.11 for updated UNFCCC reporting guidelines on annual inventories, FCCC/SBSTA/2006/9 18 August 2006.
In cases where data are available, specific site calculations are considered, and the methodologies followed, strictly adhere to the well established scientific and technical rules. Comparison and verification between specific site calculations and the default emission factors defined by the IPCCC is shown. For these cases, the work can be considered as higher than Tier 1. Estimates have been made for the base year 2000/01. For cases where data are available for the sector and the source category, estimates are carried-out for the time series 1991/92 to 2004/05.

26
CHAPTEr II NATIONAL GrEENHOUSE GAS INvENTOrY
E-SNC
E-SNC
E-SNC
E-SNC
In accordance with paragraph 23 of Decision 17/CP.8, details of the GHG inventory studies are delivered as references, in both electronic and hard copy formats, with the present report of Egypt’s Second National Communication to the COP secretariat.
Sectors, as sources of GHG emissions, are categorized according to their percentage share in the national GHG inventory. The outline of Egypt’s total GHG inventory in the year 2000 is presented by GHG type and also by sector. The national sources of GHGs are presented in successive ordering according to their categories. Data sources for each sector are defined, followed by a summary for the whole country. Whenever data are available, yearly GHG emission series are presented.
II. 2. Elements of Egypt’s GHG InventoryTable (II.1) and figure (II.1) present Egypt’s total GHG emissions by gas type, for the
year 2000, while Table (II.2) and figure (II.2) present Egypt’s total GHG emissions by sector for the year 2000.
Table (II.1): Egypt’s GHG emissions by gas type for the year 2000.
Gas Emissions(Mt CO2e)
Emissions(%)
CO2 128.2 66.3CH4 39.4 20.4N2O 24.4 12.6PFC 1.1 0.6SF6 0.1 0.1HFC’s blend 0.1 0.1TOTAL 193.3 100
solid west disposal on land; 11,694.12 Gg
CO2e; 66.88
westwater handling; 5,787.10 Gg CO2e;
33.1
incineration; 3.24Gg CO2e; 0.02
solid west disposal on land westwater handling incineration
CO2; 128.2; 66%
CH4; 39.4; 20%
N2O; 24.4; 13%
PFC; 1.1; 1% SF6; 0.1; 0%
HFC’s blend; 0.1; 0%
CO2 CH4 N2O PFC SF6 HFC’s blend
Figure (II.1): Egypt’s GHG emissions by gas type for the year 2000 in Mt CO2e.
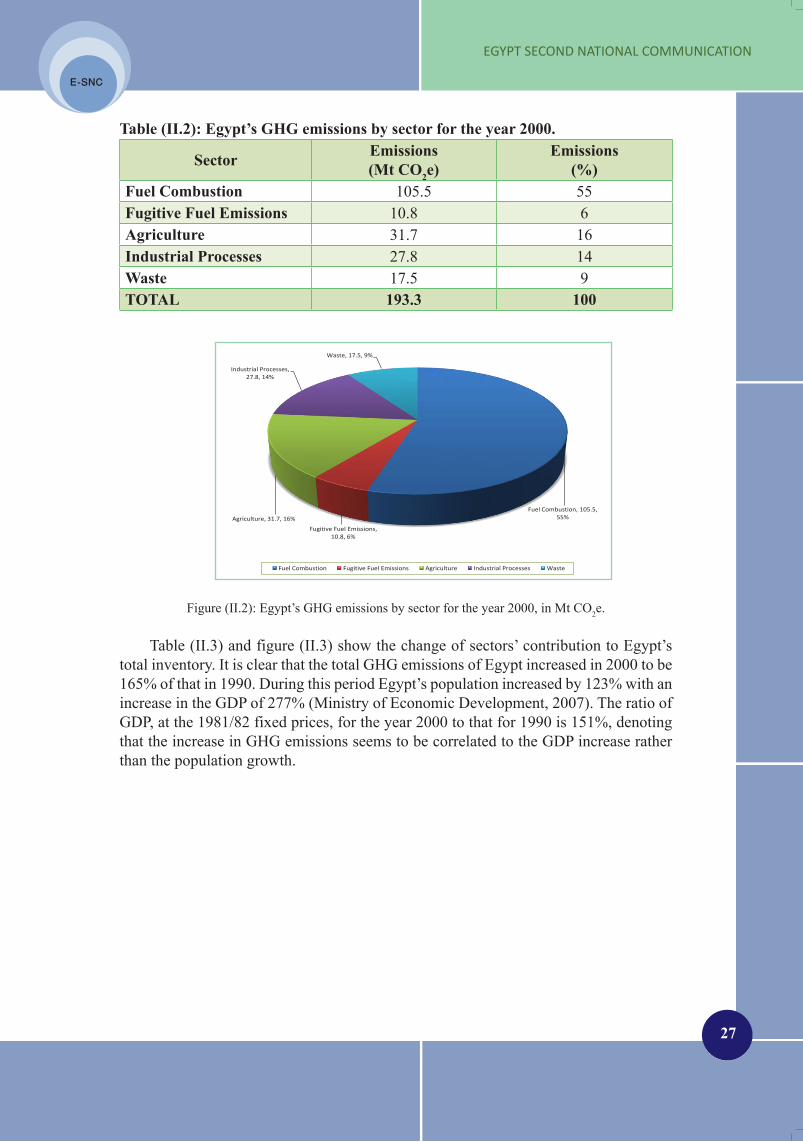
E-SNC
E-SNC
27
EGYPT SECOND NATIONAL COMMUNICATION
E-SNC
E-SNC
Table (II.2): Egypt’s GHG emissions by sector for the year 2000.
Sector Emissions(Mt CO2e)
Emissions(%)
Fuel Combustion 105.5 55Fugitive Fuel Emissions 10.8 6Agriculture 31.7 16Industrial Processes 27.8 14Waste 17.5 9TOTAL 193.3 100
solid west disposal on land; 11,694.12 Gg CO2e; 66.88;
67%
westwater handling; 5,787.10 Gg CO2e; 33.1;
33%
incineration; 3.24Gg CO2e; 0.02%
solid west disposal on land westwater handling incineration
Fuel Combustion, 105.5, 55%
Fugitive Fuel Emissions, 10.8, 6%
Agriculture, 31.7, 16%
Industrial Processes, 27.8, 14%
Waste, 17.5, 9%
Fuel Combustion Fugitive Fuel Emissions Agriculture Industrial Processes Waste
Figure (II.2): Egypt’s GHG emissions by sector for the year 2000, in Mt CO2e.
Table (II.3) and figure (II.3) show the change of sectors’ contribution to Egypt’s total inventory. It is clear that the total GHG emissions of Egypt increased in 2000 to be 165% of that in 1990. During this period Egypt’s population increased by 123% with an increase in the GDP of 277% (Ministry of Economic Development, 2007). The ratio of GDP, at the 1981/82 fixed prices, for the year 2000 to that for 1990 is 151%, denoting that the increase in GHG emissions seems to be correlated to the GDP increase rather than the population growth.

28
CHAPTEr II NATIONAL GrEENHOUSE GAS INvENTOrY
E-SNC
E-SNC
E-SNC
E-SNC
Table (II.3): Changes in contributions to the GHG inventory of different sectors.
Sector Emissions
(Mt CO2e/year) & (% of total)Emissions
of 2000 relative to 1990 (%)1990 2000
All Energy(Combustion and Fugitive emissions)
82.7 71 116.3 61 142
Industrial Processes 10.3 9 27.8 14 270
Agriculture 17.9 15 31.7 16 177Waste 5.7 5 17.5 9 307TOTAL 116.6 100 193.3 100 165
Table (II.4) gives the change of the GHG indicators for the year 2000 compared with those of 1990. Total emissions per capita increased from 2.2 to 3.1 tons CO2e, and the total emissions per thousand US$ of the GDP at market prices decreased from 3.3 tons to 1.9 tons CO2e/1000 US$.
Table (II.4): Changes in the total GHG indicators.
Year
Popu
latio
n (m
illio
n)
GD
P m
arke
t pr
ice
(bill
ion
US$
)
Em
issi
ons
(Mt C
O2e
)
Em
issi
ons
(ton
CO
2e/
capi
ta)
Em
issi
ons p
er
capi
ta; r
atio
fo
r 20
00/1
990
(%)
Em
issi
on
(ton
CO
2e/
1000
US$
)
Spec
ific
emis
sion
; rat
io
for
2000
/199
0 (%
)
1990 52.6 35.16 116.6 2.2 -- 3.3 --
2000 63.3 99.74 193.3 3.1 137 1.9 58
Table (II.5) compares the key activities resulting in GHG emissions for the years 1990 and 2000. The energy sector emissions are a function of the consumed fossil fuels as well as fugitive GHG emissions. The main source of primary energy in Egypt is the fossil fuel mix of petroleum products and natural gas (NG). In 1994, Egypt reported large discoveries of NG, discoveries which were followed by fuel switching. This is evident in the table, where NG combustion increased from 6.5 TOE in 1990 to 17.8 TOE in 2000, an increase of 174%. For the same period, the combustion of liquid petroleum products increased by only 13% from 20.1 TOE in 1990 to 22.8 TOE in 2000. The increase in the combustion of the two types of fuels combined amounts to 53%, while table (II.3) shows that all energy GHG emissions increased by 42% for the same period. This denotes a decreasing trend of the specific GHG emissions (ton CO2/ton fuel mix), which is due to the policy of fuel switching.
Egypt’s open market economy attracted energy-intensive industries such as cement and fertilizers industries which are highly dependent on the consumption of natural resources including NG. By the year 2000, the cement industry production

E-SNC
E-SNC
29
EGYPT SECOND NATIONAL COMMUNICATION
E-SNC
E-SNC
had increased by 129% relative to that of 1990. In the Initial National Communication (INC), the reported production of nitric acid in 1990 was 6000 ton/year, increasing to 1.326 million ton/year in 2000, a 220-fold increase.
Table (II.5): Growth of key activities resulting in GHG emissions.
Key Sector Activity Unit 1990 20002000/1990
ratio(%)
All Energy*Petroleum Products Combustion Fuel consumption MTOE 20.1 22.8 113
NG Combustion Fuel consumption MTOE 6.5 17.8 274
Total Fuel Consumption Total fuel consumption MTOE 26.6 40.6 153
Transportation Vehicles million units 1.2 3.1 258
Fugitive GHGLiquid fuel
production and consumption
MTOE 52.5 55.1 105
2. Industry Production**Cement -- Mt/year 15.8 36.2 229Lime -- Mt/year 71.0 72.0 101Nitric Acid*** -- Kt/year 60.0 1300.0 2167Ammonia -- Kt/year 66.0 1800.0 2727Aluminum Industry -- Kt/year 180.0 250.0 139Iron & Steel -- Mt/year 2.6 3.7 142
3. Agriculture****
Consumed Nitrogen Synthetic Fertilizer -- Ton/year 421,623 607,367 144
Livestock
Poultry population 1000 head 140.7 342.2 243Cattle 1000 head 2718.8 3529.7 130
Buffalos 1000 head 3165.0 3379.4 107Sheep and goats 1000 head 6549.9 7893.9 121
Rice Cultivation Cultivated area million acre 1.1 1.7 1544. Waste*****
Municipal Solid Waste -- Mt/year 12.3 17.2 140Municipal Wastewater -- billion m3/day 3.3 4.2 130
* (Aziz, 2007), (Hindawy, 2007), Egyptian Cabinet Information & Decision Support Center (IDSC); www.idsc. gov.eg. ** (INC, 1999), (Ministry of Trade and Industry, 2007). *** (Tabbin Institute for Metallurgical Studies, 2005). **** (Medany, 2007). ***** (INC, 1999),(Osama, “Survey on Egypt GHG Emissions, Waste Sector”, 2007).

30
CHAPTEr II NATIONAL GrEENHOUSE GAS INvENTOrY
E-SNC
E-SNC
E-SNC
E-SNC
II. 3. GHG Inventory by Sector
II. 3. 1. The Energy Sector
The energy statistics of national fuels consumed in Egypt present the basis for estimates presented here. In this respect, estimates for the base year 2000/01 were calculated, together with estimates for “all energy consumption” and for “electricity generation” for the period 1991/92 to 2004/05 in order to provide a clear view of emission trends.
II. 3. 1. a. Energy Emissions Due to Fuel Combustion
Table (II.6) and figure (II.3) present details of emissions by type of gas for the base year 2000/01 resulting from fuel combustion. It is clear that carbon dioxide (CO2) emissions represent more than 99% of the total CO2e of the total GHG emissions from fuel combustion. The combustion of petroleum fuels result in 62% of the total GHG emissions of the energy sector, with the combustion of NG resulting in the rest (figure (II.4).
Table (II.6): GHGs emissions from fuel combustion by gas type, 2000/01.
GHGs Petroleum(Mt)
NG(Mt)
Total(Mt)
Total CO2e(Mt)
Share of total(%)
CO2 65.06139 40.09041 105.1518 105.15 99.77
CH4 0.00243 0.00085 0.00328 0.075 0.07
N2O 0.00047 0.00009 0.00056 0.166 0.16
CO2e 65.2564 40.1366 105.393 105.39 100
Share of total (%) 61.92 38.08 100
CO2; 99.77%
CH4; 0.07%N2O; 0.16%
CO2 CH4 N2O
Industry; 25.7%
Transportation; 25.83%
Agriculture; 0.22%Residential &
Commercial; 8.92%
Electricity Generation; 33.2%
Petroleum Production and Industries; 6.16%
Industry Transportation Agriculture Residential & Commercial Electricity Generation Petroleum Production and Industries
Figure (II.3): GHGs emissions from fuel combustion by gas type, 2000/01.
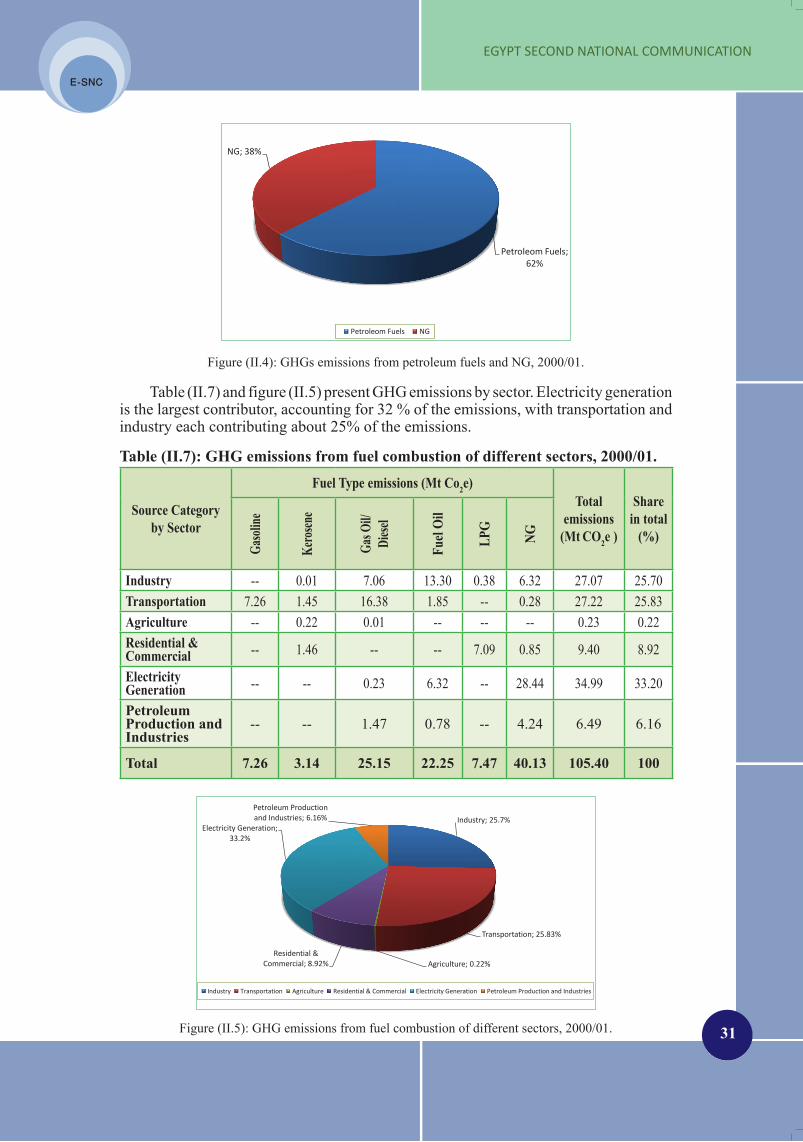
E-SNC
E-SNC
31
EGYPT SECOND NATIONAL COMMUNICATION
E-SNC
E-SNC
Petroleom Fuels; 62%
NG; 38%
Petroleom Fuels NG
Figure (II.4): GHGs emissions from petroleum fuels and NG, 2000/01.
Table (II.7) and figure (II.5) present GHG emissions by sector. Electricity generation is the largest contributor, accounting for 32 % of the emissions, with transportation and industry each contributing about 25% of the emissions.
Table (II.7): GHG emissions from fuel combustion of different sectors, 2000/01.
Source Category by Sector
Fuel Type emissions (Mt Co2e)Total
emissions (Mt CO2e )
Share in total
(%)
Gaso
line
Kero
sene
Gas O
il/ Di
esel
Fuel
Oil
LPG
NG
Industry -- 0.01 7.06 13.30 0.38 6.32 27.07 25.70Transportation 7.26 1.45 16.38 1.85 -- 0.28 27.22 25.83Agriculture -- 0.22 0.01 -- -- -- 0.23 0.22Residential & Commercial -- 1.46 -- -- 7.09 0.85 9.40 8.92
Electricity Generation -- -- 0.23 6.32 -- 28.44 34.99 33.20
Petroleum Production and Industries
-- -- 1.47 0.78 -- 4.24 6.49 6.16
Total 7.26 3.14 25.15 22.25 7.47 40.13 105.40 100CO2; 99.77%
CH4; 0.07%N2O; 0.16%
CO2 CH4 N2O
Industry; 25.7%
Transportation; 25.83%
Agriculture; 0.22%Residential &
Commercial; 8.92%
Electricity Generation; 33.2%
Petroleum Production and Industries; 6.16%
Industry Transportation Agriculture Residential & Commercial Electricity Generation Petroleum Production and Industries
Figure (II.5): GHG emissions from fuel combustion of different sectors, 2000/01.
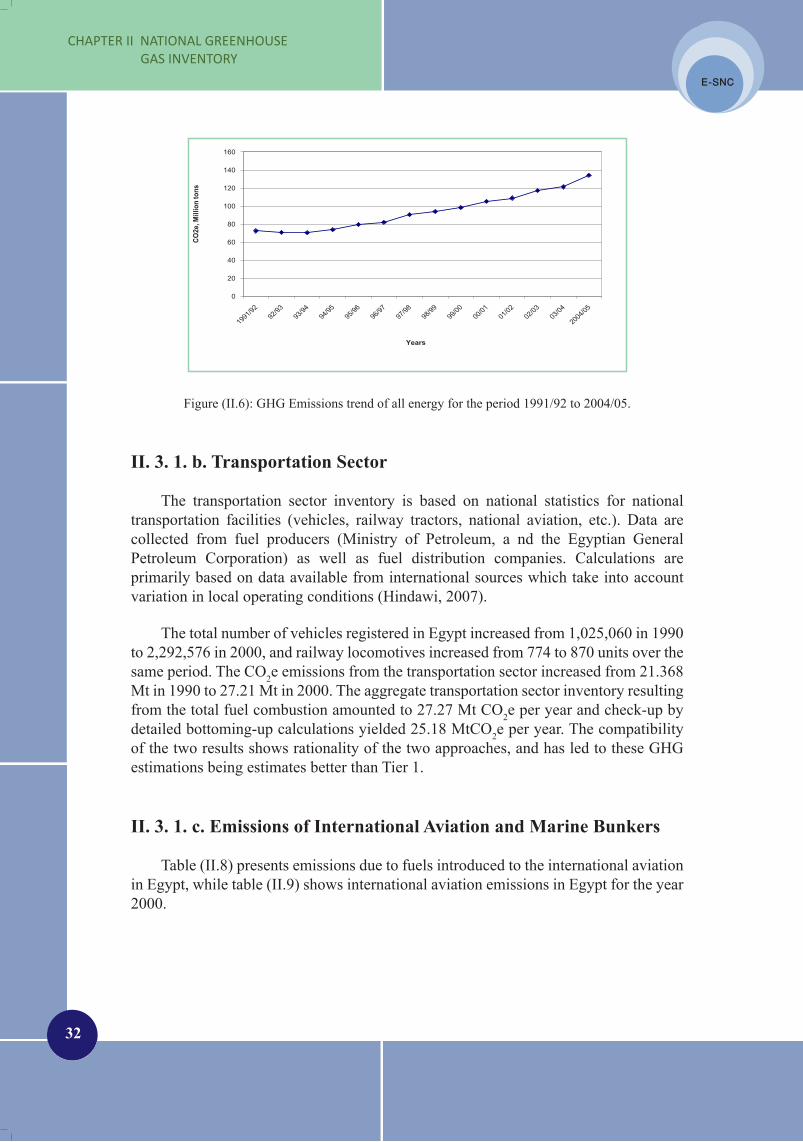
32
CHAPTEr II NATIONAL GrEENHOUSE GAS INvENTOrY
E-SNC
E-SNC
E-SNC
E-SNC
0
20
40
60
80
100
120
140
160
CO2e
, Mill
ion
tons
Years
0
0.2
0.4
0.6
0.8
1
1.2
1.4
1995 2020 2045 2070 2095
Scenarios 1 Scenarios 2 Scenarios 3 Scenarios 4 Scenarios 5Scenarios 6 Scenarios 7 Scenarios 8 Scenarios 9
Figure (II.6): GHG Emissions trend of all energy for the period 1991/92 to 2004/05.
II. 3. 1. b. Transportation Sector
The transportation sector inventory is based on national statistics for national transportation facilities (vehicles, railway tractors, national aviation, etc.). Data are collected from fuel producers (Ministry of Petroleum, a nd the Egyptian General Petroleum Corporation) as well as fuel distribution companies. Calculations are primarily based on data available from international sources which take into account variation in local operating conditions (Hindawi, 2007).
The total number of vehicles registered in Egypt increased from 1,025,060 in 1990 to 2,292,576 in 2000, and railway locomotives increased from 774 to 870 units over the same period. The CO2e emissions from the transportation sector increased from 21.368 Mt in 1990 to 27.21 Mt in 2000. The aggregate transportation sector inventory resulting from the total fuel combustion amounted to 27.27 Mt CO2e per year and check-up by detailed bottoming-up calculations yielded 25.18 MtCO2e per year. The compatibility of the two results shows rationality of the two approaches, and has led to these GHG estimations being estimates better than Tier 1.
II. 3. 1. c. Emissions of International Aviation and Marine Bunkers
Table (II.8) presents emissions due to fuels introduced to the international aviation in Egypt, while table (II.9) shows international aviation emissions in Egypt for the year 2000.

E-SNC
E-SNC
33
EGYPT SECOND NATIONAL COMMUNICATION
E-SNC
E-SNC
Table (II.8): Direct CO2 emissions from international aviation and marine bunkers for 2000 (Ministry of Petroleum, 2000).
International Aviation & Marine Bunkers
jet Fuel Gas Oil/
Diesel
Fuel Oil
Total emissions (Mt CO2)
Fuel Consumed (1000 tons) 540 194 2586
Emission Factor (kg CO2/kg fuel) 3.16 3.18 3.08
Emissions (Mt CO2) 1.61 0.62 7.96 10.281
Table (II.9): International aviation emissions in Egypt by gas type for 2000 (Hindawi, 2007).
Gas Emissions (Kt)CO2 1606.54CH4 0.18N2O 0.04NOx 9.88CO 8.23NMVO 3.28SO2 0.51
II. 3. 1. d. Emissions of SF6 in The Electricity Sector
The Ministry of Electricity and Energy reported a total consumption of 4.84 tons of SF6 in 2000. This is used for compensating leakage in the normal operations and maintenance work of the switch gears. The amount is equivalent to 0.116 Mt CO2e per year.
II. 3. 1. e. Fugitive Emissions
Calculations for the fugitive emissions are based on the 2006 IPCC guidelines for national GHG inventories. The lowest emission factor values from the ranges mentioned in the guidelines are used. Data used are those from the Egyptian General Petroleum Corporation (Egyptian General Petroleum Corporation, 2000). Egypt is one of fifteen countries exhibiting gas flaring decline over the past twelve years (The World Bank, "A Twelve Year Record of National and Global Gas Flaring Volumes Estimated Using Satellite Data”, 2007).
The total fugitive emissions encompass 1.47 Mt CO2, 0.444 Mt CH4 and 0.02 Kt of N2O, collectively equivalent to 10.81 Mt CO2e (Aziz, 2007). Sources of these emissions entail oil production, natural gas production, petroleum products processing and distribution, with oil production being the main source with a contribution of more than 99% of the emissions.

34
CHAPTEr II NATIONAL GrEENHOUSE GAS INvENTOrY
E-SNC
E-SNC
E-SNC
E-SNC
II. 3. 2. The Industry Sector (industrial processes)
According to the 1996 IPCC document “Good Practice Guidance and Uncertainty Management in National Greenhouse Gas Inventories” (IPCC, 1996), the main sources of GHG emissions from industrial processes entail the cement industry, limestone and dolomite production and use, iron and steel industry, N2O production for nitric acid and fertilizers production, PFCs from aluminum smelting, emissions related to the consumption of HFCs and other substitutes of ozone depleting substances, as well as SF6 from magnesium production and electrical equipment.
A number of data sources have been used for this section. The Industrial Development Authority (IDA) (Ministry of Trade and Industry, 2007), the official governmental entity issuing licenses to industrial establishments in Egypt, is the source for data pertaining to factory production values, details of products capacity, details of raw materials and amounts consumed, technology used, fuels and energy, together with environmental impact assessments of the establishments. The CDM reports on nitric acid production factories in Egypt (Tabbin Institute for Metallurgical Studies, 2005) present the source for data on N2O emissions, while the IDA data for aluminum production in Egypt is the source for PFCs emissions. Regarding HFCs consumption data, these originate from the EEAA department concerned with the protection of the ozone layer, the entity responsible for auditing all imports and exports of ozone depleting substances in Egypt.
II. 3. 2. a. Specific Methodologies
For the cement industry, and iron & steel industry, raw materials contents of carbon compounds are used for checking emissions, as recommended in the 2006 IPCC guidelines (IPCC, 2006). In addition, site specific data are used for checking the emission values for the iron and steel industry. These were obtained during visits conducted to the Egyptian Company for Iron and Steel which produces iron by blast furnaces, and the National Alexandria Company, Dekhela, which produces iron by direct reduction technology. In this respect, most of the present work can be considered as Tier 1 level. However, checking results with emissions calculated on the bases of raw materials or specific data, as the cases of the cement, and iron & steel industries, can be classified in a higher tier. Data obtained from the IDA are those of the factories licenses, and therefore can be considered as certain, with emissions potentially classified as those for the Egyptian Industry.
II. 3. 2. b. Industrial GHG Emissions by Gas Type and Sources
Table (II.10) and figure (II.7) present the emissions from Egyptian industries by gas type. It can be seen that the emissions primarily entail CO2, with the largest contributors being the cement, and iron & steel production sectors. The primary source of N2O emissions is nitric acid production for the fertilizers industry, while aluminum production (smelting process) is the primary source of PFCs. These main

E-SNC
E-SNC
35
EGYPT SECOND NATIONAL COMMUNICATION
E-SNC
E-SNC
sources contribute about 28 Mt of CO2e per year, representing more than 99% of the total emissions of Egypt’s industrial sector. Other minor sources are ozone depleting substances and the lime industry.
Table (II.10): GHG emissions by different industrial sectors, according to gas type, 2000.
Source Sectors GHG GasSpecific gas emissions,
(tons)
CO2e(Mt)
Contribution to total
emissions (%)
Cement Production CO2 17,251,370 17.25 62.13Lime Production CO2 31,400 0.03 0.11Iron and Steel Industry CO2 1,576,175 1.58 5.68Ammonia Production CO2 2,736,000 2.74 9.85Nitric Acid Production N2O 16,266 5.04 18.16Aluminum Production PFCs 160 1.08 3.88
Ozone Depleting Substances
ODS substitutes,
HFCs28 0.05 0.18
Total emissions from the Egyptian Industry (CO2e)
27.77 100
0
2
4
6
810
12
14
16
18
Cementproduction
Nitric AcidProduction
Ammoniaproduction
Iron & steelindustry
AluminumProduction
OzoneDepleting
Substances
Limeproduction
CO
2 eq
uiva
lent
, Mt p
er y
ear
Figure (II.7): GHG emissions by different industrial sectors, according to gas type, 2000.
Table (II.11) gives some significant indicators for the Egyptian industrial sector. Egypt’s open market economy attracted energy-intensive industries such as cement and fertilizers industries which are highly dependent on the consumption of natural resources, including NG. In year 2000, the GHG emissions due to cement, iron & steel and fertilizers industries represented 95.8% of the total emissions of Egypt’s industrial sector, as evident in table (II.10). This resulted in a 275% increase of the GHG emissions of the industrial sector for 2000 relative to those of 1990, while the increase in the overall GHG emissions of Egypt amounted to 165% for the same period. This large

36
CHAPTEr II NATIONAL GrEENHOUSE GAS INvENTOrY
E-SNC
E-SNC
E-SNC
E-SNC
increase in emissions from the industrial sector, coupled with significant increments in profit, resulted to a 10% decrease in GHG emissions per monetary value, for industrial production, from 1.79 ton to 1.61 ton CO2e/1000 US$ over the period 1990 to 2000.
Table (II.11): Egypt indicators for the Industrial sector.
Industry production,
market prices*(billion LE)
Egypt’s industrial
production, market prices**
(billion US$)
Industrial processes
GHG emissions
(Mt CO2e)
Specific emissions
(ton CO2e/1000
US$)
Specific emissions relative to
those of 1990(%)
1990 18.02 5.63 10.10 1.79 --2000 61.21 17.25 27.77 1.61 90
* (Ministry of Economic Development, 2007)** Average exchange rates are based on Central Bank data. This is 3.2 LE/US$ for 1990 and 3.41 for year 2000.
II. 3. 3. Agriculture Sector
For the agriculture GHG inventory, source categories surveyed include: enteric fermentation of livestock, manure management, rice cultivation, agricultural soils, and field burning of agricultural residues. Data from the Ministry of Agriculture and Land Reclamation (Ministry of Agriculture and Land Reclamation, 1999, 2000, 2001) are used for the calculations. Wetlands and land use change are forestry are not surveyed in the current work, as the available data are neither sufficient nor reliable enough to obtain the estimates.
The main emissions of agriculture activities are N2O and CH4, table (II.12). In addition, field burning of agricultural residues emits traces of CO and NOX. Total GHG emissions from Egypt’s agriculture sector in 2000 amounted to 31.715 Mt CO2e.
Table (II.12): Total GHG emissions from the agricultural sector by gas type, 2000.
Gas Emissions (Mt CO2e) Share of the total emissions(%)
N2O 19.16 60.38CH4 12.56 39.62Total 31.72 100
In the INC, the total emissions of the agriculture sector were about 18 Mt CO2e, representing about 16% of the total GHGs emissions in Egypt. The primary gas for the agriculture sector was CH4, contributing 11.403 Mt CO2e, representing about 63% of the emissions for the sector and about 10% of Egypt’s total emissions. The N2O emissions contributed about 36% of the emissions for the sector and about 6% of the total emissions. A 77% increase of GHG emissions of the agriculture sector occurred for the period of 1990 to 2000, and these include the emissions from manure management, agriculture soil, and field burning of agricultural residues, sources which
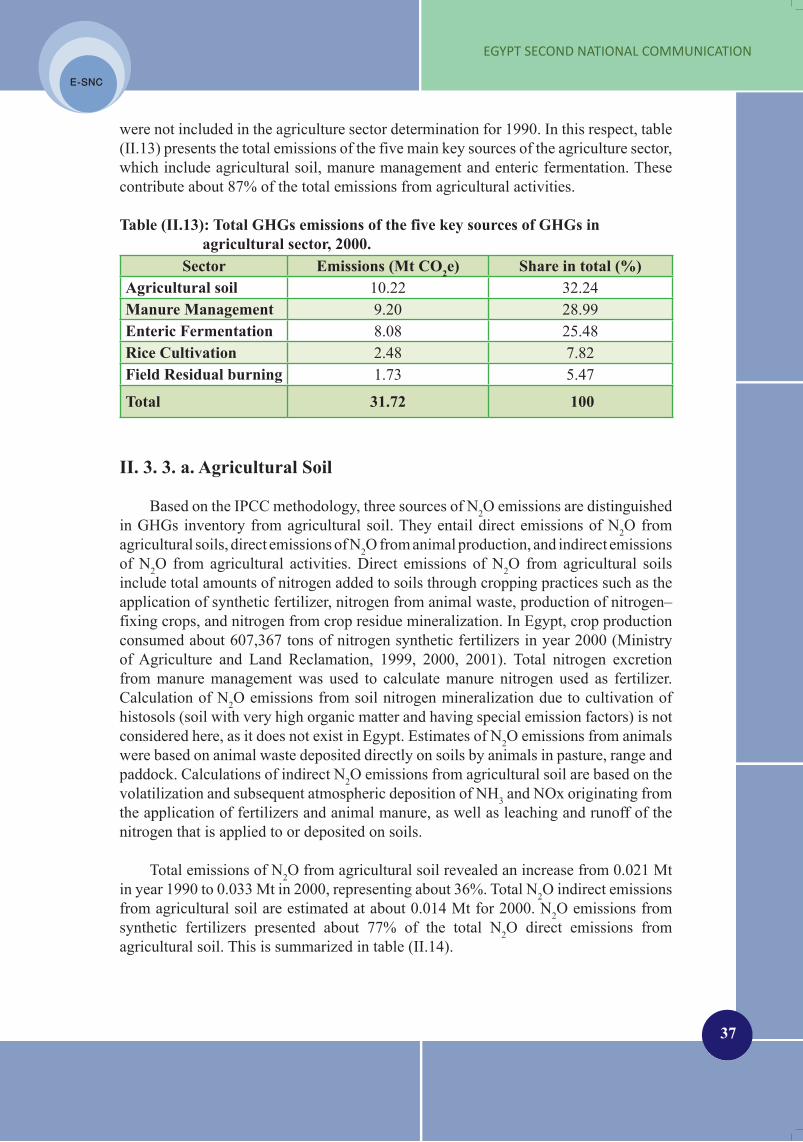
E-SNC
E-SNC
37
EGYPT SECOND NATIONAL COMMUNICATION
E-SNC
E-SNC
were not included in the agriculture sector determination for 1990. In this respect, table (II.13) presents the total emissions of the five main key sources of the agriculture sector, which include agricultural soil, manure management and enteric fermentation. These contribute about 87% of the total emissions from agricultural activities.
Table (II.13): Total GHGs emissions of the five key sources of GHGs in agricultural sector, 2000.
Sector Emissions (Mt CO2e) Share in total (%)Agricultural soil 10.22 32.24Manure Management 9.20 28.99Enteric Fermentation 8.08 25.48Rice Cultivation 2.48 7.82Field Residual burning 1.73 5.47
Total 31.72 100
II. 3. 3. a. Agricultural Soil
Based on the IPCC methodology, three sources of N2O emissions are distinguished in GHGs inventory from agricultural soil. They entail direct emissions of N2O from agricultural soils, direct emissions of N2O from animal production, and indirect emissions of N2O from agricultural activities. Direct emissions of N2O from agricultural soils include total amounts of nitrogen added to soils through cropping practices such as the application of synthetic fertilizer, nitrogen from animal waste, production of nitrogen–fixing crops, and nitrogen from crop residue mineralization. In Egypt, crop production consumed about 607,367 tons of nitrogen synthetic fertilizers in year 2000 (Ministry of Agriculture and Land Reclamation, 1999, 2000, 2001). Total nitrogen excretion from manure management was used to calculate manure nitrogen used as fertilizer. Calculation of N2O emissions from soil nitrogen mineralization due to cultivation of histosols (soil with very high organic matter and having special emission factors) is not considered here, as it does not exist in Egypt. Estimates of N2O emissions from animals were based on animal waste deposited directly on soils by animals in pasture, range and paddock. Calculations of indirect N2O emissions from agricultural soil are based on the volatilization and subsequent atmospheric deposition of NH3 and NOx originating from the application of fertilizers and animal manure, as well as leaching and runoff of the nitrogen that is applied to or deposited on soils.
Total emissions of N2O from agricultural soil revealed an increase from 0.021 Mt in year 1990 to 0.033 Mt in 2000, representing about 36%. Total N2O indirect emissions from agricultural soil are estimated at about 0.014 Mt for 2000. N2O emissions from synthetic fertilizers presented about 77% of the total N2O direct emissions from agricultural soil. This is summarized in table (II.14).

38
CHAPTEr II NATIONAL GrEENHOUSE GAS INvENTOrY
E-SNC
E-SNC
E-SNC
E-SNC
Table (II.14): Total N2O emissions from agricultural soil, 2000.
Type of Nitrogen input to Soil Direct soil emissions of N2O (Mt)
Direct N2O emissions from agricultural soil
Synthetic fertilizer 0.0107Animal waste 0.0031N-fixing crops 0.0001
Total 0.0139Indirect N2O emissions from agricultural soils Total 0.0146
N2O emissions from grazing animals Total 0.0043
Total N2O emissions from agricultural soil 0.0330
II. 3. 3. b. Enteric Fermentation
Enteric fermentation is the key source of CH4 emissions from agricultural activities. Three years average livestock population data for all livestock types were obtained from agricultural statistics for livestock (Ministry of Agriculture and Land Reclamation, 1999, 2000, 2001). Total emissions of CH4 from enteric fermentation revealed an increase from 0.323 Mt in year 1990 to 0.385 Mt in year 2000, representing a 16% increase. This increase is mainly attributed to the increase in livestock population. Figure (II.8) illustrates the total CH4 emissions from livestock categories due to enteric fermentation. Buffalo group was the key source of CH4 emission from enteric fermentation, with the cattle group representing the second key source of CH4 emission from enteric fermentation.
solid west disposal on land;
11,694.12 Gg CO2e; 66.88%
westwater handling;
5,788.10 Gg CO2e; 33.10%
incineration; 3.24Gg CO2e;
0.02%
solid west disposal on land westwater handling incineration
Dairy Cattle; 0.050
Non-dairy Cattle; 0.070
Buffalo; 0.188
Sheep; 0.023
Goats; 0.017
Camels; 0.006 Horses; 0.001
Mules and Asses; 0.030
Swine; 0.000
Dairy Cattle Non-dairy Cattle Buffalo Sheep Goats
Camels Horses Mules and Asses Swine
Figure (II.8): Total CH4 emissions (Mt) from livestock categories due to enteric fermentation, 2000.
II. 3. 3. c. Manure Management
In 1990, CH4 emissions from manure management were estimated whereas N2O emissions from the same source were not included. For 2000 figures, both CH4 and N2O emissions from manure management are estimated. Total CH4 emissions from manure

E-SNC
E-SNC
39
EGYPT SECOND NATIONAL COMMUNICATION
E-SNC
E-SNC
management increased from 0.023 Mt in 1990 to 0.028 Mt in 2000, representing a 16% increase. This increase is mainly attributed to the increase in livestock population. Figure (II.9) illustrates that buffalo group was the key source of CH4 emission from manure management. For year 2000, N2O emissions amounted to 0.028 Mt.
Dairy Cattle; 0.0028 Non-dairy Cattle; 0.0022
Buffalo; 0.0171
Sheep; 0.0009
Goats; 0.0008
Camels; 0.0003 Horses; 0.0001Mules and Asses;
0.0036
Swine; 0.0000
Poultry; 0.0000
Dairy Cattle Non-dairy Cattle Buffalo Sheep Goats
Camels Horses Mules and Asses Swine Poultry
Figure (II.9): Total CH4 emissions (Mt) from livestock categories due to manure management, 2000.
II. 3. 3. d. Rice Cultivation
Three years average of rice cultivated area data were used (Ministry of Agriculture and Land Reclamation, 1999, 2000, 2001). Rice cultivated areas increased from 1.09 million acres in 1990 to 1.62 million acres in 2000, representing a 34% increase. In spite of this increase, the associate total CH4 emissions decreased from 0.190 Mt in 1990 to 0.118 Mt in 2000, representing a reduction of 38%. This reduction is mainly attributed to the rapid switching from long duration traditional cultivars to early-maturing short-duration cultivars.
II. 3. 3. e. Field Residuals Burning
Crop residue burning is a significant source of CH4, CO, NOx, and N2O. Three years average of annual production of the major field crops (wheat, broad been, maize, cotton, rice and sugar cane), were used (Ministry of Agriculture and Land Reclamation, 1999, 2000, 2001). Total emissions of CH4 from field burning of agricultural residues increased from 0.007 Mt in 1990 to 0.068 Mt in 2000. N2O emissions, from the same source increased from 0.0002 Mt in 1990 to 0.001 Mt in 2000. Burning is a major disposal method for rice and sugar cane residues in the Egyptian farming system, and in this respect, rice and sugar cane were the main sources of emissions.
Uncertainty analysis for activity data was conducted based on expert judgment, while uncertainty analysis of emission factors was not conducted. Uncertainty of activity data of animals’ population, rice cultivation area, and crop productivity ranged from 49 to 66%. The uncertainty of the country specific crop parameters used in estimating emissions from field residues burning ranged from 30 to 70%.

40
CHAPTEr II NATIONAL GrEENHOUSE GAS INvENTOrY
E-SNC
E-SNC
E-SNC
E-SNC
II. 3. 4. Waste Sector
This sector includes emissions from solid waste disposal sites (SWDS), wastewater handling and waste incineration. Figure (II.10) illustrates the relative shares of different GHGs in the emissions of the waste sector, while figure (II.11) presents amounts and relative shares of different source categories in the waste sector for 2000. The most important gas produced in this sector is CH4. In 2000, CH4 contributed more than 99 % of the total emissions of the sector, with solid waste disposal on land being the most important source category in this sector. In 2000, the contribution of this source category amounted to 11.694 Mt CO2e, represents about 67% of the total GHG emissions from the sector.
Buffalo, 0.188, 35%
Swine, 0, 0%
Sheep, 0.023, 4%Goats, 0.17, 32%
Mules and Asses, 0.03, 6%
Horses, 0.001, 0%
Dairy cattle, 0.05, 9%
non-Dairy cattle, 0.07, 13%
Camels ; 0.006; 1%
Buffalo Swine Sheep Goats Mules and Asses Horses Dairy cattle non-Dairy cattle Camels
N2O ; 3.16 Gg CO2e; 0.02% CO2; 3.07 Gg CO2e; 0.02%
CH4; 17.479 Gg CO2e; 99.96%
N2O CO2 CH4
Figure (II.10): Emissions and relative weight of GHG for the waste sector, 2000.
solid west disposal on land;
11,694.12 Gg CO2e; 66.88%
westwater handling;
5,788.10 Gg CO2e; 33.10%
incineration; 3.24Gg CO2e;
0.02%
solid west disposal on land westwater handling incineration
Dairy Cattle; 0.050
Non-dairy Cattle; 0.070
Buffalo; 0.188
Sheep; 0.023
Goats; 0.017
Camels; 0.006 Horses; 0.001
Mules and Asses; 0.030
Swine; 0.000
Dairy Cattle Non-dairy Cattle Buffalo Sheep Goats
Camels Horses Mules and Asses Swine
Figure (II.11): GHGs emissions and relative weight of different source categories for the waste sector, 2000.
Emissions from the waste sector increased from an estimated amount of 6.233 Mt CO2e in 1990 (INC, 1999) to 17.485 Mt CO2e in 2000. This increase is due to

E-SNC
E-SNC
41
EGYPT SECOND NATIONAL COMMUNICATION
E-SNC
E-SNC
a number of factors. The first is the increase in amounts of solid waste disposed on land and the increase in wastewater quantities generated as a result from population increase. In addition, more updated figures for activity data were used for solid waste generation and wastewater generation for the year 2000. Furthermore, emissions from some sources of sub-categories were not included in the INC, while they are included here, as for example CH4 emissions from aerobic wastewater treatment plants, N2O emissions from domestic wastewater, and emissions from incineration.
II. 3. 4. a. Solid Waste Disposal on Land
The amount of solid waste generated in 2000 for each governorate was obtained from the Ministry of Local Development, with the waste composition obtained from EEAA publications (Egyptian Environmental Affairs Agency, 2001). The composition of municipal solid waste is primarily organic and food (50-60%) followed by paper (10-25%), plastics (3-12%), glass (1-5%), metals (1.5-7%) textiles and other material (11-30%). This waste composition was used for estimating the degradable organic carbon in the waste. Municipal solid waste composition and production rates vary significantly with the geographic location in Egypt, as well as with standards of living. According to estimates of the year 2000, municipal solid waste production rates are lower than 0.3 kg/capita/day in low income and rural areas and as high as 1 kg/capita/day in high income urban areas.
Default IPCC 2000 Good Practice Guidance values (IPCC, 2000) for some parameters are used in estimation of emission factors. Recovered CH4 and oxidation factor are assumed to be zero. The first order decay method of Tier 2 of the IPCCC methodology was used to estimate emissions from solid waste disposal sites.
The annual growth of municipal solid waste generation was estimated at approximately 3.4 % in the year 2000 (Egyptian Environmental Affairs Agency, 2001). Data for solid waste amounts generated in the year 2000 were calculated back to obtain amounts for previous years including 1990. The time series of emissions estimates between years 1990 and 2000 is included in figure (II.12).
0
2000
4000
6000
8000
10000
12000
14000
1990 1991 1992 1993 1994 1995 1996 1997 1998 1999 2000year
Thou
sand
ton
CO
2e/y
ear
Managed sitesUnmanaged sitesUncategorised sitesTotal
0
1000
2000
3000
4000
5000
6000
7000
1990 1992 1994 1996 1998 2000year
Tho
usan
d to
n C
O2e
/y
domestic wastewater
industrial
human sewage
total
Figure (II.12): Total CO2e emissions (1000 ton CO2e/year) from solid waste disposal sites.
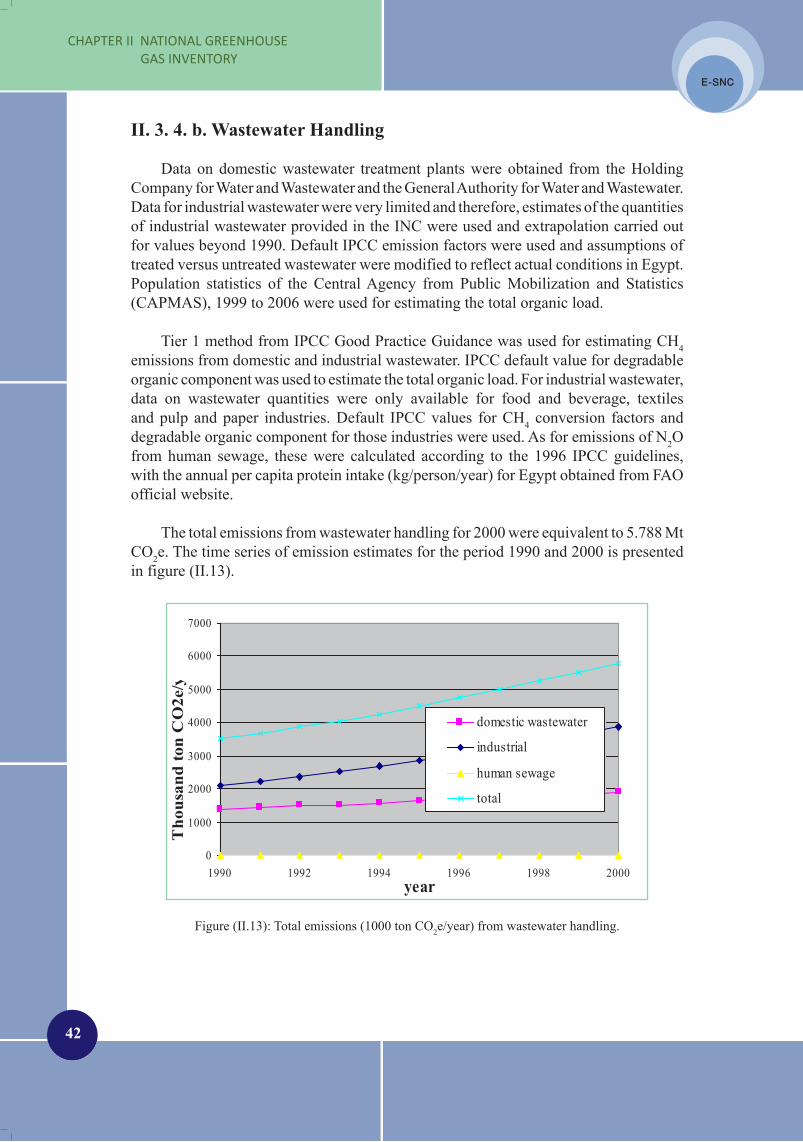
42
CHAPTEr II NATIONAL GrEENHOUSE GAS INvENTOrY
E-SNC
E-SNC
E-SNC
E-SNC
II. 3. 4. b. Wastewater Handling
Data on domestic wastewater treatment plants were obtained from the Holding Company for Water and Wastewater and the General Authority for Water and Wastewater. Data for industrial wastewater were very limited and therefore, estimates of the quantities of industrial wastewater provided in the INC were used and extrapolation carried out for values beyond 1990. Default IPCC emission factors were used and assumptions of treated versus untreated wastewater were modified to reflect actual conditions in Egypt. Population statistics of the Central Agency from Public Mobilization and Statistics (CAPMAS), 1999 to 2006 were used for estimating the total organic load.
Tier 1 method from IPCC Good Practice Guidance was used for estimating CH4 emissions from domestic and industrial wastewater. IPCC default value for degradable organic component was used to estimate the total organic load. For industrial wastewater, data on wastewater quantities were only available for food and beverage, textiles and pulp and paper industries. Default IPCC values for CH4 conversion factors and degradable organic component for those industries were used. As for emissions of N2O from human sewage, these were calculated according to the 1996 IPCC guidelines, with the annual per capita protein intake (kg/person/year) for Egypt obtained from FAO official website.
The total emissions from wastewater handling for 2000 were equivalent to 5.788 Mt
CO2e. The time series of emission estimates for the period 1990 and 2000 is presented in figure (II.13).
Figure (II.13): Total emissions (1000 ton CO2e/year) from wastewater handling.
0
2000
4000
6000
8000
10000
12000
14000
1990 1991 1992 1993 1994 1995 1996 1997 1998 1999 2000year
Thou
sand
ton
CO
2e/y
ear
Managed sitesUnmanaged sitesUncategorised sitesTotal
0
1000
2000
3000
4000
5000
6000
7000
1990 1992 1994 1996 1998 2000year
Tho
usan
d to
n C
O2e
/y
domestic wastewater
industrial
human sewage
total

E-SNC
E-SNC
43
EGYPT SECOND NATIONAL COMMUNICATION
E-SNC
E-SNC
II. 3. 4. c. Incineration
In Egypt, waste incineration is carried out primarily for clinical waste. Default values from IPCC 2006 guidelines for the fraction of carbon in clinical waste, fraction of fossil carbon and emissions factors were used. The total emissions from incineration in for 2000 were 0.0032 Mt CO2e, representing 0.02% of the emissions of the waste sector.
II. 4. SummaryTable (II.15) presents a summary of Egypt’s inventory for the year 2000. Total
emissions for 2000 amounted to about 193 Mt CO2e. As already mentioned, wetlands and land use change and forestry are not surveyed in the current work, as the available data are neither sufficient nor reliable enough to obtain the estimates. With the total emissions for 1990 amounting to about 117 Mt CO2e, the average GHG emissions increase is about 5% annually. In this respect, the estimated total GHG emissions for 2008 are about 288 Mt CO2e. Egypt’s specific GHG emissions for 2000 amounted to 2.99 ton CO2e per capita, while direct CO2 emissions per capita in 2000 amounted to 1.98 ton per capita.
According to the Climate Analysis Indicators Tool, version 6.0 (World Resources Institute, 2009), total GHG emissions in 1990 of CO2, CH4, N2O, PFCs, HFCs, SF6 (excluding emissions from land use change), for the world amounted to 29,910 Mt CO2e. According to the INC, the total 1990 emissions of Egypt amounted to about 117 Mt CO2e, based on emissions of CO2, CH4, and N2O. These figures denote that the share of Egypt in the total World emissions in 1990 was 0.4%.
In the current document, Egypt’s total emissions are about 193 Mt CO2e, including emissions of HFCs, PFCs, and SF6, as well as emissions of manure management, agriculture soil, and field burning of agricultural residues, and emissions from some sources of sub-categories, such as CH4 emissions from aerobic waste water treatment plants, N2O emissions from domestic wastewater and emissions from incineration, all of which were not included in the 1990 figures. Moreover, more updated figures for activity data were used for solid waste generation and wastewater generation for the year 2000. Based on this and taking into account the world total emissions for the year 2000, amounting to 33,017 Mt CO2e (World Resources Institute, 2009), Egypt’s share in the total world emissions for 2000 was 0.58%.
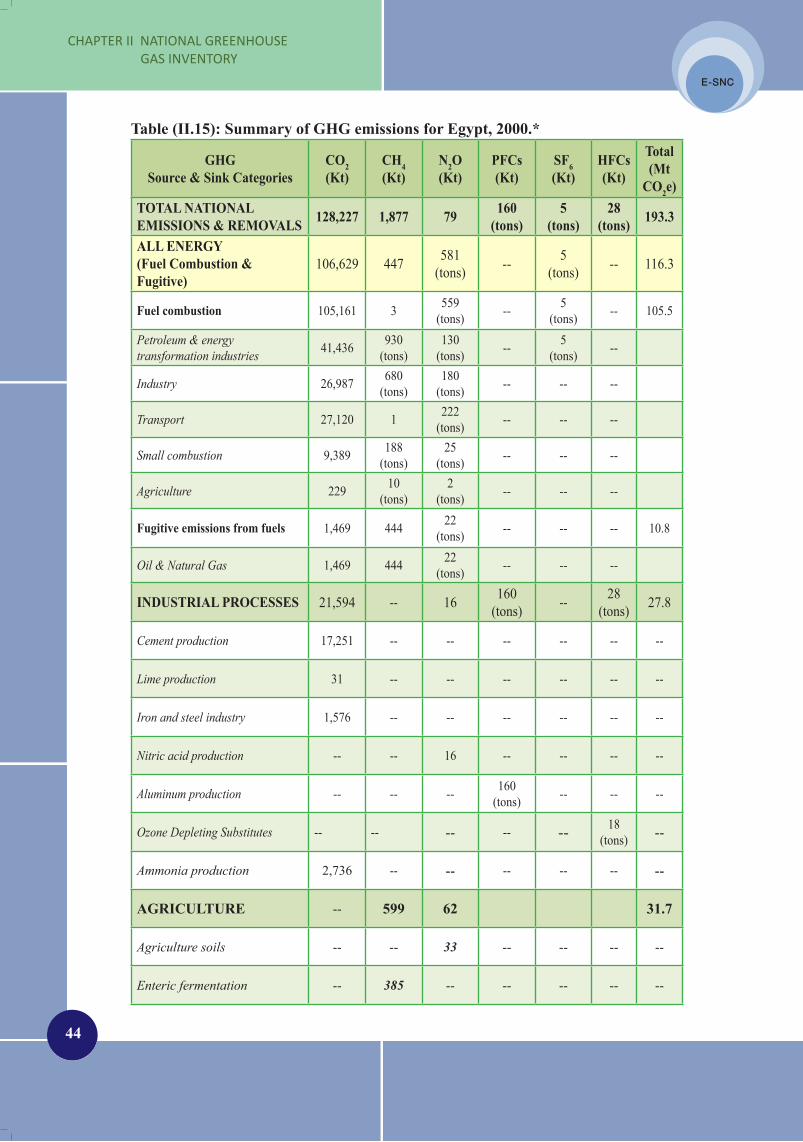
44
CHAPTEr II NATIONAL GrEENHOUSE GAS INvENTOrY
E-SNC
E-SNC
E-SNC
E-SNC
Table (II.15): Summary of GHG emissions for Egypt, 2000.*
GHGSource & Sink Categories
CO2(Kt)
CH4(Kt)
N2O(Kt)
PFCs(Kt)
SF6(Kt)
HFCs(Kt)
Total(Mt
CO2e)TOTAL NATIONAL EMISSIONS & REMOVALS 128,227 1,877 79 160
(tons)5
(tons)28
(tons) 193.3
ALL ENERGY(Fuel Combustion & Fugitive)
106,629 447 581(tons) -- 5
(tons) -- 116.3
Fuel combustion 105,161 3 559(tons) -- 5
(tons) -- 105.5
Petroleum & energy transformation industries
41,436 930(tons)
130(tons) -- 5
(tons) --
Industry 26,987 680(tons)
180(tons) -- -- --
Transport 27,120 1 222(tons) -- -- --
Small combustion 9,389 188(tons)
25(tons) -- -- --
Agriculture 229 10(tons)
2(tons) -- -- --
Fugitive emissions from fuels 1,469 444 22(tons) -- -- -- 10.8
Oil & Natural Gas 1,469 444 22(tons) -- -- --
INDUSTRIAL PROCESSES 21,594 -- 16 160(tons) -- 28
(tons) 27.8
Cement production 17,251 -- -- -- -- -- --
Lime production 31 -- -- -- -- -- --
Iron and steel industry 1,576 -- -- -- -- -- --
Nitric acid production -- -- 16 -- -- -- --
Aluminum production -- -- -- 160(tons) -- -- --
Ozone Depleting Substitutes -- -- -- -- -- 18 (tons) --
Ammonia production 2,736 -- -- -- -- -- --
AGRICULTURE -- 599 62 31.7
Agriculture soils -- -- 33 -- -- -- --
Enteric fermentation -- 385 -- -- -- -- --
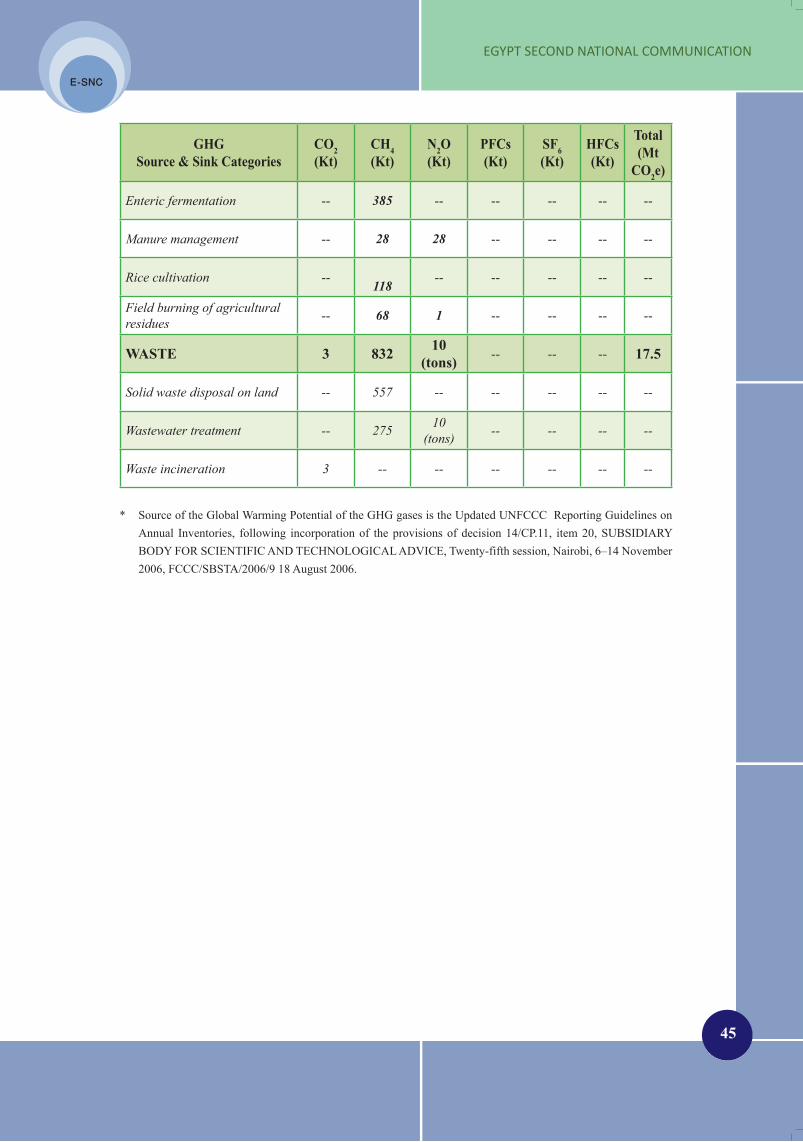
E-SNC
E-SNC
45
EGYPT SECOND NATIONAL COMMUNICATION
E-SNC
E-SNC
GHGSource & Sink Categories
CO2(Kt)
CH4(Kt)
N2O(Kt)
PFCs(Kt)
SF6(Kt)
HFCs(Kt)
Total(Mt
CO2e)
Enteric fermentation -- 385 -- -- -- -- --
Manure management -- 28 28 -- -- -- --
Rice cultivation --118
-- -- -- -- --
Field burning of agricultural residues
-- 68 1 -- -- -- --
WASTE 3 832 10(tons) -- -- -- 17.5
Solid waste disposal on land -- 557 -- -- -- -- --
Wastewater treatment -- 27510
(tons)-- -- -- --
Waste incineration 3 -- -- -- -- -- --
* Source of the Global Warming Potential of the GHG gases is the Updated UNFCCC Reporting Guidelines on Annual Inventories, following incorporation of the provisions of decision 14/CP.11, item 20, SUBSIDIARY BODY FOR SCIENTIFIC AND TECHNOLOGICAL ADVICE, Twenty-fifth session, Nairobi, 6–14 November 2006, FCCC/SBSTA/2006/9 18 August 2006.
E-SNC
E-SNC
47
EGYPT SECOND NATIONAL COMMUNICATION
E-SNC
E-SNC
CHAPTER III. PROGRAMS CONTAINING MEASURES TO MITIGATE CLIMATE CHANGE
1. Introduction
2. Strategies, Programs and Policies
Containing Measures for
Mitigating
GHGs Emissions by Key Sectors
E-SNC
E-SNC
49
EGYPT SECOND NATIONAL COMMUNICATION
E-SNC
E-SNC
III. PROGRAMS CONTAINING MEASURES TO MITIGATE CLIMATE CHANGE
III. 1. Introduction As a non-annex I country, Egypt is not required to meet any specific emission
reduction or limitation targets in terms of commitments under the UNFCCC, or the Kyoto protocol. However, mitigation measures are already in progress. Egypt is fully aware that GHG emissions reduction, particularly by major producers, is the only measure that could ensure the mitigation of global warming and climate change. The mitigation measures in this section are based on those described in national plans and country studies documents. Implementation of these national plans needs financial and technical support from the international donors.
The objective of national plans is to create a national greenhouse gas mitigation portfolio to support the process of sustainable development in Egypt. They stress Egypt’s need for technology transfer, donor funding, capacity building and financing from the Clean Development Mechanism (CDM).
Promotion of energy efficiency and utilization of renewable resources of energy not only contribute to the reduction of greenhouse gases but also are consistent with the long-term development goals of the Egyptian economy. Various policies and measures related to internalizing renewable energies, energy efficiency and reduction of GHG emissions, as advocated in the UNFCCC, have been developed in Egypt. An Inter-Ministerial Committee on Climate Change was established in 1998 to formulate, implement and promote the Comprehensive Action Plans for Combating Climate Change. Table (III.1) shows policies and measures implemented for GHG emissions reduction in Egypt during the last decade.
Accelerated developments are taking place for introducing renewables, fuel switching in industry and transport, domestic and industrial efficiency programs, energy-efficient buildings, agriculture and plantation schemes to enable establishment of an economic structure that prioritizes energy efficiency. This reflects Egypt’s basic policy direction and measures for greenhouse gas reductions to contribute to the global efforts to mitigate climate change, though not legally required to do so.

50
CHAPTEr III PrOGrAMS CONTAINING MEASUrES TO MITIGATE CLIMATE CHANGE
E-SNC
E-SNC
E-SNC
E-SNC
Table (III.1): Policies and measures implemented for GHG emissions reduction in Egypt during the last decade.
Integrated Energy Planning (IEP) at the sectoral level
Helping ensure the optimum overall mix of energy •sources.Optimizing indigenous energy resources.•Securing reliable supply of energy with minimum cost to •different sectors of Egypt’s economy.
Promotion of energy efficiency, development of environment-friendly energy, reducing GHG emissions
Maximizing use of all available renewable sources of •energy.Switching to using natural gas in substitution to oil for •power generation.Maximizing use of high-efficient gas-fired combined cycle •power plants, in addition to using large-scale generating capacity for traditional thermal power generation.Minimizing transmission and distribution losses throughout •the national electrical networks.Institutional restructuring of the energy sector.•Enhancing electricity and gas grid-interconnection across •borders of neighboring states.Fortifying energy efficiency policies for the residential •and commercial sectors via reinforcing energy efficiency standards, expanding energy efficiency labeling for household appliances, application of energy efficiency code for buildings and disseminating efficient lighting.Conserving transportation fuel consumption via promoting •cleaner alternative fuel.Reinforcing GHG reduction policy via improving methods •of farming and animal husbandry in the agriculture and livestock sectors as well as promoting recycling and waste minimization.Conserving and expanding plant sinks through plantation •and replantation projects.
Enhancing Public Participation & Cooperation
Promoting public participation and strengthening •partnerships with civil society and NGOs.Motivating the public and industries to conduct efforts that •reduce GHG emissions.
Since the late 1990s the most important mitigation measures implemented by the energy sector have encompassed fuel substitution of oil with natural gas in electricity generation and the industrial sector; combined heat and power generation; efficiency lighting systems; use of wind energy, particularly large-scale grid-connected wind farms, in electricity generation; steam condensate recovery; and the use of solar thermal energy in electricity generation.
Implemented measures in the transport sector have entailed energy efficiency through improvement of vehicle maintenance and tune up; awareness campaigns for using natural gas in commercial vehicles; extending the electrified underground transportation to new areas in Greater Cairo; intensifying the use of environmentally sound river transport; and facilitating the replacement of old taxis.

E-SNC
E-SNC
51
EGYPT SECOND NATIONAL COMMUNICATION
E-SNC
E-SNC
The mitigation measures for the agriculture and livestock sector have mainly dealt with mitigation options for CH4 emissions from rice cultivation; CH4 and CO2 emissions from livestock.
In the waste sector, a distinction was made between options suitable for solid waste and those suitable for liquid waste. For the former, implemented measures have entailed the establishment of a specialized administrative mechanism for solid waste management in each governorate and city; the recruitment of specialized experts for the choice of locations and the design of sanitary landfills; and the provision of financial and technical assistance to private sector companies interested in waste collection and waste recycling. For liquid waste, implemented measures have included the maintenance of newly developed primary and pre-treatment systems; clarification of lines of command and communications between different pertinent entities; and the development of institutional and enforcement capabilities of the local authorities of new industrial cities.
Additional mitigation measures include the increase of the country’s CO2 absorptive capacity through afforestation, entailing planting and maintaining suitable types of trees along the sides and the middle-island of inter-city roads, irrigation and drainage canals, in addition to developing man-made forest-wood trees using treated sewage water for irrigation.
The implementation of the Support for National Action Plan (SNAP) as well as the GEF building capacity and GHGs emission reduction projects, led to increased concerns about climate change within different institutions and ministries. This has been reflected in having more than twenty projects concerned with GHG mitigation actions over the past decade.
III. 2. Current Strategies, Programs and Policies Containing Measures for Mitigating GHGs Emissions by Key Sectors
III. 2. 1. Energy Sector
In the 1990s, the energy sector in Egypt has adopted policies for the integration of environmental impacts into national development plans for economic growth and social development, in order to protect the local environment and alleviate GHG emissions from energy processes.
III. 2. 1. a. Egypt’s Strategy for Energy Supply and Use
In 2007, the Egyptian Supreme Council for Energy adopted a strategy comprehensively integrating the main policies and measures that could meet the longer
52
CHAPTEr III PrOGrAMS CONTAINING MEASUrES TO MITIGATE CLIMATE CHANGE
E-SNC
E-SNC
E-SNC
E-SNC
term challenges facing the national energy industry. The strategy entails long-term security of energy supplies, including introducing renewables and nuclear power in the energy mix; sustainability of current energy utilization; and the abatement of GHG emissions growth in the medium-term. Moreover, it incorporates specific measures for mitigating climate change, encompassing:
Attracting more investments to expand access to renewable energy resources •such as wind energy and solar, to reach a contribution of 20% of the total electrical energy demand by 2020;Launching a program to build a number of nuclear power generating plants, •initiating the necessary steps to have the first plant operational by 2017, in addition to developing Egypt’s expertise and capacities in this regard, collaborating with Egypt’s international partners and IAEA with transparency and respect to all Egypt’s global obligations under the Non-Proliferation Treaty;Adopting energy production policies for rationalizing and raising the efficiency •of energy uses, including energy pricing structures in both the industrial and household sectors. These pricing structures aim at protecting limited-income groups from any unaffordable costs for their energy needs;Enhancing awareness for rationalizing energy utilization at homes, factories as •well as other various services sites;Accelerating the completion of electric interconnections with the Arab Mashreq •and Maghreb states, with plans for interconnections with the European grid in the future; Redirecting energy subsidies to eligible beneficiaries in order to minimize •wastage.
III. 2. 1. b. The Impact of Future Energy Demand on Egypt’s Energy Consumption Patterns and GHG Emissions
In addition to oil and natural gas, the available energy resources in Egypt include some oil shale, coal, hydropower and renewables, mainly comprising wind, solar and biomass. The energy system of Egypt is characterized by relying heavily on hydrocarbons, mainly oil and natural gas, for fueling the economic and social development. The following approach has been adopted for estimating GHG emissions from the Energy Sector of Egypt for the period (2006/07 to 2026/27):
Based on the average growth rates of consumption for the different petroleum 1- products and natural gas in major economic sectors, estimates for expected growth during the period 2006/07 to 2026/27 were made.In addition, projections for the consumption of petroleum products and natural 2- gas by sector for the period 2006/07 to 2026/27 were derived, based on the levels of consumption by sector, for 2006/07 as a base year, for three scenarios:
Scenario (1): • The base case, or Business as Usual (BAU) scenario;Scenario (2): • Based on the assumption of having one nuclear power plant for electricity generation operational in 2016/17, with an installed capacity of 1000 MWe, and further four plants, with a total installed capacity of 4000 MWe, up to 2026/27. Additionally, 3400 MWe of renewable energy (wind power) for electricity generation would also be introduced by 2016/17 with further 3800 MWe of wind power up to 2026/2027;
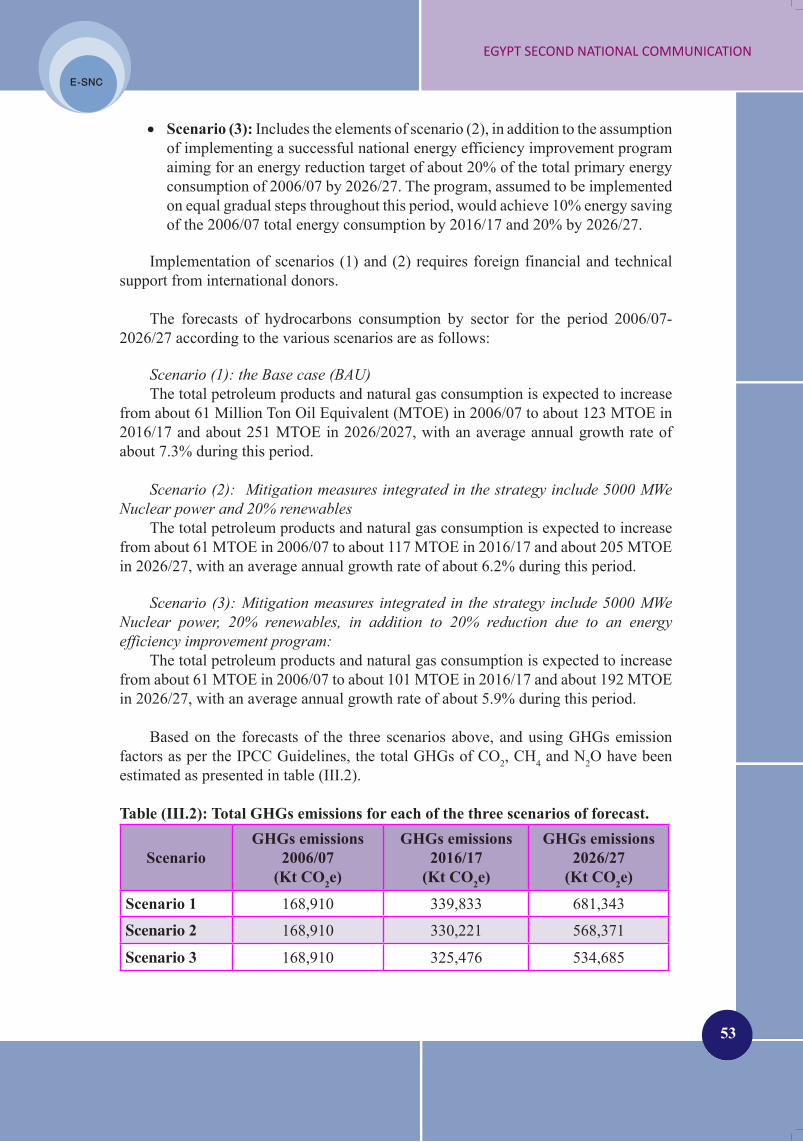
E-SNC
E-SNC
53
EGYPT SECOND NATIONAL COMMUNICATION
E-SNC
E-SNC
Scenario (3): • Includes the elements of scenario (2), in addition to the assumption of implementing a successful national energy efficiency improvement program aiming for an energy reduction target of about 20% of the total primary energy consumption of 2006/07 by 2026/27. The program, assumed to be implemented on equal gradual steps throughout this period, would achieve 10% energy saving of the 2006/07 total energy consumption by 2016/17 and 20% by 2026/27.
Implementation of scenarios (1) and (2) requires foreign financial and technical support from international donors.
The forecasts of hydrocarbons consumption by sector for the period 2006/07- 2026/27 according to the various scenarios are as follows:
Scenario (1): the Base case (BAU)The total petroleum products and natural gas consumption is expected to increase
from about 61 Million Ton Oil Equivalent (MTOE) in 2006/07 to about 123 MTOE in 2016/17 and about 251 MTOE in 2026/2027, with an average annual growth rate of about 7.3% during this period.
Scenario (2): Mitigation measures integrated in the strategy include 5000 MWe Nuclear power and 20% renewables
The total petroleum products and natural gas consumption is expected to increase from about 61 MTOE in 2006/07 to about 117 MTOE in 2016/17 and about 205 MTOE in 2026/27, with an average annual growth rate of about 6.2% during this period.
Scenario (3): Mitigation measures integrated in the strategy include 5000 MWe Nuclear power, 20% renewables, in addition to 20% reduction due to an energy efficiency improvement program:
The total petroleum products and natural gas consumption is expected to increase from about 61 MTOE in 2006/07 to about 101 MTOE in 2016/17 and about 192 MTOE in 2026/27, with an average annual growth rate of about 5.9% during this period.
Based on the forecasts of the three scenarios above, and using GHGs emission factors as per the IPCC Guidelines, the total GHGs of CO2, CH4 and N2O have been estimated as presented in table (III.2).
Table (III.2): Total GHGs emissions for each of the three scenarios of forecast.
ScenarioGHGs emissions
2006/07(Kt CO2e)
GHGs emissions 2016/17
(Kt CO2e)
GHGs emissions 2026/27
(Kt CO2e)
Scenario 1 168,910 339,833 681,343
Scenario 2 168,910 330,221 568,371
Scenario 3 168,910 325,476 534,685

54
CHAPTEr III PrOGrAMS CONTAINING MEASUrES TO MITIGATE CLIMATE CHANGE
E-SNC
E-SNC
E-SNC
E-SNC
III. 2. 1. c. Other Climate Change Mitigation Options
Other reductions of GHG emissions from the energy sector by 2027 can be achieved, provided that foreign donor programs of technical assistance for technology transfer, as well as funding, would be available for a number of initiatives already identified in the following:
The use of lower carbon fuels, such as bio-diesel;1-
The control of emissions of GHGs emitted by various sources; 2-
Creating offsets through investment in GHGs emission sinks; 3-
The use of market-based economic instruments to facilitate cost-effective 4- compliance.
Table (III.3) provides a synopsis of the above initiatives, facilitating comparison of the alternative climate change mitigation measures and estimate of possible annual emission reduction of CO2e with the associated cost, for the energy sector.
Table (III.3): Climate change mitigation matrix for the energy sector.*
Climate Change Action Areas
Lev
el o
f exp
erie
nce
with
dep
loym
ent
Com
mer
cial
bene
fit
Type
of C
O2
miti
gatio
n
Lev
el o
f CO
2m
itiga
tion
CO
2 cos
t-ef
fect
iven
ess
Pote
ntia
l CO
2e
year
ly r
educ
tion
(Kt)
Est
imat
ed c
ost
year
ly(1
000
US$
)
Environmental Pollution 1. Control Actions
Understanding, 1.1 qualifying and controlling GHG emissions from utility operations
L L A L N/A 150 15,000
Improving 1.2 environmental pollution controls
L M/H A L N/A
Utilizing Nuclear Power 2. Generation** 1st year
3,500Year 2027
12,000
3.5 – 4..5/ kWe
Utilizing Nuclear 2.1 Power for Electricity Generation
L M/H A H H
Applying Carbon 3. Capture & Storage (CCS) Technology
Implementing CO3.1 2 for EOR techniques for Power plants near stranded oil & gas wells
L L/M R H L
1st year 1000
Year 2027 12,000
0.04/ tCO2

E-SNC
E-SNC
55
EGYPT SECOND NATIONAL COMMUNICATION
E-SNC
E-SNC
Climate Change Action Areas
Lev
el o
f exp
erie
nce
with
dep
loym
ent
Com
mer
cial
bene
fit
Type
of C
O2
miti
gatio
n
Lev
el o
f CO
2m
itiga
tion
CO
2 cos
t-ef
fect
iven
ess
Pote
ntia
l CO
2e
year
ly r
educ
tion
(Kt)
Est
imat
ed c
ost
year
ly(1
000
US$
)
Renewable Energy Actions4.
Fuel switching from 4.1 carbon to non-carbon based fuels M M O M H 500
0.05-0.25/kWh (renewables)
0.02-0.10/ kWh (fossil)
Biomass a.
M M O M H 50
0.53-0.60/kW for industrial units0.30/kW where fuel sources are geographically
convenient.
Small-scale b. hydropower H H A M H 350 1.0-3.0/kW
Photovoltaics c. (PV) M L A L/M M/H 100 1.0-0.7/kW by
2015
Solar thermal d. L M A L/M M 67 Parabolic troughs:
2.5/kWe
Wind power 4.2 M M A M/H M/H
1st year 500 year 2020
16,365
1.0-1.2/kWe (utility-scale)
Waste-derived fuels 4.3 L M A L/M N/A N/A N/A
Fuel System Actions5.
Fuel switching to 5.1 natural gas M L/M A M M 200 25,000
Conventional Power 6. Generation System Actions
Improving firing 6.1 equipment and controls
M M/H A/R L/M M 500 10,000-25,000
Turbine cycle 6.2 improvements M M/H R L N/A 200 0.48-0.58/kW
Modernizing plant 6.3 instrumentation and controls
L H R L N/A N/A 1000-4000/unit
Energy management 6.4 systems L H A L M/H 2000 50,000
Transmission System 7. Actions
High voltage direct 7.1 current L L/M A L N/A N/A N/A
increasing and 7.2 stabilizing line voltage M L/M A L N/A N/A 0.5-0.75/ km
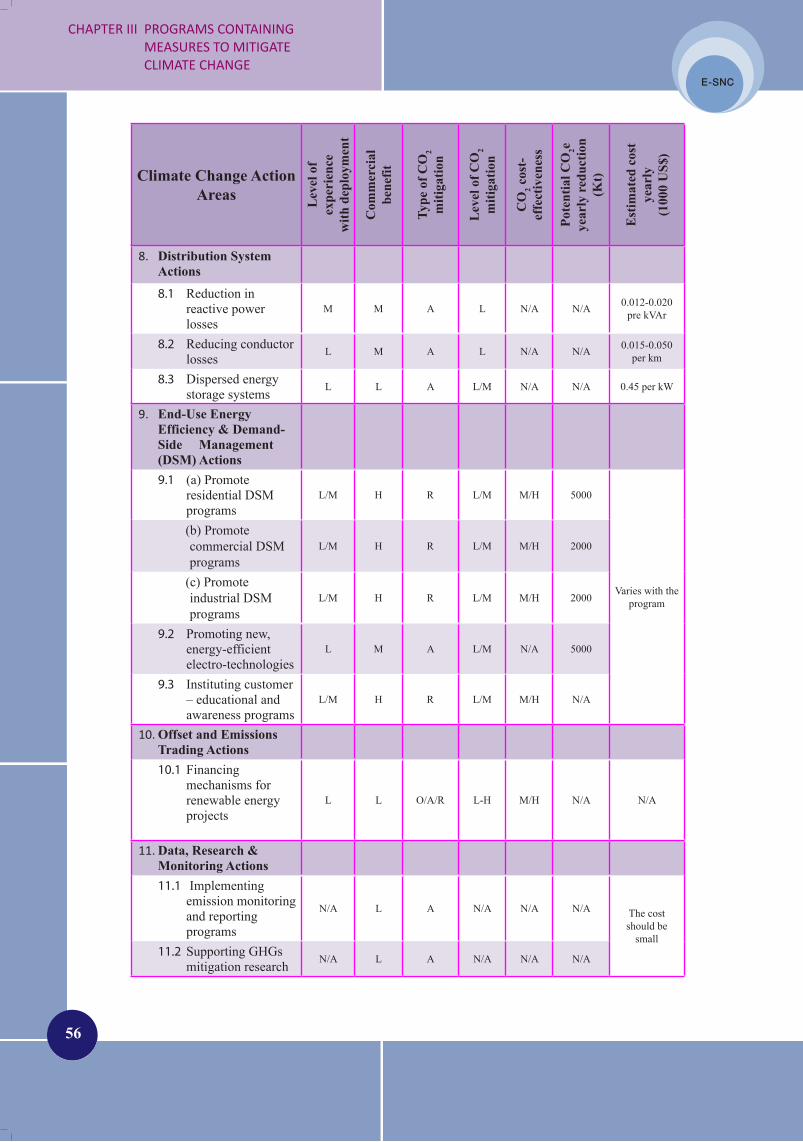
56
CHAPTEr III PrOGrAMS CONTAINING MEASUrES TO MITIGATE CLIMATE CHANGE
E-SNC
E-SNC
E-SNC
E-SNC
Climate Change Action Areas L
evel
of
expe
rien
cew
ith d
eplo
ymen
t
Com
mer
cial
bene
fit
Type
of C
O2
miti
gatio
n
Lev
el o
f CO
2m
itiga
tion
CO
2 cos
t-ef
fect
iven
ess
Pote
ntia
l CO
2e
year
ly r
educ
tion
(Kt)
Est
imat
ed c
ost
year
ly(1
000
US$
)
Distribution System 8. Actions
Reduction in 8.1 reactive power losses
M M A L N/A N/A 0.012-0.020pre kVAr
Reducing conductor 8.2 losses L M A L N/A N/A 0.015-0.050
per km
Dispersed energy 8.3 storage systems L L A L/M N/A N/A 0.45 per kW
End-Use Energy 9. Efficiency & Demand-Side Management (DSM) Actions
(a) Promote 9.1 residential DSM programs
L/M H R L/M M/H 5000
Varies with the program
(b) Promote commercial DSM programs
L/M H R L/M M/H 2000
(c) Promote industrial DSM programs
L/M H R L/M M/H 2000
Promoting new, 9.2 energy-efficient electro-technologies
L M A L/M N/A 5000
Instituting customer 9.3 – educational and awareness programs
L/M H R L/M M/H N/A
Offset and Emissions 10. Trading Actions
Financing 10.1 mechanisms for renewable energy projects
L L O/A/R L-H M/H N/A N/A
Data, Research & 11. Monitoring Actions
Implementing 11.1 emission monitoring and reporting programs
N/A L A N/A N/A N/A The cost should be
smallSupporting GHGs 11.2 mitigation research N/A L A N/A N/A N/A

E-SNC
E-SNC
57
EGYPT SECOND NATIONAL COMMUNICATION
E-SNC
E-SNC
Climate Change Action Areas L
evel
of
expe
rien
cew
ith d
eplo
ymen
t
Com
mer
cial
bene
fit
Type
of C
O2
miti
gatio
n
Lev
el o
f CO
2m
itiga
tion
CO
2 cos
t-ef
fect
iven
ess
Pote
ntia
l CO
2e
year
ly r
educ
tion
(Kt)
Est
imat
ed c
ost
year
ly(1
000
US$
)
Energy Sector 12. Institutional Reform and Restructuring Actions (Competitive market).
Increasing the role 12.1 of independent power producers in the electricity generation sector
L H A/R L/M N/A N/A Varies
Regulatory Reform 13. Actions
DSM regulations 13.1 and incentives L M R L/M L/A
Requires site
specific details
Requires site specific details
Energy efficiency 13.2 regulation and incentives
L M R L/M L/A
Emission control 13.3 regulation and incentives
M/H M A/R M/H M
Other regulations 13.4 and incentives that contribute to climate change mitigation
L M A L L
* Legend:Level of Experience with Deployment of Action:H – high M – moderate L – lowCommercial Benefit:H- high (action makes commercial sense independent of any GHG benefit)M- moderate (action is marginally cost-effective, but a benefit from GHG Mitigation improves economics)L- low (action requires GHG mitigation benefit to make commercial sense)N/A- Not available Degree of Mitigation (number of MtCO
2 avoided/offset/ reduced):
H – high M – moderate L – lowType of CO2 Mitigation Achieved:A- avoided O – offset R – reducedCO2 Cost-Effectiveness:H- low cost per ton/CO2 avoided/offset/reduced M- moderate cost per ton/ CO2 avoided/offset/reducedL- high cost per ton/ CO2 avoided/offset/reduced
** Starting the year 2017.

58
CHAPTEr III PrOGrAMS CONTAINING MEASUrES TO MITIGATE CLIMATE CHANGE
E-SNC
E-SNC
E-SNC
E-SNC
III. 2. 2. Industrial Sector
For the GHG emissions from the industrial sector, the cement industry is responsible for 17 Mt of CO2 emissions per year, amounting to about 62% of the total GHG emissions of the industrial sector. In addition, the fertilizers industry is responsible for 5 Mt of CO2e emissions per year, equivalent to about 20% of the total emissions of the sector. Egypt’s industrial development strategy issued in 2006 incorporates climate change into national development priorities. The prime objective of this strategy is to upgrade the Egyptian industrial sector from being technology-excluding to being technology-adopting in the medium term. This would be realized through directly linking the industrial sector to the world technology markets through sustainable technology transfer channels. The most significant industrial processes and product categories in Egypt with respect to GHG emissions, are cement production, processes of carbonates and nitric acid production, as well aluminum production. Some of these industrial processes have already partly acquired technologies through the Clean Development Mechanism (CDM) under the Kyoto Protocol.
Over the years, a series of policies and measures have been adopted so that GHG emissions per unit of product in industrial processes (excluding those related to energy) witnessed a general drop. Examples of these measures include:
Designating GHGs reducing technology as one of the environmentally sound •technologies;Creating a market for climate and environment friendly technologies;•Comprehensive utilization of flue gases, boiler’s steam and every possible heat •waste;Minimizing the ratio between raw materials and products without significant •changes in specifications;Treating tail gases to convert nitrous oxide and NO• x in nitric acid production into nitrogen, oxygen and water vapor; Controlling the process chain to reduce the GHG emissions such as PFCs •emission reduction in the aluminum industry.
The main barriers currently preventing the industrial sector from achieving full energy conservation and considerable GHG emissions reduction include:
Subsidies that hinder the incentives to activities for GHG emissions reduction;•Lack of information about GHG emissions reduction opportunities in the •sector;Long payback period on some GHG emissions reduction investments compared •to other investment alternatives. This would require international donors support;Financial barriers such as lack of access to investment capital or requiring very •high rates of return on investments;Competing corporate priorities such as competitiveness, other environmental •and/or regulatory concerns.

E-SNC
E-SNC
59
EGYPT SECOND NATIONAL COMMUNICATION
E-SNC
E-SNC
Regulatory programs, such as emission standards and offsets will help setting industry-specific and product-specific GHG emission standards for bringing about more certain compliance. Efficiency or performance standards can help to overcome a variety of barriers and shift production to lower GHG-emitting industrial practices. Research, development and demonstration (RD&D) is needed in the near term in order to create and commercialize new industrial technology and to reach future emissions goals in the period 2020 to 2050 timeframe. Table (III.4) presents a variety of potential sector-specific measures which could encourage further reductions in process-related GHG emissions.
Table (III.4): Mitigation options for GHGs abatement in the industrial sector.
Technical Options Climate and OtherEnvironmental Effects
New Technologies and ProcessesHydrogen reduction of metal oxide ores- Carbon-free hydrogen and ammonia - productionNon-reactive electrodes for aluminum - productionNon-fluorine-based aluminum production-
Climate BenefitsReduction of CO2 emissions
Other Additional EffectsReduction in air pollution from coke
Process ImprovementsN- 2O reduction for nylon productionN- 2O reduction for urea productionCF- 4 reduction in aluminum productionHCFC elimination-
Climate BenefitsReduction of CO2 emissions
Other EffectsN2O and HCFC reduction will protect ozone layer
Material SubstitutionReplacement of metals with plastics- Replacement of concrete with plastics- Lighter materials lower transport-related - CO2 emissionsIntroducing chemicals made from plant - feed stock materialsCement blending -
Climate BenefitsHas to be determined on case by case basis
Other EffectsReduction in air pollution
Material Recycling/ReuseDesign for disassembly- Design materials for reuse- Material quality cascading-
Climate BenefitsSavings of carbon emissions proportional to the increase in recycling percentage
Other EffectsLess solid waste and lower resource use
60
CHAPTEr III PrOGrAMS CONTAINING MEASUrES TO MITIGATE CLIMATE CHANGE
E-SNC
E-SNC
E-SNC
E-SNC
III. 2. 3. Transport Sector
The transport sector accounted for about 27% of Egypt’s GHG emissions in 2000. It is the most rapidly growing source of GHG emissions in Egypt, and the energy intensity in this sector is particularly high due to the low efficient-engines using hydrocarbon fuels (gasoline and diesel oil), and to the primary reliance on road transport as the main means of transportation.
Based on a Cabinet of Ministers decision, the Ministry of Transport developed a strategy for improving national transport and urban traffic, in addition to controlling exhaust emissions from road-going vehicles in Egypt. In this respect, the removal of lead from gasoline, and the removal of an increased quantity of sulphur from diesel oil is to be achieved by 2012.
Other mitigation options considered include public transport initiatives, energy efficiency improvements, fuel switching and new propulsion technologies:
The management of public transport systems must be radically improved. •Measures include provision of new vehicles; expansions of public transport; and in non-motorized transport use, the integration of modes and timetables/services; the introduction of clear information and customer service training; increased maintenance of vehicles, stops and stations; and the restructuring of the minibus taxi sector. Travel demand management offers significant opportunity to mitigate growth of •emissions from private car users; Fuel switching could include liquefied petroleum gas, biochemical fuels, •compressed natural gas, and electric and hybrid electric propulsion technology. Municipalities and operators should be encouraged to introduce a wide variety •of more efficient public transport propulsion systems and pilot alternative fuel use. These technologies and systems include bus rapid transit and the use of bio fuels. Non-motorized transport can be encouraged through appropriate planning, •provision of infrastructure, and marketing of these emissions-free, low cost modes.
Table (III.5) presents various mitigation options for the transport sector with their potential GHG emissions reduction. Implementation of most of these measures requires intenatonal financial and technical support.

E-SNC
E-SNC
61
EGYPT SECOND NATIONAL COMMUNICATION
E-SNC
E-SNC
Table (III.5): Transport sector opportunities for mitigation options.Mitigation /
Adaptation Option Size
Automotive Transport
Shift to diesel (including bio-diesel) engines - Introduction of the hybrid car, including the plug-in hybrid - electric vehicle (PHEV)
Rail Transport
Development of urban transport in the cities of Cairo - and Alexandria in the form of metros and tramways, and combinations of “light” and “heavy” rail passenger transport
Freight Transport Nile barge freight transport - Rail freight transport (container inland ports)-
Power Train Technologies
Power train technologies available today include ICE petrol (further development of the ICE can improve the fuel efficiency of petrol vehicles by 30% and that of diesel vehicles by around 20%); ICE diesel; compressed natural gas (CNG); and hybrids
Shifting from Diesel to Electrified Railways
Potential Shifts:Electrification of Cairo – Alexandria Line around 2020 - Electrification of Cairo – Upper Egypt Line (to Assiut then - to Aswan) around 2030
Fuel Cells Technology
Numbers of vehicles utilizing fuel cells are anticipated to - grow as their economics improveHydrogen generated as a by-product in industry will be - used More hydrogen could be generated via electrolysis of - water using free carbon energy available from as solar photovoltaics, or wind energy
III. 2. 4. Agriculture Sector
Many research studies, national and international projects, and governmental programs and campaigns, have been carried out by the Ministry of Agriculture and Land Reclamation in order to conserve water and land resources, ensure food security and alleviate poverty, and sustain agricultural production and resources. Some of these efforts had positive impacts on the mitigation of GHG emissions primarily from rice cultivation, livestock production, and soil management.
Regarding mitigation of CH4 emissions from rice cultivation, the actual recorded areas of cultivated rice, from the period of 1997 to 2007, reflect a gradual increase, with the area reaching 1.58 million acres by 2007. Based on current rice cultivation, projections for CH4 emissions predict an increase of about 35% during the period 1997 to 2017 (Medany, 2007). In this regard, a number of mitigation measures and scenarios offer an opportunity for the reduction of CH4 emissions from rice production by 0.055
62
CHAPTEr III PrOGrAMS CONTAINING MEASUrES TO MITIGATE CLIMATE CHANGE
E-SNC
E-SNC
E-SNC
E-SNC
to 0.087 Tg by 2017. The current Ministry of Agriculture and Land Reclamation plan aims at sustaining rice cultivation areas under 1.4 million acres, with area reduction to 1.2 million acres by 2017. This plan also requires switching conventional cultivars by short duration cultivars, and applying intermittent irrigation. Switching cultivars was the most accepted measure by farmers over the last few years.
As for the mitigation of GHG emissions from livestock production, improving feeding patterns and technologies to enhance veterinary care, and improving breeding programs represent the primary options. Changing feeding pattern of native dairy cattle (Central Laboratory for Agriculture Climate, 2002) resulted in improving milk productivity, with a CH4 reduction by about 15-20%.
A number of barriers face mitigation policies in the agricultural sector. These include:Institutional capacity and framework: • The awareness of the sector stakeholders of the threats of climate change is limited, as information regarding climate change impacts over the different activities of the sector has not been widely shared and disseminated. Additionally, the current system of agricultural census doesn’t provide the required data for mitigation planning processes. Data exchange between the other economic sectors, sub-sectors, and governmental bodies is limited. Mitigation funds: • The lack of the necessary institutional framework is limiting the ability of this sector in obtaining support from the current UNFCCC and Kyoto Protocol mitigation fund mechanisms.Knowledge and technology levels: • The low knowledge and technology levels of the farmers represent the most significant constraint to mitigation policies in this sector. Increasing services efficiency is a basic step for the development of mitigation and adaptation strategies. In addition to foreign mitigation funds, training on technology transferred is required.
With the aim of mainstreaming mitigation in national policies, the Ministry of Agriculture and Land Reclamation is developing a national strategy for sustainable agricultural development, up to year 2030. The main goals of this strategy comprise a switching to short life and/or cultivars tolerant of higher temperatures, salinity and drought; improving irrigation management; improving livestock production systems; and establishing a national integrated network for monitoring and assessing of climatic and environmental hazards and their impact on agriculture.
III. 2. 5. Waste Sector
Six main criteria have been selected for prioritization of mitigation measures in the waste sector. These entail investment costs; payback periods; GHGs emission reductions potentials; duration of implementation; priority in national strategies/programs; and contribution to sustainable development. Mitigation options, concluded from a multi-criteria analysis, were combined for each sub-sector in order to generate a number of scenarios for solid waste and wastewater. The lowest GHG emitting scenario was selected for implementation during the period 2009 to 2025.

E-SNC
E-SNC
63
EGYPT SECOND NATIONAL COMMUNICATION
E-SNC
E-SNC
Mitigation measures under one or more of appropriate treatment categories, the associated emission reduction potential, and investment costs calculated for 25 years lifetime in simple linear amortization cost, are summarized in tables (III.6) and (III.7) for solid waste and wastewater, respectively (Osama, “Survey on Egypt GHG Emissions, Waste Sector”, 2007).
Table (III.6): Summary of identified mitigation measures for solid waste.
Mitigation Measure
Emission reduction potential
(ton CO2e per ton MSW)
Investment cost(US$/ton MSW)
Composting and recycling facilities 0.38 0.92
Refuse Derived Fuel (RDF) with electricity generation only, composting, and recycling < 0.3 2.07
Refuse Derived Fuel (RDF) with substitution in cement kiln, composting, and recycling facilities
< 0.3 1.97
Anaerobic digestion with recycling (flaring biogas) 0.342 12.16
Anaerobic digestion with recycling facilities (with electricity generation) 0.547 16.16
Table (III.7): Summary of identified mitigation measures for wastewater.
Mitigation Measure
Emission reduction potential
(kgCO2e/ m3 WW)
Cost of Mitigation(US$/ m3WW)
Untreated domestic wastewater in current practice
Aerobic treatment of wastewater and aerobic treatment of sludge through composting
0.29
Shallow Ponds: 0.015
Aerobic WWTP: 0.050
Aerobic treatment of wastewater and combustion of sludge in cement kiln 2.25
Shallow Ponds: 0.014
Aerobic WWTP: 0.050
Aerobic treatment of wastewater and treatment of sludge in anaerobic system with biogas flaring
2.55
Shallow Ponds: 0.134
Aerobic WWTP: 0.170
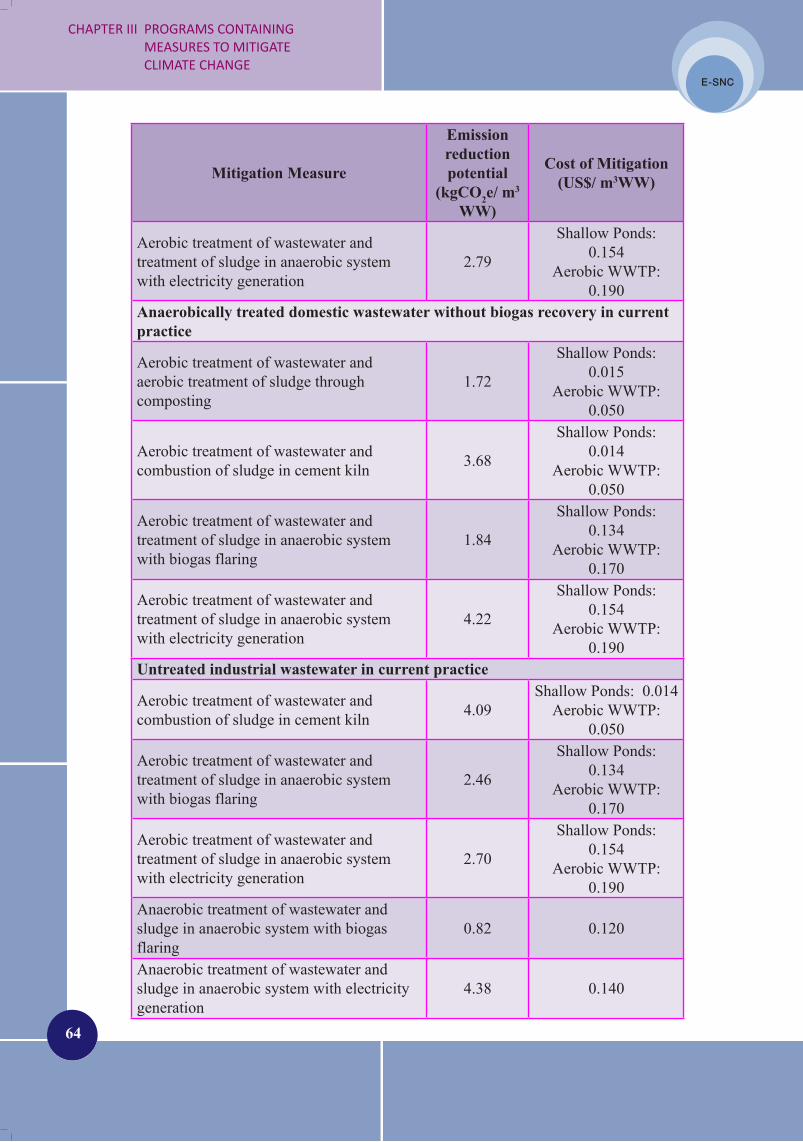
64
CHAPTEr III PrOGrAMS CONTAINING MEASUrES TO MITIGATE CLIMATE CHANGE
E-SNC
E-SNC
E-SNC
E-SNC
Mitigation Measure
Emission reduction potential
(kgCO2e/ m3 WW)
Cost of Mitigation(US$/ m3WW)
Aerobic treatment of wastewater and treatment of sludge in anaerobic system with electricity generation
2.79
Shallow Ponds: 0.154
Aerobic WWTP: 0.190
Anaerobically treated domestic wastewater without biogas recovery in current practice
Aerobic treatment of wastewater and aerobic treatment of sludge through composting
1.72
Shallow Ponds: 0.015
Aerobic WWTP: 0.050
Aerobic treatment of wastewater and combustion of sludge in cement kiln 3.68
Shallow Ponds: 0.014
Aerobic WWTP: 0.050
Aerobic treatment of wastewater and treatment of sludge in anaerobic system with biogas flaring
1.84
Shallow Ponds: 0.134
Aerobic WWTP: 0.170
Aerobic treatment of wastewater and treatment of sludge in anaerobic system with electricity generation
4.22
Shallow Ponds: 0.154
Aerobic WWTP: 0.190
Untreated industrial wastewater in current practice
Aerobic treatment of wastewater and combustion of sludge in cement kiln 4.09
Shallow Ponds: 0.014 Aerobic WWTP:
0.050
Aerobic treatment of wastewater and treatment of sludge in anaerobic system with biogas flaring
2.46
Shallow Ponds: 0.134
Aerobic WWTP: 0.170
Aerobic treatment of wastewater and treatment of sludge in anaerobic system with electricity generation
2.70
Shallow Ponds: 0.154
Aerobic WWTP: 0.190
Anaerobic treatment of wastewater and sludge in anaerobic system with biogas flaring
0.82 0.120
Anaerobic treatment of wastewater and sludge in anaerobic system with electricity generation
4.38 0.140

E-SNC
E-SNC
65
EGYPT SECOND NATIONAL COMMUNICATION
E-SNC
E-SNC
The Egyptian relevant ministries, in close collaboration with concerned governorates, have developed several plans and programs over the past ten years to improve the process of dealing with waste reduction, reuse, recycling and/or proper disposal. These plans and programs lead to the reduction in emissions from the waste sector. Yet there are several barriers to achieving the goals of these programs. These comprise the following:
Although financial support for mitigation of GHGs emissions from the waste •sector in Egypt has increased significantly over the last years, it still represents a clear constraint in the implementation of the intended programs.Investment in this sector requires large funds and is not cost effective for the •private sector, so there is significant dependence on external financial support, as grants and concessionary loans, which complicates the planning process, and slows down implementation.Technology transfer represents another barrier mainly in anaerobic digestion •technologies as it needs high capital investment and skills to operate correctly. Some technologies are designed on site-specific bases, which are not optimal for other regions. Highly local skilled experts and extensive studies are needed for proving the suitability and applicability of the technology according to different varying local conditions in Egypt.All parties in the waste sector are relatively of limited environmental management •experience and the mechanisms for coordination with EEAA are not well established. Furthermore, privatization of the waste sector lacks clear modalities for partnership, particularly with regards to private-public partnership.
E-SNC
E-SNC
67
EGYPT SECOND NATIONAL COMMUNICATION
E-SNC
E-SNC
CHAPTER IV. VULNERABILITY AND ADAPTATION TO CLIMATE CHANGE
1. Introduction
2. Water Resources
3. Agriculture Sector
4. Coastal Zones
5. Tourism Sector
6. Housing and Roads
7. Health Sector
E-SNC
E-SNC
69
EGYPT SECOND NATIONAL COMMUNICATION
E-SNC
E-SNC
IV. VULNERABILITY AND ADAPTATION TO CLIMATE CHANGE
IV. 1. Introduction
Egypt is one of the most vulnerable countries to the potential impacts and risks of climate change, even though it produces less than 1% of the world total emissions of GHG, with a vulnerability of all sectors of development and a low resilience of the majority of stakeholders. The sectors of water resources, agricultural resources and food security, coastal resources, tourism, and health are all highly vulnerable with serious socioeconomic implications (INC, 1999). This chapter outlines and updates the main vulnerabilities associated with various sectors of development in Egypt. Detailed analysis of adaptation policy and measures has been carried out. Vulnerabilities, socioeconomic implications and suggested adaptation policies and measures for each sector are outlined.
IV. 2. Water Resources
IV. 2. 1. Vulnerability
This section addresses the sensitivity of the Nile river waters to climate change. The sensitivity of different Nile basins to uniform changes in rainfall have been studied (Sayed, 2004). Results are summarized in Table (IV.1). It is clear that the Eastern Nile (Atbara and the Blue Nile) is extremely sensitive to the change in rainfall both positive and negative, where an increase of 10% in rainfall results in a 36% increase in water flow at Khartoum, and a decrease of 10% in rainfall results in flow reduction of 31%. On the other hand, Equatorial Nile (Lake Victoria at Jinja) flow has low sensitivity to the change in rainfall, with a 6% increase of flow for a 10% increase in rainfall and a decrease of 4% of flow reduce flow for a 10% decrease in rainfall. Bahr El Ghazal Basin (White Nile at Malakal) has moderate sensitivity, where an increase of 10% in rainfall increases water flow by 19% and a decrease of 10% in rainfall reduces water flow by 11%.
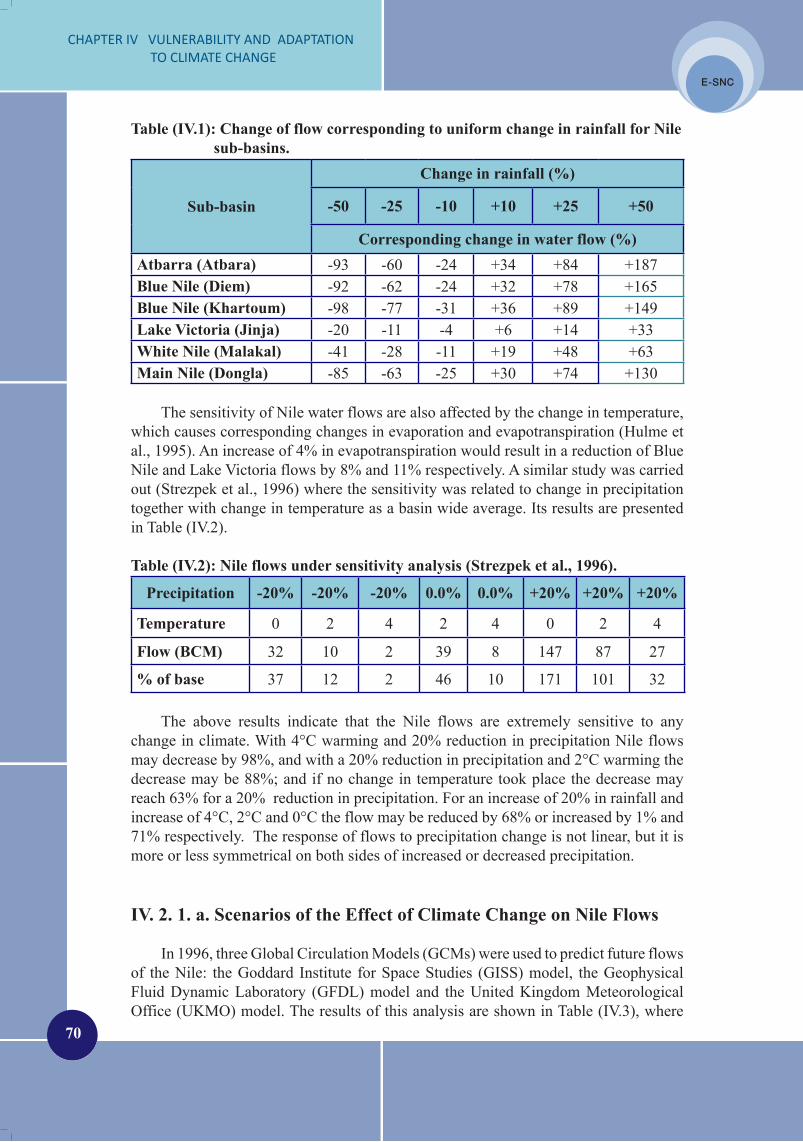
70
CHAPTEr Iv vULNErAbILITY AND ADAPTATION TO CLIMATE CHANGE
E-SNC
E-SNC
E-SNC
E-SNC
Table (IV.1): Change of flow corresponding to uniform change in rainfall for Nile sub-basins.
Sub-basin
Change in rainfall (%)
-50 -25 -10 +10 +25 +50
Corresponding change in water flow (%)Atbarra (Atbara) -93 -60 -24 +34 +84 +187Blue Nile (Diem) -92 -62 -24 +32 +78 +165Blue Nile (Khartoum) -98 -77 -31 +36 +89 +149Lake Victoria (jinja) -20 -11 -4 +6 +14 +33White Nile (Malakal) -41 -28 -11 +19 +48 +63Main Nile (Dongla) -85 -63 -25 +30 +74 +130
The sensitivity of Nile water flows are also affected by the change in temperature, which causes corresponding changes in evaporation and evapotranspiration (Hulme et al., 1995). An increase of 4% in evapotranspiration would result in a reduction of Blue Nile and Lake Victoria flows by 8% and 11% respectively. A similar study was carried out (Strezpek et al., 1996) where the sensitivity was related to change in precipitation together with change in temperature as a basin wide average. Its results are presented in Table (IV.2).
Table (IV.2): Nile flows under sensitivity analysis (Strezpek et al., 1996).
Precipitation -20% -20% -20% 0.0% 0.0% +20% +20% +20%
Temperature 0 2 4 2 4 0 2 4
Flow (BCM) 32 10 2 39 8 147 87 27
% of base 37 12 2 46 10 171 101 32
The above results indicate that the Nile flows are extremely sensitive to any change in climate. With 4°C warming and 20% reduction in precipitation Nile flows may decrease by 98%, and with a 20% reduction in precipitation and 2°C warming the decrease may be 88%; and if no change in temperature took place the decrease may reach 63% for a 20% reduction in precipitation. For an increase of 20% in rainfall and increase of 4°C, 2°C and 0°C the flow may be reduced by 68% or increased by 1% and 71% respectively. The response of flows to precipitation change is not linear, but it is more or less symmetrical on both sides of increased or decreased precipitation.
IV. 2. 1. a. Scenarios of the Effect of Climate Change on Nile Flows
In 1996, three Global Circulation Models (GCMs) were used to predict future flows of the Nile: the Goddard Institute for Space Studies (GISS) model, the Geophysical Fluid Dynamic Laboratory (GFDL) model and the United Kingdom Meteorological Office (UKMO) model. The results of this analysis are shown in Table (IV.3), where
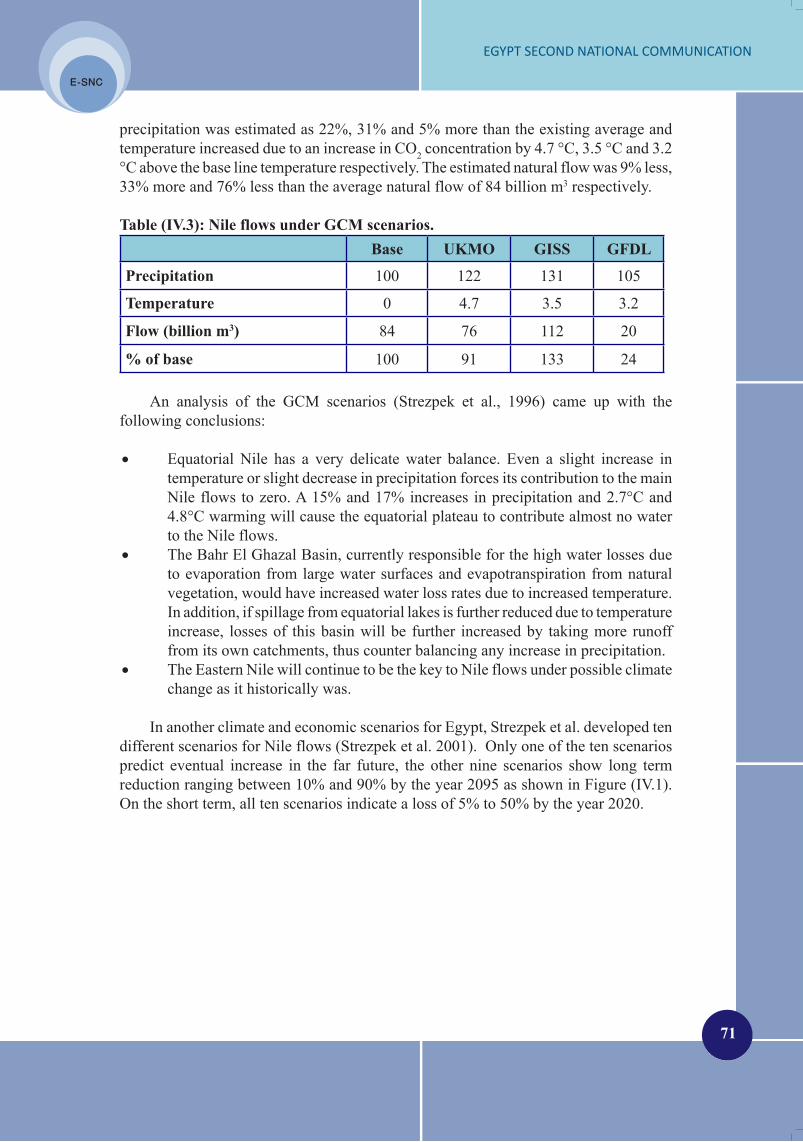
E-SNC
E-SNC
71
EGYPT SECOND NATIONAL COMMUNICATION
E-SNC
E-SNC
precipitation was estimated as 22%, 31% and 5% more than the existing average and temperature increased due to an increase in CO2 concentration by 4.7 °C, 3.5 °C and 3.2 °C above the base line temperature respectively. The estimated natural flow was 9% less, 33% more and 76% less than the average natural flow of 84 billion m3 respectively.
Table (IV.3): Nile flows under GCM scenarios.Base UKMO GISS GFDL
Precipitation 100 122 131 105
Temperature 0 4.7 3.5 3.2
Flow (billion m3) 84 76 112 20
% of base 100 91 133 24
An analysis of the GCM scenarios (Strezpek et al., 1996) came up with the following conclusions:
Equatorial Nile has a very delicate water balance. Even a slight increase in •temperature or slight decrease in precipitation forces its contribution to the main Nile flows to zero. A 15% and 17% increases in precipitation and 2.7°C and 4.8°C warming will cause the equatorial plateau to contribute almost no water to the Nile flows.The Bahr El Ghazal Basin, currently responsible for the high water losses due •to evaporation from large water surfaces and evapotranspiration from natural vegetation, would have increased water loss rates due to increased temperature. In addition, if spillage from equatorial lakes is further reduced due to temperature increase, losses of this basin will be further increased by taking more runoff from its own catchments, thus counter balancing any increase in precipitation. The Eastern Nile will continue to be the key to Nile flows under possible climate •change as it historically was.
In another climate and economic scenarios for Egypt, Strezpek et al. developed ten different scenarios for Nile flows (Strezpek et al. 2001). Only one of the ten scenarios predict eventual increase in the far future, the other nine scenarios show long term reduction ranging between 10% and 90% by the year 2095 as shown in Figure (IV.1). On the short term, all ten scenarios indicate a loss of 5% to 50% by the year 2020.

72
CHAPTEr Iv vULNErAbILITY AND ADAPTATION TO CLIMATE CHANGE
E-SNC
E-SNC
E-SNC
E-SNC
Sheet1
Page 1
0
0.2
0.4
0.6
0.8
1
1.2
1.4
1995 2020 2045 2070 2095
Scenarios 1 Scenarios 2 Scenarios 3 Scenarios 4 Scenarios 5Scenarios 6 Scenarios 7 Scenarios 8 Scenarios 9
Figure (IV.1): Scenarios of changes in Nile flows (Strezpek et al., 2001).
In 2005, a United Nations Environment Program study (UNEP, 2005) considered the impact of climate change and/or variability on the Nile flow, as illustrated by Figure (IV.2) showing a stream hydrograph for one of the gauging stations along the River Nile, the Atbara station which was established early in the 20th century. The hydrograph covers a 90 years period (1907-1997) of monitoring. Three distinct periods of water level rise and decline can be detected: from 1907 to 1961 water level was slightly rising, from 1962 to 1984 a steep decline, and from 1987 to 1997 a water level rise which was as steep as the previous decline, which is an indicator of the high sensitivity of the natural flow to rainfall on the Ethiopian highlands.
Figure (IV.2): Annual average stream levels on the Nile at Atbara (UNEP 2005).
A research conducted at Bergen University, Norway, under the Nile Basin Research Program during the period August-December 2007 on three sub-basins namely Atbarra, Kagera and Gilgel Abbay revealed that the Atbara and Gilgel Abbay catchments are dominated by fast surface runoff and quick response to rainfall. The Kagera catchment has a large base flow due to the regulating effect of the lakes and swamps in the sub-basin. The results of this research show that sensitivity to rainfall is larger than that to evapotranspiration because the latter is only fully satisfied when soils have enough
volu
me
(fra
ctio
n of
cur
rent
)
E-SNC
E-SNC
73
EGYPT SECOND NATIONAL COMMUNICATION
E-SNC
E-SNC
moisture content. Kagera catchment is more sensitive to evapotranspiration due to the existence of a number of small lakes and swamps while the sensitivity of Atbara to precipitation is highest as it is the most seasonal of all three catchments. This indicates the strong need for regional models accurate enough to reduce the degree and extent of uncertainty in the obtained results as well as to increase the country’s preparedness to receive both high and low natural flows.
A study published by the Organization for Economic Cooperation and Development (Agrawala et al., 2004) concluded that population, land use and agriculture and economic activity in Egypt being all constrained along the Nile Valley and Delta makes the county extremely vulnerable to any adverse impacts on Nile water availability. Nile water availability is likely to be increasingly stressed due to higher demand and higher evaporative losses. This potential vulnerability could be seriously exacerbated should climatic impacts be accompanied by any concomitant reduction in the country’s allocation of Nile water, or even unaccounted for excessive abstraction from upstream riparian countries. Moreover, the International Water Management Institute (IWMI) together with Utah State University in their Research Report 126 entitled “Climate Change Impacts on Hydrology and Water Resources of the Upper Blue Nile River Basin, Ethiopia” (Kin et al. 2008) stated that the downstream countries of the River Nile Basin are sensitive to the variability of runoff from the Ethiopian part of the Basin.
The impacts of potential future hydropower dam operation in the upstream part of the Nile Basin under future climate scenarios may cause:
Wetter and warmer climate in most of the Upper Blue Nile River Basin. •Low flows may become higher and severe, mid to long term droughts are likely •to become less frequent. The potential future dam operations are unlikely to significantly affect water •availability to Sudan and Egypt based on predicted outflows from six GCM’s and many operation scenarios. The results are, however, uncertain with existing accuracy of climate models, which suggest that the region is likely to have the future potential to produce hydropower, increase flow duration and increase water storage capacity without affecting outflows to riparian countries in the 2050’s.
In summary, all studies clearly show that the impact of climate change in the Nile Basin is strongly dependent on the choice of the climate scenario and the underlying GCM experiment.
IV. 2. 1. b. Other Vulnerability Indicators
Climate change is not the only vulnerability indicator in the Nile Basin, other indicators comprise:Population growth and urbanization:
Population growth and extension of inhabited areas increase wastewater disposal causing deterioration of river water quality from upstream to downstream. Upstream
74
CHAPTEr Iv vULNErAbILITY AND ADAPTATION TO CLIMATE CHANGE
E-SNC
E-SNC
E-SNC
E-SNC
excessive urbanization may result in increased flooding downstream due to the reduction in infiltration and evapotranspiration from natural vegetation and more runoff downstream.
Water related conflicts:Upstream Nile countries depend more directly on rain which sustains forestry,
wildlife, wetlands, rain-fed agriculture, fishing and groundwater recharge. For tail end countries Nile water is the only source of irrigated agriculture and drinking water supply. The per capita share of water in the Nile Basin stands now at 10,000 m3 per capita per year while this per capita share in a country like Egypt is less than 1,000 m3 per year. Water problems upstream are related to drainage, flood protection, occasional droughts, infrastructure, while water problems downstream are mainly related to scarcity.
There is high potential for trans-boundary cooperation rather than conflict. Upstream countries could use surface waterways to generate power for groundwater development in remote areas. Projects for decreasing losses and preventing flood hazards upstream could be developed to generate additional river flows for downstream countries.
IV. 2. 1. c. Conclusions
The above discussion reveals the following important points:Natural flows in the River Nile Basin as a whole and in separate sub-basins are •extremely sensitive to change in precipitation and temperature increase;Estimates of the order of magnitude of the effect of GHGs emissions on •temperature and precipitation rate are extremely uncertain;Both high and low natural flows of Nile water have positive as well as negative •impacts on the water system in Egypt. Higher flows require bigger storage capacity and larger conveyance and distribution network. Reduced rates of natural flows limit the ability of the economy to cope with all development activities especially agriculture, industry, tourism, hydropower generation, navigation, fish-farming, and environment required for providing the ever growing population with potable and domestic requirements;Little has been published internationally on the effect of climate change on •precipitation on the coastal strips running parallel to the Mediterranean and the Red Sea, except that stated by the IPCC on the prediction of movement of rain belt from south to north. Sea level rise will certainly affect groundwater aquifers in the Nile Delta, in •particular those close to the northern strip. These aquifers, although brackish, were considered future hope; however, increased salinity may cause them to be unusable.
E-SNC
E-SNC
75
EGYPT SECOND NATIONAL COMMUNICATION
E-SNC
E-SNC
IV. 2. 2. Adaptation
Egypt is a developing country which is struggling to overcome day to day challenges represented by a rocketing population growth and the need to finance several activities which concern low income citizens who constitute the majority of the country’s population. Issues like climate change which appears like a long term issue is not always a top priority for the successive governments in Egypt.
Many ideas have been developed on the subject of adaptation to climate change, some of these ideas are structural, others are soft, some of them can be decided upon locally, while others need regional blessing. Following are some of the policies collected from the different sources of information of this document.
Adaptation to Uncertainty:Maintaining storage at Aswan High Dam at lower elevations in order to allow •for receiving higher flood events, and at the same time, the preparation of other stores to receive any surplus water in emergency cases, such as Toshka and Quattara Depressions which are currently dry, Qaroun and Wadi El Natroun where limited ground waters are collected and the coastal lakes of Manzala, Borroulas, Edko and Mariout which are salty.The increase of cultivated areas especially in highly elevated lands to absorb •surplus water.
Adaptation to Increase of Inflow:Storage in upstream lakes was one day accepted on large scale. With the present
developments of the Nile Basin Initiative, this could be revived now.
Adaptation to Inflow Reduction:Even without the impact of climate change, Egypt expects to face water shortages
which will reduce the per capita share of water to less than 500 cubic meters per year by the year 2050. Some of the measures that has to be taken according to the National Water Resources Plan (Ministry of Water Resources and Irrigation, 2005) are:
Physical improvement of the irrigation system.1-
More efficient and reliable water delivery.2-
Better control on water.3-
Augmented farm productivity and raised farmers’ income. 4-
Empowerment and participation of stakeholders.5-
Quick resolution of conflicts between users. 6-
Use of new technologies of weed control.7-
Redesign of canal cross sections to reduce evaporation losses.8-
Cost recovery systems.9-
Improvement of drainage. 10-
Change of cropping pattern and on farm irrigation systems. 11-
76
CHAPTEr Iv vULNErAbILITY AND ADAPTATION TO CLIMATE CHANGE
E-SNC
E-SNC
E-SNC
E-SNC
Development of New Water Resources:Possibilities to increase Nile flows are limited to upper Nile conservation projects •which are discussed vigorously in the Nile Basin Initiative at the present time. These projects have to be re-evaluated in order to cater for impacts of climate change.Deep groundwater reservoirs have the potential of increased exploitation. These •reservoirs are left as strategic storage for unforeseen developments. This applies to the Western Desert and Sinai Peninsula. Rain harvesting may add to the country’s water budget not only on the east and •west north coast but also in the Red Sea area where flash floods normally have destructive effects. Desalination has tremendous potential in Egypt, especially if applied to brackish •groundwater.Recycling of treated wastewater (both domestic and industrial).•Increased reuse of land drainage water. •
Soft Interventions:Public awareness campaigns on water shortages or surpluses caused by climate •change.Development of Circulation Models capable of predicting the impact of climate •change on the local (Egypt) and regional (Nile Basin) water resources. It is worth to note that there is currently an ongoing effort funded by the UN-Spanish MDG Fund and Ministry of Water Resources and Irrigation to develop a Regional Circulation Model for the River Nile in collaboration with UK Met Office.Increasing the capacity of researchers in all fields of climate change and its •impact on water systems.Encouraging exchange of data and information between Nile Basin countries.•Enhancing precipitation measurement networks in upstream countries of the •Nile Basin as well as the installation of modern early warning systems.
IV. 3. Agriculture SectorThe risks associated with agriculture and climate change is a result of the strong
complicated relationships between agriculture and climate systems, plus the high reliance of agriculture systems on natural resources. Egypt is located in the arid region that can be affected greatly by the adverse effects of climate change. The projected increase in temperature is perceived to widen the gap between water resources and demands, decrease the overall agriculture productivity, and increase the competition over the natural resources. The effects of sea level rise on the coast of the Nile Delta would reduce the area under cultivation and likely reduce agricultural production.
Agriculture represents one of the most complex and important human activity in Egypt and it plays a significant role in the Egyptian economy. Moreover, agriculture plays an important role in the social structures of rural areas in Egypt, and it is responsible for social stability in these regions. The impact of climate change is most likely to hit the rural communities severely due to their fragile socioeconomic conditions. Any pressures due to climate change may cause unrecoverable damage.
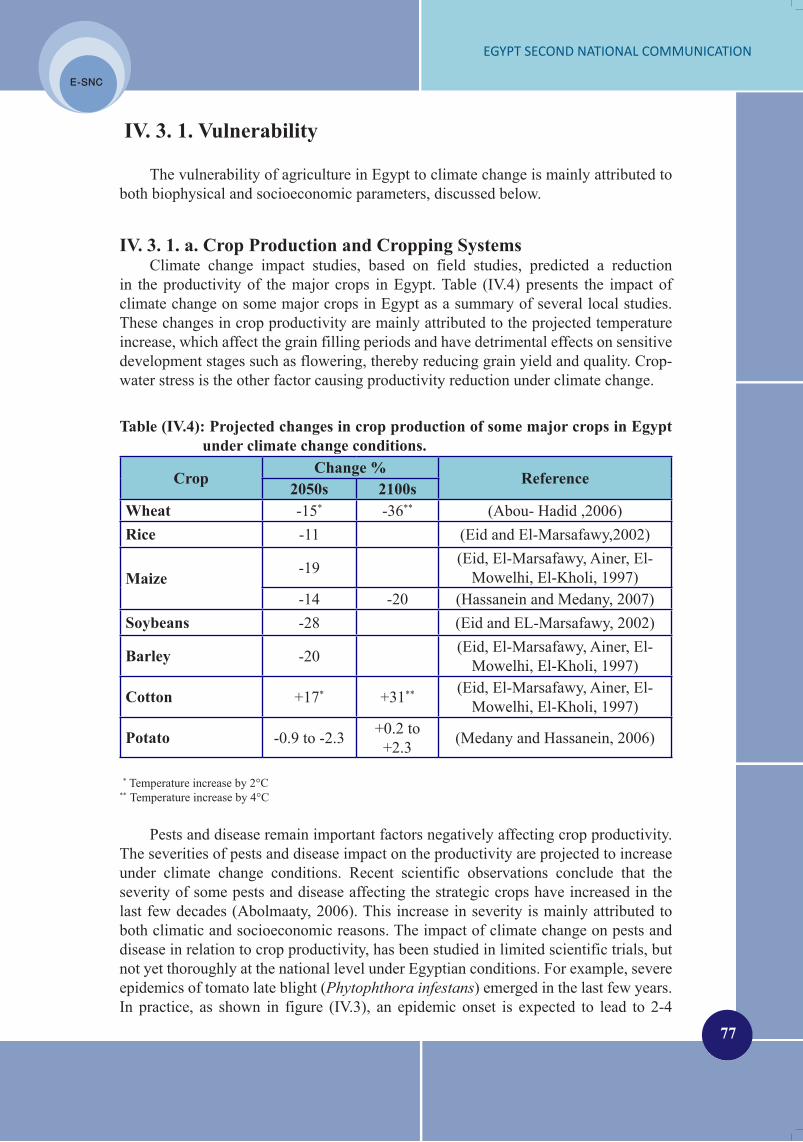
E-SNC
E-SNC
77
EGYPT SECOND NATIONAL COMMUNICATION
E-SNC
E-SNC
IV. 3. 1. Vulnerability
The vulnerability of agriculture in Egypt to climate change is mainly attributed to both biophysical and socioeconomic parameters, discussed below.
IV. 3. 1. a. Crop Production and Cropping Systems Climate change impact studies, based on field studies, predicted a reduction
in the productivity of the major crops in Egypt. Table (IV.4) presents the impact of climate change on some major crops in Egypt as a summary of several local studies. These changes in crop productivity are mainly attributed to the projected temperature increase, which affect the grain filling periods and have detrimental effects on sensitive development stages such as flowering, thereby reducing grain yield and quality. Crop-water stress is the other factor causing productivity reduction under climate change.
Table (IV.4): Projected changes in crop production of some major crops in Egypt under climate change conditions.
CropChange %
Reference2050s 2100s
Wheat -15* -36** (Abou- Hadid ,2006)Rice -11 (Eid and El-Marsafawy,2002)
Maize-19 (Eid, El-Marsafawy, Ainer, El-
Mowelhi, El-Kholi, 1997)-14 -20 (Hassanein and Medany, 2007)
Soybeans -28 (Eid and EL-Marsafawy, 2002)
Barley -20 (Eid, El-Marsafawy, Ainer, El-Mowelhi, El-Kholi, 1997)
Cotton +17* +31** (Eid, El-Marsafawy, Ainer, El-Mowelhi, El-Kholi, 1997)
Potato -0.9 to -2.3 +0.2 to +2.3 (Medany and Hassanein, 2006)
* Temperature increase by 2°C
** Temperature increase by 4°C
Pests and disease remain important factors negatively affecting crop productivity. The severities of pests and disease impact on the productivity are projected to increase under climate change conditions. Recent scientific observations conclude that the severity of some pests and disease affecting the strategic crops have increased in the last few decades (Abolmaaty, 2006). This increase in severity is mainly attributed to both climatic and socioeconomic reasons. The impact of climate change on pests and disease in relation to crop productivity, has been studied in limited scientific trials, but not yet thoroughly at the national level under Egyptian conditions. For example, severe epidemics of tomato late blight (Phytophthora infestans) emerged in the last few years. In practice, as shown in figure (IV.3), an epidemic onset is expected to lead to 2-4

78
CHAPTEr Iv vULNErAbILITY AND ADAPTATION TO CLIMATE CHANGE
E-SNC
E-SNC
E-SNC
E-SNC
additional sprays to be applied for the period 2025 to 2100 (Fahim, 2007). Furthermore, finding a balance between reducing the use of pesticides and the pressure to increase pesticide utilization due to changes in climate will represent a challenge for potato late-blight researches in the future (Fahim et al., 2007). Another study indicated that the severities of current cultivars of wheat to leaf rust caused by Puccinia triticina and stripe rust disease caused by Puccinia striiformis increase with increasing temperature which is projected under climate change conditions (Abolmaaty, 2006).
0
2
4
6
8
10
12
14
16
2025 2050 2100 2025 2050 2100
A1 B1
Crop
-wate
r req
uirem
ents
chan
ge [%
]
Wheat [W] Broad Bean [W]Maize [S] Maize [N]Tomato [W] Tomato [S]Tomato [N] Potato [W]Potato [S] Potato [N]
Figure (IV.3): Chaining in the late blight epidemic onset dates due to the climate change impacts in Egypt during the period 2025 to 2100 (Fahim et al., 2007).
The limited investigations in pests and disease concluded that finding a balance between the public demand for reducing the use of pesticides and the pressure to increase pesticide utilization due to climate change will be a challenge for the agricultural sector in the future. Furthermore, the possibility of emergence of foreign species endangering the local environment species of pest and diseases under climate change conditions is one of the high risks that may face agriculture production in the future.
Despite the effects of long term projected changes in temperature, agriculture in Egypt is less sensitive to climate variability, due to its reliance on irrigated agriculture systems. Yet, heat and cold waves can cause several harmful impacts in crops productivity, especially for fruits and vegetables. A recent study found that the intensity of the heat and cold waves increased in the past 20 years, this represents more risks for growers (Abou-Hadid, 2009).
IV. 3. 1. b. On-farm Irrigation Systems
Egypt has one of the most unique and complicated irrigation systems around the world, sustaining irrigation for more than 95% of the total cultivated area. On-farm irrigation performance in Egypt is the overall result of climatic and environmental conditions, irrigation technology, on-farm irrigation practices, and investment availability (Hamdy, 2007). Projected future temperature rises under climate change conditions are likely to increase crop-water requirements thereby directly decreasing crop-water use
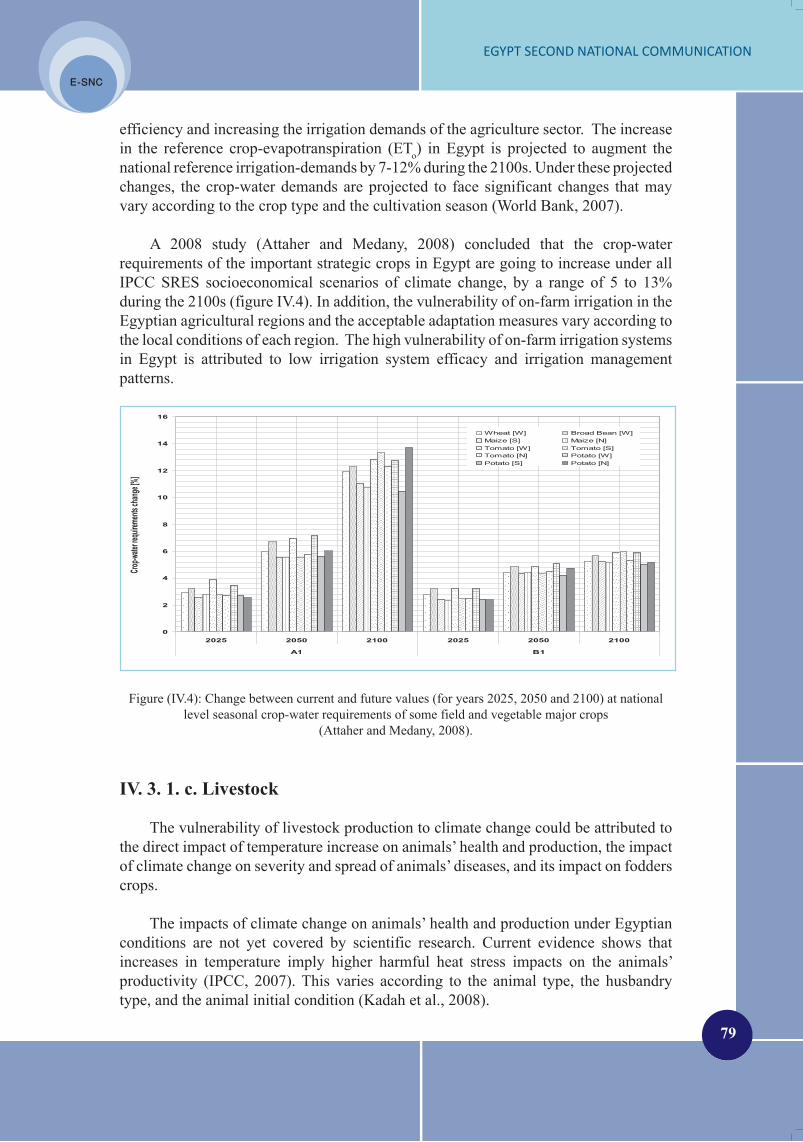
E-SNC
E-SNC
79
EGYPT SECOND NATIONAL COMMUNICATION
E-SNC
E-SNC
efficiency and increasing the irrigation demands of the agriculture sector. The increase in the reference crop-evapotranspiration (ETo) in Egypt is projected to augment the national reference irrigation-demands by 7-12% during the 2100s. Under these projected changes, the crop-water demands are projected to face significant changes that may vary according to the crop type and the cultivation season (World Bank, 2007).
A 2008 study (Attaher and Medany, 2008) concluded that the crop-water requirements of the important strategic crops in Egypt are going to increase under all IPCC SRES socioeconomical scenarios of climate change, by a range of 5 to 13% during the 2100s (figure IV.4). In addition, the vulnerability of on-farm irrigation in the Egyptian agricultural regions and the acceptable adaptation measures vary according to the local conditions of each region. The high vulnerability of on-farm irrigation systems in Egypt is attributed to low irrigation system efficacy and irrigation management patterns.
0
2
4
6
8
10
12
14
16
2025 2050 2100 2025 2050 2100
A1 B1
Crop-w
ater re
quirem
ents c
hange
[%]
Wheat [W] Broad Bean [W]Maize [S] Maize [N]Tomato [W] Tomato [S]Tomato [N] Potato [W]Potato [S] Potato [N]
Figure (IV.4): Change between current and future values (for years 2025, 2050 and 2100) at national level seasonal crop-water requirements of some field and vegetable major crops
(Attaher and Medany, 2008).
IV. 3. 1. c. Livestock
The vulnerability of livestock production to climate change could be attributed to the direct impact of temperature increase on animals’ health and production, the impact of climate change on severity and spread of animals’ diseases, and its impact on fodders crops.
The impacts of climate change on animals’ health and production under Egyptian conditions are not yet covered by scientific research. Current evidence shows that increases in temperature imply higher harmful heat stress impacts on the animals’ productivity (IPCC, 2007). This varies according to the animal type, the husbandry type, and the animal initial condition (Kadah et al., 2008).
80
CHAPTEr Iv vULNErAbILITY AND ADAPTATION TO CLIMATE CHANGE
E-SNC
E-SNC
E-SNC
E-SNC
In recent decades some new animals’ diseases emerged in Egypt, and have had strong negative impacts on livestock production. Blue tongue disease and rift valley fever are recently emerging diseases, attributed to some observed changes in Egyptian climate. The global and the regional distribution of diseases are projected to experience major changes under climate change conditions. Such changes are projected to increase the risks facing animals’ health at the national and the local levels. Animal diseases transferred to humans represent another expected side effect of climate change.
The availability of fodders is subject to decrease due to climate change impacts on crops productivity, and the high competition for land and water resources between fodder crops and cereals and other food security crops.
Egypt is almost totally dependent in feeding livestock on berseem (clover), a winter fodder crop which is a high water consumer. With expected scarcity of water supply plus population pressures and the need to grow more winter wheat, the country will most probably tend to increase the wheat area at the expanse of the area of berseem. Additionally, farm animals, especially buffalos, are high water consuming creatures affected not only by the quantity of water but also by its quality. No sufficient research was conducted either on vulnerability or adaptation of the livestock sector to climate changes.
.IV. 3. 1. d. Fisheries
More than 80% of fish production in Egypt comes from aquaculture projects in the northern part of the Nile Delta. Aquaculture projects are generally fed with drainage water. Few aquaculture projects have recently been established in desert areas using groundwater. Although Egypt has extensive Mediterranean and Red Sea coasts and an intensive network of drainage canals in addition to the River Nile and its two branches yet, fish catching fleets are not up to standard and the fish industry as a whole is relatively primitive.
The country currently produces about 93% of its consumption of fish (Ministry of Agriculture and Land Reclamation, SADS2030, 2009), with imports of low cost products mainly from China, Vietnam and East Asia. Climate change is expected to increase sea temperature causing fish distribution to shift northwards and to move to deeper water. Aquaculture projects may suffer from water shortages due to the expected scarcity in fresh water supply that might affect the country due to climate change and increased temperatures might also affect the production of some fish species.
The increased salinity of water in the coastal lakes may gradually reduce the existence of fresh water fish, increasing the portion of saline water fish which is more sensitive to environmental changes and which have a higher price as well. This will negatively affect most of the coastal area population who rely almost completely on cheap fresh water fish. More studies are still needed to figure out the vulnerability of the fishing sector and it is possible adaptation options to climate change.
E-SNC
E-SNC
81
EGYPT SECOND NATIONAL COMMUNICATION
E-SNC
E-SNC
IV. 3. 2. Adaptation
Although, climate change is projected to have serious impacts on agricultural sector in Egypt, modest efforts and steps are taken in scientific research, mitigation and adaptation. Some scientific research results relevant to the possible adaptation measures and consideration on agriculture to climate change, are discussed below.
IV. 3. 2. a. Crop Production and Cropping Systems
Studies concluded that changing sowing dates and management practices are among the important adaptation measures oriented to ameliorate the harmful impact of the climate change on the crop yield. Simulation studies in Egypt (Abou-Hadid, 2006) showed that 10-day delay in wheat sowing date at the North Nile Delta might mitigate the negative impacts on crop productivity by 10%.
Regarding the impact of climate change on the national cropping patterns, a range of temperatures over a range of cultivars of major crop species were studied (Hegazy et al., 2008), indicating that sowing dates could be managed in order to allow maximum predicted planting area in a given region in Egypt. For instance, the current maximum area suitable for cotton planting may show few variations over the coming hundred years. In this case, sowing dates should be changed to cooler months.
A great reduction in the wheat area is projected in the coming hundred years. Despite the early planting, a reduction of about 147 thousand acres/year is projected by the year 2075. On the other hand, with earlier sowing dates, the maximum areas that are planted by rice and maize will not be greatly affected by the projected increase in air temperature.
Changing sowing dates could increase the flexibility of the farming system to face temperature and water requirements increase due to climate change, as a single factor effect. This adaptation option is facing some implementation difficulties related to the overall crop calendar arrangements, and it may be limited by the marketing opportunities, which may not match new harvesting dates, especially for cash crops. The acceptability of changing planting date option needs further studies regarding the conflict with other existing crops as the Egyptian cropping system is based on 12-month cycle (El-Marsafawy, 2006).
Medany et al. concluded that changing cultivars and changing crop patterns are the most promising adaptation measures that could be applied at the national level to overcome the harmful impacts of climate change on crop production (Medany et al., 2009).Furthermore, in order to adapt to the expected disease severity for major crops, breeding of disease-tolerant cultivars is urgently needed. At the same time, monitoring system for the current and new races of plant pests and diseases in the country is highly required.

82
CHAPTEr Iv vULNErAbILITY AND ADAPTATION TO CLIMATE CHANGE
E-SNC
E-SNC
E-SNC
E-SNC
IV. 3. 2. b. On-farm Irrigation Systems
For on-farm irrigation systems in Egypt, figuring out adaptation strategies is a high national priority. The current national plan for improving on-farm water management is an ambitious plan targeting 5 million acres in ten years. If financial resources are to be secured, the implemented plan will increase irrigation efficiency by 50 to 75%, which is equivalent to water needs for reclaiming about 3 million acres. A recent study indicated that improving surface irrigation efficiency is likely to be much-needed for overcoming the negative impacts of climate change on on-farm irrigation systems in Old lands. This measure could be acceptable only when power and economic resources are available and the reduction in the crop-yield is significant (Ministry of Agriculture and Land Reclamation, SADS2030, 2009). Furthermore, application of deficit irrigation measures is more acceptable during water shortage circumstances, compared to reduction of irrigated area.
Finally, using different combinations of different levels of improved surface irrigation system efficiencies and applying deficit irrigation could improve the capacity of surface irrigation systems in Old lands in order to overcome the negative impacts of climate change.
IV. 3. 2. c. Livestock
The most likely adaptation options for livestock entail improving the current low productivity cattle and buffalos breeds, and improving feeding programs to be better adapted for warmer climate conditions.
There is a need for an adaptation strategy targeting the livestock sector based on rigorous assessment of the current vulnerability of the sector to climate change, including the vulnerability of the green fodder, in order to secure the current share of local animal protein production.
IV. 3. 2. d. Fisheries
There is no clear adaptation options defined for this important sector. Further studies on the impacts, vulnerability, and adaptation to climate change are still needed.
IV. 3. 3. General Remarks and Recommendations for Adaptation Planning in Agriculture
Designing and applying a national adaptation strategy for the agriculture sector is facing a number of barriers and limitations of existing scientific, information and policy perceptions, poor adaptive capacity of the rural community, lack to financial support, and absence of the appropriate institutional framework.

E-SNC
E-SNC
83
EGYPT SECOND NATIONAL COMMUNICATION
E-SNC
E-SNC
For Egyptian conditions, designing an adaptation strategy for the agriculture sector should consider simple and low cost adaptation measures, which may be inspired from traditional knowledge, meet local conditions and be compatible with sustainable development requirements. The following consideration could be included to enhance the planning of adaptation and mitigation strategies (Ministry of Agriculture and Land Reclamation, SADS2030, 2009):
Improving scientific capacity;•Using a bottom-up approach for adaptation planning;•Developing community-based measures for stakeholders’ involvement in •adaptation planning;Increasing public awareness about climate change; •Improving adaptive capacity of the community. •
The recommended priorities of the agriculture sector in the adaptation to climate change could be summarized as follows:
Conducting a national program for improving the current crop patterns and •calendar to be adapted to the incoming projected climate changes. This program should include developing and testing heat, water, salinity and plant pests and disease stress-tolerant cultivars of the major crops. Dissemination of the results to the farmers should be one of the important objectives of this program. Implementing a nationwide project targeting the improvements of on-farm •irrigation systems in order to tackle the expected increase in pressures on water availability and the higher irrigation demand under climate change conditions.Assuring sustainable adaptation funds and climate hazards insurance systems. The •current scientific and social evidence reveals that there are strong needs to develop special fund program for adaptation activities in the agriculture sector (Medany et al., 2009). The size of this fund and the local allocation of the program activities should be relative to the vulnerability levels of the local agricultural regions. Establishing a strong information dissemination system regarding climate change •and its impacts on agriculture targeting all growers, in order to assist them in developing appropriate adaptation measures.
IV. 4. Coastal ZonesEgyptian coasts extend for about 3,500 km along the Mediterranean and the Red
Sea. In addition, Egypt hosts a large number of inland lakes, the largest being the fresh water Lake Nasser and the saline Lake Qarun in Fayoum. The coastal zones of Egypt host a major part of the industrial activities including petroleum, chemicals and tourism distributed among a large number of highly populated economic centers such as the cities of Alexandria, Rosetta, Damietta, Port Said, Suez and Hurghada. Trading and transportation centers are also distributed among a large number of harbors which are considered highly attractive to employment from all over the country. The coastal zones are also considered an important source for fisheries and income generation. Egypt’s overall production of fish, according to the 2004 statistics (FAO, 2004), is about 876000 tons, of which 116,600 tons (13.3% of the overall production) are from coasts.
84
CHAPTEr Iv vULNErAbILITY AND ADAPTATION TO CLIMATE CHANGE
E-SNC
E-SNC
E-SNC
E-SNC
The coastal zones of Egypt are perceived as vulnerable to the impacts of climate change, not only because of the direct impact of sea level rise, but also because of the potential impacts of climate changes on their water resources, agricultural resources, tourism and human settlements. In particular, the low lying Nile Delta region, which constitutes the main agricultural land of Egypt and hosts over one-third of the national population and nearly half of all crops (World Resources Institute, 2007), industrial activities and commercial centers, is highly vulnerable to various impacts of climate change.
Mediterranean Sea Coastal Zone:
The Mediterranean coastal shoreline includes five large lakes which constitute about 25% of the total area of wetlands in the Mediterranean region. The Mediterranean coastal zone hosts a large number of economic and industrial centers as well as important beaches and tourist resorts. The precipitation along the coastal zone in winter varies between 130 and 170 mm/year and decreases gradually to the south. The tidal range is about 30-40 cm.
The Mediterranean coastal zone of Egypt suffers from a number of problems, including a high rate of population growth, unplanned urbanization, land subsidence, excessive erosion rates, salt water intrusion, soil salinization, land use interference, ecosystem pollution and degradation and lack of appropriate institutional management systems. This zone hosts Alexandria city, which is the main harbor on the western side of the Delta located at a partly low elevation land. The city hosts about 40% of the country’s industrial capacity, in addition to being an important summer resort. Other vulnerable large cities include the cities of Rosetta, Damietta, and Port Said.
Red Sea Coastal Zone:
The coastal zone of the Red Sea of Egypt is generally narrow because of the relatively close mountains parallel to the shoreline. The coastline is composed of a large number of embayments, small gulfs and small pocket beaches. Fragmented and extended coral reef communities with associated rich marine life extend over large areas of the coast. The tidal range varies between 110 and 130cm.
The Egyptian Red Sea coast in general has very limited freshwater resources due to its geographical location in the arid sub-tropical region. Human populations are concentrated in a number of cities along the coastline and in few scattered villages in between. It hosts a large number of well known diving sites based on world famous rich and highly diversified coral and mangrove communities. Tourism along the coastal zone of Sinai and eastern Egypt on the Red Sea now contributes a significant portion of the GNP. Fishing and diving activities have supported a growing human population.
This coastal zone suffers from increasing losses of habitats due to growing
unplanned urbanization, pollution, coastal land filling, flash flooding and increasing negative impacts of tourism. In addition, low precipitation has recently been well observed over a large part of the coastal zone, which has already been reflected over the quality of life in the region.
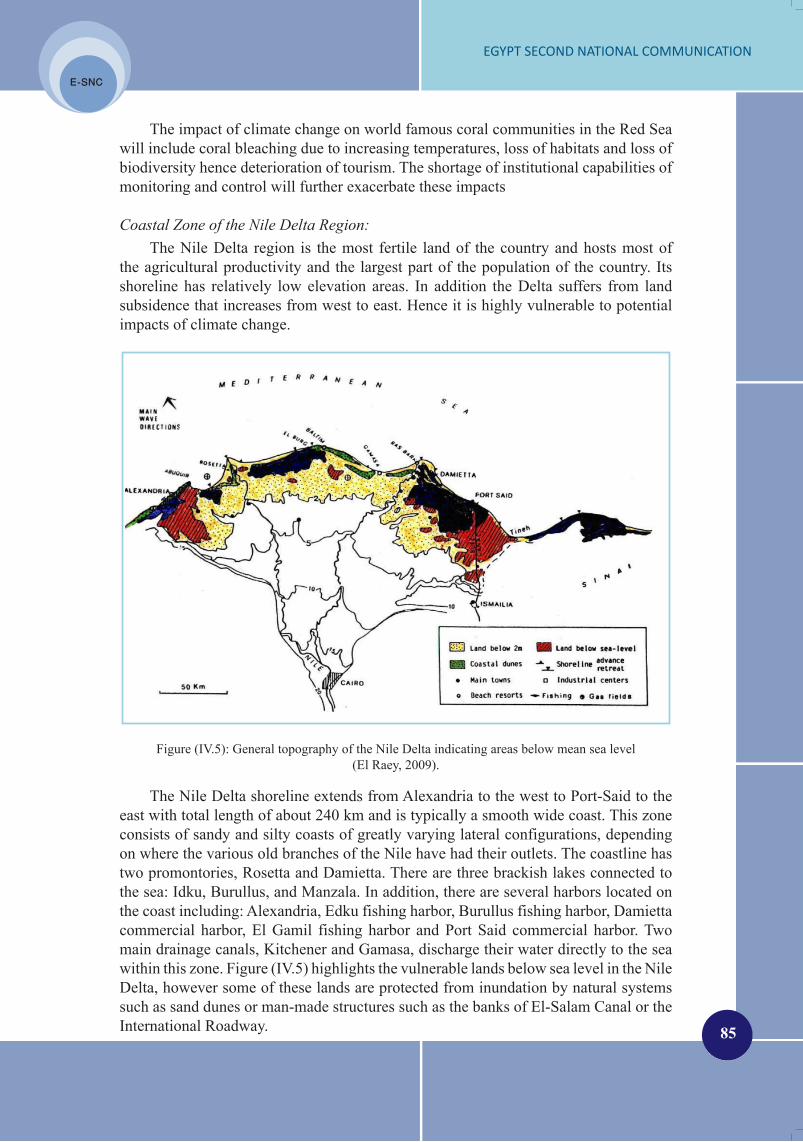
E-SNC
E-SNC
85
EGYPT SECOND NATIONAL COMMUNICATION
E-SNC
E-SNC
The impact of climate change on world famous coral communities in the Red Sea will include coral bleaching due to increasing temperatures, loss of habitats and loss of biodiversity hence deterioration of tourism. The shortage of institutional capabilities of monitoring and control will further exacerbate these impacts
Coastal Zone of the Nile Delta Region:
The Nile Delta region is the most fertile land of the country and hosts most of the agricultural productivity and the largest part of the population of the country. Its shoreline has relatively low elevation areas. In addition the Delta suffers from land subsidence that increases from west to east. Hence it is highly vulnerable to potential impacts of climate change.
Figure (IV.5): General topography of the Nile Delta indicating areas below mean sea level(El Raey, 2009).
The Nile Delta shoreline extends from Alexandria to the west to Port-Said to the east with total length of about 240 km and is typically a smooth wide coast. This zone consists of sandy and silty coasts of greatly varying lateral configurations, depending on where the various old branches of the Nile have had their outlets. The coastline has two promontories, Rosetta and Damietta. There are three brackish lakes connected to the sea: Idku, Burullus, and Manzala. In addition, there are several harbors located on the coast including: Alexandria, Edku fishing harbor, Burullus fishing harbor, Damietta commercial harbor, El Gamil fishing harbor and Port Said commercial harbor. Two main drainage canals, Kitchener and Gamasa, discharge their water directly to the sea within this zone. Figure (IV.5) highlights the vulnerable lands below sea level in the Nile Delta, however some of these lands are protected from inundation by natural systems such as sand dunes or man-made structures such as the banks of El-Salam Canal or the International Roadway.

86
CHAPTEr Iv vULNErAbILITY AND ADAPTATION TO CLIMATE CHANGE
E-SNC
E-SNC
E-SNC
E-SNC
The Nile Delta region is presently subject to changes, including shoreline changes, due to erosion and accretion, subsidence and sea level rise due to climate changes. Agrawala et al., 2004 surveyed specific large economic centers of Alexandria, Rosetta and Port Said and obtained quantitative estimates of vulnerable areas and expected loss of employment in case of no action. They concluded that the Nile Delta coastal zone is highly vulnerable to the impacts of sea level rise through direct inundation and salt water intrusion. Low elevation coastal zones constitute high risk areas due to potential damage of sea protection from earthquakes or human activities.
IV. 4. 1. Vulnerability
The Coastal Research Institute (CoRI) has developed accurate coastal elevation maps based on aerial photos and hydrographic profiles. Tide gauges data revealed an increase in the relative sea to land level of about 1.6 mm/year at Alexandria, 1.0 mm/year at Al-Burullus, and 2.3 mm/year at Port Said, as presented in Figure (IV.6) (Frihy, 2003) due to land subsidence and sea level rise.
Figure (IV.6): Long term Sea-Level rise based on mean annual sea levels measured by tide gauges located at Alexandria, Burullus and Port Said (Frihy, 2003).
IV. 4. 1. a. Sea Level Rise
Results of IPCC fourth Assessment Report indicated that a global sea level rise of 18-59 cm is expected by the end of this century. Based on this, and land subsidence rates two models have been initiated (The Coastal Research Institute, 2009): the first is the business as usual one, while the second is the actual situation in progress. For each model, three scenarios were considered namely the IPCC scenarios B1 and A1F1 as well as a new CoRI scenario which assumes a linear increase rate of air temperature till 2100. Table (IV.5) represents the actual situation that the Nile Delta could face considering the fact that the boundaries of the lakes are above zero level and the low lands at Abu-Qir Bay are protected by Mohamed Ali Sea Wall constructed in 1830.

E-SNC
E-SNC
87
EGYPT SECOND NATIONAL COMMUNICATION
E-SNC
E-SNC
Table (IV.5): Total affected area and its percentage of the Nile Delta area, A1F1 scenario (The Coastal Research Institute, 2009).
Year 2025 2050 2075 2100
Total Area Affected (km2) 152.86 256.27 450.00 761.40Total share from the Nile Delta Area (%) 0.61 1.03 1.8 3.01
Considering Mohamed Ali Sea Wall that protects low lands with levels varying between -1.5 to -2.5 below mean sea level, CoRI estimated areas to be affected and their ratios to the Nile Delta area with and without Mohamed Ali Sea Wall as presented in tables (IV.6) and (IV.7), respectively.
Table (IV.6): Total affected area and its percentage of the Nile Delta area, A1F1 scenario, without Mohamed Ali Sea Wall and zero level for lake’s borders (The Coastal Research Institute, 2009).
Year 2025 2050 2075 2100
Total Area Affected (km2) 701.00 1729.10 3010.60 3600.00Total share from the Nile Delta Area (%) 2.80 6.92 12.04 14.40
Table (IV.7): Total affected area and its percentage of the Nile Delta area, A1F1 scenario, with Mohamed Ali Sea Wall and zero level for lake’s borders (The Coastal Research Institute, 2009).Year 2025 2050 2075 2100
Total Area Affected (km2) 701.00 766.50 2348.00 2938.00Total share from the Nile Delta Area (%) 2.80 3.10 9.40 11.750
Results for the A1F1 scenario – model 1 (Table IV.6) represent the worst case conditions of the Nile Delta coastal zones according to the high impact scenario in the business as usual model. This indicates that Mohamed Ali Sea Wall will have a noticeable role in the protection of the low land area after the year 2025.
In Alexandria, the new expansion of the sea front (Abdelgawwad, 2006) has protected much of the vulnerable urban areas in the city without actually aiming at that.
IV. 4. 1. b. Salt Water Intrusion
Salt water intrusion and its potential impacts on ground water quality in the coastal zone cannot be overlooked especially in low land areas along the Mediterranean coast of Egypt. In addition, water logging and water bogging problems are expected to exacerbate soil salinization which will lead to deterioration of crop quality and productivity. This

88
CHAPTEr Iv vULNErAbILITY AND ADAPTATION TO CLIMATE CHANGE
E-SNC
E-SNC
E-SNC
E-SNC
will in turn lead to increasing health problems and loss of tourism. This phenomenon is considered of utmost importance and warrant full investigation.
IV. 4. 1. c. Lakes Boundaries and Natural Sand Dunes System
Field survey works were carried out by CoRI (2008) to estimate the difference in elevation between water surface and the nearest natural or man-made works around Manzala and Burullus lakes. It indicated that the difference in elevation between water surface in Lake Manzala and the banks levels of Al-Salam Canal that goes along the western and southern boundaries of the lake varies between 2.68 m and 3.6 m. Field investigations also indicated that levels of Lake Burullus boundaries vary between 0.5 m in the north to 2.0 m in the south. Results of 200 hydrographic profiles carried out by CoRI over the last three decades were utilized to define the natural sand dune systems at the Nile coasts. The Shore Protection Authority (SPA) is suggesting that these systems be used as the first line of defense at their locations.
IV. 4. 1. d. Extreme Events of Heat Waves, Sand and Dust Storms
The increase of intensity and frequency of extreme events is also expected to affect the coastal zones of Egypt and extend over the whole country as well as across the Mediterranean. Saharan dust and heat waves are well known to seriously affect land agricultural productivity, materials lifetime and public health. Increased intensity and frequency of marine storms will necessarily increase risks of transportation accidents and health risks
A change of wind direction and coastal current pattern is also expected due to climate changes. Decreases of precipitation on the Red Sea coastal area, changes of the well known Nawwat pattern of extreme events at Alexandria, increased rates and frequencies of dust storms and prevailing temperature inversions are only a few examples of climate change observations in the coastal areas.
IV. 4. 2. Adaptation
The Egyptian National Assembly has recently approved new regulations to include Integrated Coastal Zone Management (ICZM) into developmental plans needed for better management of coastal resources and protection against impacts of climate change. This makes it necessary to have a strong institutional monitoring capability. Options of adaptations are generally site-dependent and necessarily involve multicriterial analysis to assess levels of technology, maintenance, impact assessment and cost (El Raey et al., 2000).
The following adaptation measures on the local scale are under considerations (El Shennawy, 2008):
Creating wetlands in areas vulnerable to the impacts of sea level rise in low lying •deltas. Lake Manzala and Lake Burullus are two examples of such areas eligible for such adaptation processes;Progressing with protecting and fixing natural sand dunes systems which constitute •an important natural protection;
E-SNC
E-SNC
89
EGYPT SECOND NATIONAL COMMUNICATION
E-SNC
E-SNC
The Shore Protection Authority is considering protection and enforcement of •Mohamed Ali Wall as a first line of defense of the low lands south of Abu-Qir Bay;Reinforcing the international road along the Mediterranean coast to act as a second •line of defense for the protection of the northern zone of the Delta. In this respect, the northern side of this road should be reinforced so as to act as a sea wall; Possibly using Al-Salam Canal banks as protection, as they rise 2 m above Lake •Manzala water level;Activating the National Coastal Zone Management Committee which should •formulate an integrated coastal zone management plan.
IV. 5. Tourism SectorClimate change is now a new challenge that the tourism industry has to confront.
Climate change will permanently alter the attraction of some holiday regions and will force states and local communities to take steps to adapt in the next few decades. There are a variety of ways in which the environmental-climatic dimension of climate change can affect the attractiveness for tourists and the economic prospects of individual tourist regions.
In Egypt, with the focus of tourism being on seaside and beach holidays, the country might lose attractiveness if there are an increased number of heat waves in the summer months: during the past few years such events have already begun to increase in frequency. People who repeatedly find that their holiday activities are restricted by extreme heat could be inclined to spend future holidays in other regions, or to go to the Mediterranean region in spring or autumn.
IV. 5. 1. Vulnerability
The INC indicated that sectors of agriculture, coastal zones, aqua-culture and fisheries, water resources, human settlements, and human health are most vulnerable in Egypt. The Tourism sector has strong forward and backward linkages with all these inflicted sectors. Negative impact from climate change on these sectors will have a definite influence on tourism in Egypt.
Water poverty will affect tourism in the Nile Valley and Delta (Agrawala et al.,2004). Resorts might be able to secure fresh water supply by desalination, however, this solution has its environmental limitations and affects the financial and economic feasibility of the developed resorts.
Alexandria and Port Said as well as Ras El-Bar, Gamasa and Bulteem are all destinations for local tourism. Middle and low income Egyptians spend their summer vacations in these North Delta cities that are vulnerable areas along the coastal zone of Egypt. These are all threatened by sea level rising. Beaches and tourist sites at other cities such as Matruh City west of the Delta and Arish, North Sinai are also vulnerable. The socio-economic impacts associated with these changes are far reaching and include migration, unemployment and possibly political unrest.

90
CHAPTEr Iv vULNErAbILITY AND ADAPTATION TO CLIMATE CHANGE
E-SNC
E-SNC
E-SNC
E-SNC
IV. 5. 1. a. Impact on the Coral Reefs
Coral reefs represent some of the most biologically diverse ecosystems on Earth, providing critical habitat to approximately 25% of marine species. In addition, these ecosystems provide economic benefits through tourism and fisheries. However, human activities, including development in coastal areas, over-fishing, and pollution have contributed to a global loss of over 10% of these valuable ecosystems. An additional 15% have been lost due to warming of the surface ocean, and climate change will further contribute to coral reef degradation in the decades ahead.
In Egypt, coral reefs extend along most of the entire shoreline of the southern part of Sinai, particularly at Ras Antur and the area between Ras Nasrani and Ras Mohamed. In the Red Sea area, important reefs are around Hurghada and near Gebal Elba at the extreme southern border of Egypt.
Egypt currently has five marine protected areas that include coral reefs. They are established around the Sinai Peninsula and Red Sea coast at sites where recreational scuba diving is common and the threat from anchor and flipper damage is high. There are seven additional areas that have been proposed for protection (Spalding et al., 2001).
Coral reefs are among the most sensitive ecosystems to climate change. Corals are especially sensitive to elevated sea surface temperatures (Earth Trends, 2003). When physiologically stressed, corals may lose much symbiotic algae, which supply nutrients and colors. In this stage corals appear white bleached. Corals can recover from short term bleaching; however, prolonged bleaching can cause irreversible damage and subsequent mortality.
IV. 5. 1. b. Impact on Monuments
The most fragile element in Egypt’s cultural heritage is the colored wall paintings in ancient tombs. Immediately following the exit of visitors from the tomb, levels of CO2 drop due, in part, to the air exchange. Moisture that visitors generate in the burial chamber remains longer during the summer. For this reason it is essential, for the safety of visitors, and the stability of wall paintings, to monitor the microenvironment of these tombs and limit their visitation during summer months.
IV. 5. 1. c. Impact on Local Ecosystems
Degradation of local ecosystems can negatively affect tourism in Egypt. Resorts at the Red Sea and Sinai Peninsula depend on the aesthetic values of their marine environment. If coral reefs bleach, these areas lose their attractiveness to tourism. Climate change will affect the Nile and the water cycle. This in turn can affect Nile cruising activities which can affect tourism, among other sectors of the Egyptian economy.
E-SNC
E-SNC
91
EGYPT SECOND NATIONAL COMMUNICATION
E-SNC
E-SNC
IV. 5. 2. Adaptation
A number of policy options have been identified as adaptation measures in Egypt. These essentially include:
Expanding the marine protected areas and enforcing regulations;•Adopting an integrated coastal zone management approach for development in •coastal areas;Carrying out vulnerability assessments and protection of archeological and •touristic sites and roads against impacts of climate changes;Redirecting growth away from sensitive lands and towards less vulnerable •areas; Developing a strong monitoring and law enforcement system to ensure the •implementation of these measures.
IV. 6. Housing and Roads
IV. 6. 1. Housing
Heat islands, which originate from hot air arising from heated buildings in cities and town, are the main concern in hot arid climates, and Egypt’s urban centers largely suffer from this effect. An increase in temperature caused by climate change will exacerbate this situation. The orientation of streets in cities has strong implications on energy conservations and energy emissions of buildings. In addition, external colors of houses have strong implications on rates of emission. Dark painted houses are good emitters while light painted houses are low emitters.
Adaptation measures comprise:Building Standards: • The Ministry of Housing, Utilities and Urban Communities has issued a code dealing with energy in buildings, both domestic and commercial.Natural Ventilation: • Natural ventilation can save up to 10%-30% of electricity used for air conditioning. In houses, it helps in relieving excessive heat from the building mass. The intake of cool air usually is situated in the uppermost part of the building. Natural lighting: • Most of the energy exploited in buildings is used in electrical lighting. Considerations for the design of windows, factors affecting the design, and ways to enhance the quality of natural lighting have to be included in the building design. Saving emissions in this way cuts GHG emissions and adapts to climate change.National Institutional Capacity: • The curricula at many universities involve programs for climate change at departments of environmental studies, architecture, urban planning and design and civil engineering. Energy conservation in buildings, inefficient energy consumption in contemporary architecture, and the principles of green architecture are related titles among many other courses in the curriculum. These courses need to be effectively spread over the context of climate change.
92
CHAPTEr Iv vULNErAbILITY AND ADAPTATION TO CLIMATE CHANGE
E-SNC
E-SNC
E-SNC
E-SNC
IV. 6. 2. Roads
Roads in Egypt could be classified into 2 main categories: urban roads in 217 cities and open roads connecting urban areas. Roads are subject to different climatic vulnerabilities according to location. For urban roads, roads in Cairo city, as an example, suffer from an excess of heat mainly caused by sunlight during the day, plus exhaust from air conditioning systems scattered over the facades of buildings. The amount of exhaust from internal combustion engines such as cars might reach 60 m3 per car per day. In Cairo, this is approximately equal to 120 million m3 per day of car exhaust gases. In the Cairo Region, roads amount to around 1300 km. In most of other cities, roads cover about one third of the area of the city. As for open roads (coastal, desert, agricultural, and mountainous), these also suffer from an excess of heat caused by sunlight during the day. In addition, they also suffer from rain conditions.
Roads vulnerability to climatic elements is primarily concerned with:Temperature: • The main effect of temperature on the road network is on the bituminous paving. Traffic loading, speed and density, local ambient temperature, intensity of direct sunlight will all modify the effects of elevated temperatures. The highest maximum surface temperatures recorded in specific localities exceeded 45°C, which corresponds to the dry wheel tracking, the temperature at which asphalts design may be liable to deformation. When temperature exceeds 45°C, roads would be subjected to this effect. Extreme conditions would be likely to happen in summer, as a result of global warming. The potential for deformation due to prolonged high road surface temperatures increases, would lead to adverse affects on the hardness of the road surface, as well as fatting up of the road surface and thermal expansion and contraction affecting the integrity of the road surface.Rain: • The rainy season occurs during winter in Egypt. For the high lands, in Sinai and the Red sea, rainfall is usually twice a year, in October and April. Flash flood routes cross the path of roads causing disintegration of their infrastructures, hence their deterioration. Landslides and expected falling rocks and instability of rocky ridges caused by climate change need to be evaluated.
Adaptation measures comprise:Bituminous materials with appropriate stiffness characteristics should be used in •road construction or maintenance works on the road network. Alternative modes of transportations need to be considered; Re-orienting flood routes away from road paths;•Slowing down, collection, and storing rain and flood water;•Bridging water: Notwithstanding the high cost of constructing a bridge over the •water path, this is an obvious way to face the problem; The road network should be reviewed to identify areas of potential risk from •coastal flooding, taking account into the cumulative effects of sea-level changes and storm surges. Any new projects proposed in low-lying areas should be reviewed with respect to these risk factors;A strong need for upgrading public transportation systems and encouraging non •motorized transport.

E-SNC
E-SNC
93
EGYPT SECOND NATIONAL COMMUNICATION
E-SNC
E-SNC
IV. 7. Health SectorThe population of Egypt is expected to reach 92 million by the year 2020, and 104
million by 2030 if the population growth control program is successfully implemented and may reach 119 million by 2030 if the population growth rate remains the same as today. Climate change is expected to have both direct and indirect adverse impacts on human health. However, comprehensive studies of the impacts of climate change on human health are still lacking in Egypt. The main limitations are due to the dearth of data and information. Health effects of climate change are expected to be particularly significant for vulnerable populations such as elderly, children, infirm and poor. Rural residents, those relying directly on natural resources for their livelihood or food, are also considered to be more vulnerable for climate-change-related health impacts. Currently, 58% of the Egyptian population lives in rural areas (WHO, 2007). Climate change will contribute to the global burden of diseases through direct and indirect effects. Direct impacts are perceived to include heat strokes and heat related phenomena especially to the growing ageing sector of population, skin cancers, eye cataracts, injuries and deaths. The indirect impacts are perceived to be mainly linked with the population growth which reflects into shortage of water supply and decreased agricultural land area leading to shortage of essential food items and emergence of malnutrition and underdevelopment for new generations. Increased incidence of diseases associated with climate change include communicable diseases; such as parasitic, bacterial and viral diseases, and non-communicable diseases; such as cardiovascular diseases, respiratory diseases, cancers, and malnutrition. Climate change is also always linked with increases in diarrhea diseases, vector-borne diseases, malnutrition, and injuries and deaths secondary to disasters related to climate change events.
IV. 7. 1. Vulnerability
IV. 7. 1. a. Communicable DiseasesParasitic Diseases:
Climate and environmental variables can influence the distribution of Schistosomiasis, as the intermediate host (snails: Bulinus, and Biomphalaria) can move to avoid extreme temperatures within their habitats. Climate change might allow Schistosomiasis transmission to extend its range to higher altitudes (Brooker, 2002). Moreover, water shortages caused by climate change could create greater need for irrigation, particularly in arid regions. If irrigation systems expand to meet this need, the snail populations (intermediate host) may increase leading to greater risk of human infection with the parasite.
Vector Borne Diseases:
There are scientific evidence that changes in frequency, timing and duration of heat waves will increase the number and the variety of insects, which in turn increases health problems, specially vector-borne diseases (WHO, 2007). Diseases of primary significance include:

94
CHAPTEr Iv vULNErAbILITY AND ADAPTATION TO CLIMATE CHANGE
E-SNC
E-SNC
E-SNC
E-SNC
Malaria:• Egypt is currently considered to be among Group 1B countries in which only few autochthonous cases of malaria were reported in limited residual foci during the past 3 years (WHO, 2007). A malaria eliminating program is strongly committed to eliminate the residual foci and to achieve malaria-free status and the country has been on its way to become malaria-free, as no indigenous case has been reported since 1998 (WHO, 2005). However, Egypt is still vulnerable to malaria, because of the presence of suitable climate and habitat for the vector, in addition to non-immune people and the proximity of epidemic areas in the Sudan, south of Egypt. With climate change, the potential for mosquito-borne disease infection is likely to increase because warmer conditions would extend the range and growth season of mosquitoes and encourage humans to spend more time outdoors that increases their exposure to the mosquitoes’ bites (Bouma and Dye, 1997). High temperatures would also accelerate the development of the pathogeneses in mosquitoes, increasing the efficiency of disease transmission. In addition, water shortage may increase the unsanitary water collected areas that provide breeding sites for mosquitoes, the malaria vector. Additionally, the increase in the relative humidity is also necessary for mosquito survival. In another scenario, Egypt may be vulnerable to flood events, which can facilitate breeding of malaria vectors and consequently increase malaria transmission. Lymphatic Filariasis:• This is due to Wuchereria bancrofti and is limited to the relatively rare humid zones in the Eastern Mediterranean Region. Lymphatic Filariasis is endemic only in three countries of the region, Egypt, Sudan and Yemen (Division of Communicable Disease Control, 2004). In Egypt, Lymphatic Filariasis is focally endemic in the Nile Delta of Egypt, where the vector (Culex pipiens mosquito) is extremely abundant and an estimated 2.7 million people are at risk. Thus, extreme climatic conditions will likely affect vector abundance, elevating the risk of outbreaks (Epstein, 2001; 2002).Rift Valley Fever:• Although the natural reservoir of Rift Valley Fever is unknown, it is believed that cattle and sheep act as amplifiers of the disease (The International Livestock Research Institute, 2006). At least 26 species of mosquito have been implicated as potential vectors of the virus, including Culex pipiens (WHO, 2007). Although, Rift Valley Fever has generally been confined to sub-Saharan Africa, an outbreak occurred in 1977/78 in the irrigated region of Egypt with devastating consequences. In the presence of susceptible hosts in Egypt, a climate change that favors rapid arthropod amplification may cause epidemics of Rift Valley Fever of immense proportions.
Emerging Diseases:
Tuberculosis• : Climate change and migration patterns may result in the emergence of old diseases, such as Tuberculosis, due to changes in the epidemiology of regions and populations. Avian Influenza:• Avian influenza, or “bird flu”, is a contagious zoonotic disease caused by viruses that normally infect only birds and less commonly pigs. Avian influenza viruses are highly species-specific, but have, on rare occasions, crossed the species barrier to infect humans. There has been some debate about whether there is a connection between climate change and avian influenza. No direct links have been established until now, although it is known that climate change could
E-SNC
E-SNC
95
EGYPT SECOND NATIONAL COMMUNICATION
E-SNC
E-SNC
alter the timing and geographical pattern of bird reproduction and migration. The migratory wild birds can carry highly pathogenic avian influenza, and uncontrolled interactions between wild and domestic birds play a major role in its transmission to human.
Water-Borne and Food-Borne Diseases:
Changes in precipitation, temperature, humidity, salinity, and wind have a measurable effect on the quality of water used for drinking, recreation, and commerce. Temperature also influences the occurrence and the survival of bacterial agents, toxic algal blooms, and viral pathogens (U.S. Global Change Research Program, 2001). Some predicted climate change in Egypt include floods that causes contamination of public water supplies, droughts that encourages unhygienic practices because of water shortage, and salinization of groundwater and estuaries in coastal areas due to sea level rising.
Diarrhea:• is a water and food borne disease that has a threatening prognosis to children less than 5 years. Lam (2007) mentions that climatic variables including rainfall, maximum and minimum daily temperature, and humidity are significantly associated with the emergency of fever and gastroenteritis with moderate strengths among children younger than 5 years. In Egypt, there is lack of research on the role of climate change in the episodes of gastroenteritis.
IV. 7. 1. b. Non-Communicable Diseases
Climate change is likely to stimulate the emergence and spread of some non-communicable diseases such as heatstroke, cardiovascular, respiratory diseases and cancers. With the improvement of life expectancy (69.5 for men and 74 years for women, year 2006 health indicators) the climate change will enhance the frequency of cardio-respiratory diseases due to higher concentrations of ground level ozone (IPCC, 2007) especially in the elderly. An important feature is the interaction of heat waves, ozone and particulate matter concentrations.
Cardiovascular Diseases:
In general, climate change in the form of severe heat waves may boost deaths and illnesses among elderly, infants, and people with cardiovascular diseases. High temperatures and hyper-thermal stress promote extended episodes of these diseases. Considering the increased poverty in many regions, compensation by heating and cooling could become more difficult for vulnerable groups.
Respiratory Diseases:
Studies on climate change (Kovats et al., 2004) provide evidence of an increase in emergency hospital admissions for respiratory health problems in young children and subjects over 75 years of age. The main effects of climate change recorded so far include altered distribution and the production of allergenic pollen species, as well as an increase in heat waves. Additionally, increases in temperature lead to increases of soil erosion and dust which has direct adverse impacts on health. Increased wind speed encourages sand dune movements causing health problems. Moreover, high air temperatures increase the concentration of ozone at ground level. Ozone damages
96
CHAPTEr Iv vULNErAbILITY AND ADAPTATION TO CLIMATE CHANGE
E-SNC
E-SNC
E-SNC
E-SNC
lung tissue, and causes particular problems for people with asthma and other lung diseases. Even modest exposure to ozone can cause healthy individuals to experience chest pains and pulmonary congestion.
Malnutrition:
Malnutrition remains one of the largest health crises worldwide, and approximately 800 million people are currently undernourished (WHO, 2009). Global warming and changes in rainfall patterns will affect water resources and food production capacity. This in turn shall affect agricultural cropping patterns and production, having a severe effect on food intake per capita, particularly in the developing countries. Droughts and other climate extremes have also direct impacts on food crops, and can influence food supply indirectly by altering the ecology of plant pathogens. Projections of the effect of climate change on food crop yield production globally appear to be broadly neutral, but climate change will probably exacerbate regional food supply inequalities (Parry et al., 2004).
IV. 7. 2. Adaptation
Adaptation measures for the health sector entail the following: Reduction of socioeconomic vulnerability:• Socioeconomic information is considered an essential aspect for the vulnerability assessments and adaptation decided strategies. Socioeconomic scenarios must also be developed to provide decision makers with possible future situations to support in assessing risk and developing adaptation strategies within appropriate timeframes. Moreover, socioeconomic data can be helpful in identifying appropriate approaches for different regions. Parameters as population and economic growth should be used for climate change impacts projection.Maintenance of a national public health infrastructure:• Although people in Egypt have access to health care and adequate public health control programs are available, yet there is still a wide disparity between Upper and Lower Egypt as well as between rural and urban regions with lowest indicators for health among rural areas of upper Egypt and for health services as well, which when improves and the gap is closed the resurgence of some infectious and non-communicable diseases can be limited. Access to quality health services:• A significant improvement in the percent of population with access to local health services reaching more than 90% (Egypt Demographic Health Survey, 2005) would lead to upgrading of adaptive capacity of the population to climatic changes. However, the quality of the healthcare provided (like management of coronary heart disease, cancer, complicated diabetes among rural areas) needs improvement. The Egyptian government has been undergoing a health sector reform program since 1998 targeting improvement of primary, curative and rehabilitation health care with the funding support from the European Commission and the World Bank.Improvement of vaccination programs:• Vaccinations for all infants and school children against primary diseases free of charge, and the annual local production of serum reached 96.5 million vaccine and serum doses, representing 95 percent of the country’s needs have led to the improvement in the health indicators and

E-SNC
E-SNC
97
EGYPT SECOND NATIONAL COMMUNICATION
E-SNC
E-SNC
the declaration of Egypt as free of some infectious diseases like Malaria and poliomyelitis and marked diminution of Schistosomiasis. However emerging new diseases needing vaccination like the human Papilloma Virus causing cancer cervix, the second common cause of cancer among women, as well as swine flue vaccination to all vulnerable sectors, require extra budgets.The development of early warning systems and control programs for infectious •diseases: This would particularly address Schistosomiasis, Lymphatic Falariasis, Malaria, Rift Valley Fever, Tuberculosis, water and food borne diseases, Rheumatic Fever, and Rheumatic Heart Disease. Egypt has to design and implement a variety of adaptive strategies to reduce the current burden of the diseases most sensitive to climate change, whether communicable like Malaria, Lymphatic Falariasis and Schistosomiasis or non-communicable like coronary heart diseases, and cancer.The development of weather and seasonal forecasting and early warning systems, •disaster planning and educational and public awareness programs: Hot weather watch/heat-health warning systems, a collaboration between meteorological and health services, should be implemented in Egypt. The warning is normally issued by the health sector, based on the model run by the meteorological agency. The systems should include outreach and education via the media, and interventions by the health and social sectors to follow up with the most vulnerable groups to achieve appropriate responses to the warnings.Gap identification:• Gap identification and fulfilling information needs through making available data for statistical analysis of climate data is needed. Satellite data may serve as an important source of continuous global information that can be used to monitor disease pattern. Several steps could be taken to begin to address health issues, such as :
Maintaining and strengthening disease surveillance systems for monitoring a. incidence and prevalence of diseases vulnerable to climate change, clarifying definitions of terminology and methods for assessing predictive accuracy. Involving health policy-makers in all stages of system design; Carrying out research areas on heat-related illness, non-communicable b. diseases and socioeconomic impacts from extreme climatic events, water-borne and food-borne diseases, vector-borne and rodent-borne diseases, impacts of the pollen of neophytes to better understand the relationship between weather and climate and pollen transmission, and understanding vulnerabilities with urban environment, including how the urban heat island enhancement will evolve; Effort should be affected to develop better cooperation between the c. meteorological services and relevant health authorities to increase the effectiveness of early warnings.
E-SNC
E-SNC
99
EGYPT SECOND NATIONAL COMMUNICATION
E-SNC
E-SNC
CHAPTER V. ACHIEVEMENT OF THE OBJECTIVES OF THE CONVENTION
1. Efforts Exerted
2. Needs for Mitigating the Effects of
Climate Change

E-SNC
E-SNC
101
EGYPT SECOND NATIONAL COMMUNICATION
E-SNC
E-SNC
V. ACHIEVEMENT OF THE OBjECTIVES OF THE CONVENTION
V. 1. Efforts Exerted
V. 1. 1. Transfer of Technology
Development and demonstration projects undertaken in Egypt during the last 10 years have essentially been targeting renewable energies and efficiency. They include:
Photovoltaic equipment to provide electricity and to drive desalination units for •fresh drinking water in remote zones.Pilot projects for the electrification of some rural villages with solar photovoltaic •panels. The utilization of solar thermal energy applications in tourist resorts and new •villages in desert reclaimed areas. The introduction of electric buses technology to Egyptian areas of antiquities.•The conservation of energy and time used for cooking by traditional ovens in •rural areas. Demonstration projects for solar water heaters technology in several governorates •in the Delta and Upper Egypt. Pilot projects and policy for energy efficiency and renewable energy, with the •introduction and promotion of energy efficient lighting systems in the Egyptian markets, leading to increase in demand, local manufacturing and significant drop in prices.Zafarana Windmill Parks with a total capacity of 300 MW; the promotion of a •local manufacturing base for wind energy equipment.
V. 1. 2. Research, Systematic Observation and Networking
V. 1. 2. a. Ongoing Studies and Research in the Field of Climate Change
Ongoing studies and research in the field of climate change is primarily concentrated in three main fields: energy, coastal zones, and agriculture and water resources. The initiatives being carried out within each of these fields are as follows:
Energy:
Reducing loss of electricity through transmission.•Renewable energy generation technologies (wind, solar, biomass, etc ).•Regional mechanisms for developing sustainable energy systems.•Using compressed renewable natural gas in some means of transportation in •cities.

102
CHAPTEr v ACHIEvEMENT Of THE ObjECTIvES Of THE CONvENTION
E-SNC
E-SNC
E-SNC
E-SNC
Coastal Areas:
Promoting the role of stakeholders’ participation in evaluating the trade-offs •between adaptation options.Incorporating the management of sea level rise risks into the development plans •of Egypt’s low elevation coastal zones in the Nile Delta. Developing an adaptation policy framework for the low elevation coastal zone •areas; climate change risk reduction strategies; policies and relevant measures integrated into land use plan, and the identification of needs of laws and regulations related to coastal zone development to take careful account of climate risks.Identifying means of strengthening institutional and individual capacities to •implement integrated coastal zone management plans.
Agriculture and Water Resources:
Determining the impact of climate change on the production of different cultivars •of maize. Investigating potato productivity and wheat production under changing climate.•Carrying out modeling and stimulation studies of growth and geographical •distribution of some crop plants in relation to expected climate change. Assessment of the impact of climate change on rust disease of wheat and potato •blight. Determining the impact of climate change on agricultural water demands. •Developing integrated climate application information system for prediction and •adaptation to climate change impacts in agriculture. Carrying out socioeconomic analysis of the adaptive capacity of agricultural •stakeholders to climate change.Carrying out an analysis of mitigation options of CH• 4 emissions from enteric fermentation, manure management of livestock, and paddy rice cultivation. Developing cultivars of the main crops tolerant to heat, soil salinity and new and •more virulent pests.Determining the impact of climate change on ground water resources.•Applying desalination on a large scale.•Building a regional model for the River Nile.•Locally developing some components of wind mills and solar panels.•
V. 1. 2. b. Systematic Observation
In Egypt, The Central Agency for Population, Mobilization and Statistics (CAPMAS) represents the official authority for national data collection and analysis for the country. Its website offers information and data concerning various environment and development indicators. In addition several other organizations are carrying out systematic observations for specific climate targets. The systems and programs available for systematic observation are the following:
Meteorological and Atmospheric Observation:
The Egyptian Meteorological Authority (EMA) is the authority responsible for systematic observations and meteorological forecasting in Egypt. EMA had
E-SNC
E-SNC
103
EGYPT SECOND NATIONAL COMMUNICATION
E-SNC
E-SNC
meteorological stations monitoring in Egypt as early as 1933. The country-wide monitoring network consist of 112 stations including surface and atmospheric stations, air pollution, global radiation and agro-meteorological stations (EEAA, 2001). Of these stations, 26 are connected to international networks as of 2001.
As of 2006, EMA operates 32 stations in dual system, both automatic and manual. The Authority plans to modernize another 15 stations and has also plans to establish 15 new stations in 2009. The automatic network will thus consist of 47 stations in 2009, and all the other manual stations will be modernized to have automatic meteorological observations in a few years. In addition to meteorological data EMA has also established a network for air pollution monitoring, analysis and interpretation, as well as an ozone monitoring network.
Air Pollution Monitoring:
The Egyptian Environmental Affairs Agency (EEAA) has contracted the Environmental Hazards and Mitigation Center (EHMC) at Cairo University, and the Institute for Graduate Studies and Research (IGSR), Alexandria University for sampling, measuring and carrying out laboratory analyses for a number of air pollutants. The National Institute for Standardization (NIS) acts as the reference laboratory for standardization, quality assurance and control. A network of 47 stations is established over Cairo, Alexandria, main cities in the Delta and Upper Egypt. The parameters monitored are: CO, NOX, O3, TSP and SO2. The ambient air pollution monitoring network does not monitor greenhouse gases except tropospheric ozone at a limited number of stations.
Coastal Water Quality Monitoring Network:
The Institute of Graduate Studies and Research (IGSR), Alexandria University, is responsible for monitoring the Mediterranean coast of Egypt and the National Institute of Oceanography and Fisheries (NIOF) is responsible for monitoring the Red Sea coast. The monitoring institutions also participate in a laboratory quality assurance program supervised by an independent reference laboratory at the Faculty of Science, Ain Shams University. The following parameters have been monitored on a bimonthly basis over the past 10 years:
Bacteriological parameters: • Total coliforms, ISO 56679; Ecoli, ISO 9308-1; Fecal Streptococci, ISO 78992;Physical Parameters:• Depth; salinity; conductivity ; pH; temperature; dissolved oxygen; transparency;Chemical Eutrophication Parameters:• Nitrite; nitrate; total phosphorus; total nitrogen; ammonia; reactive phosphate; Chlorophyll–a.
EEAA has an established a website where these data are published. It has also established requirements for the quality of data in proficiency tests in order to have uniform evaluations of the results of all participating laboratories. The physical parameters monitored by this network verify and complement satellite measurements of Sea Surface Temperature (STT) so as to provide useful information on changes of SST at various localities of the coastal zone.

104
CHAPTEr v ACHIEvEMENT Of THE ObjECTIvES Of THE CONvENTION
E-SNC
E-SNC
E-SNC
E-SNC
Satellite Systematic Earth Observations:
The earth observation system of the National Aeronautics and Space Administration (NASA) has established a large number of satellites in orbit to collect various types of indicators related to climate, pollution and atmospheric parameters. So far no systematic observations have been established in an operational system for collection, analysis and interpretation of these data in Egypt.
The National Authority of Remote Sensing and Space Sciences (NARSS) has been responsible for launching Egypt’s first satellite, EgyptSat-1, in 2007. EgyptSat-1 carries two remote sensing devices, an infrared device and a multi-spectrum one. EgyptSat-1 is the country’s first satellite for scientific research. A data base has been built for EgyptSat-1 for several months. So far, the data collected has not been disseminated to the scientific community except through an intranet. A multi satellite receiving station has also been established in Egypt. NARSS has also established a station for receiving data from National Oceanic and Atmospheric Administration (NOAA) satellites, Sea-viewing Wide Field-of-view Sensors (SeaWifs) and Satellites Pour l’Observation de la Terre (SPOT). A database is being held by NARSS, however, no mechanism for the accessibility of these data to external researchers has been established so far.
Agriculture:
There are 26 agro-meteorological stations in addition to two environmental stations distributed in the agriculture regions in Egypt, all belonging to the Ministry of Agriculture and Land Reclamation. All these stations are equipped with measurement equipment for the regular minimum and maximum temperatures, relative humidity, total radiation, wind speed and direction, soil temperature and leaf wetness. These stations are marginally covering the agriculture areas, and most of them need substantial calibration and maintenance. The required number of stations for proper coverage is at least three times the number of existing ones. Monitoring of nitrous oxide, methane and carbon dioxide on hourly basis in all agricultural areas is lacking. As a minimum one station for each of the 28 governorates is required in order to monitor the emissions of these gases from agricultural activities.
Water Resources:
Tide gauge stations are installed by the Ministry of Water Resources and Irrigation at several spots of the Nile Delta and Mediterranean coast (Table (V.1)), with two stations installed on the Red Sea coast, and eleven automatic tide gauge stations installed along the Suez Canal.
E-SNC
E-SNC
105
EGYPT SECOND NATIONAL COMMUNICATION
E-SNC
E-SNC
Table (V.1): Tide gauge stations in the Delta and on the Mediterranean coast.
Tide Gauge Location/Name Starting Date
Alexandria Port 1944
Abu Qir Port 1992
Rosetta Mouth 1964
Burullus Inlet 1972
New Damietta Harbor 1997
Damietta Mouth Estuary 1990
El Arish Power Plant 1996-1998
Difficulties in the measurement of precipitation over the Nile Basin countries remain an area of concern in quantifying trends of natural flow to downstream riparian countries of Egypt and Sudan. The number of rain gauges is not sufficient, distribution of rain gauges does not reflect the importance of catchments and sub-basins and the difficulty facing Nile Basin countries in the exchange of their precipitation data makes it difficult to analyze and predict future changes.
In addition, many hydro-meteorological variables such as stream flow, soil moistures and actual and potential evapotranspiration in the Nile Basin are either not measured or inadequately measured. Potential evapotranspiration is generally calculated from parameters such as solar radiation, relative humidity and wind speeds. Records are often very short and available only for few countries or even few regions inside each country which impedes complete analysis of change during droughts.
Nile stretches in Sudan and Egypt are rich with river flow data collected over more than 100 years. This is only because of the large number of dams in the system (e.g. Sennar, Rosaires, Khashm El Girba, Aswan Dam and High Aswan Dam). Dams are perfect measuring points since electricity generation is a function of static head and discharge.
Groundwater is not well monitored and the process of groundwater depletion and recharge is not well modeled especially in the fossil aquifers which form strategic reserve in the case of prolonged droughts.
Data on water quality, water use and sediment transport determine the suitability of water use for different development activities. Sediment transport shows the accumulation of sediments upstream of the High Aswan Dam which could give indications of when to clear these sediments or when the reservoir will be full of sediments which would reduce its suitability for storage or energy generation.
In addition to the above, the Nile Delta needs a refined grid parallel and perpendicular to the seashore till at least the middle of the Delta. Water table level and salinity need to be monitored on a daily basis and logged centrally in an accessible data base.

106
CHAPTEr v ACHIEvEMENT Of THE ObjECTIvES Of THE CONvENTION
E-SNC
E-SNC
E-SNC
E-SNC
Health:
The Ministry of Health and the Ministry of State for Family and Population have systematic observations on the significant health population indicators, with the Ministry of Health regularly monitoring overall infectious diseases including, lately, bird and swine flu. This is carried out through its central laboratory in cooperation with a reference laboratory, the Communicable Disease Control Center (CDC), in the USA. A regular Egypt Health Demography Survey, prepared by an independent consultant for the Ministry, is issued every three years by the Ministry of Health. It reflects all health and demographic changes which have occurred within the period it covers, including incidence of infectious diseases and, lately, non-communicable diseases.
The National Council for Childhood and Motherhood (NCCM) regularly issues an international report on children affairs. Different health issues are regularly reported within the Millennium Development Goals with information being supplied from different relevant ministries.
Statistical analysis of climate data demonstrates that disease incidence vary over time with climatic patterns. Satellite data serve as an important source of continuous global information that can be used to monitor disease pattern. Results from scientific research conducted to estimate the possible change in the distribution of infectious diseases and ecological adaptation as a result of climate change have yet to be put together and analyzed.
V. 1. 2. c. Networking
The obvious priority collaborators for Egypt are ones associated with water resources. These comprise the Nile Basin countries for Nile flows, and Sudan, Libya and Chad as the three partners in the Nubian Sandstone Aquifer.
Nile flows represent the largest contribution to Egypt’s water budget and therefore, collaboration with the nine upstream riparian states is a must. Egypt is now working on extending the networking with the Nile Basin countries to the development of regional models, climatic data collection on river flows, precipitation, forestry, evaporation and evapotranspiration losses in swamps and marches.
Groundwater in the Nubian Sandstone Aquifer is very important as a local reservoir that can only be substituted by very expensive conveyance of Nile water through extremely long distances. Efforts on collaboration with other countries are geared towards controlling abstraction according to agreed upon shares.
Additional to water resources networking, networking already exists between research institutions working on monitoring and assessment of extreme events, early warning systems, risk assessment and disaster reduction. Furthermore, networking also exists with Arab Mashrek and Maghreb countries in the field of electrical interconnection. There is also networking links with the Mediterranean countries in the areas of renewable energies and energy efficiency. However, there is also a need to establish networks (or

E-SNC
E-SNC
107
EGYPT SECOND NATIONAL COMMUNICATION
E-SNC
E-SNC
join existing ones) between African Arab states, the rest of African countries, and when feasible, with other countries that have similar environmental, economic and social conditions to work together on responding to climate change. This could be shaped in the form of joint research projects, exchange of experts and post graduate students and exchange of information.
V. 1. 3. Education, Training and Public Awareness
Egypt has already introduced an integrated environmental component in its secondary schools curricula and many universities started offering postgraduate studies in environmental sciences. Moreover, a resource book of the experts of formal and non-formal education material has been prepared, offering information for the introduction of environmental concepts into the curriculum for formal and non-formal environmental education. In addition, the general framework of a National Strategy for Environmental Education for Sustainability was prepared, and in 2007 and 2008 nine training workshops on climate change were organised by EEAA and targeted NGOs and Media.
Furthermore, GEF funded initiatives have played a significant role in introducing climate change on the national level and increasing the general awareness on climate change mitigation and adaptation issues and its linkages to the national sustainable development agenda. The INC project has established a common platform for national experts in related areas to work together and exchange information for the first time on climate change. Meanwhile, the implementation of GEF climate change projects, such as energy efficiency, has contributed to the introduction of climate change mitigation approaches to government officials in several ministries. The project has trained a large number of engineers and practitioners inside and outside Egypt in different fields related to energy efficiency improvement techniques including power generation, transmission, standards, labels, and testing of electric appliances, efficient lighting systems, building codes, etc.
Meanwhile, since it was launched in 1992, the UNDP GEF Small Grants Programme in Egypt has directed more than 60% of its 175 grants in small scale projects to NGOs implementing small scale climate change projects. This has significantly contributed significantly to awareness and on-job and field training of civil society organizations and NGOs on climate change related issues and in particular in the areas of renewable energy use, energy efficiency, recycling of agriculture wastes and sustainable transport.
Within the area of awareness, the UNDP has orchestrated a national energy efficiency awareness campaign that was funded by three international companies in collaboration with the Ministry of State for Environmental Affairs and the Social Fund for Development (SFD). Throughout the campaign three television spots have been produced and broadcasted on six regional satellite channels about energy efficient lightings and energy efficient equipment. This was followed by another television campaign organized by the Egyptian NGO Federation to promote the use of energy efficient compact florescent lamps.
108
CHAPTEr v ACHIEvEMENT Of THE ObjECTIvES Of THE CONvENTION
E-SNC
E-SNC
E-SNC
E-SNC
V. 2. Needs for Mitigating the Effects of Climate Change
V. 2. 1. Transfer of Technology
Technology transfer needs for mitigating the effects of climate change over the medium term include:
Environmental friendly technologies for the protection of the Mediterranean coast •in general, and low elevation coastal zones in the Nile Delta in particular;High efficiency clean coal- burning power generation;•New generation of nuclear technology;•Fuel cell and hydrogen vehicle technology;•New style building (energy saving) technology;•Industrial processes (more energy efficient and better green technologies in the •industrial processes); CO• 2 separation, capture and storage technologies;Intelligent distributed energy systems and smart networks;•Electricity generated from solar energy;•Efficient lighting systems; expansion of local manufacturing; •Water desalination using renewable energy;•Updated genetic engineering techniques for producing crop using saline waters;•Biomass energy technologies as a renewable source of energy•Energy efficient home electric appliances and means of transport•Solar energy applications (heating, cooling, electricity generation, water •desalination, etc.)Bio-fuel cultivation using low quality water in marginal lands•Fuel switching technologies to cleaner fuels•
V. 2. 2. Research Needs
Technical and financial support is urgently needed to establish research programs with teams from existing universities and research institutes. In this respect, priority research areas within the different fields include:
Agriculture:
Developing new cultivars tolerant to heat, salinity and water stresses. •Changing dates of sowing.•Adaptation options based on genetic engineering applications.•Simple and cheap applications of solar energy in agricultural sector.•Agricultural wastes recycling and reuse.•Soil preservation and healing technologies.•Evaporation and evapotranspiration reduction.•Irrigation with treated waste water and/or low quality water.•Traditional techniques for coping with high temperature for crop management.•Adaptation of livestock production.•Simple and cheap aquaculture techniques.•

E-SNC
E-SNC
109
EGYPT SECOND NATIONAL COMMUNICATION
E-SNC
E-SNC
Water Resources:
Prediction of and adaptation to variation in Nile flow.•Non-conventional water resources development.•Low cost technologies for wastewater treatment, water quality improvement and •reuse.Advanced research in the area of improved water use efficiency and water demand •management as no- regret solutions to cope with climate change.
Coastal Zone and Tourism
Vulnerability assessment of the coastal zone and exploration of options for •adaptation in view of adopted scenarios of sea level riseMonitoring, modelling and assessment of impacts of salt water intrusion on soil •salinity.Monitoring, modeling and assessment of potential impacts of climate changes •on coral reef and impacts on tourismSocioeconomic considerations of immigration of vulnerable communities and •employment considerations in safe aeas
Energy:
Upgrading of low-efficiency fossil fuel-fired Industrial Boilers.•Combined heat and power cogeneration.•Recovery of residual and waste heat and pressure.•Fuel Substitutes.•Biomass energy technologies.•Energy efficient transport systems and technologies.•Potential of CO• 2 separation, capture and storing in geological formations.Utilization of heat pumps and condensing gas furnaces.•
Health:
Heat related illness and death. •Non-communicable diseases.•Water-borne and food-borne diseases.•Vector-borne and rodent-borne diseases.•Better understanding of the relationship between weather and climate and pollen •transmission.With the possible forced migration of populations from coastal zones as a result •of climate change and sea level rise, the population density will increase and basic requirements for health can be jeopardized. This needs a study of the socioeconomic burden of diseases especially the non-communicable diseases like hypertension, diabetes mellitus and coronary heart diseases.
Weather:
Carrying out vulnerability assessments to extreme weather events.•
110
CHAPTEr v ACHIEvEMENT Of THE ObjECTIvES Of THE CONvENTION
E-SNC
E-SNC
E-SNC
E-SNC
V. 2. 3. Systematic Observation Needs
For systematic observation, the following is needed:
The establishment of proper systematic observation systems, monitoring networks •and institutional information systems on sea lever rising to support decision making. The systems primary objectives would be the identification of vulnerable areas; the building of databases; the development and implementation of measures for resource protection; and the follow up and enforcement of planning regulationsSupport of the EEAA air quality network with a number of monitoring stations •for CO2, CH4, and VOCs. The institutionalization of systematic observations of sea surface temperature, •coastal land use and sea level variations, ensuring the availability of results for to the scientific community and policy makers.The establishment of a network of tide gauges over the Mediterranean, the Red •Sea, and Lake Nasser.The establishment of institutional capacities for monitoring coastal and sea surface •temperature variations in the Red Sea, Lake Nasser and Lake Qarun.Maintaining and strengthening disease surveillance systems for monitoring •incidences and prevalence of diseases vulnerable to climate change, including more effective use of remote sensing and non- traditional observing strategies.
V. 2. 4. Modelling Needs
For modeling, the following is needed:
Building up capacity on Regional Circulation Models.•Building capacities for modeling and early warning of extreme events and disasters •such as flash floods, tsunamis, dust storms and droughts.Developing of adaptation models and contingency plans for risk reduction.•Building capacities for regional models development and operation so as to allow the •assessment of predicted temperature and precipitation conditions in coastal zones.
V. 2. 5. Adaptation Needs
For adaptation, the following is needed:
The identification and assessment of selection criteria for different adaptation •measures options.The identification and protection of high risk areas such as areas below sea level •(Abu Qir Bay and South of Port Said).Increasing awareness of population and decision makers of the negative impacts •of climate change on social, economic and health situation.
V. 2. 6. Institutional Needs
There is an urgent need to establish a Ministerial Committee headed by the Prime Minister and including all relevant ministers, particularly those of Agriculture,

E-SNC
E-SNC
111
EGYPT SECOND NATIONAL COMMUNICATION
E-SNC
E-SNC
Water Resources, Environment, Health, Energy, Tourism, and Higher Education and Scientific Research. The Technical arm of this Ministerial Committee should be an independent technical committee established by the Prime Minister to include 25 to 30 top Egyptian scientists in the different relevant fields such as Agriculture, Water Resources, Metrology, Health, Energy, Coastal Protection, Remote Sensing, Modelling, Sociology, etc. The committee would elect its own chairman from among its members and report directly to the Prime Minister. The committee would:
Review all literature and results of research, monitoring and adaptation activities •ongoing in Egypt and those published abroad;Based on the above, develop a draft policy for addressing climate change in Egypt •and present it to the Prime Minister;When this policy is adopted by the Council of Ministries, the Technical Committee •would assist the Ministry of Economic Development to draw four five year plans, covering the period from 2011 to 2035, addressing climate change;The Committee could be turned into a virtual centre for coordinating national •activities and follow-up actions reported abroad. This centre can be hosted within the IDSC or the Bibliotheca Alexandrina. The role of the host would be to store data reported by the Committee, establish a database and update it and host the quarterly meetings of the Committee. This would mean that no new physical entity would be needed.
V. 2. 7. Other Needs
Further to what is listed above, additional needs include the following:
Upgrading hospitals with efficient laboratories necessary for diagnosis and follow •up of communicable diseases. Establishing an effective energy savings data bank with full transparency •through an information management system for knowledge dissemination and management. Water supply management is generally practiced in Egypt where supply is •released according to the country’s requirement for different uses. Narrowing the gap between supply and demand will ultimately balance both and keep the difference to a minimum. Demand management is meant to provide each activity with its timely requirements through measured volumes. This type of management requires a piped system running under pressure. Construction and running costs of such a system does not seem to be affordable by Egypt, especially with the level of fragmentation of the irrigation system in the country. Egypt certainly needs technical and financial help to reach this goal.New observing stations for the Nile river flow are needed. •Developing awareness program among stakeholders and officials of the coastal •governorates regarding the impacts of climate change on coastal zones.
E-SNC
E-SNC
113
EGYPT SECOND NATIONAL COMMUNICATION
E-SNC
CHAPTER VI. FINANCIAL, TECHNICAL AND CAPACITY BUILDING NEEDS
1. Introduction
2. Projects Needed in Egypt
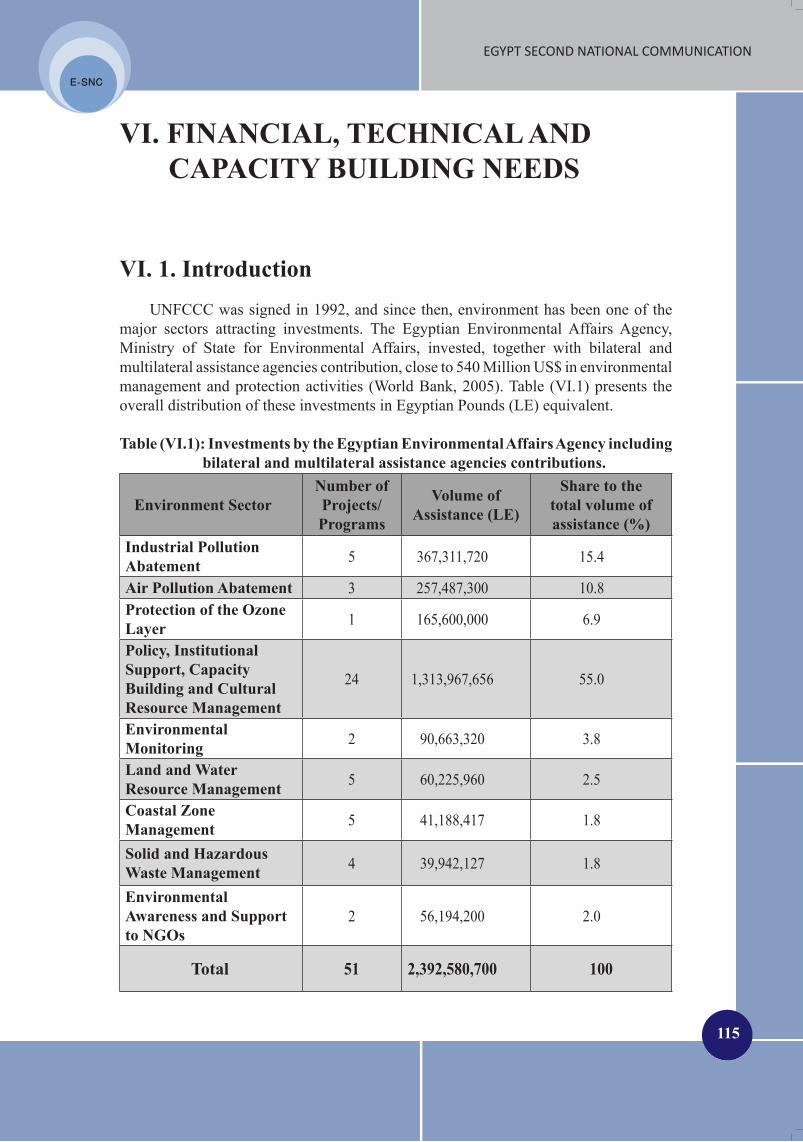
115
EGYPT SECOND NATIONAL COMMUNICATION
E-SNC
VI. FINANCIAL, TECHNICAL AND CAPACITY BUILDING NEEDS
VI. 1. IntroductionUNFCCC was signed in 1992, and since then, environment has been one of the
major sectors attracting investments. The Egyptian Environmental Affairs Agency, Ministry of State for Environmental Affairs, invested, together with bilateral and multilateral assistance agencies contribution, close to 540 Million US$ in environmental management and protection activities (World Bank, 2005). Table (VI.1) presents the overall distribution of these investments in Egyptian Pounds (LE) equivalent.
Table (VI.1): Investments by the Egyptian Environmental Affairs Agency including bilateral and multilateral assistance agencies contributions.
Environment Sector Number of Projects/Programs
Volume ofAssistance (LE)
Share to the total volume ofassistance (%)
Industrial PollutionAbatement 5 367,311,720 15.4
Air Pollution Abatement 3 257,487,300 10.8 Protection of the OzoneLayer 1 165,600,000 6.9
Policy, Institutional Support, Capacity Building and CulturalResource Management
24 1,313,967,656 55.0
EnvironmentalMonitoring 2 90,663,320 3.8
Land and WaterResource Management 5 60,225,960 2.5
Coastal ZoneManagement 5 41,188,417 1.8
Solid and HazardousWaste Management 4 39,942,127 1.8
Environmental Awareness and Supportto NGOs
2 56,194,200 2.0
Total 51 2,392,580,700 100

116
CHATPEr vI fINANCIAL, TECHNICAL AND CAPACITY bUILDING NEEDS
E-SNC
Other projects relating directly or indirectly to climate change were implemented by other ministries and Egyptian government bodies in cooperation with various donors. In the fields of vulnerability and adaptation to climate change in the sectors of coastal zones, water resources and agriculture, the gap between Egypt’s financial and technical needs and the resources given by assistance agencies is very large.
VI. 2. Projects Needed in EgyptThe following are the high priority projects which need to be implemented in the
coming four years. Based on an initiative financed through the UNFCCC secretariat for the evaluation of financial and technical needs of Egypt in the areas of climate change mitigation and adaptation, the actual estimation of Egypt’s needs in this context may approach several billions of US$ for implementing short and long term plans.
VI. 2. 1. Research Programs/Projects
Sect
or
Program/Project Title Concerned AuthorityFinance
Required(million
US$)
Duration(y ears)
Gen
eral Negative impacts of
climate changes on health sectors
Ministry of Health; Universities and relevant
Research Institutes2 3
Coa
stal
Z
ones
Assessment of climate change impacts on
coastal zones and water resources
Ministry of Water Resources and Irrigation;
Coastal Research Institutes
3 3
Wat
er R
esou
rces
Identification and assessment of various
sectors that are sensitive to climate change
Ministry of Water Resources and Irrigation;
Coastal Research Institutes; Ministry of
State for Environmental Affairs; Ministry of Higher Education
3 3
Assessment of climate change impacts on water resources vulnerability
assessment.
Ministry of Water Resources and Irrigation 2 3
Study and assessment of impacts of sea water intrusion on changing water quality in the
shallow aquifers in the coastal areas
Ministry of Water Resources and Irrigation;
Ministry of State for Environmental Affairs
2 3
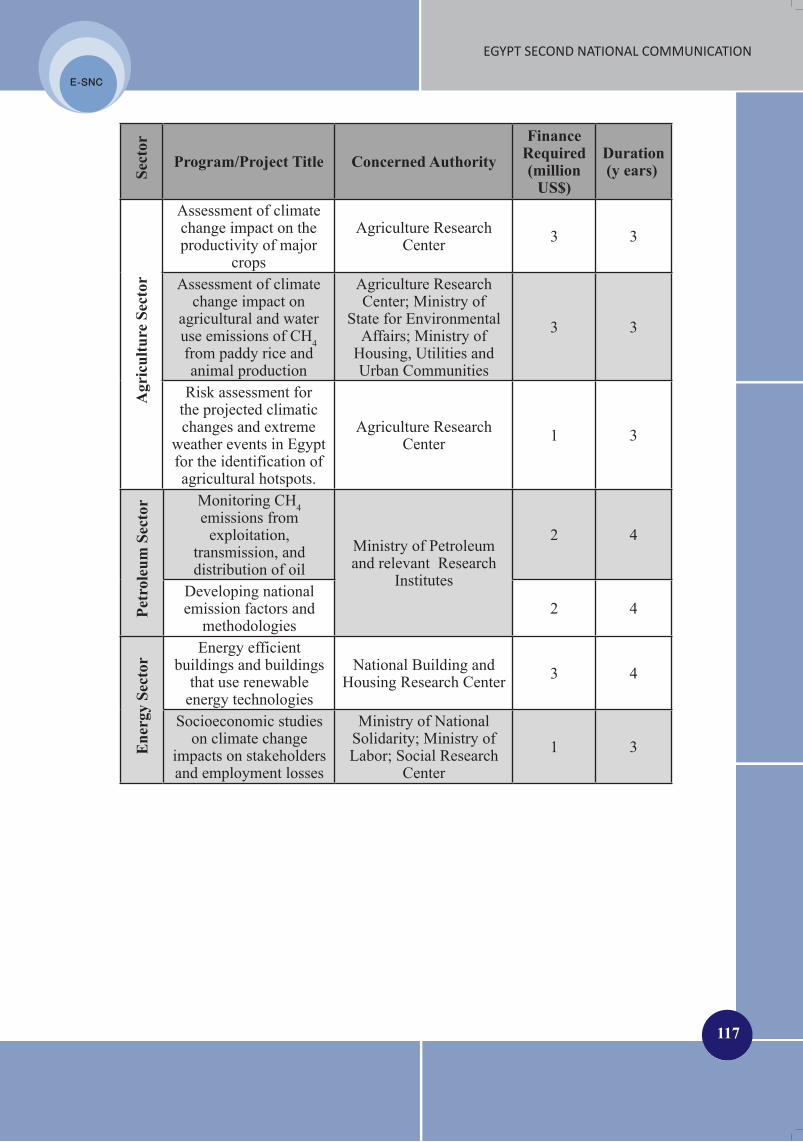
117
EGYPT SECOND NATIONAL COMMUNICATION
E-SNC
Sect
orProgram/Project Title Concerned Authority
Finance Required(million
US$)
Duration(y ears)
Agr
icul
ture
Sec
tor
Assessment of climate change impact on the productivity of major
crops
Agriculture Research Center 3 3
Assessment of climate change impact on
agricultural and water use emissions of CH4 from paddy rice and animal production
Agriculture Research Center; Ministry of
State for Environmental Affairs; Ministry of
Housing, Utilities and Urban Communities
3 3
Risk assessment for the projected climatic changes and extreme
weather events in Egypt for the identification of agricultural hotspots.
Agriculture Research Center 1 3
Petr
oleu
m S
ecto
r Monitoring CH4 emissions from
exploitation, transmission, and distribution of oil
Ministry of Petroleum and relevant Research
Institutes
2 4
Developing national emission factors and
methodologies2 4
Ene
rgy
Sect
or
Energy efficient buildings and buildings
that use renewable energy technologies
National Building and Housing Research Center 3 4
Socioeconomic studies on climate change
impacts on stakeholders and employment losses
Ministry of National Solidarity; Ministry of Labor; Social Research
Center1 3

118
CHATPEr vI fINANCIAL, TECHNICAL AND CAPACITY bUILDING NEEDS
E-SNC
VI. 2. 2. Programs/Projects for Systematic Observation and Information Technologies
Program/Project Title Concerned Authority
Finance Required(million
US$)
Duration(years)
The establishment of a Regional Center for Research and Studies of Climate ChangeThe Center would be responsible for data collection, monitoring and assessing climate changes and likely impacts within Egypt and in the other Nile Basin countries, developing and maintaining a database in this regard, as well as networking with other research institutes
Ministry of State for Environmental Affairs;
Ministry of Higher Education
4 3
Monitoring and observation of climate change
Ministry of State for Environmental
Affairs; Ministry of Agriculture and Land Reclamation; Ministry
of Water Resources and Irrigation; Egyptian
Meteorological Authority
18 4
VI. 2. 3. Programs/Projects for Raising Capacity in Education, Training and Public Awareness
Program/Project Title Concerned Authority
Finance Required(million
US$)
Duration(years)
Capacity building of the Egyptian Meteorological AuthorityThis would be on the use of satellite monitoring equipment, and networking with national and for international universities and organizations
Egyptian Meteorological Authority; Ministry of
Higher Education3 4
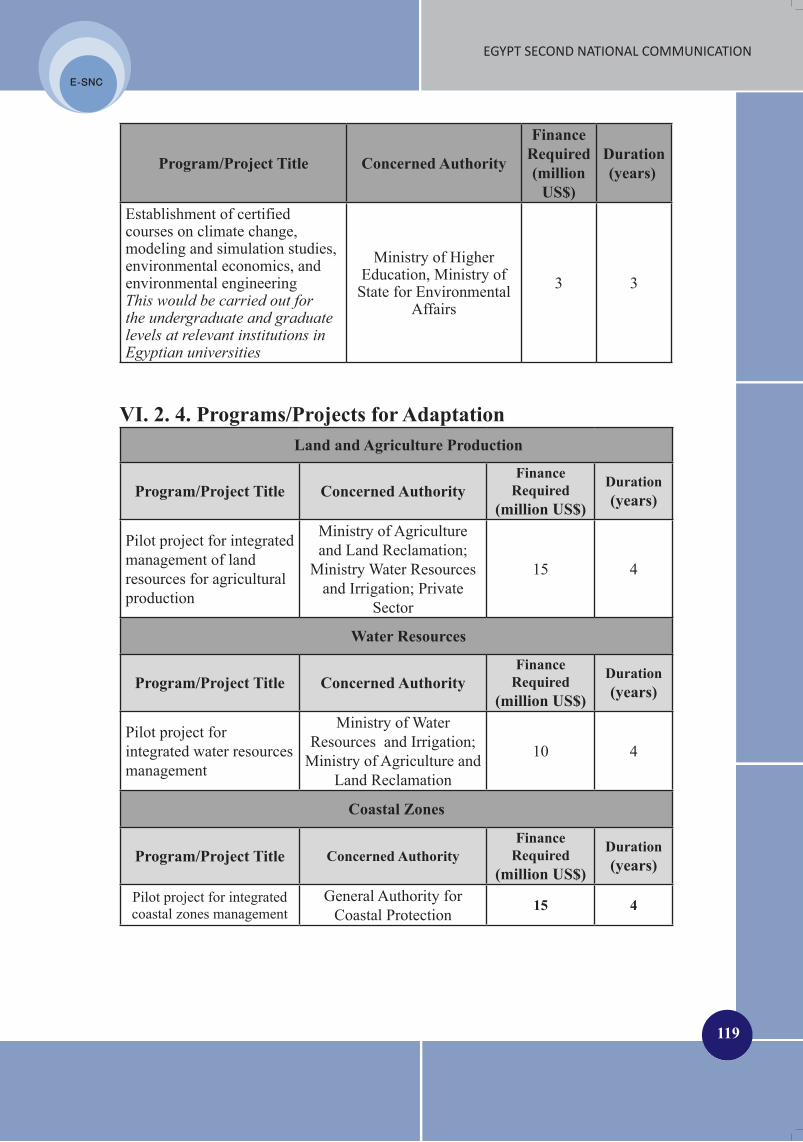
119
EGYPT SECOND NATIONAL COMMUNICATION
E-SNC
Program/Project Title Concerned Authority
Finance Required(million
US$)
Duration(years)
Establishment of certified courses on climate change, modeling and simulation studies, environmental economics, and environmental engineeringThis would be carried out for the undergraduate and graduate levels at relevant institutions in Egyptian universities
Ministry of Higher Education, Ministry of
State for Environmental Affairs
3 3
VI. 2. 4. Programs/Projects for AdaptationLand and Agriculture Production
Program/Project Title Concerned AuthorityFinance
Required(million US$)
Duration(years)
Pilot project for integrated management of land resources for agricultural production
Ministry of Agriculture and Land Reclamation;
Ministry Water Resources and Irrigation; Private
Sector
15 4
Water Resources
Program/Project Title Concerned AuthorityFinance
Required(million US$)
Duration(years)
Pilot project for integrated water resources management
Ministry of Water Resources and Irrigation;
Ministry of Agriculture and Land Reclamation
10 4
Coastal Zones
Program/Project Title Concerned AuthorityFinance
Required(million US$)
Duration(years)
Pilot project for integrated coastal zones management
General Authority for Coastal Protection 15 4
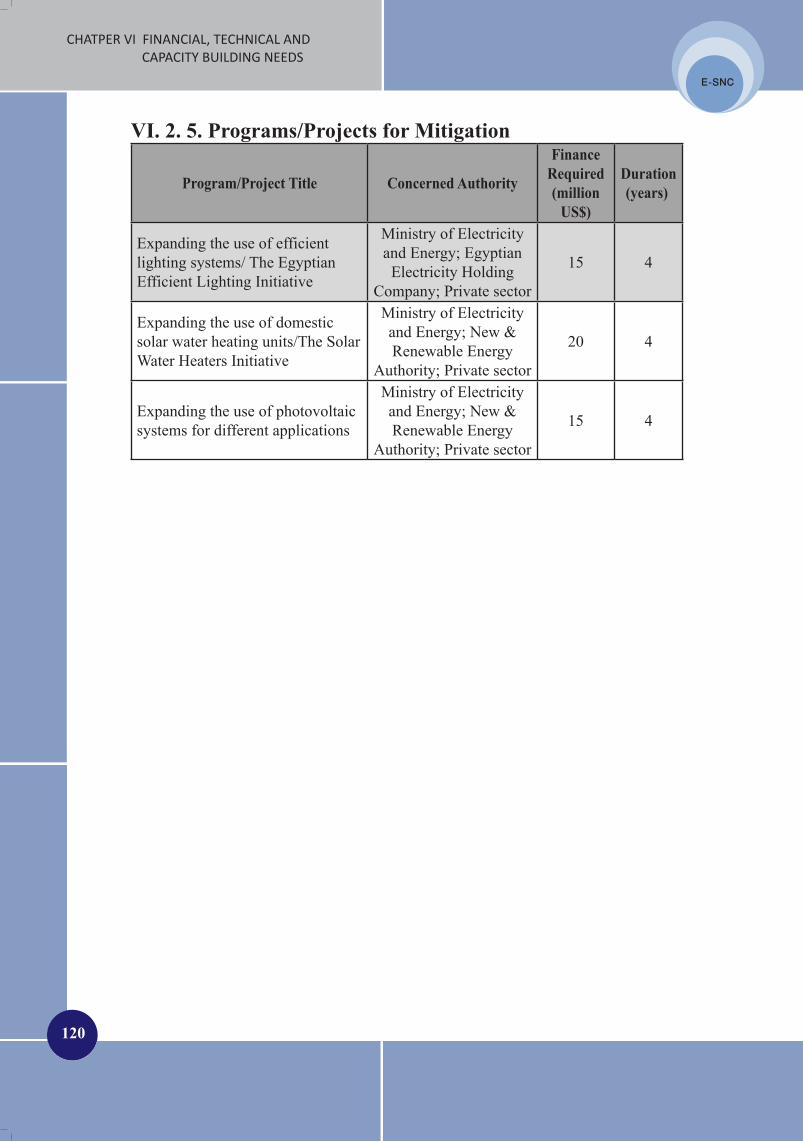
120
CHATPEr vI fINANCIAL, TECHNICAL AND CAPACITY bUILDING NEEDS
E-SNC
VI. 2. 5. Programs/Projects for Mitigation
Program/Project Title Concerned Authority
Finance Required(million
US$)
Duration(years)
Expanding the use of efficient lighting systems/ The Egyptian Efficient Lighting Initiative
Ministry of Electricity and Energy; Egyptian
Electricity Holding Company; Private sector
15 4
Expanding the use of domestic solar water heating units/The Solar Water Heaters Initiative
Ministry of Electricity and Energy; New & Renewable Energy
Authority; Private sector
20 4
Expanding the use of photovoltaic systems for different applications
Ministry of Electricity and Energy; New & Renewable Energy
Authority; Private sector
15 4
121
References
Abdelgawwad, D. (2006), Development of Water Front of Alexandria, M.Sc. Thesis, University of Alexandria.
Abolmaaty, S.M. (2006), Assessment of the Impact of Climate Change on Some Rust Diseases for Wheat Crop Under Egyptian Environmental Conditions, PhD Thesis, Faculty of Agriculture, Al-Azhar University.
Abou Zeid, K. (2002), Egypt and the World Water Goals; Egypt’s statement in the World Summit for Sustainable Development and Beyond, Johannesburg, South Africa.
Abou-Hadid, A.F. (2006), Assessment of Impacts, Adaptation and Vulnerability to Climate Change in North Africa: Food Production and Water Resources, Final Report, Assessments of Impacts and Adaptations to Climate Change (AIACC), Project No. AF 90.
Abou-Hadid, A.F. (2009), Climate Change and the Egyptian Agriculture Conundrum, Proceedings of the Ninth International Conference of Dryland Development, “Sustainable Development in the Drylands - Meeting the Challenges of Global Climate Change”, Alexandria, Egypt.
Agrawala, Shardul, Moehner, A., El Raey, M., Conway, D., Van Aalst, M., Hagenstad, M., and Smith, J. (2004), Development and Climate Change in Egypt, Focus on Coastal Resources and the Nile, Working Party on Global and Structural Policies, Organization for Economic Cooperation and Development, (OECD).
Alaam, M.N. (2002), Waters and Agricultural Soils in Egypt, Academic Library, Cairo, Egypt.
Allam, M. and Abdel-Azim, R. (2007), Review and Analysis of Water Use Efficiency and Water Productivity in Egypt, in Water Use Efficiency and Water Productivity, Lamaddalena, N., Shatanawi, M., Todorovic, M., Bogliott, C., and Albrizio R., eds., Proceedings of the fourth WASAMED workshop, Amman, Jordan, Option Mediterranean Series, CIHAM, B. n. 57.
Attaher, S.M. and Medany, M.A. (2008), Analysis of Crop Water Use Efficiencies in Egypt Under Climate Change, Proceedings of the first international conference on Environmental Studies and Research, “Natural Resources and Sustainable Development”, Sadat Academy of Environmental science, Minofya, Egypt.
Aziz, M.B. (2007), CO2 Abatement Linked to Increased Energy Efficiency in the Egyptian
Power Sector, Background Paper to the international study “Energy and Climate Change”, Report of the World Energy Council, London, United Kingdom.
Bouma, J.M. and Dye, C. (1997), Cycles of Malaria Associated with El Nino in Venezuela, Journal of the American Medical Association, 278:1772-1774.
Brooker, S. (2002), Schistosomes, Snails and Satellites, Acta Tropica, 82: 209–216.CAPMAS, the Central Agency for Public Mobilization and Statistics, Egypt (2001),
Agricultural Census of 1990/2000.Coastal Research Institute, Ministry of Water Resources and Irrigation, Egypt (2009),
private communication.Conway, D. (2005), From Headwater Tributaries to International River: Observing
and Adapting to Climate Variability and Change in the Nile Basin, Global Environmental Change, 15: 99-114.
122
Division of Communicable Disease Control (DCD) (2004), TB Epidemiology and Surveillance in the Region: Incidence Estimates. DCD Newsletter, 3: 6.
Earth Trends (2003), Egypt: Country Profile, Coastal and Marine Ecosystems, http://earthtrends.wri.org/pdf_library/country_profiles/coa_cou_818.pdf
Egypt Demographic Health Survey (2005).Egyptian Environmental Affairs Agency (2001), Guidelines for Solid Waste Management
in Egypt. Egyptian Environmental Affairs Agency, Environmental Status Report for 2003.Egyptian Environmental Affairs Agency, Environmental Status Report for 2004.Egyptian General Petroleum Corporation (2000), Annual Statistical Report.Eid H.M., El-Marsafawy S.M., and Ouda, S.A. (2006), Assessing the Economic Impact
of Climate Change on Agriculture in Egypt: A Ricardian Approach, CEEPA Discussion Paper No. 16. Special Series on Climate Change and Agriculture in Africa.
Eid, H. M., El-Marsafawy, S. M., Ainer, N.G., El-Mowelhi N.M. and El-Kholi, O. (1997), Vulnerability and Adaptation to Climate Change in Maize Crop, Meteorology & Environmental Cases Conference, Cairo, Egypt.
El Quosy, D. (2007), Vulnerability and Adaptation of Water Resources to Climate Change in Egypt, Second National Communication Project, UNDP-EEAA, Cairo, Egypt.
El Raey, M. (2009), Mapping Areas Affected by Sea-Level Rise Due to Climate Change in the Nile Delta Until 2100, in Hexagon Series on Human and Environmental Security and Peace (HESP), Brauch, H.G. ed., Free University of Berlin, UNU-EHS and AFES-PRESS.
El Raey, M., Fouda Y. and Gal, P. (2000), GIS for Environmental Assessment of Impacts of Urban encroachment on Rosetta Region, Egypt, Environmental Monitoring and Assessment, 60: 217-233.
El Shennawy, I. (2008) Coastal Vulnerability to Climate Changes And Adaptation Assessment for Coastal Zones of Egypt, Coastal Research Institute, Egypt.
El-Marsafawy, S.M. (2006), Impact of Climate Change on Sunflower Crop Production in Egypt, Proceedings of the 2nd International Conference on Water Resources & Arid Environment, Riyadh, Saudi Arabia.
Epstein, P. (2001), Climate Change and Emerging Infectious Diseases, Microbes and Infection, 3: 747-754.
Epstein, P. (2002), Climate Change and Infectious Disease; Stormy Weather Ahead, Epidemiology, 13: 373-375.
Fahim, M.A. (2007), Effects of the Climate Change on the Widespread and Epidemics of the Potato and Tomato Late Blight Under Egyptian Conditions, PhD Thesis, Faculty of Agriculture, Cairo University.
Fahim, M.A., Medany, M. A., Aly, H.A. and Fahim, M.M. (2007), Effects of Some Climatic Factors and Climate Change on the Epidemiology of the Potato Late Blight in Egypt, International Conference on Climate Change and its Impacts on River Deltas, Alexandria, Egypt.
FAO (2004), Fishery and Aquaculture Country Profiles, Egypt, http://www.fao.org/fishery/countrysector/FI-CP_EG/en
FAO (2006), FAOSTAT database, http://faostat.fao.org

123
Frihy, O. (2003), The Nile Delta-Alexandria Coast: Vulnerability To Sea-Level Rise, Consequences and Adaptation, Mitigation and Adaptation Strategies for Global Change 8: 115–138.
Hamdy, A. (2007), Water Use Efficiency in Irrigated Agriculture: an Analytical Review, in Water Use Efficiency and Water Productivity, Lamaddalena, N., Shatanawi, M., Todorovic, M., Bogliott, C., and Albrizio R., eds., Proceedings of the fourth WASAMED workshop, Amman, Jordan, Option Mediterranean Series, CIHAM, B. n. 57.
Hassanien, M.K. and Medany, M.A. (2007), The Impact of Climate Change on Production of Maize (Zea Mays L.), Proceedings of the International Conference on Climate Change and their Impacts on Costal Zones and River Deltas, Alexandria, Egypt.
Hegazy, A.K., Medany, M.A., Kabiel, H.F. and Meaz, M.M. (2008), Spatial and Temporal Projected Distribution of Four Crop Plants in Egypt, Natural Resources Forum, 32: 316-326.
Hindawi S. (2007), Survey on Egypt GHG Emissions, Transportation Sector, Second National Communication Project, UNDP-EEAA, Cairo, Egypt.
Hulme, M., Conway, D., Kelly, P.M., Subak, S. and Downing, T.E. (1995), The Impacts of Climate Change on Africa, SEI, Stockholm, Sweden.
INC (1999), Egypt Initial National Communication,http://unfccc.int/resource/docs/natc/egync1.pdf
International Fund for Agricultural Development (2005), Arab Republic of Egypt, Country Programme Evaluation, Report No. 1658-EG.
IPCC (1996), Good Practice Guidance and Uncertainty Management in National Greenhouse Gas Inventories, http://www.ipcc-nggip.iges.or.jp/public/gp/english/
IPCC (2000), Good Practice Guidance and Uncertainty Management in National Greenhouse Gas Inventories, http://www.ipcc-nggip.iges.or.jp/public/gp/english/
IPCC (2006), Guidelines for National Greenhouse Gas Inventories, http://www.ipcc-nggip.iges.or.jp/public/2006gl/index.htm
IPCC (2007), Climate Change 2007: Impacts, Adaptation and Vulnerability, Contribution of Working Group II to the Fourth Assessment Report of the Intergovernmental Panel on Climate Change, Cambridge University Press, Cambridge, UK.
IPCC (2007), Special Report on the Regional Impacts of Climate Change and Assessment of Vulnerability, http://www.grida.no/publications/other/ipcc_sr/?src=/climate/ipcc/regional/index.htm
IPCC (2007), New Assessment Methods and the Characterization of Future Conditions, Fourth Assessment Report.
Kadah, M.S., Medany, M.A., Hassanein, M. K. and Abou Hadid. A.F. (2008), Determining the Quantity of Emitted Methane from the Egyptian Livestock, Proceedings of the Ninth International Conference of Dryland Development, “Sustainable Development in the Drylands - Meeting the Challenges of Global Climate Change”, Alexandria, Egypt.
Kim,U., Kaluarachchi, J.J. and Smakhtin, V.U. (2008), Climate Change Impacts on Hydrology and Water Resources of the Upper Blue Nile River Basin, Ethiopia, Research Report 126, International Water Management Institute.

124
Kovats, R.S., Hajat, S. and Wilkinson, P. (2004), Contrasting Patterns of Mortality and Hospital Admissions During Hot Weather and Heat Waves in Greater London, UK, Occupational and Environmental Medicine, 61: 893-898.
Lam, L.T. (2007), The Association Between Climatic Factors and Childhood Illnesses Presented to Hospital Emergency Among Young Children, International Journal of Environmental Health Research, 17: 1–8.
Medany M.A. (2007), Survey on Egypt GHG Emissions, Agriculture Sector, Second National Communication Project, UNDP-EEAA, Cairo, Egypt.
Medany, M.A. and Hassanein, M.K. (2006), Assessment of the Impact of Climate Change and Adaptation on Potato Production, Egyptian Journal of Applied Sciences, 21: 623-638.
Medany, M.A., Attaher, S.M. And Abou-Hadid, A.F. (2009), Adaptation of Agriculture Sector in the Nile Delta Region to Climate Change at Farm Level, International Symposium of Impact of Climate Change and Adaptation in Agriculture, Vienna, Austria.
Mediterranean Environmental Technical Assistance Program (2005), Cost of Environmental Degradation.
Ministry of Agriculture and Land Reclamation, Egypt (2005), Agricultural Statistics. Ministry of Agriculture and Land Reclamation, Egypt (2009) SADS2030: Sustainable
Agricultural Development Strategy.Ministry of Agriculture and Land Reclamation, Egypt, Official Publications of 1999,
2000, and 2001.Ministry of Economic Development, Egypt (2007), Series of Basic Data of Production,
Investment, Employment and Wages, 1981-2007, http://www.mop.gov.eg/PDF/25%20years_File.pdf
Ministry of Industry and Foreign Trade, Egypt (2006), Egypt’s Industrial Development Strategy, http://www.imc-egypt.org/Img%5Cimc%5CNIDS.pdf
Ministry of Local Development, Egypt (2007), http://www.mld.gov.eg/arabic/default.htm
Ministry of Petroleum, Egypt (2000), The Environment Sector Records.Ministry of State for Environmental Affairs (2007), Environment 2007 Fact Sheet.Ministry of Trade and Industry, Egypt (2007), Official Documents of Egypt Industrial
Development Association, IDA.Ministry of Water Resources and Irrigation, Egypt, (2005), National Water Resources
Plan 2017.Osama, A. (2007), National Circumstances, Waste Sector, Second National
Communication Project, UNDP-EEAA, Cairo, Egypt.Osama, A. (2007), Survey on Egypt GHG Emissions, Waste Sector, Second National
Communication Project, UNDP-EEAA, Cairo, Egypt.Parry, D.T., Parry, E.C. and Pattison, N.S. (2004), An Online Tool for Investigating
Clinical Decision Making, Medical Informatics and the Internet in Medicine, 29: 75-85.
Sayed, M.A.-A. (2004), Impacts of Climate Change on the Nile Flows, Ain Shams University, Cairo, Egypt.
Spalding, M.D., Ravilious, C. and Green, E.P. (2001), World Atlas of Coral Reefs, UNEP World Conservation Monitoring Centre, University of California Press, Berkeley, USA.
125
Strezpek, K.M., Yates, D.N. and El Quosy, D.E.D. (1996), Vulnerability Assessment of Water Resources in Egypt to Climate Change in the Nile Basin, Climate Research, 6: 89–95.
Strezpek, K.M., Yates, D.N.,Yohe, G. Tol, R.J.S. and Mader, N. (2001), Constructing “Not implausible” Climate and Economic Scenarios for Egypt, Integrated Assessment 2,139-157, Integrated Assessment Society.
Tabbin Institute for Metallurgical Studies, Egypt (2005), Technology Profile & Market Analysis for Reduction of Nitrous Oxide (N2O) at Egyptian Fertilizers Facilities, CD4CDM Project, UNEP-RISOE.
The Central Laboratory for Agriculture Climate, Egypt, Official Publications for 2002.The International Livestock Research Institute, The Energy & Resources Institute and
The African Centre for Technology Studies (2006), Mapping Climate Vulnerability, Report to the Department for International Development, United Kingdom.
The World Bank (2005), Arab Republic of Egypt Country Environmental Analysis (1992-2002).
U.S. Global Change Research Program, 2001, http://clinton3.nara.gov/CEQ/usgcrp.htmlUNEP (2005), Facing the Facts: Assessing the Vulnerability of Africa’s Water Resources
to Environmental Change.WHO (2005), The Way Forward: Annual Report 2004, Regional Office for the Eastern
Mediterranean, document WHO-EM/CDC/004/E/03.05/2000.WHO (2007), Strategic Plan for Malaria Control and Elimination in the WHO Eastern
Mediterranean Region 2006–2010, document WHO-EM/MAL/340/E/02.07/1000.WHO (2009), Global Environmental Change, http://www.who.int/globalchange/
climate/en/World Bank (2005), Arab Republic of Egypt Country Environmental Analysis (1992-
2002).World Bank (2007), A Twelve Year Record of National and Global Gas Flaring Volumes
Estimated Using Satellite Data.World Bank (2007), Assessing the Impact of Climate on Crop Water Needs in Egypt,
Global Environment Facility, Policy Research Working Paper, WPS4293.World Bank (2008), Country Classification, http://web.worldbank.org/WBSITE/
EXTERNAL/DATASTATISTICS/0,,contentMDK:20420458~menuPK:64133156~pagePK:64133150~piPK:64133175~theSitePK:239419,00.html
World Resources Institute (2007), http://www.wri.orgWorld Resources Institute (2009), Climate Analysis Indicators Tool (CAIT) version
6.0.

127
List of ContributorsThe publication of the Second National Communication of Egypt under the
UNFCCC was supervised by a Steering Committee headed by Professor Mostafa Kamal Tolba, Former Executive Director, United Nations Environment Programme, in collaboration with the following distinguished contributors (in alphabetical order):
Abdel latif Mehanna Former General Director, Egyptian Meteorology Authority
Adel Yasin Former Dean of Environment Institute, Ain Shams University
Adham Ramadan Associate Professor of Chemistry, American University in Cairo
Ahmed El-Kholy Professor of Urban Planning, Faculty of Engineering, Menofya University
Ali Esherbeny Former Director, Central Laboratory for Agricultural Climate
Amal Saad El-din Professor of Environmental Health & Preventive Medicine, National Research Centre
Amr Osama President, Integral & Environmental Expert
Ayman Abou Hadid President, Agricultural Research Center
Bahaa El-Din Mansour Emeritus Professor, Tabbin Institute for Metallurgical Studies
Bayoumi Attia Advisor to the Ministry of Water Resources and Irrigation
Diaa El-Din El-Quosy Former Deputy Chairman of the National Water Research Center
El-Sayed Sabry Supervisor of Climate Change Central Department, Egyptian Environmental Affairs Agency
Emad El-Sharkawi Late Member ,Steering Committee, World Energy Council
Essam Hassan Consultant, Climate Change Central Department, Egyptian Environmental Affairs Agency
Gamal El-Din Khalifa Former Director, Tabbin Institute for Metallurgical Studies
Hindawi Saleh Professor, Mechanical Power Department, Faculty of Engineering, Cairo University
128
Ibrahim El-Shinnawy Director of Coastal Research Institute, National Research Center, Alexandria
Madeha Khatab Professor of Internal Medicine, Faculty of Medicine, Cairo University
Magdy Rabie Professor , Urban Planning and Management, Cairo University
Maher Aziz Head of Environmental Studies, Egypt Electricity Holding Company
Mahmoud Medany Former Director, Central Laboratory for Agriculture Climate; Chief Researcher, Agricultural Research Center
Manal El-Batran Professor of Urban Planning, Housing and Building National Research Institute
Mawaheb Abu El-Azm Chief Executive Officer, Egyptian Environmental Affairs Agency
Mohamed El-Raey Professor of Environmental Physics and Former Dean of Institute of Graduate Studies and Research, University of Alexandria
Mohamed Bayomi Assistant Resident Representative, UNDP Egypt
Mohamed El-Shahawy Late Professor of Meteorology, Faculty of Science, Cairo University
Mostafa El-Rafy Assistant Professor, Synoptic Science, Faculty of Science, Cairo University
Mounir Labib Consultant, Climate Change Central Department, Egyptian Environmental Affairs Agency
Saber Osman Vulnerability Manager, Climate Change Central Department, Egyptian Environmental Affairs Agency
Samia El-Marsafawy Head of Agro-meteorology and Climate Change Unit, Soil, Water and Environment Research Institute Agricultural Research Center
Samir Tantawi Mitigation Manager, Climate Change Central Department, Egyptian Environmental Affairs Agency
Sayed Sharaf El-Deen Former Head of Oceanology Department, Faculty of Science, University of Alexandria
Yasmine Fouad Capacity Development Project Manager (GEF/UNDP)
Related Documents