EFInA Access to Financial Services in Nigeria 2010 Survey Key Findings November 2010

Welcome message from author
This document is posted to help you gain knowledge. Please leave a comment to let me know what you think about it! Share it to your friends and learn new things together.
Transcript

"A4
rb_
sta
nd
ard
_b
an
d_p
ho
to" –
20
10
01
11
– d
o n
ot
de
lete
this
te
xt o
bje
ct!
EFInA Access to Financial Services in Nigeria 2010 Survey
Key Findings
November 2010

"A4
rb_
sta
nd
ard
_b
an
d_p
ho
to" –
20
10
01
11
– d
o n
ot
de
lete
this
te
xt o
bje
ct!
Contents Page
A. Background 3
B. Overview of Sample Demographics 6
C. Banking 11
D. Financial Access 22
E. Savings 27
F. Loans & Credit 32
G. Insurance 37
H. Remittances 41
I. Technology and Mobile Phone Usage 45
J. Financial Literacy 49
K. Trend Analysis: 2010 vs. 2008 52
L. Conclusions 58
M. Data Dissemination Options 61

"A4
rb_
sta
nd
ard
_b
an
d_p
ho
to" –
20
10
01
11
– d
o n
ot
de
lete
this
te
xt o
bje
ct!
A. Background

"A4
rb_
sta
nd
ard
_b
an
d_p
ho
to" –
20
10
01
11
– d
o n
ot
de
lete
this
te
xt o
bje
ct!
4
Key Objectives
The broad objective of the EFInA Access to Financial Services survey is to generate relevant and reliable data on the demand for and usage of a range of financial products (both formal and informal) by the adult population in Nigeria. The survey aims to:
Provide credible data that can support evidence based financial inclusion policies and highlight opportunities for policy reform
Establish credible benchmarks and indicators of financial penetration in Nigeria
Document usage of financial products across both formal and informal sectors
Provide a comparison of access to financial services in Nigeria from 2008 to 2010
Provide insights into regulatory and market obstacles to growth and innovation in the financial sector
Identify the financial needs of the adult population and thereby give service providers the opportunity to develop innovative products to serve them
Analyse the market potential of the low income segment

"A4
rb_
sta
nd
ard
_b
an
d_p
ho
to" –
20
10
01
11
– d
o n
ot
de
lete
this
te
xt o
bje
ct!
5
Nationally representative sample of Nigerian adults (18+) across all 36 states plus FCT Abuja
Target sample selection involved three stages. The first was at the Enumeration Area (EA) level with a sample of 1,200 EAs, the second was at Household (HH) level with a sample of 20 HHs in each EA and the third was at Individual level with 1 individual sampled in each HH
Target sample size = 24,000; Total Achieved = 22,569 (Response rate = 94%)
Results were weighted at the three levels to provide the total adult population. This was also benchmarked to National population estimates for verification
Sample design, household listing and weighting conducted by the National Bureau of Statistics (NBS)
Fieldwork was conducted from July to August 2010 by Research & Marketing Services
The survey is based on the FinScope Methodology
The questionnaire was translated into Hausa, Yoruba, Igbo and Pidgin English
Sampling of questionnaires was based on proportional representation (i.e. population size) per State as follows:
Coverage and Methodology
No of questionnaires Population per State
400 Population < 3 m
600 Population ≥ 3 m but < 4 m
800 Population ≥ 4 m but < 5 m
1,000 Population ≥ 5 m but < 7 m
1,200 Population ≥ 7 m
"A4
rb_
sta
nd
ard
_b
an
d_p
ho
to" –
20
10
01
11
– d
o n
ot
de
lete
this
te
xt o
bje
ct!
B. Overview of Sample Demographics

"A4
rb_
sta
nd
ard
_b
an
d_p
ho
to" –
20
10
01
11
– d
o n
ot
de
lete
this
te
xt o
bje
ct!
7 7
Demographic Profile of the Adult Population
North Central
North East
North West
19%
14%
Female
Urban
South West
13%
Male
49%
South South
10%
22%
51%
South East
22%
Rural
30%
70%
25%
28%
19%
14%
9%
6%
No formal education
Some primary/primary completed
Some secondary/secondary completed
Some University/Polytechnic
Vocational/technical/Islamic College
18-24
25-34
35-44
45-54
55-64
65+
21%
20%
41%
17%
1%
Geopolitical zone
Gender
Metropolitan area
Level of education
Age
The total adult population (18 years and above) is 84.7 million
70% of the adult population live in rural areas while 30% live in urban areas
51% are male and 49% are female
Source: EFInA Access to Financial Services in Nigeria 2010 survey

"A4
rb_
sta
nd
ard
_b
an
d_p
ho
to" –
20
10
01
11
– d
o n
ot
de
lete
this
te
xt o
bje
ct!
8
Main Source of Income
Return on investments
13.5%
Subsistence/small scale farming
Own business (non farming)
Rent
Trading of goods and services (non farming)
12.6%
17.9%
1.1%
Commercial/large scale farming
Family/friends
0.5%
5.3%
0.4%
Pensions
6.6%
Salaries/wages
23.1%
18.7%
The main source of income for 19.5 million adults is from their own business
15.2 million adults get their income from family/friends
10.7 million adults are salaried
No Response
Source: EFInA Access to Financial Services in Nigeria 2010 survey
"A4
rb_
sta
nd
ard
_b
an
d_p
ho
to" –
20
10
01
11
– d
o n
ot
de
lete
this
te
xt o
bje
ct!
9
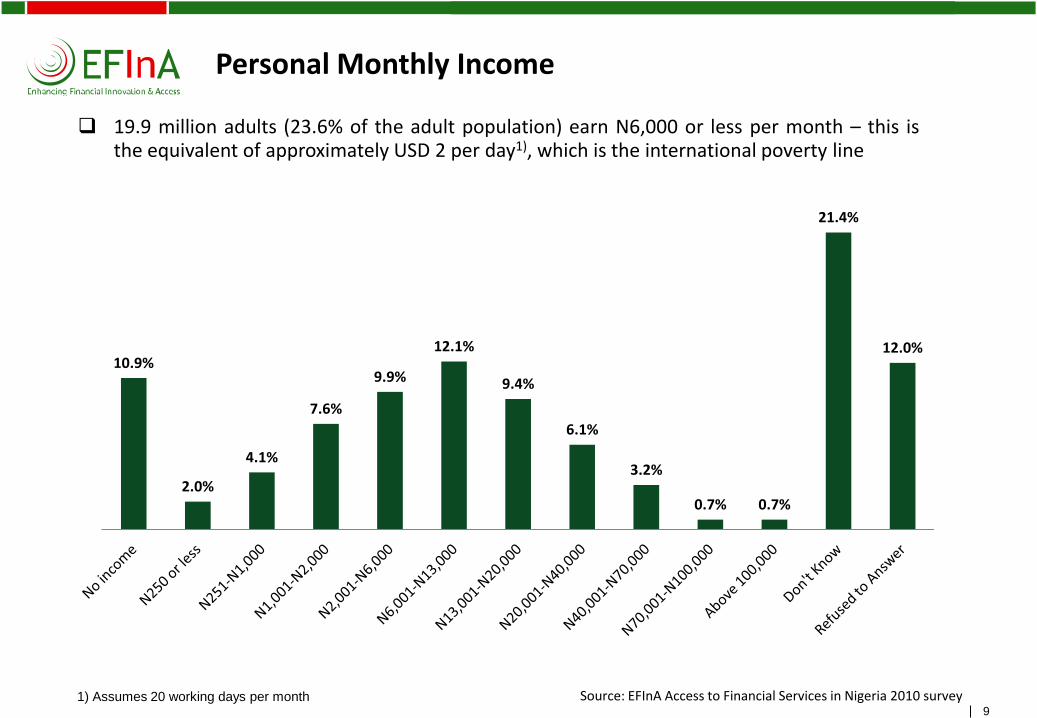
Personal Monthly Income
19.9 million adults (23.6% of the adult population) earn N6,000 or less per month – this is the equivalent of approximately USD 2 per day1), which is the international poverty line
1) Assumes 20 working days per month
10.9%
2.0%
4.1%
7.6%
9.9%
12.1%
9.4%
6.1%
3.2%
0.7% 0.7%
21.4%
12.0%
Source: EFInA Access to Financial Services in Nigeria 2010 survey
"A4
rb_
sta
nd
ard
_b
an
d_p
ho
to" –
20
10
01
11
– d
o n
ot
de
lete
this
te
xt o
bje
ct!
10
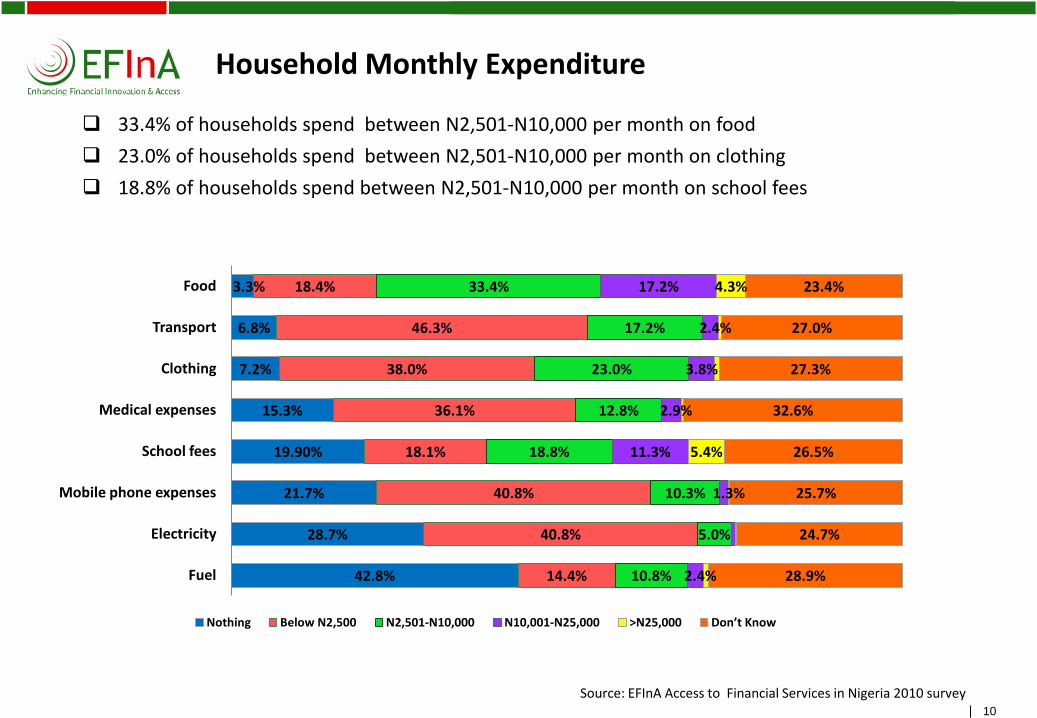
Household Monthly Expenditure
33.4% of households spend between N2,501-N10,000 per month on food
23.0% of households spend between N2,501-N10,000 per month on clothing
18.8% of households spend between N2,501-N10,000 per month on school fees
42.8%
28.7%
21.7%
19.90%
15.3%
7.2%
6.8%
3.3%
14.4%
40.8%
40.8%
18.1%
36.1%
38.0%
46.3%
18.4%
10.8%
5.0%
10.3%
18.8%
12.8%
23.0%
17.2%
33.4%
2.4%
1.3%
11.3%
2.9%
3.8%
2.4%
17.2%
5.4%
4.3%
28.9%
24.7%
25.7%
26.5%
32.6%
27.3%
27.0%
23.4%
Fuel
Electricity
Mobile phone expenses
School fees
Medical expenses
Clothing
Transport
Food
Nothing Below N2,500 N2,501-N10,000 N10,001-N25,000 >N25,000 Don’t Know
Source: EFInA Access to Financial Services in Nigeria 2010 survey

"A4
rb_
sta
nd
ard
_b
an
d_p
ho
to" –
20
10
01
11
– d
o n
ot
de
lete
this
te
xt o
bje
ct!
C. Banking

"A4
rb_
sta
nd
ard
_b
an
d_p
ho
to" –
20
10
01
11
– d
o n
ot
de
lete
this
te
xt o
bje
ct!
12
Banking Profile of the Adult Population
Only 30.0% of the adult population currently has a bank account, which is equivalent to 25.4 million people
67.2% of the adult population have never been banked, which is equivalent to 56.9 million people
2.8% of the adult population are previously banked, which is equivalent to 2.4 million people
Banked definition: Currently have access to or use a deposit money bank, in addition to having/using any of these products: ATM card, credit card, savings account, current account, fixed deposit account, mortgage, overdraft, loan, or Islamic banking product
63.5% of adult males are unbanked 76.8% of adult females are unbanked 78.8% of the rural population is unbanked
Never Banked
67.2%
Source: EFInA Access to Financial Services in Nigeria 2010 survey
Currently Banked
Previously Banked
30.0%
2.8%

"A4
rb_
sta
nd
ard
_b
an
d_p
ho
to" –
20
10
01
11
– d
o n
ot
de
lete
this
te
xt o
bje
ct!
13
Current Usage of Banking Products
Savings Account
ATM Card
Current Account
93.0%
62.6%
4.9%
25.5%
3.9%
2.4%
1.1%
0.7%
Fixed Deposit Account
Prepaid/Cash Card
Credit Card
Overdraft
Mortgage
Islamic Products
Of the 25.4 million adults who are banked – 23.6 million have savings accounts, 15.9 million have ATM cards and 6.5 million adults have current accounts
Of those that have savings accounts, 2.2 million of them opened it because of a savings promotion
0.4%
Of those who have it now and use it
Source: EFInA Access to Financial Services in Nigeria 2010 survey

"A4
rb_
sta
nd
ard
_b
an
d_p
ho
to" –
20
10
01
11
– d
o n
ot
de
lete
this
te
xt o
bje
ct!
14
Deposit Money Banks Used Most Often
Zenith
3.5% 2.0%
Diamond
4.4% 3.1%
Bank PHB
5.1% 3.6%
Skye
5.7%
3.9%
GT Bank
6.6%
UnionBank
9.2%
6.5%
Intercon- tinental
13.7%
9.9%
Oceanic
14.5%
11.6%
First Bank
23.4%
19.2%
UBA
26.6%
20.8%
Currently use Main bank
UBA and First Bank are the top two currently used and main banks
12.7 million adults currently use UBA and First Bank
8.3%
Source: EFInA Access to Financial Services in Nigeria 2010 survey

"A4
rb_
sta
nd
ard
_b
an
d_p
ho
to" –
20
10
01
11
– d
o n
ot
de
lete
this
te
xt o
bje
ct!
15
Penetration of Banking Products
12.7%
Bank PHB
UBA
Union Bank
5.0% Skye
Oceanic
First Bank
25.4%
Zenith
7.4%
GT Bank
21.2%
Diamond
8.7%
Intercontinental
13.2%
4.4%
4.0%
2.5% Zenith 2.9%
Union Bank 4.9%
Bank PHB 5.1%
Diamond 5.1%
Skye 5.9%
GT Bank 11.4%
Intercontinental 15.6%
Oceanic 15.9%
First Bank 19.2%
UBA 25.5%
Afribank 4.0%
Skye 4.3%
Zenith 4.4%
Bank PHB 5.1%
GT Bank 6.8%
Union Bank 8.4%
Intercontinental 9.5%
Oceanic 12.5%
UBA 19.3%
First Bank 23.2%
SAVINGS ACCOUNTS ATM CARDS
CURRENT ACCOUNTS
UBA is the top bank for customers with Savings accounts and ATM cards
First Bank is the top bank for customers with Current accounts
Of those who have it now and use it
Source: EFInA Access to Financial Services in Nigeria 2010 survey

"A4
rb_
sta
nd
ard
_b
an
d_p
ho
to" –
20
10
01
11
– d
o n
ot
de
lete
this
te
xt o
bje
ct!
16
Reasons for Choice of Main Bank
Interest rates
19.2%
Staff attitude
19.3%
Knowledge- able staff
21.2%
Security for
safe- keeping
21.7%
Bank location
36.4%
Bank reputation
36.9%
Bank stability
45.3%
Of those that are currently banked:
The most important criteria for the selection of a main bank is stability
36.9% of the adult population chose their main bank because of its reputation and 36.4% because of its location
Source: EFInA Access to Financial Services in Nigeria 2010 survey

"A4
rb_
sta
nd
ard
_b
an
d_p
ho
to" –
20
10
01
11
– d
o n
ot
de
lete
this
te
xt o
bje
ct!
17
Reasons for Not Having a Bank Account
The main barriers to having a bank account are irregular income, unemployment and distance to the bank branch
Bank proximity is of greater concern to the rural population
URBAN
5.8%
9.7%
13.2%
13.7%
47.5%
Too much documentation
Lack of trust
Expensive
Transport costs
Illiterate
Too far
Unemployed
Irregular income
TOTAL
8.5%
10.2%
10.9%
33.4%
46.7%
RURAL
8.2%
9.6%
15.0%
15.5%
33.6%
Source: EFInA Access to Financial Services in Nigeria 2010 survey
33.6%
27.2%
8.3%
7.3%
6.9%
7.8%
47.7%
31.7%
5.2%

"A4
rb_
sta
nd
ard
_b
an
d_p
ho
to" –
20
10
01
11
– d
o n
ot
de
lete
this
te
xt o
bje
ct!
18
What Would Encourage the Unbanked to Open a Bank Account
42.4 million adults which represents 74.0% of the unbanked population would like a bank account
The factors which would most likely encourage the unbanked to open a bank account are being employed, having a bank closer to residence/work and understanding the benefits of being banked
Bank proximity is of greater concern to the rural population
URBAN TOTAL RURAL
28.5%
41.8%
5.2%
14.7%
Source: EFInA Access to Financial Services in Nigeria 2010 survey
Being employed
Banks closer to Residence/work
When benefits are understood
Sufficient income
Nothing
30.9%
14.3%
6.8%
13.4%
29.4%
35.4%
41.9%
17.9%
25.3%
41.5%
7.3%
"A4
rb_
sta
nd
ard
_b
an
d_p
ho
to" –
20
10
01
11
– d
o n
ot
de
lete
this
te
xt o
bje
ct!
19
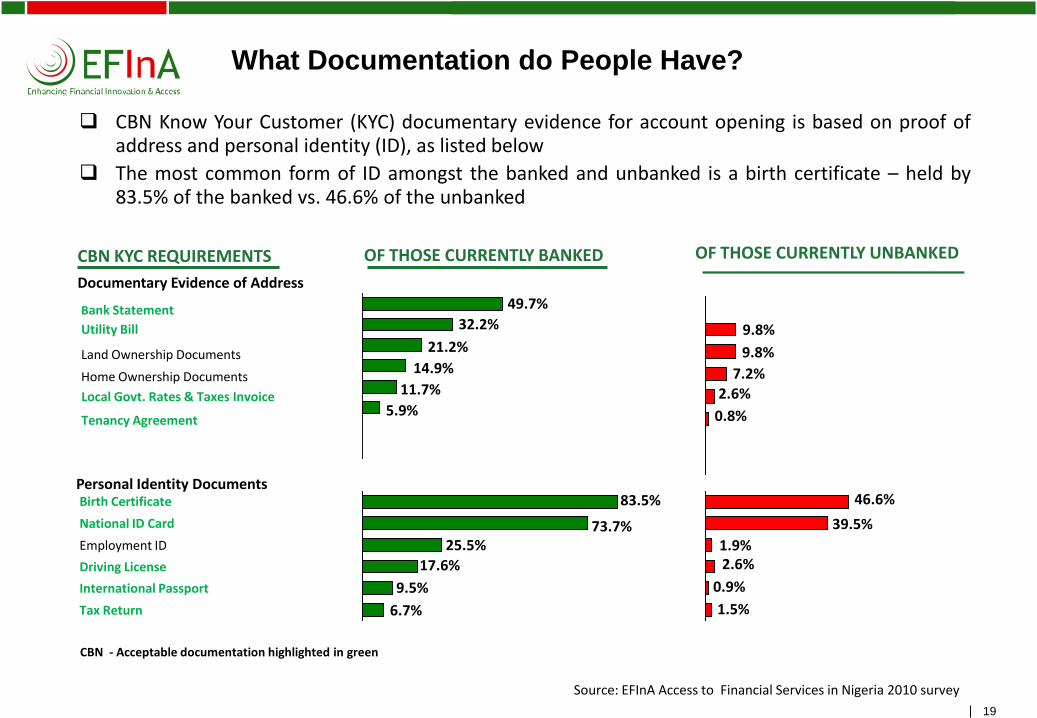
What Documentation do People Have?
CBN Know Your Customer (KYC) documentary evidence for account opening is based on proof of address and personal identity (ID), as listed below
The most common form of ID amongst the banked and unbanked is a birth certificate – held by 83.5% of the banked vs. 46.6% of the unbanked
CBN - Acceptable documentation highlighted in green
CBN KYC REQUIREMENTS
Personal Identity Documents
Documentary Evidence of Address
17.6%
National ID Card 73.7%
Birth Certificate
Tax Return
Driving License
25.5% Employment ID
International Passport
83.5%
Utility Bill 32.2%
Land Ownership Documents 21.2%
Bank Statement 49.7%
Home Ownership Documents 14.9%
OF THOSE CURRENTLY BANKED OF THOSE CURRENTLY UNBANKED
11.7%
5.9% Local Govt. Rates & Taxes Invoice
Tenancy Agreement
9.5%
6.7%
9.8%
9.8%
7.2% 2.6%
0.8%
2.6%
39.5%
1.9%
46.6%
0.9%
1.5%
Source: EFInA Access to Financial Services in Nigeria 2010 survey

"A4
rb_
sta
nd
ard
_b
an
d_p
ho
to" –
20
10
01
11
– d
o n
ot
de
lete
this
te
xt o
bje
ct!
20
Microfinance Banks (MFBs)
ATM Card
4.2%
Loans 13.7%
Savings Account
65.2%
3.2 million people (3.8% of the adult population) have a Microfinance bank account, of which 57.9% are male and 42.1% are female
1.8 million people (2.1% of the adult population) use their MFB account as their main bank account
The most commonly used MFB product is a savings account
USAGE OF MFB PRODUCTS
Source: EFInA Access to Financial Services in Nigeria 2010 survey

"A4
rb_
sta
nd
ard
_b
an
d_p
ho
to" –
20
10
01
11
– d
o n
ot
de
lete
this
te
xt o
bje
ct!
21
What Would Encourage People to Open a Microfinance Bank Account
Of the 81.5 million adults (96.2% of the adult population) that do not currently have a microfinance bank account:
33.9 million adults (representing 41.6% of them) would like to open a microfinance bank account
The main factors that would encourage them to open a microfinance bank account are understanding how microfinance banks work and how they would meet their needs
31.1%
0.5%
3.1%
7.5%
8.6%
14.8%
18.9%
23.8%
29.4%
Nothing
Being employed
MFB closer to residence/work
Stable/sufficient income
When better loans are on offer
When MFBs are trusted
When benefits are understood
When MFBs meet my needs
When I understand how they work
Source: EFInA Access to Financial Services in Nigeria 2010 survey
25.3 million adults (31.1% of those who do not currently have a microfinance bank account) said nothing will encourage them to open a microfinance bank account
Of those who do not currently have a microfinance bank account

"A4
rb_
sta
nd
ard
_b
an
d_p
ho
to" –
20
10
01
11
– d
o n
ot
de
lete
this
te
xt o
bje
ct!
D. Financial Access

"A4
rb_
sta
nd
ard
_b
an
d_p
ho
to" –
20
10
01
11
– d
o n
ot
de
lete
this
te
xt o
bje
ct!
23
Financial Access Strand
Banked Formal Other Informal Only Excluded
30.0% 6.3% 17.4% 46.3%
36.3% Formally included
53.7% Financially served 46.3% Financially excluded
25.4 m 39.2 m 14.8 m 5.3 m
DEFINITION OF FINANCIAL ACCESS Banked: all adults who have access to or use a deposit money bank, in addition to having/using a traditional banking product,
including ATM card, credit card, savings account, current account, fixed deposit account, mortgage, overdraft, loan from a bank, or Islamic banking product
Formal Other: all adults who have access to or use other formal institutions and financial products not supplied by deposit money banks, including Insurance companies, microfinance banks, pension schemes or shares. It also includes remittances (through formal channels)
Informal Only: all adults who do not have any banked or formal other products, but have access to or use only informal services and products. This includes savings clubs/pools, esusu, ajo, or moneylenders; as well as remittances (through informal channels such as via a transport service or recharge card)
Financially Excluded: adults not in the banked, formal other or informal only categories, even though the person may be using or have access to any of the following: loan/gift from friends or family and loan from employers, as well as remittances via a friend/family member
30.7 million adults are formally included 39.2 million adults are financially excluded
These four strands are mutually exclusive
Source: EFInA Access to Financial Services in Nigeria 2010 survey
30.0% 6.3% 17.4% 46.3%

"A4
rb_
sta
nd
ard
_b
an
d_p
ho
to" –
20
10
01
11
– d
o n
ot
de
lete
this
te
xt o
bje
ct!
24
Financial Access Strand
Adult Population
84.7 m
Financially Served 45.5 m
Financially Excluded 39.2 m
Formally Included 30.7 m
Informal Only 14.8 m
Banked 25.4 m
Formal Other 5.3 m
53.7%
46.3%
36.3%
17.4%
30.0%
6.3%
45.5 million adults are financially served, with access to formal or informal financial services 39.2 million adults are financially excluded with no access to either formal or informal financial
services
Source: EFInA Access to Financial Services in Nigeria 2010 survey
"A4
rb_
sta
nd
ard
_b
an
d_p
ho
to" –
20
10
01
11
– d
o n
ot
de
lete
this
te
xt o
bje
ct!
25
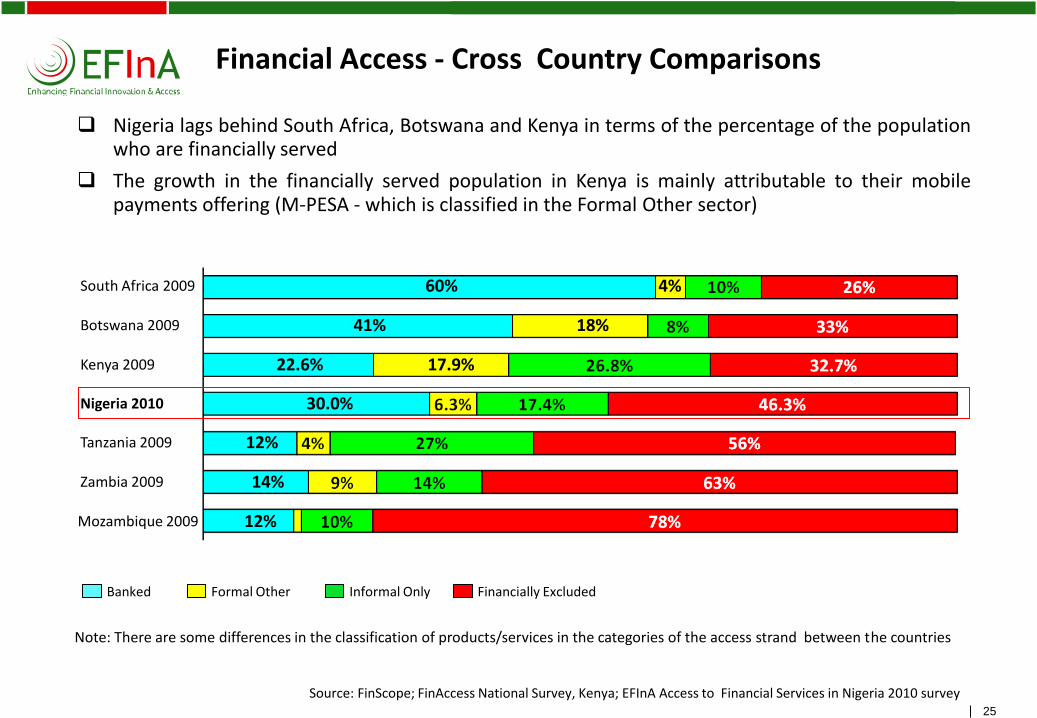
Financial Access - Cross Country Comparisons
Mozambique 2009 12%
Zambia 2009 14%
Tanzania 2009 12%
Nigeria 2010 30.0%
Kenya 2009 22.6% 17.9%
Botswana 2009 41% 18%
South Africa 2009 60% 4%
Financially Excluded Informal Only Formal Other Banked
Note: There are some differences in the classification of products/services in the categories of the access strand between the countries
Nigeria lags behind South Africa, Botswana and Kenya in terms of the percentage of the population who are financially served
The growth in the financially served population in Kenya is mainly attributable to their mobile payments offering (M-PESA - which is classified in the Formal Other sector)
Source: FinScope; FinAccess National Survey, Kenya; EFInA Access to Financial Services in Nigeria 2010 survey

"A4
rb_
sta
nd
ard
_b
an
d_p
ho
to" –
20
10
01
11
– d
o n
ot
de
lete
this
te
xt o
bje
ct!
26
Financial Access in Nigeria
Banked
Formal Other
Informal
7% 4% 13%
2%
8%
17%
2%
This diagram provides information on overlapping usage of financial products/services:
11.0 million people (13% of the adult population) use products/services from both deposit money banks and "formal other" institutions
6.8 million people (8% of the adult population) use products/services from deposit money banks, "formal other" institutions and informal providers
1.7 million people (2% of the adult population) use products/services from both deposit money banks and informal providers
Source: EFInA Access to Financial Services in Nigeria 2010 survey

"A4
rb_
sta
nd
ard
_b
an
d_p
ho
to" –
20
10
01
11
– d
o n
ot
de
lete
this
te
xt o
bje
ct!
E. Savings

"A4
rb_
sta
nd
ard
_b
an
d_p
ho
to" –
20
10
01
11
– d
o n
ot
de
lete
this
te
xt o
bje
ct!
28
Population Who are Currently Saving Money
52.8 million adults (62.3%) are currently saving of which:
28.5 million men (65.7% of the adult male population) and 24.3 million women (58.8% of the adult female population) are currently saving
17.7 million adults (68.6% of the urban population) and 35.1 million adults (59.6% of the rural population) are currently saving
22.0 million adults (86.6% of the banked population) and 30.8 million adults (51.9% of the unbanked population) are currently saving
51.9%
86.6%
59.6%
68.6%
58.8%
65.7%
Unbanked
Banked
Rural
Urban
Female
Male
Source: EFInA Access to Financial Services in Nigeria 2010 survey

"A4
rb_
sta
nd
ard
_b
an
d_p
ho
to" –
20
10
01
11
– d
o n
ot
de
lete
this
te
xt o
bje
ct!
29
Reasons for Saving
Emergencies
Day-to-day ordinary household needs
School fees
40.5 m
20.9 m
15.1 m
12.1 m
10.7 m
8.9 m
7.9 m
7.6m
6.5 m
Personal needs
Expand business
Old age
Medical expenses
Home improvements
Start a business
The top two reasons for saving are:
For emergencies and for day-to-day household needs
Of those that are currently saving (no. of adults in millions)
Source: EFInA Access to Financial Services in Nigeria 2010 survey

"A4
rb_
sta
nd
ard
_b
an
d_p
ho
to" –
20
10
01
11
– d
o n
ot
de
lete
this
te
xt o
bje
ct!
30
Where People Currently Save
Of the 52.8 million savers:
23.8 million adults are currently saving at home
20.5 million adults are currently saving in a bank
23.8 m
Informal Bank Home
51.7%
20.5 m
62.7%
12.9m
51.8% 48.3%
37.3%
48.2%
Friends/Relatives Village Associations MFB
6.0 m
51.9% 48.1%
6.7 m
48.4% 51.6%
1.7m
57.0%
43.0%
Total Male Female
Source: EFInA Access to Financial Services in Nigeria 2010 survey
"A4
rb_
sta
nd
ard
_b
an
d_p
ho
to" –
20
10
01
11
– d
o n
ot
de
lete
this
te
xt o
bje
ct!
31
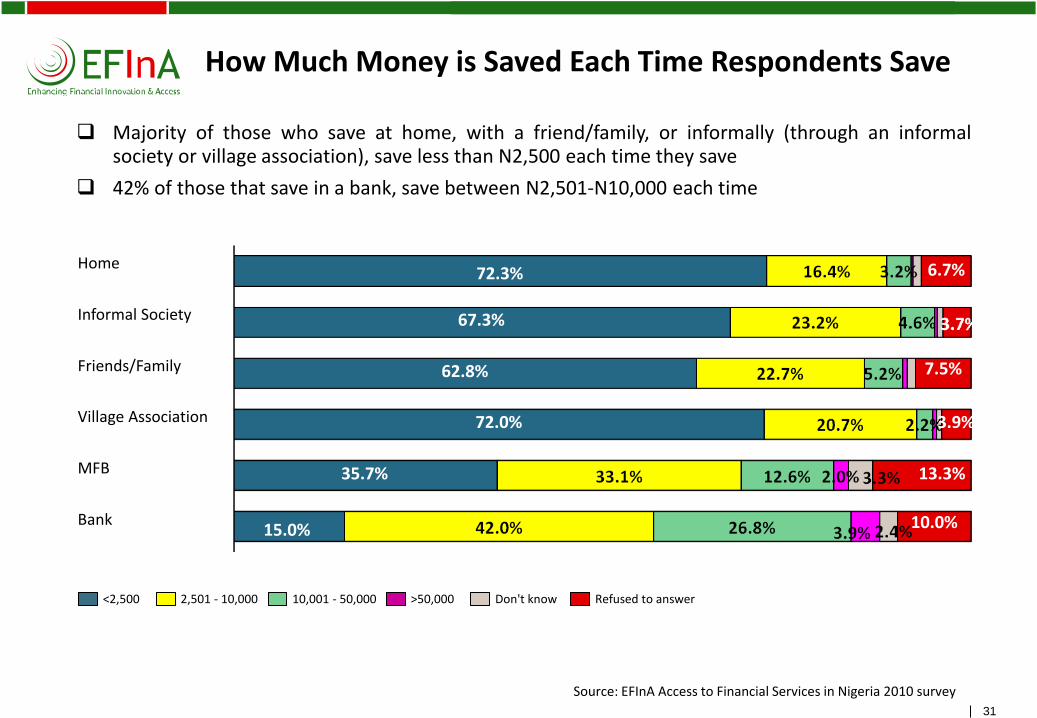
How Much Money is Saved Each Time Respondents Save
Bank 15.0% 10.0%
MFB 35.7% 13.3%
Village Association 72.0% 3.9%
Friends/Family 62.8% 7.5%
Informal Society 67.3%
Home 72.3% 6.7%
>50,000 10,001 - 50,000 Don't know Refused to answer 2,501 - 10,000 <2,500
Majority of those who save at home, with a friend/family, or informally (through an informal society or village association), save less than N2,500 each time they save
42% of those that save in a bank, save between N2,501-N10,000 each time
Source: EFInA Access to Financial Services in Nigeria 2010 survey

"A4
rb_
sta
nd
ard
_b
an
d_p
ho
to" –
20
10
01
11
– d
o n
ot
de
lete
this
te
xt o
bje
ct!
F. Loans & Credit

"A4
rb_
sta
nd
ard
_b
an
d_p
ho
to" –
20
10
01
11
– d
o n
ot
de
lete
this
te
xt o
bje
ct!
33
Reasons for Taking a Loan
Travel 0.5 m
Pay off debts 0.7 m
Buy household goods 0.8 m
Medical expenses 1.3 m
Education 1.3 m
Buy fertilizer/livestock/seeds 1.7m
Buy food/clothing 2.2 m
Start/expand a business 2.7 m
8.2 million people (9.7% of the adult population) currently have a loan
The top two reasons for taking a loan are to start/expand a business and to buy food/clothing
Of those that currently have a loan (no. of adults in millions)
Source: EFInA Access to Financial Services in Nigeria 2010 survey

"A4
rb_
sta
nd
ard
_b
an
d_p
ho
to" –
20
10
01
11
– d
o n
ot
de
lete
this
te
xt o
bje
ct!
34
Sources of Loans
Of the 8.2 million adults that currently have a loan:
5.8 million adults (71.0%) have a personal loan from a family/friend
2.0 million adults (24.4%) have a personal loan from informal societies/savings clubs/cooperatives
1.5 million adults (18.8%) have a loan from a formal institution
0.7%
0.7%
0.8%
0.9%
2.1%
3.8%
18.8%
24.4%
71.0%
Mortgage from a formal institution
Overdraft from a formal institution
Personal loan from employer
Mortgage from family/friend
Personal loan from government
Personal loan from a money lender
Personal loan from a formal institution
Personal loan from informal societies/savings clubs/cooperatives
Personal loan from family/friend
Of those that currently have a loan
Source: EFInA Access to Financial Services in Nigeria 2010 survey

"A4
rb_
sta
nd
ard
_b
an
d_p
ho
to" –
20
10
01
11
– d
o n
ot
de
lete
this
te
xt o
bje
ct!
35
Factors Considered When Deciding to Apply for a Loan
Of the 8.2 million adults that currently have a loan:
4.0 million (48.7%) of them said "getting the money as soon as possible“ was the most important factor when deciding to apply for a loan
Other important factors include repayment period (34.6%) and low interest rates (22.2%)
5.1%
11.2%
18.0%
20.3%
22.2%
34.6%
48.7%
Quality of service provided
Affordable monthly instalments
No collateral
Flexibility of repayments
Low interest rate
Repayment period
Getting the money as soon as possible
Of those that currently have a loan
Source: EFInA Access to Financial Services in Nigeria 2010 survey

"A4
rb_
sta
nd
ard
_b
an
d_p
ho
to" –
20
10
01
11
– d
o n
ot
de
lete
this
te
xt o
bje
ct!
36
Sources of Credit
In the past 12 months, 20.4 million adults have bought goods & services on credit, of which:
11.8 million adults (58.0%) obtained credit from a market trader
11.7 million adults (57.3%) obtained credit from a provision shop
1.1%
4.7%
8.9%
11.3%
14.3%
57.3%
58.0%
Credit from a leasing company
Credit from a mechanic
Credit from a boutique
Credit from a pharmacy
Credit from a tailor
Credit from a provision shop
Credit from a market trader
Of those that have obtained credit
Source: EFInA Access to Financial Services in Nigeria 2010 survey

"A4
rb_
sta
nd
ard
_b
an
d_p
ho
to" –
20
10
01
11
– d
o n
ot
de
lete
this
te
xt o
bje
ct!
G. Insurance

"A4
rb_
sta
nd
ard
_b
an
d_p
ho
to" –
20
10
01
11
– d
o n
ot
de
lete
this
te
xt o
bje
ct!
38
Penetration of Insurance Products
Only 1.0% (0.8 million) of the adult population has insurance
0.5 million adults (58.8%) have motor vehicle insurance (which is compulsory)
10.0%
3.1%
5.2%
7.1%
7.2%
21.6%
58.8%
Others
Credit /Loan Protection
Education plan
Medical
Building
Life
Motor Vehicle
Of those that currently have insurance
Source: EFInA Access to Financial Services in Nigeria 2010 survey

"A4
rb_
sta
nd
ard
_b
an
d_p
ho
to" –
20
10
01
11
– d
o n
ot
de
lete
this
te
xt o
bje
ct!
39
Experience of Household Risks and Coping Mechanisms
The top mechanisms for dealing with adverse experiences - are doing nothing and using one’s savings
Risks Experienced Used insurance policy
Used own savings
Did Nothing
Top Coping Mechanisms
31.2%
26.2%
60.4%
26.6%
56.8%
13.6%
49.7%
41.0%
15.9%
49.0%
0.2%
0.2%
0.6%
0.2%
0.2%
0.2%
0.2%
0.3%
Source: EFInA Access to Financial Services in Nigeria 2010 survey
9.8%
9.1%
Death of a relative
Serious illness
Theft of household property
Failure of business
Theft of agricultural crop/livestock
Vehicle accident
Agricultural crop/livestock destroyed by fire
Fire in the household
52.1%
50.1%
21.2%
18.7%
18.6%
5.8%
24.4%
34.5%
44.8%
22.9%
18.6%
19.2%

"A4
rb_
sta
nd
ard
_b
an
d_p
ho
to" –
20
10
01
11
– d
o n
ot
de
lete
this
te
xt o
bje
ct!
40
Reasons for Not Having Insurance
No belief in insurance
Cannot afford to pay for insurance
Don’t know where to get one
Not enlightened about it
31.6%
Providers are cheats and don’t settle claims
34.3%
5.1%
10.6%
6.1%
Don’t know the benefits of having one
36.0%
Of the 83.9 million adults that do not have insurance, the reasons cited were:
Do not know the benefits of having insurance – 30.2 million
Cannot afford it – 28.8 million
Do not believe in insurance – 26.5 million
Source: EFInA Access to Financial Services in Nigeria 2010 survey
"A4
rb_
sta
nd
ard
_b
an
d_p
ho
to" –
20
10
01
11
– d
o n
ot
de
lete
this
te
xt o
bje
ct!
H. Remittances

"A4
rb_
sta
nd
ard
_b
an
d_p
ho
to" –
20
10
01
11
– d
o n
ot
de
lete
this
te
xt o
bje
ct!
42
Remittances
In the six months prior to being interviewed:
30.8 million adults (36.4% of the adult population) received remittances from within Nigeria
15.6 million adults (18.4% of the adult population) sent remittances within Nigeria
2.6 million adults (3.1% of the adult population) received remittances from outside Nigeria
0.3 million adults (0.3% of the adult population) sent remittances to outside Nigeria
36.4%
18.4%
3.1% 0.3%
Received money from within Nigeria
Sent money within Nigeria Received money from outside Nigeria
Sent money outside Nigeria
Source: EFInA Access to Financial Services in Nigeria 2010 survey

"A4
rb_
sta
nd
ard
_b
an
d_p
ho
to" –
20
10
01
11
– d
o n
ot
de
lete
this
te
xt o
bje
ct!
43
International Remittances
In the six months prior to being interviewed:
2.6 million Nigerians received money from friends or family members from outside Nigeria
The top 3 countries for inbound international remittances were USA, UK and South Africa
Of those who received international remittances
Source: EFInA Access to Financial Services in Nigeria 2010 survey
5.3%
6.1%
8.9%
10.2%
23.5%
32.9%
Ghana
Italy
Germany
South Africa
United Kingdom
USA

"A4
rb_
sta
nd
ard
_b
an
d_p
ho
to" –
20
10
01
11
– d
o n
ot
de
lete
this
te
xt o
bje
ct!
44
Amounts Received for Domestic and International Remittances
Amount received the last time Domestic (%) International (%)
Below N2,500 11.4 -
N2,501 – N5,000 27.7 1.9
N5,001 – N10,000 30.5 11.6
N10,001 – N50,000 19.8 39.9
Above N50,000 4.1 30.0
Refused to Answer/Can’t Say 6.5 16.6
Source: EFInA Access to Financial Services in Nigeria 2010 survey
30.5% (9.4 million adults) of those who received domestic remittances in the six months prior to being interviewed received, between N5,001 and N10,000
39.9% (1.0 million adults) of those who received international remittances in the six months prior to being interviewed, received between N10,001 and N50,000

"A4
rb_
sta
nd
ard
_b
an
d_p
ho
to" –
20
10
01
11
– d
o n
ot
de
lete
this
te
xt o
bje
ct!
I. Technology and Mobile Phone Usage
"A4
rb_
sta
nd
ard
_b
an
d_p
ho
to" –
20
10
01
11
– d
o n
ot
de
lete
this
te
xt o
bje
ct!
46
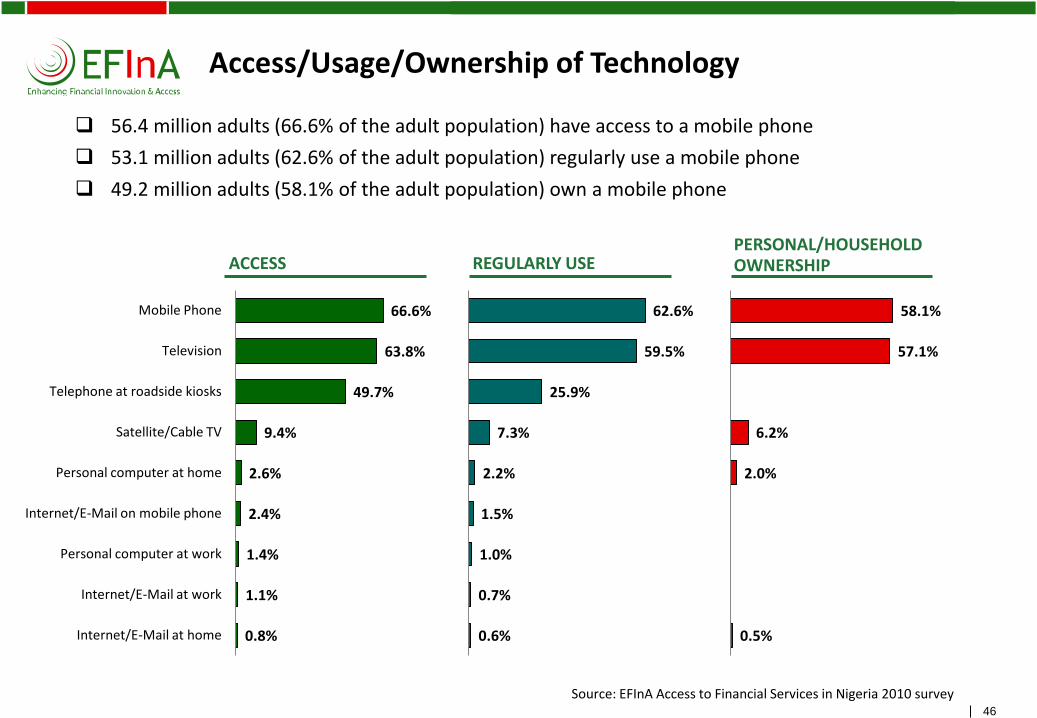
Access/Usage/Ownership of Technology
56.4 million adults (66.6% of the adult population) have access to a mobile phone
53.1 million adults (62.6% of the adult population) regularly use a mobile phone
49.2 million adults (58.1% of the adult population) own a mobile phone
Source: EFInA Access to Financial Services in Nigeria 2010 survey
0.8%
1.1%
1.4%
2.4%
2.6%
9.4%
49.7%
63.8%
66.6%
Internet/E-Mail at home
Internet/E-Mail at work
Personal computer at work
Internet/E-Mail on mobile phone
Personal computer at home
Satellite/Cable TV
Telephone at roadside kiosks
Television
Mobile Phone
0.6%
0.7%
1.0%
1.5%
2.2%
7.3%
25.9%
59.5%
62.6%
0.5%
2.0%
6.2%
57.1%
58.1%
REGULARLY USE PERSONAL/HOUSEHOLD OWNERSHIP ACCESS

"A4
rb_
sta
nd
ard
_b
an
d_p
ho
to" –
20
10
01
11
– d
o n
ot
de
lete
this
te
xt o
bje
ct!
47
Mobile Phone Ownership vs. Banking Status
49.2 million adults own a mobile phone, of which:
23.9 million are banked (which represents 93.7% of the banked population)
25.3 million are unbanked (which represents 42.7% of the unbanked population)
This clearly demonstrates the potential for using mobile phones as a distribution channel for providing financial services to the unbanked
Banked Total Unbanked
Source: EFInA Access to Financial Services in Nigeria 2010 survey
49.2 m
23.9 m 25.3 m

"A4
rb_
sta
nd
ard
_b
an
d_p
ho
to" –
20
10
01
11
– d
o n
ot
de
lete
this
te
xt o
bje
ct!
48
Financial Transactions that People Would Consider Conducting Using their Mobile Phone
Sending SMS Complaints to Consumer Hotline
11.2%
Sending money
15.7%
Settling bills
13.3%
Receiving financial statements
6.0%
Receiving money
19.8%
16.8 million adults (19.8%) would consider using their mobile phone to receive money
13.3 million adults (15.7%) would consider using their mobile phone to send money
5.1 million adults (6.0%) would consider using their mobile phone to pay bills
Source: EFInA Access to Financial Services in Nigeria 2010 survey

"A4
rb_
sta
nd
ard
_b
an
d_p
ho
to" –
20
10
01
11
– d
o n
ot
de
lete
this
te
xt o
bje
ct!
J. Financial Literacy

"A4
rb_
sta
nd
ard
_b
an
d_p
ho
to" –
20
10
01
11
– d
o n
ot
de
lete
this
te
xt o
bje
ct!
50
Knowledge of Key Financial Terms
Heard and know what it means
Heard but don’t know what it means
Never Heard
Bank 84.6% 7.5% 7.9%
Interest 71.5% 10.5% 18.0%
Loans 69.9% 13.1% 17.0%
Savings Account 59.5% 12.9% 27.6%
Pension 55.1% 17.8% 27.1%
Cheque 54.5% 15.7% 29.8%
ATM Card 45.7% 16.2% 38.1%
Current Account 44.1% 18.5% 37.4%
Insurance 35.9% 21.3% 42.8%
Microfinance 35.5% 19.8% 44.7%
Shares 27.5% 18.0% 54.5%
Mortgage 17.6% 17.1% 65.3%
Credit Card 15.6% 15.8% 68.6%
Non-Interest (Islamic) Banking 6.4% 9.8% 83.8%
69.9% of the adult population have heard and understand what Loans mean; 59.5% have heard and understand what savings accounts means
65.3% of the adult population have never heard of a mortgage; 44.7% have never heard of microfinance; 42.8% have never heard of Insurance; 38.1% have never heard of ATM cards
Source: EFInA Access to Financial Services in Nigeria 2010 survey

"A4
rb_
sta
nd
ard
_b
an
d_p
ho
to" –
20
10
01
11
– d
o n
ot
de
lete
this
te
xt o
bje
ct!
51
Sources of Financial Advice/Desired Financial Knowledge
DESIRED FINANCIAL KNOWLEDGE SOURCES OF FINANCIAL ADVICE
Where to get the best finanacial products
How interest rates are calculated
How to open a bank account
How to save regularly
How to save for old age 62.6%
59.9%
55.0%
52.3%
48.5%
69.5 million adults (82.0%) get financial advice from family members or friends
8.3%
9.8%
13.2%
20.2%
82.0%
Radio Programmes
Employer/Work colleagues
Bank
Someone trusted in the Community/Religious Leader
Family/Friend
Source: EFInA Access to Financial Services in Nigeria 2010 survey
53.1 million adults (62.6%) would like to know how to save for their old age
50.7 million adults (59.9%) would like to know how to save regularly

"A4
rb_
sta
nd
ard
_b
an
d_p
ho
to" –
20
10
01
11
– d
o n
ot
de
lete
this
te
xt o
bje
ct!
K. Trend Analysis: 2010 vs. 2008

"A4
rb_
sta
nd
ard
_b
an
d_p
ho
to" –
20
10
01
11
– d
o n
ot
de
lete
this
te
xt o
bje
ct!
53 53
Coverage, Methodology and Analysis
Coverage and Methodology
Same as 2008 with the following exceptions:
2010 2008
Target Sample 24,000 22,200
Enumeration Areas (EAs) 1,200 1,110
Sampling Methodology Proportionate sampling based on the population per State. Minimum - 400 questionnaires per State; Maximum - 1,200 questionnaires per State
Equal sampling – 600 questionnaires per State
Fieldwork Duration July to August May to August
Analysis
2010 comparisons are based on the adult population of 2008 which was 86.6 million
Source: EFInA Access to Financial Services in Nigeria 2010 survey

"A4
rb_
sta
nd
ard
_b
an
d_p
ho
to" –
20
10
01
11
– d
o n
ot
de
lete
this
te
xt o
bje
ct!
54
Change in Banking Status from 2008 to 2010
From 2008 to 2010:
The percentage of the adult population who are banked increased by 8.9%, an increase of 7.7 million
The percentage of the adult population that were previously banked declined by 2.1%, a decrease of 1.8 million
KEY COMMENTS 2008 2010
2.8%
30.0%
67.2%
4.9%
21.1%
74.0%
Banked
Previously Banked
Never Banked
Banked
Previously Banked
Never Banked
Source: EFInA Access to Financial Services in Nigeria 2010 survey

"A4
rb_
sta
nd
ard
_b
an
d_p
ho
to" –
20
10
01
11
– d
o n
ot
de
lete
this
te
xt o
bje
ct!
55
Change in the Banked Population from 2008 to 2010
From 2008 to 2010:
The number of adults that are banked increased by 7.7 million
The number of female adults that are banked increased by 3.4 million
The number of male adults that are banked increased by 4.3 million
KEY COMMENTS 2008 2010
+8.9%, 7.7 m
+9.7%, 4.3 m
+8.2%, 3.4 m
CHANGE 08-10
Female 15.0%
Male 26.8%
Total 21.1%
Female 23.2%
Male 36.5%
Total 30.0%
Source: EFInA Access to Financial Services in Nigeria 2010 survey
"A4
rb_
sta
nd
ard
_b
an
d_p
ho
to" –
20
10
01
11
– d
o n
ot
de
lete
this
te
xt o
bje
ct!
56
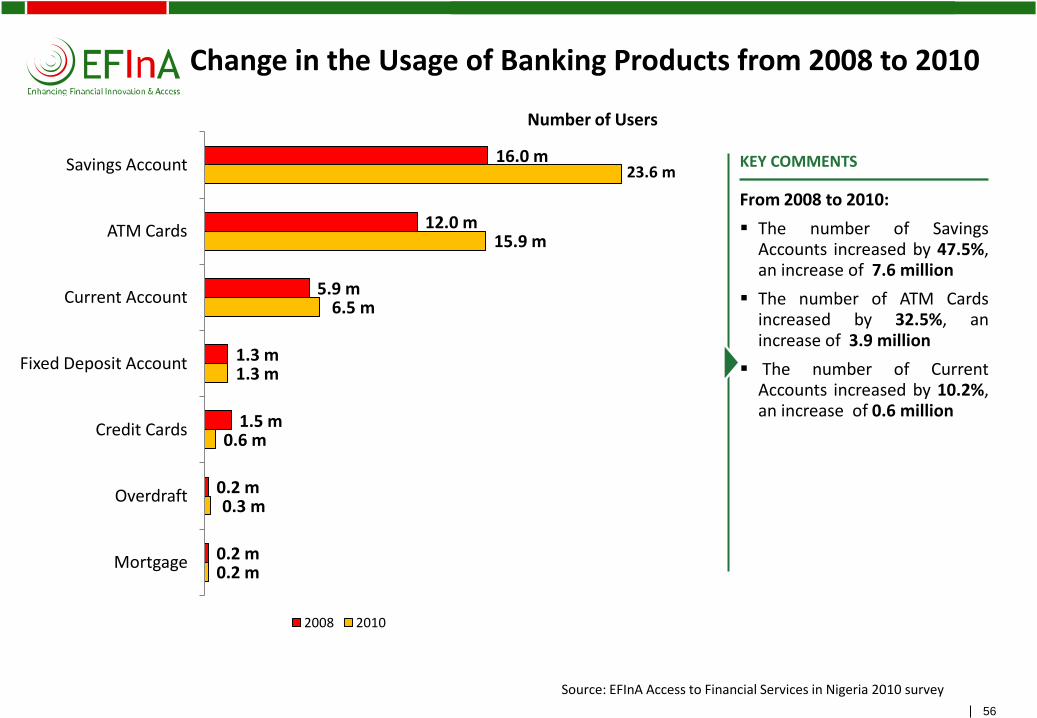
Change in the Usage of Banking Products from 2008 to 2010
From 2008 to 2010:
The number of Savings Accounts increased by 47.5%, an increase of 7.6 million
The number of ATM Cards increased by 32.5%, an increase of 3.9 million
The number of Current Accounts increased by 10.2%, an increase of 0.6 million
KEY COMMENTS
0.2 m
0.3 m
0.6 m
1.3 m
6.5 m
15.9 m
0.2 m
0.2 m
1.5 m
1.3 m
5.9 m
12.0 m
16.0 m
Mortgage
Overdraft
Credit Cards
Fixed Deposit Account
Current Account
ATM Cards
Savings Account
2008 2010
Number of Users
23.6 m
Source: EFInA Access to Financial Services in Nigeria 2010 survey

"A4
rb_
sta
nd
ard
_b
an
d_p
ho
to" –
20
10
01
11
– d
o n
ot
de
lete
this
te
xt o
bje
ct!
57
Change in the Access Strand from 2008 to 2010
Financially Excluded Informal Only Formal Other Banked
The four categories are mutually exclusive
2010 30.0% 6.3% 17.4% 46.3%
2008 21.1% 2.5% 23.9% 52.5%
Note: 2010 figures include remittances (Formal Other and Informal Only), whereas 2008 does not
From 2008 to 2010:
• The number of adults that are formally included increased from 23.6% to 36.3%, an increase of 11.0 million
• The number of adults that are financially served increased from 47.5% to 53.7%, an increase of 5.4 million
• The number of adults that are financially excluded decreased by 5.4 million
KEY COMMENTS
Source: EFInA Access to Financial Services in Nigeria 2010 survey

"A4
rb_
sta
nd
ard
_b
an
d_p
ho
to" –
20
10
01
11
– d
o n
ot
de
lete
this
te
xt o
bje
ct!
L. Conclusions

"A4
rb_
sta
nd
ard
_b
an
d_p
ho
to" –
20
10
01
11
– d
o n
ot
de
lete
this
te
xt o
bje
ct!
59
With over 59 million unbanked adults, finding new ways of reaching out to this market is a major challenge for service providers. New ways of thinking and innovation in bank product and service offerings are needed to capture this market
The key issues that need to be addressed are:
How can we serve the unbanked market economically and profitably?
How can we leverage technology and non-bank channels (such as retail stores) to increase access to a range of financial products for the unbanked, especially those in remote rural areas?
Which technology should be deployed and how can they be adapted to reach the rural areas?
How do we encourage services providers (both financial and non-financial) to develop a range of financial products which are appropriate and affordable and meet the needs of the unbanked and low income population?
How do we ensure that the unbanked and low income population fully understand the benefits of being financially included?
All of these challenges translate into opportunities for banking the unbanked in Nigeria
Key Issues
Source: EFInA Access to Financial Services in Nigeria 2010 survey

"A4
rb_
sta
nd
ard
_b
an
d_p
ho
to" –
20
10
01
11
– d
o n
ot
de
lete
this
te
xt o
bje
ct!
60
How do we Successfully Promote Financial Inclusion in Nigeria?
BANKING INDUSTRY
Extend banking beyond branches by the use of technology such as mobile phones and POS devices
Take banking services closer to the customer – e.g. through agent banking
Ensure that the benefits of having a bank account is widely communicated to the unbanked and low income population through several different channels
Develop innovative savings products to encourage the 23.8 million adults currently saving at home to save in a bank
Develop remittances products which can be linked to bank accounts
Formal financial providers should identify innovative ways of extending micro and retail loans to the low income segment
POLICY MAKERS
Maintain policy reforms that foster stability in the banking industry, especially as this is the top criterion for deciding where to open a bank account
Ensure robust consumer protection policies that address transparency, fair treatment and effective redress mechanisms, that are tailored to the realities of inexperienced, low literacy consumers
Implement a tiered KYC regime that supports the lack of relevant documentation of the unbanked and low income segment
Promote basic savings accounts with no/limited fees with defined features such as maximum balance, limited number of transactions, etc
In conjunction with service providers, ensure that the economically active population has good access to high quality financial education to enable them make the best choice for their needs when selecting financial products
Fast track the implementation of innovative policies that support branchless banking models (e.g. mobile payment licenses, agent banking) and increase access to finance
Source: EFInA Access to Financial Services in Nigeria 2010 survey

"A4
rb_
sta
nd
ard
_b
an
d_p
ho
to" –
20
10
01
11
– d
o n
ot
de
lete
this
te
xt o
bje
ct!
M. Data Dissemination Options

"A4
rb_
sta
nd
ard
_b
an
d_p
ho
to" –
20
10
01
11
– d
o n
ot
de
lete
this
te
xt o
bje
ct!
62
Data Dissemination Options
EFInA Access to Financial Services in Nigeria, 2008/2010 survey
Comprehensive database where information can be segmented in multiple dimensions, e.g., gender, geo political zone, age, education, etc.
Data will be provided in SPSS format
Key findings can be downloaded from the EFInA website
Data Options
Purchase full dataset
Request customised presentations
Purchase a limited number of variables
Data request form can be downloaded from the EFInA website
Contact
Website
www.efina.org.ng
Related Documents