NURITION AND FOOD SECURITY SURVEILLANCE: NORTH EAST NIGERIA – EMERGENCY SURVEY NOVEMBER 2019 FINAL REPORT

Welcome message from author
This document is posted to help you gain knowledge. Please leave a comment to let me know what you think about it! Share it to your friends and learn new things together.
Transcript
NURITION AND FOOD SECURITY SURVEILLANCE: NORTH EAST NIGERIA – EMERGENCY SURVEY
NOVEMBER 2019
FINAL REPORT
Acknowledgments
This survey was carried out by the National Bureau of Statistics (NBS) in coordination with the National Population Commission (NPopC), the Federal Ministry of Health (FMOH), and the Nigeria Nutrition in Emergency Working Group (NiEWG). Financial support was provided by the Government of Nigeria, United Nations Children’s Fund (UNICEF), and the United Kingdom Agency for International Development (UKAID). Technical support was provided by the Centers for Disease Control and Prevention (CDC) and UNICEF through NBS. Additional information about this survey may be obtained by contacting UNICEF Nigeria or the Northeast Nigeria Nutrition Sector Coordinator Simon Karanja: [email protected] or Adamu Yerima: [email protected].
Executive Summary
The Boko Haram conflict was declared to be a state of emergency at the beginning of 2012 by the government of Nigeria. In May 2013, the area under the state of emergency was extended to include all of Adamawa, Borno and Yobe states in North-eastern Nigeria. The insurgency and political violence had caused mass population displacement. According to the International Organization of Migration’s (IOM) August 2019 report, there were 1,483,566, 200,011 and 131,597 internally displaced persons (IDPs) in Borno, Adamawa and Yobe states respectively.
Given the emergency situation as well as recently increases in access to newly liberated areas since the emergency declaration, a series of repeated surveys were organized with the primary objective of providing representative estimates for prevalence of acute malnutrition among children 6 to 59 months (by weight-for-height and MUAC), as well as mortality rate in North East Nigeria to inform the ongoing emergency response. Information on nutritional status of women of reproductive age, prevalence of common child health morbidities, access to health services and health status among children, and infant feeding.
The first round of repeated surveys was conducted in October-November 2016, the second round in February-March 2017, the third round in July-August 2017, the fourth round in November-December 2017, the fifth round in April-May 2018 and the sixth round conducted jointly with WFP for both nutrition and food security (JANFSA) in October 2018, seventh round in May-June 2019.
These surveys were carried out by the National Bureau of Statistics (NBS) in coordination with the National Population Commission (NPC), the Federal Ministry of Health (FMOH), and the Nigeria Nutrition in Emergency Working Group (NiEWG). Financial support was provided by the Government of Nigeria, United Nations Children’s Fund (UNICEF), and the United Kingdom Agency for International Aid (UKAID). Technical support was provided by the Centers for Disease Control and Prevention (CDC) and UNICEF through NBS.
Methodology
Cross-sectional household surveys were carried out using a two-stage cluster sampling design consistent with the SMART methodology. The survey area consisted of 65 LGAs within the three states of Adamawa, Borno and Yobe. The 65 LGAs were divided into 10 domains: 2 in Adamawa (North and South), 3 in Yobe (North, Central and South) and 5 in Borno state (North, South, Central, East, and MMC/Jere). Domains were created considering livelihood zones, geographic proximity and socio-cultural homogeneity1. Results are representative at the level of the domain, a grouping of LGAs.
Clusters were selected using probability proportional to size (PPS) sampling. The primary sampling unit (PSU) for Yobe and Adamawa domains were based on Enumeration Areas (EAs) from the 2006 census frame. Estimated populations for each EA are 2019 populations projected from the 2006 census. Given recent large-scale population movement, an updated sampling frame was built for Borno. Population estimates from the August 2019 polio campaign micro plan as well as Village Tracking System population estimates by settlement were used for settlements2.
1 Famine Early Warning Systems Network (FEWSNET). Nigeria Livelihood Zones. 2014. Available at:
http://www.fews.net/west-africa/nigeria/livelihood-zone-map/may-2014
2 Nigeria - DTM Round 28 Report (August 2019). Available at;
https://displacement.iom.int/system/tdf/reports/Nigeria_DTM_Round_28_Report_August%202019.pdf?file=1&type=node&id=6616
Sample size was calculated to ensure adequate precision for estimates of global acute malnutrition (GAM) and crude mortality rate (CMR). A sample of 600 households, 30 clusters of 20 households, was selected per domain. Within selected clusters, all households were listed and selected using systematic random sampling. Enumerators received a four-days training including a full standardization and field test.
Results Data collection took place between September 15 and October 22, 2019. Four of the LGAs in Borno (Abadam, Guzamala, Kukawa and Marte) were determined by state level actors to be inaccessible at the time of this survey. All ten domains were accessible and all inaccessible areas in were excluded a priori. Prevalence of GAM in children 6 to 59 months was 11.3% in Yobe, 8.1% in Borno, and 7.2% in Adamawa. Prevalence of GAM exceeded the WHO Crisis Classification threshold for serious (10%) in all the domains in Yobe state (Central Yobe, Southern Borno, and Northern Yobe) and East Borno in Borno state. Prevalence of GAM was highest in Central Yobe both by weight-for-height and/or oedema (13.8%), and by MUAC (4.1%).
Crude mortality was highest in Southern Adamawa 0.41 while under-five mortality rates was highest in both Northern Borno 1.02). Crude and under-five mortality rates remained below emergency threshold of 1 death / 10,000 people / day & 2 deaths in children under five / 10,000 children under five / day in any of the domains. By domain, crude mortality rate ranged from 0.2-0.41 total deaths / 10,000 people / day. Under five mortality rates ranged from 0.1 to 1.02 deaths in children under five / 10,000 children under five / day.
Overall, data quality was excellent in all 10 domains according to SMART methodology classifications. Breastfeeding practices were assessed as a measure of infant and young child feeding (IYCF). The proportion of children who continued breastfeeding at one year was over 90% in all three states, but then steadily declined; continued breastfeeding at two years (assessed among children aged 20-23 months) ranged from 31.1 - 40.9% by state. Prevalence of acute among adolescent girls (15 to 19 years) was 29.5% and among adult women (20 to 49 years) was 5.9%. The rates of acute malnutrition is 5 times higher among the adolescent compared to the adult women.
Recommendations: Based on the NFSS Round 8 findings, the following actions are recommended: Prevention: 1. UNICEF and WHO to continue support for SPHCDA to strengthen the routine provision of
vitamin A and deworming through the EPI at health facilities, and in regular campaigns. UNICEF to assist in developing communication strategies to improve the uptake of vitamin A and deworming both in routine programming, and campaigns.
2. Health Sector to ensure 100% coverage of measles vaccination to ensure 100% herd immunity is achieved.
3. WHO, UNICEF and health sector partners to strengthen management of common childhood illnesses, such as diarrhoea, at accessible at the household level and primary health centers.
4. WFP to continue strengthening its ongoing humanitarian response (nutrition and food or cash assistance), which may be attributable in contributing to the documented decrease in acute malnutrition.
Response: 5. Improve coverage of effective nutrition intervention e.g. targeting them in Mother to
Mother Support groups, aimed at improving the nutritional status of adolescent girls. 6. Nutrition Sector partners to adopt tested and innovative methods to improve the coverage
and quality of infant and young child feeding (IYCF), and use of micronutrient powder (MNP), including establishing Father-to-Father Groups, Mother-to-Mother Support Groups, Care Models, and engagement of Community Nutrition Mobilisers to distribute MNPs.
Funding 7. Donors to support Nutrition Sector partners to scale-up nutrition prevention and treatment
response in areas with persistent high levels of GAM including Central, Northern and Southern Yobe, and East Borno.
Monitoring and Evaluation: 8. Nutrition Sector to plan and carry out systematic SMART methodology nutrition surveys in
LGAs, and to seek donor funding for regularization of these surveys.
Coordination: 9. OCHA to support the Nutrition Sector to involve the ISWG and specifically the WASH and
Food Security in the planning, implementation, analysis, and dissemination of results. This is to ensure the SMART results are relevant to the other sectors.
10. OCHA to support the adoption of GAM results as a cross cutting outcome for all sectors.
Table of Contents
Acknowledgments i
Executive Summary ii
Table of Contents 5
List of Tables 7
List of Figures 8
List of Acronyms 9
1 Introduction 11
1.1 Justification 11
1.2 Objectives 12
2. Methodology 13
2.1 First Stage Sampling 13
2.2 Second Stage Sampling 14
2.3 Sample Size Calculation 14
2.4 Case Definitions and Inclusion Criteria 18
2.5 Training and Supervision 19
2.6 Data Analysis 20
3. Results 21
3.1 Final Sample and Data Quality 21
3.2 Anthropometric results: 24
3.2.1 Acute Malnutrition (WHZ and/or Bilateral Oedema) 25
3.2.2 Acute Malnutrition (MUAC) and/or Bilateral Oedema 28
3.2.3 Underweight 32
3.2.4 Chronic Malnutrition (Stunting) 34
3.3 Mortality results 37
3.4 Infant and Young Child Feeding 37
3.5 Child Health 44
3.5.1 Measles Vaccination Coverage 44
3.5.2 Diarrhoea, Oral Rehydration Therapy and Zinc Supplementation 47
3.5.3 Acute Respiratory Infection (ARI) and Treatment 49
3.5.4 Fever, Prevention of Malaria, and Antimalarial Treatment 51
3.6 Maternal Nutrition 56
3.6.1 Minimum Dietary Diversity for Women 58
3.7 Public Health Interventions that Prevents against Malnutrition 60
3.7.1 Deworming, Vitamin A and Micronutrient Powder (MNP) 60
3.7.2 Specialised Nutritious Foods 62
3.8 Water, Sanitation and Hygiene (WASH) 63
4. Discussion: 66
5. Conclusion and Recommendations 73
6. References 75
7. Annexes 77
Annex 1: Local Government Areas and Estimated Accessible Population, by Survey Domain 77
Annex 3. Maps of Local Government Areas, by Survey Domain 79
Annex 4. List of nutrition indicators and definitions 80
Annex 5: Calendar of Local Events 84
Annex 6: Selected Clusters 86
Annex 7: Plausibility Checks 98
List of Tables
TABLE 1: SURVEY DOMAINS........................................................................................................................................................................... 13 TABLE 2 ANTHROPOMETRY AND MORTALITY SAMPLE SIZE INPUTS..................................................................................................... 16 TABLE 3 NUMBER OF HOUSEHOLDS PER CLUSTER IN EACH DOMAIN ................................................................................................... 17 TABLE 4 NUMBER OF CLUSTERS AND HOUSEHOLDS SAMPLED BY DOMAIN ........................................................................................ 17 TABLE 5 FINAL SAMPLE OF HOUSEHOLDS, WOMEN AND CHILDREN, BY DOMAIN ........................................................................... 21 TABLE 6 DISTRIBUTION OF AGE AND SEX OF SAMPLE, BY DOMAIN ..................................................................................................... 22 TABLE 7 SUMMARY OF CHILD ANTHROPOMETRY DATA QUALITY ........................................................................................................ 23 TABLE 8 PROPORTION OF CHILDREN WITH COMPLETE DATA OF BIRTH, AGE REPORTED IN MONTHS OR MISSING, BY
DOMAIN AND TEAM ................................................................................................................................................................................. 24 TABLE 9 PREVALENCE OF ACUTE MALNUTRITION BY WEIGHT-FOR-HEIGHT Z-SCORES (AND/OR OEDEMA) AND BY SEX,
CHILDREN 0-59 MONTHS, BY STATE AND DOMAIN ....................................................................................................................... 26 TABLE 10 PREVALENCE OF ACUTE MALNUTRITION BY AGE, BY WEIGHT-FOR-HEIGHT Z-SCORES AND/OR OEDEMA,
CHILDREN 6-59 MONTHS, BY DOMAIN ............................................................................................................................................. 27 TABLE 11 PREVALENCE OF ACUTE MALNUTRITION BY MUAC (AND/OR OEDEMA) IN CHILDREN 6-59 MONTHS, AND BY
SEX, STATE AND DOMAIN ...................................................................................................................................................................... 30 TABLE 12: PREVALENCE OF ACUTE MALNUTRITION BY MUAC AND/OR OEDEMA IN CHILDREN 6-59 MONTHS, BY AGE, BY
DOMAIN ...................................................................................................................................................................................................... 31 TABLE 13 PREVALENCE OF UNDERWEIGHT BY WEIGHT-FOR-AGE Z-SCORES IN CHILDREN 0-59 MONTHS, BY SEX, BY
STATE AND DOMAIN ................................................................................................................................................................................ 33 TABLE 14: PREVALENCE OF STUNTING BASED ON HEIGHT-FOR-AGE Z-SCORES IN CHILDREN 0-59 MONTHS, BY SEX, BY
STATE AND DOMAIN ................................................................................................................................................................................ 35 TABLE 15: MEAN Z-SCORES, DESIGN EFFECTS AND EXCLUDED SUBJECTS, BY DOMAIN ............................................................. 36 TABLE 16: MORTALITY RATES BY STATES AND DOMAIN ....................................................................................................................... 37 TABLE 17: PERCENT OF CHILDREN 0-59 MONTHS WHO WERE EXCLUSIVELY BREASTFED, EARLY INITIATION OF
BREASTFEEDING, BY SEX, AGE, STATE AND DOMAIN ................................................................................................................... 39 TABLE 18: EXCLUSIVE, PREDOMINANTLY, AND CONTINUED BREASTFEEDING PRACTICES BY AGE, SEX, SURVEY DOMAIN
AND STATE ................................................................................................................................................................................................ 41 TABLE 19: PERCENTAGE OF INFANTS AGE 6-8 MONTHS WHO RECEIVED SOLID, SEMI-SOLID, OR SOFT FOODS DURING
THE PREVIOUS DAY, BY SEX, SURVEY DOMAIN AND STATE ........................................................................................................ 43 TABLE 20: PERCENTAGE OF CHILDREN AGE 6-23 MONTHS WHO RECEIVED APPROPRIATE LIQUIDS AND SOLID, SEMI-
SOLID, OR SOFT FOODS THE MINIMUM NUMBER OF TIMES OR MORE DURING THE PREVIOUS DAY, BY BREASTFEEDING
STATUS, BY SEX, STATE, AND DOMAIN ........................................................................................................................................... 44 TABLE 21: PERCENTAGE OF CHILDREN AGE 12-59 MONTHS VACCINATED AGAINST MEASLES, BY STATE AND DOMAIN .. 46 TABLE 22 PERCENTAGE OF CHILDREN AGE 0-59 MONTHS WITH DIARRHOEA IN THE PREVIOUS TWO WEEKS WHO
RECEIVED ORAL REHYDRATION SALTS (ORS) OR ZINC, BY SEX, AGE, STATE AND DOMAIN ............................................ 48 TABLE 23: PERCENTAGE OF CHILDREN AGE 0-59 MONTHS WITH SYMPTOMS ARI IN THE PREVIOUS TWO WEEKS WHO
RECEIVED ANTIBIOTICS, BY SEX, AGE, STATE AND DOMAIN ....................................................................................................... 50 TABLE 24: PERCENTAGE OF CHILDREN AGE 0-59 MONTHS WITH FEVER IN THE LAST TWO WEEKS WHO WERE TESTED
FOR MALARIA USING RAPID DIAGNOSTIC TEST (RDT) AND/OR RECEIVED ANTI-MALARIAL, BY SEX, AGE, STATE AND
DOMAIN ...................................................................................................................................................................................................... 52 TABLE 25: HOUSEHOLDS OWNERSHIP OF MOSQUITO NETS, BY STATE AND DOMAIN ................................................................... 54 TABLE 26: PERCENTAGE OF CHILDREN AGE 0-59 MONTHS RECEIVING SEASONAL MALARIA CHEMOPREVENTION AND
PERCENT WHO SLEPT UNDER A MOSQUITO NET THE NIGHT BEFORE THE SURVEY, BY SEX, AGE, STATE AND DOMAIN
..................................................................................................................................................................................................................... 55 TABLE 27: ACUTE MALNUTRITION BY MUAC AMONG WOMEN OF REPRODUCTIVE AGE (15-49 YEARS), BY AGE, STATE
AND DOMAIN ............................................................................................................................................................................................. 57 TABLE 28: DIETARY DIVERSITY AMONG WOMEN OF REPRODUCTIVE AGE (15-49 YEARS), BY AGE, STATE AND DOMAIN
..................................................................................................................................................................................................................... 59 TABLE 29: PERCENTAGE OF CHILDREN RECEIVING VITAMIN A, ANTHELMINTHIC DRUG, AND MNP IN THE PAST 6 MONTHS
BY SEX, AGE AND LOCATION ................................................................................................................................................................ 61 TABLE 30: PERCENTAGE OF HOUSEHOLDS RECEIVING SUPER CEREAL IN THE LAST THREE MONTHS, BY STATE AND DOMAIN
..................................................................................................................................................................................................................... 62 TABLE 31: PERCENTAGE OF HOUSEHOLDS TREATING THEIR DRINKING WATER BY TREATMENT METHOD, BY STATE AND
DOMAIN ...................................................................................................................................................................................................... 64 TABLE 32: PERCENTAGE OF HOUSEHOLDS WHERE A PLACE FOR HANDWASHING WAS OBSERVED AND AVAILABILITY OF
SOAP AND/OR WATER, BY STATE AND DOMAIN ............................................................................................................................. 65
List of Figures
FIGURE 1: PERCENTAGE OF CHILDREN AGE 12-59 MONTHS VACCINATED AGAINST MEASLES, BY DOMAIN .............................. 47 FIGURE 2: GAM TRENDS FROM 2016 TO 2019..................................................................................................................................... 67
List of Acronyms
ACT Artemisinin-based Combination Therapy
ANC Antenatal Care
ARI Acute Respiratory Infection
CI Confidence Interval
CMAM Community-based Management of Acute Malnutrition
EA Enumeration Areas
ENA Emergency Nutrition Assessment
EPI Expanded Programme on Immunisation
FGON Federal Government of Nigeria
FMOH Federal Ministry of Health
GAM Global Acute Malnutrition
HAZ Height-for-Age Z-score
HH Household
IPT Intermittent Preventive Treatment
ITN Insecticide Treated Net
IYCF Infant and Young Child Feeding
KAP Knowledge, Attitudes and Practice
LGA Local Governmental Area
MAM Moderate Acute Malnutrition
MDG Millennium Development Goals
MNCHW Maternal Newborn and Child Health Week
MICS Multiple Indicator Cluster Survey
MUAC Mid-Upper Arm Circumference
NBS National Bureau of Statistics
NCHS National Center for Health Statistics
NDHS Nigeria Demographic and Health Survey
NIS Nutrition Information System
NMCSP National Malaria Control Strategic Plan
NNHS National Nutrition and Health Survey
NPopC National Population Commission
NSHDP National Strategic Health Development Plan
NSPAN National Strategic Plan of Action for Nutrition
ORS Oral Rehydration Salts
ORT Oral Rehydration Therapy
PHC Primary Health Care
PPS Probability Proportional to Size
PSU Primary Sampling Unit
RDT Rapid Diagnostic Testing
SAM Severe Acute Malnutrition
SD Standard Deviation
SMART Standardized Monitoring and Assessment of Relief and Transition
SOML Saving One Million Lives
SP Sulphadoxine Pyrimethamine
UNHCR United Nations High Commission for Refugees
UNICEF United Nations Children's Fund
USAID United States Agency for International Development
VAD Vitamin A Deficiency
WASH Water, Sanitation and Hygiene
WAZ Weight-for-Age Z-score
WB World Bank
WHZ Weight for Height Z-score
WFP World Food Programme
WHO World Health Organization
1 Introduction The Boko Haram insurgency has caused mass population displacement throughout the North East Nigeria since 2012, when the government declared a state of emergency secondary to the conflict. According to the International Organization of Migration’s (IOM) Displacement Tracking Matrix (DTM) round XXVIII (August 2019) report, there are 2,018,513 internal displaced persons (IDPs) spread across Borno, Adamawa and Yobe states. This represents a nominal increase of 2.0% or 38,477 persons in comparison to 1,980,036 IDPs identified in ION DTM Round XXVII (May 2019). The conflict and displacement has resulted in disrupted livelihoods, food insecurity, and population overcrowding, in turn increasing the risks for malnutrition and mortality in affected populations. With the emergency situation in North East Nigeria, and access to newly liberated areas, a series of repeated surveys were organized with the primary objective to provide representative estimates for prevalence of acute malnutrition among children under five years, the nutritional status of women, prevalence of common child health morbidities, access to health services and health status among children, status of infant feeding, and mortality rates to inform the ongoing emergency response. The round of repeated surveys known collectively as the Nutrition and Food Security Surveillance (NFSS) were carried out as follows: Round 1 October-November 2016 Round 2 February-March 2017 Round 3 July-August 2017 Round 4 November-December 2017 Round 5 April-May 2018 Round 6 October 20183 Round 7 May-June 2019
The results of the NFSS are only representative of accessible areas in the three states at the time of their undertaking. The situation may be worse in inaccessible and newly accessible LGAs. The July 2018 Bama SMART survey showed a higher GAM in areas where newly arrived children 6 to 59 months were living (37.5%) compared to 7.8% for children 6 to 59 months living in the camp for a longer period. The new arrival screening data is also suggestive of a critical nutrition situation in inaccessible areas.
Currently, there is limited nutrition data available at the LGA level, which is the level of program implementation. The only available LGA results are SMART nutrition surveys conducted by Nutrition Sector partners within their operational areas. Recently, a sentinel surveillance system has been initiated in 23 accessible LGAs of Borno. The data is collected on quarterly basis from 75,591 households within the accessible wards. A dashboard showing the sentinel surveillance findings will be functional by April 2020.
1.1 Justification
In early 2016, the Federal Government of Nigeria declared the Boko Haram conflict in Northeastern Nigeria as a state of emergency. In May 2017, the state of emergency area was extended to include Adamawa, Borno and Yobe states. The conflict has continued and impacted the population’s freedom of movement, livelihoods, markets, and access to humanitarian assistance in Northeast Nigeria, as well as the neighbouring border countries of Niger, Chad,
3 UNICEF/WFP Joint Approach for Nutrition and Food Security Assessment (JANFSA) in Borno, Yobe and
Adamawa states, October 2018.
and Cameroon.
In Nigeria, the humanitarian response is mainly focused in Borno, Yobe and Adamawa states. Information on the nutrition situation since April 2016 remains limited. Small-scale SMART nutrition surveys and larger Emergency Food Security Assessments (EFSA) surveys have been carried out. While these surveys provide the most reliable information on the current nutrition situation in the Northeast, there were too few to provide a detailed analysis of the nutrition situation across the whole of the three states. Presently, the NFSS remains the most comprehensive and regular source of the nutrition situation.
In 2016, UNICEF and Nutrition Sector partners established the NFSS, which intends to contribute to existing nutrition information from:
i. repeated cross-sectional surveys on standardized groupings of LGAs;
ii. exhaustive MUAC screening of children 6-59 months coming from newly accessible areas,
iii. flexible integrated and timely (FIT) sentinel surveillance in Borno state and
iv. real-time CMAM programme and stocks data to ensure that all children with acute
malnutrition have access to appropriate management.
The findings in this report represent Round 8 of a series of planned, repeated cross-sectional surveys.
1.2 Objectives
The overall goal of this survey is to establish the extent and the severity of acute malnutrition and determine the contributing factors of malnutrition in Northeast Nigeria to inform the ongoing emergency response. The specific objectives of the survey were as follows:
1. Determine all-cause mortality among the general population (crude death rate) and among children 6 to 59 months (under-five death rate);
2. Determine the prevalence of acute malnutrition among children 0 to 59 months of age using WHZ and bilateral oedema and among children 6 to 59 months using Middle Upper Arm Circumference (MUAC);
3. Determine the prevalence of chronic malnutrition and underweight among children 0 to 59 months of age;
4. Determine the prevalence of acute malnutrition among women 15 to 49 years of age using MUAC;
5. Assess the prevalence of diarrhoea and use of ORS and zinc among children under-five years in the two weeks preceding the survey;
6. Assess the prevalence of fever and use of antibiotics among children under-five years in the two weeks preceding the survey;
7. Estimate coverage of deworming among children 12 to 59 months of age within the last six months;
8. Determine the coverage of measles immunization among children 12 to 23 months of age;
9. Determine the proportion of children under five with Acute Respiratory Infection (ARI) symptoms and proportion of children with fever who received treatment;
10. Determine the ownership and universal access of mosquito nets, and utilization of mosquito nets by children 0 to 59 months of age;
11. Assess IYCF practices among children 0 to 23 months of age; 12. Assess dietary diversity among women 15 to 49 years of age; 13. Estimate household access to safe water and sanitation facilities.
2. Methodology
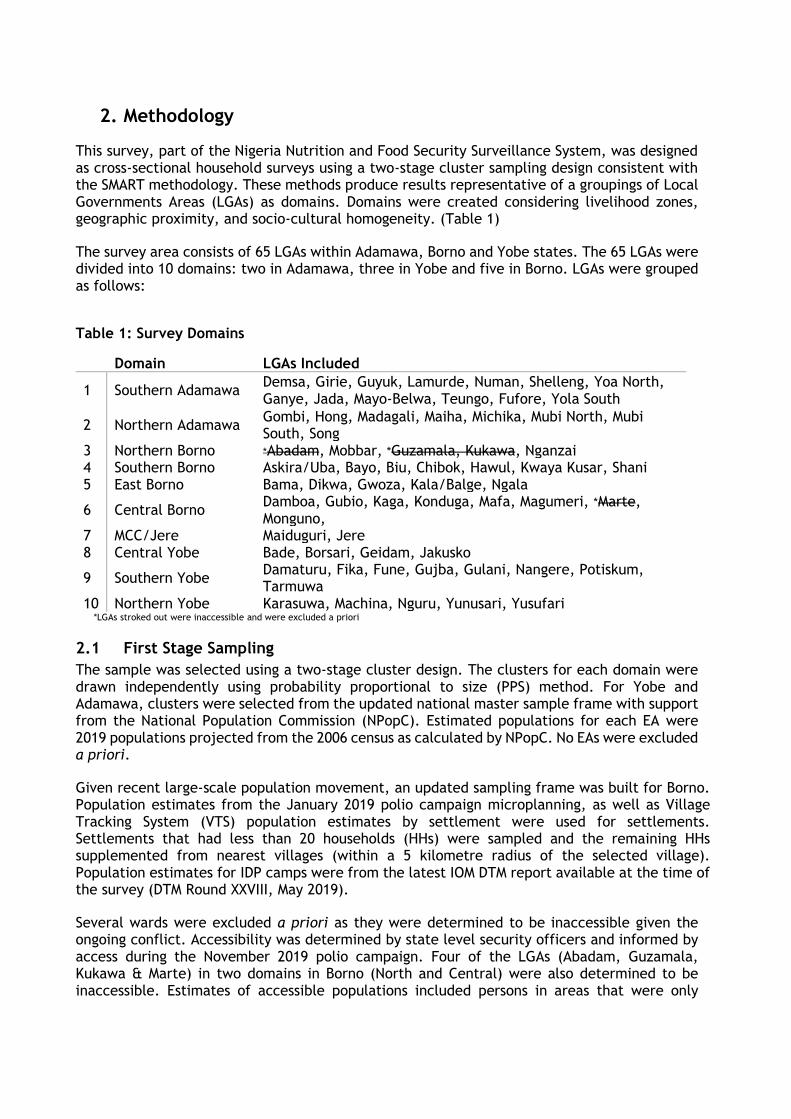
This survey, part of the Nigeria Nutrition and Food Security Surveillance System, was designed as cross-sectional household surveys using a two-stage cluster sampling design consistent with the SMART methodology. These methods produce results representative of a groupings of Local Governments Areas (LGAs) as domains. Domains were created considering livelihood zones, geographic proximity, and socio-cultural homogeneity. (Table 1)
The survey area consists of 65 LGAs within Adamawa, Borno and Yobe states. The 65 LGAs were divided into 10 domains: two in Adamawa, three in Yobe and five in Borno. LGAs were grouped as follows:
Table 1: Survey Domains
Domain LGAs Included
1 Southern Adamawa Demsa, Girie, Guyuk, Lamurde, Numan, Shelleng, Yoa North, Ganye, Jada, Mayo-Belwa, Teungo, Fufore, Yola South
2 Northern Adamawa Gombi, Hong, Madagali, Maiha, Michika, Mubi North, Mubi South, Song
3 Northern Borno *Abadam, Mobbar, *Guzamala, Kukawa, Nganzai 4 Southern Borno Askira/Uba, Bayo, Biu, Chibok, Hawul, Kwaya Kusar, Shani 5 East Borno Bama, Dikwa, Gwoza, Kala/Balge, Ngala
6 Central Borno Damboa, Gubio, Kaga, Konduga, Mafa, Magumeri, *Marte, Monguno,
7 MCC/Jere Maiduguri, Jere 8 Central Yobe Bade, Borsari, Geidam, Jakusko
9 Southern Yobe Damaturu, Fika, Fune, Gujba, Gulani, Nangere, Potiskum, Tarmuwa
10 Northern Yobe Karasuwa, Machina, Nguru, Yunusari, Yusufari *LGAs stroked out were inaccessible and were excluded a priori
2.1 First Stage Sampling
The sample was selected using a two-stage cluster design. The clusters for each domain were drawn independently using probability proportional to size (PPS) method. For Yobe and Adamawa, clusters were selected from the updated national master sample frame with support from the National Population Commission (NPopC). Estimated populations for each EA were 2019 populations projected from the 2006 census as calculated by NPopC. No EAs were excluded a priori.
Given recent large-scale population movement, an updated sampling frame was built for Borno. Population estimates from the January 2019 polio campaign microplanning, as well as Village Tracking System (VTS) population estimates by settlement were used for settlements. Settlements that had less than 20 households (HHs) were sampled and the remaining HHs supplemented from nearest villages (within a 5 kilometre radius of the selected village). Population estimates for IDP camps were from the latest IOM DTM report available at the time of the survey (DTM Round XXVIII, May 2019).
Several wards were excluded a priori as they were determined to be inaccessible given the ongoing conflict. Accessibility was determined by state level security officers and informed by access during the November 2019 polio campaign. Four of the LGAs (Abadam, Guzamala, Kukawa & Marte) in two domains in Borno (North and Central) were also determined to be inaccessible. Estimates of accessible populations included persons in areas that were only
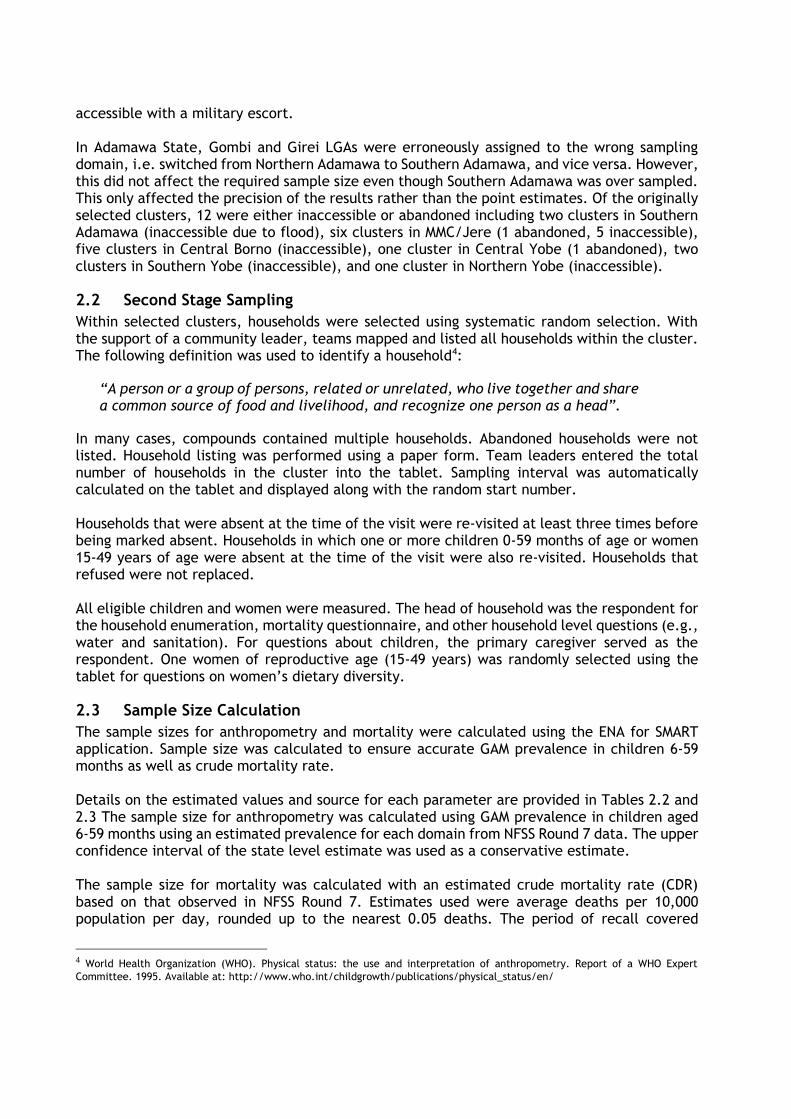
accessible with a military escort. In Adamawa State, Gombi and Girei LGAs were erroneously assigned to the wrong sampling domain, i.e. switched from Northern Adamawa to Southern Adamawa, and vice versa. However, this did not affect the required sample size even though Southern Adamawa was over sampled. This only affected the precision of the results rather than the point estimates. Of the originally selected clusters, 12 were either inaccessible or abandoned including two clusters in Southern Adamawa (inaccessible due to flood), six clusters in MMC/Jere (1 abandoned, 5 inaccessible), five clusters in Central Borno (inaccessible), one cluster in Central Yobe (1 abandoned), two clusters in Southern Yobe (inaccessible), and one cluster in Northern Yobe (inaccessible).
2.2 Second Stage Sampling
Within selected clusters, households were selected using systematic random selection. With the support of a community leader, teams mapped and listed all households within the cluster. The following definition was used to identify a household4:
“A person or a group of persons, related or unrelated, who live together and share a common source of food and livelihood, and recognize one person as a head”.
In many cases, compounds contained multiple households. Abandoned households were not listed. Household listing was performed using a paper form. Team leaders entered the total number of households in the cluster into the tablet. Sampling interval was automatically calculated on the tablet and displayed along with the random start number. Households that were absent at the time of the visit were re-visited at least three times before being marked absent. Households in which one or more children 0-59 months of age or women 15-49 years of age were absent at the time of the visit were also re-visited. Households that refused were not replaced. All eligible children and women were measured. The head of household was the respondent for the household enumeration, mortality questionnaire, and other household level questions (e.g., water and sanitation). For questions about children, the primary caregiver served as the respondent. One women of reproductive age (15-49 years) was randomly selected using the tablet for questions on women’s dietary diversity.
2.3 Sample Size Calculation
The sample sizes for anthropometry and mortality were calculated using the ENA for SMART application. Sample size was calculated to ensure accurate GAM prevalence in children 6-59 months as well as crude mortality rate. Details on the estimated values and source for each parameter are provided in Tables 2.2 and 2.3 The sample size for anthropometry was calculated using GAM prevalence in children aged 6-59 months using an estimated prevalence for each domain from NFSS Round 7 data. The upper confidence interval of the state level estimate was used as a conservative estimate. The sample size for mortality was calculated with an estimated crude mortality rate (CDR) based on that observed in NFSS Round 7. Estimates used were average deaths per 10,000 population per day, rounded up to the nearest 0.05 deaths. The period of recall covered
4 World Health Organization (WHO). Physical status: the use and interpretation of anthropometry. Report of a WHO Expert
Committee. 1995. Available at: http://www.who.int/childgrowth/publications/physical_status/en/

approximately four months, a period of 165 days starting from October 1st, 2018 (Independence Day). The inputs for the sample size calculations for anthropometry and mortality are included in the table 2.
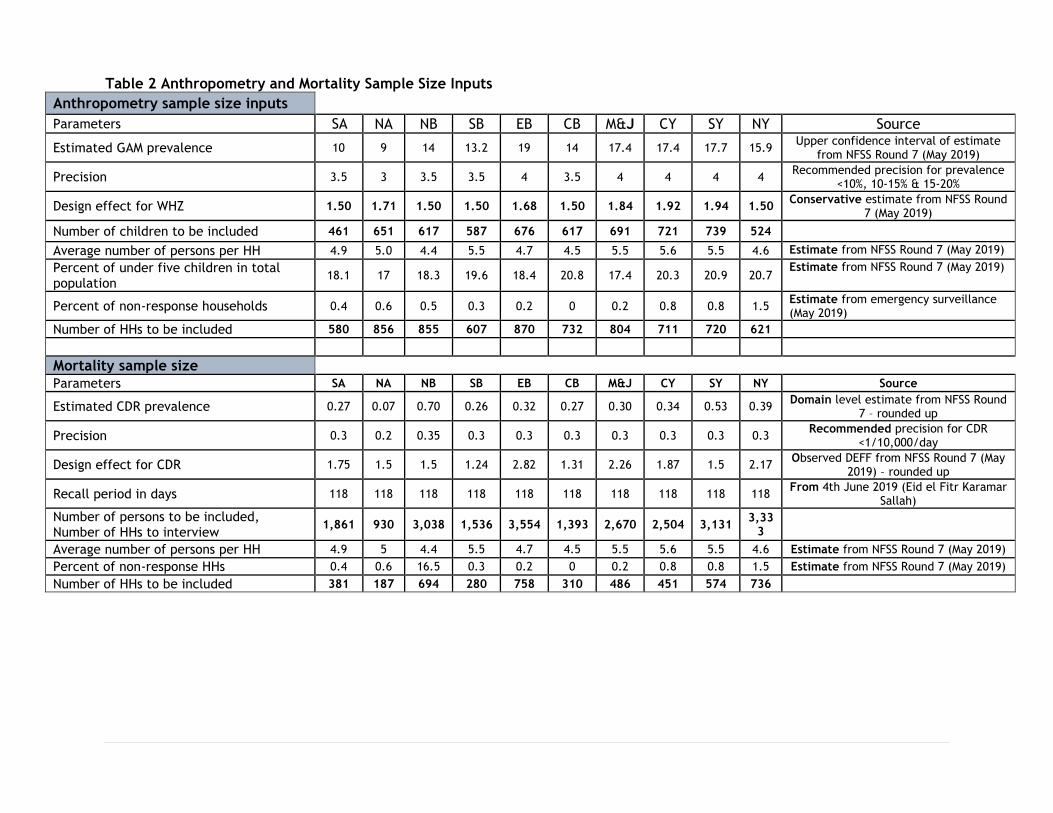
Table 2 Anthropometry and Mortality Sample Size Inputs
Anthropometry sample size inputs
Parameters SA NA NB SB EB CB M&J CY SY NY Source
Estimated GAM prevalence 10 9 14 13.2 19 14 17.4 17.4 17.7 15.9 Upper confidence interval of estimate
from NFSS Round 7 (May 2019)
Precision 3.5 3 3.5 3.5 4 3.5 4 4 4 4 Recommended precision for prevalence
<10%, 10-15% & 15-20%
Design effect for WHZ 1.50 1.71 1.50 1.50 1.68 1.50 1.84 1.92 1.94 1.50 Conservative estimate from NFSS Round
7 (May 2019)
Number of children to be included 461 651 617 587 676 617 691 721 739 524
Average number of persons per HH 4.9 5.0 4.4 5.5 4.7 4.5 5.5 5.6 5.5 4.6 Estimate from NFSS Round 7 (May 2019)
Percent of under five children in total population
18.1 17 18.3 19.6 18.4 20.8 17.4 20.3 20.9 20.7 Estimate from NFSS Round 7 (May 2019)
Percent of non-response households 0.4 0.6 0.5 0.3 0.2 0 0.2 0.8 0.8 1.5 Estimate from emergency surveillance (May 2019)
Number of HHs to be included 580 856 855 607 870 732 804 711 720 621
Mortality sample size Parameters SA NA NB SB EB CB M&J CY SY NY Source
Estimated CDR prevalence 0.27 0.07 0.70 0.26 0.32 0.27 0.30 0.34 0.53 0.39 Domain level estimate from NFSS Round
7 – rounded up
Precision 0.3 0.2 0.35 0.3 0.3 0.3 0.3 0.3 0.3 0.3 Recommended precision for CDR
<1/10,000/day
Design effect for CDR 1.75 1.5 1.5 1.24 2.82 1.31 2.26 1.87 1.5 2.17 Observed DEFF from NFSS Round 7 (May
2019) – rounded up
Recall period in days 118 118 118 118 118 118 118 118 118 118 From 4th June 2019 (Eid el Fitr Karamar
Sallah)
Number of persons to be included, Number of HHs to interview
1,861 930 3,038 1,536 3,554 1,393 2,670 2,504 3,131 3,33
3
Average number of persons per HH 4.9 5 4.4 5.5 4.7 4.5 5.5 5.6 5.5 4.6 Estimate from NFSS Round 7 (May 2019)
Percent of non-response HHs 0.4 0.6 16.5 0.3 0.2 0 0.2 0.8 0.8 1.5 Estimate from NFSS Round 7 (May 2019)
Number of HHs to be included 381 187 694 280 758 310 486 451 574 736
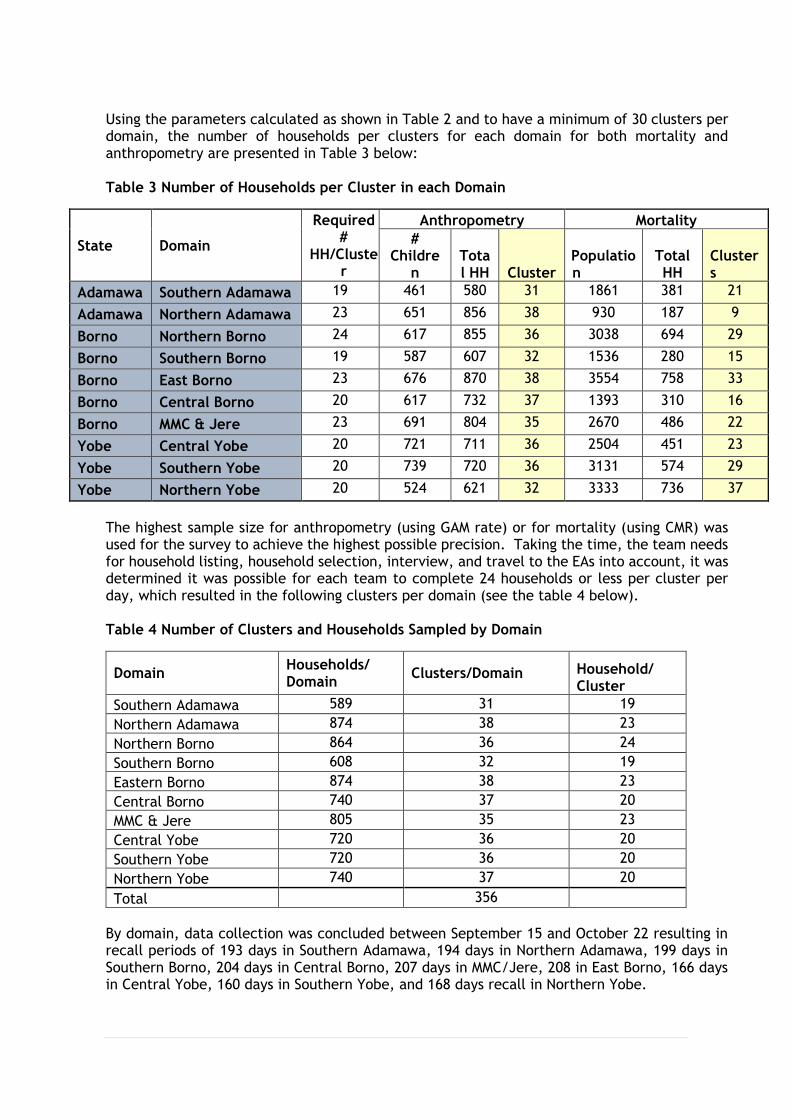
Using the parameters calculated as shown in Table 2 and to have a minimum of 30 clusters per domain, the number of households per clusters for each domain for both mortality and anthropometry are presented in Table 3 below: Table 3 Number of Households per Cluster in each Domain
State Domain
Required #
HH/Cluster
Anthropometry Mortality
# Childre
n Total HH Cluster
Population
Total HH
Clusters
Adamawa Southern Adamawa 19 461 580 31 1861 381 21
Adamawa Northern Adamawa 23 651 856 38 930 187 9
Borno Northern Borno 24 617 855 36 3038 694 29
Borno Southern Borno 19 587 607 32 1536 280 15
Borno East Borno 23 676 870 38 3554 758 33
Borno Central Borno 20 617 732 37 1393 310 16
Borno MMC & Jere 23 691 804 35 2670 486 22
Yobe Central Yobe 20 721 711 36 2504 451 23
Yobe Southern Yobe 20 739 720 36 3131 574 29
Yobe Northern Yobe 20 524 621 32 3333 736 37
The highest sample size for anthropometry (using GAM rate) or for mortality (using CMR) was used for the survey to achieve the highest possible precision. Taking the time, the team needs for household listing, household selection, interview, and travel to the EAs into account, it was determined it was possible for each team to complete 24 households or less per cluster per day, which resulted in the following clusters per domain (see the table 4 below). Table 4 Number of Clusters and Households Sampled by Domain
Domain Households/ Domain
Clusters/Domain Household/ Cluster
Southern Adamawa 589 31 19
Northern Adamawa 874 38 23
Northern Borno 864 36 24
Southern Borno 608 32 19
Eastern Borno 874 38 23
Central Borno 740 37 20
MMC & Jere 805 35 23
Central Yobe 720 36 20
Southern Yobe 720 36 20
Northern Yobe 740 37 20
Total 356
By domain, data collection was concluded between September 15 and October 22 resulting in recall periods of 193 days in Southern Adamawa, 194 days in Northern Adamawa, 199 days in Southern Borno, 204 days in Central Borno, 207 days in MMC/Jere, 208 in East Borno, 166 days in Central Yobe, 160 days in Southern Yobe, and 168 days recall in Northern Yobe.
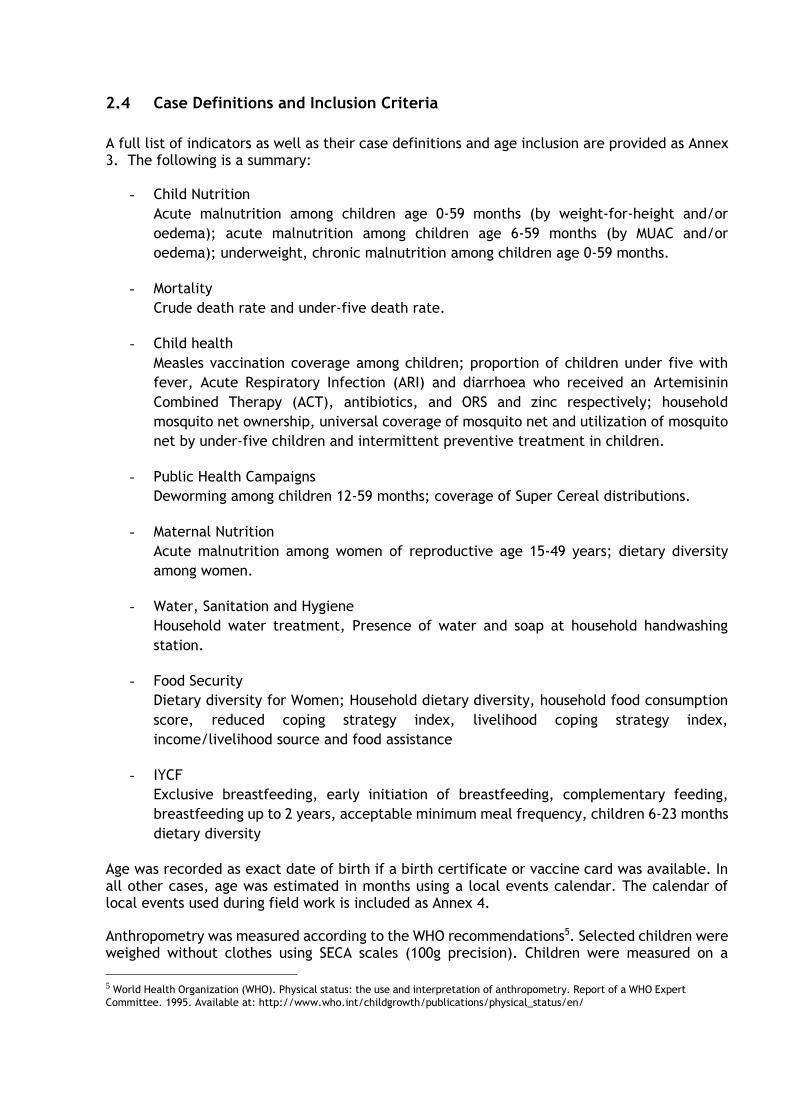
2.4 Case Definitions and Inclusion Criteria
A full list of indicators as well as their case definitions and age inclusion are provided as Annex 3. The following is a summary:
- Child Nutrition
Acute malnutrition among children age 0-59 months (by weight-for-height and/or
oedema); acute malnutrition among children age 6-59 months (by MUAC and/or
oedema); underweight, chronic malnutrition among children age 0-59 months.
- Mortality
Crude death rate and under-five death rate.
- Child health
Measles vaccination coverage among children; proportion of children under five with
fever, Acute Respiratory Infection (ARI) and diarrhoea who received an Artemisinin
Combined Therapy (ACT), antibiotics, and ORS and zinc respectively; household
mosquito net ownership, universal coverage of mosquito net and utilization of mosquito
net by under-five children and intermittent preventive treatment in children.
- Public Health Campaigns
Deworming among children 12-59 months; coverage of Super Cereal distributions.
- Maternal Nutrition
Acute malnutrition among women of reproductive age 15-49 years; dietary diversity
among women.
- Water, Sanitation and Hygiene
Household water treatment, Presence of water and soap at household handwashing
station.
- Food Security
Dietary diversity for Women; Household dietary diversity, household food consumption
score, reduced coping strategy index, livelihood coping strategy index,
income/livelihood source and food assistance
- IYCF
Exclusive breastfeeding, early initiation of breastfeeding, complementary feeding,
breastfeeding up to 2 years, acceptable minimum meal frequency, children 6-23 months
dietary diversity
Age was recorded as exact date of birth if a birth certificate or vaccine card was available. In all other cases, age was estimated in months using a local events calendar. The calendar of local events used during field work is included as Annex 4.
Anthropometry was measured according to the WHO recommendations5. Selected children were weighed without clothes using SECA scales (100g precision). Children were measured on a
5 World Health Organization (WHO). Physical status: the use and interpretation of anthropometry. Report of a WHO Expert
Committee. 1995. Available at: http://www.who.int/childgrowth/publications/physical_status/en/
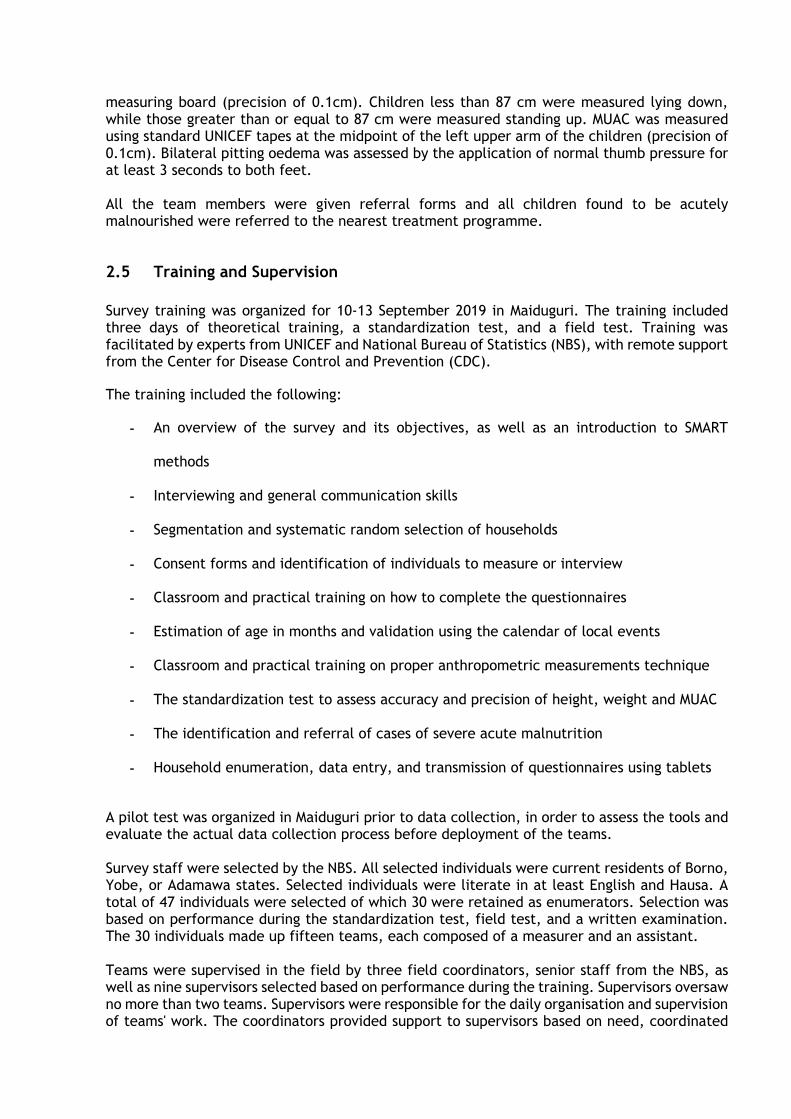
measuring board (precision of 0.1cm). Children less than 87 cm were measured lying down, while those greater than or equal to 87 cm were measured standing up. MUAC was measured using standard UNICEF tapes at the midpoint of the left upper arm of the children (precision of 0.1cm). Bilateral pitting oedema was assessed by the application of normal thumb pressure for at least 3 seconds to both feet.
All the team members were given referral forms and all children found to be acutely
malnourished were referred to the nearest treatment programme.
2.5 Training and Supervision
Survey training was organized for 10-13 September 2019 in Maiduguri. The training included three days of theoretical training, a standardization test, and a field test. Training was facilitated by experts from UNICEF and National Bureau of Statistics (NBS), with remote support from the Center for Disease Control and Prevention (CDC).
The training included the following:
- An overview of the survey and its objectives, as well as an introduction to SMART
methods
- Interviewing and general communication skills
- Segmentation and systematic random selection of households
- Consent forms and identification of individuals to measure or interview
- Classroom and practical training on how to complete the questionnaires
- Estimation of age in months and validation using the calendar of local events
- Classroom and practical training on proper anthropometric measurements technique
- The standardization test to assess accuracy and precision of height, weight and MUAC
- The identification and referral of cases of severe acute malnutrition
- Household enumeration, data entry, and transmission of questionnaires using tablets
A pilot test was organized in Maiduguri prior to data collection, in order to assess the tools and evaluate the actual data collection process before deployment of the teams. Survey staff were selected by the NBS. All selected individuals were current residents of Borno, Yobe, or Adamawa states. Selected individuals were literate in at least English and Hausa. A total of 47 individuals were selected of which 30 were retained as enumerators. Selection was based on performance during the standardization test, field test, and a written examination. The 30 individuals made up fifteen teams, each composed of a measurer and an assistant. Teams were supervised in the field by three field coordinators, senior staff from the NBS, as well as nine supervisors selected based on performance during the training. Supervisors oversaw no more than two teams. Supervisors were responsible for the daily organisation and supervision of teams' work. The coordinators provided support to supervisors based on need, coordinated
security and movement plans, and targeted additional supervision based on feedback received daily from survey manager.
2.6 Data Analysis
Data was entered directly into 3G enabled tablets (Galaxy tab 4 and tab A 7.0) using a questionnaire built in Open Data Kit (opendatakit.org) and transmitted to an ONA online server (ona.io) as soon as connected to a network. The ENA application (version July 9, 2015) was used for analysis of anthropometry and mortality data. Stata (version 14.2) was used for transformation of the data from the ONA output to ENA as well as for analysis of additional indicators.
Tablets were programmed with internal quality checks during field work including a prompt for a re-measurement of potential errors in anthropometric measurements. Enumerators were prompted to re-measure all anthropometric indicators if measurements were outside of the WHO flag criteria: HAZ below –6 or above +6, WAZ below –6 or above +5, WHZ below –5 or above +5, or BMIZ below –5 or above +5). An additional 5% of children were randomly selected for re-measurement. Second measurements were used in the analysis when taken.
For analysis, Z-scores for each child were calculated based on the WHO 2006 growth references population. Extreme values were excluded during analysis based on SMART flag criteria. SMART flags exclude anthropometric indices with -3 to 3 for WHZ, -3 to 3 for HAZ, -3 to 3 for WAZ, from observed mean. The number of values excluded for each indicator are presented in Table 3.2.7.
3. Results
3.1 Final Sample and Data Quality
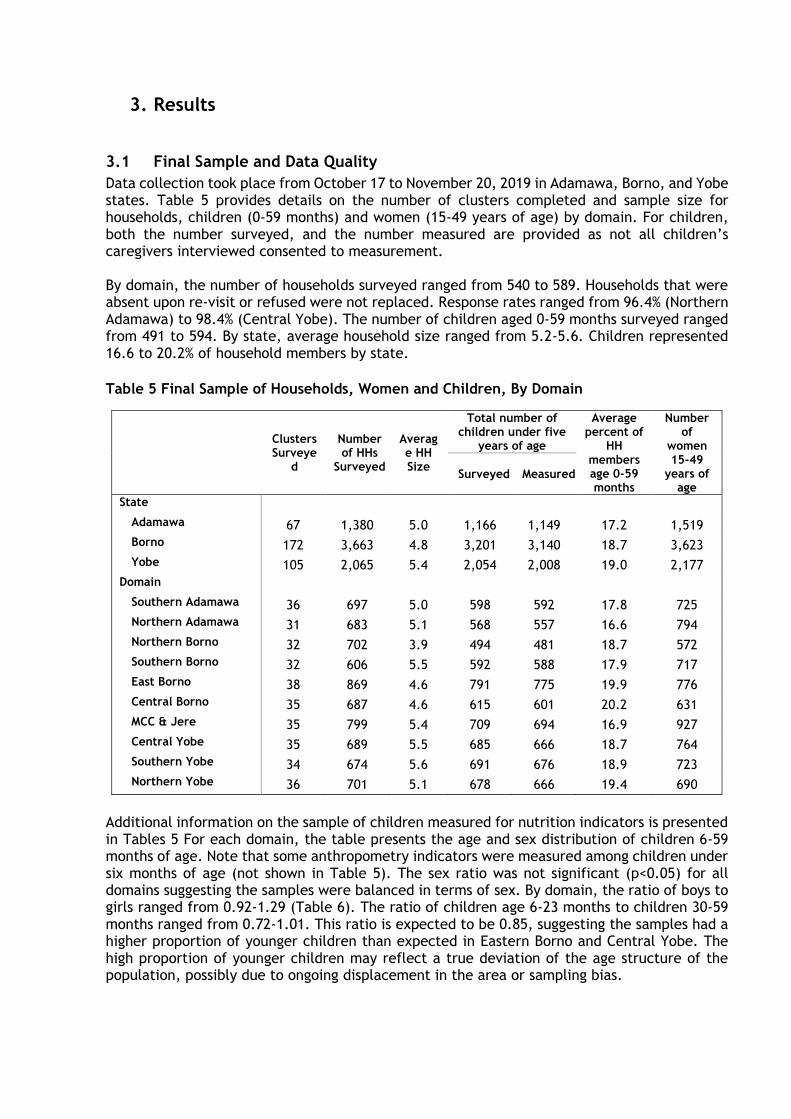
Data collection took place from October 17 to November 20, 2019 in Adamawa, Borno, and Yobe states. Table 5 provides details on the number of clusters completed and sample size for households, children (0-59 months) and women (15-49 years of age) by domain. For children, both the number surveyed, and the number measured are provided as not all children’s caregivers interviewed consented to measurement. By domain, the number of households surveyed ranged from 540 to 589. Households that were absent upon re-visit or refused were not replaced. Response rates ranged from 96.4% (Northern Adamawa) to 98.4% (Central Yobe). The number of children aged 0-59 months surveyed ranged from 491 to 594. By state, average household size ranged from 5.2-5.6. Children represented 16.6 to 20.2% of household members by state.
Table 5 Final Sample of Households, Women and Children, By Domain
Clusters Surveye
d
Number of HHs
Surveyed
Average HH Size
Total number of children under five
years of age
Average percent of
HH members age 0-59 months
Number of
women 15-49
years of age
Surveyed Measured
State
Adamawa 67 1,380 5.0 1,166 1,149 17.2 1,519
Borno 172 3,663 4.8 3,201 3,140 18.7 3,623
Yobe 105 2,065 5.4 2,054 2,008 19.0 2,177
Domain
Southern Adamawa 36 697 5.0 598 592 17.8 725
Northern Adamawa 31 683 5.1 568 557 16.6 794
Northern Borno 32 702 3.9 494 481 18.7 572
Southern Borno 32 606 5.5 592 588 17.9 717
East Borno 38 869 4.6 791 775 19.9 776
Central Borno 35 687 4.6 615 601 20.2 631
MCC & Jere 35 799 5.4 709 694 16.9 927
Central Yobe 35 689 5.5 685 666 18.7 764
Southern Yobe 34 674 5.6 691 676 18.9 723
Northern Yobe 36 701 5.1 678 666 19.4 690
Additional information on the sample of children measured for nutrition indicators is presented in Tables 5 For each domain, the table presents the age and sex distribution of children 6-59 months of age. Note that some anthropometry indicators were measured among children under six months of age (not shown in Table 5). The sex ratio was not significant (p<0.05) for all domains suggesting the samples were balanced in terms of sex. By domain, the ratio of boys to girls ranged from 0.92-1.29 (Table 6). The ratio of children age 6-23 months to children 30-59 months ranged from 0.72-1.01. This ratio is expected to be 0.85, suggesting the samples had a higher proportion of younger children than expected in Eastern Borno and Central Yobe. The high proportion of younger children may reflect a true deviation of the age structure of the population, possibly due to ongoing displacement in the area or sampling bias.
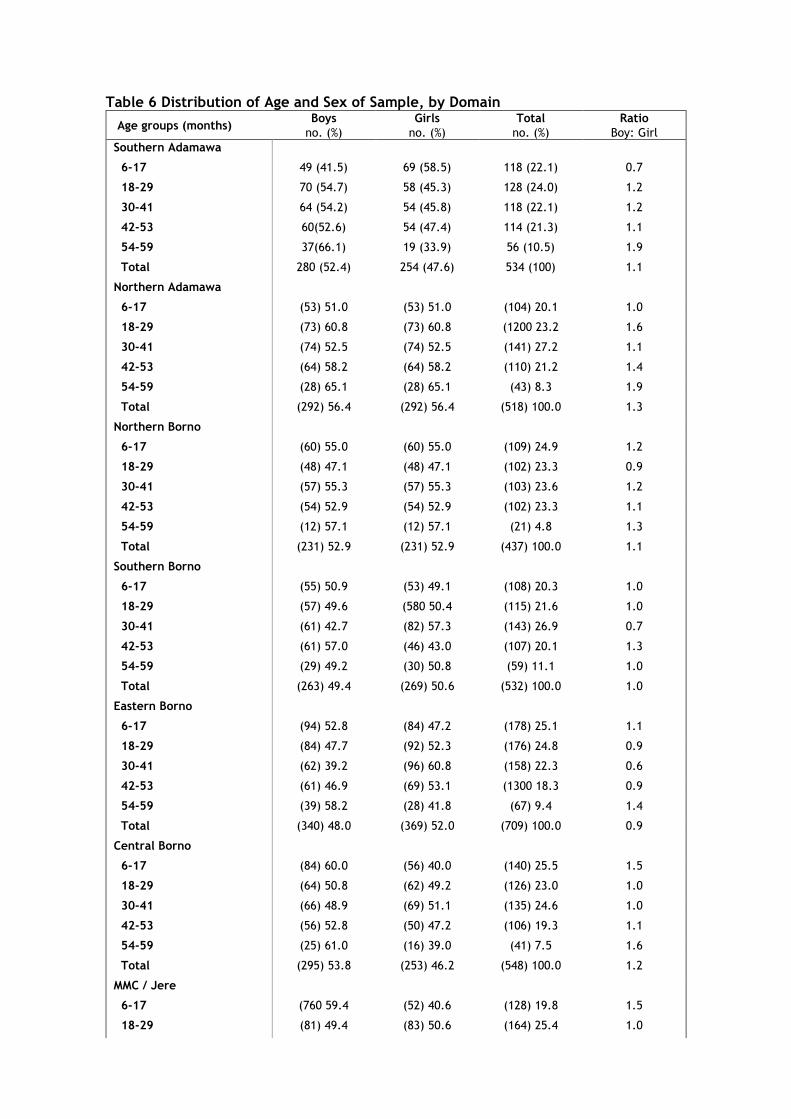
Table 6 Distribution of Age and Sex of Sample, by Domain
Age groups (months) Boys Girls Total Ratio
no. (%) no. (%) no. (%) Boy: Girl
Southern Adamawa
6-17 49 (41.5) 69 (58.5) 118 (22.1) 0.7
18-29 70 (54.7) 58 (45.3) 128 (24.0) 1.2
30-41 64 (54.2) 54 (45.8) 118 (22.1) 1.2
42-53 60(52.6) 54 (47.4) 114 (21.3) 1.1
54-59 37(66.1) 19 (33.9) 56 (10.5) 1.9
Total 280 (52.4) 254 (47.6) 534 (100) 1.1
Northern Adamawa
6-17 (53) 51.0 (53) 51.0 (104) 20.1 1.0
18-29 (73) 60.8 (73) 60.8 (1200 23.2 1.6
30-41 (74) 52.5 (74) 52.5 (141) 27.2 1.1
42-53 (64) 58.2 (64) 58.2 (110) 21.2 1.4
54-59 (28) 65.1 (28) 65.1 (43) 8.3 1.9
Total (292) 56.4 (292) 56.4 (518) 100.0 1.3
Northern Borno
6-17 (60) 55.0 (60) 55.0 (109) 24.9 1.2
18-29 (48) 47.1 (48) 47.1 (102) 23.3 0.9
30-41 (57) 55.3 (57) 55.3 (103) 23.6 1.2
42-53 (54) 52.9 (54) 52.9 (102) 23.3 1.1
54-59 (12) 57.1 (12) 57.1 (21) 4.8 1.3
Total (231) 52.9 (231) 52.9 (437) 100.0 1.1
Southern Borno
6-17 (55) 50.9 (53) 49.1 (108) 20.3 1.0
18-29 (57) 49.6 (580 50.4 (115) 21.6 1.0
30-41 (61) 42.7 (82) 57.3 (143) 26.9 0.7
42-53 (61) 57.0 (46) 43.0 (107) 20.1 1.3
54-59 (29) 49.2 (30) 50.8 (59) 11.1 1.0
Total (263) 49.4 (269) 50.6 (532) 100.0 1.0
Eastern Borno
6-17 (94) 52.8 (84) 47.2 (178) 25.1 1.1
18-29 (84) 47.7 (92) 52.3 (176) 24.8 0.9
30-41 (62) 39.2 (96) 60.8 (158) 22.3 0.6
42-53 (61) 46.9 (69) 53.1 (1300 18.3 0.9
54-59 (39) 58.2 (28) 41.8 (67) 9.4 1.4
Total (340) 48.0 (369) 52.0 (709) 100.0 0.9
Central Borno
6-17 (84) 60.0 (56) 40.0 (140) 25.5 1.5
18-29 (64) 50.8 (62) 49.2 (126) 23.0 1.0
30-41 (66) 48.9 (69) 51.1 (135) 24.6 1.0
42-53 (56) 52.8 (50) 47.2 (106) 19.3 1.1
54-59 (25) 61.0 (16) 39.0 (41) 7.5 1.6
Total (295) 53.8 (253) 46.2 (548) 100.0 1.2
MMC / Jere
6-17 (760 59.4 (52) 40.6 (128) 19.8 1.5
18-29 (81) 49.4 (83) 50.6 (164) 25.4 1.0
30-41 (72) 47.7 (79) 52.3 (151) 23.4 0.9
42-53 (74) 49.7 (75) 50.3 (149) 23.1 1.0
54-59 (26) 49.1 (27) 50.9 (53) 8.2 1.0
Total (329) 51.0 (316) 49.0 (645) 100.0 1.0
Northern Yobe
6-17 (64) 43.5 (83) 56.5 (147) 24.3 0.8
18-29 (690 45.4 (83) 54.6 (152) 25.1 0.8
30-41 (77) 50.3 (76) 49.7 (153) 25.2 1.0
42-53 (53) 49.5 (54) 50.5 (107) 17.7 1.0
54-59 (27) 57.4 (20) 42.6 (47) 7.8 1.4
Total (290) 47.9 (316) 52.1 (606) 100.0 0.9
Central Yobe
6-17 (70) 43.2 (92) 56.8 (162) 26.1 0.8
18-29 (80) 53.3 (70) 46.7 (150) 24.2 1.1
30-41 (60) 45.8 (71) 54.2 (131) 21.1 0.8
42-53 (75) 55.1 (61) 44.9 (136) 21.9 1.2
54-59 (17) 41.5 (24) 58.5 (41) 6.6 0.7
Total (302) 48.7 (318) 51.3 (620) 100.0 0.9
Southern Yobe
6-17 (64) 46.0 (75) 54.0 (139) 22.3 0.9
18-29 (78) 47.6 (86) 52.4 (164) 26.4 0.9
30-41 (77) 53.8 (66) 46.2 (143) 23.0 1.2
42-53 (76) 56.3 (59) 43.7 (135) 21.7 1.3
54-59 (23) 56.1 (18) 43.9 (41) 6.6 1.3
Total (318) 51.1 (304) 48.9 (622) 100.0 1.0
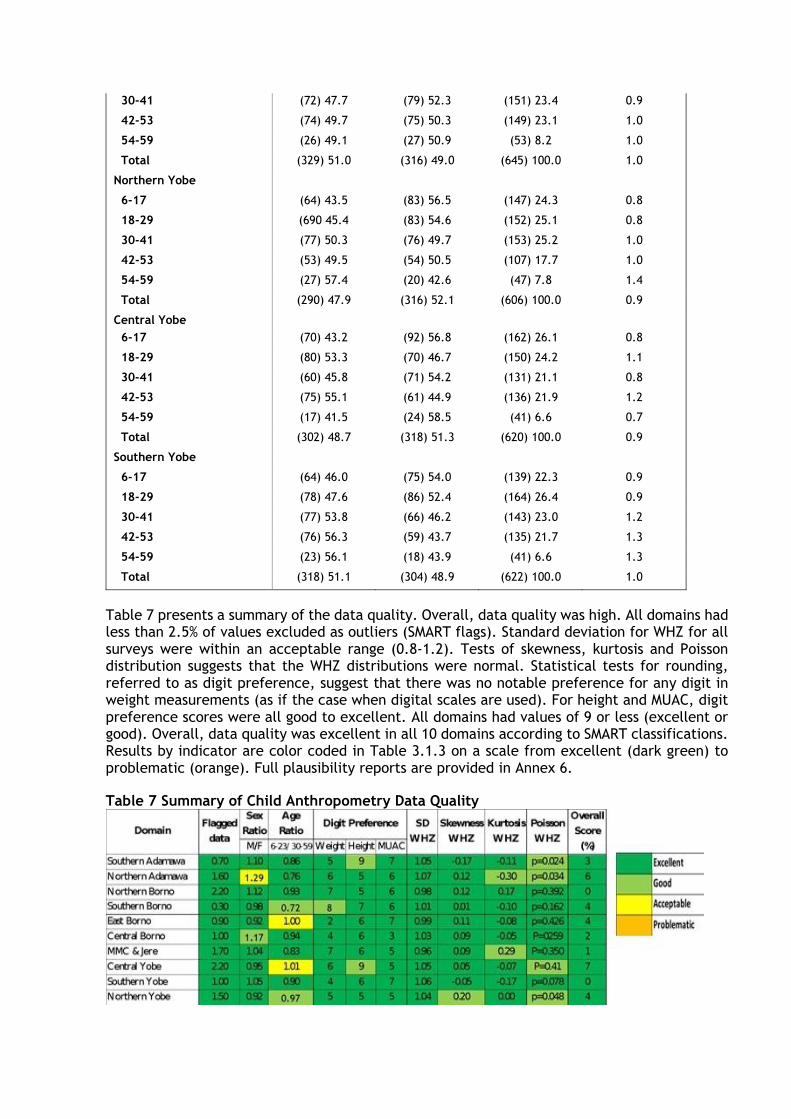
Table 7 presents a summary of the data quality. Overall, data quality was high. All domains had less than 2.5% of values excluded as outliers (SMART flags). Standard deviation for WHZ for all surveys were within an acceptable range (0.8-1.2). Tests of skewness, kurtosis and Poisson distribution suggests that the WHZ distributions were normal. Statistical tests for rounding, referred to as digit preference, suggest that there was no notable preference for any digit in weight measurements (as if the case when digital scales are used). For height and MUAC, digit preference scores were all good to excellent. All domains had values of 9 or less (excellent or good). Overall, data quality was excellent in all 10 domains according to SMART classifications. Results by indicator are color coded in Table 3.1.3 on a scale from excellent (dark green) to problematic (orange). Full plausibility reports are provided in Annex 6.
Table 7 Summary of Child Anthropometry Data Quality
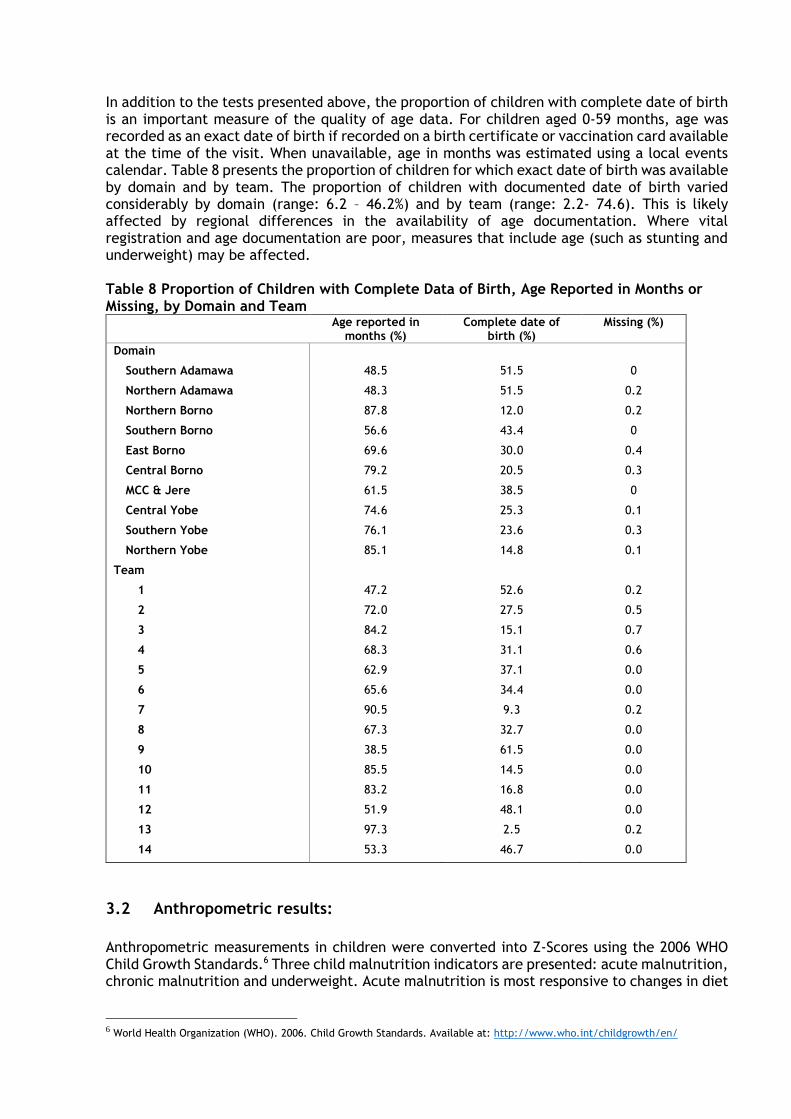
In addition to the tests presented above, the proportion of children with complete date of birth is an important measure of the quality of age data. For children aged 0-59 months, age was recorded as an exact date of birth if recorded on a birth certificate or vaccination card available at the time of the visit. When unavailable, age in months was estimated using a local events calendar. Table 8 presents the proportion of children for which exact date of birth was available by domain and by team. The proportion of children with documented date of birth varied considerably by domain (range: 6.2 – 46.2%) and by team (range: 2.2- 74.6). This is likely affected by regional differences in the availability of age documentation. Where vital registration and age documentation are poor, measures that include age (such as stunting and underweight) may be affected. Table 8 Proportion of Children with Complete Data of Birth, Age Reported in Months or Missing, by Domain and Team
Age reported in months (%)
Complete date of birth (%)
Missing (%)
Domain
Southern Adamawa 48.5 51.5 0
Northern Adamawa 48.3 51.5 0.2
Northern Borno 87.8 12.0 0.2
Southern Borno 56.6 43.4 0
East Borno 69.6 30.0 0.4
Central Borno 79.2 20.5 0.3
MCC & Jere 61.5 38.5 0
Central Yobe 74.6 25.3 0.1
Southern Yobe 76.1 23.6 0.3
Northern Yobe 85.1 14.8 0.1
Team
1 47.2 52.6 0.2
2 72.0 27.5 0.5
3 84.2 15.1 0.7
4 68.3 31.1 0.6
5 62.9 37.1 0.0
6 65.6 34.4 0.0
7 90.5 9.3 0.2
8 67.3 32.7 0.0
9 38.5 61.5 0.0
10 85.5 14.5 0.0
11 83.2 16.8 0.0
12 51.9 48.1 0.0
13 97.3 2.5 0.2
14 53.3 46.7 0.0
3.2 Anthropometric results:
Anthropometric measurements in children were converted into Z-Scores using the 2006 WHO Child Growth Standards.6 Three child malnutrition indicators are presented: acute malnutrition, chronic malnutrition and underweight. Acute malnutrition is most responsive to changes in diet
6 World Health Organization (WHO). 2006. Child Growth Standards. Available at: http://www.who.int/childgrowth/en/
and recent shocks including disease and is the most dangerous form of malnutrition in terms of mortality risk; as such it is the primary indicator of interest in the context of an emergency.
3.2.1 Acute Malnutrition (WHZ and/or Bilateral Oedema)
Tables 9 present prevalence of acute malnutrition by state and domain among children 6-59 months of age based on weight-for-height z-scores and/or oedema, disaggregated by sex. Age disaggregation by domain for children 6-59 months of age is presented in Table 10. Prevalence of GAM was high in Yobe (11.5%), where the prevalence of SAM was 1.5%. By sampling domain, prevalence of GAM was highest in Central Yobe (13.8%), followed by Southern Yobe (11.1%). Prevalence was higher among boys than girls in all domains with the exception of MMC & Jere and Central Borno. Disaggregation by age showed that prevalence of GAM was highest among children in the younger age cohort of 6-17 months.
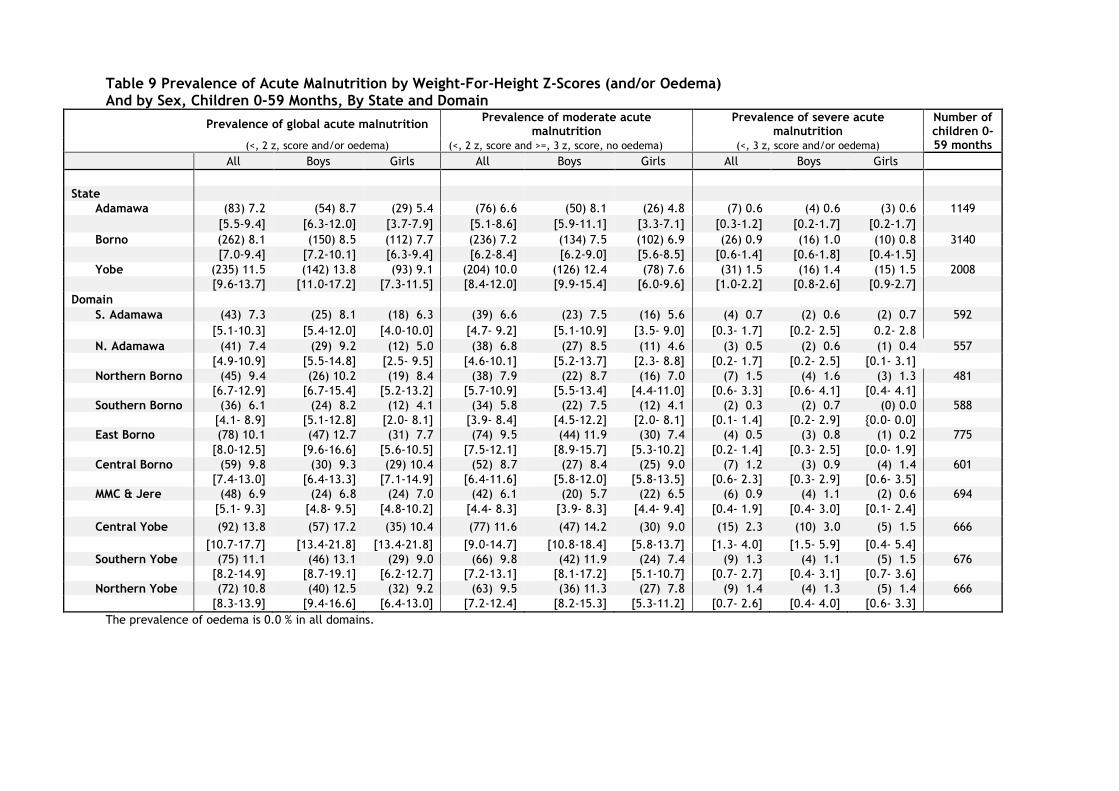
Table 9 Prevalence of Acute Malnutrition by Weight-For-Height Z-Scores (and/or Oedema) And by Sex, Children 0-59 Months, By State and Domain
Prevalence of global acute malnutrition
Prevalence of moderate acute malnutrition
Prevalence of severe acute malnutrition
Number of children 0- 59 months (<, 2 z, score and/or oedema) (<, 2 z, score and >=, 3 z, score, no oedema) (<, 3 z, score and/or oedema)
All Boys Girls All Boys Girls All Boys Girls
State
Adamawa (83) 7.2 (54) 8.7 (29) 5.4 (76) 6.6 (50) 8.1 (26) 4.8 (7) 0.6 (4) 0.6 (3) 0.6 1149
[5.5-9.4] [6.3-12.0] [3.7-7.9] [5.1-8.6] [5.9-11.1] [3.3-7.1] [0.3-1.2] [0.2-1.7] [0.2-1.7] Borno (262) 8.1 (150) 8.5 (112) 7.7 (236) 7.2 (134) 7.5 (102) 6.9 (26) 0.9 (16) 1.0 (10) 0.8 3140
[7.0-9.4] [7.2-10.1] [6.3-9.4] [6.2-8.4] [6.2-9.0] [5.6-8.5] [0.6-1.4] [0.6-1.8] [0.4-1.5] Yobe (235) 11.5 (142) 13.8 (93) 9.1 (204) 10.0 (126) 12.4 (78) 7.6 (31) 1.5 (16) 1.4 (15) 1.5 2008
[9.6-13.7] [11.0-17.2] [7.3-11.5] [8.4-12.0] [9.9-15.4] [6.0-9.6] [1.0-2.2] [0.8-2.6] [0.9-2.7] Domain
S. Adamawa (43) 7.3 (25) 8.1 (18) 6.3 (39) 6.6 (23) 7.5 (16) 5.6 (4) 0.7 (2) 0.6 (2) 0.7 592
[5.1-10.3] [5.4-12.0] [4.0-10.0] [4.7- 9.2] [5.1-10.9] [3.5- 9.0] [0.3- 1.7] [0.2- 2.5] 0.2- 2.8
N. Adamawa (41) 7.4 (29) 9.2 (12) 5.0 (38) 6.8 (27) 8.5 (11) 4.6 (3) 0.5 (2) 0.6 (1) 0.4 557
[4.9-10.9] [5.5-14.8] [2.5- 9.5] [4.6-10.1] [5.2-13.7] [2.3- 8.8] [0.2- 1.7] [0.2- 2.5] [0.1- 3.1] Northern Borno (45) 9.4 (26) 10.2 (19) 8.4 (38) 7.9 (22) 8.7 (16) 7.0 (7) 1.5 (4) 1.6 (3) 1.3 481
[6.7-12.9] [6.7-15.4] [5.2-13.2] [5.7-10.9] [5.5-13.4] [4.4-11.0] [0.6- 3.3] [0.6- 4.1] [0.4- 4.1] Southern Borno (36) 6.1 (24) 8.2 (12) 4.1 (34) 5.8 (22) 7.5 (12) 4.1 (2) 0.3 (2) 0.7 (0) 0.0 588
[4.1- 8.9] [5.1-12.8] [2.0- 8.1] [3.9- 8.4] [4.5-12.2] [2.0- 8.1] [0.1- 1.4] [0.2- 2.9] {0.0- 0.0] East Borno (78) 10.1 (47) 12.7 (31) 7.7 (74) 9.5 (44) 11.9 (30) 7.4 (4) 0.5 (3) 0.8 (1) 0.2 775
[8.0-12.5] [9.6-16.6] [5.6-10.5] [7.5-12.1] [8.9-15.7] [5.3-10.2] [0.2- 1.4] [0.3- 2.5] [0.0- 1.9] Central Borno (59) 9.8 (30) 9.3 (29) 10.4 (52) 8.7 (27) 8.4 (25) 9.0 (7) 1.2 (3) 0.9 (4) 1.4 601
[7.4-13.0] [6.4-13.3] [7.1-14.9] [6.4-11.6] [5.8-12.0] [5.8-13.5] [0.6- 2.3] [0.3- 2.9] [0.6- 3.5] MMC & Jere (48) 6.9 (24) 6.8 (24) 7.0 (42) 6.1 (20) 5.7 (22) 6.5 (6) 0.9 (4) 1.1 (2) 0.6 694
[5.1- 9.3] [4.8- 9.5] [4.8-10.2] [4.4- 8.3] [3.9- 8.3] [4.4- 9.4] [0.4- 1.9] [0.4- 3.0] [0.1- 2.4]
Central Yobe (92) 13.8 (57) 17.2 (35) 10.4 (77) 11.6 (47) 14.2 (30) 9.0 (15) 2.3 (10) 3.0 (5) 1.5 666
[10.7-17.7] [13.4-21.8] [13.4-21.8] [9.0-14.7] [10.8-18.4] [5.8-13.7] [1.3- 4.0] [1.5- 5.9] [0.4- 5.4] Southern Yobe (75) 11.1 (46) 13.1 (29) 9.0 (66) 9.8 (42) 11.9 (24) 7.4 (9) 1.3 (4) 1.1 (5) 1.5 676
[8.2-14.9] [8.7-19.1] [6.2-12.7] [7.2-13.1] [8.1-17.2] [5.1-10.7] [0.7- 2.7] [0.4- 3.1] [0.7- 3.6] Northern Yobe (72) 10.8 (40) 12.5 (32) 9.2 (63) 9.5 (36) 11.3 (27) 7.8 (9) 1.4 (4) 1.3 (5) 1.4 666
[8.3-13.9] [9.4-16.6] [6.4-13.0] [7.2-12.4] [8.2-15.3] [5.3-11.2] [0.7- 2.6] [0.4- 4.0] [0.6- 3.3]
The prevalence of oedema is 0.0 % in all domains.
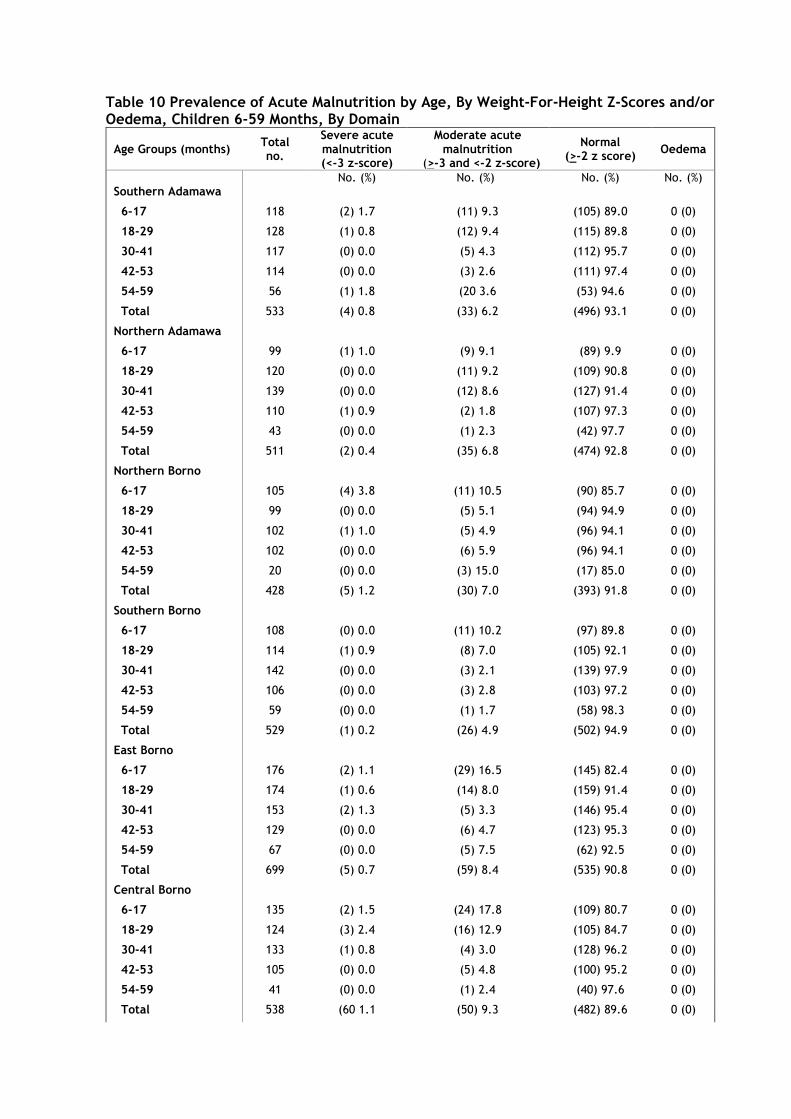
Table 10 Prevalence of Acute Malnutrition by Age, By Weight-For-Height Z-Scores and/or Oedema, Children 6-59 Months, By Domain
Age Groups (months) Total no.
Severe acute malnutrition (<-3 z-score)
Moderate acute malnutrition
(>-3 and <-2 z-score)
Normal (>-2 z score)
Oedema
No. (%) No. (%) No. (%) No. (%) Southern Adamawa
6-17 118 (2) 1.7 (11) 9.3 (105) 89.0 0 (0)
18-29 128 (1) 0.8 (12) 9.4 (115) 89.8 0 (0)
30-41 117 (0) 0.0 (5) 4.3 (112) 95.7 0 (0)
42-53 114 (0) 0.0 (3) 2.6 (111) 97.4 0 (0)
54-59 56 (1) 1.8 (20 3.6 (53) 94.6 0 (0)
Total 533 (4) 0.8 (33) 6.2 (496) 93.1 0 (0)
Northern Adamawa
6-17 99 (1) 1.0 (9) 9.1 (89) 9.9 0 (0)
18-29 120 (0) 0.0 (11) 9.2 (109) 90.8 0 (0)
30-41 139 (0) 0.0 (12) 8.6 (127) 91.4 0 (0)
42-53 110 (1) 0.9 (2) 1.8 (107) 97.3 0 (0)
54-59 43 (0) 0.0 (1) 2.3 (42) 97.7 0 (0)
Total 511 (2) 0.4 (35) 6.8 (474) 92.8 0 (0)
Northern Borno
6-17 105 (4) 3.8 (11) 10.5 (90) 85.7 0 (0)
18-29 99 (0) 0.0 (5) 5.1 (94) 94.9 0 (0)
30-41 102 (1) 1.0 (5) 4.9 (96) 94.1 0 (0)
42-53 102 (0) 0.0 (6) 5.9 (96) 94.1 0 (0)
54-59 20 (0) 0.0 (3) 15.0 (17) 85.0 0 (0)
Total 428 (5) 1.2 (30) 7.0 (393) 91.8 0 (0)
Southern Borno
6-17 108 (0) 0.0 (11) 10.2 (97) 89.8 0 (0)
18-29 114 (1) 0.9 (8) 7.0 (105) 92.1 0 (0)
30-41 142 (0) 0.0 (3) 2.1 (139) 97.9 0 (0)
42-53 106 (0) 0.0 (3) 2.8 (103) 97.2 0 (0)
54-59 59 (0) 0.0 (1) 1.7 (58) 98.3 0 (0)
Total 529 (1) 0.2 (26) 4.9 (502) 94.9 0 (0)
East Borno
6-17 176 (2) 1.1 (29) 16.5 (145) 82.4 0 (0)
18-29 174 (1) 0.6 (14) 8.0 (159) 91.4 0 (0)
30-41 153 (2) 1.3 (5) 3.3 (146) 95.4 0 (0)
42-53 129 (0) 0.0 (6) 4.7 (123) 95.3 0 (0)
54-59 67 (0) 0.0 (5) 7.5 (62) 92.5 0 (0)
Total 699 (5) 0.7 (59) 8.4 (535) 90.8 0 (0)
Central Borno
6-17 135 (2) 1.5 (24) 17.8 (109) 80.7 0 (0)
18-29 124 (3) 2.4 (16) 12.9 (105) 84.7 0 (0)
30-41 133 (1) 0.8 (4) 3.0 (128) 96.2 0 (0)
42-53 105 (0) 0.0 (5) 4.8 (100) 95.2 0 (0)
54-59 41 (0) 0.0 (1) 2.4 (40) 97.6 0 (0)
Total 538 (60 1.1 (50) 9.3 (482) 89.6 0 (0)
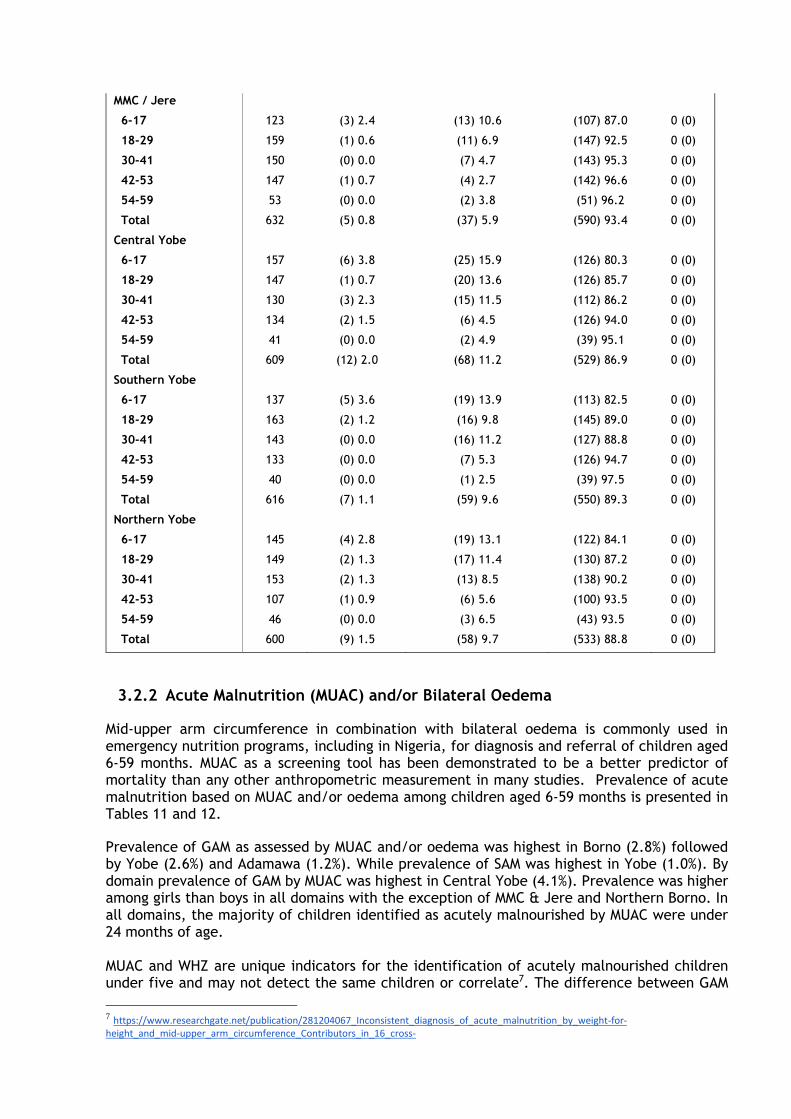
MMC / Jere
6-17 123 (3) 2.4 (13) 10.6 (107) 87.0 0 (0)
18-29 159 (1) 0.6 (11) 6.9 (147) 92.5 0 (0)
30-41 150 (0) 0.0 (7) 4.7 (143) 95.3 0 (0)
42-53 147 (1) 0.7 (4) 2.7 (142) 96.6 0 (0)
54-59 53 (0) 0.0 (2) 3.8 (51) 96.2 0 (0)
Total 632 (5) 0.8 (37) 5.9 (590) 93.4 0 (0)
Central Yobe
6-17 157 (6) 3.8 (25) 15.9 (126) 80.3 0 (0)
18-29 147 (1) 0.7 (20) 13.6 (126) 85.7 0 (0)
30-41 130 (3) 2.3 (15) 11.5 (112) 86.2 0 (0)
42-53 134 (2) 1.5 (6) 4.5 (126) 94.0 0 (0)
54-59 41 (0) 0.0 (2) 4.9 (39) 95.1 0 (0)
Total 609 (12) 2.0 (68) 11.2 (529) 86.9 0 (0)
Southern Yobe
6-17 137 (5) 3.6 (19) 13.9 (113) 82.5 0 (0)
18-29 163 (2) 1.2 (16) 9.8 (145) 89.0 0 (0)
30-41 143 (0) 0.0 (16) 11.2 (127) 88.8 0 (0)
42-53 133 (0) 0.0 (7) 5.3 (126) 94.7 0 (0)
54-59 40 (0) 0.0 (1) 2.5 (39) 97.5 0 (0)
Total 616 (7) 1.1 (59) 9.6 (550) 89.3 0 (0)
Northern Yobe
6-17 145 (4) 2.8 (19) 13.1 (122) 84.1 0 (0)
18-29 149 (2) 1.3 (17) 11.4 (130) 87.2 0 (0)
30-41 153 (2) 1.3 (13) 8.5 (138) 90.2 0 (0)
42-53 107 (1) 0.9 (6) 5.6 (100) 93.5 0 (0)
54-59 46 (0) 0.0 (3) 6.5 (43) 93.5 0 (0)
Total 600 (9) 1.5 (58) 9.7 (533) 88.8 0 (0)
3.2.2 Acute Malnutrition (MUAC) and/or Bilateral Oedema
Mid-upper arm circumference in combination with bilateral oedema is commonly used in emergency nutrition programs, including in Nigeria, for diagnosis and referral of children aged 6-59 months. MUAC as a screening tool has been demonstrated to be a better predictor of mortality than any other anthropometric measurement in many studies. Prevalence of acute malnutrition based on MUAC and/or oedema among children aged 6-59 months is presented in Tables 11 and 12.
Prevalence of GAM as assessed by MUAC and/or oedema was highest in Borno (2.8%) followed by Yobe (2.6%) and Adamawa (1.2%). While prevalence of SAM was highest in Yobe (1.0%). By domain prevalence of GAM by MUAC was highest in Central Yobe (4.1%). Prevalence was higher among girls than boys in all domains with the exception of MMC & Jere and Northern Borno. In all domains, the majority of children identified as acutely malnourished by MUAC were under 24 months of age. MUAC and WHZ are unique indicators for the identification of acutely malnourished children under five and may not detect the same children or correlate7. The difference between GAM
7 https://www.researchgate.net/publication/281204067_Inconsistent_diagnosis_of_acute_malnutrition_by_weight-for-height_and_mid-upper_arm_circumference_Contributors_in_16_cross-
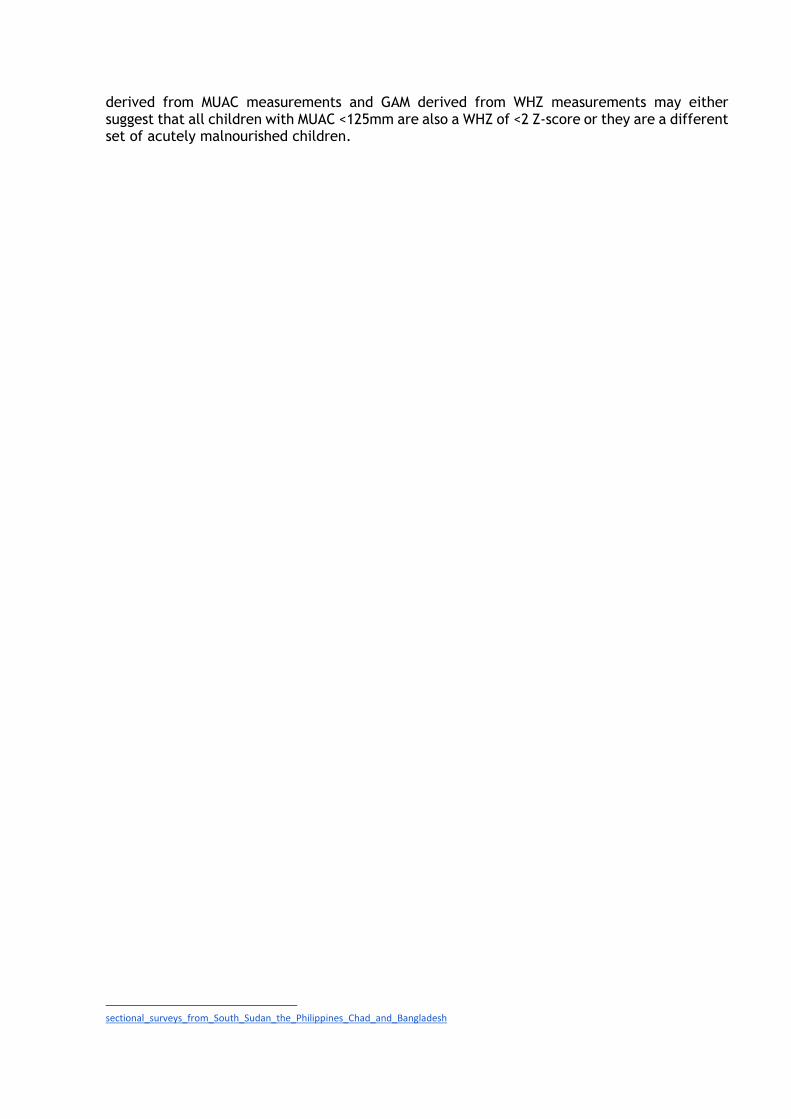
derived from MUAC measurements and GAM derived from WHZ measurements may either suggest that all children with MUAC <125mm are also a WHZ of <2 Z-score or they are a different set of acutely malnourished children.
sectional_surveys_from_South_Sudan_the_Philippines_Chad_and_Bangladesh
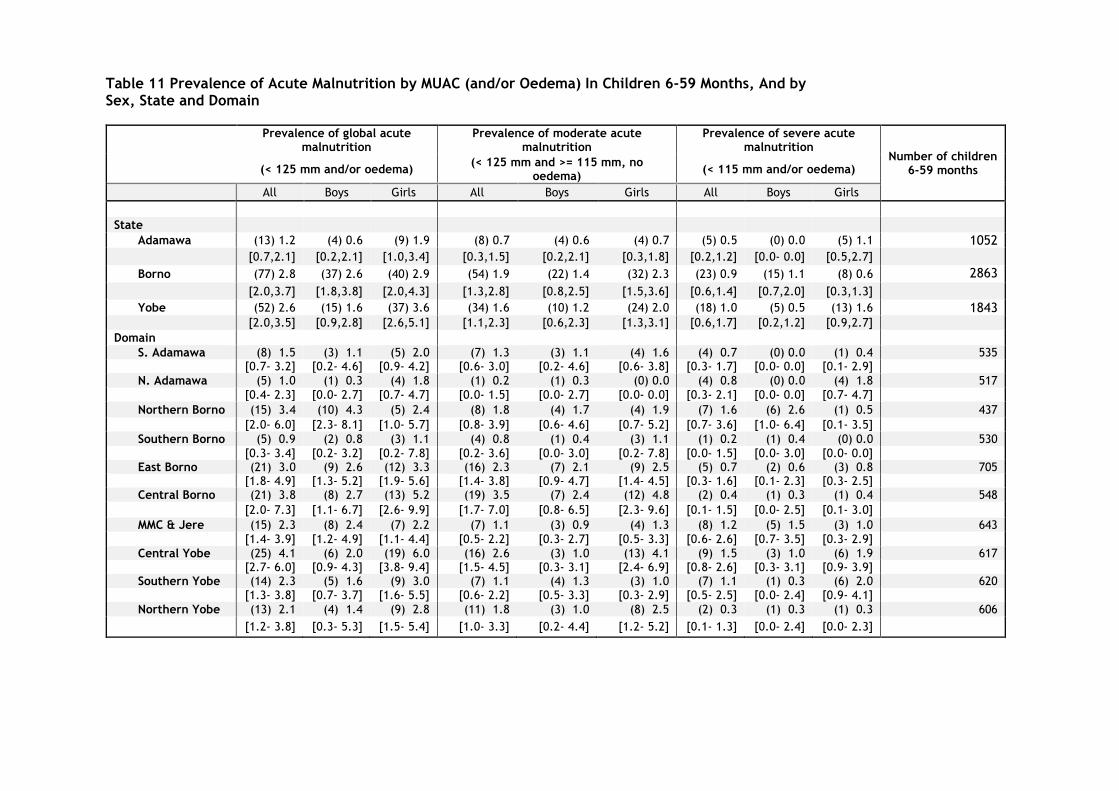
Table 11 Prevalence of Acute Malnutrition by MUAC (and/or Oedema) In Children 6-59 Months, And by Sex, State and Domain
Prevalence of global acute malnutrition
Prevalence of moderate acute malnutrition
Prevalence of severe acute malnutrition
Number of children 6-59 months (< 125 mm and/or oedema)
(< 125 mm and >= 115 mm, no oedema)
(< 115 mm and/or oedema)
All Boys Girls All Boys Girls All Boys Girls
State
Adamawa (13) 1.2 (4) 0.6 (9) 1.9 (8) 0.7 (4) 0.6 (4) 0.7 (5) 0.5 (0) 0.0 (5) 1.1 1052
[0.7,2.1] [0.2,2.1] [1.0,3.4] [0.3,1.5] [0.2,2.1] [0.3,1.8] [0.2,1.2] [0.0- 0.0] [0.5,2.7]
Borno (77) 2.8 (37) 2.6 (40) 2.9 (54) 1.9 (22) 1.4 (32) 2.3 (23) 0.9 (15) 1.1 (8) 0.6 2863
[2.0,3.7] [1.8,3.8] [2.0,4.3] [1.3,2.8] [0.8,2.5] [1.5,3.6] [0.6,1.4] [0.7,2.0] [0.3,1.3]
Yobe (52) 2.6 (15) 1.6 (37) 3.6 (34) 1.6 (10) 1.2 (24) 2.0 (18) 1.0 (5) 0.5 (13) 1.6 1843 [2.0,3.5] [0.9,2.8] [2.6,5.1] [1.1,2.3] [0.6,2.3] [1.3,3.1] [0.6,1.7] [0.2,1.2] [0.9,2.7]
Domain S. Adamawa (8) 1.5 (3) 1.1 (5) 2.0 (7) 1.3 (3) 1.1 (4) 1.6 (4) 0.7 (0) 0.0 (1) 0.4 535
[0.7- 3.2] [0.2- 4.6] [0.9- 4.2] [0.6- 3.0] [0.2- 4.6] [0.6- 3.8] [0.3- 1.7] [0.0- 0.0] [0.1- 2.9]
N. Adamawa (5) 1.0 (1) 0.3 (4) 1.8 (1) 0.2 (1) 0.3 (0) 0.0 (4) 0.8 (0) 0.0 (4) 1.8 517
[0.4- 2.3] [0.0- 2.7] [0.7- 4.7] [0.0- 1.5] [0.0- 2.7] [0.0- 0.0] [0.3- 2.1] [0.0- 0.0] [0.7- 4.7]
Northern Borno (15) 3.4 (10) 4.3 (5) 2.4 (8) 1.8 (4) 1.7 (4) 1.9 (7) 1.6 (6) 2.6 (1) 0.5 437
[2.0- 6.0] [2.3- 8.1] [1.0- 5.7] [0.8- 3.9] [0.6- 4.6] [0.7- 5.2] [0.7- 3.6] [1.0- 6.4] [0.1- 3.5]
Southern Borno (5) 0.9 (2) 0.8 (3) 1.1 (4) 0.8 (1) 0.4 (3) 1.1 (1) 0.2 (1) 0.4 (0) 0.0 530
[0.3- 3.4] [0.2- 3.2] [0.2- 7.8] [0.2- 3.6] [0.0- 3.0] [0.2- 7.8] [0.0- 1.5] [0.0- 3.0] [0.0- 0.0] East Borno (21) 3.0 (9) 2.6 (12) 3.3 (16) 2.3 (7) 2.1 (9) 2.5 (5) 0.7 (2) 0.6 (3) 0.8 705
[1.8- 4.9] [1.3- 5.2] [1.9- 5.6] [1.4- 3.8] [0.9- 4.7] [1.4- 4.5] [0.3- 1.6] [0.1- 2.3] [0.3- 2.5] Central Borno (21) 3.8 (8) 2.7 (13) 5.2 (19) 3.5 (7) 2.4 (12) 4.8 (2) 0.4 (1) 0.3 (1) 0.4 548
[2.0- 7.3] [1.1- 6.7] [2.6- 9.9] [1.7- 7.0] [0.8- 6.5] [2.3- 9.6] [0.1- 1.5] [0.0- 2.5] [0.1- 3.0]
MMC & Jere (15) 2.3 (8) 2.4 (7) 2.2 (7) 1.1 (3) 0.9 (4) 1.3 (8) 1.2 (5) 1.5 (3) 1.0 643
[1.4- 3.9] [1.2- 4.9] [1.1- 4.4] [0.5- 2.2] [0.3- 2.7] [0.5- 3.3] [0.6- 2.6] [0.7- 3.5] [0.3- 2.9]
Central Yobe (25) 4.1 (6) 2.0 (19) 6.0 (16) 2.6 (3) 1.0 (13) 4.1 (9) 1.5 (3) 1.0 (6) 1.9 617 [2.7- 6.0] [0.9- 4.3] [3.8- 9.4] [1.5- 4.5] [0.3- 3.1] [2.4- 6.9] [0.8- 2.6] [0.3- 3.1] [0.9- 3.9]
Southern Yobe (14) 2.3 (5) 1.6 (9) 3.0 (7) 1.1 (4) 1.3 (3) 1.0 (7) 1.1 (1) 0.3 (6) 2.0 620 [1.3- 3.8] [0.7- 3.7] [1.6- 5.5] [0.6- 2.2] [0.5- 3.3] [0.3- 2.9] [0.5- 2.5] [0.0- 2.4] [0.9- 4.1]
Northern Yobe (13) 2.1 (4) 1.4 (9) 2.8 (11) 1.8 (3) 1.0 (8) 2.5 (2) 0.3 (1) 0.3 (1) 0.3 606
[1.2- 3.8] [0.3- 5.3] [1.5- 5.4] [1.0- 3.3] [0.2- 4.4] [1.2- 5.2] [0.1- 1.3] [0.0- 2.4] [0.0- 2.3]
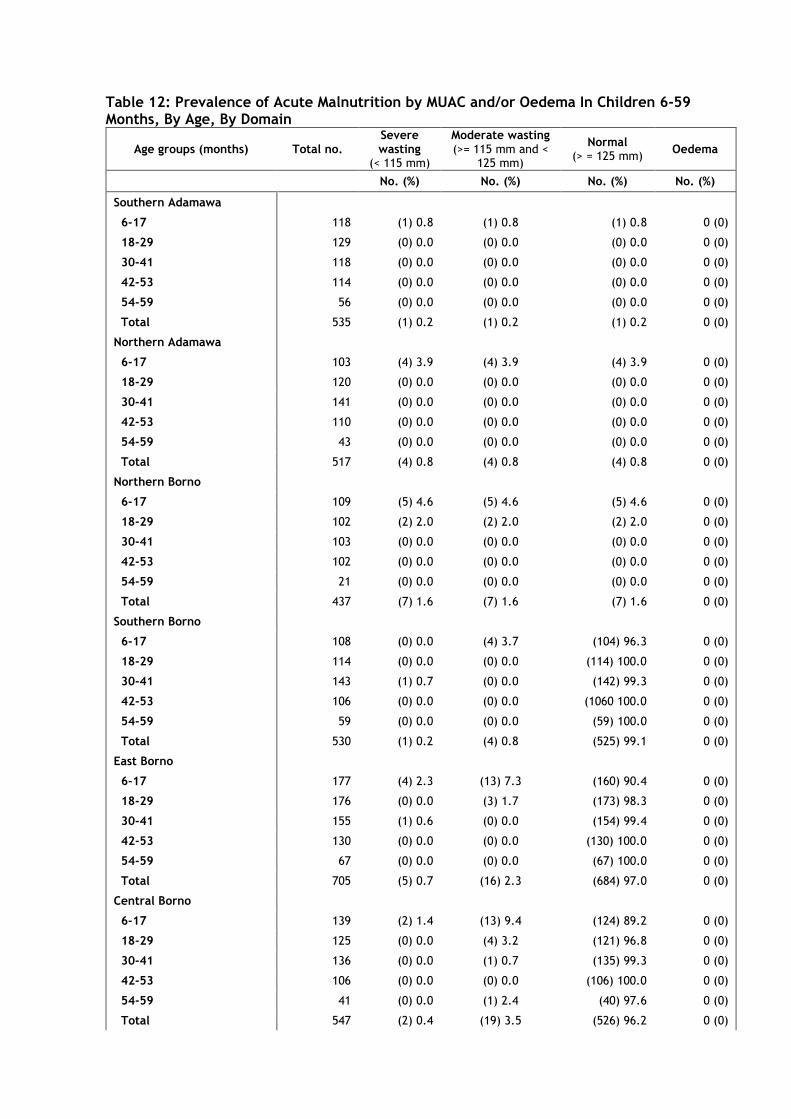
Table 12: Prevalence of Acute Malnutrition by MUAC and/or Oedema In Children 6-59 Months, By Age, By Domain
Age groups (months) Total no. Severe wasting
(< 115 mm)
Moderate wasting (>= 115 mm and <
125 mm)
Normal (> = 125 mm)
Oedema
No. (%) No. (%) No. (%) No. (%)
Southern Adamawa
6-17 118 (1) 0.8 (1) 0.8 (1) 0.8 0 (0)
18-29 129 (0) 0.0 (0) 0.0 (0) 0.0 0 (0)
30-41 118 (0) 0.0 (0) 0.0 (0) 0.0 0 (0)
42-53 114 (0) 0.0 (0) 0.0 (0) 0.0 0 (0)
54-59 56 (0) 0.0 (0) 0.0 (0) 0.0 0 (0)
Total 535 (1) 0.2 (1) 0.2 (1) 0.2 0 (0)
Northern Adamawa
6-17 103 (4) 3.9 (4) 3.9 (4) 3.9 0 (0)
18-29 120 (0) 0.0 (0) 0.0 (0) 0.0 0 (0)
30-41 141 (0) 0.0 (0) 0.0 (0) 0.0 0 (0)
42-53 110 (0) 0.0 (0) 0.0 (0) 0.0 0 (0)
54-59 43 (0) 0.0 (0) 0.0 (0) 0.0 0 (0)
Total 517 (4) 0.8 (4) 0.8 (4) 0.8 0 (0)
Northern Borno
6-17 109 (5) 4.6 (5) 4.6 (5) 4.6 0 (0)
18-29 102 (2) 2.0 (2) 2.0 (2) 2.0 0 (0)
30-41 103 (0) 0.0 (0) 0.0 (0) 0.0 0 (0)
42-53 102 (0) 0.0 (0) 0.0 (0) 0.0 0 (0)
54-59 21 (0) 0.0 (0) 0.0 (0) 0.0 0 (0)
Total 437 (7) 1.6 (7) 1.6 (7) 1.6 0 (0)
Southern Borno
6-17 108 (0) 0.0 (4) 3.7 (104) 96.3 0 (0)
18-29 114 (0) 0.0 (0) 0.0 (114) 100.0 0 (0)
30-41 143 (1) 0.7 (0) 0.0 (142) 99.3 0 (0)
42-53 106 (0) 0.0 (0) 0.0 (1060 100.0 0 (0)
54-59 59 (0) 0.0 (0) 0.0 (59) 100.0 0 (0)
Total 530 (1) 0.2 (4) 0.8 (525) 99.1 0 (0)
East Borno
6-17 177 (4) 2.3 (13) 7.3 (160) 90.4 0 (0)
18-29 176 (0) 0.0 (3) 1.7 (173) 98.3 0 (0)
30-41 155 (1) 0.6 (0) 0.0 (154) 99.4 0 (0)
42-53 130 (0) 0.0 (0) 0.0 (130) 100.0 0 (0)
54-59 67 (0) 0.0 (0) 0.0 (67) 100.0 0 (0)
Total 705 (5) 0.7 (16) 2.3 (684) 97.0 0 (0)
Central Borno
6-17 139 (2) 1.4 (13) 9.4 (124) 89.2 0 (0)
18-29 125 (0) 0.0 (4) 3.2 (121) 96.8 0 (0)
30-41 136 (0) 0.0 (1) 0.7 (135) 99.3 0 (0)
42-53 106 (0) 0.0 (0) 0.0 (106) 100.0 0 (0)
54-59 41 (0) 0.0 (1) 2.4 (40) 97.6 0 (0)
Total 547 (2) 0.4 (19) 3.5 (526) 96.2 0 (0)
MMC / Jere
6-17 127 (5) 3.9 (5) 3.9 (117) 92.1 0 (0)
18-29 163 (3)1.8 (2) 1.2 (158) 96.9 0 (0)
30-41 151 (0) 0.0 (0) 0.0 (151) 100.0 0 (0)
42-53 149 (0) 0.0 (0) 0.0 (149) 100.0 0 (0)
54-59 53 (0) 0.0 (0) 0.0 (53) 100.0 0 (0)
Total 643 (8) 1.2 (7) 1.1 (628) 97.7 0 (0)
Northern Yobe
6-17 147 (2) 1.4 (10) 6.8 (135) 91.8 0 (0)
18-29 152 (0) 0.0 (1) 0.7 (151) 99.3 0 (0)
30-41 153 (0) 0.0 (0) 0.0 (153) 100.0 0 (0)
42-53 107 (0) 0.0 (0) 0.0 (107) 100.0 0 (0)
54-59 47 (0) 0.0 (0) 0.0 (47) 100.0 0 (0)
Total 606 (0.3) 0.3 (11) 1.8 (593) 97.9 0 (0)
Central Yobe
6-17 161 (8) 5.0 (12) 7.5 (141) 87.6 0 (0)
18-29 149 (1) 0.7 (3) 2.0 (145) 97.3 0 (0)
30-41 131 (0) 0.0 (1) 0.8 (130) 99.2 0 (0)
42-53 135 (0) 0.0 (0) 0.0 (135) 100.0 0 (0)
54-59 41 (0) 0.0 (0) 0.0 (41) 100.0 0 (0)
Total 617 (9) 1.5 (16) 2.6 (592) 95.9 0 (0)
Southern Yobe
6-17 139 (4) 2.9 (6) 4.3 (129) 92.8 0 (0)
18-29 164 3) 1.8 (1) 0.6 (160) 97.6 0 (0)
30-41 143 (0) 0.0 (0) 0.0 (143) 100.0 0 (0)
42-53 133 (0) 0.0 (0) 0.0 (133) 100.0 0 (0)
54-59 41 (0) 0.0 (0) 0.0 (41) 100.0 0 (0)
Total 620 (7) 1.1 (7) 1.1 (606) 97.7 0 (0)
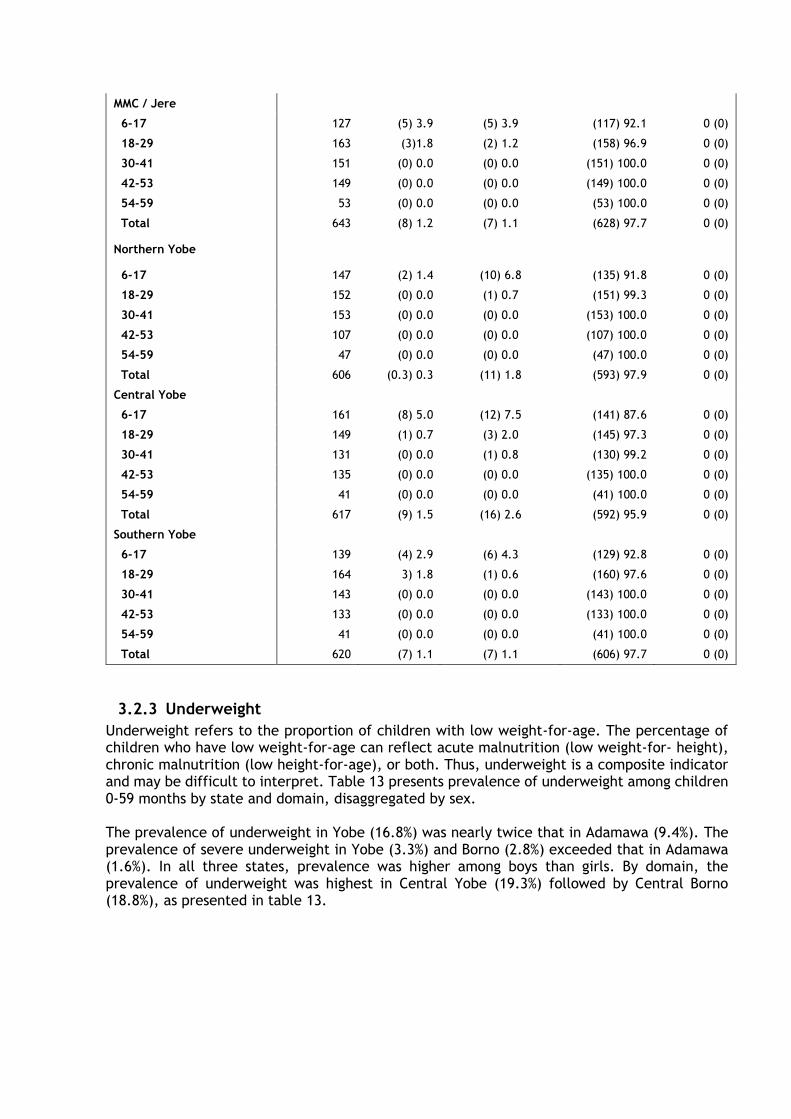
3.2.3 Underweight
Underweight refers to the proportion of children with low weight-for-age. The percentage of children who have low weight-for-age can reflect acute malnutrition (low weight-for- height), chronic malnutrition (low height-for-age), or both. Thus, underweight is a composite indicator and may be difficult to interpret. Table 13 presents prevalence of underweight among children 0-59 months by state and domain, disaggregated by sex. The prevalence of underweight in Yobe (16.8%) was nearly twice that in Adamawa (9.4%). The prevalence of severe underweight in Yobe (3.3%) and Borno (2.8%) exceeded that in Adamawa (1.6%). In all three states, prevalence was higher among boys than girls. By domain, the prevalence of underweight was highest in Central Yobe (19.3%) followed by Central Borno (18.8%), as presented in table 13.
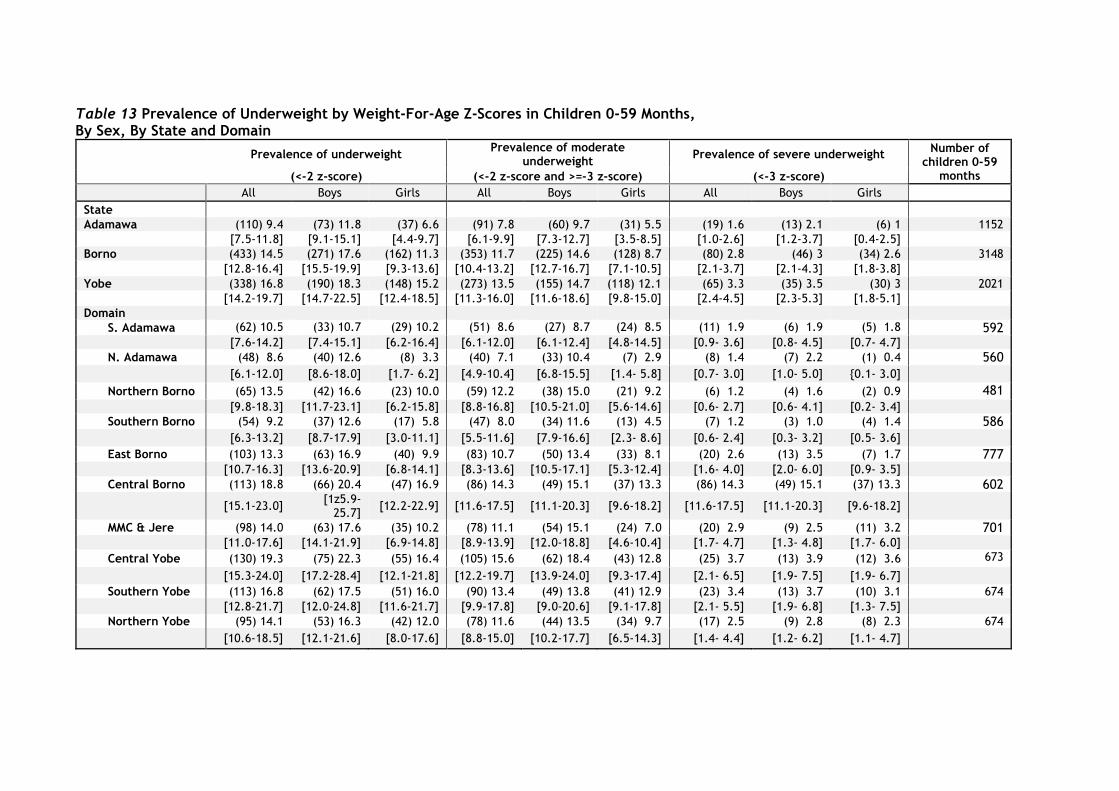
Table 13 Prevalence of Underweight by Weight-For-Age Z-Scores in Children 0-59 Months, By Sex, By State and Domain
Prevalence of underweight
Prevalence of moderate underweight
Prevalence of severe underweight Number of
children 0-59 months (<-2 z-score) (<-2 z-score and >=-3 z-score) (<-3 z-score)
All Boys Girls All Boys Girls All Boys Girls
State Adamawa (110) 9.4 (73) 11.8 (37) 6.6 (91) 7.8 (60) 9.7 (31) 5.5 (19) 1.6 (13) 2.1 (6) 1 1152
[7.5-11.8] [9.1-15.1] [4.4-9.7] [6.1-9.9] [7.3-12.7] [3.5-8.5] [1.0-2.6] [1.2-3.7] [0.4-2.5] Borno (433) 14.5 (271) 17.6 (162) 11.3 (353) 11.7 (225) 14.6 (128) 8.7 (80) 2.8 (46) 3 (34) 2.6 3148
[12.8-16.4] [15.5-19.9] [9.3-13.6] [10.4-13.2] [12.7-16.7] [7.1-10.5] [2.1-3.7] [2.1-4.3] [1.8-3.8] Yobe (338) 16.8 (190) 18.3 (148) 15.2 (273) 13.5 (155) 14.7 (118) 12.1 (65) 3.3 (35) 3.5 (30) 3 2021
[14.2-19.7] [14.7-22.5] [12.4-18.5] [11.3-16.0] [11.6-18.6] [9.8-15.0] [2.4-4.5] [2.3-5.3] [1.8-5.1] Domain
S. Adamawa (62) 10.5 (33) 10.7 (29) 10.2 (51) 8.6 (27) 8.7 (24) 8.5 (11) 1.9 (6) 1.9 (5) 1.8 592 [7.6-14.2] [7.4-15.1] [6.2-16.4] [6.1-12.0] [6.1-12.4] [4.8-14.5] [0.9- 3.6] [0.8- 4.5] [0.7- 4.7]
N. Adamawa (48) 8.6 (40) 12.6 (8) 3.3 (40) 7.1 (33) 10.4 (7) 2.9 (8) 1.4 (7) 2.2 (1) 0.4 560
[6.1-12.0] [8.6-18.0] [1.7- 6.2] [4.9-10.4] [6.8-15.5] [1.4- 5.8] [0.7- 3.0] [1.0- 5.0] {0.1- 3.0]
Northern Borno (65) 13.5 (42) 16.6 (23) 10.0 (59) 12.2 (38) 15.0 (21) 9.2 (6) 1.2 (4) 1.6 (2) 0.9 481
[9.8-18.3] [11.7-23.1] [6.2-15.8] [8.8-16.8] [10.5-21.0] [5.6-14.6] [0.6- 2.7] [0.6- 4.1] [0.2- 3.4]
Southern Borno (54) 9.2 (37) 12.6 (17) 5.8 (47) 8.0 (34) 11.6 (13) 4.5 (7) 1.2 (3) 1.0 (4) 1.4 586
[6.3-13.2] [8.7-17.9] [3.0-11.1] [5.5-11.6] [7.9-16.6] [2.3- 8.6] [0.6- 2.4] [0.3- 3.2] [0.5- 3.6]
East Borno (103) 13.3 (63) 16.9 (40) 9.9 (83) 10.7 (50) 13.4 (33) 8.1 (20) 2.6 (13) 3.5 (7) 1.7 777 [10.7-16.3] [13.6-20.9] [6.8-14.1] [8.3-13.6] [10.5-17.1] [5.3-12.4] [1.6- 4.0] [2.0- 6.0] [0.9- 3.5]
Central Borno (113) 18.8 (66) 20.4 (47) 16.9 (86) 14.3 (49) 15.1 (37) 13.3 (86) 14.3 (49) 15.1 (37) 13.3 602
[15.1-23.0] [1z5.9-
25.7] [12.2-22.9] [11.6-17.5] [11.1-20.3] [9.6-18.2] [11.6-17.5] [11.1-20.3] [9.6-18.2]
MMC & Jere (98) 14.0 (63) 17.6 (35) 10.2 (78) 11.1 (54) 15.1 (24) 7.0 (20) 2.9 (9) 2.5 (11) 3.2 701 [11.0-17.6] [14.1-21.9] [6.9-14.8] [8.9-13.9] [12.0-18.8] [4.6-10.4] [1.7- 4.7] [1.3- 4.8] [1.7- 6.0]
Central Yobe (130) 19.3 (75) 22.3 (55) 16.4 (105) 15.6 (62) 18.4 (43) 12.8 (25) 3.7 (13) 3.9 (12) 3.6 673
[15.3-24.0] [17.2-28.4] [12.1-21.8] [12.2-19.7] [13.9-24.0] [9.3-17.4] [2.1- 6.5] [1.9- 7.5] [1.9- 6.7]
Southern Yobe (113) 16.8 (62) 17.5 (51) 16.0 (90) 13.4 (49) 13.8 (41) 12.9 (23) 3.4 (13) 3.7 (10) 3.1 674
[12.8-21.7] [12.0-24.8] [11.6-21.7] [9.9-17.8] [9.0-20.6] [9.1-17.8] [2.1- 5.5] [1.9- 6.8] [1.3- 7.5]
Northern Yobe (95) 14.1 (53) 16.3 (42) 12.0 (78) 11.6 (44) 13.5 (34) 9.7 (17) 2.5 (9) 2.8 (8) 2.3 674
[10.6-18.5] [12.1-21.6] [8.0-17.6] [8.8-15.0] [10.2-17.7] [6.5-14.3] [1.4- 4.4] [1.2- 6.2] [1.1- 4.7]
3.2.4 Chronic Malnutrition (Stunting)
Stunting occurs as a result of inadequate nutrition over a longer period. Stunting is assessed by length or height-for-age Z-scores (HAZ). Table 14 presents prevalence of stunting among children 0-59 months by state and domain, disaggregated by sex. Prevalence of stunting is highest in Yobe (24.8%) and Borno (24.4%) than in Adamawa (19.9%). Based on the WHO classification of malnutrition, prevalence in Adamawa, Yobe and Borno are below serious level of between 30 and 40%. At least one in twenty children in Yobe and Borno are severely stunted (22.9% and 20.4%, respectively). Stunting prevalence is higher (but statistically significant) in boys than girls in all three states. By domain, prevalence was highest in Central Borno (31.5%).
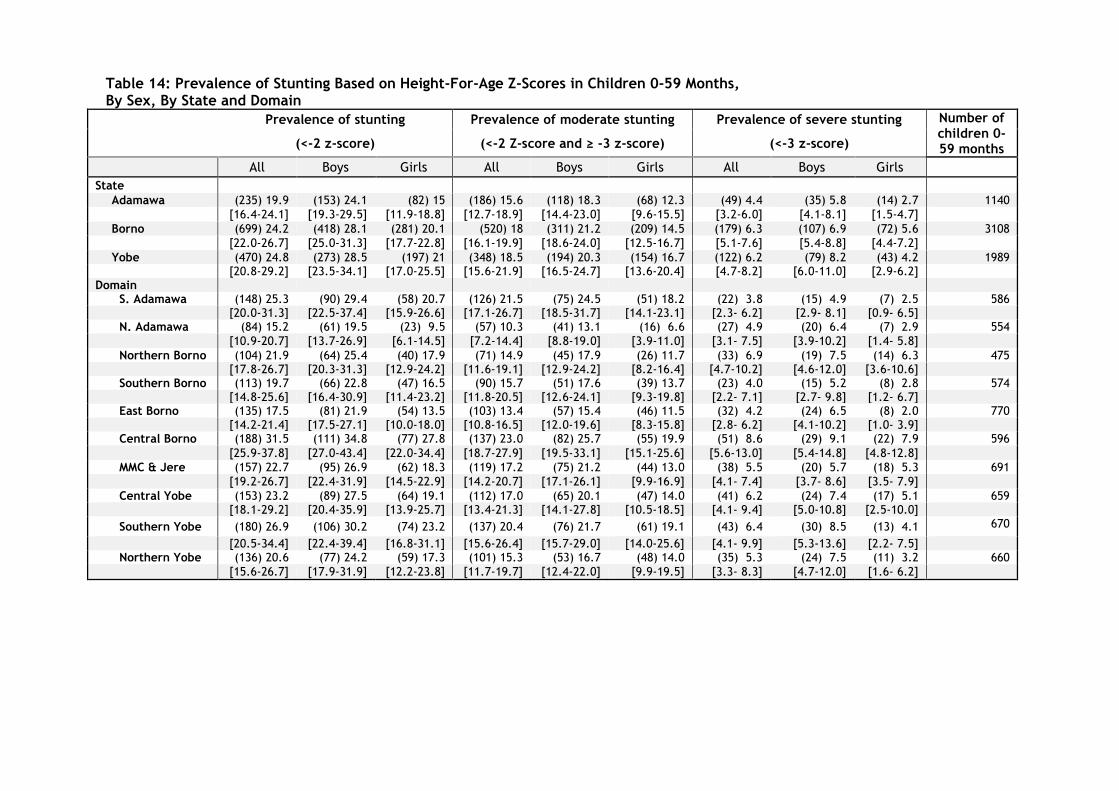
Table 14: Prevalence of Stunting Based on Height-For-Age Z-Scores in Children 0-59 Months, By Sex, By State and Domain
Prevalence of stunting Prevalence of moderate stunting Prevalence of severe stunting Number of
children 0-59 months (<-2 z-score) (<-2 Z-score and ≥ -3 z-score) (<-3 z-score)
All Boys Girls All Boys Girls All Boys Girls
State Adamawa (235) 19.9 (153) 24.1 (82) 15 (186) 15.6 (118) 18.3 (68) 12.3 (49) 4.4 (35) 5.8 (14) 2.7 1140
[16.4-24.1] [19.3-29.5] [11.9-18.8] [12.7-18.9] [14.4-23.0] [9.6-15.5] [3.2-6.0] [4.1-8.1] [1.5-4.7]
Borno (699) 24.2 (418) 28.1 (281) 20.1 (520) 18 (311) 21.2 (209) 14.5 (179) 6.3 (107) 6.9 (72) 5.6 3108
[22.0-26.7] [25.0-31.3] [17.7-22.8] [16.1-19.9] [18.6-24.0] [12.5-16.7] [5.1-7.6] [5.4-8.8] [4.4-7.2]
Yobe (470) 24.8 (273) 28.5 (197) 21 (348) 18.5 (194) 20.3 (154) 16.7 (122) 6.2 (79) 8.2 (43) 4.2 1989 [20.8-29.2] [23.5-34.1] [17.0-25.5] [15.6-21.9] [16.5-24.7] [13.6-20.4] [4.7-8.2] [6.0-11.0] [2.9-6.2]
Domain S. Adamawa (148) 25.3 (90) 29.4 (58) 20.7 (126) 21.5 (75) 24.5 (51) 18.2 (22) 3.8 (15) 4.9 (7) 2.5 586
[20.0-31.3] [22.5-37.4] [15.9-26.6] [17.1-26.7] [18.5-31.7] [14.1-23.1] [2.3- 6.2] [2.9- 8.1] [0.9- 6.5] N. Adamawa (84) 15.2 (61) 19.5 (23) 9.5 (57) 10.3 (41) 13.1 (16) 6.6 (27) 4.9 (20) 6.4 (7) 2.9 554
[10.9-20.7] [13.7-26.9] [6.1-14.5] [7.2-14.4] [8.8-19.0] [3.9-11.0] [3.1- 7.5] [3.9-10.2] [1.4- 5.8]
Northern Borno (104) 21.9 (64) 25.4 (40) 17.9 (71) 14.9 (45) 17.9 (26) 11.7 (33) 6.9 (19) 7.5 (14) 6.3 475 [17.8-26.7] [20.3-31.3] [12.9-24.2] [11.6-19.1] [12.9-24.2] [8.2-16.4] [4.7-10.2] [4.6-12.0] [3.6-10.6]
Southern Borno (113) 19.7 (66) 22.8 (47) 16.5 (90) 15.7 (51) 17.6 (39) 13.7 (23) 4.0 (15) 5.2 (8) 2.8 574 [14.8-25.6] [16.4-30.9] [11.4-23.2] [11.8-20.5] [12.6-24.1] [9.3-19.8] [2.2- 7.1] [2.7- 9.8] [1.2- 6.7]
East Borno (135) 17.5 (81) 21.9 (54) 13.5 (103) 13.4 (57) 15.4 (46) 11.5 (32) 4.2 (24) 6.5 (8) 2.0 770 [14.2-21.4] [17.5-27.1] [10.0-18.0] [10.8-16.5] [12.0-19.6] [8.3-15.8] [2.8- 6.2] [4.1-10.2] [1.0- 3.9]
Central Borno (188) 31.5 (111) 34.8 (77) 27.8 (137) 23.0 (82) 25.7 (55) 19.9 (51) 8.6 (29) 9.1 (22) 7.9 596
[25.9-37.8] [27.0-43.4] [22.0-34.4] [18.7-27.9] [19.5-33.1] [15.1-25.6] [5.6-13.0] [5.4-14.8] [4.8-12.8]
MMC & Jere (157) 22.7 (95) 26.9 (62) 18.3 (119) 17.2 (75) 21.2 (44) 13.0 (38) 5.5 (20) 5.7 (18) 5.3 691
[19.2-26.7] [22.4-31.9] [14.5-22.9] [14.2-20.7] [17.1-26.1] [9.9-16.9] [4.1- 7.4] [3.7- 8.6] [3.5- 7.9]
Central Yobe (153) 23.2 (89) 27.5 (64) 19.1 (112) 17.0 (65) 20.1 (47) 14.0 (41) 6.2 (24) 7.4 (17) 5.1 659 [18.1-29.2] [20.4-35.9] [13.9-25.7] [13.4-21.3] [14.1-27.8] [10.5-18.5] [4.1- 9.4] [5.0-10.8] [2.5-10.0]
Southern Yobe (180) 26.9 (106) 30.2 (74) 23.2 (137) 20.4 (76) 21.7 (61) 19.1 (43) 6.4 (30) 8.5 (13) 4.1 670
[20.5-34.4] [22.4-39.4] [16.8-31.1] [15.6-26.4] [15.7-29.0] [14.0-25.6] [4.1- 9.9] [5.3-13.6] [2.2- 7.5] Northern Yobe (136) 20.6 (77) 24.2 (59) 17.3 (101) 15.3 (53) 16.7 (48) 14.0 (35) 5.3 (24) 7.5 (11) 3.2 660
[15.6-26.7] [17.9-31.9] [12.2-23.8] [11.7-19.7] [12.4-22.0] [9.9-19.5] [3.3- 8.3] [4.7-12.0] [1.6- 6.2]
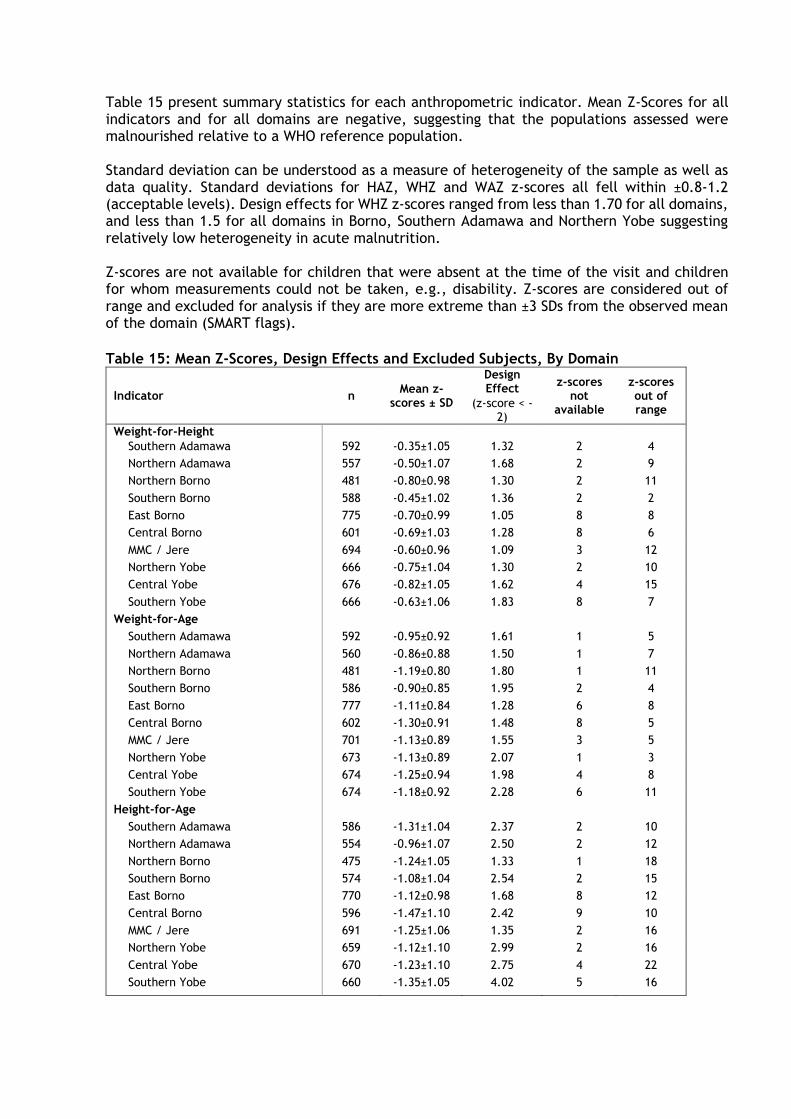
Table 15 present summary statistics for each anthropometric indicator. Mean Z-Scores for all indicators and for all domains are negative, suggesting that the populations assessed were malnourished relative to a WHO reference population. Standard deviation can be understood as a measure of heterogeneity of the sample as well as data quality. Standard deviations for HAZ, WHZ and WAZ z-scores all fell within ±0.8-1.2 (acceptable levels). Design effects for WHZ z-scores ranged from less than 1.70 for all domains, and less than 1.5 for all domains in Borno, Southern Adamawa and Northern Yobe suggesting relatively low heterogeneity in acute malnutrition. Z-scores are not available for children that were absent at the time of the visit and children for whom measurements could not be taken, e.g., disability. Z-scores are considered out of range and excluded for analysis if they are more extreme than ±3 SDs from the observed mean of the domain (SMART flags).
Table 15: Mean Z-Scores, Design Effects and Excluded Subjects, By Domain
Indicator n Mean z-
scores ± SD
Design Effect
z-scores not
available
z-scores out of range
(z-score < -2)
Weight-for-Height
Southern Adamawa 592 -0.35±1.05 1.32 2 4
Northern Adamawa 557 -0.50±1.07 1.68 2 9
Northern Borno 481 -0.80±0.98 1.30 2 11
Southern Borno 588 -0.45±1.02 1.36 2 2
East Borno 775 -0.70±0.99 1.05 8 8
Central Borno 601 -0.69±1.03 1.28 8 6
MMC / Jere 694 -0.60±0.96 1.09 3 12
Northern Yobe 666 -0.75±1.04 1.30 2 10
Central Yobe 676 -0.82±1.05 1.62 4 15
Southern Yobe 666 -0.63±1.06 1.83 8 7
Weight-for-Age
Southern Adamawa 592 -0.95±0.92 1.61 1 5
Northern Adamawa 560 -0.86±0.88 1.50 1 7
Northern Borno 481 -1.19±0.80 1.80 1 11
Southern Borno 586 -0.90±0.85 1.95 2 4
East Borno 777 -1.11±0.84 1.28 6 8
Central Borno 602 -1.30±0.91 1.48 8 5
MMC / Jere 701 -1.13±0.89 1.55 3 5
Northern Yobe 673 -1.13±0.89 2.07 1 3
Central Yobe 674 -1.25±0.94 1.98 4 8
Southern Yobe 674 -1.18±0.92 2.28 6 11
Height-for-Age
Southern Adamawa 586 -1.31±1.04 2.37 2 10
Northern Adamawa 554 -0.96±1.07 2.50 2 12
Northern Borno 475 -1.24±1.05 1.33 1 18
Southern Borno 574 -1.08±1.04 2.54 2 15
East Borno 770 -1.12±0.98 1.68 8 12
Central Borno 596 -1.47±1.10 2.42 9 10
MMC / Jere 691 -1.25±1.06 1.35 2 16
Northern Yobe 659 -1.12±1.10 2.99 2 16
Central Yobe 670 -1.23±1.10 2.75 4 22
Southern Yobe 660 -1.35±1.05 4.02 5 16
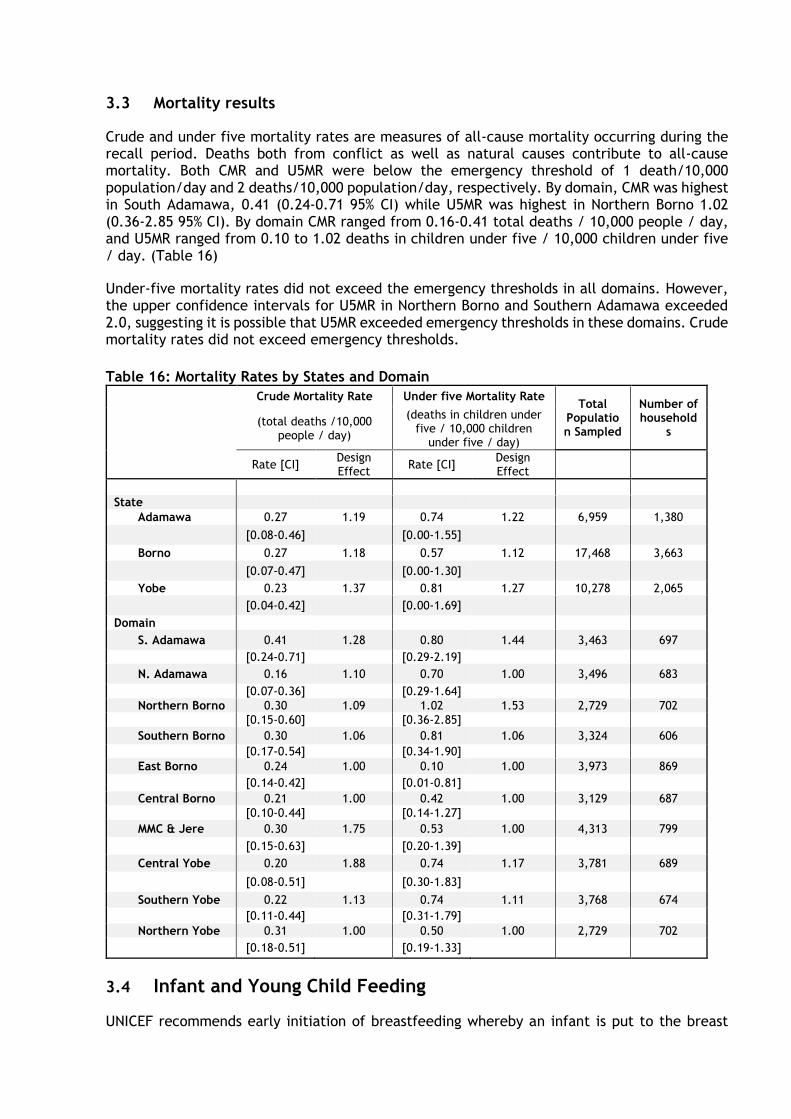
3.3 Mortality results
Crude and under five mortality rates are measures of all-cause mortality occurring during the recall period. Deaths both from conflict as well as natural causes contribute to all-cause mortality. Both CMR and U5MR were below the emergency threshold of 1 death/10,000 population/day and 2 deaths/10,000 population/day, respectively. By domain, CMR was highest in South Adamawa, 0.41 (0.24-0.71 95% CI) while U5MR was highest in Northern Borno 1.02 (0.36-2.85 95% CI). By domain CMR ranged from 0.16-0.41 total deaths / 10,000 people / day, and U5MR ranged from 0.10 to 1.02 deaths in children under five / 10,000 children under five / day. (Table 16)
Under-five mortality rates did not exceed the emergency thresholds in all domains. However, the upper confidence intervals for U5MR in Northern Borno and Southern Adamawa exceeded 2.0, suggesting it is possible that U5MR exceeded emergency thresholds in these domains. Crude mortality rates did not exceed emergency thresholds.
Table 16: Mortality Rates by States and Domain
Crude Mortality Rate Under five Mortality Rate Total
Population Sampled
Number of household
s (total deaths /10,000
people / day)
(deaths in children under five / 10,000 children
under five / day)
Rate [CI] Design Effect
Rate [CI] Design Effect
State
Adamawa 0.27 1.19 0.74 1.22 6,959 1,380
[0.08-0.46] [0.00-1.55]
Borno 0.27 1.18 0.57 1.12 17,468 3,663
[0.07-0.47] [0.00-1.30]
Yobe 0.23 1.37 0.81 1.27 10,278 2,065
[0.04-0.42] [0.00-1.69]
Domain
S. Adamawa 0.41 1.28 0.80 1.44 3,463 697
[0.24-0.71] [0.29-2.19]
N. Adamawa 0.16 1.10 0.70 1.00 3,496 683
[0.07-0.36] [0.29-1.64]
Northern Borno 0.30 1.09 1.02 1.53 2,729 702
[0.15-0.60] [0.36-2.85]
Southern Borno 0.30 1.06 0.81 1.06 3,324 606
[0.17-0.54] [0.34-1.90]
East Borno 0.24 1.00 0.10 1.00 3,973 869
[0.14-0.42] [0.01-0.81]
Central Borno 0.21 1.00 0.42 1.00 3,129 687
[0.10-0.44] [0.14-1.27]
MMC & Jere 0.30 1.75 0.53 1.00 4,313 799
[0.15-0.63] [0.20-1.39]
Central Yobe 0.20 1.88 0.74 1.17 3,781 689
[0.08-0.51] [0.30-1.83]
Southern Yobe 0.22 1.13 0.74 1.11 3,768 674
[0.11-0.44] [0.31-1.79]
Northern Yobe 0.31 1.00 0.50 1.00 2,729 702
[0.18-0.51] [0.19-1.33]
3.4 Infant and Young Child Feeding
UNICEF recommends early initiation of breastfeeding whereby an infant is put to the breast
within one hour of birth. Exclusive breastfeeding is recommended for the first six months of life. Continued breastfeeding with appropriate complementary feeding is recommended for up to two years.
Mothers (or caregivers) were asked whether their children aged 0-23 months had ever been breastfed. For all children who had ever been breastfed, mothers (or caregivers) were asked how long after birth did they first put the child to breast and whether the child was breastfed on the day preceding the survey during the day or night. Indicators for continued breastfeeding at one and two years of age are derived from the question regarding breastfeeding during the day preceding the survey, asked to all mothers or caregivers of children 0-23 months. While for exclusive breastfeeding, mothers of children 0-5 months were asked whether the child was given anything other than breast milk during the day preceding the survey. Sample sizes for continued breastfeeding within each domain are small and therefore the confidence intervals around these estimates are wide.
Overall the proportion of children aged 0-23 months who were ever breastfed was over 90% in all three states. By domain, the proportion ever breastfed ranged from 90.7-96.2%. However, less than half of mothers initiated early breastfeeding within one hour of birth: 49.7% in Borno, 44.5% in Adamawa and 46.5% in Yobe. (Table 17)
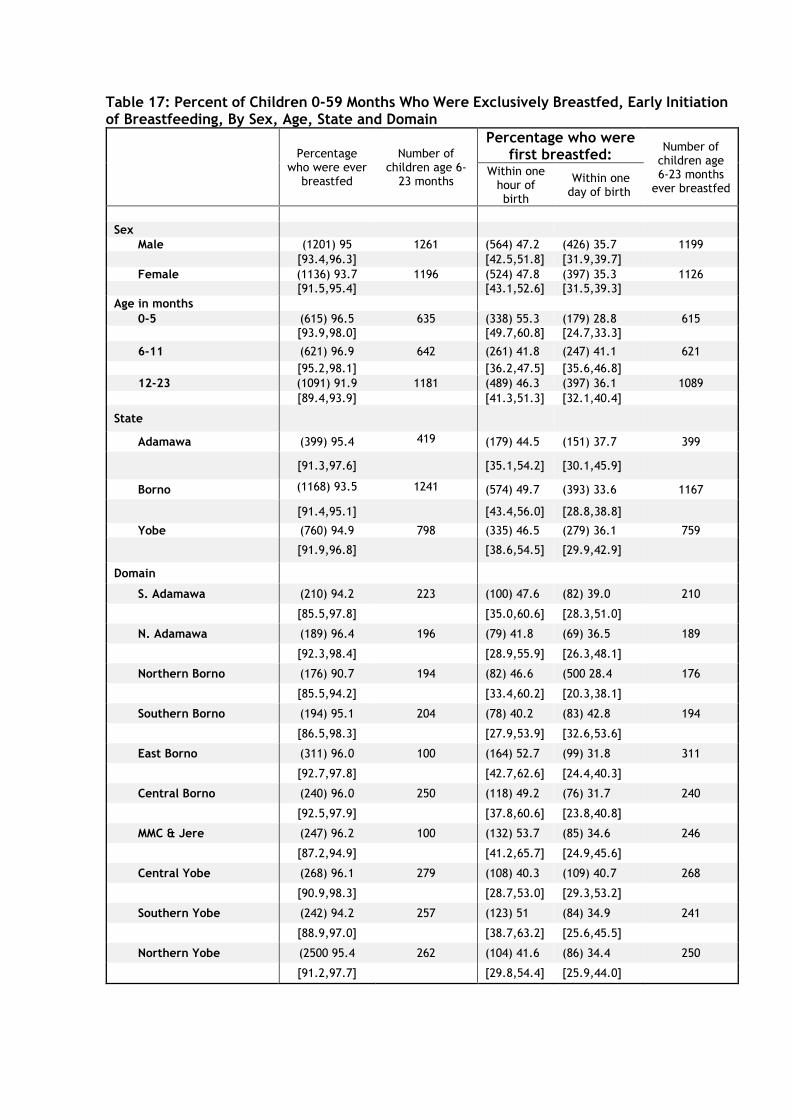
Table 17: Percent of Children 0-59 Months Who Were Exclusively Breastfed, Early Initiation of Breastfeeding, By Sex, Age, State and Domain
Percentage
who were ever breastfed
Number of children age 6-
23 months
Percentage who were first breastfed:
Number of children age 6-23 months
ever breastfed
Within one hour of birth
Within one day of birth
Sex
Male (1201) 95 1261 (564) 47.2 (426) 35.7 1199
[93.4,96.3] [42.5,51.8] [31.9,39.7]
Female (1136) 93.7 1196 (524) 47.8 (397) 35.3 1126
[91.5,95.4] [43.1,52.6] [31.5,39.3]
Age in months
0-5 (615) 96.5 635 (338) 55.3 (179) 28.8 615
[93.9,98.0] [49.7,60.8] [24.7,33.3]
6-11 (621) 96.9 642 (261) 41.8 (247) 41.1 621
[95.2,98.1] [36.2,47.5] [35.6,46.8]
12-23 (1091) 91.9 1181 (489) 46.3 (397) 36.1 1089
[89.4,93.9] [41.3,51.3] [32.1,40.4]
State
Adamawa (399) 95.4 419 (179) 44.5 (151) 37.7 399
[91.3,97.6] [35.1,54.2] [30.1,45.9]
Borno (1168) 93.5 1241 (574) 49.7 (393) 33.6 1167
[91.4,95.1] [43.4,56.0] [28.8,38.8]
Yobe (760) 94.9 798 (335) 46.5 (279) 36.1 759
[91.9,96.8] [38.6,54.5] [29.9,42.9]
Domain
S. Adamawa (210) 94.2 223 (100) 47.6 (82) 39.0 210
[85.5,97.8] [35.0,60.6] [28.3,51.0]
N. Adamawa (189) 96.4 196 (79) 41.8 (69) 36.5 189
[92.3,98.4] [28.9,55.9] [26.3,48.1]
Northern Borno (176) 90.7 194 (82) 46.6 (500 28.4 176
[85.5,94.2] [33.4,60.2] [20.3,38.1]
Southern Borno (194) 95.1 204 (78) 40.2 (83) 42.8 194
[86.5,98.3] [27.9,53.9] [32.6,53.6]
East Borno (311) 96.0 100 (164) 52.7 (99) 31.8 311
[92.7,97.8] [42.7,62.6] [24.4,40.3]
Central Borno (240) 96.0 250 (118) 49.2 (76) 31.7 240
[92.5,97.9] [37.8,60.6] [23.8,40.8]
MMC & Jere (247) 96.2 100 (132) 53.7 (85) 34.6 246
[87.2,94.9] [41.2,65.7] [24.9,45.6]
Central Yobe (268) 96.1 279 (108) 40.3 (109) 40.7 268
[90.9,98.3] [28.7,53.0] [29.3,53.2]
Southern Yobe (242) 94.2 257 (123) 51 (84) 34.9 241
[88.9,97.0] [38.7,63.2] [25.6,45.5]
Northern Yobe (2500 95.4 262 (104) 41.6 (86) 34.4 250
[91.2,97.7] [29.8,54.4] [25.9,44.0]
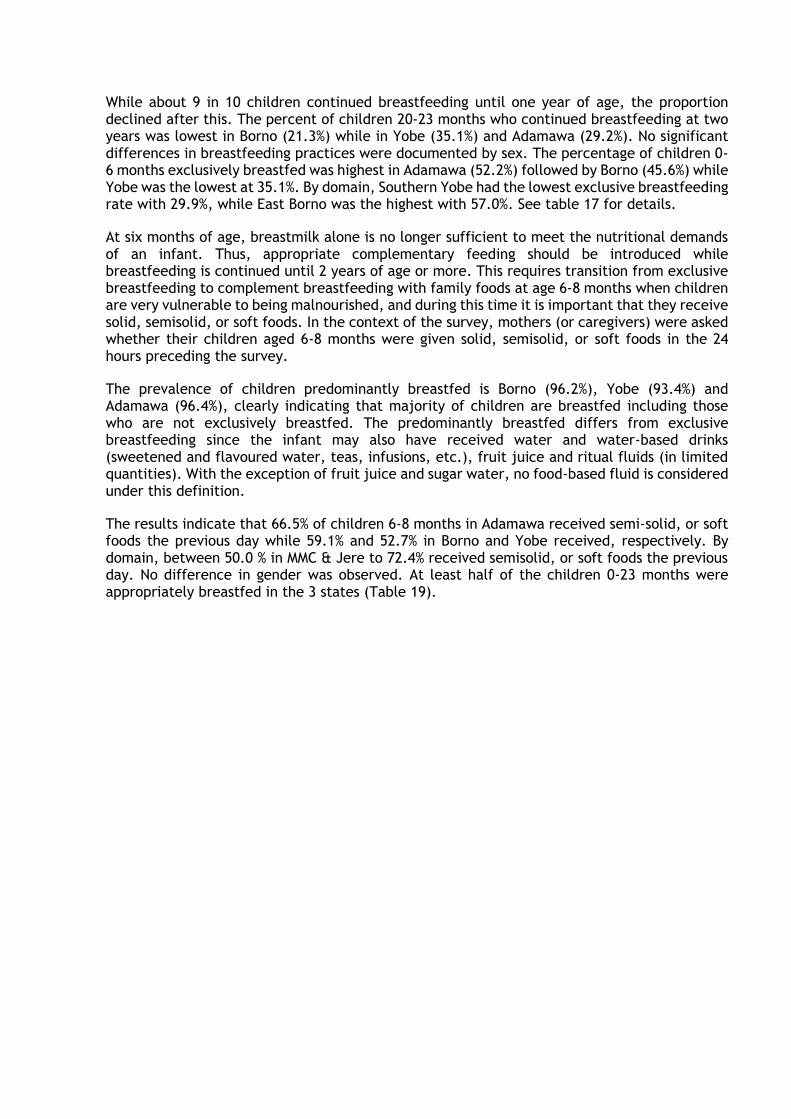
While about 9 in 10 children continued breastfeeding until one year of age, the proportion declined after this. The percent of children 20-23 months who continued breastfeeding at two years was lowest in Borno (21.3%) while in Yobe (35.1%) and Adamawa (29.2%). No significant differences in breastfeeding practices were documented by sex. The percentage of children 0-6 months exclusively breastfed was highest in Adamawa (52.2%) followed by Borno (45.6%) while Yobe was the lowest at 35.1%. By domain, Southern Yobe had the lowest exclusive breastfeeding rate with 29.9%, while East Borno was the highest with 57.0%. See table 17 for details.
At six months of age, breastmilk alone is no longer sufficient to meet the nutritional demands of an infant. Thus, appropriate complementary feeding should be introduced while breastfeeding is continued until 2 years of age or more. This requires transition from exclusive breastfeeding to complement breastfeeding with family foods at age 6-8 months when children are very vulnerable to being malnourished, and during this time it is important that they receive solid, semisolid, or soft foods. In the context of the survey, mothers (or caregivers) were asked whether their children aged 6-8 months were given solid, semisolid, or soft foods in the 24 hours preceding the survey.
The prevalence of children predominantly breastfed is Borno (96.2%), Yobe (93.4%) and Adamawa (96.4%), clearly indicating that majority of children are breastfed including those who are not exclusively breastfed. The predominantly breastfed differs from exclusive breastfeeding since the infant may also have received water and water-based drinks (sweetened and flavoured water, teas, infusions, etc.), fruit juice and ritual fluids (in limited quantities). With the exception of fruit juice and sugar water, no food-based fluid is considered under this definition.
The results indicate that 66.5% of children 6-8 months in Adamawa received semi-solid, or soft foods the previous day while 59.1% and 52.7% in Borno and Yobe received, respectively. By domain, between 50.0 % in MMC & Jere to 72.4% received semisolid, or soft foods the previous day. No difference in gender was observed. At least half of the children 0-23 months were appropriately breastfed in the 3 states (Table 19).
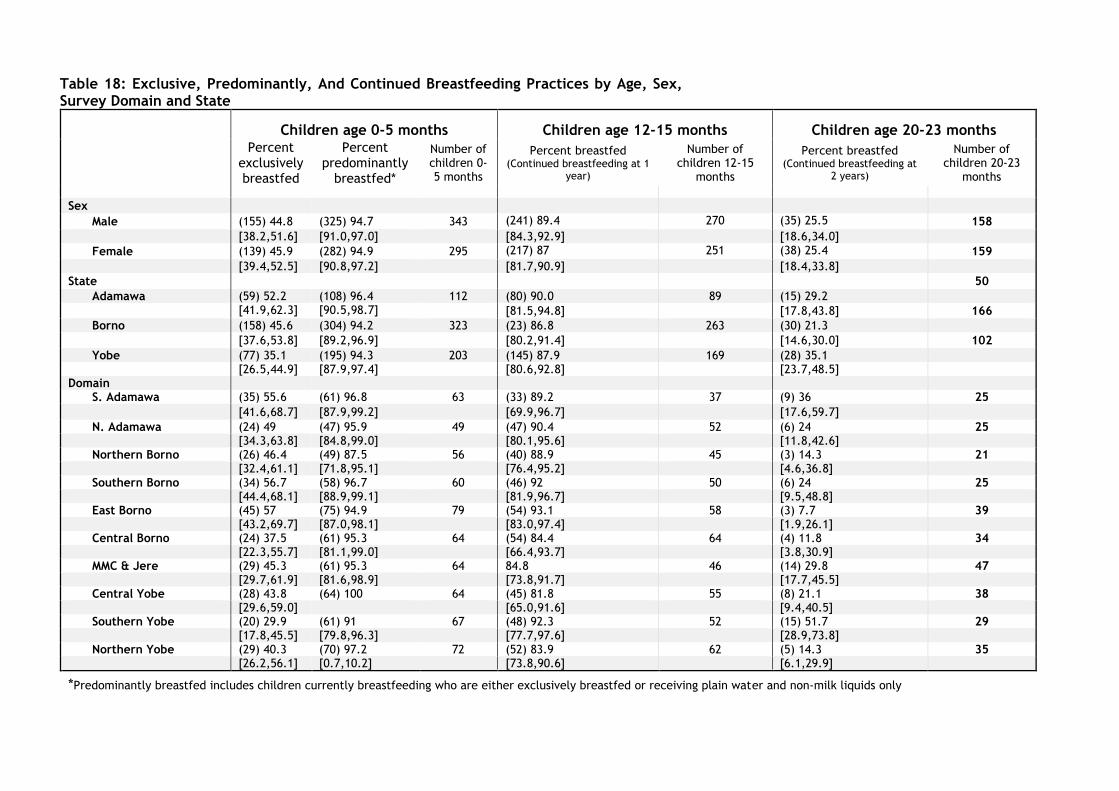
Table 18: Exclusive, Predominantly, And Continued Breastfeeding Practices by Age, Sex, Survey Domain and State
Children age 0-5 months Children age 12-15 months Children age 20-23 months Percent
exclusively breastfed
Percent predominantly
breastfed*
Number of children 0-5 months
Percent breastfed (Continued breastfeeding at 1
year)
Number of children 12-15
months
Percent breastfed (Continued breastfeeding at
2 years)
Number of children 20-23
months
Sex
Male (155) 44.8 (325) 94.7 343 (241) 89.4 270 (35) 25.5 158
[38.2,51.6] [91.0,97.0] [84.3,92.9] [18.6,34.0]
Female (139) 45.9 (282) 94.9 295 (217) 87 251 (38) 25.4 159
[39.4,52.5] [90.8,97.2] [81.7,90.9] [18.4,33.8]
State 50
Adamawa (59) 52.2 (108) 96.4 112 (80) 90.0 89 (15) 29.2
[41.9,62.3] [90.5,98.7] [81.5,94.8] [17.8,43.8] 166
Borno (158) 45.6 (304) 94.2 323 (23) 86.8 263 (30) 21.3
[37.6,53.8] [89.2,96.9] [80.2,91.4] [14.6,30.0] 102
Yobe (77) 35.1 (195) 94.3 203 (145) 87.9 169 (28) 35.1 [26.5,44.9] [87.9,97.4] [80.6,92.8] [23.7,48.5] Domain
S. Adamawa (35) 55.6 (61) 96.8 63 (33) 89.2 37 (9) 36 25
[41.6,68.7] [87.9,99.2] [69.9,96.7] [17.6,59.7]
N. Adamawa (24) 49 (47) 95.9 49 (47) 90.4 52 (6) 24 25 [34.3,63.8] [84.8,99.0] [80.1,95.6] [11.8,42.6]
Northern Borno (26) 46.4 (49) 87.5 56 (40) 88.9 45 (3) 14.3 21 [32.4,61.1] [71.8,95.1] [76.4,95.2] [4.6,36.8]
Southern Borno (34) 56.7 (58) 96.7 60 (46) 92 50 (6) 24 25 [44.4,68.1] [88.9,99.1] [81.9,96.7] [9.5,48.8]
East Borno (45) 57 (75) 94.9 79 (54) 93.1 58 (3) 7.7 39 [43.2,69.7] [87.0,98.1] [83.0,97.4] [1.9,26.1]
Central Borno (24) 37.5 (61) 95.3 64 (54) 84.4 64 (4) 11.8 34 [22.3,55.7] [81.1,99.0] [66.4,93.7] [3.8,30.9]
MMC & Jere (29) 45.3 (61) 95.3 64 84.8 46 (14) 29.8 47 [29.7,61.9] [81.6,98.9] [73.8,91.7] [17.7,45.5]
Central Yobe (28) 43.8 (64) 100 64 (45) 81.8 55 (8) 21.1 38 [29.6,59.0] [65.0,91.6] [9.4,40.5] Southern Yobe (20) 29.9 (61) 91 67 (48) 92.3 52 (15) 51.7 29
[17.8,45.5] [79.8,96.3] [77.7,97.6] [28.9,73.8] Northern Yobe (29) 40.3 (70) 97.2 72 (52) 83.9 62 (5) 14.3 35
[26.2,56.1] [0.7,10.2] [73.8,90.6] [6.1,29.9]
*Predominantly breastfed includes children currently breastfeeding who are either exclusively breastfed or receiving plain water and non-milk liquids only
3.4.1 Minimum Dietary Diversity, Minimum Meal Frequency and Minimum Acceptable Diet
Minimum dietary diversity8 is a proxy indicator for the mean micronutrient density adequacy of the diet and is measured by counting the number of food groups a child received in the last 24 hours. Studies have shown that infants and young children who consumed at least four of the seven groups were more likely to have diets that were higher in micronutrient density. Minimum meal frequency9 was developed as a proxy for energy intake of infants and young children. Young children are expected to receive a minimum acceptable diet10, which combines both minimum diet diversity and minimum meal frequency. (Table 19)
Less than 5% of children 6-23 months of age received a minimum acceptable diet in the 24 hours preceding the survey: 3.8% in Adamawa, 3.0% in Yobe and only 0.5% in Borno. By domain, no children 6 to 23 months in Northern Borno and MMC/Jere received a minimum acceptable diet. The domain with the highest proportion of minimum acceptable diets was Southern Yobe with 4.6%. (Table 20). The low rates of minimum acceptable diets can indicate a lack of knowledge by mothers and caregivers on appropriate infant and young child feeding practices.
8 Minimum dietary diversity is defined as receiving foods from at least 4 of 7 food groups: 1) Grains, roots and tubers, 2)
legumes and nuts, 3) dairy products (milk, yogurt, cheese), 4) flesh foods (meat, fish, poultry and liver/organ meats), 5) eggs, 6) vitamin-A rich fruits and vegetables, and 7) other fruits and vegetables. 9 Minimum meal frequency among currently breastfeeding children is defined as children who also received solid, semi-solid, or soft foods 2 times or more daily for children age 6-8 months and 3 times or more daily for children age 9-23 months. For non-breastfeeding children age 6-23 months it is defined as receiving solid, semi-solid or soft foods, or milk feeds, at least 4 times. 10 the minimum acceptable diet for breastfed children age 6-23 months is defined as receiving the minimum dietary diversity and the minimum meal frequency, while it for non-breastfed children further requires at least 2 milk feedings and that the minimum dietary diversity is achieved without counting milk feeds.
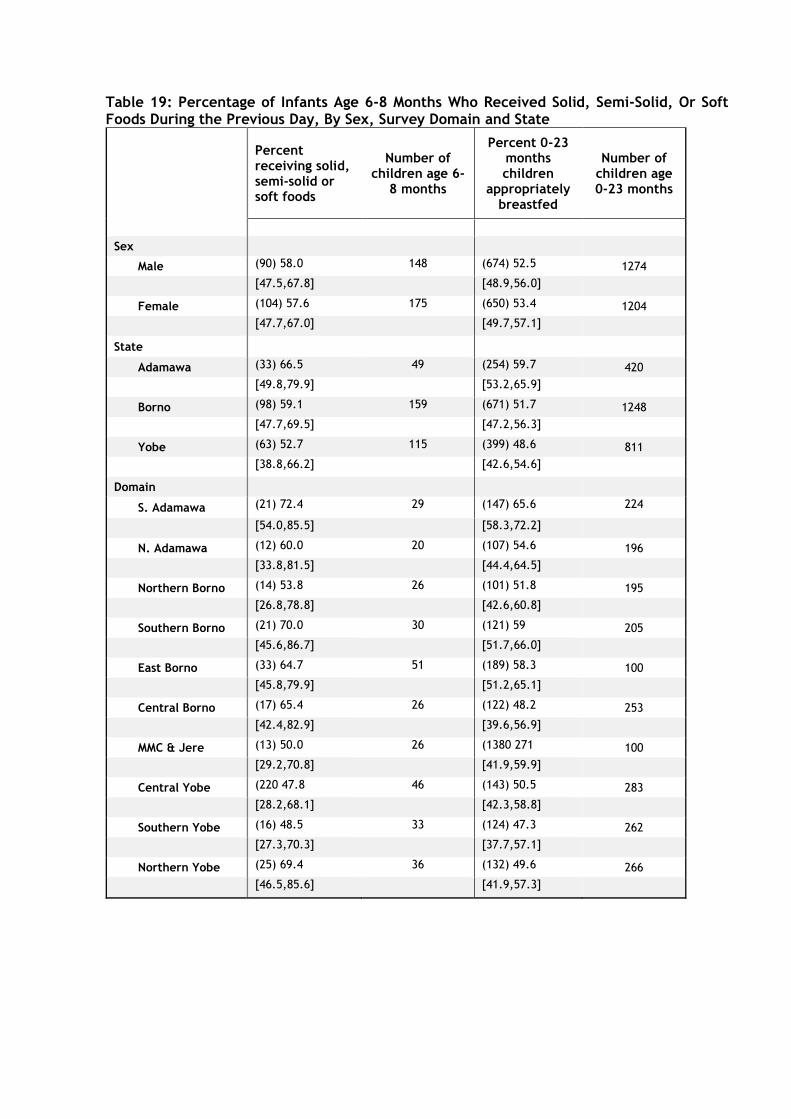
Table 19: Percentage of Infants Age 6-8 Months Who Received Solid, Semi-Solid, Or Soft Foods During the Previous Day, By Sex, Survey Domain and State
Percent receiving solid, semi-solid or soft foods
Number of children age 6-
8 months
Percent 0-23 months children
appropriately breastfed
Number of children age 0-23 months
Sex
Male (90) 58.0 148 (674) 52.5 1274
[47.5,67.8] [48.9,56.0]
Female (104) 57.6 175 (650) 53.4 1204
[47.7,67.0] [49.7,57.1]
State
Adamawa (33) 66.5 49 (254) 59.7 420
[49.8,79.9] [53.2,65.9]
Borno (98) 59.1 159 (671) 51.7 1248
[47.7,69.5] [47.2,56.3]
Yobe (63) 52.7 115 (399) 48.6 811
[38.8,66.2] [42.6,54.6]
Domain
S. Adamawa (21) 72.4 29 (147) 65.6 224
[54.0,85.5] [58.3,72.2]
N. Adamawa (12) 60.0 20 (107) 54.6 196
[33.8,81.5] [44.4,64.5]
Northern Borno (14) 53.8 26 (101) 51.8 195
[26.8,78.8] [42.6,60.8]
Southern Borno (21) 70.0 30 (121) 59 205
[45.6,86.7] [51.7,66.0]
East Borno (33) 64.7 51 (189) 58.3 100
[45.8,79.9] [51.2,65.1]
Central Borno (17) 65.4 26 (122) 48.2 253
[42.4,82.9] [39.6,56.9]
MMC & Jere (13) 50.0 26 (1380 271 100
[29.2,70.8] [41.9,59.9]
Central Yobe (220 47.8 46 (143) 50.5 283
[28.2,68.1] [42.3,58.8]
Southern Yobe (16) 48.5 33 (124) 47.3 262
[27.3,70.3] [37.7,57.1]
Northern Yobe (25) 69.4 36 (132) 49.6 266
[46.5,85.6] [41.9,57.3]
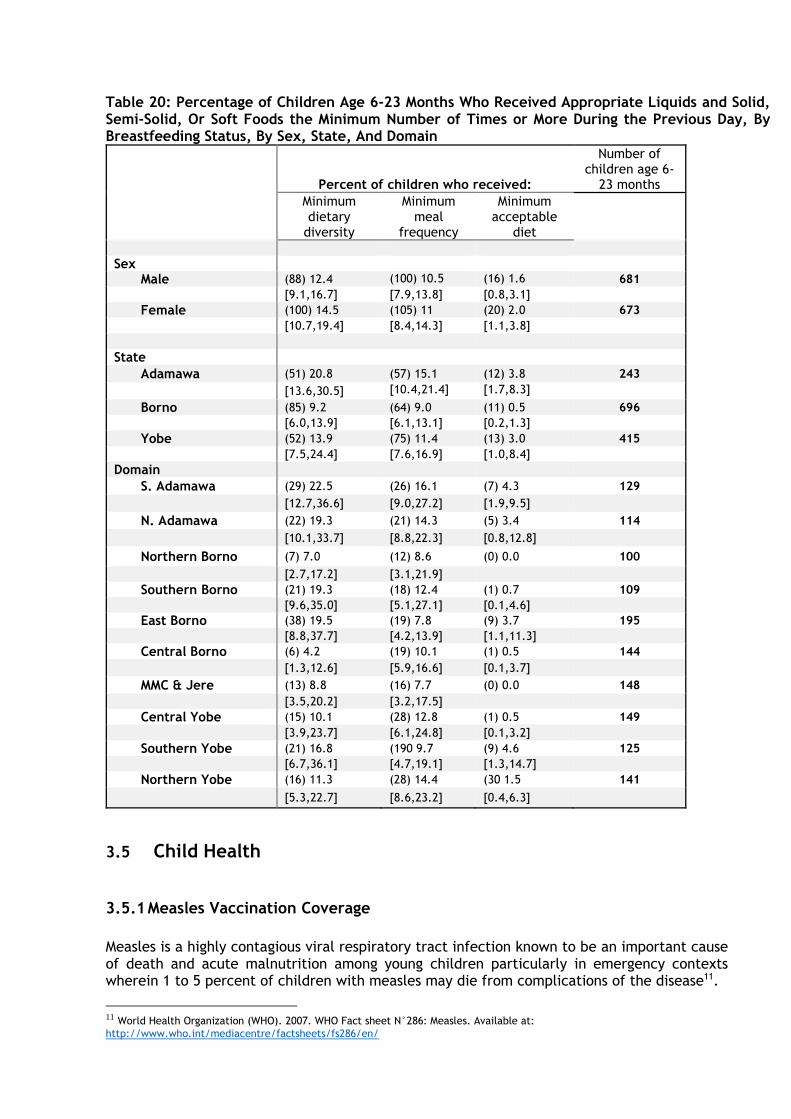
Table 20: Percentage of Children Age 6-23 Months Who Received Appropriate Liquids and Solid, Semi-Solid, Or Soft Foods the Minimum Number of Times or More During the Previous Day, By Breastfeeding Status, By Sex, State, And Domain
Percent of children who received:
Number of children age 6-
23 months
Minimum dietary
diversity
Minimum meal
frequency
Minimum acceptable
diet
Sex
Male (88) 12.4 (100) 10.5 (16) 1.6 681
[9.1,16.7] [7.9,13.8] [0.8,3.1]
Female (100) 14.5 (105) 11 (20) 2.0 673
[10.7,19.4] [8.4,14.3] [1.1,3.8]
State
Adamawa (51) 20.8 (57) 15.1 (12) 3.8 243
[13.6,30.5] [10.4,21.4] [1.7,8.3]
Borno (85) 9.2 (64) 9.0 (11) 0.5 696
[6.0,13.9] [6.1,13.1] [0.2,1.3]
Yobe (52) 13.9 (75) 11.4 (13) 3.0 415
[7.5,24.4] [7.6,16.9] [1.0,8.4]
Domain
S. Adamawa (29) 22.5 (26) 16.1 (7) 4.3 129
[12.7,36.6] [9.0,27.2] [1.9,9.5]
N. Adamawa (22) 19.3 (21) 14.3 (5) 3.4 114
[10.1,33.7] [8.8,22.3] [0.8,12.8]
Northern Borno (7) 7.0 (12) 8.6 (0) 0.0 100
[2.7,17.2] [3.1,21.9]
Southern Borno (21) 19.3 (18) 12.4 (1) 0.7 109
[9.6,35.0] [5.1,27.1] [0.1,4.6]
East Borno (38) 19.5 (19) 7.8 (9) 3.7 195
[8.8,37.7] [4.2,13.9] [1.1,11.3]
Central Borno (6) 4.2 (19) 10.1 (1) 0.5 144
[1.3,12.6] [5.9,16.6] [0.1,3.7]
MMC & Jere (13) 8.8 (16) 7.7 (0) 0.0 148
[3.5,20.2] [3.2,17.5]
Central Yobe (15) 10.1 (28) 12.8 (1) 0.5 149
[3.9,23.7] [6.1,24.8] [0.1,3.2]
Southern Yobe (21) 16.8 (190 9.7 (9) 4.6 125
[6.7,36.1] [4.7,19.1] [1.3,14.7]
Northern Yobe (16) 11.3 (28) 14.4 (30 1.5 141
[5.3,22.7] [8.6,23.2] [0.4,6.3]
3.5 Child Health
3.5.1 Measles Vaccination Coverage
Measles is a highly contagious viral respiratory tract infection known to be an important cause of death and acute malnutrition among young children particularly in emergency contexts wherein 1 to 5 percent of children with measles may die from complications of the disease11.
11 World Health Organization (WHO). 2007. WHO Fact sheet N°286: Measles. Available at:
http://www.who.int/mediacentre/factsheets/fs286/en/
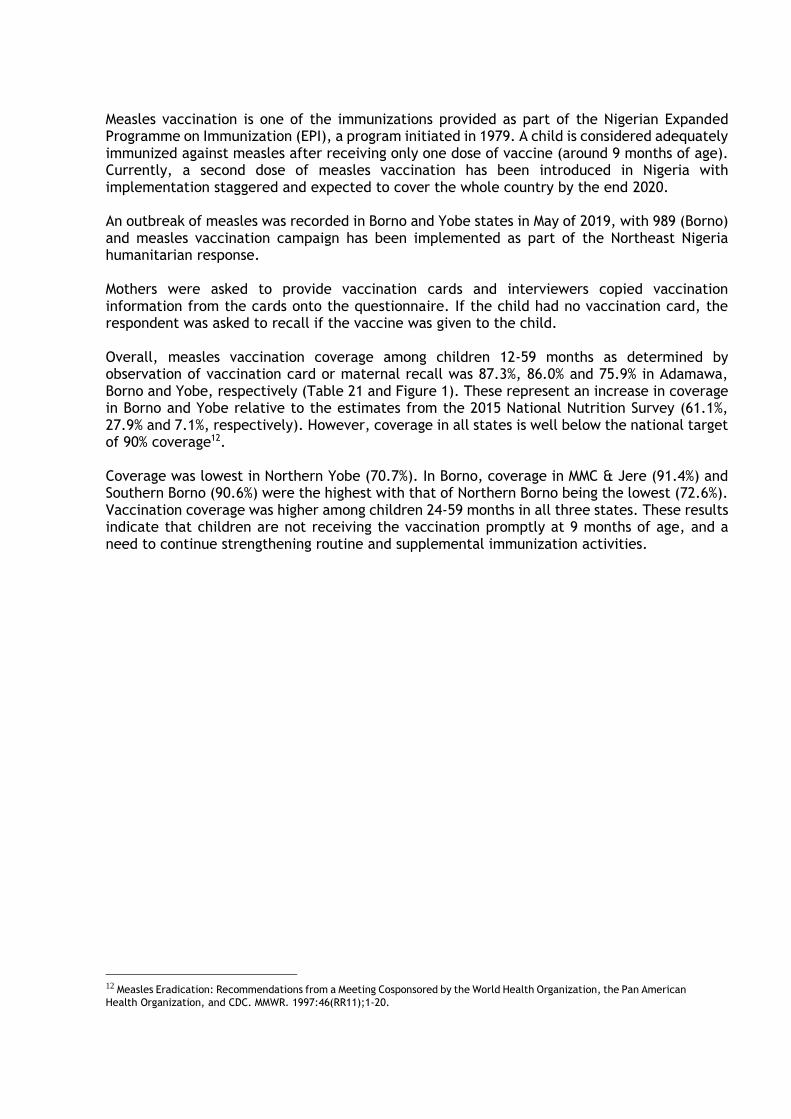
Measles vaccination is one of the immunizations provided as part of the Nigerian Expanded Programme on Immunization (EPI), a program initiated in 1979. A child is considered adequately immunized against measles after receiving only one dose of vaccine (around 9 months of age). Currently, a second dose of measles vaccination has been introduced in Nigeria with implementation staggered and expected to cover the whole country by the end 2020. An outbreak of measles was recorded in Borno and Yobe states in May of 2019, with 989 (Borno) and measles vaccination campaign has been implemented as part of the Northeast Nigeria humanitarian response. Mothers were asked to provide vaccination cards and interviewers copied vaccination information from the cards onto the questionnaire. If the child had no vaccination card, the respondent was asked to recall if the vaccine was given to the child. Overall, measles vaccination coverage among children 12-59 months as determined by observation of vaccination card or maternal recall was 87.3%, 86.0% and 75.9% in Adamawa, Borno and Yobe, respectively (Table 21 and Figure 1). These represent an increase in coverage in Borno and Yobe relative to the estimates from the 2015 National Nutrition Survey (61.1%, 27.9% and 7.1%, respectively). However, coverage in all states is well below the national target of 90% coverage12. Coverage was lowest in Northern Yobe (70.7%). In Borno, coverage in MMC & Jere (91.4%) and Southern Borno (90.6%) were the highest with that of Northern Borno being the lowest (72.6%). Vaccination coverage was higher among children 24-59 months in all three states. These results indicate that children are not receiving the vaccination promptly at 9 months of age, and a need to continue strengthening routine and supplemental immunization activities.
12 Measles Eradication: Recommendations from a Meeting Cosponsored by the World Health Organization, the Pan American
Health Organization, and CDC. MMWR. 1997:46(RR11);1-20.
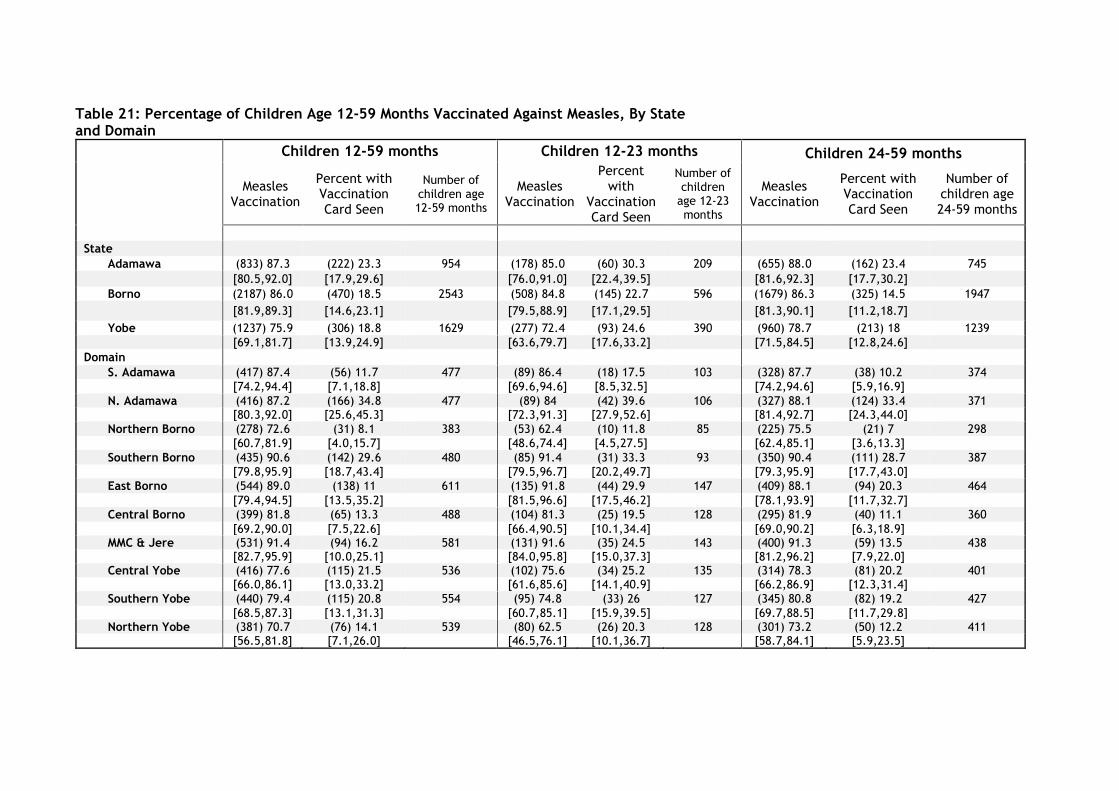
Table 21: Percentage of Children Age 12-59 Months Vaccinated Against Measles, By State and Domain
Children 12-59 months Children 12-23 months Children 24-59 months
Measles Vaccination
Percent with Vaccination Card Seen
Number of children age 12-59 months
Measles Vaccination
Percent with
Vaccination Card Seen
Number of children
age 12-23 months
Measles Vaccination
Percent with Vaccination Card Seen
Number of children age 24-59 months
State Adamawa (833) 87.3 (222) 23.3 954 (178) 85.0 (60) 30.3 209 (655) 88.0 (162) 23.4 745
[80.5,92.0] [17.9,29.6] [76.0,91.0] [22.4,39.5] [81.6,92.3] [17.7,30.2]
Borno (2187) 86.0 (470) 18.5 2543 (508) 84.8 (145) 22.7 596 (1679) 86.3 (325) 14.5 1947
[81.9,89.3] [14.6,23.1] [79.5,88.9] [17.1,29.5] [81.3,90.1] [11.2,18.7]
Yobe (1237) 75.9 (306) 18.8 1629 (277) 72.4 (93) 24.6 390 (960) 78.7 (213) 18 1239
[69.1,81.7] [13.9,24.9] [63.6,79.7] [17.6,33.2] [71.5,84.5] [12.8,24.6]
Domain S. Adamawa (417) 87.4 (56) 11.7 477 (89) 86.4 (18) 17.5 103 (328) 87.7 (38) 10.2 374
[74.2,94.4] [7.1,18.8] [69.6,94.6] [8.5,32.5] [74.2,94.6] [5.9,16.9]
N. Adamawa (416) 87.2 (166) 34.8 477 (89) 84 (42) 39.6 106 (327) 88.1 (124) 33.4 371 [80.3,92.0] [25.6,45.3] [72.3,91.3] [27.9,52.6] [81.4,92.7] [24.3,44.0]
Northern Borno (278) 72.6 (31) 8.1 383 (53) 62.4 (10) 11.8 85 (225) 75.5 (21) 7 298
[60.7,81.9] [4.0,15.7] [48.6,74.4] [4.5,27.5] [62.4,85.1] [3.6,13.3]
Southern Borno (435) 90.6 (142) 29.6 480 (85) 91.4 (31) 33.3 93 (350) 90.4 (111) 28.7 387
[79.8,95.9] [18.7,43.4] [79.5,96.7] [20.2,49.7] [79.3,95.9] [17.7,43.0]
East Borno (544) 89.0 (138) 11 611 (135) 91.8 (44) 29.9 147 (409) 88.1 (94) 20.3 464
[79.4,94.5] [13.5,35.2] [81.5,96.6] [17.5,46.2] [78.1,93.9] [11.7,32.7]
Central Borno (399) 81.8 (65) 13.3 488 (104) 81.3 (25) 19.5 128 (295) 81.9 (40) 11.1 360
[69.2,90.0] [7.5,22.6] [66.4,90.5] [10.1,34.4] [69.0,90.2] [6.3,18.9] MMC & Jere (531) 91.4 (94) 16.2 581 (131) 91.6 (35) 24.5 143 (400) 91.3 (59) 13.5 438
[82.7,95.9] [10.0,25.1] [84.0,95.8] [15.0,37.3] [81.2,96.2] [7.9,22.0] Central Yobe (416) 77.6 (115) 21.5 536 (102) 75.6 (34) 25.2 135 (314) 78.3 (81) 20.2 401
[66.0,86.1] [13.0,33.2] [61.6,85.6] [14.1,40.9] [66.2,86.9] [12.3,31.4]
Southern Yobe (440) 79.4 (115) 20.8 554 (95) 74.8 (33) 26 127 (345) 80.8 (82) 19.2 427
[68.5,87.3] [13.1,31.3] [60.7,85.1] [15.9,39.5] [69.7,88.5] [11.7,29.8] Northern Yobe (381) 70.7 (76) 14.1 539 (80) 62.5 (26) 20.3 128 (301) 73.2 (50) 12.2 411
[56.5,81.8] [7.1,26.0] [46.5,76.1] [10.1,36.7] [58.7,84.1] [5.9,23.5]
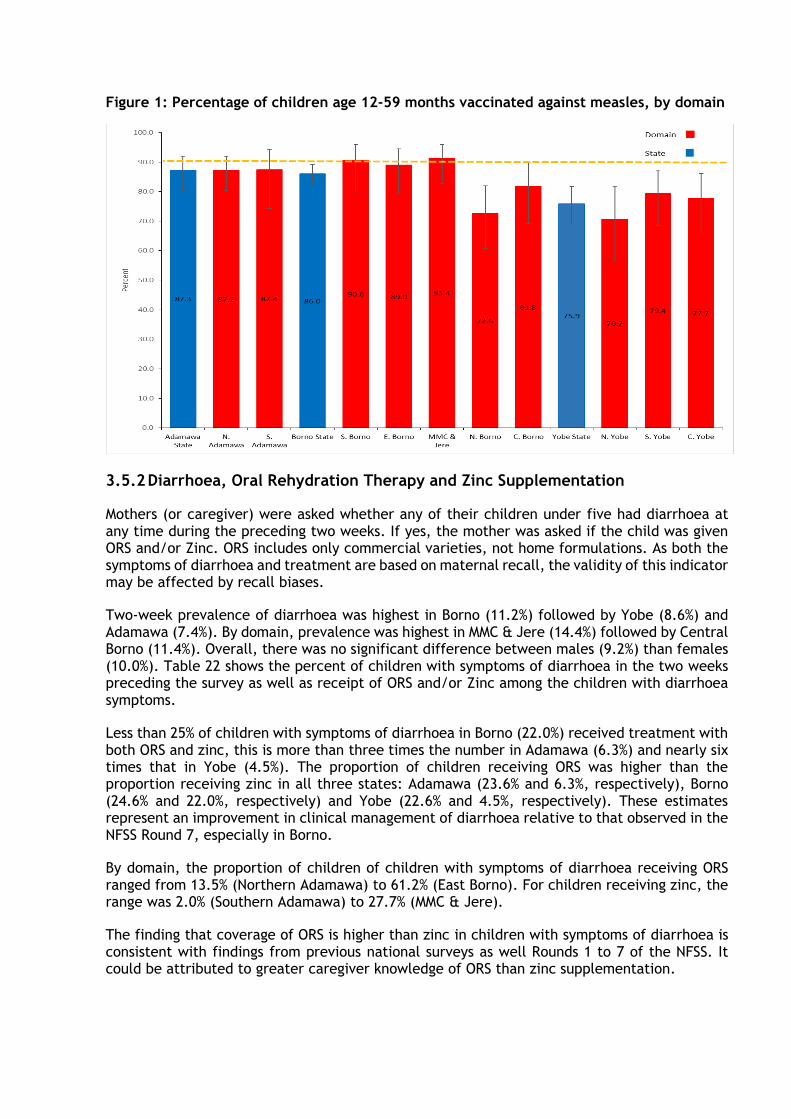
Figure 1: Percentage of children age 12-59 months vaccinated against measles, by domain
3.5.2 Diarrhoea, Oral Rehydration Therapy and Zinc Supplementation
Mothers (or caregiver) were asked whether any of their children under five had diarrhoea at any time during the preceding two weeks. If yes, the mother was asked if the child was given ORS and/or Zinc. ORS includes only commercial varieties, not home formulations. As both the symptoms of diarrhoea and treatment are based on maternal recall, the validity of this indicator may be affected by recall biases.
Two-week prevalence of diarrhoea was highest in Borno (11.2%) followed by Yobe (8.6%) and Adamawa (7.4%). By domain, prevalence was highest in MMC & Jere (14.4%) followed by Central Borno (11.4%). Overall, there was no significant difference between males (9.2%) than females (10.0%). Table 22 shows the percent of children with symptoms of diarrhoea in the two weeks preceding the survey as well as receipt of ORS and/or Zinc among the children with diarrhoea symptoms.
Less than 25% of children with symptoms of diarrhoea in Borno (22.0%) received treatment with both ORS and zinc, this is more than three times the number in Adamawa (6.3%) and nearly six times that in Yobe (4.5%). The proportion of children receiving ORS was higher than the proportion receiving zinc in all three states: Adamawa (23.6% and 6.3%, respectively), Borno (24.6% and 22.0%, respectively) and Yobe (22.6% and 4.5%, respectively). These estimates represent an improvement in clinical management of diarrhoea relative to that observed in the NFSS Round 7, especially in Borno.
By domain, the proportion of children of children with symptoms of diarrhoea receiving ORS ranged from 13.5% (Northern Adamawa) to 61.2% (East Borno). For children receiving zinc, the range was 2.0% (Southern Adamawa) to 27.7% (MMC & Jere).
The finding that coverage of ORS is higher than zinc in children with symptoms of diarrhoea is consistent with findings from previous national surveys as well Rounds 1 to 7 of the NFSS. It could be attributed to greater caregiver knowledge of ORS than zinc supplementation.
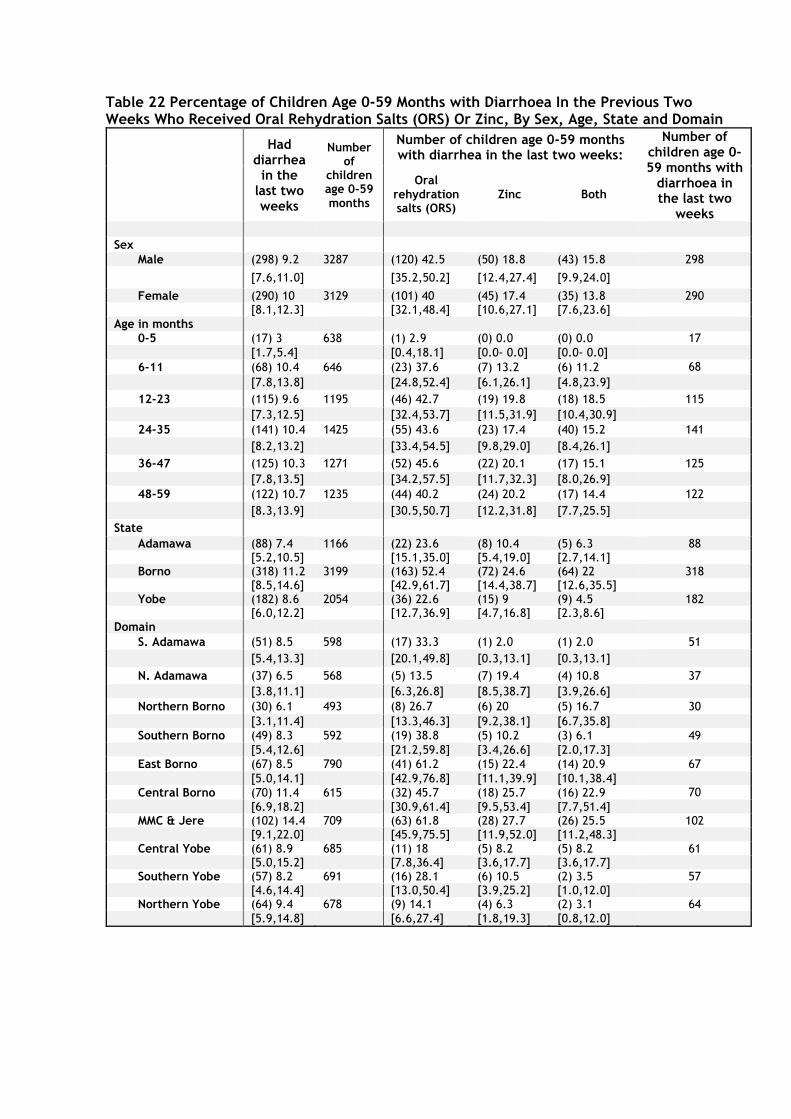
Table 22 Percentage of Children Age 0-59 Months with Diarrhoea In the Previous Two Weeks Who Received Oral Rehydration Salts (ORS) Or Zinc, By Sex, Age, State and Domain
Had diarrhea
in the last two weeks
Number of
children age 0-59 months
Number of children age 0-59 months with diarrhea in the last two weeks:
Number of children age 0-59 months with
diarrhoea in the last two
weeks
Oral rehydration salts (ORS)
Zinc Both
Sex
Male (298) 9.2 3287 (120) 42.5 (50) 18.8 (43) 15.8 298
[7.6,11.0] [35.2,50.2] [12.4,27.4] [9.9,24.0]
Female (290) 10 3129 (101) 40 (45) 17.4 (35) 13.8 290 [8.1,12.3] [32.1,48.4] [10.6,27.1] [7.6,23.6]
Age in months
0-5 (17) 3 638 (1) 2.9 (0) 0.0 (0) 0.0 17
[1.7,5.4] [0.4,18.1] [0.0- 0.0] [0.0- 0.0]
6-11 (68) 10.4 646 (23) 37.6 (7) 13.2 (6) 11.2 68
[7.8,13.8] [24.8,52.4] [6.1,26.1] [4.8,23.9]
12-23 (115) 9.6 1195 (46) 42.7 (19) 19.8 (18) 18.5 115
[7.3,12.5] [32.4,53.7] [11.5,31.9] [10.4,30.9]
24-35 (141) 10.4 1425 (55) 43.6 (23) 17.4 (40) 15.2 141
[8.2,13.2] [33.4,54.5] [9.8,29.0] [8.4,26.1]
36-47 (125) 10.3 1271 (52) 45.6 (22) 20.1 (17) 15.1 125
[7.8,13.5] [34.2,57.5] [11.7,32.3] [8.0,26.9]
48-59 (122) 10.7 1235 (44) 40.2 (24) 20.2 (17) 14.4 122
[8.3,13.9] [30.5,50.7] [12.2,31.8] [7.7,25.5]
State
Adamawa (88) 7.4 1166 (22) 23.6 (8) 10.4 (5) 6.3 88 [5.2,10.5] [15.1,35.0] [5.4,19.0] [2.7,14.1]
Borno (318) 11.2 3199 (163) 52.4 (72) 24.6 (64) 22 318 [8.5,14.6] [42.9,61.7] [14.4,38.7] [12.6,35.5]
Yobe (182) 8.6 2054 (36) 22.6 (15) 9 (9) 4.5 182 [6.0,12.2] [12.7,36.9] [4.7,16.8] [2.3,8.6] Domain
S. Adamawa (51) 8.5 598 (17) 33.3 (1) 2.0 (1) 2.0 51
[5.4,13.3] [20.1,49.8] [0.3,13.1] [0.3,13.1]
N. Adamawa (37) 6.5 568 (5) 13.5 (7) 19.4 (4) 10.8 37
[3.8,11.1] [6.3,26.8] [8.5,38.7] [3.9,26.6]
Northern Borno (30) 6.1 493 (8) 26.7 (6) 20 (5) 16.7 30
[3.1,11.4] [13.3,46.3] [9.2,38.1] [6.7,35.8]
Southern Borno (49) 8.3 592 (19) 38.8 (5) 10.2 (3) 6.1 49
[5.4,12.6] [21.2,59.8] [3.4,26.6] [2.0,17.3]
East Borno (67) 8.5 790 (41) 61.2 (15) 22.4 (14) 20.9 67
[5.0,14.1] [42.9,76.8] [11.1,39.9] [10.1,38.4]
Central Borno (70) 11.4 615 (32) 45.7 (18) 25.7 (16) 22.9 70
[6.9,18.2] [30.9,61.4] [9.5,53.4] [7.7,51.4] MMC & Jere (102) 14.4 709 (63) 61.8 (28) 27.7 (26) 25.5 102
[9.1,22.0] [45.9,75.5] [11.9,52.0] [11.2,48.3] Central Yobe (61) 8.9 685 (11) 18 (5) 8.2 (5) 8.2 61
[5.0,15.2] [7.8,36.4] [3.6,17.7] [3.6,17.7] Southern Yobe (57) 8.2 691 (16) 28.1 (6) 10.5 (2) 3.5 57 [4.6,14.4] [13.0,50.4] [3.9,25.2] [1.0,12.0] Northern Yobe (64) 9.4 678 (9) 14.1 (4) 6.3 (2) 3.1 64
[5.9,14.8] [6.6,27.4] [1.8,19.3] [0.8,12.0]
3.5.3 Acute Respiratory Infection (ARI) and Treatment
Among children under five years of age, the rates for ARI symptoms during the two weeks preceding the survey were highest in Borno (2.5%), followed by Yobe (1.8%) and Adamawa (1.5%). Nearly half of the children in Adamawa, Borno and Yobe (42.6%, 36.0% and 41.4%, respectively) received antibiotics (see table 23). Prescription of antibiotics varied greatly by domain. Less than one in five children with symptoms of ARI in Northern Borno (12.5%) received antibiotics compared to three in five children in Southern Adamawa (66.7%) and Northern Yobe (66.7%). These differences do not correspond with major differences in receipt of any medication (including antibiotics as well as paracetamol, aspirin, ibuprofen, and other medications). No major differences in two-week prevalence or receipt of antibiotics were observed by gender. Antibiotic treatment was least prevalent among children aged 0-5 months (20.9%).
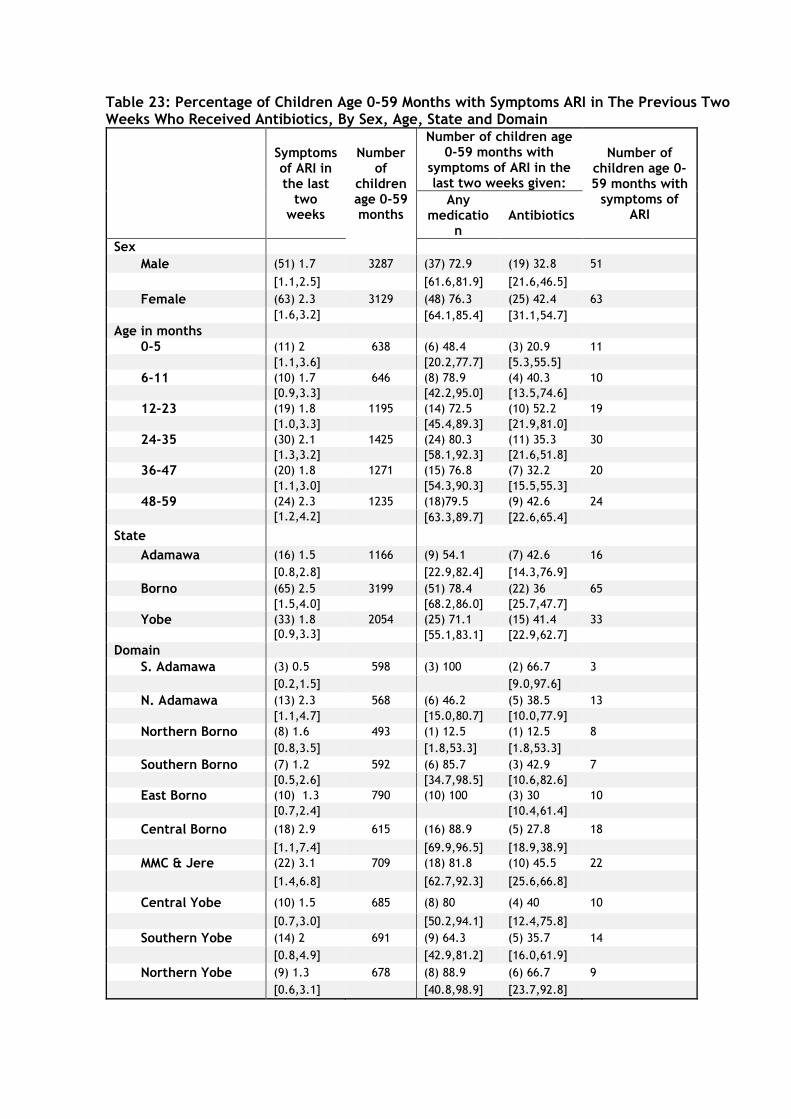
Table 23: Percentage of Children Age 0-59 Months with Symptoms ARI in The Previous Two Weeks Who Received Antibiotics, By Sex, Age, State and Domain
Symptoms of ARI in the last
two weeks
Number of
children age 0-59 months
Number of children age 0-59 months with
symptoms of ARI in the last two weeks given:
Number of children age 0-59 months with
symptoms of ARI
Any medicatio
n Antibiotics
Sex
Male (51) 1.7 3287 (37) 72.9 (19) 32.8 51
[1.1,2.5] [61.6,81.9] [21.6,46.5]
Female (63) 2.3 3129 (48) 76.3 (25) 42.4 63
[1.6,3.2] [64.1,85.4] [31.1,54.7]
Age in months
0-5 (11) 2 638 (6) 48.4 (3) 20.9 11
[1.1,3.6] [20.2,77.7] [5.3,55.5]
6-11 (10) 1.7 646 (8) 78.9 (4) 40.3 10
[0.9,3.3] [42.2,95.0] [13.5,74.6]
12-23 (19) 1.8 1195 (14) 72.5 (10) 52.2 19
[1.0,3.3] [45.4,89.3] [21.9,81.0]
24-35 (30) 2.1 1425 (24) 80.3 (11) 35.3 30
[1.3,3.2] [58.1,92.3] [21.6,51.8]
36-47 (20) 1.8 1271 (15) 76.8 (7) 32.2 20
[1.1,3.0] [54.3,90.3] [15.5,55.3]
48-59 (24) 2.3 1235 (18)79.5 (9) 42.6 24
[1.2,4.2] [63.3,89.7] [22.6,65.4]
State
Adamawa (16) 1.5 1166 (9) 54.1 (7) 42.6 16
[0.8,2.8] [22.9,82.4] [14.3,76.9]
Borno (65) 2.5 3199 (51) 78.4 (22) 36 65
[1.5,4.0] [68.2,86.0] [25.7,47.7]
Yobe (33) 1.8 2054 (25) 71.1 (15) 41.4 33
[0.9,3.3] [55.1,83.1] [22.9,62.7]
Domain
S. Adamawa (3) 0.5 598 (3) 100 (2) 66.7 3
[0.2,1.5] [9.0,97.6]
N. Adamawa (13) 2.3 568 (6) 46.2 (5) 38.5 13
[1.1,4.7] [15.0,80.7] [10.0,77.9]
Northern Borno (8) 1.6 493 (1) 12.5 (1) 12.5 8
[0.8,3.5] [1.8,53.3] [1.8,53.3]
Southern Borno (7) 1.2 592 (6) 85.7 (3) 42.9 7
[0.5,2.6] [34.7,98.5] [10.6,82.6]
East Borno (10) 1.3 790 (10) 100 (3) 30 10
[0.7,2.4] [10.4,61.4]
Central Borno (18) 2.9 615 (16) 88.9 (5) 27.8 18
[1.1,7.4] [69.9,96.5] [18.9,38.9]
MMC & Jere (22) 3.1 709 (18) 81.8 (10) 45.5 22
[1.4,6.8] [62.7,92.3] [25.6,66.8]
Central Yobe (10) 1.5 685 (8) 80 (4) 40 10
[0.7,3.0] [50.2,94.1] [12.4,75.8]
Southern Yobe (14) 2 691 (9) 64.3 (5) 35.7 14
[0.8,4.9] [42.9,81.2] [16.0,61.9]
Northern Yobe (9) 1.3 678 (8) 88.9 (6) 66.7 9
[0.6,3.1] [40.8,98.9] [23.7,92.8]
3.5.4 Fever, Prevention of Malaria, and Antimalarial Treatment
Among all children with symptoms of fever, receipt of antimalarial medications was highest in Borno (40.9%) followed by Yobe (34.5%) and Adamawa (28.9%). However, less than 20% of all children receiving antimalarial treatment received ACT, the first-line treatment for malaria in Nigeria. Receipt of ACT in Yobe (6.5%) was nearly five times that of Adamawa (1.5%) and nearly twice that of Borno (1.5%). The proportion of children receiving ACT varied by domain ranging from 1.5% in 2 domains of Adamawa to 14.5% in East Borno. Table 24 shows the proportion of children receiving any antimalarial medication including SP/Fansidar, Chloroquine, Amodiaquine, Quinine, ACT, or any other anti-malarial. The use of antimalarial treatment (including ACT) increased with age, from 8.5% among children less than 6 months of age to 39.0% for children above 4 years of age, while antibiotic treatment is quite stable at around (10.4 to 26.1%) for all age cohorts above 5 months. No significant difference was noted between boys and girls receiving appropriate antimalarial drugs. These findings suggest that despite national programs, adequate clinical management of malaria with first line treatment remains below the national target of 80% as specified in the National Malaria Strategic Plan13.
13 Federal Ministry of Health. 2011. National Policy on Malaria Diagnosis and Treatment.
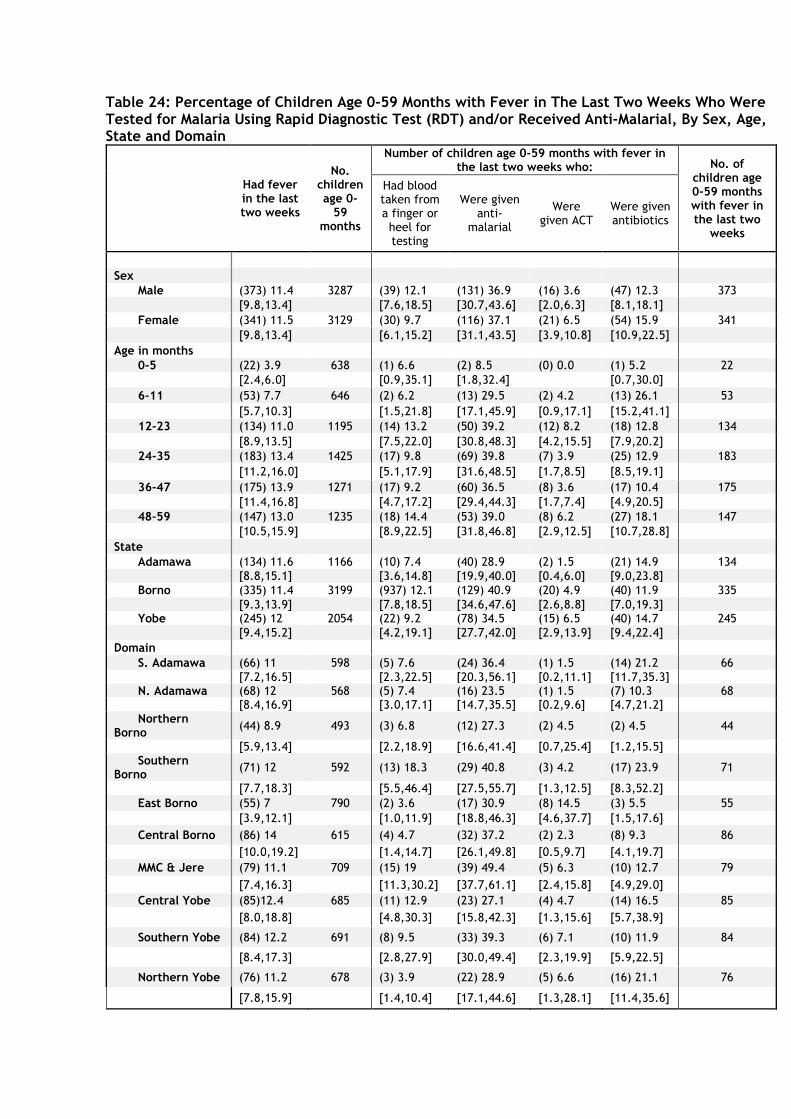
Table 24: Percentage of Children Age 0-59 Months with Fever in The Last Two Weeks Who Were Tested for Malaria Using Rapid Diagnostic Test (RDT) and/or Received Anti-Malarial, By Sex, Age, State and Domain
Had fever in the last two weeks
No. children age 0-
59 months
Number of children age 0-59 months with fever in the last two weeks who: No. of
children age 0-59 months with fever in the last two
weeks
Had blood taken from a finger or heel for testing
Were given anti-
malarial
Were given ACT
Were given antibiotics
Sex
Male (373) 11.4 3287 (39) 12.1 (131) 36.9 (16) 3.6 (47) 12.3 373
[9.8,13.4] [7.6,18.5] [30.7,43.6] [2.0,6.3] [8.1,18.1] Female (341) 11.5 3129 (30) 9.7 (116) 37.1 (21) 6.5 (54) 15.9 341
[9.8,13.4] [6.1,15.2] [31.1,43.5] [3.9,10.8] [10.9,22.5] Age in months
0-5 (22) 3.9 638 (1) 6.6 (2) 8.5 (0) 0.0 (1) 5.2 22
[2.4,6.0] [0.9,35.1] [1.8,32.4] [0.7,30.0] 6-11 (53) 7.7 646 (2) 6.2 (13) 29.5 (2) 4.2 (13) 26.1 53
[5.7,10.3] [1.5,21.8] [17.1,45.9] [0.9,17.1] [15.2,41.1] 12-23 (134) 11.0 1195 (14) 13.2 (50) 39.2 (12) 8.2 (18) 12.8 134
[8.9,13.5] [7.5,22.0] [30.8,48.3] [4.2,15.5] [7.9,20.2] 24-35 (183) 13.4 1425 (17) 9.8 (69) 39.8 (7) 3.9 (25) 12.9 183
[11.2,16.0] [5.1,17.9] [31.6,48.5] [1.7,8.5] [8.5,19.1]
36-47 (175) 13.9 1271 (17) 9.2 (60) 36.5 (8) 3.6 (17) 10.4 175
[11.4,16.8] [4.7,17.2] [29.4,44.3] [1.7,7.4] [4.9,20.5] 48-59 (147) 13.0 1235 (18) 14.4 (53) 39.0 (8) 6.2 (27) 18.1 147
[10.5,15.9] [8.9,22.5] [31.8,46.8] [2.9,12.5] [10.7,28.8] State
Adamawa (134) 11.6 1166 (10) 7.4 (40) 28.9 (2) 1.5 (21) 14.9 134
[8.8,15.1] [3.6,14.8] [19.9,40.0] [0.4,6.0] [9.0,23.8]
Borno (335) 11.4 3199 (937) 12.1 (129) 40.9 (20) 4.9 (40) 11.9 335
[9.3,13.9] [7.8,18.5] [34.6,47.6] [2.6,8.8] [7.0,19.3] Yobe (245) 12 2054 (22) 9.2 (78) 34.5 (15) 6.5 (40) 14.7 245
[9.4,15.2] [4.2,19.1] [27.7,42.0] [2.9,13.9] [9.4,22.4]
Domain
S. Adamawa (66) 11 598 (5) 7.6 (24) 36.4 (1) 1.5 (14) 21.2 66
[7.2,16.5] [2.3,22.5] [20.3,56.1] [0.2,11.1] [11.7,35.3] N. Adamawa (68) 12 568 (5) 7.4 (16) 23.5 (1) 1.5 (7) 10.3 68
[8.4,16.9] [3.0,17.1] [14.7,35.5] [0.2,9.6] [4.7,21.2] Northern
Borno (44) 8.9 493 (3) 6.8 (12) 27.3 (2) 4.5 (2) 4.5 44
[5.9,13.4] [2.2,18.9] [16.6,41.4] [0.7,25.4] [1.2,15.5] Southern
Borno (71) 12 592 (13) 18.3 (29) 40.8 (3) 4.2 (17) 23.9 71
[7.7,18.3] [5.5,46.4] [27.5,55.7] [1.3,12.5] [8.3,52.2]
East Borno (55) 7 790 (2) 3.6 (17) 30.9 (8) 14.5 (3) 5.5 55
[3.9,12.1] [1.0,11.9] [18.8,46.3] [4.6,37.7] [1.5,17.6]
Central Borno (86) 14 615 (4) 4.7 (32) 37.2 (2) 2.3 (8) 9.3 86
[10.0,19.2] [1.4,14.7] [26.1,49.8] [0.5,9.7] [4.1,19.7]
MMC & Jere (79) 11.1 709 (15) 19 (39) 49.4 (5) 6.3 (10) 12.7 79
[7.4,16.3] [11.3,30.2] [37.7,61.1] [2.4,15.8] [4.9,29.0]
Central Yobe (85)12.4 685 (11) 12.9 (23) 27.1 (4) 4.7 (14) 16.5 85
[8.0,18.8] [4.8,30.3] [15.8,42.3] [1.3,15.6] [5.7,38.9]
Southern Yobe (84) 12.2 691 (8) 9.5 (33) 39.3 (6) 7.1 (10) 11.9 84
[8.4,17.3] [2.8,27.9] [30.0,49.4] [2.3,19.9] [5.9,22.5]
Northern Yobe (76) 11.2 678 (3) 3.9 (22) 28.9 (5) 6.6 (16) 21.1 76
[7.8,15.9] [1.4,10.4] [17.1,44.6] [1.3,28.1] [11.4,35.6]
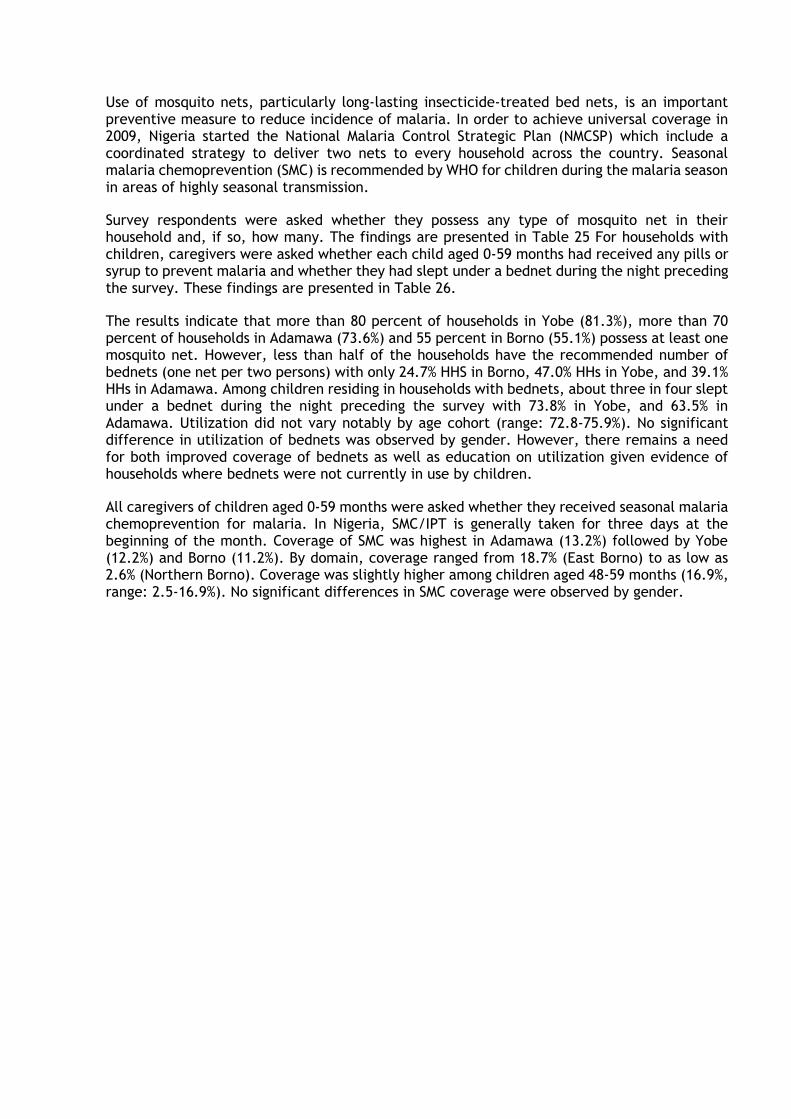
Use of mosquito nets, particularly long-lasting insecticide-treated bed nets, is an important preventive measure to reduce incidence of malaria. In order to achieve universal coverage in 2009, Nigeria started the National Malaria Control Strategic Plan (NMCSP) which include a coordinated strategy to deliver two nets to every household across the country. Seasonal malaria chemoprevention (SMC) is recommended by WHO for children during the malaria season in areas of highly seasonal transmission.
Survey respondents were asked whether they possess any type of mosquito net in their household and, if so, how many. The findings are presented in Table 25 For households with children, caregivers were asked whether each child aged 0-59 months had received any pills or syrup to prevent malaria and whether they had slept under a bednet during the night preceding the survey. These findings are presented in Table 26.
The results indicate that more than 80 percent of households in Yobe (81.3%), more than 70 percent of households in Adamawa (73.6%) and 55 percent in Borno (55.1%) possess at least one mosquito net. However, less than half of the households have the recommended number of bednets (one net per two persons) with only 24.7% HHS in Borno, 47.0% HHs in Yobe, and 39.1% HHs in Adamawa. Among children residing in households with bednets, about three in four slept under a bednet during the night preceding the survey with 73.8% in Yobe, and 63.5% in Adamawa. Utilization did not vary notably by age cohort (range: 72.8-75.9%). No significant difference in utilization of bednets was observed by gender. However, there remains a need for both improved coverage of bednets as well as education on utilization given evidence of households where bednets were not currently in use by children.
All caregivers of children aged 0-59 months were asked whether they received seasonal malaria chemoprevention for malaria. In Nigeria, SMC/IPT is generally taken for three days at the beginning of the month. Coverage of SMC was highest in Adamawa (13.2%) followed by Yobe (12.2%) and Borno (11.2%). By domain, coverage ranged from 18.7% (East Borno) to as low as 2.6% (Northern Borno). Coverage was slightly higher among children aged 48-59 months (16.9%, range: 2.5-16.9%). No significant differences in SMC coverage were observed by gender.
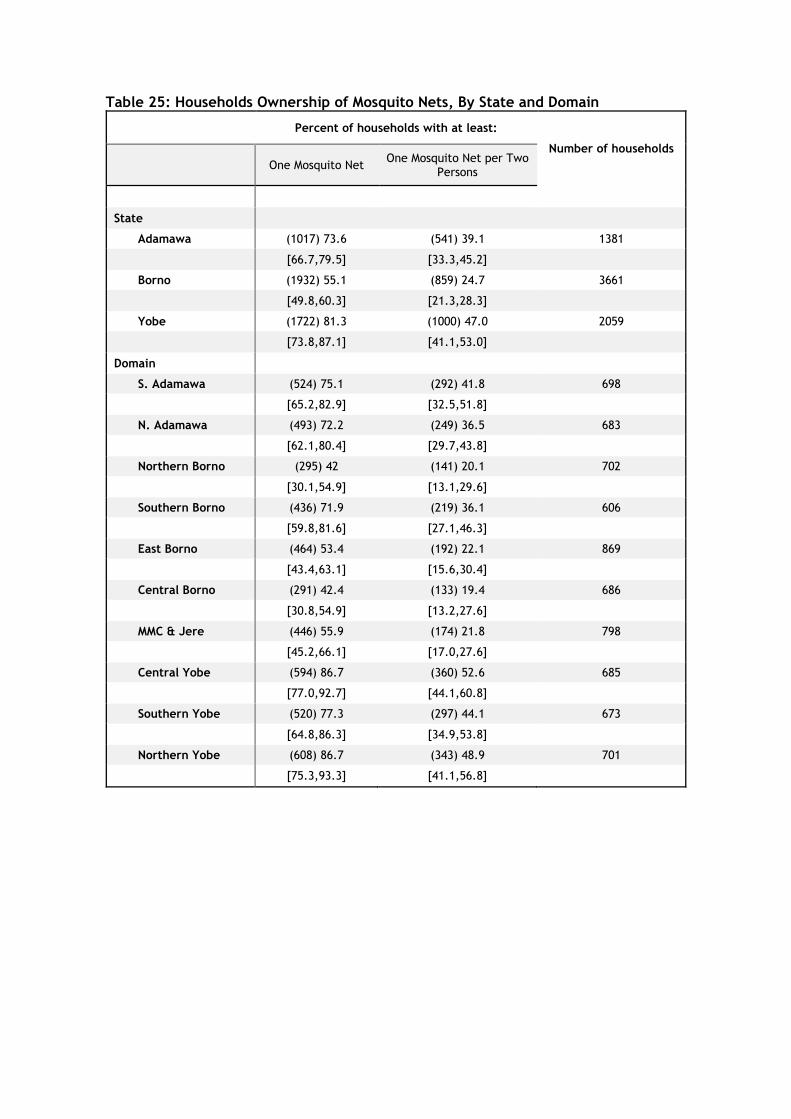
Table 25: Households Ownership of Mosquito Nets, By State and Domain
Percent of households with at least:
Number of households
One Mosquito Net One Mosquito Net per Two
Persons
State
Adamawa (1017) 73.6 (541) 39.1 1381
[66.7,79.5] [33.3,45.2]
Borno (1932) 55.1 (859) 24.7 3661
[49.8,60.3] [21.3,28.3]
Yobe (1722) 81.3 (1000) 47.0 2059
[73.8,87.1] [41.1,53.0]
Domain
S. Adamawa (524) 75.1 (292) 41.8 698
[65.2,82.9] [32.5,51.8]
N. Adamawa (493) 72.2 (249) 36.5 683
[62.1,80.4] [29.7,43.8]
Northern Borno (295) 42 (141) 20.1 702
[30.1,54.9] [13.1,29.6]
Southern Borno (436) 71.9 (219) 36.1 606
[59.8,81.6] [27.1,46.3]
East Borno (464) 53.4 (192) 22.1 869
[43.4,63.1] [15.6,30.4]
Central Borno (291) 42.4 (133) 19.4 686
[30.8,54.9] [13.2,27.6]
MMC & Jere (446) 55.9 (174) 21.8 798
[45.2,66.1] [17.0,27.6]
Central Yobe (594) 86.7 (360) 52.6 685
[77.0,92.7] [44.1,60.8]
Southern Yobe (520) 77.3 (297) 44.1 673
[64.8,86.3] [34.9,53.8]
Northern Yobe (608) 86.7 (343) 48.9 701
[75.3,93.3] [41.1,56.8]
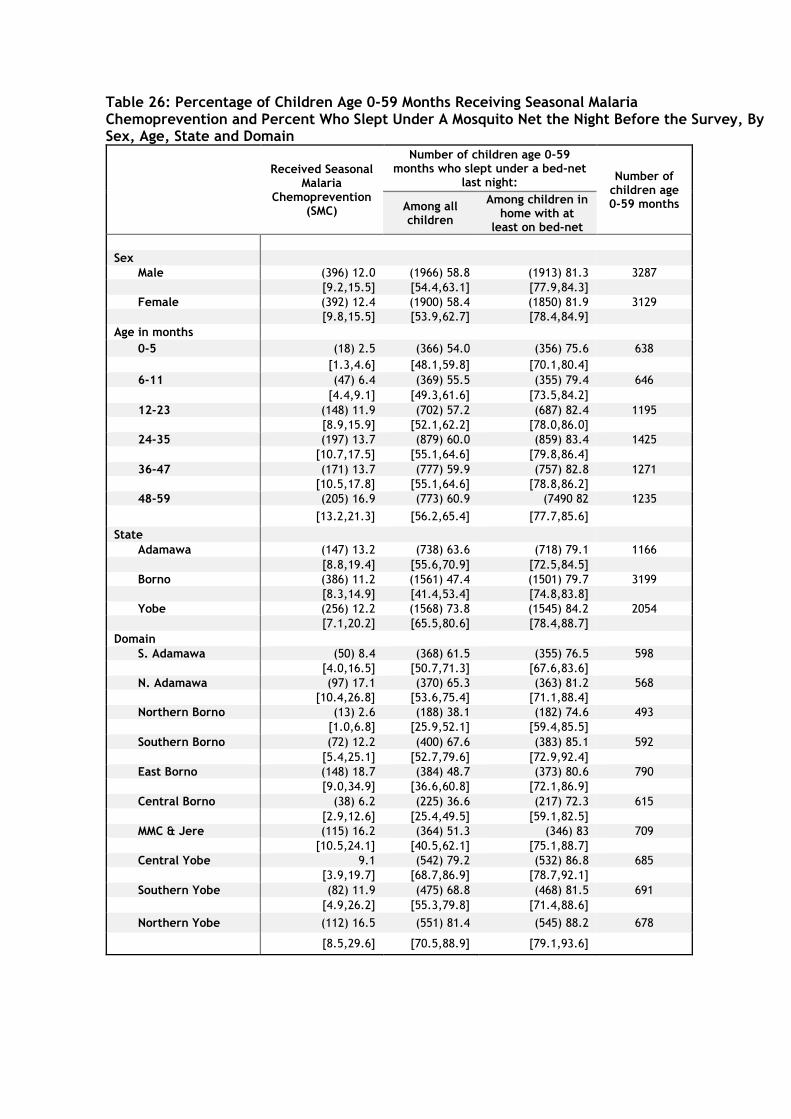
Table 26: Percentage of Children Age 0-59 Months Receiving Seasonal Malaria Chemoprevention and Percent Who Slept Under A Mosquito Net the Night Before the Survey, By Sex, Age, State and Domain
Received Seasonal Malaria
Chemoprevention (SMC)
Number of children age 0-59 months who slept under a bed-net
last night: Number of
children age 0-59 months Among all
children
Among children in home with at
least on bed-net
Sex
Male (396) 12.0 (1966) 58.8 (1913) 81.3 3287
[9.2,15.5] [54.4,63.1] [77.9,84.3] Female (392) 12.4 (1900) 58.4 (1850) 81.9 3129
[9.8,15.5] [53.9,62.7] [78.4,84.9] Age in months
0-5 (18) 2.5 (366) 54.0 (356) 75.6 638
[1.3,4.6] [48.1,59.8] [70.1,80.4] 6-11 (47) 6.4 (369) 55.5 (355) 79.4 646
[4.4,9.1] [49.3,61.6] [73.5,84.2] 12-23 (148) 11.9 (702) 57.2 (687) 82.4 1195
[8.9,15.9] [52.1,62.2] [78.0,86.0] 24-35 (197) 13.7 (879) 60.0 (859) 83.4 1425
[10.7,17.5] [55.1,64.6] [79.8,86.4] 36-47 (171) 13.7 (777) 59.9 (757) 82.8 1271
[10.5,17.8] [55.1,64.6] [78.8,86.2] 48-59 (205) 16.9 (773) 60.9 (7490 82 1235
[13.2,21.3] [56.2,65.4] [77.7,85.6]
State Adamawa (147) 13.2 (738) 63.6 (718) 79.1 1166
[8.8,19.4] [55.6,70.9] [72.5,84.5] Borno (386) 11.2 (1561) 47.4 (1501) 79.7 3199
[8.3,14.9] [41.4,53.4] [74.8,83.8] Yobe (256) 12.2 (1568) 73.8 (1545) 84.2 2054
[7.1,20.2] [65.5,80.6] [78.4,88.7] Domain
S. Adamawa (50) 8.4 (368) 61.5 (355) 76.5 598
[4.0,16.5] [50.7,71.3] [67.6,83.6] N. Adamawa (97) 17.1 (370) 65.3 (363) 81.2 568
[10.4,26.8] [53.6,75.4] [71.1,88.4] Northern Borno (13) 2.6 (188) 38.1 (182) 74.6 493
[1.0,6.8] [25.9,52.1] [59.4,85.5] Southern Borno (72) 12.2 (400) 67.6 (383) 85.1 592
[5.4,25.1] [52.7,79.6] [72.9,92.4] East Borno (148) 18.7 (384) 48.7 (373) 80.6 790
[9.0,34.9] [36.6,60.8] [72.1,86.9] Central Borno (38) 6.2 (225) 36.6 (217) 72.3 615
[2.9,12.6] [25.4,49.5] [59.1,82.5] MMC & Jere (115) 16.2 (364) 51.3 (346) 83 709
[10.5,24.1] [40.5,62.1] [75.1,88.7] Central Yobe 9.1 (542) 79.2 (532) 86.8 685
[3.9,19.7] [68.7,86.9] [78.7,92.1] Southern Yobe (82) 11.9 (475) 68.8 (468) 81.5 691
[4.9,26.2] [55.3,79.8] [71.4,88.6]
Northern Yobe (112) 16.5 (551) 81.4 (545) 88.2 678
[8.5,29.6] [70.5,88.9] [79.1,93.6]
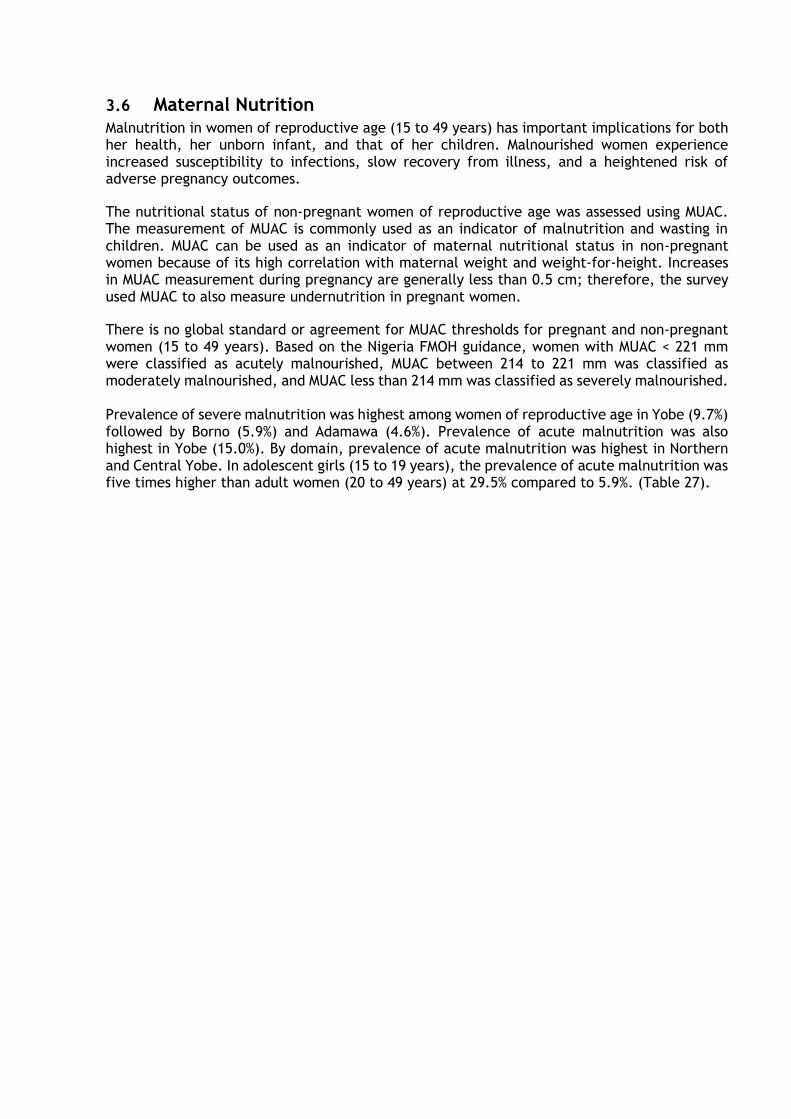
3.6 Maternal Nutrition Malnutrition in women of reproductive age (15 to 49 years) has important implications for both her health, her unborn infant, and that of her children. Malnourished women experience increased susceptibility to infections, slow recovery from illness, and a heightened risk of adverse pregnancy outcomes.
The nutritional status of non-pregnant women of reproductive age was assessed using MUAC. The measurement of MUAC is commonly used as an indicator of malnutrition and wasting in children. MUAC can be used as an indicator of maternal nutritional status in non-pregnant women because of its high correlation with maternal weight and weight-for-height. Increases in MUAC measurement during pregnancy are generally less than 0.5 cm; therefore, the survey used MUAC to also measure undernutrition in pregnant women.
There is no global standard or agreement for MUAC thresholds for pregnant and non-pregnant women (15 to 49 years). Based on the Nigeria FMOH guidance, women with MUAC < 221 mm were classified as acutely malnourished, MUAC between 214 to 221 mm was classified as moderately malnourished, and MUAC less than 214 mm was classified as severely malnourished. Prevalence of severe malnutrition was highest among women of reproductive age in Yobe (9.7%) followed by Borno (5.9%) and Adamawa (4.6%). Prevalence of acute malnutrition was also highest in Yobe (15.0%). By domain, prevalence of acute malnutrition was highest in Northern and Central Yobe. In adolescent girls (15 to 19 years), the prevalence of acute malnutrition was five times higher than adult women (20 to 49 years) at 29.5% compared to 5.9%. (Table 27).
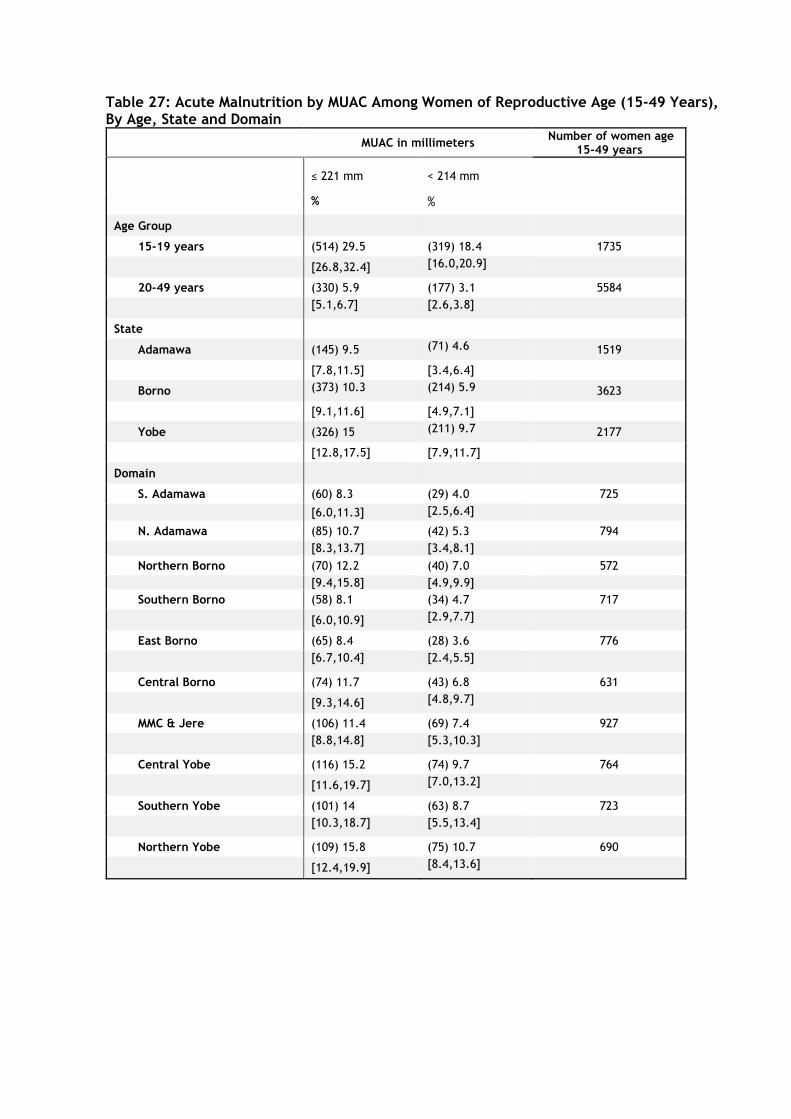
Table 27: Acute Malnutrition by MUAC Among Women of Reproductive Age (15-49 Years), By Age, State and Domain
MUAC in millimeters Number of women age
15-49 years
≤ 221 mm < 214 mm
% %
Age Group
15-19 years (514) 29.5 (319) 18.4 1735
[26.8,32.4] [16.0,20.9]
20-49 years (330) 5.9 (177) 3.1 5584
[5.1,6.7] [2.6,3.8]
State
Adamawa (145) 9.5 (71) 4.6 1519
[7.8,11.5] [3.4,6.4]
Borno (373) 10.3 (214) 5.9 3623
[9.1,11.6] [4.9,7.1]
Yobe (326) 15 (211) 9.7 2177
[12.8,17.5] [7.9,11.7]
Domain
S. Adamawa (60) 8.3 (29) 4.0 725
[6.0,11.3] [2.5,6.4]
N. Adamawa (85) 10.7 (42) 5.3 794
[8.3,13.7] [3.4,8.1]
Northern Borno (70) 12.2 (40) 7.0 572
[9.4,15.8] [4.9,9.9]
Southern Borno (58) 8.1 (34) 4.7 717
[6.0,10.9] [2.9,7.7]
East Borno (65) 8.4 (28) 3.6 776
[6.7,10.4] [2.4,5.5]
Central Borno (74) 11.7 (43) 6.8 631
[9.3,14.6] [4.8,9.7]
MMC & Jere (106) 11.4 (69) 7.4 927
[8.8,14.8] [5.3,10.3]
Central Yobe (116) 15.2 (74) 9.7 764
[11.6,19.7] [7.0,13.2]
Southern Yobe (101) 14 (63) 8.7 723
[10.3,18.7] [5.5,13.4]
Northern Yobe (109) 15.8 (75) 10.7 690
[12.4,19.9] [8.4,13.6]
3.6.1 Minimum Dietary Diversity for Women
In the context of an emergency, diets can be dominated by one or a few staple foods given constraints on food choices. Poor dietary diversity has been shown to be associated with poor micronutrient adequacy of diets14. In the survey, dietary diversity was measured to assess micronutrient adequacy among women of reproductive age (15 to 49 years). This group is nutritionally vulnerable because of the physiological demands of pregnancy and lactation. The Minimum Dietary Diversity in Women (MDD-W) indicator can be understood as a measure of whether women are receiving adequate amounts of the recommended vitamins and minerals. The MDD-W was developed as a proxy indicator to reflect the micronutrient adequacy of women’s diets, a contrast to the household dietary diversity (HDDS) indicator that measures household-level access to kilo-calories (dietary energy).
One randomly selected woman of reproductive age in each household containing at least one eligible woman was surveyed. Selection was done automatically on the tablets, and sample weights were adjusted accordingly. Women were asked about consumption of different food groups during the day prior to the survey. Foods were then re-categorized into 10 food groups: (1) grains, white roots and tubers, plantains, (2) pulses, (3) nuts and seeds, (4) dairy, (5) meat, poultry and fish, (6) eggs, (7) dark green leafy vegetables, (8) other vitamin A-rich fruits, (9) other vegetables, and (10) other fruits. The MDD-W indicator is a dichotomous indicator of whether a woman has consumed at least five out of the ten defined food groups15.
The proportion of women of reproductive age meeting minimum dietary diversity was highest in Adamawa (47.2%) followed by Borno (34.1%) and Yobe (29.1%). Of the ten food groups assessed, the mean number consumed during the day preceding the survey by women of reproductive age was less than five in all three states with 4.57% in Adamawa, 4.07% in Borno, and 3.98% in Yobe. The proportion of women of reproductive age consuming iron rich foods was lowest in Borno (36.4%) while the proportion consuming vitamin A rich foods was lowest in Adamawa (62.6%).
By domain, the proportions consuming iron rich food, and the proportion consuming vitamin A rich foods were all lowest in East Borno (21.0%), Northern Borno (25.0%) and Northern Adamawa (57.4%). (Table 28). For all domains, the proportion of women consuming Vitamin A rich foods during the day preceding the survey was higher than the proportion consuming iron rich foods.
The proportion of women meeting minimum dietary diversity, consuming iron rich foods, and consuming Vitamin A rich foods were all slightly higher among adolescent girls (15-19 years) than adult women (20-49 years). This was a contrast to the pattern of acute malnutrition as measured by MUAC.
14 Martin-Prevel, Y, Allemand, P, Wiesmann, D, et al. 20015. Moving Forward: On choosing a standard operational indicator for women’s dietary diversity. Available at: http://www.fao.org/3/a-i4942e.pdf
15 Food and Agricultural Organization (FAO) and FHI 360. 2016. Minimum Dietary Diversity for Women: A Guide for
Measurement. Rome: FAO. Available at: http://www.fao.org/3/a-i5486e.pdf
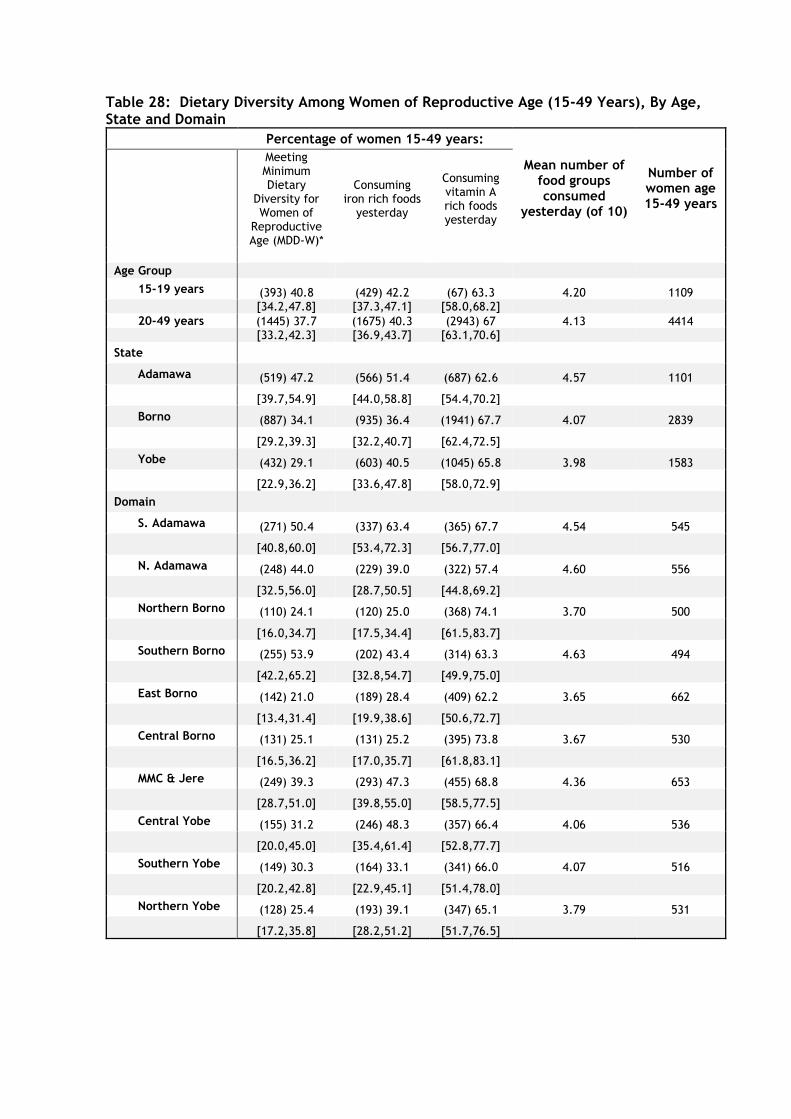
Table 28: Dietary Diversity Among Women of Reproductive Age (15-49 Years), By Age, State and Domain
Percentage of women 15-49 years:
Mean number of food groups consumed
yesterday (of 10)
Number of women age 15-49 years
Meeting Minimum Dietary
Diversity for Women of
Reproductive Age (MDD-W)*
Consuming iron rich foods
yesterday
Consuming vitamin A rich foods yesterday
Age Group
15-19 years (393) 40.8 (429) 42.2 (67) 63.3 4.20 1109 [34.2,47.8] [37.3,47.1] [58.0,68.2]
20-49 years (1445) 37.7 (1675) 40.3 (2943) 67 4.13 4414 [33.2,42.3] [36.9,43.7] [63.1,70.6]
State
Adamawa (519) 47.2 (566) 51.4 (687) 62.6 4.57 1101
[39.7,54.9] [44.0,58.8] [54.4,70.2]
Borno (887) 34.1 (935) 36.4 (1941) 67.7 4.07 2839
[29.2,39.3] [32.2,40.7] [62.4,72.5]
Yobe (432) 29.1 (603) 40.5 (1045) 65.8 3.98 1583
[22.9,36.2] [33.6,47.8] [58.0,72.9]
Domain
S. Adamawa (271) 50.4 (337) 63.4 (365) 67.7 4.54 545
[40.8,60.0] [53.4,72.3] [56.7,77.0]
N. Adamawa (248) 44.0 (229) 39.0 (322) 57.4 4.60 556
[32.5,56.0] [28.7,50.5] [44.8,69.2]
Northern Borno (110) 24.1 (120) 25.0 (368) 74.1 3.70 500
[16.0,34.7] [17.5,34.4] [61.5,83.7]
Southern Borno (255) 53.9 (202) 43.4 (314) 63.3 4.63 494
[42.2,65.2] [32.8,54.7] [49.9,75.0]
East Borno (142) 21.0 (189) 28.4 (409) 62.2 3.65 662
[13.4,31.4] [19.9,38.6] [50.6,72.7]
Central Borno (131) 25.1 (131) 25.2 (395) 73.8 3.67 530
[16.5,36.2] [17.0,35.7] [61.8,83.1]
MMC & Jere (249) 39.3 (293) 47.3 (455) 68.8 4.36 653
[28.7,51.0] [39.8,55.0] [58.5,77.5]
Central Yobe (155) 31.2 (246) 48.3 (357) 66.4 4.06 536
[20.0,45.0] [35.4,61.4] [52.8,77.7]
Southern Yobe (149) 30.3 (164) 33.1 (341) 66.0 4.07 516
[20.2,42.8] [22.9,45.1] [51.4,78.0]
Northern Yobe (128) 25.4 (193) 39.1 (347) 65.1 3.79 531
[17.2,35.8] [28.2,51.2] [51.7,76.5]
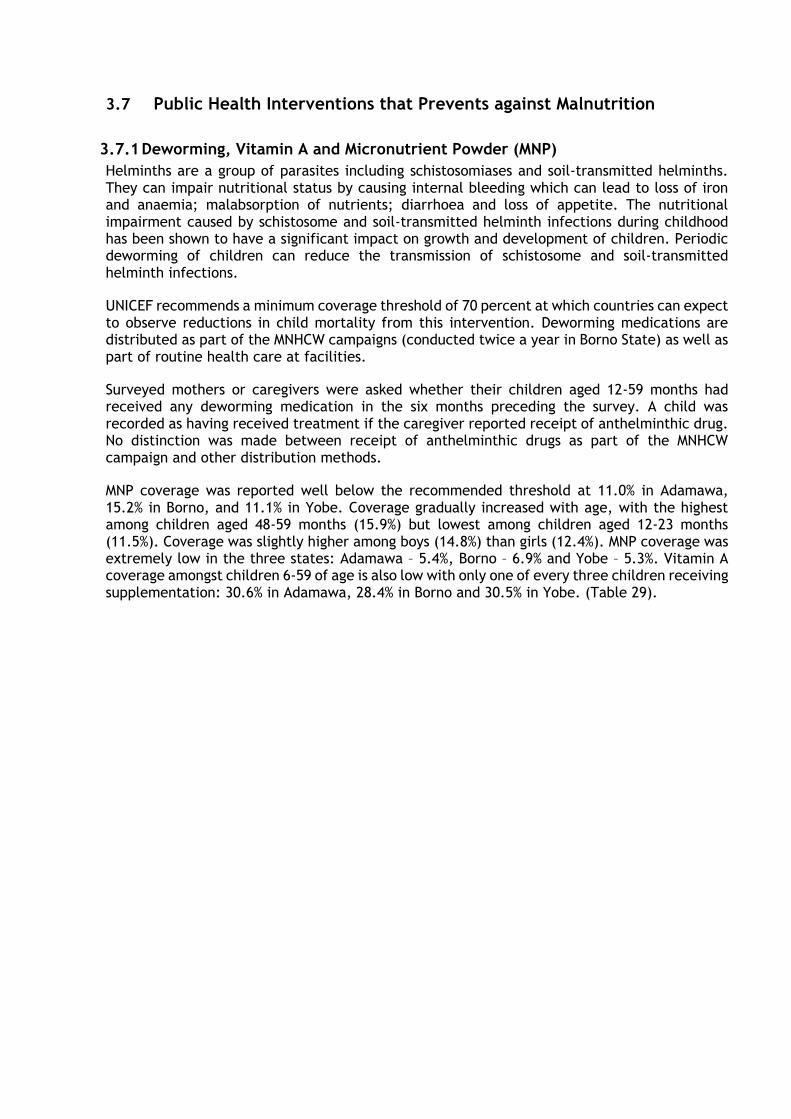
3.7 Public Health Interventions that Prevents against Malnutrition
3.7.1 Deworming, Vitamin A and Micronutrient Powder (MNP)
Helminths are a group of parasites including schistosomiases and soil-transmitted helminths. They can impair nutritional status by causing internal bleeding which can lead to loss of iron and anaemia; malabsorption of nutrients; diarrhoea and loss of appetite. The nutritional impairment caused by schistosome and soil-transmitted helminth infections during childhood has been shown to have a significant impact on growth and development of children. Periodic deworming of children can reduce the transmission of schistosome and soil-transmitted helminth infections.
UNICEF recommends a minimum coverage threshold of 70 percent at which countries can expect to observe reductions in child mortality from this intervention. Deworming medications are distributed as part of the MNHCW campaigns (conducted twice a year in Borno State) as well as part of routine health care at facilities.
Surveyed mothers or caregivers were asked whether their children aged 12-59 months had received any deworming medication in the six months preceding the survey. A child was recorded as having received treatment if the caregiver reported receipt of anthelminthic drug. No distinction was made between receipt of anthelminthic drugs as part of the MNHCW campaign and other distribution methods.
MNP coverage was reported well below the recommended threshold at 11.0% in Adamawa, 15.2% in Borno, and 11.1% in Yobe. Coverage gradually increased with age, with the highest among children aged 48-59 months (15.9%) but lowest among children aged 12-23 months (11.5%). Coverage was slightly higher among boys (14.8%) than girls (12.4%). MNP coverage was extremely low in the three states: Adamawa – 5.4%, Borno – 6.9% and Yobe – 5.3%. Vitamin A coverage amongst children 6-59 of age is also low with only one of every three children receiving supplementation: 30.6% in Adamawa, 28.4% in Borno and 30.5% in Yobe. (Table 29).
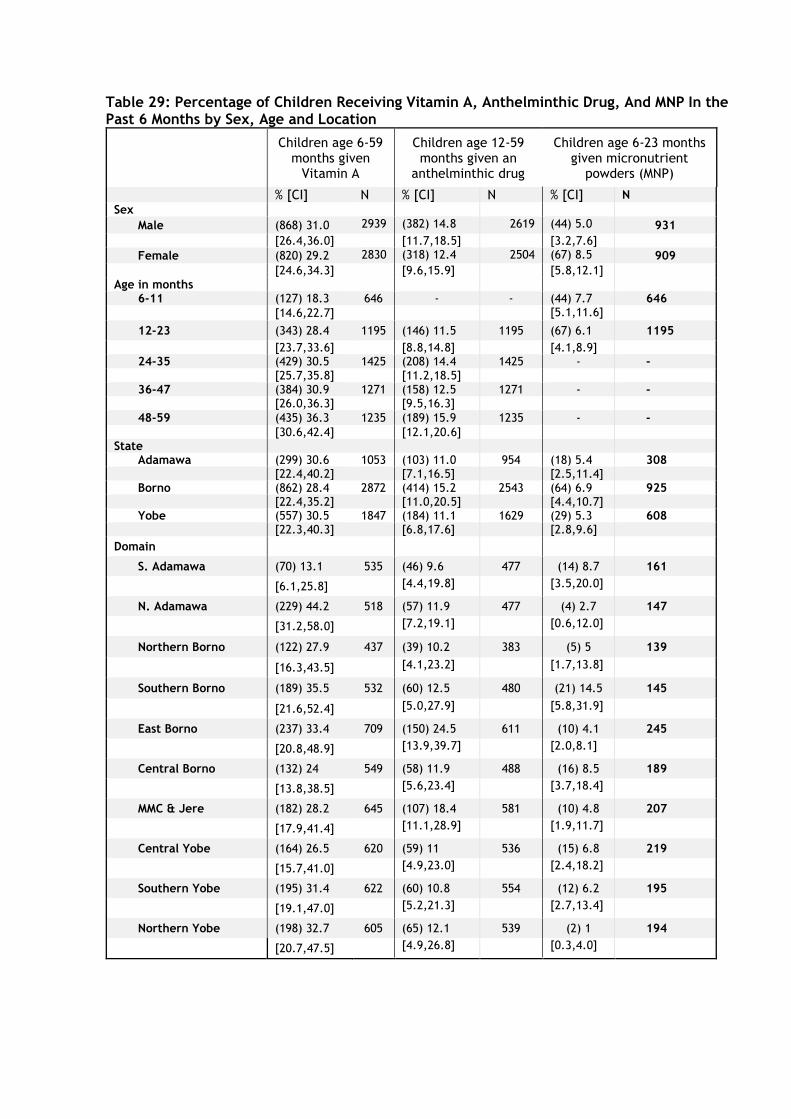
Table 29: Percentage of Children Receiving Vitamin A, Anthelminthic Drug, And MNP In the Past 6 Months by Sex, Age and Location
Children age 6-59 months given
Vitamin A
Children age 12-59 months given an
anthelminthic drug
Children age 6-23 months given micronutrient
powders (MNP)
% [CI] N % [CI] N % [CI] N
Sex
Male (868) 31.0 2939 (382) 14.8 2619 (44) 5.0 931
[26.4,36.0] [11.7,18.5] [3.2,7.6]
Female (820) 29.2 2830 (318) 12.4 2504 (67) 8.5 909
[24.6,34.3] [9.6,15.9] [5.8,12.1] Age in months
6-11 (127) 18.3 646 - - (44) 7.7 646
[14.6,22.7] [5.1,11.6]
12-23 (343) 28.4 1195 (146) 11.5 1195 (67) 6.1 1195
[23.7,33.6] [8.8,14.8] [4.1,8.9] 24-35 (429) 30.5 1425 (208) 14.4 1425 - -
[25.7,35.8] [11.2,18.5] 36-47 (384) 30.9 1271 (158) 12.5 1271 - -
[26.0,36.3] [9.5,16.3]
48-59 (435) 36.3 1235 (189) 15.9 1235 - -
[30.6,42.4] [12.1,20.6] State
Adamawa (299) 30.6 1053 (103) 11.0 954 (18) 5.4 308 [22.4,40.2] [7.1,16.5] [2.5,11.4]
Borno (862) 28.4 2872 (414) 15.2 2543 (64) 6.9 925 [22.4,35.2] [11.0,20.5] [4.4,10.7]
Yobe (557) 30.5 1847 (184) 11.1 1629 (29) 5.3 608 [22.3,40.3] [6.8,17.6] [2.8,9.6]
Domain
S. Adamawa (70) 13.1 535 (46) 9.6 477 (14) 8.7 161
[6.1,25.8] [4.4,19.8] [3.5,20.0]
N. Adamawa (229) 44.2 518 (57) 11.9 477 (4) 2.7 147
[31.2,58.0] [7.2,19.1] [0.6,12.0]
Northern Borno (122) 27.9 437 (39) 10.2 383 (5) 5 139
[16.3,43.5] [4.1,23.2] [1.7,13.8]
Southern Borno (189) 35.5 532 (60) 12.5 480 (21) 14.5 145
[21.6,52.4] [5.0,27.9] [5.8,31.9]
East Borno (237) 33.4 709 (150) 24.5 611 (10) 4.1 245
[20.8,48.9] [13.9,39.7] [2.0,8.1]
Central Borno (132) 24 549 (58) 11.9 488 (16) 8.5 189
[13.8,38.5] [5.6,23.4] [3.7,18.4]
MMC & Jere (182) 28.2 645 (107) 18.4 581 (10) 4.8 207
[17.9,41.4] [11.1,28.9] [1.9,11.7]
Central Yobe (164) 26.5 620 (59) 11 536 (15) 6.8 219
[15.7,41.0] [4.9,23.0] [2.4,18.2]
Southern Yobe (195) 31.4 622 (60) 10.8 554 (12) 6.2 195
[19.1,47.0] [5.2,21.3] [2.7,13.4]
Northern Yobe (198) 32.7 605 (65) 12.1 539 (2) 1 194
[20.7,47.5] [4.9,26.8] [0.3,4.0]
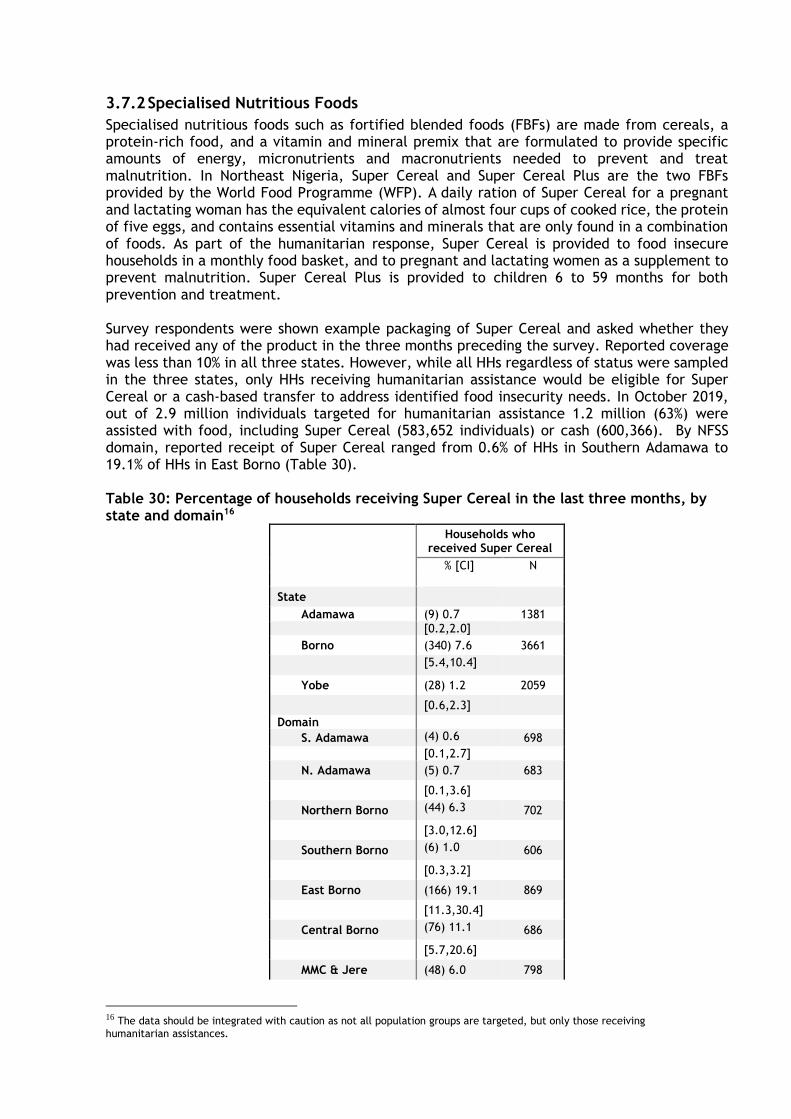
3.7.2 Specialised Nutritious Foods
Specialised nutritious foods such as fortified blended foods (FBFs) are made from cereals, a protein-rich food, and a vitamin and mineral premix that are formulated to provide specific amounts of energy, micronutrients and macronutrients needed to prevent and treat malnutrition. In Northeast Nigeria, Super Cereal and Super Cereal Plus are the two FBFs provided by the World Food Programme (WFP). A daily ration of Super Cereal for a pregnant and lactating woman has the equivalent calories of almost four cups of cooked rice, the protein of five eggs, and contains essential vitamins and minerals that are only found in a combination of foods. As part of the humanitarian response, Super Cereal is provided to food insecure households in a monthly food basket, and to pregnant and lactating women as a supplement to prevent malnutrition. Super Cereal Plus is provided to children 6 to 59 months for both prevention and treatment. Survey respondents were shown example packaging of Super Cereal and asked whether they had received any of the product in the three months preceding the survey. Reported coverage was less than 10% in all three states. However, while all HHs regardless of status were sampled in the three states, only HHs receiving humanitarian assistance would be eligible for Super Cereal or a cash-based transfer to address identified food insecurity needs. In October 2019, out of 2.9 million individuals targeted for humanitarian assistance 1.2 million (63%) were assisted with food, including Super Cereal (583,652 individuals) or cash (600,366). By NFSS domain, reported receipt of Super Cereal ranged from 0.6% of HHs in Southern Adamawa to 19.1% of HHs in East Borno (Table 30). Table 30: Percentage of households receiving Super Cereal in the last three months, by state and domain16
Households who received Super Cereal
% [CI] N
State
Adamawa (9) 0.7 1381
[0.2,2.0]
Borno (340) 7.6 3661
[5.4,10.4]
Yobe (28) 1.2 2059
[0.6,2.3]
Domain
S. Adamawa (4) 0.6 698
[0.1,2.7]
N. Adamawa (5) 0.7 683
[0.1,3.6]
Northern Borno (44) 6.3 702
[3.0,12.6]
Southern Borno (6) 1.0 606
[0.3,3.2]
East Borno (166) 19.1 869
[11.3,30.4]
Central Borno (76) 11.1 686
[5.7,20.6]
MMC & Jere (48) 6.0 798
16 The data should be integrated with caution as not all population groups are targeted, but only those receiving
humanitarian assistances.
[2.7,12.7]
Central Yobe (10) 1.5 685
[0.5,4.2]
Southern Yobe (6) 0.9 673
[0.3,2.9]
Northern Yobe (12) 1.7 701
[0.6,4.8]
3.8 Water, Sanitation and Hygiene (WASH) Safe treatment of drinking water and proper hygiene and sanitation are important cornerstones of public health, and lack of is a key contributor to undernutrition. In the context of an emergency with mass displacement, people may become resettled in locations without adequate water, access to means to treat water, sufficient latrines, and handwashing stations. Unsafe drinking water can be a carrier of many diseases such as cholera, schistosomiasis, and typhoid.
Households were asked whether they treat the water used for drinking. Among HHs that reported treating water, all methods used were recorded. Drinking water is considered appropriately treated if one of the following methods are used: boiling; adding bleach or chlorine; using a water filter; or using solar disinfection. Use of solar disinfection was assessed but is not presented here as no household in the survey reported this method. Sanitation was assessed through a series of observations. Survey teams observed whether there was a location in the house where household members could wash their hands. If yes, the presence of water and soap were each verified, and the type of soap was recorded.
In Adamawa, 2.0% of HHs reported treating their drinking water with 3.8% in Borno and 2.1% in Yobe. However, of those that reported treating their water, only one in 20 used a safe and appropriate water treatment method in Yobe (4.1%) while more than fifty percent used safe and appropriate water treatment in Adamawa (64.3%) and Borno (52.8%). The most common methods used - letting it stand, settle, and straining through a cloth - are not as effective. By domain, the proportion of HHs using an appropriate treatment method was highest in East Borno (85.7%). Worryingly, zero HHs in Southern Borno used any treatment method, and zero households in Northern Borno, and Northern and Southern Yobe zero HHs reported using safe and appropriate water treatment methods. The percentage of HHs treating their drinking water, and the methods used are presented in Table 31.
Of all HHs in the three states, approximately one in six HHs had a facility for handwashing with both water and soap. The proportion of HHs with a facility for handwashing was highest in Yobe (34.5%), although Yobe HHs had the lowest proportion with both soap and water (4.3%). In Borno the proportion of HHs with a facility for handwashing was low (31.4%), but a higher proportion had soap and water (15.6%). In Adamawa 32.5% of HHs had a facility for hand washing, but only 22.1% had soap and water present, which was the highest for all the 3 states. By domain, both the proportion of HHs with a facility for handwashing (22.2% to 42.5%) and the proportion with soap and water observed among them (1.7% to 58.7%) was highly variable. The percent of HHs where a place for handwashing was observed is shown Table 32. These results suggest that in all domains, the majority of HHs did not have the ability to properly wash their hands at home. Washing hands with water and soap is an important and cost-effective health intervention to reduce the incidence of conditions observed to be prevalent in the surveyed areas (e.g., diarrhoea and pneumonia).
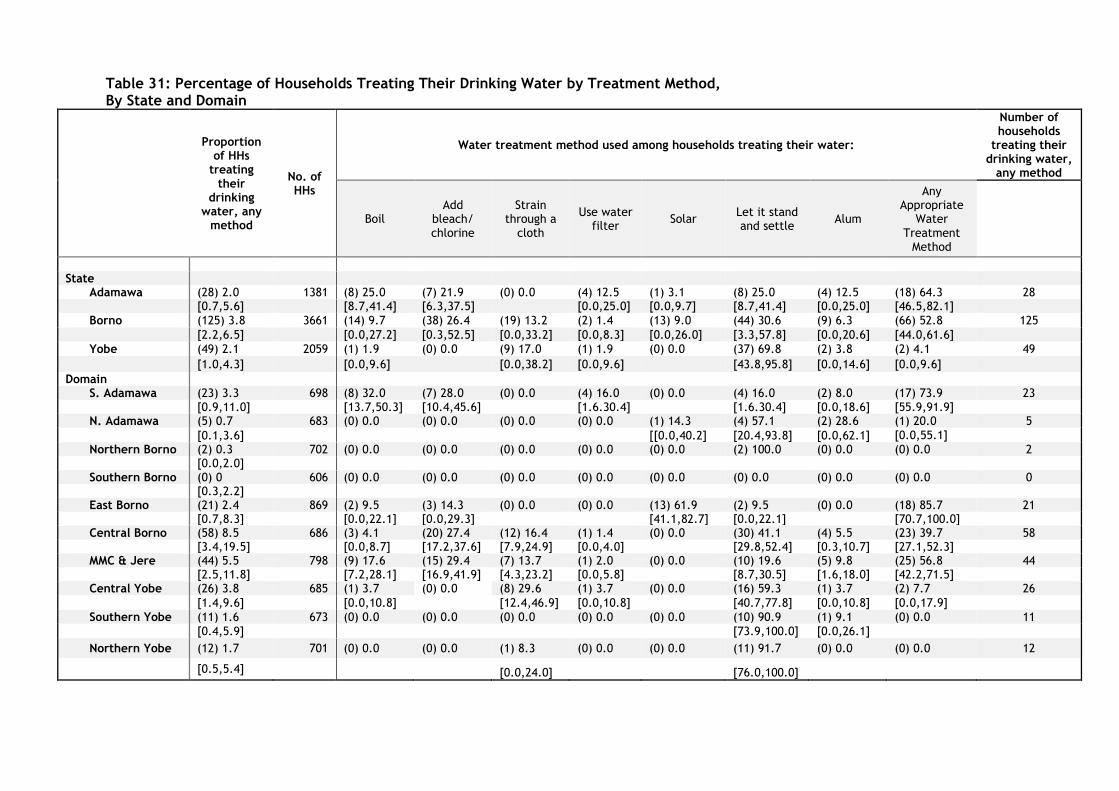
Table 31: Percentage of Households Treating Their Drinking Water by Treatment Method, By State and Domain
Proportion of HHs
treating their
drinking water, any
method
No. of HHs
Water treatment method used among households treating their water:
Number of households
treating their drinking water,
any method
Boil Add
bleach/ chlorine
Strain through a
cloth
Use water filter
Solar Let it stand and settle
Alum
Any Appropriate
Water Treatment
Method
State
Adamawa (28) 2.0 1381 (8) 25.0 (7) 21.9 (0) 0.0 (4) 12.5 (1) 3.1 (8) 25.0 (4) 12.5 (18) 64.3 28 [0.7,5.6] [8.7,41.4] [6.3,37.5] [0.0,25.0] [0.0,9.7] [8.7,41.4] [0.0,25.0] [46.5,82.1]
Borno (125) 3.8 3661 (14) 9.7 (38) 26.4 (19) 13.2 (2) 1.4 (13) 9.0 (44) 30.6 (9) 6.3 (66) 52.8 125
[2.2,6.5] [0.0,27.2] [0.3,52.5] [0.0,33.2] [0.0,8.3] [0.0,26.0] [3.3,57.8] [0.0,20.6] [44.0,61.6]
Yobe (49) 2.1 2059 (1) 1.9 (0) 0.0 (9) 17.0 (1) 1.9 (0) 0.0 (37) 69.8 (2) 3.8 (2) 4.1 49
[1.0,4.3] [0.0,9.6] [0.0,38.2] [0.0,9.6] [43.8,95.8] [0.0,14.6] [0.0,9.6]
Domain S. Adamawa (23) 3.3 698 (8) 32.0 (7) 28.0 (0) 0.0 (4) 16.0 (0) 0.0 (4) 16.0 (2) 8.0 (17) 73.9 23
[0.9,11.0] [13.7,50.3] [10.4,45.6] [1.6.30.4] [1.6.30.4] [0.0,18.6] [55.9,91.9] N. Adamawa (5) 0.7 683 (0) 0.0 (0) 0.0 (0) 0.0 (0) 0.0 (1) 14.3 (4) 57.1 (2) 28.6 (1) 20.0 5
[0.1,3.6] [[0.0,40.2] [20.4,93.8] [0.0,62.1] [0.0,55.1]
Northern Borno (2) 0.3 702 (0) 0.0 (0) 0.0 (0) 0.0 (0) 0.0 (0) 0.0 (2) 100.0 (0) 0.0 (0) 0.0 2 [0.0,2.0]
Southern Borno (0) 0 606 (0) 0.0 (0) 0.0 (0) 0.0 (0) 0.0 (0) 0.0 (0) 0.0 (0) 0.0 (0) 0.0 0 [0.3,2.2]
East Borno (21) 2.4 869 (2) 9.5 (3) 14.3 (0) 0.0 (0) 0.0 (13) 61.9 (2) 9.5 (0) 0.0 (18) 85.7 21 [0.7,8.3] [0.0,22.1] [0.0,29.3] [41.1,82.7] [0.0,22.1] [70.7,100.0]
Central Borno (58) 8.5 686 (3) 4.1 (20) 27.4 (12) 16.4 (1) 1.4 (0) 0.0 (30) 41.1 (4) 5.5 (23) 39.7 58 [3.4,19.5] [0.0,8.7] [17.2,37.6] [7.9,24.9] [0.0,4.0] [29.8,52.4] [0.3,10.7] [27.1,52.3]
MMC & Jere (44) 5.5 798 (9) 17.6 (15) 29.4 (7) 13.7 (1) 2.0 (0) 0.0 (10) 19.6 (5) 9.8 (25) 56.8 44 [2.5,11.8] [7.2,28.1] [16.9,41.9] [4.3,23.2] [0.0,5.8] [8.7,30.5] [1.6,18.0] [42.2,71.5]
Central Yobe (26) 3.8 685 (1) 3.7 (0) 0.0 (8) 29.6 (1) 3.7 (0) 0.0 (16) 59.3 (1) 3.7 (2) 7.7 26
[1.4,9.6] [0.0,10.8] [12.4,46.9] [0.0,10.8] [40.7,77.8] [0.0,10.8] [0.0,17.9]
Southern Yobe (11) 1.6 673 (0) 0.0 (0) 0.0 (0) 0.0 (0) 0.0 (0) 0.0 (10) 90.9 (1) 9.1 (0) 0.0 11
[0.4,5.9] [73.9,100.0] [0.0,26.1]
Northern Yobe (12) 1.7 701 (0) 0.0 (0) 0.0 (1) 8.3 (0) 0.0 (0) 0.0 (11) 91.7 (0) 0.0 (0) 0.0 12
[0.5,5.4] [0.0,24.0] [76.0,100.0]
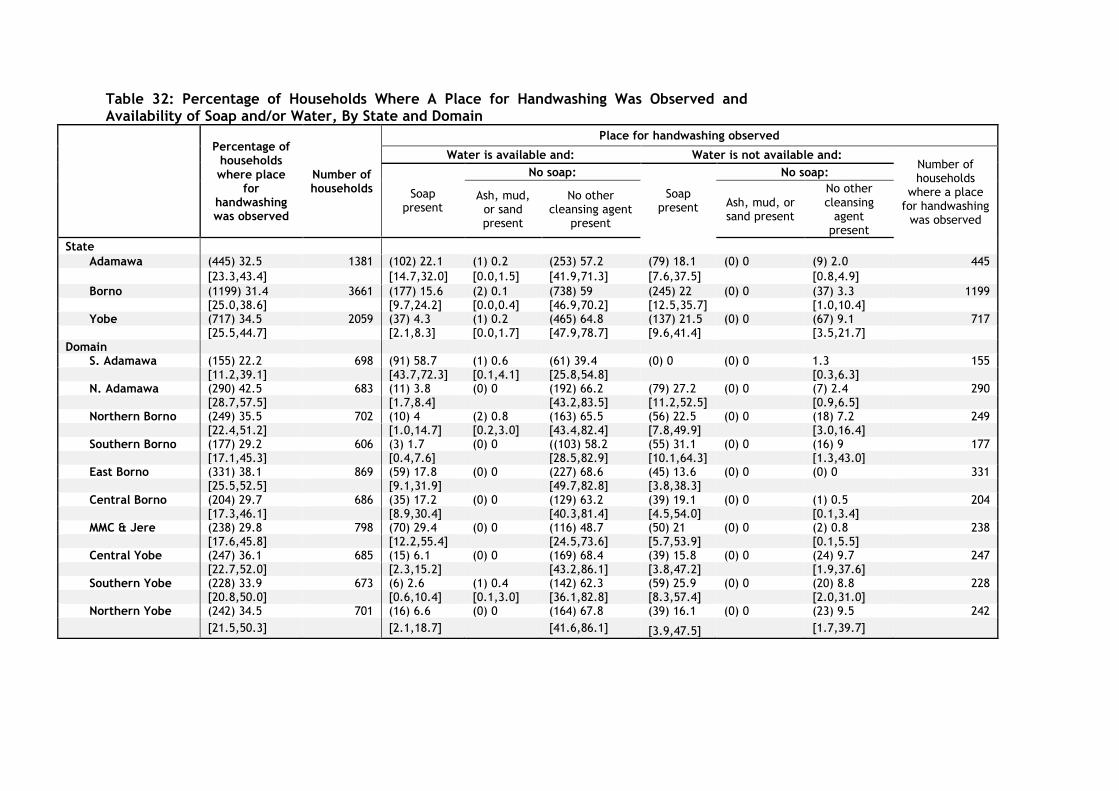
Table 32: Percentage of Households Where A Place for Handwashing Was Observed and Availability of Soap and/or Water, By State and Domain
Percentage of households where place
for handwashing was observed
Number of households
Place for handwashing observed
Water is available and: Water is not available and: Number of households
where a place for handwashing
was observed
Soap present
No soap:
Soap present
No soap:
Ash, mud, or sand present
No other cleansing agent
present
Ash, mud, or sand present
No other cleansing
agent present
State
Adamawa (445) 32.5 1381 (102) 22.1 (1) 0.2 (253) 57.2 (79) 18.1 (0) 0 (9) 2.0 445
[23.3,43.4] [14.7,32.0] [0.0,1.5] [41.9,71.3] [7.6,37.5] [0.8,4.9]
Borno (1199) 31.4 3661 (177) 15.6 (2) 0.1 (738) 59 (245) 22 (0) 0 (37) 3.3 1199 [25.0,38.6] [9.7,24.2] [0.0,0.4] [46.9,70.2] [12.5,35.7] [1.0,10.4]
Yobe (717) 34.5 2059 (37) 4.3 (1) 0.2 (465) 64.8 (137) 21.5 (0) 0 (67) 9.1 717 [25.5,44.7] [2.1,8.3] [0.0,1.7] [47.9,78.7] [9.6,41.4] [3.5,21.7] Domain
S. Adamawa (155) 22.2 698 (91) 58.7 (1) 0.6 (61) 39.4 (0) 0 (0) 0 1.3 155 [11.2,39.1] [43.7,72.3] [0.1,4.1] [25.8,54.8] [0.3,6.3]
N. Adamawa (290) 42.5 683 (11) 3.8 (0) 0 (192) 66.2 (79) 27.2 (0) 0 (7) 2.4 290 [28.7,57.5] [1.7,8.4] [43.2,83.5] [11.2,52.5] [0.9,6.5]
Northern Borno (249) 35.5 702 (10) 4 (2) 0.8 (163) 65.5 (56) 22.5 (0) 0 (18) 7.2 249 [22.4,51.2] [1.0,14.7] [0.2,3.0] [43.4,82.4] [7.8,49.9] [3.0,16.4]
Southern Borno (177) 29.2 606 (3) 1.7 (0) 0 ((103) 58.2 (55) 31.1 (0) 0 (16) 9 177 [17.1,45.3] [0.4,7.6] [28.5,82.9] [10.1,64.3] [1.3,43.0]
East Borno (331) 38.1 869 (59) 17.8 (0) 0 (227) 68.6 (45) 13.6 (0) 0 (0) 0 331 [25.5,52.5] [9.1,31.9] [49.7,82.8] [3.8,38.3]
Central Borno (204) 29.7 686 (35) 17.2 (0) 0 (129) 63.2 (39) 19.1 (0) 0 (1) 0.5 204 [17.3,46.1] [8.9,30.4] [40.3,81.4] [4.5,54.0] [0.1,3.4]
MMC & Jere (238) 29.8 798 (70) 29.4 (0) 0 (116) 48.7 (50) 21 (0) 0 (2) 0.8 238 [17.6,45.8] [12.2,55.4] [24.5,73.6] [5.7,53.9] [0.1,5.5]
Central Yobe (247) 36.1 685 (15) 6.1 (0) 0 (169) 68.4 (39) 15.8 (0) 0 (24) 9.7 247 [22.7,52.0] [2.3,15.2] [43.2,86.1] [3.8,47.2] [1.9,37.6]
Southern Yobe (228) 33.9 673 (6) 2.6 (1) 0.4 (142) 62.3 (59) 25.9 (0) 0 (20) 8.8 228 [20.8,50.0] [0.6,10.4] [0.1,3.0] [36.1,82.8] [8.3,57.4] [2.0,31.0]
Northern Yobe (242) 34.5 701 (16) 6.6 (0) 0 (164) 67.8 (39) 16.1 (0) 0 (23) 9.5 242
[21.5,50.3] [2.1,18.7] [41.6,86.1] [3.9,47.5] [1.7,39.7]
4. Discussion:
4.1 Nutrition Situation: The nutritional status of children under five and pregnant and lactating women are important indicators for the overall health and nutritional wellbeing of a population. The prevalence of global acute malnutrition was 11.5% in Yobe State, with Central Yobe showing the highest GAM rate (13.8%). In all three domains of Yobe State, the GAM17 rates exceeded 10%, which is considered to be of high public health concern18. The main causes of the high GAM levels in Yobe are mostly attributed to developmental issues including poor health services, high illiteracy rates, food insecurity and overall high levels of poverty and less on the impact of the conflict. The GAM rates in Borno and Adamawa states were 8.1% and 7.2%, respectively, which are considered a medium severity. The GAM rates in Yobe State have remained persistently high since the establishment of the surveillance system in 2016. In Borno State, the GAM rates have fluctuated probably due to seasonality, and the scale-up of the nutrition responses (Figure 2). The GAM rates in Adamawa have remained relatively stable, but with a slight increase in October 2019 from 6.1% to 7.2%. When analyzing the prevalence of acute malnutrition by both MUAC and WHZ score, a poor
correlation between both results was found. The prevalence of acute malnutrition by MUAC is
significantly lower compared to WHZ score. For example, in Yobe State, the GAM as measured
by WHZ was 11.5% but 2.6% by MUAC. Surveys conducted in some countries in Africa19 have
shown that the two measures are not detecting the same children, and they can correlate
poorly. Grellety and Golden concluded in their 2016 study20 that “the perceived need for
humanitarian intervention can be affected by the measure chosen to assess the prevalence of
malnutrition which will vary from region to region. MUAC measurement is recommended to be
included in all anthropometric surveys and the two criteria are not to be seen as alternative
measures of the loss of body tissue leading to an increased risk of death, but complementary
variables that should both be used independently to guide admission for treatment of
malnourished children”.
It is important to note that “in a protracted crisis” like in most areas of Borno State, the drivers of persistent GAM are often unclear, in part because the three underlying causes — food, care, and health — all potentially play a role, so there may be no single reason accounting for persistent GAM. Addressing persistent GAM presents particular challenges for operational agencies, in part because of structural issues within the humanitarian system which focusses on treatment of severe acute malnutrition, “siloed” sectors, short-term funding cycles that do not include nutrition causal analysis (NCA) or prioritize prevalence data”.
17 There is currently no formal SAM threshold issued by any UN agency.. 18 World Health Organization (WHO). Physical status: the use and interpretation of anthropometry. Report of a WHO Expert
Committee. 1995. Available at: http://www.who.int/childgrowth/publications/physical_status/en/
19https://www.researchgate.net/publication/281204067_Inconsistent_diagnosis_of_acute_malnutrition_by_weight-for-height_and_mid-upper_arm_circumference_Contributors_in_16_cross-sectional_surveys_from_South_Sudan_the_Philippines_Chad_and_Bangladesh 20 https://bmcnutr.biomedcentral.com/track/pdf/10.1186/s40795-016-0049-7
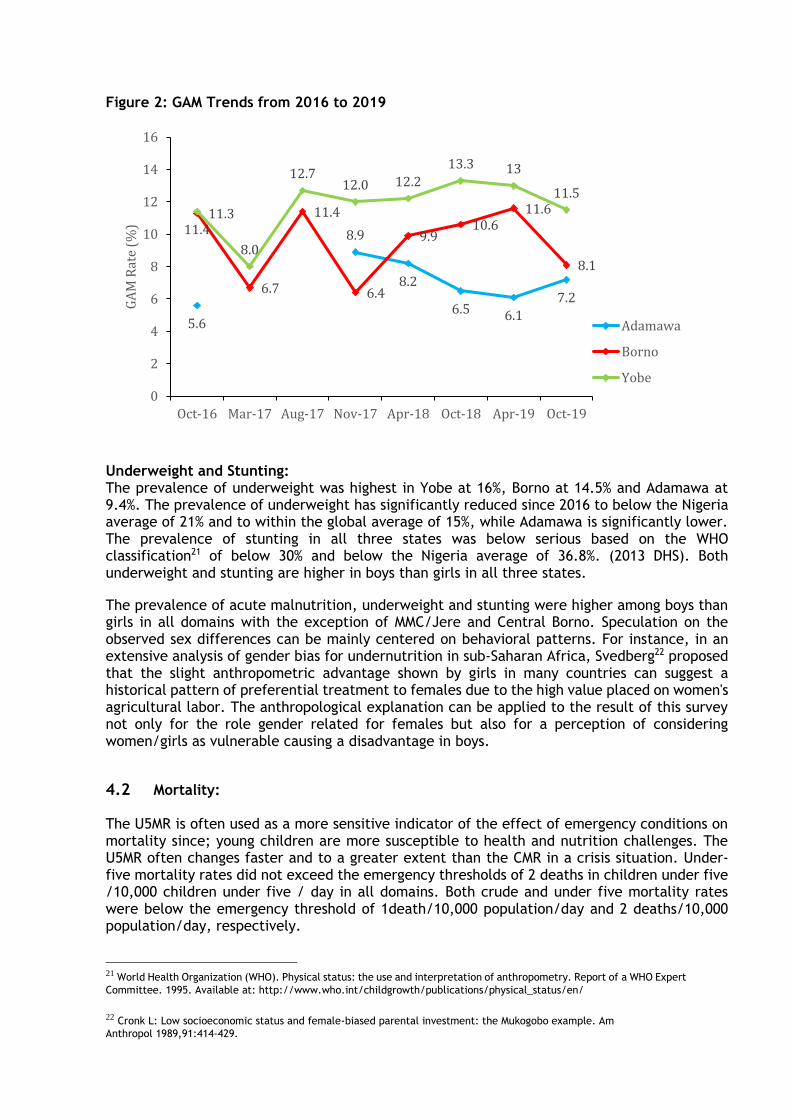
Figure 2: GAM Trends from 2016 to 2019
Underweight and Stunting: The prevalence of underweight was highest in Yobe at 16%, Borno at 14.5% and Adamawa at 9.4%. The prevalence of underweight has significantly reduced since 2016 to below the Nigeria average of 21% and to within the global average of 15%, while Adamawa is significantly lower. The prevalence of stunting in all three states was below serious based on the WHO classification21 of below 30% and below the Nigeria average of 36.8%. (2013 DHS). Both underweight and stunting are higher in boys than girls in all three states.
The prevalence of acute malnutrition, underweight and stunting were higher among boys than girls in all domains with the exception of MMC/Jere and Central Borno. Speculation on the observed sex differences can be mainly centered on behavioral patterns. For instance, in an extensive analysis of gender bias for undernutrition in sub-Saharan Africa, Svedberg22 proposed that the slight anthropometric advantage shown by girls in many countries can suggest a historical pattern of preferential treatment to females due to the high value placed on women's agricultural labor. The anthropological explanation can be applied to the result of this survey not only for the role gender related for females but also for a perception of considering women/girls as vulnerable causing a disadvantage in boys.
4.2 Mortality:
The U5MR is often used as a more sensitive indicator of the effect of emergency conditions on mortality since; young children are more susceptible to health and nutrition challenges. The U5MR often changes faster and to a greater extent than the CMR in a crisis situation. Under-five mortality rates did not exceed the emergency thresholds of 2 deaths in children under five /10,000 children under five / day in all domains. Both crude and under five mortality rates were below the emergency threshold of 1death/10,000 population/day and 2 deaths/10,000 population/day, respectively.
21 World Health Organization (WHO). Physical status: the use and interpretation of anthropometry. Report of a WHO Expert
Committee. 1995. Available at: http://www.who.int/childgrowth/publications/physical_status/en/
22 Cronk L: Low socioeconomic status and female-biased parental investment: the Mukogobo example. Am
Anthropol 1989,91:414-429.
5.6
8.9
8.2
6.5 6.1
7.2
11.3
6.7
11.4
6.4
9.910.6
11.6
8.1
11.4
8.0
12.712.0 12.2
13.3 13
11.5
0
2
4
6
8
10
12
14
16
Oct-16 Mar-17 Aug-17 Nov-17 Apr-18 Oct-18 Apr-19 Oct-19
GA
M R
ate
(%)
Adamawa
Borno
Yobe
4.3 Vaccination Coverage:
Immunization is one of the most essential public health interventions and cost-effective
strategy to reduce childhood morbidity and mortality. The initiation of immunity through
application of vaccine is considered to be vital for improving chances of child survival. Failure
to vaccinate children against measles puts them at risk of severe health complications such as
acute malnutrition, pneumonia, diarrhoea, encephalitis, and blindness.
The overall measles coverage among children 12-59 months as determined by observation of vaccination card and maternal recall was Adamawa (87.3%), Borno (86%) and Yobe (75.9%). The current measles coverage is below the recommended 90-95% to achieve herd immunity. This means that to achieve 95% immunity in the population for measles, vaccination coverage needs to be higher than 95%. The suboptimal coverage rates maybe cause of the frequency measles outbreak in certain parts of Borno States. Measles vaccination campaigns have been organized in the 3 emergency states. However, data suggest that coverage of measles vaccination is below 95% coverage rate required to give herd immunity in all the 9 domains. A vaccination campaign should therefore be ramped up given insufficient coverage in the context of an ongoing outbreak. Additionally, despite ongoing distributions of deworming medication as part of routine activities and through campaigns, coverage remains low in all domains (below 15% in all domains and as low as 1% in Northern Yobe). As presented in Table 29, the coverage of Vitamin A is low with only one-third of children having received supplementation in the past 6 months. Vitamin A deficiency is a recognized risk factor for severe measles. To ensure a comprehensive prevention and fight against measles, both measles vaccination and Vitamin A supplementation should be integrated.
4.4 Infant and Young Child Feeding:
Breast milk provides all the nutrients, vitamins, and minerals an infant need for growth during their first six month of life. Breastfeeding also protects children from infection. As a result, early and exclusive breastfeeding are among the most economical and safe public health interventions. However, many mothers stop breastfeeding early. This is particularly true in the context of an emergency where factors such as stress, displacement and distributions of infant formula may contribute to early interruption. Emergency interventions in Northeast Nigeria have therefore included counselling on Infant and Young Child Feeding (IYCF) aimed at encouraging proper breastfeeding and complementary feeding practices. Despite the importance of breast milk, both the percent of exclusively breastfeeding low with Borno (45.6%), Adamawa (52.2%) and Yobe (35.1%). Nonetheless, the exclusive breastfeeding rates have significantly improved in the 3 states since 2016, from a low of 20%. The overall predominant breastfeeding (PBF) was 95% across the 3 states. Predominant breastfeeding means that the infant's predominant source of nourishment has been breast milk. The issue of the studying predominant breastfeeding needs further clarification. Although awareness and knowledge of exclusive breastfeeding might be relatively high among mothers, this might not translate into practice of exclusive breastfeeding. It is important to note that predominant breastfeeding, just like exclusive breastfeeding, is associated with substantially lower risk of child mortality than partial or no breastfeeding at all. Therefore, much greater attention should be given to this finding. The current high rates of predominantly breastfeeding
is very encouraging, a clear indication that the IYCF programming outcome and possibly a reason of the relatively low levels of acute malnutrition despite other aggravating factors such as very low rates of minimum dietary, frequency and acceptable diet and general food insecurity.
4.5 Child Minimum Dietary Diversity and Minimum Acceptable Diet. The minimum dietary diversity and minimum acceptable diets are extremely low across the 3 states. The minimum acceptable diet across the 3 states is extremely low, with Adamawa (3.8%), Borno (0.5%) and Yobe (3.0%). Low dietary diversity and meal frequency practices are determinant for health and growth in children 6 to 23 months. They increase the risk of undernutrition, illness, and mortality in infants and young children. Even with optimum breastfeeding, stunting will occur if children do not receive sufficient dietary diversity and frequency over 6 months of age. Supplementing breastfeeding with nutritious complementary foods can reduce stunting among children of this age by 20%. 23 Both individual and community level factors are significantly associated with a minimum acceptable diet of 6–23 months age children in Nigeria, suggesting that nutritional interventions designed to improve child health should not only be implemented at the individual level but tailored to community context as well. The individual factors include high levels of illiteracy, low incomes, gender disparities (intrahousehold food allocation) and low awareness on appropriate IYCF practices. Community factors includes the impact of the ongoing insecurity (displacements), lack of access for farming land and markets, poor health and nutrition services, and general poor infrastructure.
4.6 Maternal Nutrition:
The nutritional status of women of reproductive age (15-49 years) is concerning with approximately 1 out of 10 women acutely malnourished in Borno and Adamawa states and 2 out of 10 women in Yobe State. Moreover, the prevalence of acute malnutrition was found to be five times higher for adolescent girls (15 to 19 years) at 29.5% than for adult women (20 to 49 years) at 5.9%. (Table 28). Early child bearing carries significant risks for young girls, particularly in rural areas where women do not complete their growth before the age of 20 years. This finding is particularly significant since nutritional status before and during pregnancy is essential for healthy maternal and neonatal outcomes. More effort is needed to improve adolescent nutrition, and to support positive birth outcome and prevent the vicious cycle of inter-generational growth failure. Further investigation is warranted to understand the causes of low MUAC among adolescent girls, particularly in Yobe State.
The proportion of women of reproductive age who met minimum dietary diversity was below half in all three states, a clear indication that macro and micronutrient intakes are inadequate, and that diets lack diversity. The poor diet diversity could be attributed to low agricultural activity in the surveyed areas24 and low agrobiodiversity, low education levels, and/or large household/family size among other factors. Nutrition interventions focusing on malnutrition prevention and improving dietary quality should be linked to nutrition sensitive interventions, especially agricultural, that promote locally-available micronutrient dense foods such vegetables, fruits, dairy and animal proteins.
4.7 Deworming, Vitamin A and Micronutrient Powder Supplementation.
23 Food and Agricultural Organization (FAO) and FHI 360. 2016. Minimum Dietary Diversity for Women: A Guide for
Measurement. Rome: FAO. Available at: http://www.fao.org/3/a-i5486e.pdf
24 Famine Early Warning Systems Network (FEWSNET). Nigeria Livelihood Zones. 2014. Available at:
http://www.fews.net/west-africa/nigeria/livelihood-zone-map/may-2014
The nutritional impairment caused by schistosome and soil-transmitted helminth infections during childhood has been shown to have a significant impact on growth and development of children25. Across the 3 states, approximately only 13% of children had received deworming drugs in the past 6 months. Periodic deworming of children can reduce the transmission of schistosome and soil-transmitted helminth infections. However, drug therapy alone is only a short-term measure of reducing worm infection and re-infection is frequent. Thus, control measures with improvement of water and sanitation, and health education are needed to prevent infection and re-infection. In Africa, Vitamin A deficiency (VAD) alone is responsible for almost 6% of child deaths under the age of 5 years. According to the survey results, only about 30% of the children aged between 6 to 59 months received Vitamin A supplement in the 6 months prior to the survey26. This implies that two-thirds of the children in the 3 states that did not receive the supplement, may be growing up with VAD. The low Vitamin A coverage is despite bi-annual mass supplementation during the MNCH week. To improve the Vitamin A coverage, to above 90%27 or higher (recommendation for areas with low minimum acceptable diet), supplementation must be integrated into the EPI, better coverage of MNCH week and promotion of appropriate infant and young child feeding practices that promote the consumption of vitamin A rich foods. Micronutrient deficiency is a major contributor to childhood morbidity and mortality. Children can receive micronutrients from foods, food fortification, and home (direct) supplementation. Micronutrient powders are one strategy of addressing micronutrient deficiencies especially in areas with high food insecurity, and minimum acceptable diets. The overall uptake of MNPs is very low at Adamawa (5.4%), Borno (6.9%) and Yobe (5.3%) due geographically incomplete distribution programmes. Analysis of the MNP coverage in Borno State has shown am improved in the uptake and utilization of MNPs increases when combined with IYCF programmes28.
4.8 Diarrhoea, Oral Rehydration Therapy and Zinc Supplementation Coverage:
Diarrhoea is the second leading cause of death after pneumonia in children worldwide29. The risk factors of diarrhea include: consumption of contaminated water and unhygienic practices in food preparation and disposal of stools can increase in the context of a humanitarian emergency, prevalence of diarrhoea is often observed to increase.
On average, 10% of children surveyed had diarrhea episode in the last two weeks preceding the survey. Humanitarian updates suggest that during the period of the survey diarrhoea, along with suspected malaria and suspected pneumonia, remained a major cause of consultations at primary health centers in the northeast30. Given concerns about increased risk of diarrhoeal disease, and in particular potential for outbreaks of diarrhoeal diseases such as cholera or Shigella dysentery, humanitarian partners have prepositioned Interagency Diarrhoeal Disease
25 https://www.ncbi.nlm.nih.gov/pubmed/16634028?dopt=Abstract 26 https://www.ncbi.nlm.nih.gov/pubmed/16634028?dopt=Abstract 27 https://www.ncbi.nlm.nih.gov/pubmed/16634028?dopt=Abstract 28 Nutrition Sector, NE Nigeria. 5W (2017-2019). 29 World Health Organization (WHO). 2013. WHO Fact sheet N°330: Diarrhoeal disease. Available at:
http://www.who.int/mediacentre/factsheets/fs330/en/
30 United Nations Children’s Fund (UNICEF). 2016. Nigeria Humanitarian Situation Report #16. Available at:
http://reliefweb.int/report/nigeria/nigeria-weekly-humanitarian-situation-report-no-16-15-21-december-2016.
Kits (IDDKs) at the Ministry of Health in Borno. Along with other supplies, kits contain ORS and Zinc31.
WHO and UNICEF recommend Zinc with ORS in the treatment for diarrhoea. Diarrhoea is treated with low-osmolarity oral rehydration salt (ORS) to replenish water and electrolytes lost in loose stools. Zinc deficiency is associated with immune system dysfunctions, growth retardation, and a high risk of morbidities, including diarrhoea. Studies show that supplemental Zinc, when combined oral rehydration solutions (ORS), provides therapeutic benefits, reducing the duration and the severity of the diarrhoea episodes.
Survey results indicate that in the emergency states, appropriate medications, and preventive services for common childhood illnesses remain below national benchmarks. The prevalence of diarrhoea was above 8% all domains except Northern Borno and Northern Adamawa which were slightly above 6.0%. However, access to proper treatment remains very low thereby leaving room for improvement in the management of diarrhoea cases (recommended treatment with Lo-ORS zinc combination as low as 2% in Southern Adamawa with the highest being 25.5% in MMC/Jere). Where the conflict has resulted in considerable destruction to health infrastructure, use of community health volunteers can be prioritized to improve coverage.
4.9 Acute Respiratory Infection (ARI) and treatment. Acute respiratory infections (ARI) are a heterogeneous and complex group of diseases that constitute the major causes of mortality and morbidity among under-five children in Nigeria, and globally. Most of these deaths are caused by pneumonia and bronchiolitis. According to a study conducted in Nigeria, the overall incidence of ARI is 6-8 episodes during the first 5 years of life.32 As with diarrhoea, prevalence of ARI varies seasonally. Previous research from Nigeria suggests that the peak of infection corresponded to the rainy season (July-November). WHO guidelines recommend that all children with fast breathing are classified as having “pneumonia” and treated with oral amoxicillin.33 In the survey, the prevalence of ARI has been estimated by asking mothers (or caretakers) whether the child had had a cough accompanied by short, rapid breathing in the two weeks prior to the survey. The estimate is based on mothers' perception and not on a diagnosis by a health professional, therefore this finding needs to be interpreted with caution.
4.10 Fever, Prevention of Malaria, and Antimalarial Treatment. These survey results show that the clinical management of malaria with first line treatment remains below the national target (80%) as specified in the National Malaria Strategic Plan.34 Fever is a major manifestation of many acute infections in children, including malaria. Malaria is endemic in Nigeria, with year-round transmission. Plasmodium falciparum is the predominant
31 Butta ZA, Bird SM, Black RE, et al. Therapeutic effects of oral zinc in acute and persistent diarrhea in children in
developing countries: pooled analysis of randomized controlled trials. Am J Clin Nutr. 2000 Dec;72(6):1516-22.
32 Fagbule D, Parakoyi DB, Spiegel R. Acute respiratory infections in Nigerian children: prospective cohort study of
incidence and case management. J Trop Pediatr. 1994 Oct;40(5):279-84.
33 17 World Health Organization (WHO). 2014. Revised WHO classification and treatment of childhood pneumonia at
health facilities: Evidence summaries. Available at:
http://apps.who.int/iris/bitstream/10665/137319/1/9789241507813_eng.pdf
34 Federal Ministry of Health. 2011. National Policy on Malaria Diagnosis and Treatment.
parasite species. Children in Nigeria have an estimated average of 2-4 episodes annually. Malaria is most prevalent after the end of the rainy season (July – November). Previous national surveys found prevalence of fever to be lowest in the North East region. In 2010, the World Health Organization started recommending universal use of diagnostic testing to confirm malaria infection and apply appropriate treatment based on the results. According to the new guidelines, treatment solely on the basis of clinical suspicion should only be considered when a parasitological diagnosis is not accessible. Children with severe malaria symptoms, such as fever or convulsions, should be taken to a health facility and subjected to diagnostic testing. The proportion of children under five with reported symptoms of fever is provided in Table 24, along with measures of clinical management including proportions tested for malaria and receiving anti-malarial drugs. Prevalence was highest in Yobe (12.0%) followed by Adamawa (11.6%) and Borno (11.4%). By domain, prevalence ranged from 7.0% (East Borno) to 14.0% (Central Borno). No significant differences were observed by sex. Despite WHO recommendations, less than 13 percent of children with fever in the last two weeks were tested for malaria with only 7.4% in Adamawa, 12.1% in Borno, and 9.2% in Yobe. In all domains with the exception of MMC & Jere, Southern Borno and Central Yobe, less than 10% of children with symptoms of fever in the preceding two weeks received malaria diagnostic tests. None of the 3 domains have up to 20% of children with symptoms of fever in the preceding two weeks received malaria diagnostic tests.
less than half of the households have the recommended number of bed nets, one net per two persons with only 24.7% in Borno, 47.0% in Yobe, and 39.1% in Adamawa. Among children residing in households with bed nets, about three in four slept under a bed net during the night preceding the survey with 73.8% in Yobe, and 63.5% in Adamawa. Utilization did not vary notably by age cohort or by gender. However, there remains a need for both improved coverage of bed nets as well as education on utilization given evidence of households where bed nets are not currently in use by children.
4.11 Specialised Nutritious Foods:
Emergency affected populations often face limited access to diversified diets, or livelihood opportunities, and are frequently reliant upon food assistance. A household general food distribution (GFD) is not able to support the unique nutritional requirements of young children, pregnant and lactating women, and other vulnerable groups. Selective feeding programmes may be implemented to help bridge the nutrient gap.
4.12 Water, Sanitation and Hygiene:
The survey results are limited to the water treatment and handwashing practices. The proportion of households treating water was Adamawa (2.0%), Borno (3.8%) and Yobe (2.1%). Data was not collected on the main source of water, and therefore the results should be interpreted with caution. It is assumed that the low rate of water treatment is that the main source of water is protected, treated and safe e.g. boreholes. It is worthy to note that water that is safe at the point of delivery can nevertheless present a significant health risk due to re-contamination during collection, storage, and drawing. Steps must be taken to minimize such risk include improved collection and storage practices, distributions of clean and appropriate collection and storage containers and treatment with a residual disinfectant, or treatment at the point of use. However, on those that reported treating their water, only 1 in 20 employed safe and appropriated water treatment methods, putting at risk 95% of the population to drinking contaminated water.
The importance of hand washing after defecation and before eating and preparing food, to prevent the spread of disease, cannot be over-estimated. The proportion of households that had both soap and water observed at a handwashing facility below 30% in all the 3 States. Agencies implementing WASH facilities should go beyond providing adequate water supply and also focus on basic hygiene messaged including handwashing and household level appropriate water treatment and storage.
5. Conclusion and Recommendations The results presented represent the only population-representative estimates for all accessible areas of the emergency states for October 2019. The findings provide evidence that prevalence of GAM remains at serious levels35 all of Yobe state since 2016 when the surveillance was established. Prevalence of acute malnutrition is generally comparable with estimates of GAM from the round 1 through round 7 (2016-2019) with slight seasonal variability observed in Borno and to a lesser extent Adamawa. Under five mortality rates did not exceed the emergency threshold in all domains. However, the upper confidence intervals for U5MR in Northern Yobe exceeded 2 deaths in children under five / 10,000 children under five / day, suggesting it is possible that U5MR exceeded emergency thresholds in that domain. There remain critical gaps in both preventive and curative nutrition services, and clinical management of common childhood morbidities. Inadequate coverage of measles vaccination (less than 100% required to confer herd immunity in all three states) is particularly concerning given the ongoing measles outbreak in Borno and Yobe states. Acute malnutrition prevalence, mortality rates, and other indicators are likely poorer in newly liberated and inaccessible areas. Large areas of the assessed domains remain inaccessible, particularly in Borno. Additionally, this assessment was conducted during the end of hunger season and following a surge in emergency response programs, factors that might also contribute to the end of hunger season and following a surge in emergency response programs, factors that might also contribute to the lower estimated prevalence of acute malnutrition in these surveys relative to estimates from other small-scale surveys. Based on these results the following are recommended:
A) Prevention: 1. UNICEF and WHO to continue support for SPHCDA to strengthen the routine provision of
vitamin A and deworming through the EPI at health facilities, and in regular campaigns. UNICEF to assist in developing communication strategies to improve the uptake of vitamin A and deworming both in routine programming, and campaigns.
2. Health Sector to ensure 100% coverage of measles vaccination to ensure 100% herd immunity is achieved.
3. WHO, UNICEF and health sector partners to strengthen management of common childhood illnesses, such as diarrhoea, at accessible at the household level and primary health centers.
4. WFP to continue strengthening its ongoing humanitarian response (nutrition and food or
35 World Health Organization (WHO). Physical status: the use and interpretation of anthropometry. Report of a WHO Expert
Committee. 1995. Available at: http://www.who.int/childgrowth/publications/physical_status/en/
cash assistance), which may be attributable in contributing to the documented decrease in acute malnutrition.
B) Response: 5. WFP to continue strengthening its ongoing humanitarian response (nutrition and food or
cash assistance) which may be attributable in contributing to the documented decrease in acute malnutrition.
6. Donors to support Nutrition Sector partners to scale-up malnutrition prevention and treatment responses in areas with persistent high levels of GAM including Central Yobe, Southern Yobe, Northern Yobe, and East Borno.
7. Nutrition Sector partners to adopt innovative methods to improve the coverage and quality of infant and young child feeding (IYCF) and Micro-Nutrient Powder (MNP) including establishing Father-to-Father Groups, MtMSG, Care Models and use of the CNMs to distribute MNPs.
8. Improve coverage of effective nutrition intervention e.g. targeting them in Mother to Mother Support groups, aimed at improving the nutritional status of adolescent girls.
9. Nutrition Sector partners to adopt tested and innovative methods to improve the coverage and quality of infant and young child feeding (IYCF), and use of micronutrient powder (MNP), including establishing Father-to-Father Groups, Mother-to-Mother Support Groups, Care Models, and engagement of Community Nutrition Mobilisers to distribute MNPs.
C) Funding 10. Donors to support Nutrition Sector partners to scale-up nutrition prevention and
treatment response in areas with persistent high levels of GAM including Central, Northern and Southern Yobe, and East Borno.
D) Monitoring and Evaluation: 11. Nutrition Sector to plan and carry out systematic SMART methodology nutrition surveys
in LGAs, and to seek donor funding for regularization of these surveys. E) Coordination: 12. OCHA to support the Nutrition Sector to involve the ISWG and specifically the WASH and
Food Security in the planning, implementation, analysis, and dissemination of results. This is to ensure the SMART results are relevant to the other sectors.
13. OCHA to support the adoption of GAM results as a cross cutting outcome for all sectors.
6. References 1. Famine Early Warning Systems Network (FEWSNET). Nigeria Livelihood Zones. 2014.
Available at: http://www.fews.net/west-africa/nigeria/livelihood-zone-map/may-2014
2. Nigeria - DTM Round 28 Report (August 2019). Available at; https://displacement.iom.int/system/tdf/reports/Nigeria_DTM_Round_28_Report_August%202019.pdf?file=1&type=node&id=6616
3. United States Agency for International Development (USAID), United Nations Children’s Fund (UNICEF), United Kingdom Agency for International Development (UKAID). 2015. National Nutrition and Health Survey: Report on the Nutrition and Health Situation in Nigeria (NNHS). Available at: http://somlpforr.org.ng/pdfs/SMARTResults%202015.pdf.
4. World Health Organization (WHO). Physical status: the use and interpretation of anthropometry. Report of a WHO Expert Committee. 1995. Available at: http://www.who.int/childgrowth/publications/physical_status/en/
5. World Health Organization (WHO). 2006. Child Growth Standards. Available at: http://www.who.int/childgrowth/en/
6. World Health Organization (WHO). 2007. WHO Fact sheet N°286: Measles. Available at: http://www.who.int/mediacentre/factsheets/fs286/en/
7. NCDC 2019 Measles Outbreak in Nigeria, May 18, 2019 Available: https://reliefweb.int/sites/reliefweb.int/files/resources/An%20Update%20of%20Measles%20Outbreak%20in%20Nigeria_100519_19.pdf
8. World Health Organization (WHO), Government of Nigeria. 2016. Northeast Nigeria Response: Borno State Health Sector Bulletin #08. Avalable : http://reliefweb.int/report/nigeria/northeast-nigeria-response-borno-state-health-sector-bulletin-08
9. Measles Eradication: Recommendations from a Meeting Cosponsored by the World Health Organization, the Pan American Health Organization, and CDC. MMWR. 1997:46(RR11);1-20.
10. World Health Organization (WHO). 2013. WHO Fact sheet N°330: Diarrhoeal disease. Available at: http://www.who.int/mediacentre/factsheets/fs330/en/
11. United Nations Children’s Fund (UNICEF). 2016. Nigeria Humanitarian Situation Report #16. Available at: http://reliefweb.int/report/nigeria/nigeria-weekly-humanitarian-situation-report-no-16-15-21-december-2016.
12. United Nations Children’s Fund (UNICEF). 2016. Nigeria Humanitarian Situation Report #12. Available at: http://reliefweb.int/report/nigeria/nigeria-weekly-humanitarian-situation-report-no-12-17-23-november-2016.
13. Borno State Government. Health Sector Nigeria. 2016. Northeast Nigeria Response. Borno State Health Sector Bulletin #04. Available at: http://www.who.int/health-cluster/news-and-events/news/Borno-Health-Sector-Bulletin-Issue4.pdf?ua=1.
14. Butta ZA, Bird SM, Black RE, et al. Therapeutic effects of oral zinc in acute and persistent diarrhea in children in developing countries: pooled analysis of randomized controlled trials. Am J Clin Nutr. 2000 Dec;72(6):1516-22.
15. Oyejide CO, Osinusi K. Incidence of acute lower respiratory infections in a low socioeconomic community. Niger J Paediatr. 1991:8–21.
16. Fagbule D, Parakoyi DB, Spiegel R. Acute respiratory infections in Nigerian children: prospective cohort study of incidence and case management. J Trop Pediatric. 1994 Oct;40(5):279-84.
17. World Health Organization (WHO). 2014. Revised WHO classification and treatment of childhood pneumonia at health facilities: Evidence summaries. Available at: http://apps.who.int/iris/bitstream/10665/137319/1/9789241507813_eng.pdf
18. Federal Ministry of Health. 2011. National Policy on Malaria Diagnosis and Treatment.
19. National Primary Health Care Development Agency. 2012. National Guidelines for the Development of Primary Health Care System in Nigeria. Available at: http://www.nphcda.gov.ng/index.php/publication
20. World Food Program (WFP). 2016. Number of People in Need of Food Assistance Grows in North East Nigeria. Available at: https://www.wfp.org/news/news-release/number-people-need-food-assistance-grows-north-eastern-nigeria
21. World Food Program (WFP). 2016. WFP Nigeria Situation Report #3. http://reliefweb.int/report/nigeria/wfp-nigeria-situation-report-03-october-2016
22. Martin-Prevel, Y, Allemand, P, Wiesmann, D, et al. 20015. Moving Forward: On choosing a standard operational indicator for women’s dietary diversity. Available at: http://www.fao.org/3/a-i4942e.pdf
23. Food and Agricultural Organization (FAO) and FHI 360. 2016. Minimum Dietary Diversity for Women: A Guide for Measurement. Rome: FAO. Available at: http://www.fao.org/3/a-i5486e.pdf
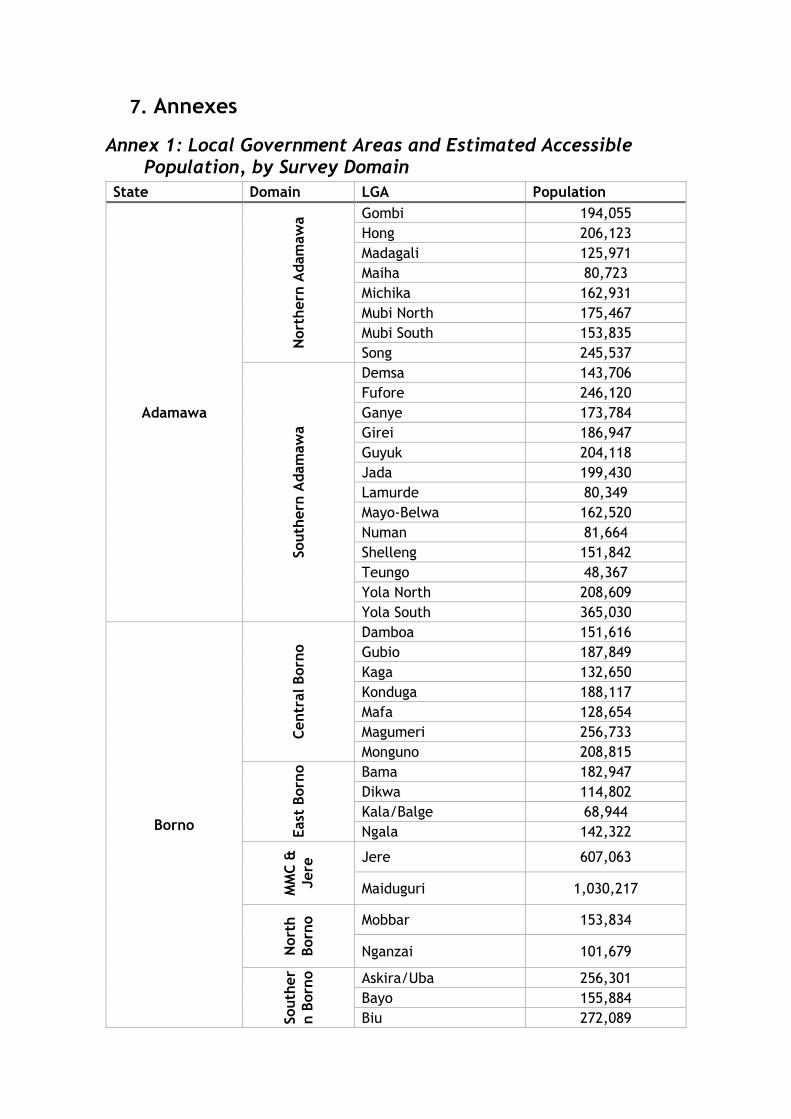
7. Annexes
Annex 1: Local Government Areas and Estimated Accessible Population, by Survey Domain
State Domain LGA Population
Adamawa
Nort
hern
Adam
aw
a Gombi 194,055
Hong 206,123
Madagali 125,971
Maiha 80,723
Michika 162,931
Mubi North 175,467
Mubi South 153,835
Song 245,537
South
ern
Adam
aw
a
Demsa 143,706
Fufore 246,120
Ganye 173,784
Girei 186,947
Guyuk 204,118
Jada 199,430
Lamurde 80,349
Mayo-Belwa 162,520
Numan 81,664
Shelleng 151,842
Teungo 48,367
Yola North 208,609
Yola South 365,030
Borno
Centr
al Born
o
Damboa 151,616
Gubio 187,849
Kaga 132,650
Konduga 188,117
Mafa 128,654
Magumeri 256,733
Monguno 208,815
East
Born
o
Bama 182,947
Dikwa 114,802
Kala/Balge 68,944
Ngala 142,322
MM
C &
Jere
Jere 607,063
Maiduguri 1,030,217
Nort
h
Born
o
Mobbar 153,834
Nganzai 101,679
South
er
n B
orn
o
Askira/Uba 256,301
Bayo 155,884
Biu 272,089
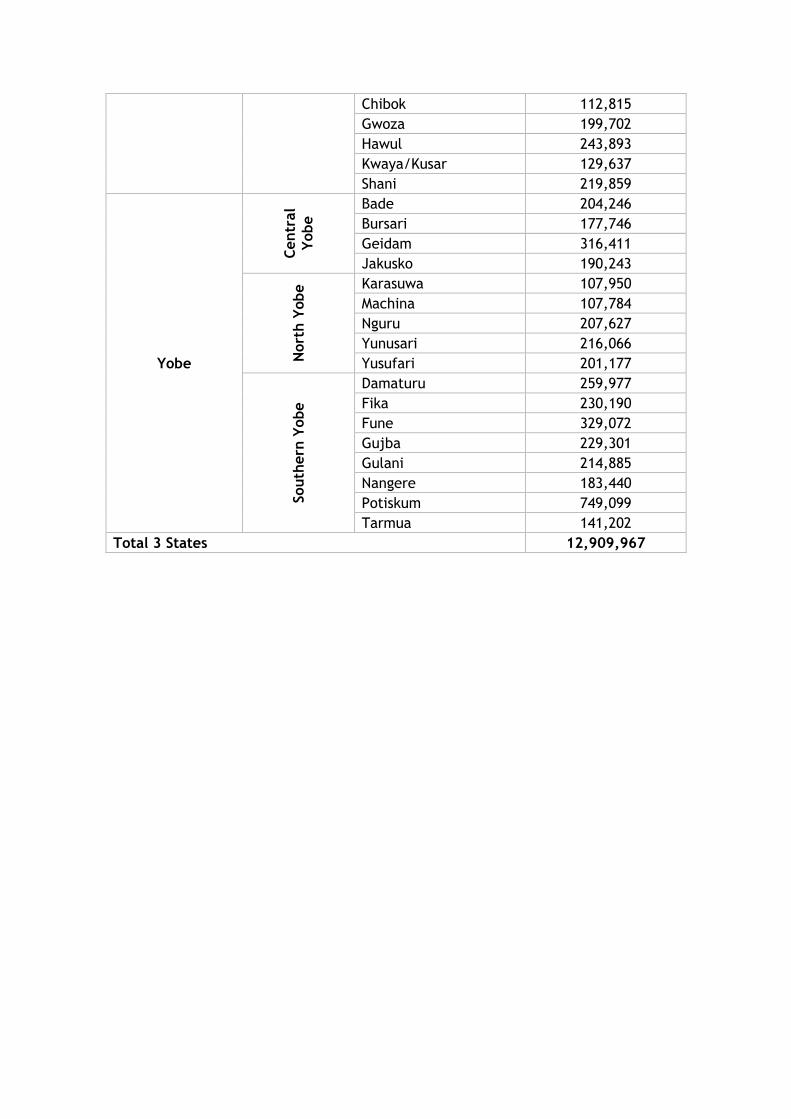
Chibok 112,815
Gwoza 199,702
Hawul 243,893
Kwaya/Kusar 129,637
Shani 219,859
Yobe
Centr
al
Yobe
Bade 204,246
Bursari 177,746
Geidam 316,411
Jakusko 190,243
Nort
h Y
obe Karasuwa 107,950
Machina 107,784
Nguru 207,627
Yunusari 216,066
Yusufari 201,177
South
ern
Yobe
Damaturu 259,977
Fika 230,190
Fune 329,072
Gujba 229,301
Gulani 214,885
Nangere 183,440
Potiskum 749,099
Tarmua 141,202
Total 3 States 12,909,967
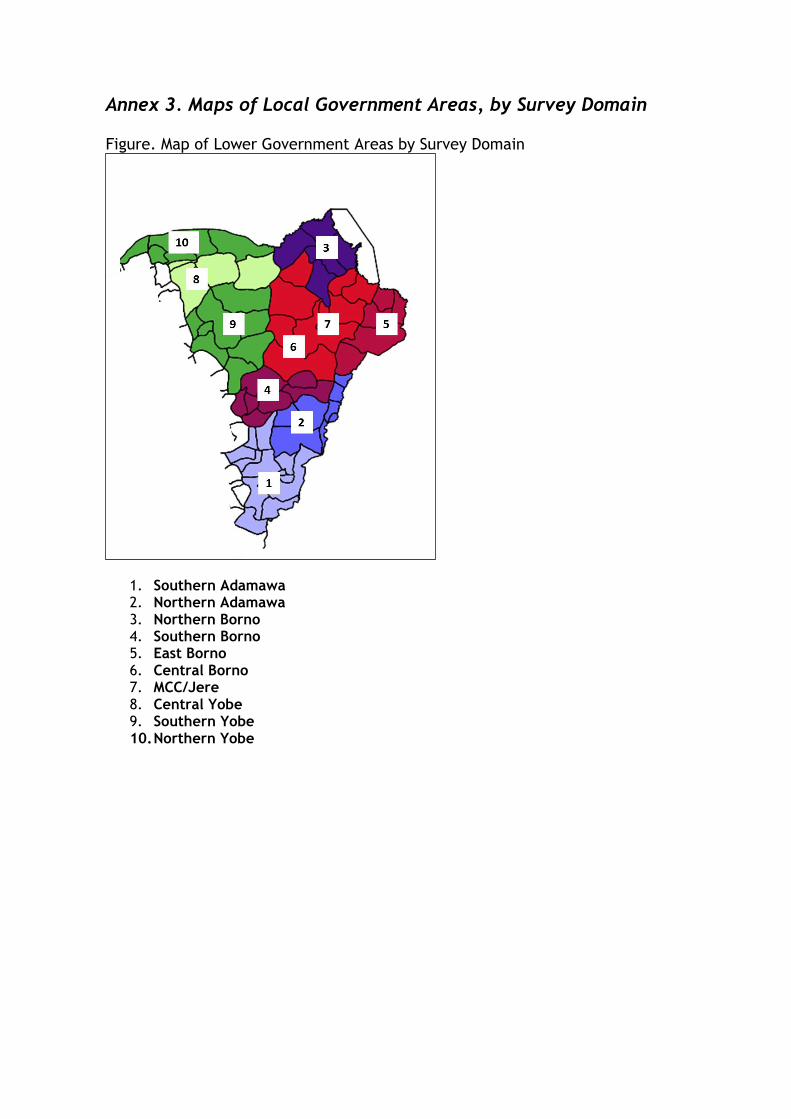
Annex 3. Maps of Local Government Areas, by Survey Domain
Figure. Map of Lower Government Areas by Survey Domain
1. Southern Adamawa 2. Northern Adamawa 3. Northern Borno 4. Southern Borno 5. East Borno 6. Central Borno 7. MCC/Jere 8. Central Yobe 9. Southern Yobe 10. Northern Yobe
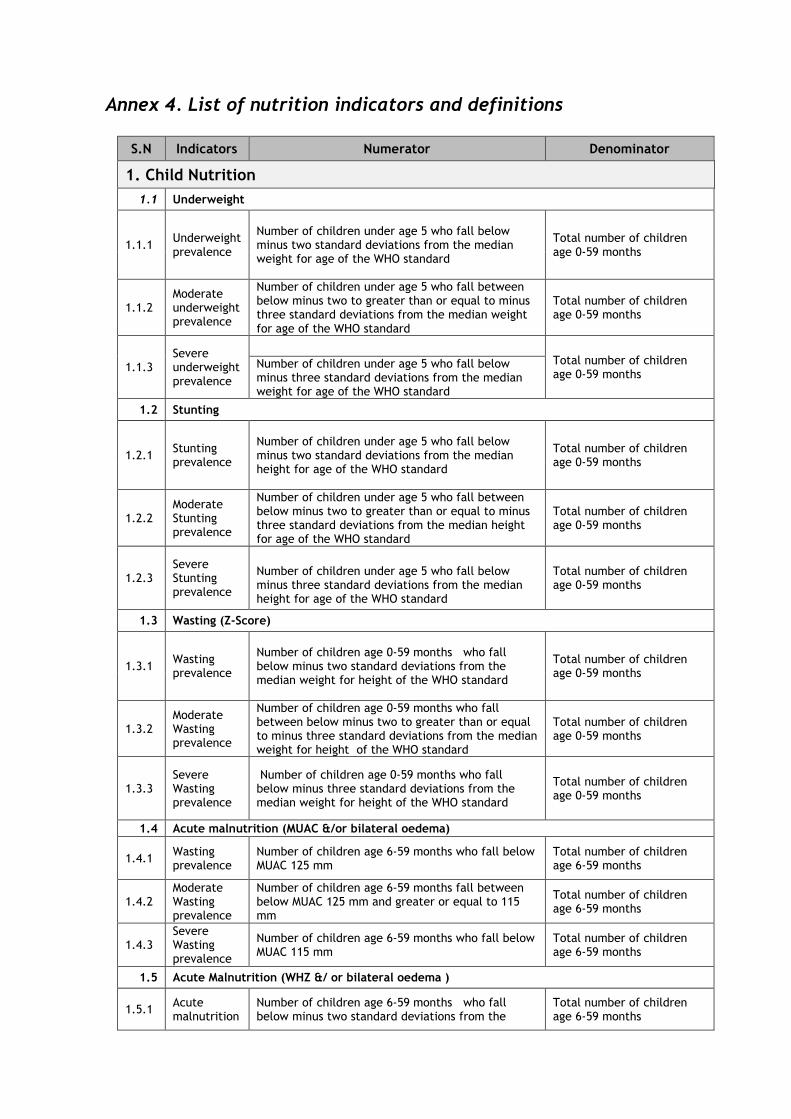
Annex 4. List of nutrition indicators and definitions
S.N Indicators Numerator Denominator
1. Child Nutrition
1.1 Underweight
1.1.1 Underweight prevalence
Number of children under age 5 who fall below minus two standard deviations from the median weight for age of the WHO standard
Total number of children age 0-59 months
1.1.2 Moderate underweight prevalence
Number of children under age 5 who fall between below minus two to greater than or equal to minus three standard deviations from the median weight for age of the WHO standard
Total number of children age 0-59 months
1.1.3 Severe underweight prevalence
Total number of children age 0-59 months
Number of children under age 5 who fall below minus three standard deviations from the median weight for age of the WHO standard
1.2 Stunting
1.2.1 Stunting prevalence
Number of children under age 5 who fall below minus two standard deviations from the median height for age of the WHO standard
Total number of children age 0-59 months
1.2.2 Moderate Stunting prevalence
Number of children under age 5 who fall between below minus two to greater than or equal to minus three standard deviations from the median height for age of the WHO standard
Total number of children age 0-59 months
1.2.3 Severe Stunting prevalence
Number of children under age 5 who fall below minus three standard deviations from the median height for age of the WHO standard
Total number of children age 0-59 months
1.3 Wasting (Z-Score)
1.3.1 Wasting prevalence
Number of children age 0-59 months who fall below minus two standard deviations from the median weight for height of the WHO standard
Total number of children age 0-59 months
1.3.2 Moderate Wasting prevalence
Number of children age 0-59 months who fall between below minus two to greater than or equal to minus three standard deviations from the median weight for height of the WHO standard
Total number of children age 0-59 months
1.3.3 Severe Wasting prevalence
Number of children age 0-59 months who fall below minus three standard deviations from the median weight for height of the WHO standard
Total number of children age 0-59 months
1.4 Acute malnutrition (MUAC &/or bilateral oedema)
1.4.1 Wasting prevalence
Number of children age 6-59 months who fall below MUAC 125 mm
Total number of children age 6-59 months
1.4.2 Moderate Wasting prevalence
Number of children age 6-59 months fall between below MUAC 125 mm and greater or equal to 115 mm
Total number of children age 6-59 months
1.4.3 Severe Wasting prevalence
Number of children age 6-59 months who fall below MUAC 115 mm
Total number of children age 6-59 months
1.5 Acute Malnutrition (WHZ &/ or bilateral oedema )
1.5.1 Acute malnutrition
Number of children age 6-59 months who fall below minus two standard deviations from the
Total number of children age 6-59 months
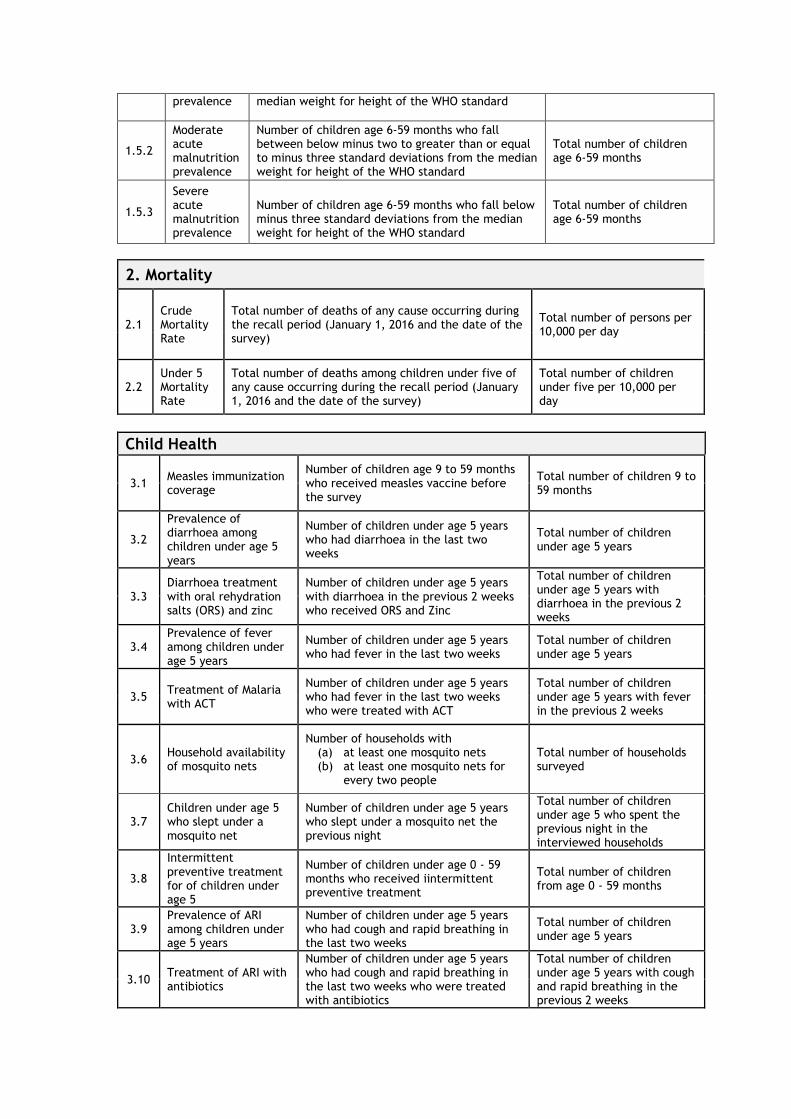
prevalence median weight for height of the WHO standard
1.5.2
Moderate acute malnutrition prevalence
Number of children age 6-59 months who fall between below minus two to greater than or equal to minus three standard deviations from the median weight for height of the WHO standard
Total number of children age 6-59 months
1.5.3
Severe acute malnutrition prevalence
Number of children age 6-59 months who fall below minus three standard deviations from the median weight for height of the WHO standard
Total number of children age 6-59 months
2. Mortality
2.1 Crude Mortality Rate
Total number of deaths of any cause occurring during the recall period (January 1, 2016 and the date of the survey)
Total number of persons per 10,000 per day
2.2 Under 5 Mortality Rate
Total number of deaths among children under five of any cause occurring during the recall period (January 1, 2016 and the date of the survey)
Total number of children under five per 10,000 per day
Child Health
3.1 Measles immunization coverage
Number of children age 9 to 59 months who received measles vaccine before the survey
Total number of children 9 to 59 months
3.2
Prevalence of diarrhoea among children under age 5 years
Number of children under age 5 years who had diarrhoea in the last two weeks
Total number of children under age 5 years
3.3 Diarrhoea treatment with oral rehydration salts (ORS) and zinc
Number of children under age 5 years with diarrhoea in the previous 2 weeks who received ORS and Zinc
Total number of children under age 5 years with diarrhoea in the previous 2 weeks
3.4 Prevalence of fever among children under age 5 years
Number of children under age 5 years who had fever in the last two weeks
Total number of children under age 5 years
3.5 Treatment of Malaria with ACT
Number of children under age 5 years who had fever in the last two weeks who were treated with ACT
Total number of children under age 5 years with fever in the previous 2 weeks
3.6 Household availability of mosquito nets
Number of households with (a) at least one mosquito nets (b) at least one mosquito nets for
every two people
Total number of households surveyed
3.7 Children under age 5 who slept under a mosquito net
Number of children under age 5 years who slept under a mosquito net the previous night
Total number of children under age 5 who spent the previous night in the interviewed households
3.8
Intermittent preventive treatment for of children under age 5
Number of children under age 0 - 59 months who received iintermittent preventive treatment
Total number of children from age 0 - 59 months
3.9 Prevalence of ARI among children under age 5 years
Number of children under age 5 years who had cough and rapid breathing in the last two weeks
Total number of children under age 5 years
3.10 Treatment of ARI with antibiotics
Number of children under age 5 years who had cough and rapid breathing in the last two weeks who were treated with antibiotics
Total number of children under age 5 years with cough and rapid breathing in the previous 2 weeks
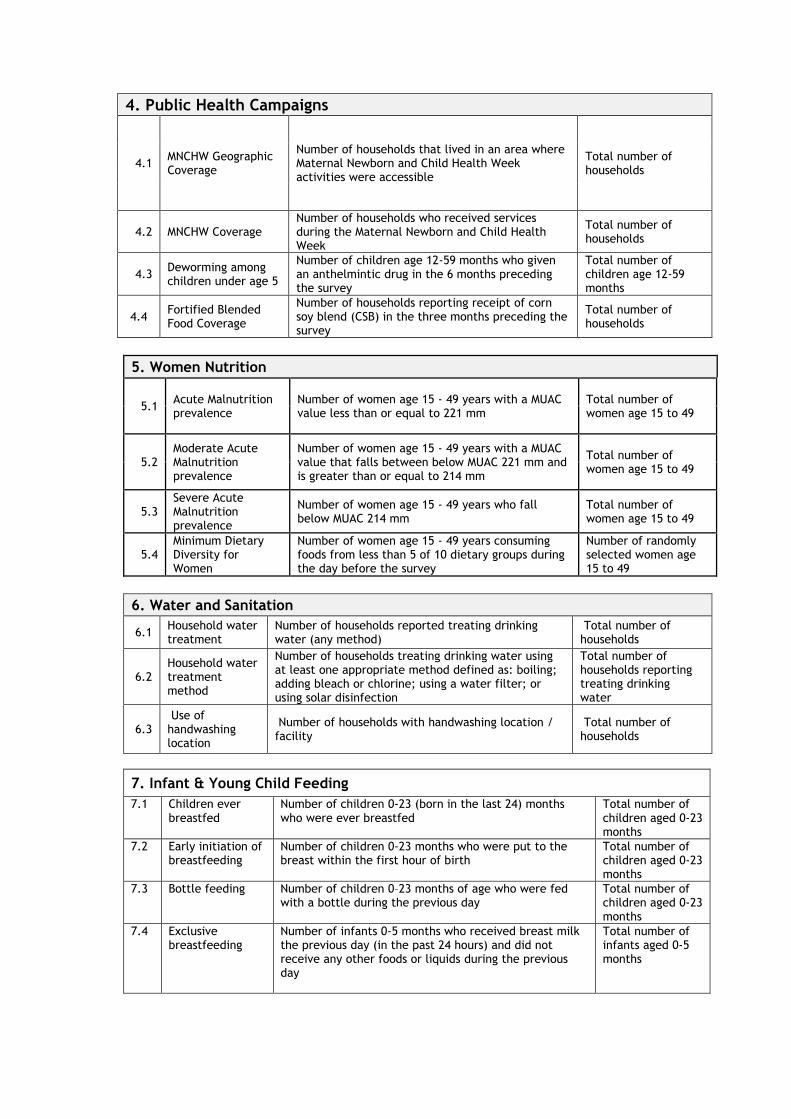
4. Public Health Campaigns
4.1 MNCHW Geographic Coverage
Number of households that lived in an area where Maternal Newborn and Child Health Week activities were accessible
Total number of households
4.2 MNCHW Coverage Number of households who received services during the Maternal Newborn and Child Health Week
Total number of households
4.3 Deworming among children under age 5
Number of children age 12-59 months who given an anthelmintic drug in the 6 months preceding the survey
Total number of children age 12-59 months
4.4 Fortified Blended Food Coverage
Number of households reporting receipt of corn soy blend (CSB) in the three months preceding the survey
Total number of households
5. Women Nutrition
5.1 Acute Malnutrition prevalence
Number of women age 15 - 49 years with a MUAC value less than or equal to 221 mm
Total number of women age 15 to 49
5.2 Moderate Acute Malnutrition prevalence
Number of women age 15 - 49 years with a MUAC value that falls between below MUAC 221 mm and is greater than or equal to 214 mm
Total number of women age 15 to 49
5.3 Severe Acute Malnutrition prevalence
Number of women age 15 - 49 years who fall below MUAC 214 mm
Total number of women age 15 to 49
5.4 Minimum Dietary Diversity for Women
Number of women age 15 - 49 years consuming foods from less than 5 of 10 dietary groups during the day before the survey
Number of randomly selected women age 15 to 49
6. Water and Sanitation
6.1 Household water treatment
Number of households reported treating drinking water (any method)
Total number of households
6.2 Household water treatment method
Number of households treating drinking water using at least one appropriate method defined as: boiling; adding bleach or chlorine; using a water filter; or using solar disinfection
Total number of households reporting treating drinking water
6.3 Use of handwashing location
Number of households with handwashing location / facility
Total number of households
7. Infant & Young Child Feeding
7.1 Children ever breastfed
Number of children 0-23 (born in the last 24) months who were ever breastfed
Total number of children aged 0-23 months
7.2 Early initiation of breastfeeding
Number of children 0-23 months who were put to the breast within the first hour of birth
Total number of children aged 0-23 months
7.3 Bottle feeding Number of children 0–23 months of age who were fed with a bottle during the previous day
Total number of children aged 0-23 months
7.4 Exclusive breastfeeding
Number of infants 0-5 months who received breast milk the previous day (in the past 24 hours) and did not receive any other foods or liquids during the previous day
Total number of infants aged 0-5 months
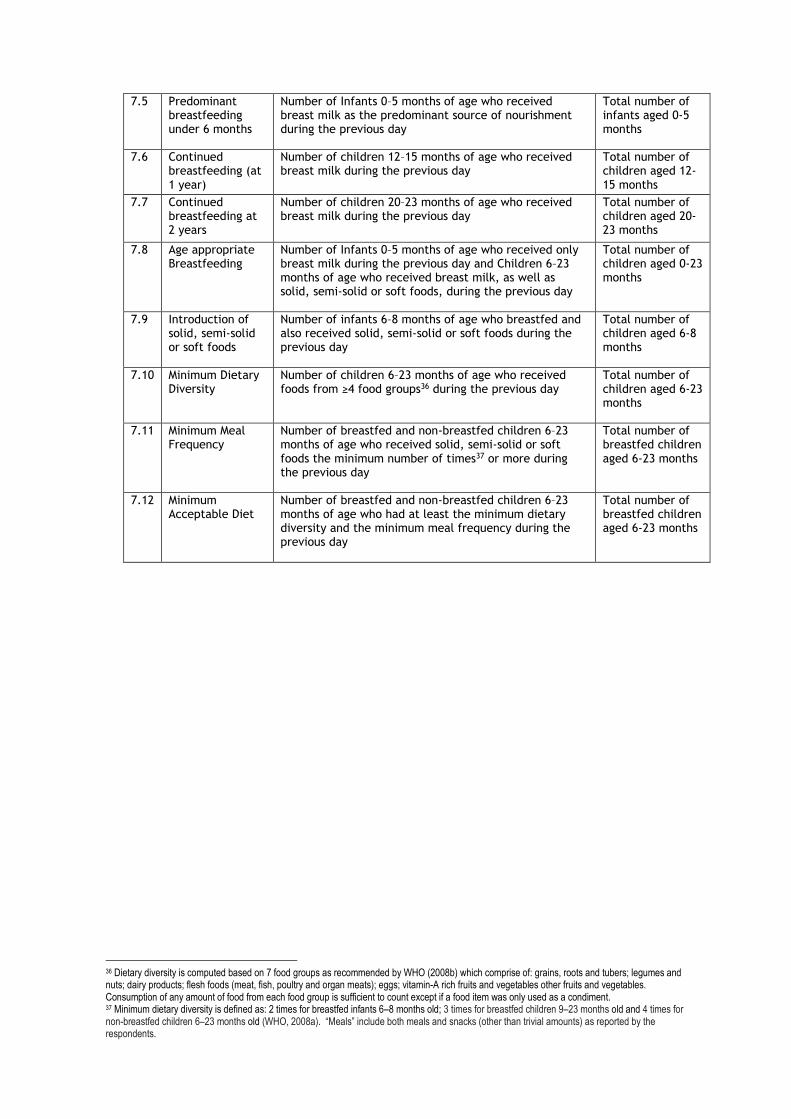
7.5 Predominant breastfeeding under 6 months
Number of Infants 0–5 months of age who received breast milk as the predominant source of nourishment during the previous day
Total number of infants aged 0-5 months
7.6 Continued breastfeeding (at 1 year)
Number of children 12–15 months of age who received breast milk during the previous day
Total number of children aged 12-15 months
7.7 Continued breastfeeding at 2 years
Number of children 20–23 months of age who received breast milk during the previous day
Total number of children aged 20-23 months
7.8 Age appropriate Breastfeeding
Number of Infants 0–5 months of age who received only breast milk during the previous day and Children 6–23 months of age who received breast milk, as well as solid, semi-solid or soft foods, during the previous day
Total number of children aged 0-23 months
7.9 Introduction of solid, semi-solid or soft foods
Number of infants 6–8 months of age who breastfed and also received solid, semi-solid or soft foods during the previous day
Total number of children aged 6-8 months
7.10 Minimum Dietary Diversity
Number of children 6–23 months of age who received foods from ≥4 food groups36 during the previous day
Total number of children aged 6-23 months
7.11 Minimum Meal Frequency
Number of breastfed and non-breastfed children 6–23 months of age who received solid, semi-solid or soft foods the minimum number of times37 or more during the previous day
Total number of breastfed children aged 6-23 months
7.12 Minimum Acceptable Diet
Number of breastfed and non-breastfed children 6–23 months of age who had at least the minimum dietary diversity and the minimum meal frequency during the previous day
Total number of breastfed children aged 6-23 months
36 Dietary diversity is computed based on 7 food groups as recommended by WHO (2008b) which comprise of: grains, roots and tubers; legumes and nuts; dairy products; flesh foods (meat, fish, poultry and organ meats); eggs; vitamin-A rich fruits and vegetables other fruits and vegetables. Consumption of any amount of food from each food group is sufficient to count except if a food item was only used as a condiment. 37 Minimum dietary diversity is defined as: 2 times for breastfed infants 6–8 months old; 3 times for breastfed children 9–23 months old and 4 times for non-breastfed children 6–23 months old (WHO, 2008a). “Meals” include both meals and snacks (other than trivial amounts) as reported by the respondents.
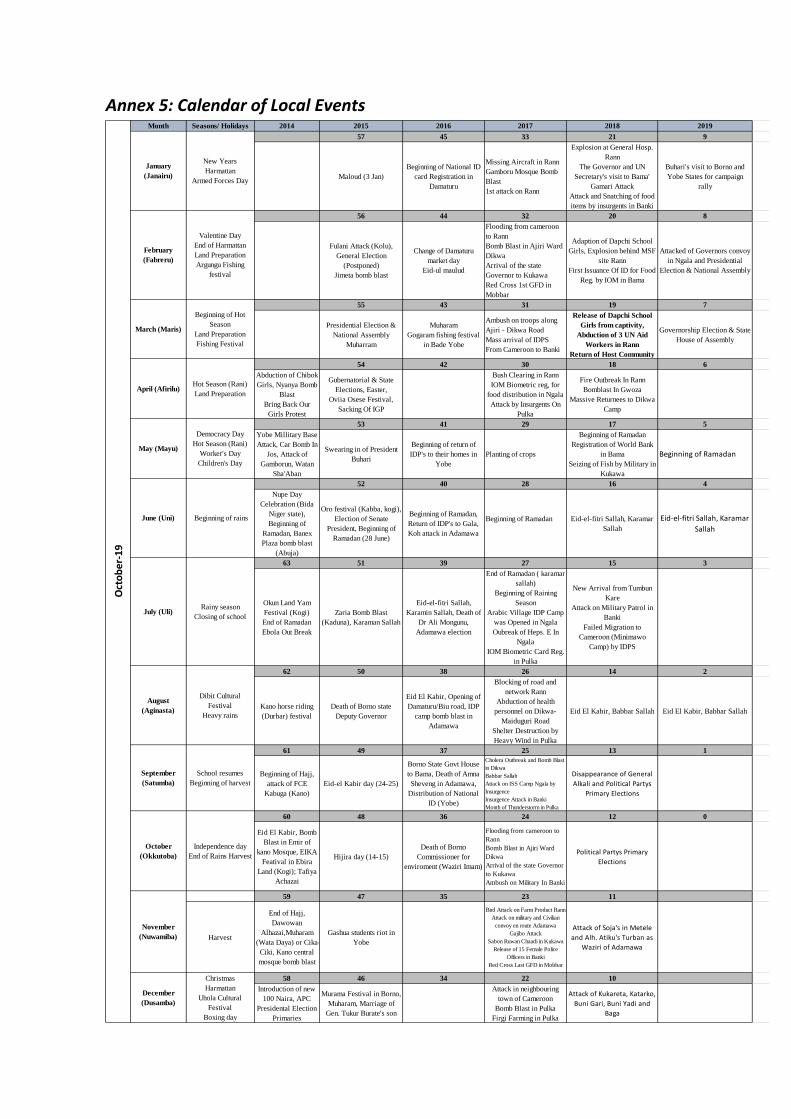
Annex 5: Calendar of Local Events
Month Seasons/ Holidays 2014 2015 2016 2017 2018 2019
57 45 33 21 9
Maloud (3 Jan)
Beginning of National ID
card Registration in
Damaturu
Missing Aircraft in Rann
Gamboru Mosque Bomb
Blast
1st attack on Rann
Explosion at General Hosp.
Rann
The Governor and UN
Secretary's visit to Bama'
Gamari Attack
Attack and Snatching of food
items by insurgents in Banki
Buhari's visit to Borno and
Yobe States for campaign
rally
56 44 32 20 8
Fulani Attack (Kolu),
General Election
(Postponed)
Jimeta bomb blast
Change of Damaturu
market day
Eid-ul maulud
Flooding from cameroon
to Rann
Bomb Blast in Ajiri Ward
Dikwa
Arrival of the state
Governor to Kukawa
Red Cross 1st GFD in
Mobbar
Adaption of Dapchi School
Girls, Explosion behind MSF
site Rann
First Issuance Of ID for Food
Reg. by IOM in Bama
Attacked of Governors convoy
in Ngala and Presidential
Election & National Assembly
55 43 31 19 7
Presidential Election &
National Assembly
Muharram
Muharam
Gogaram fishing festival
in Bade Yobe
Ambush on troops along
Ajiri - Dikwa Road
Mass arrival of IDPS
From Cameroon to Banki
Release of Dapchi School
Girls from captivity,
Abduction of 3 UN Aid
Workers in Rann
Return of Host Community
Governorship Election & State
House of Assembly
54 42 30 18 6
Abduction of Chibok
Girls, Nyanya Bomb
Blast
Bring Back Our
Girls Protest
Gubernatorial & State
Elections, Easter,
Oviia Osese Festival,
Sacking Of IGP
Bush Clearing in Rann
IOM Biometric reg, for
food distribution in Ngala
Attack by Insurgents On
Pulka
Fire Outbreak In Rann
Bomblast In Gwoza
Massive Returnees to Dikwa
Camp
53 41 29 17 5
Yobe Millitary Base
Attack, Car Bomb In
Jos, Attack of
Gamborun, Watan
Sha'Aban
Swearing in of President
Buhari
Beginning of return of
IDP's to their homes in
Yobe
Planting of crops
Beginning of Ramadan
Registration of World Bank
in Bama
Seizing of Fish by Military in
Kukawa
Beginning of Ramadan
52 40 28 16 4
Nupe Day
Celebration (Bida
Niger state),
Beginning of
Ramadan, Banex
Plaza bomb blast
(Abuja)
Oro festival (Kabba, kogi),
Election of Senate
President, Beginning of
Ramadan (28 June)
Beginning of Ramadan,
Return of IDP's to Gala,
Koh attack in Adamawa
Beginning of Ramadan Eid-el-fitri Sallah, Karamar
Sallah
Eid-el-fitri Sallah, Karamar
Sallah
63 51 39 27 15 3
Okun Land Yam
Festival (Kogi)
End of Ramadan
Ebola Out Break
Zaria Bomb Blast
(Kaduna), Karaman Sallah
Eid-el-fitri Sallah,
Karamin Sallah, Death of
Dr Ali Mongunu,
Adamawa election
End of Ramadan ( karamar
sallah)
Beginning of Raining
Season
Arabic Village IDP Camp
was Opened in Ngala
Oubreak of Heps. E In
Ngala
IOM Biometric Card Reg.
in Pulka
New Arrival from Tumbun
Kare
Attack on Military Patrol in
Banki
Failed Migration to
Cameroon (Minimawo
Camp) by IDPS
62 50 38 26 14 2
Kano horse riding
(Durbar) festival
Death of Borno state
Deputy Governor
Eid El Kabir, Opening of
Damaturu/Biu road, IDP
camp bomb blast in
Adamawa
Blocking of road and
network Rann
Abduction of health
personnel on Dikwa-
Maiduguri Road
Shelter Destruction by
Heavy Wind in Pulka
Eid El Kabir, Babbar Sallah Eid El Kabir, Babbar Sallah
61 49 37 25 13 1
Beginning of Hajj,
attack of FCE
Kabuga (Kano)
Eid-el Kabir day (24-25)
Borno State Govt House
to Bama, Death of Amna
Sheveng in Adamawa,
Distribution of National
ID (Yobe)
Cholera Outbreak and Bomb Blast
in Dikwa
Babbar Sallah
Attack on ISS Camp Ngala by
Insurgence
Insurgence Attack in Banki
Month of Thunderstorm in Pulka
Disappearance of General
Alkali and Political Partys
Primary Elections
60 48 36 24 12 0
Eid El Kabir, Bomb
Blast in Emir of
kano Mosque, EIKA
Featival in Ebira
Land (Kogi); Tafiya
Achazai
Hijira day (14-15)
Death of Borno
Commissioner for
enviroment (Waziri Imam)
Flooding from cameroon to
Rann
Bomb Blast in Ajiri Ward
Dikwa
Arrival of the state Governor
to Kukawa
Ambush on Military In Banki
Political Partys Primary
Elections
59 47 35 23 11
Harvest
End of Hajj,
Dawowan
Alhazai,Muharam
(Wata Daya) or Cika-
Ciki, Kano central
mosque bomb blast
Gashua students riot in
Yobe
Bird Attack on Farm Product Rann
Attack on military and Civilian
convoy en route Adamawa
Gajibo Attack
Sabon Ruwan Chaadi in Kukawa
Release of 15 Female Police
Officers in Banki
Red Cross Last GFD in Mobbar
Attack of Soja's in Metele
and Alh. Atiku's Turban as
Waziri of Adamawa
58 46 34 22 10
Introduction of new
100 Naira, APC
Presidental Election
Primaries
Murama Festival in Borno,
Muharam, Marriage of
Gen. Tukur Burate's son
Attack in neighbouring
town of Cameroon
Bomb Blast in Pulka
Firgi Farming in Pulka
Attack of Kukareta, Katarko,
Buni Gari, Buni Yadi and
Baga
October
(Okkutoba)
Independence day
End of Rains Harvest
November
(Nuwamiba)
Rainy season
Closing of school
August
(Aginasta)
Dibit Cultural
Festival
Heavy rains
September
(Satumba)
School resumes
Beginning of harvest
October-19
January
(Janairu)
New Years
Harmattan
Armed Forces Day
February
(Fabreru)
Valentine Day
End of Harmattan
Land Preparation
Argungu Fishing
festival
March (Maris)
Beginning of Hot
Season
Land Preparation
Fishing Festival
April (Afirilu)Hot Season (Rani)
Land Preparation
May (Mayu)
December
(Dusamba)
Christmas
Harmattan
Uhola Cultural
Festival
Boxing day
Democracy Day
Hot Season (Rani)
Worker's Day
Children's Day
June (Uni) Beginning of rains
July (Uli)
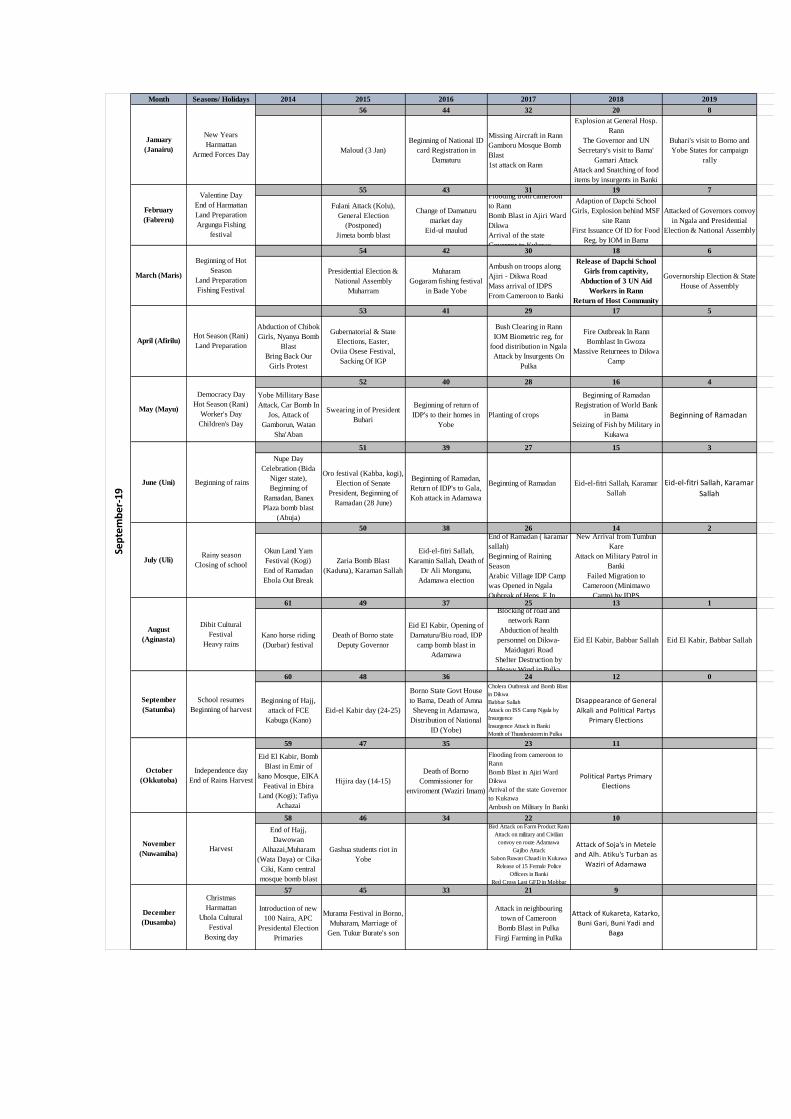
Month Seasons/ Holidays 2014 2015 2016 2017 2018 2019
56 44 32 20 8
Maloud (3 Jan)
Beginning of National ID
card Registration in
Damaturu
Missing Aircraft in Rann
Gamboru Mosque Bomb
Blast
1st attack on Rann
Explosion at General Hosp.
Rann
The Governor and UN
Secretary's visit to Bama'
Gamari Attack
Attack and Snatching of food
items by insurgents in Banki
Buhari's visit to Borno and
Yobe States for campaign
rally
55 43 31 19 7
Fulani Attack (Kolu),
General Election
(Postponed)
Jimeta bomb blast
Change of Damaturu
market day
Eid-ul maulud
Flooding from cameroon
to Rann
Bomb Blast in Ajiri Ward
Dikwa
Arrival of the state
Governor to Kukawa
Adaption of Dapchi School
Girls, Explosion behind MSF
site Rann
First Issuance Of ID for Food
Reg. by IOM in Bama
Attacked of Governors convoy
in Ngala and Presidential
Election & National Assembly
54 42 30 18 6
Presidential Election &
National Assembly
Muharram
Muharam
Gogaram fishing festival
in Bade Yobe
Ambush on troops along
Ajiri - Dikwa Road
Mass arrival of IDPS
From Cameroon to Banki
Release of Dapchi School
Girls from captivity,
Abduction of 3 UN Aid
Workers in Rann
Return of Host Community
Governorship Election & State
House of Assembly
53 41 29 17 5
Abduction of Chibok
Girls, Nyanya Bomb
Blast
Bring Back Our
Girls Protest
Gubernatorial & State
Elections, Easter,
Oviia Osese Festival,
Sacking Of IGP
Bush Clearing in Rann
IOM Biometric reg, for
food distribution in Ngala
Attack by Insurgents On
Pulka
Fire Outbreak In Rann
Bomblast In Gwoza
Massive Returnees to Dikwa
Camp
52 40 28 16 4
Yobe Millitary Base
Attack, Car Bomb In
Jos, Attack of
Gamborun, Watan
Sha'Aban
Swearing in of President
Buhari
Beginning of return of
IDP's to their homes in
Yobe
Planting of crops
Beginning of Ramadan
Registration of World Bank
in Bama
Seizing of Fish by Military in
Kukawa
Beginning of Ramadan
51 39 27 15 3
Nupe Day
Celebration (Bida
Niger state),
Beginning of
Ramadan, Banex
Plaza bomb blast
(Abuja)
Oro festival (Kabba, kogi),
Election of Senate
President, Beginning of
Ramadan (28 June)
Beginning of Ramadan,
Return of IDP's to Gala,
Koh attack in Adamawa
Beginning of Ramadan Eid-el-fitri Sallah, Karamar
Sallah
Eid-el-fitri Sallah, Karamar
Sallah
50 38 26 14 2
Okun Land Yam
Festival (Kogi)
End of Ramadan
Ebola Out Break
Zaria Bomb Blast
(Kaduna), Karaman Sallah
Eid-el-fitri Sallah,
Karamin Sallah, Death of
Dr Ali Mongunu,
Adamawa election
End of Ramadan ( karamar
sallah)
Beginning of Raining
Season
Arabic Village IDP Camp
was Opened in Ngala
Oubreak of Heps. E In
New Arrival from Tumbun
Kare
Attack on Military Patrol in
Banki
Failed Migration to
Cameroon (Minimawo
Camp) by IDPS
61 49 37 25 13 1
Kano horse riding
(Durbar) festival
Death of Borno state
Deputy Governor
Eid El Kabir, Opening of
Damaturu/Biu road, IDP
camp bomb blast in
Adamawa
Blocking of road and
network Rann
Abduction of health
personnel on Dikwa-
Maiduguri Road
Shelter Destruction by
Heavy Wind in Pulka
Eid El Kabir, Babbar Sallah Eid El Kabir, Babbar Sallah
60 48 36 24 12 0
Beginning of Hajj,
attack of FCE
Kabuga (Kano)
Eid-el Kabir day (24-25)
Borno State Govt House
to Bama, Death of Amna
Sheveng in Adamawa,
Distribution of National
ID (Yobe)
Cholera Outbreak and Bomb Blast
in Dikwa
Babbar Sallah
Attack on ISS Camp Ngala by
Insurgence
Insurgence Attack in Banki
Month of Thunderstorm in Pulka
Disappearance of General
Alkali and Political Partys
Primary Elections
59 47 35 23 11
Eid El Kabir, Bomb
Blast in Emir of
kano Mosque, EIKA
Featival in Ebira
Land (Kogi); Tafiya
Achazai
Hijira day (14-15)
Death of Borno
Commissioner for
enviroment (Waziri Imam)
Flooding from cameroon to
Rann
Bomb Blast in Ajiri Ward
Dikwa
Arrival of the state Governor
to Kukawa
Ambush on Military In Banki
Political Partys Primary
Elections
58 46 34 22 10
End of Hajj,
Dawowan
Alhazai,Muharam
(Wata Daya) or Cika-
Ciki, Kano central
mosque bomb blast
Gashua students riot in
Yobe
Bird Attack on Farm Product Rann
Attack on military and Civilian
convoy en route Adamawa
Gajibo Attack
Sabon Ruwan Chaadi in Kukawa
Release of 15 Female Police
Officers in Banki
Red Cross Last GFD in Mobbar
Attack of Soja's in Metele
and Alh. Atiku's Turban as
Waziri of Adamawa
57 45 33 21 9
Introduction of new
100 Naira, APC
Presidental Election
Primaries
Murama Festival in Borno,
Muharam, Marriage of
Gen. Tukur Burate's son
Attack in neighbouring
town of Cameroon
Bomb Blast in Pulka
Firgi Farming in Pulka
Attack of Kukareta, Katarko,
Buni Gari, Buni Yadi and
Baga
October
(Okkutoba)
Independence day
End of Rains Harvest
November
(Nuwamiba)
Rainy season
Closing of school
August
(Aginasta)
Dibit Cultural
Festival
Heavy rains
September
(Satumba)
School resumes
Beginning of harvest
Harvest
September-19
January
(Janairu)
New Years
Harmattan
Armed Forces Day
February
(Fabreru)
Valentine Day
End of Harmattan
Land Preparation
Argungu Fishing
festival
March (Maris)
Beginning of Hot
Season
Land Preparation
Fishing Festival
April (Afirilu)Hot Season (Rani)
Land Preparation
May (Mayu)
December
(Dusamba)
Christmas
Harmattan
Uhola Cultural
Festival
Boxing day
Democracy Day
Hot Season (Rani)
Worker's Day
Children's Day
June (Uni) Beginning of rains
July (Uli)
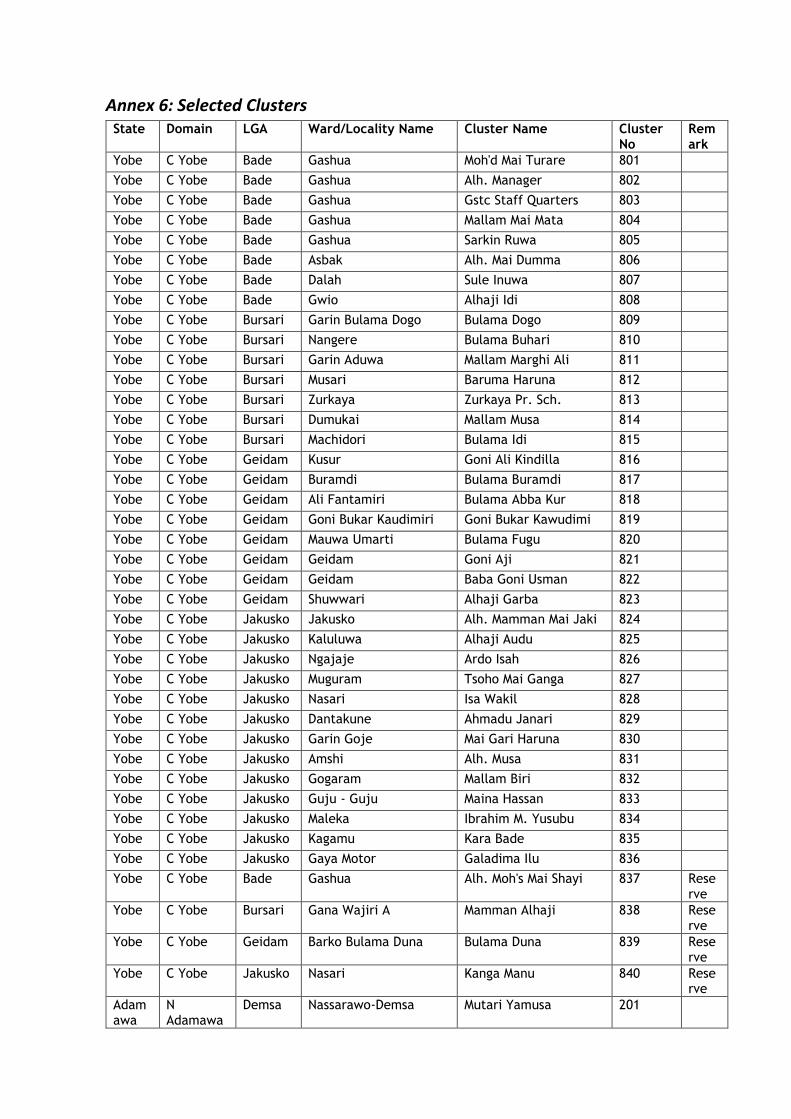
Annex 6: Selected Clusters State Domain LGA Ward/Locality Name Cluster Name Cluster
No Remark
Yobe C Yobe Bade Gashua Moh'd Mai Turare 801
Yobe C Yobe Bade Gashua Alh. Manager 802
Yobe C Yobe Bade Gashua Gstc Staff Quarters 803
Yobe C Yobe Bade Gashua Mallam Mai Mata 804
Yobe C Yobe Bade Gashua Sarkin Ruwa 805
Yobe C Yobe Bade Asbak Alh. Mai Dumma 806
Yobe C Yobe Bade Dalah Sule Inuwa 807
Yobe C Yobe Bade Gwio Alhaji Idi 808
Yobe C Yobe Bursari Garin Bulama Dogo Bulama Dogo 809
Yobe C Yobe Bursari Nangere Bulama Buhari 810
Yobe C Yobe Bursari Garin Aduwa Mallam Marghi Ali 811
Yobe C Yobe Bursari Musari Baruma Haruna 812
Yobe C Yobe Bursari Zurkaya Zurkaya Pr. Sch. 813
Yobe C Yobe Bursari Dumukai Mallam Musa 814
Yobe C Yobe Bursari Machidori Bulama Idi 815
Yobe C Yobe Geidam Kusur Goni Ali Kindilla 816
Yobe C Yobe Geidam Buramdi Bulama Buramdi 817
Yobe C Yobe Geidam Ali Fantamiri Bulama Abba Kur 818
Yobe C Yobe Geidam Goni Bukar Kaudimiri Goni Bukar Kawudimi 819
Yobe C Yobe Geidam Mauwa Umarti Bulama Fugu 820
Yobe C Yobe Geidam Geidam Goni Aji 821
Yobe C Yobe Geidam Geidam Baba Goni Usman 822
Yobe C Yobe Geidam Shuwwari Alhaji Garba 823
Yobe C Yobe Jakusko Jakusko Alh. Mamman Mai Jaki 824
Yobe C Yobe Jakusko Kaluluwa Alhaji Audu 825
Yobe C Yobe Jakusko Ngajaje Ardo Isah 826
Yobe C Yobe Jakusko Muguram Tsoho Mai Ganga 827
Yobe C Yobe Jakusko Nasari Isa Wakil 828
Yobe C Yobe Jakusko Dantakune Ahmadu Janari 829
Yobe C Yobe Jakusko Garin Goje Mai Gari Haruna 830
Yobe C Yobe Jakusko Amshi Alh. Musa 831
Yobe C Yobe Jakusko Gogaram Mallam Biri 832
Yobe C Yobe Jakusko Guju - Guju Maina Hassan 833
Yobe C Yobe Jakusko Maleka Ibrahim M. Yusubu 834
Yobe C Yobe Jakusko Kagamu Kara Bade 835
Yobe C Yobe Jakusko Gaya Motor Galadima Ilu 836
Yobe C Yobe Bade Gashua Alh. Moh's Mai Shayi 837 Reserve
Yobe C Yobe Bursari Gana Wajiri A Mamman Alhaji 838 Reserve
Yobe C Yobe Geidam Barko Bulama Duna Bulama Duna 839 Reserve
Yobe C Yobe Jakusko Nasari Kanga Manu 840 Reserve
Adamawa
N Adamawa
Demsa Nassarawo-Demsa Mutari Yamusa 201
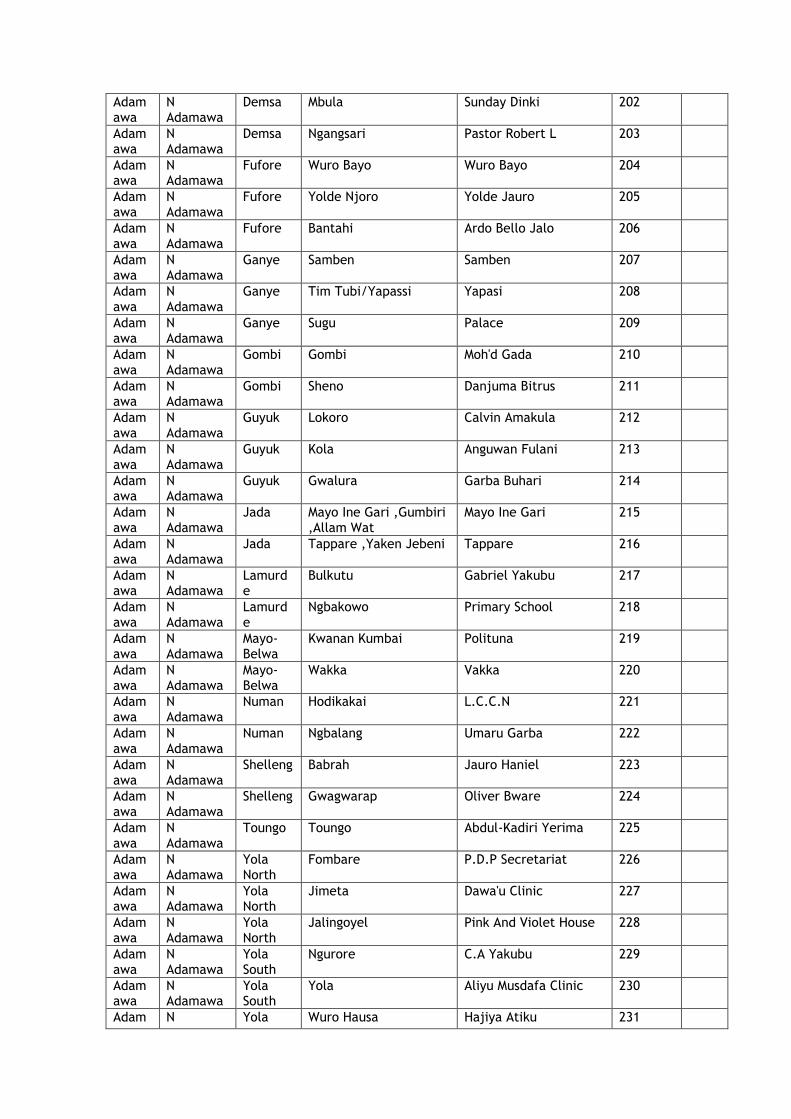
Adamawa
N Adamawa
Demsa Mbula Sunday Dinki 202
Adamawa
N Adamawa
Demsa Ngangsari Pastor Robert L 203
Adamawa
N Adamawa
Fufore Wuro Bayo Wuro Bayo 204
Adamawa
N Adamawa
Fufore Yolde Njoro Yolde Jauro 205
Adamawa
N Adamawa
Fufore Bantahi Ardo Bello Jalo 206
Adamawa
N Adamawa
Ganye Samben Samben 207
Adamawa
N Adamawa
Ganye Tim Tubi/Yapassi Yapasi 208
Adamawa
N Adamawa
Ganye Sugu Palace 209
Adamawa
N Adamawa
Gombi Gombi Moh'd Gada 210
Adamawa
N Adamawa
Gombi Sheno Danjuma Bitrus 211
Adamawa
N Adamawa
Guyuk Lokoro Calvin Amakula 212
Adamawa
N Adamawa
Guyuk Kola Anguwan Fulani 213
Adamawa
N Adamawa
Guyuk Gwalura Garba Buhari 214
Adamawa
N Adamawa
Jada Mayo Ine Gari ,Gumbiri ,Allam Wat
Mayo Ine Gari 215
Adamawa
N Adamawa
Jada Tappare ,Yaken Jebeni Tappare 216
Adamawa
N Adamawa
Lamurde
Bulkutu Gabriel Yakubu 217
Adamawa
N Adamawa
Lamurde
Ngbakowo Primary School 218
Adamawa
N Adamawa
Mayo-Belwa
Kwanan Kumbai Polituna 219
Adamawa
N Adamawa
Mayo-Belwa
Wakka Vakka 220
Adamawa
N Adamawa
Numan Hodikakai L.C.C.N 221
Adamawa
N Adamawa
Numan Ngbalang Umaru Garba 222
Adamawa
N Adamawa
Shelleng Babrah Jauro Haniel 223
Adamawa
N Adamawa
Shelleng Gwagwarap Oliver Bware 224
Adamawa
N Adamawa
Toungo Toungo Abdul-Kadiri Yerima 225
Adamawa
N Adamawa
Yola North
Fombare P.D.P Secretariat 226
Adamawa
N Adamawa
Yola North
Jimeta Dawa'u Clinic 227
Adamawa
N Adamawa
Yola North
Jalingoyel Pink And Violet House 228
Adamawa
N Adamawa
Yola South
Ngurore C.A Yakubu 229
Adamawa
N Adamawa
Yola South
Yola Aliyu Musdafa Clinic 230
Adam N Yola Wuro Hausa Hajiya Atiku 231
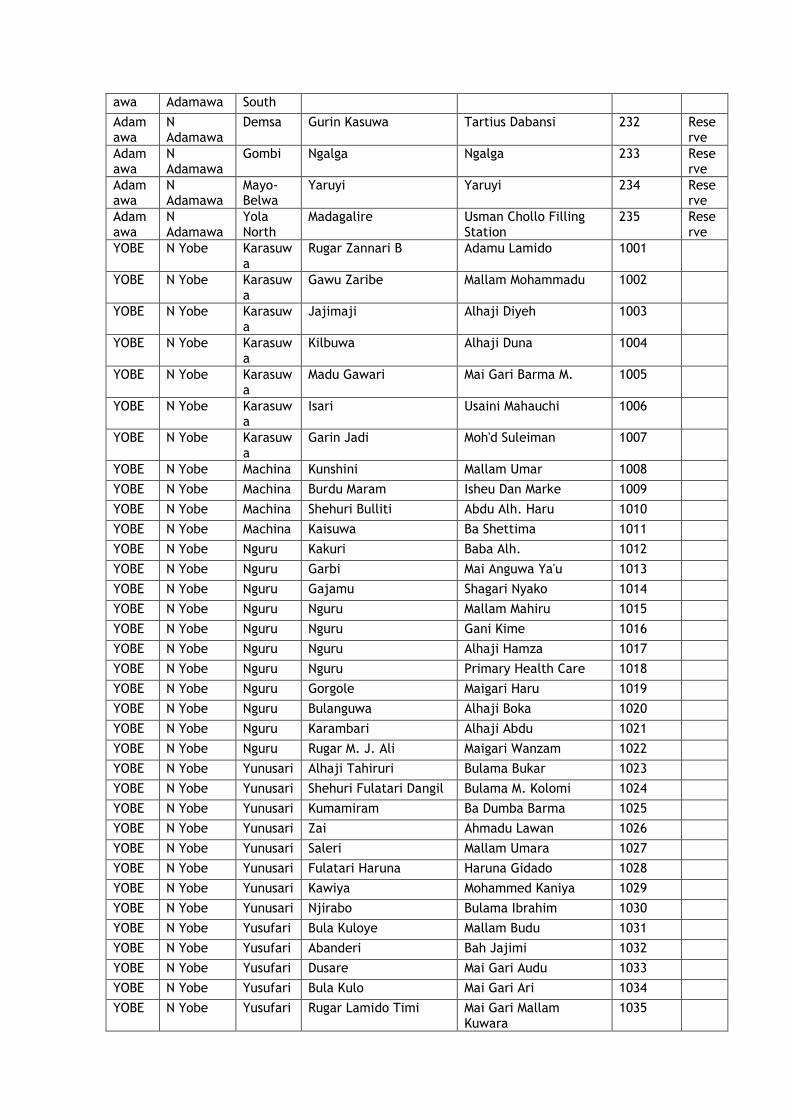
awa Adamawa South
Adamawa
N Adamawa
Demsa Gurin Kasuwa Tartius Dabansi 232 Reserve
Adamawa
N Adamawa
Gombi Ngalga Ngalga 233 Reserve
Adamawa
N Adamawa
Mayo-Belwa
Yaruyi Yaruyi 234 Reserve
Adamawa
N Adamawa
Yola North
Madagalire Usman Chollo Filling Station
235 Reserve
YOBE N Yobe Karasuwa
Rugar Zannari B Adamu Lamido 1001
YOBE N Yobe Karasuwa
Gawu Zaribe Mallam Mohammadu 1002
YOBE N Yobe Karasuwa
Jajimaji Alhaji Diyeh 1003
YOBE N Yobe Karasuwa
Kilbuwa Alhaji Duna 1004
YOBE N Yobe Karasuwa
Madu Gawari Mai Gari Barma M. 1005
YOBE N Yobe Karasuwa
Isari Usaini Mahauchi 1006
YOBE N Yobe Karasuwa
Garin Jadi Moh'd Suleiman 1007
YOBE N Yobe Machina Kunshini Mallam Umar 1008
YOBE N Yobe Machina Burdu Maram Isheu Dan Marke 1009
YOBE N Yobe Machina Shehuri Bulliti Abdu Alh. Haru 1010
YOBE N Yobe Machina Kaisuwa Ba Shettima 1011
YOBE N Yobe Nguru Kakuri Baba Alh. 1012
YOBE N Yobe Nguru Garbi Mai Anguwa Ya'u 1013
YOBE N Yobe Nguru Gajamu Shagari Nyako 1014
YOBE N Yobe Nguru Nguru Mallam Mahiru 1015
YOBE N Yobe Nguru Nguru Gani Kime 1016
YOBE N Yobe Nguru Nguru Alhaji Hamza 1017
YOBE N Yobe Nguru Nguru Primary Health Care 1018
YOBE N Yobe Nguru Gorgole Maigari Haru 1019
YOBE N Yobe Nguru Bulanguwa Alhaji Boka 1020
YOBE N Yobe Nguru Karambari Alhaji Abdu 1021
YOBE N Yobe Nguru Rugar M. J. Ali Maigari Wanzam 1022
YOBE N Yobe Yunusari Alhaji Tahiruri Bulama Bukar 1023
YOBE N Yobe Yunusari Shehuri Fulatari Dangil Bulama M. Kolomi 1024
YOBE N Yobe Yunusari Kumamiram Ba Dumba Barma 1025
YOBE N Yobe Yunusari Zai Ahmadu Lawan 1026
YOBE N Yobe Yunusari Saleri Mallam Umara 1027
YOBE N Yobe Yunusari Fulatari Haruna Haruna Gidado 1028
YOBE N Yobe Yunusari Kawiya Mohammed Kaniya 1029
YOBE N Yobe Yunusari Njirabo Bulama Ibrahim 1030
YOBE N Yobe Yusufari Bula Kuloye Mallam Budu 1031
YOBE N Yobe Yusufari Abanderi Bah Jajimi 1032
YOBE N Yobe Yusufari Dusare Mai Gari Audu 1033
YOBE N Yobe Yusufari Bula Kulo Mai Gari Ari 1034
YOBE N Yobe Yusufari Rugar Lamido Timi Mai Gari Mallam Kuwara
1035
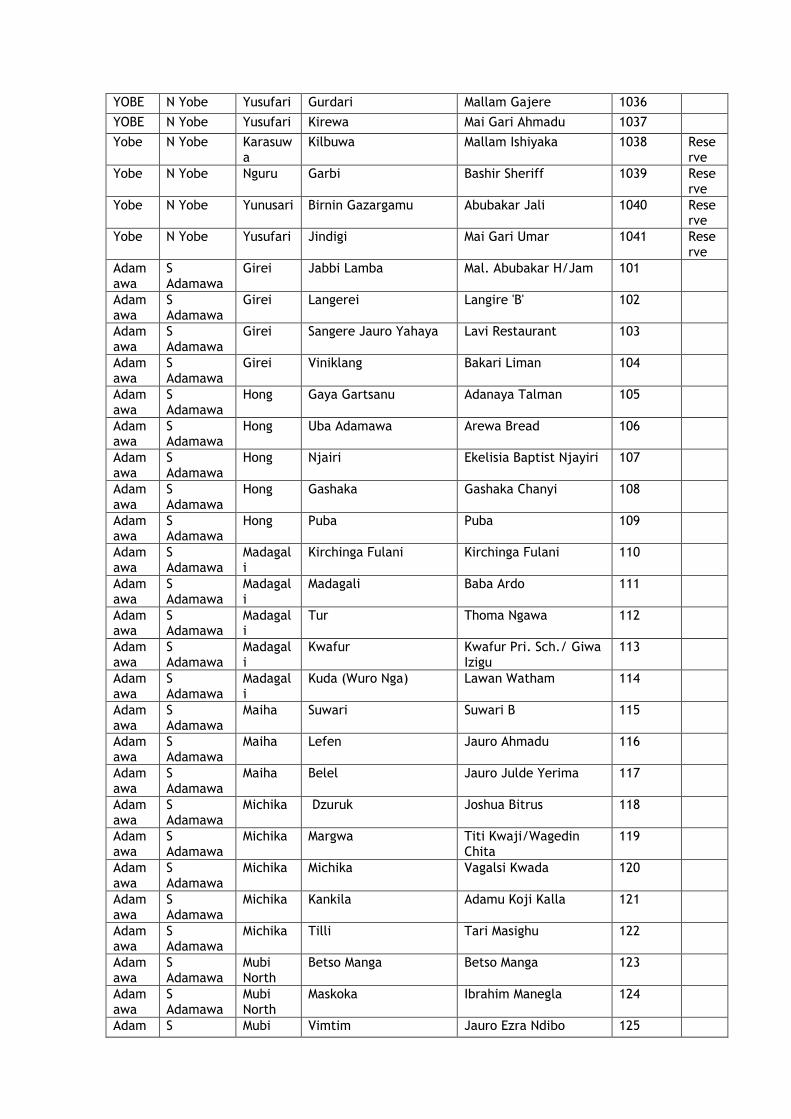
YOBE N Yobe Yusufari Gurdari Mallam Gajere 1036
YOBE N Yobe Yusufari Kirewa Mai Gari Ahmadu 1037
Yobe N Yobe Karasuwa
Kilbuwa Mallam Ishiyaka 1038 Reserve
Yobe N Yobe Nguru Garbi Bashir Sheriff 1039 Reserve
Yobe N Yobe Yunusari Birnin Gazargamu Abubakar Jali 1040 Reserve
Yobe N Yobe Yusufari Jindigi Mai Gari Umar 1041 Reserve
Adamawa
S Adamawa
Girei Jabbi Lamba Mal. Abubakar H/Jam 101
Adamawa
S Adamawa
Girei Langerei Langire 'B' 102
Adamawa
S Adamawa
Girei Sangere Jauro Yahaya Lavi Restaurant 103
Adamawa
S Adamawa
Girei Viniklang Bakari Liman 104
Adamawa
S Adamawa
Hong Gaya Gartsanu Adanaya Talman 105
Adamawa
S Adamawa
Hong Uba Adamawa Arewa Bread 106
Adamawa
S Adamawa
Hong Njairi Ekelisia Baptist Njayiri 107
Adamawa
S Adamawa
Hong Gashaka Gashaka Chanyi 108
Adamawa
S Adamawa
Hong Puba Puba 109
Adamawa
S Adamawa
Madagali
Kirchinga Fulani Kirchinga Fulani 110
Adamawa
S Adamawa
Madagali
Madagali Baba Ardo 111
Adamawa
S Adamawa
Madagali
Tur Thoma Ngawa 112
Adamawa
S Adamawa
Madagali
Kwafur Kwafur Pri. Sch./ Giwa Izigu
113
Adamawa
S Adamawa
Madagali
Kuda (Wuro Nga) Lawan Watham 114
Adamawa
S Adamawa
Maiha Suwari Suwari B 115
Adamawa
S Adamawa
Maiha Lefen Jauro Ahmadu 116
Adamawa
S Adamawa
Maiha Belel Jauro Julde Yerima 117
Adamawa
S Adamawa
Michika Dzuruk Joshua Bitrus 118
Adamawa
S Adamawa
Michika Margwa Titi Kwaji/Wagedin Chita
119
Adamawa
S Adamawa
Michika Michika Vagalsi Kwada 120
Adamawa
S Adamawa
Michika Kankila Adamu Koji Kalla 121
Adamawa
S Adamawa
Michika Tilli Tari Masighu 122
Adamawa
S Adamawa
Mubi North
Betso Manga Betso Manga 123
Adamawa
S Adamawa
Mubi North
Maskoka Ibrahim Manegla 124
Adam S Mubi Vimtim Jauro Ezra Ndibo 125
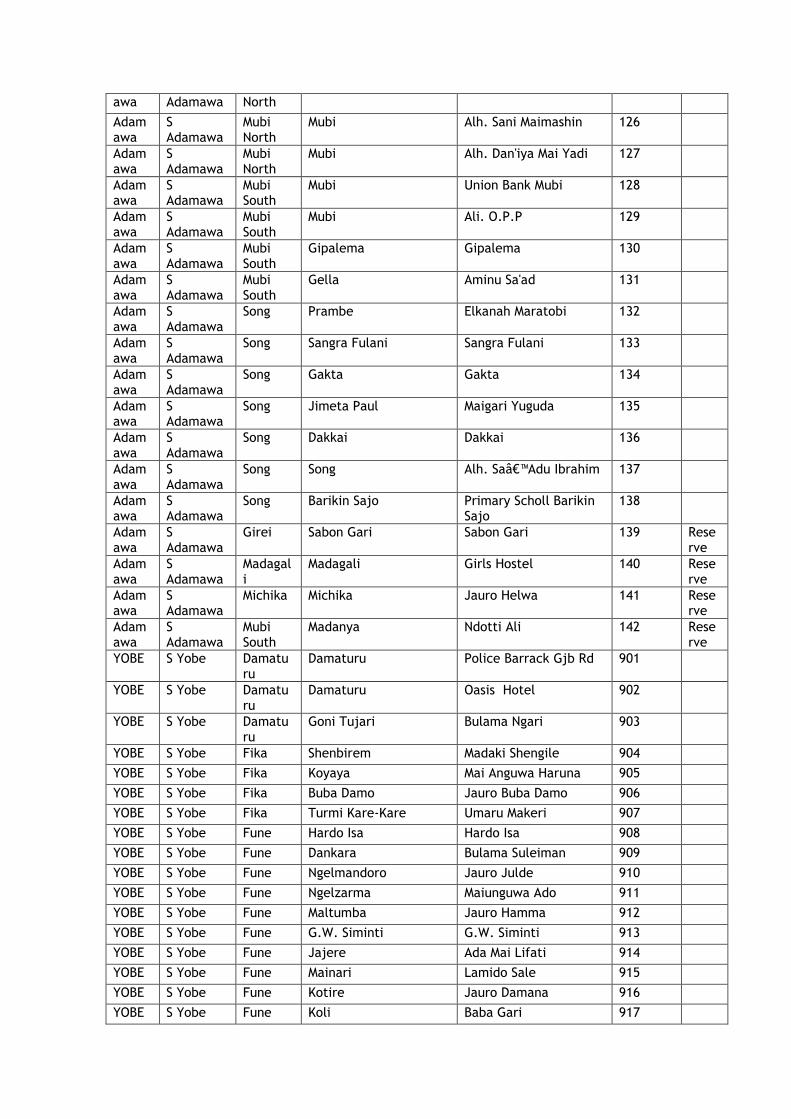
awa Adamawa North
Adamawa
S Adamawa
Mubi North
Mubi Alh. Sani Maimashin 126
Adamawa
S Adamawa
Mubi North
Mubi Alh. Dan'iya Mai Yadi 127
Adamawa
S Adamawa
Mubi South
Mubi Union Bank Mubi 128
Adamawa
S Adamawa
Mubi South
Mubi Ali. O.P.P 129
Adamawa
S Adamawa
Mubi South
Gipalema Gipalema 130
Adamawa
S Adamawa
Mubi South
Gella Aminu Sa'ad 131
Adamawa
S Adamawa
Song Prambe Elkanah Maratobi 132
Adamawa
S Adamawa
Song Sangra Fulani Sangra Fulani 133
Adamawa
S Adamawa
Song Gakta Gakta 134
Adamawa
S Adamawa
Song Jimeta Paul Maigari Yuguda 135
Adamawa
S Adamawa
Song Dakkai Dakkai 136
Adamawa
S Adamawa
Song Song Alh. Sa’Adu Ibrahim 137
Adamawa
S Adamawa
Song Barikin Sajo Primary Scholl Barikin Sajo
138
Adamawa
S Adamawa
Girei Sabon Gari Sabon Gari 139 Reserve
Adamawa
S Adamawa
Madagali
Madagali Girls Hostel 140 Reserve
Adamawa
S Adamawa
Michika Michika Jauro Helwa 141 Reserve
Adamawa
S Adamawa
Mubi South
Madanya Ndotti Ali 142 Reserve
YOBE S Yobe Damaturu
Damaturu Police Barrack Gjb Rd 901
YOBE S Yobe Damaturu
Damaturu Oasis Hotel 902
YOBE S Yobe Damaturu
Goni Tujari Bulama Ngari 903
YOBE S Yobe Fika Shenbirem Madaki Shengile 904
YOBE S Yobe Fika Koyaya Mai Anguwa Haruna 905
YOBE S Yobe Fika Buba Damo Jauro Buba Damo 906
YOBE S Yobe Fika Turmi Kare-Kare Umaru Makeri 907
YOBE S Yobe Fune Hardo Isa Hardo Isa 908
YOBE S Yobe Fune Dankara Bulama Suleiman 909
YOBE S Yobe Fune Ngelmandoro Jauro Julde 910
YOBE S Yobe Fune Ngelzarma Maiunguwa Ado 911
YOBE S Yobe Fune Maltumba Jauro Hamma 912
YOBE S Yobe Fune G.W. Siminti G.W. Siminti 913
YOBE S Yobe Fune Jajere Ada Mai Lifati 914
YOBE S Yobe Fune Mainari Lamido Sale 915
YOBE S Yobe Fune Kotire Jauro Damana 916
YOBE S Yobe Fune Koli Baba Gari 917
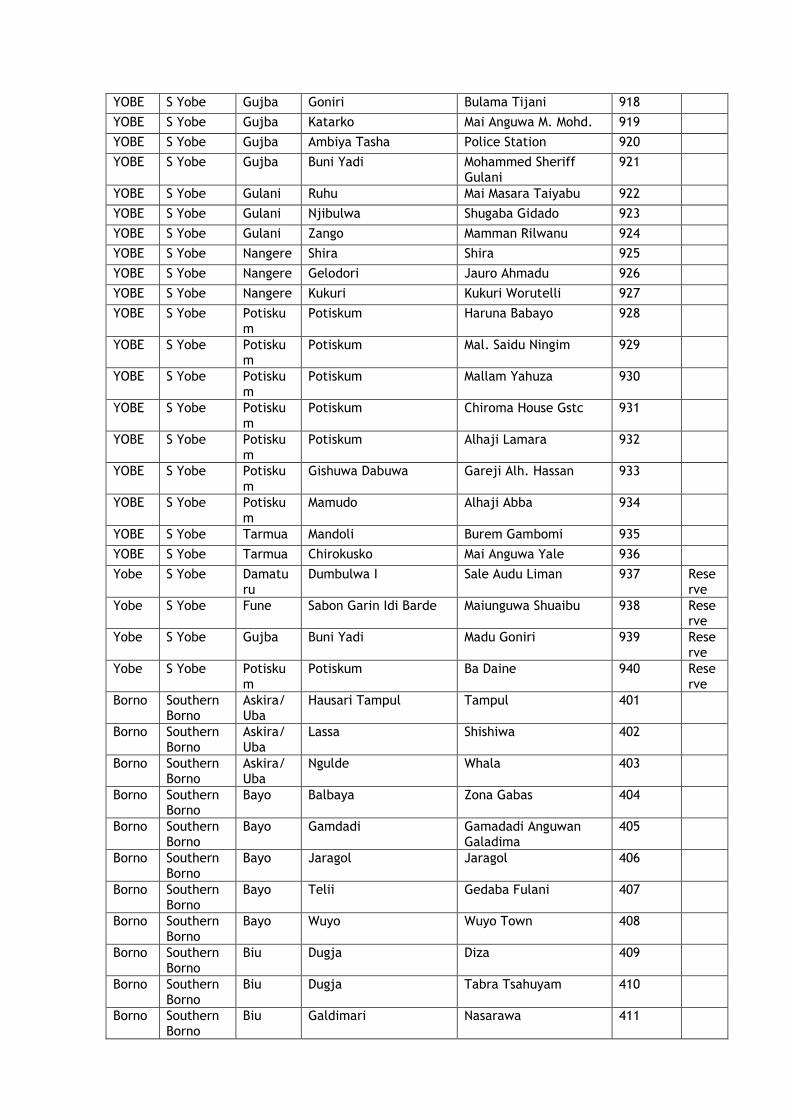
YOBE S Yobe Gujba Goniri Bulama Tijani 918
YOBE S Yobe Gujba Katarko Mai Anguwa M. Mohd. 919
YOBE S Yobe Gujba Ambiya Tasha Police Station 920
YOBE S Yobe Gujba Buni Yadi Mohammed Sheriff Gulani
921
YOBE S Yobe Gulani Ruhu Mai Masara Taiyabu 922
YOBE S Yobe Gulani Njibulwa Shugaba Gidado 923
YOBE S Yobe Gulani Zango Mamman Rilwanu 924
YOBE S Yobe Nangere Shira Shira 925
YOBE S Yobe Nangere Gelodori Jauro Ahmadu 926
YOBE S Yobe Nangere Kukuri Kukuri Worutelli 927
YOBE S Yobe Potiskum
Potiskum Haruna Babayo 928
YOBE S Yobe Potiskum
Potiskum Mal. Saidu Ningim 929
YOBE S Yobe Potiskum
Potiskum Mallam Yahuza 930
YOBE S Yobe Potiskum
Potiskum Chiroma House Gstc 931
YOBE S Yobe Potiskum
Potiskum Alhaji Lamara 932
YOBE S Yobe Potiskum
Gishuwa Dabuwa Gareji Alh. Hassan 933
YOBE S Yobe Potiskum
Mamudo Alhaji Abba 934
YOBE S Yobe Tarmua Mandoli Burem Gambomi 935
YOBE S Yobe Tarmua Chirokusko Mai Anguwa Yale 936
Yobe S Yobe Damaturu
Dumbulwa I Sale Audu Liman 937 Reserve
Yobe S Yobe Fune Sabon Garin Idi Barde Maiunguwa Shuaibu 938 Reserve
Yobe S Yobe Gujba Buni Yadi Madu Goniri 939 Reserve
Yobe S Yobe Potiskum
Potiskum Ba Daine 940 Reserve
Borno Southern Borno
Askira/Uba
Hausari Tampul Tampul 401
Borno Southern Borno
Askira/Uba
Lassa Shishiwa 402
Borno Southern Borno
Askira/Uba
Ngulde Whala 403
Borno Southern Borno
Bayo Balbaya Zona Gabas 404
Borno Southern Borno
Bayo Gamdadi Gamadadi Anguwan Galadima
405
Borno Southern Borno
Bayo Jaragol Jaragol 406
Borno Southern Borno
Bayo Telii Gedaba Fulani 407
Borno Southern Borno
Bayo Wuyo Wuyo Town 408
Borno Southern Borno
Biu Dugja Diza 409
Borno Southern Borno
Biu Dugja Tabra Tsahuyam 410
Borno Southern Borno
Biu Galdimari Nasarawa 411
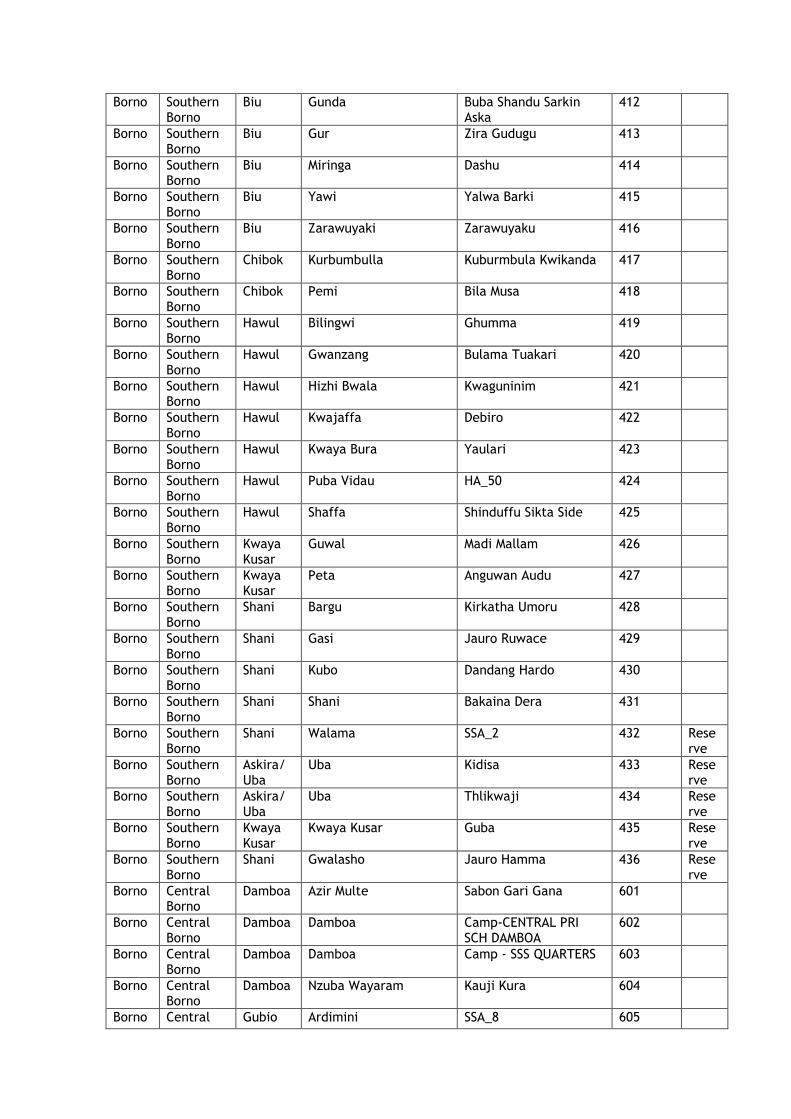
Borno Southern Borno
Biu Gunda Buba Shandu Sarkin Aska
412
Borno Southern Borno
Biu Gur Zira Gudugu 413
Borno Southern Borno
Biu Miringa Dashu 414
Borno Southern Borno
Biu Yawi Yalwa Barki 415
Borno Southern Borno
Biu Zarawuyaki Zarawuyaku 416
Borno Southern Borno
Chibok Kurbumbulla Kuburmbula Kwikanda 417
Borno Southern Borno
Chibok Pemi Bila Musa 418
Borno Southern Borno
Hawul Bilingwi Ghumma 419
Borno Southern Borno
Hawul Gwanzang Bulama Tuakari 420
Borno Southern Borno
Hawul Hizhi Bwala Kwaguninim 421
Borno Southern Borno
Hawul Kwajaffa Debiro 422
Borno Southern Borno
Hawul Kwaya Bura Yaulari 423
Borno Southern Borno
Hawul Puba Vidau HA_50 424
Borno Southern Borno
Hawul Shaffa Shinduffu Sikta Side 425
Borno Southern Borno
Kwaya Kusar
Guwal Madi Mallam 426
Borno Southern Borno
Kwaya Kusar
Peta Anguwan Audu 427
Borno Southern Borno
Shani Bargu Kirkatha Umoru 428
Borno Southern Borno
Shani Gasi Jauro Ruwace 429
Borno Southern Borno
Shani Kubo Dandang Hardo 430
Borno Southern Borno
Shani Shani Bakaina Dera 431
Borno Southern Borno
Shani Walama SSA_2 432 Reserve
Borno Southern Borno
Askira/Uba
Uba Kidisa 433 Reserve
Borno Southern Borno
Askira/Uba
Uba Thlikwaji 434 Reserve
Borno Southern Borno
Kwaya Kusar
Kwaya Kusar Guba 435 Reserve
Borno Southern Borno
Shani Gwalasho Jauro Hamma 436 Reserve
Borno Central Borno
Damboa Azir Multe Sabon Gari Gana 601
Borno Central Borno
Damboa Damboa Camp-CENTRAL PRI SCH DAMBOA
602
Borno Central Borno
Damboa Damboa Camp - SSS QUARTERS 603
Borno Central Borno
Damboa Nzuba Wayaram Kauji Kura 604
Borno Central Gubio Ardimini SSA_8 605
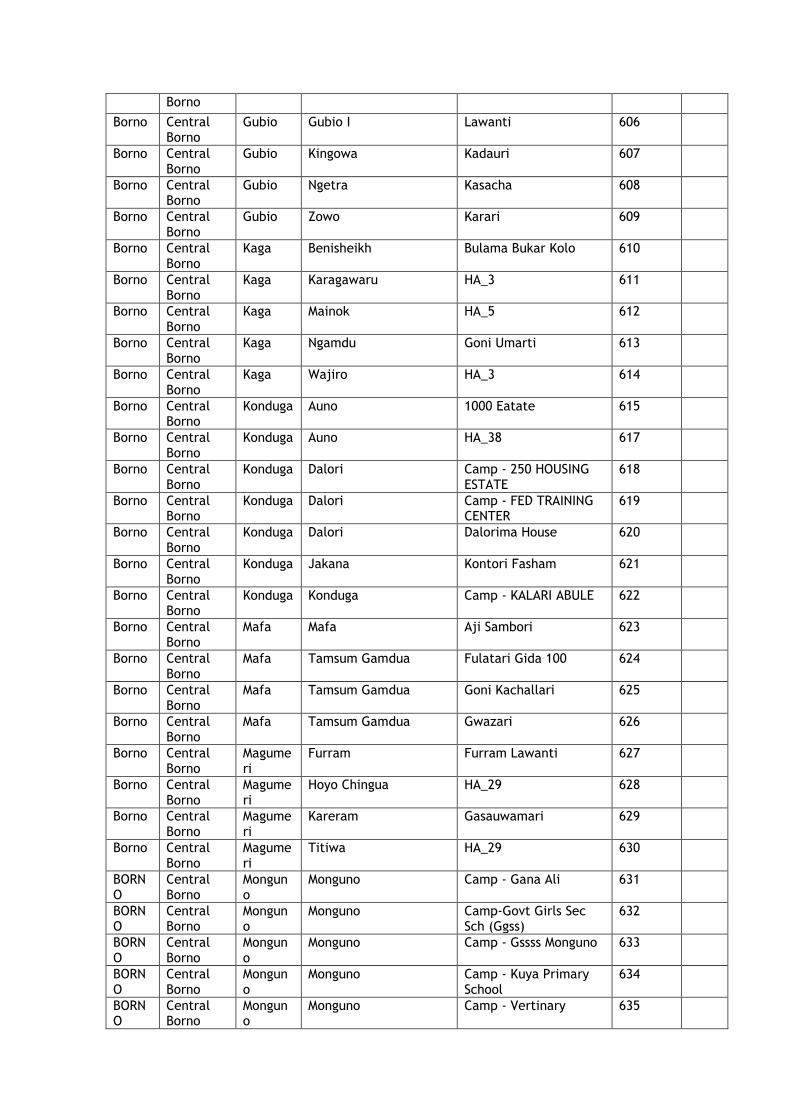
Borno
Borno Central Borno
Gubio Gubio I Lawanti 606
Borno Central Borno
Gubio Kingowa Kadauri 607
Borno Central Borno
Gubio Ngetra Kasacha 608
Borno Central Borno
Gubio Zowo Karari 609
Borno Central Borno
Kaga Benisheikh Bulama Bukar Kolo 610
Borno Central Borno
Kaga Karagawaru HA_3 611
Borno Central Borno
Kaga Mainok HA_5 612
Borno Central Borno
Kaga Ngamdu Goni Umarti 613
Borno Central Borno
Kaga Wajiro HA_3 614
Borno Central Borno
Konduga Auno 1000 Eatate 615
Borno Central Borno
Konduga Auno HA_38 617
Borno Central Borno
Konduga Dalori Camp - 250 HOUSING ESTATE
618
Borno Central Borno
Konduga Dalori Camp - FED TRAINING CENTER
619
Borno Central Borno
Konduga Dalori Dalorima House 620
Borno Central Borno
Konduga Jakana Kontori Fasham 621
Borno Central Borno
Konduga Konduga Camp - KALARI ABULE 622
Borno Central Borno
Mafa Mafa Aji Sambori 623
Borno Central Borno
Mafa Tamsum Gamdua Fulatari Gida 100 624
Borno Central Borno
Mafa Tamsum Gamdua Goni Kachallari 625
Borno Central Borno
Mafa Tamsum Gamdua Gwazari 626
Borno Central Borno
Magumeri
Furram Furram Lawanti 627
Borno Central Borno
Magumeri
Hoyo Chingua HA_29 628
Borno Central Borno
Magumeri
Kareram Gasauwamari 629
Borno Central Borno
Magumeri
Titiwa HA_29 630
BORNO
Central Borno
Monguno
Monguno Camp - Gana Ali 631
BORNO
Central Borno
Monguno
Monguno Camp-Govt Girls Sec Sch (Ggss)
632
BORNO
Central Borno
Monguno
Monguno Camp - Gssss Monguno 633
BORNO
Central Borno
Monguno
Monguno Camp - Kuya Primary School
634
BORNO
Central Borno
Monguno
Monguno Camp - Vertinary 635
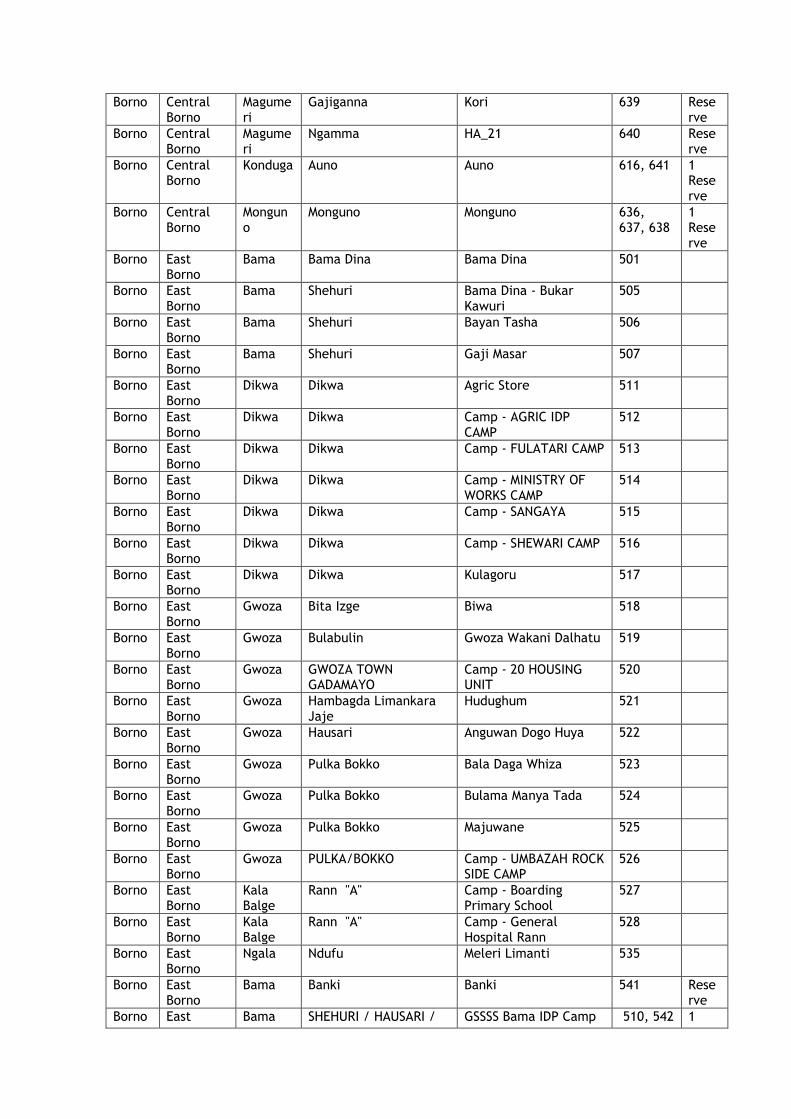
Borno Central Borno
Magumeri
Gajiganna Kori 639 Reserve
Borno Central Borno
Magumeri
Ngamma HA_21 640 Reserve
Borno Central Borno
Konduga Auno Auno 616, 641 1 Reserve
Borno Central Borno
Monguno
Monguno Monguno 636, 637, 638
1 Reserve
Borno East Borno
Bama Bama Dina Bama Dina 501
Borno East Borno
Bama Shehuri Bama Dina - Bukar Kawuri
505
Borno East Borno
Bama Shehuri Bayan Tasha 506
Borno East Borno
Bama Shehuri Gaji Masar 507
Borno East Borno
Dikwa Dikwa Agric Store 511
Borno East Borno
Dikwa Dikwa Camp - AGRIC IDP CAMP
512
Borno East Borno
Dikwa Dikwa Camp - FULATARI CAMP 513
Borno East Borno
Dikwa Dikwa Camp - MINISTRY OF WORKS CAMP
514
Borno East Borno
Dikwa Dikwa Camp - SANGAYA 515
Borno East Borno
Dikwa Dikwa Camp - SHEWARI CAMP 516
Borno East Borno
Dikwa Dikwa Kulagoru 517
Borno East Borno
Gwoza Bita Izge Biwa 518
Borno East Borno
Gwoza Bulabulin Gwoza Wakani Dalhatu 519
Borno East Borno
Gwoza GWOZA TOWN GADAMAYO
Camp - 20 HOUSING UNIT
520
Borno East Borno
Gwoza Hambagda Limankara Jaje
Hudughum 521
Borno East Borno
Gwoza Hausari Anguwan Dogo Huya 522
Borno East Borno
Gwoza Pulka Bokko Bala Daga Whiza 523
Borno East Borno
Gwoza Pulka Bokko Bulama Manya Tada 524
Borno East Borno
Gwoza Pulka Bokko Majuwane 525
Borno East Borno
Gwoza PULKA/BOKKO Camp - UMBAZAH ROCK SIDE CAMP
526
Borno East Borno
Kala Balge
Rann "A" Camp - Boarding Primary School
527
Borno East Borno
Kala Balge
Rann "A" Camp - General Hospital Rann
528
Borno East Borno
Ngala Ndufu Meleri Limanti 535
Borno East Borno
Bama Banki Banki 541 Reserve
Borno East Bama SHEHURI / HAUSARI / GSSSS Bama IDP Camp 510, 542 1
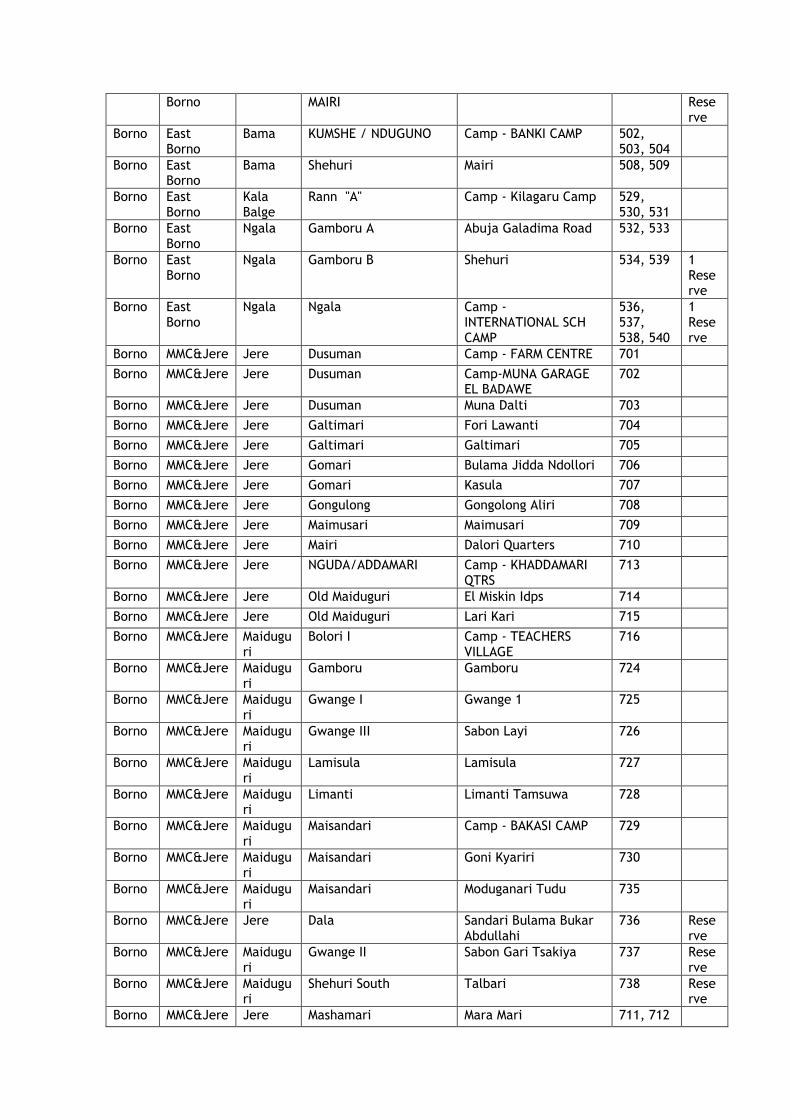
Borno MAIRI Reserve
Borno East Borno
Bama KUMSHE / NDUGUNO Camp - BANKI CAMP 502, 503, 504
Borno East Borno
Bama Shehuri Mairi 508, 509
Borno East Borno
Kala Balge
Rann "A" Camp - Kilagaru Camp 529, 530, 531
Borno East Borno
Ngala Gamboru A Abuja Galadima Road 532, 533
Borno East Borno
Ngala Gamboru B Shehuri 534, 539 1 Reserve
Borno East Borno
Ngala Ngala Camp - INTERNATIONAL SCH CAMP
536, 537, 538, 540
1 Reserve
Borno MMC&Jere Jere Dusuman Camp - FARM CENTRE 701
Borno MMC&Jere Jere Dusuman Camp-MUNA GARAGE EL BADAWE
702
Borno MMC&Jere Jere Dusuman Muna Dalti 703
Borno MMC&Jere Jere Galtimari Fori Lawanti 704
Borno MMC&Jere Jere Galtimari Galtimari 705
Borno MMC&Jere Jere Gomari Bulama Jidda Ndollori 706
Borno MMC&Jere Jere Gomari Kasula 707
Borno MMC&Jere Jere Gongulong Gongolong Aliri 708
Borno MMC&Jere Jere Maimusari Maimusari 709
Borno MMC&Jere Jere Mairi Dalori Quarters 710
Borno MMC&Jere Jere NGUDA/ADDAMARI Camp - KHADDAMARI QTRS
713
Borno MMC&Jere Jere Old Maiduguri El Miskin Idps 714
Borno MMC&Jere Jere Old Maiduguri Lari Kari 715
Borno MMC&Jere Maiduguri
Bolori I Camp - TEACHERS VILLAGE
716
Borno MMC&Jere Maiduguri
Gamboru Gamboru 724
Borno MMC&Jere Maiduguri
Gwange I Gwange 1 725
Borno MMC&Jere Maiduguri
Gwange III Sabon Layi 726
Borno MMC&Jere Maiduguri
Lamisula Lamisula 727
Borno MMC&Jere Maiduguri
Limanti Limanti Tamsuwa 728
Borno MMC&Jere Maiduguri
Maisandari Camp - BAKASI CAMP 729
Borno MMC&Jere Maiduguri
Maisandari Goni Kyariri 730
Borno MMC&Jere Maiduguri
Maisandari Moduganari Tudu 735
Borno MMC&Jere Jere Dala Sandari Bulama Bukar Abdullahi
736 Reserve
Borno MMC&Jere Maiduguri
Gwange II Sabon Gari Tsakiya 737 Reserve
Borno MMC&Jere Maiduguri
Shehuri South Talbari 738 Reserve
Borno MMC&Jere Jere Mashamari Mara Mari 711, 712
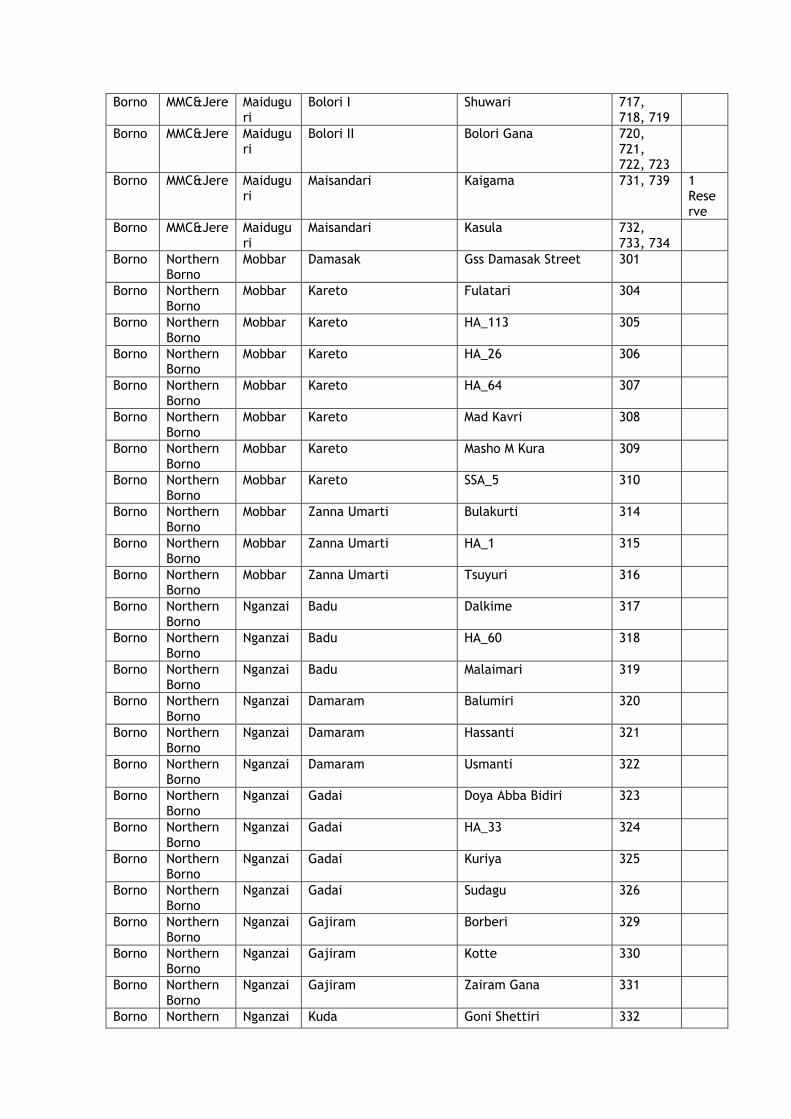
Borno MMC&Jere Maiduguri
Bolori I Shuwari 717, 718, 719
Borno MMC&Jere Maiduguri
Bolori II Bolori Gana 720, 721, 722, 723
Borno MMC&Jere Maiduguri
Maisandari Kaigama 731, 739 1 Reserve
Borno MMC&Jere Maiduguri
Maisandari Kasula 732, 733, 734
Borno Northern Borno
Mobbar Damasak Gss Damasak Street 301
Borno Northern Borno
Mobbar Kareto Fulatari 304
Borno Northern Borno
Mobbar Kareto HA_113 305
Borno Northern Borno
Mobbar Kareto HA_26 306
Borno Northern Borno
Mobbar Kareto HA_64 307
Borno Northern Borno
Mobbar Kareto Mad Kavri 308
Borno Northern Borno
Mobbar Kareto Masho M Kura 309
Borno Northern Borno
Mobbar Kareto SSA_5 310
Borno Northern Borno
Mobbar Zanna Umarti Bulakurti 314
Borno Northern Borno
Mobbar Zanna Umarti HA_1 315
Borno Northern Borno
Mobbar Zanna Umarti Tsuyuri 316
Borno Northern Borno
Nganzai Badu Dalkime 317
Borno Northern Borno
Nganzai Badu HA_60 318
Borno Northern Borno
Nganzai Badu Malaimari 319
Borno Northern Borno
Nganzai Damaram Balumiri 320
Borno Northern Borno
Nganzai Damaram Hassanti 321
Borno Northern Borno
Nganzai Damaram Usmanti 322
Borno Northern Borno
Nganzai Gadai Doya Abba Bidiri 323
Borno Northern Borno
Nganzai Gadai HA_33 324
Borno Northern Borno
Nganzai Gadai Kuriya 325
Borno Northern Borno
Nganzai Gadai Sudagu 326
Borno Northern Borno
Nganzai Gajiram Borberi 329
Borno Northern Borno
Nganzai Gajiram Kotte 330
Borno Northern Borno
Nganzai Gajiram Zairam Gana 331
Borno Northern Nganzai Kuda Goni Shettiri 332
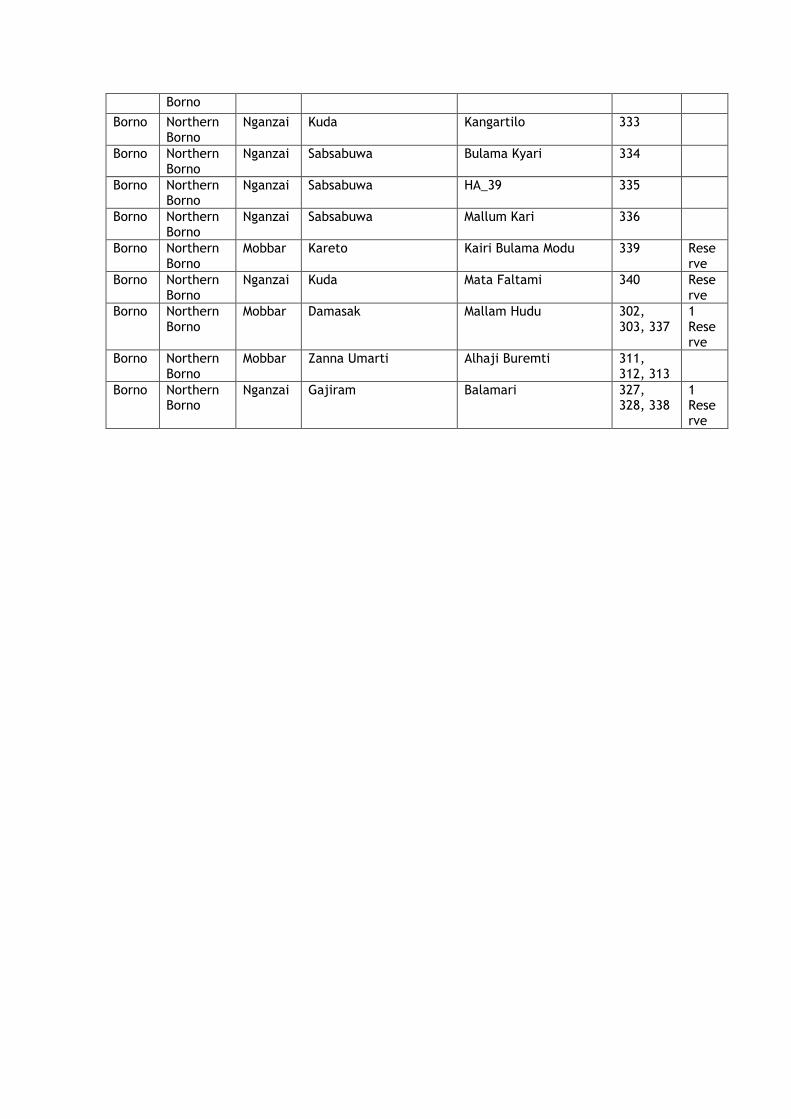
Borno
Borno Northern Borno
Nganzai Kuda Kangartilo 333
Borno Northern Borno
Nganzai Sabsabuwa Bulama Kyari 334
Borno Northern Borno
Nganzai Sabsabuwa HA_39 335
Borno Northern Borno
Nganzai Sabsabuwa Mallum Kari 336
Borno Northern Borno
Mobbar Kareto Kairi Bulama Modu 339 Reserve
Borno Northern Borno
Nganzai Kuda Mata Faltami 340 Reserve
Borno Northern Borno
Mobbar Damasak Mallam Hudu 302, 303, 337
1 Reserve
Borno Northern Borno
Mobbar Zanna Umarti Alhaji Buremti 311, 312, 313
Borno Northern Borno
Nganzai Gajiram Balamari 327, 328, 338
1 Reserve

Annex 7: Plausibility Checks Available as a separate file.
Related Documents