Louisiana State University Louisiana State University LSU Digital Commons LSU Digital Commons LSU Historical Dissertations and Theses Graduate School 1974 Effects of Varying Exercise Stress Upon Skin Temperature During Effects of Varying Exercise Stress Upon Skin Temperature During Exercise and Through Recovery. Exercise and Through Recovery. Richard John Smith Louisiana State University and Agricultural & Mechanical College Follow this and additional works at: https://digitalcommons.lsu.edu/gradschool_disstheses Recommended Citation Recommended Citation Smith, Richard John, "Effects of Varying Exercise Stress Upon Skin Temperature During Exercise and Through Recovery." (1974). LSU Historical Dissertations and Theses. 2765. https://digitalcommons.lsu.edu/gradschool_disstheses/2765 This Dissertation is brought to you for free and open access by the Graduate School at LSU Digital Commons. It has been accepted for inclusion in LSU Historical Dissertations and Theses by an authorized administrator of LSU Digital Commons. For more information, please contact [email protected].

Welcome message from author
This document is posted to help you gain knowledge. Please leave a comment to let me know what you think about it! Share it to your friends and learn new things together.
Transcript
Louisiana State University Louisiana State University
LSU Digital Commons LSU Digital Commons
LSU Historical Dissertations and Theses Graduate School
1974
Effects of Varying Exercise Stress Upon Skin Temperature During Effects of Varying Exercise Stress Upon Skin Temperature During
Exercise and Through Recovery. Exercise and Through Recovery.
Richard John Smith Louisiana State University and Agricultural & Mechanical College
Follow this and additional works at: https://digitalcommons.lsu.edu/gradschool_disstheses
Recommended Citation Recommended Citation Smith, Richard John, "Effects of Varying Exercise Stress Upon Skin Temperature During Exercise and Through Recovery." (1974). LSU Historical Dissertations and Theses. 2765. https://digitalcommons.lsu.edu/gradschool_disstheses/2765
This Dissertation is brought to you for free and open access by the Graduate School at LSU Digital Commons. It has been accepted for inclusion in LSU Historical Dissertations and Theses by an authorized administrator of LSU Digital Commons. For more information, please contact [email protected].

INFORMATION TO USERS
This material was produced from a microfilm copy of the original document. While the most advanced technological means to photograph and reproduce this document have been used, the quality is heavily dependent upon the quality of the original submitted.
The following explanation of techniques is provided to help you understand markings or patterns which may appear on this reproduction.
1.The sign or "target" for pages apparently lacking from the document photographed is "Missing Page(s)". If it was possible to obtain the missing page(s) or section, they are spliced into the film along with adjacent pages. This may have necessitated cutting thru an image and duplicating adjacent pages to insure you complete continuity.
2. When an image on the film is obliterated with a large round black mark, it is an indication that the photographer suspected that the copy may have moved during exposure and thus cause a blurred image. You will find a good image of the page in the adjacent frame.
3. When a map, drawing or chart, etc., was part of the material being photographed the photographer followed a definite method in "sectioning" the material. It is customary to begin photoing at the upper left hand corner of a large sheet and to continue photoing from left to right in equal sections with a small overlap. If necessary, sectioning is continued again — beginning below the first row and continuing on until complete.
4. The majority of users indicate that the textual content is of greatest value, however, a somewhat higher quality reproduction could be made from "photographs" if essential to the understanding of the dissertation. Silver prints of "photographs" may be ordered at additional charge by writing the Order Department, giving the catalog number, title, author and specific pages you wish reproduced.
5. PLEASE NOTE: Some pages may have indistinct print. Filmed as received.
Xerox University Microfilms300 North Zeeb RoadAnn Arbor, Michigan 48106
SMITH, Richard John, 1941- EFFECTS OF VARYING EXERCISE STRESS UPON SKIN TEMPERATURE DURING EXERCISE AND THROUGH RECOVERY.The Louisiana State University and Agricultural and Mechanical College, Ed.D., 1974 Education, physical
Xerox University Microfilms, Ann Arbor, Michigan 48ioe

EFFECTS OF VARYING EXERCISE STRESS UPON SKIN TEMPERATURE
DURING EXERCISE AND THROUGH RECOVERY
A Dissertation
Submitted to the Graduate Faculty of the Louisiana State University and
Agricultural and Mechanical College in partial fulfillment of the requirements for the degree of
Doctor of Education
in
The Department of Health, Physical, and Recreation Education
byRichard J. Smith
B.S., University of Southwestern Louisiana, 1963 M.Ed., Northwestern State University of Louisiana, 1968
December, 1974

Dedication:To my wife, Dianne, and
my children, Rick and Beth
ACKNOWLEDGEMENTS
The author wishes to express his deep appreciation to Dr.
Ralph E. Steben for his professional guidance and unending assistance
in the preparation of this investigation. For the assistance pro
vided by Dr. Jack K. Nelson in the statistical design of this study,
the author expresses his gratitude. The author would like to express
a special thank you to the students of Louisiana State University
who gave so freely of their time as participants in this investigation.
ii
TABLE OF CONTENTSPage
ACKNOWLEDGEMENTS ................................... . . . . . ±1
LIST OF TABLES .............................................. vi
LIST OF F I G U R E S .............................................. Vii
ABSTRACT......................................................... viii
CHAPTER
1. INTRODUCTION ......................................... 1
Statement of the P r o b l e m ...................... 5
Purpose of the S t u d y ............................... 5
Definition of Terms . ........................... 3
Delimitations of the Study ........................ 3
Limitations of the Study .................... 7
Significance of the Study ........................... 7
2. REVIEW OF RELATED LITERATURE ....................... 9
Literature Related to the History of Thermography . 9
Literature Related to the Physics of Thermography . 11
Literature Related to the Physiology of SkinTemperature........................................ 14
Literature Related to Medical Studies andApplications of Thermography .................... 1®
Literature Related to Exercise and SkinTemperature Studies ............................... 22
Summary of Related Literature ...................... 26
3. PROCEDURE FOR THE S T U D Y ............................. 29
Overview of P r o c e d u r e s ...................... 29
iii
PagePersonnel Required to Conduct the Study .............. 31
Selection of Subjects........... ..................... 31
Grouping of Subjects ................................. 31
Testing Apparatus . .................... . . . . . . . 32
Procedures for Measuring Skin Temperature and HeartRate Before, During, and After Treadmill Walk . . . 33
Pilot S t u d y ........................................... 36
Statistical A n a l y s i s ................................. 37
4. PRESENTATION AND ANALYSIS OF DATA ............... 39
Analysis of the Effects of Exercise Dynalevels Upon Skin Temperature Scores of Fitness Groups and Body Locations ......... . . . . . . . . 39
Analysis of the Recovery Times for Skin TemperatureScores Upon Fitness Groups and Body Locations . . . ^5
Regression Analysis of Skin Temperature Relationships Among Fitness Groups and Total Subject Population By Location During Exercise and Through Recovery. . 58
5. SUMMARY, FINDINGS, CONCLUSIONS, AND RECOMMENDATIONS . 63
Summary .............................................. 63
F i n d i n g s .............................................. 64
D i s c u s s i o n ............................................ 67
Conclusions............................................ 73
Recommendations ....................................... 73
BIBLIOGRAPHY ..................................................... 74
APPENDIXES ..................................................... 79
A Skin Temperature and Heart Rate Data S h e e t ........... 80
B Pictorial Description of Seven Anatomical LocationsStudied.. ........ ................................... 81
iv
Page
D
E
F
G
H
I
J
K
VITA
Analysis of Variance Tables and Intercept: PlotData Used in Regression Analyses of SkinTemperature Relationships in Fitness Groupsand Total Subject Population While AttainingFour Exercise Dynalevels . . . . . ....................
Analysis of Variance Tables and Intercept Plot D$ta Used in Regression Analyses of Skin Temperature Relationships in Fitness Groups and Total Subject Population While Recovering From Exercise ...........
Mean Data Used in Split-Plot Factorial Analysis of Variance Comparisons of Changes in Skin Temperature Among Fitness Groups During Four Exercise Dynalevels .
Mean Data Used in Split-Plot Factorial Analysis of Variance Comparisons of Changes in Skin Temperature Among Fitness Groups During Recovery from Exercise . .
Comparison of Skin Temperature Patterns of High and Low Fitness Groups from Rest Through Four Exercise Dynalevels at the Bicep Location . . . . . .
Comparison of Skin Temperature Patterns of High and Low Fitness Groups from Rest Through Four Exercise Dynalevels at the Rectus Femoris Location . .
Comparison of Skin Temperature Patterns of Highand Low Fitness Groups Through Thirty Minutesof Recovery From Exercise at the Head Location . . . .
Comparison of Skin Temperature Patterns of High and Low Fitness Groups from Rest Through Four Exercise Dynalevels at the Palm Location .............
Comparison of Skin Temperature Patterns of High and Low Fitness Groups Through Thirty Minutes of Recovery from Exercise at the Palm Location .........
82
87
97
99
102
103
104
105
106
107
v
I
LIST OF TABLES
Table Page
1 Analysis of Variance of Exercise Dynalevels andSkin Temperature Scores of High and Low FitnessGroups at Seven Body Locations.................. 41
2 Orthogonal Test for L i n e a r i t y ........................... 43
3 Honestly Significant Differences Resulting from TukeyTest Comparing Skin Temperature Changes by Body Locations as a Result of E x e r c i s e .............. 47
4 Analysis of Variance of Recovery Time upon SkinTemperature Scores of High and Low Fitness Groupsat Seven Body L o c a t i o n s ....................... 48
5 Orthogonal Test for L i n e a r i t y .................... 50
6 Honestly Significant Differences Resulting fromTukey Test Comparing Skin Temperature Changesfrom Body Location During Recovery from Exercise . . . 54
7 Honestly Significant Differences Resulting from TukeyTest Comparing Changes in Skin Temperature byFitness Groups and Body Locations During Recoveryfrom Exercise............................ 56
8 Regression Probability Levels of Skin TemperatureRelationships with Heart Rate in Fitness Groups and Total Population of Sixty Subjects During Exercise with Skin Temperature as a Dependent Variable . . . . 59
9 Regression Probability Levels of Skin TemperatureRelationships with Heart Rate and Time in Fitness Groups and Total Population of Sixty Subjects During Recovery from Exercise with Skin Temperature as a Dependent Variable..................... 61
vi
LIST OF FIGURES
Figure Page1 Mean Skin Temperature Experienced by Both Fitness
Groups at Rest and Through Four Dynalevels . . . . . . . 42
2 Mean Skin Temperature of High and Low Fitness Groupsat Rest and Through Four Dynalevels ............. 44
3 Mean Skin Temperature of Various Body Locations Experienced by Both Fitness Groups during Exercise . . . 46
4 Mean Skin Temperature of the Body Locations of Both Fitness Groups from Rest Through Four Dynalevels . . . . 49
5 Mean Skin Temperature Experienced by Both FitnessGroups Through Recovery from Exercise ................. 51
6 Mean Skin Temperature of High and Low Fitness GroupsDuring Recovery from Exercise .......................... 53
7 Mean Skin Temperature of Various Body Locations Experienced by Both Fitness Groups During Recoveryfrom Exercise .......................................... 55
8 Mean Skin Temperature Readings of Various Parts of the Body for High and Low Fitness Groups during Recoveryfrom E x e r c i s e ............................................ 57
vii
ABSTRACT
This study was conducted to determine whether variances in
physical fitness would cause differences in skin temperature patterns
during exercise and through a thirty minute recovery period. The
primary purpose was to determine if the skin temperature patterns
of high and low fitness groups would differ significantly during an
exercise load at four heart rate dynalevels and through recovery
from exercise. A secondary purpose was to determine whether a
specific body location could be found that would indicate radiometry
could be used to measure physical fitness.
Sixty male subjects were randomly selected to study the rela
tionships between heart rate and skin temperature induced by exercise
performed on a motor driven treadmill. High and low fitness groups
were separated for additional study to determine whether differences
and/or relationships were present due to the factor of fitness.
The subjects were classified by the amount of time necessary for the
heart rate to attain 180 beats per minute. Seven body locations
were studied: forehead, a point immediately inferior to the sternum,
belly of the left bicep, center of the left palm, tip of the left
thumb, belly of the left rectus femoris, and belly of the left
gastrocnemius.
Subjects were tested in a 72°F to 76°F environment by using a
Barnes radiometer and a cardio-tach to obtain skin temperature and
viii
heart rate. Resting skin temperature and heart rate measurements
were taken after a fifteen minute rest period and were continued
throughout the exercise phase as heart rates attained 120, 140, 160,
and 180 beats per minute. Monitoring for skin temperature and heart
rate were continued through the thirty minute recovery period at
three minute intervals.
A split-plot factorial analysis of variance was used to deter
mine whether differences existed in skin temperature changes at
seven body locations among high and low fit groups due to the effects
of exercise stress at various heart rates. An additional split-plot
factorial analysis of variance was used to determine what effects
recovery time had upon skin temperature changes experienced by high
and low fitness groups. Curvilinear regression equations were
employed to study the skin temperature and heart rate relationship
for fitness groups and the total subject population at the seven
body sites during exercise. This procedure was also used to study
the relationships between skin temperature and time, and skin
temperature and heart rate for both groups and the total subject
population at all seven body locations through thirty minutes of
recovery.
The results of this study showed that:
1. Low fit individuals experience lower skin temperature than
highly fit individuals as exercise increases to maximal levels.
2. Highly fit individuals experience higher skin temperatures
during recovery from exercise than low fit individuals.
ix

3. There is evidence that the fitness level of an individual
may be determined by measuring skin temperature at the center of
the palm.
x
CHAPTER 1
INTRODUCTION
Seeking answers to the unknown has brought man through the
ages to where he stands today. Man's present knowledge of technology
has enabled him to conquer many barriers, including those of space
travel. The technology and research programs of the United States
enabled this country to develop a life support system so sophisti
cated that one could journey through thousands of miles to the moon
in thermal conditioned comfort.^ Yet, researchers have not con
clusively solved the mystery of how the physiological makeup of man
allows him to function actively and maintain a static inner core
temperature.
Modern Science has been studying the effects of body temperature
since the seventeenth and eighteenth centuries when a few pioneer2physicians realized the values of such study. But, it remained for
the technicians of the twentieth century to offer researchers the
equipment necessary to analyze this basic body function. Based on
the knowledge that all objects emit infrared radiation, thermography
*J. C. Chato and others, "On the Dimensionless Parameters Associated with Heat Transfer within Living Tissue," Aerospace Medicine, XLI (April, 1970), 390.
^J. E, Schmidt, Medical Discoveries (Springfield: Charles C.Thomas, 1965), p. 448; J. Gershon-Cohen and others, "Medical Thermography: A Summary of Current Status," Radiologic Clinics of NorthAmerica, III (December, 1965), 403-31; C. Maxwell-Cade, "Principles and Practices of Clinical Thermography," Radiography, XXXIV (February, 1968), 23-34.
1
was developed to measure body temperature In a totally passive form.
Used initially for detection of enemy hiding under cover of darkness,
technology created an optics system that could provide a picture ofO
an object’s emitted rays.
When thermography was declassified by the military in 1956, it
was not long until researchers in medicine realized its possibilities.4In 1957, a Baird Evaporograph was used experimentally to detect breast
cancer. Although encouraged by the results, physicians realized that
technical limitations of the equipment were inherent, since the early
systems were not designed for medical, clinical, or research work.
However, second generation thermographs are now operational and
provide researchers with far superior instrumentation to study temp
erature unknowns in man.'*
The body of knowledge of skin temperature has increased rapidly
with contributions from the medical profession and a few exercise
physiologists. Since it is quite apparent that physicians are
interested in thermography to detect abnormalities in man, it is
left to the exercise physiologist to study the effects of activity
on skin temperature in the normal exercising man. Commonly referred
to as a virgin field even in medicine, the study of skin temperature
in the active man is practically non-existent.
Man’8 knowledge of the effects of exercise upon heart rate and
heart functions has been extensively documented in the literature
3Ibid.
^Ibid., R. N. Lawson, "Early Applications of Thermography,"Annals of the New York' Academy of Sciences, CXXI (October, 19.64), 31-33.
Gershon-Cohen, pp. 403-31.
gof exercise physiology. An area of interest in this literature is
the study of heart rate as a measure of cardiovascular fitness. In
general terms, fitness levels may be measured by taking the pulse of
one who has undergone a specific work load and with a mathematical
computation using the pulse rate place the individual into b fitness
level category. Through the development of various fitness tests
the physical education profession has made a valuable contribution
in the area of preventative medicine. In continuation of such
efforts, research in skin temperature may provide an additional
parameter to assess the physical fitness of an individual.
Five studies related to the effects of exercise on skin tempera
ture were found. One study showing the effects of exercise on the
relationship between heart rate and skin temperature was found.
Saltin et al.^ conducted a study of muscle temperature during
submaximal exercise in man. It was found that the quadriceps muscle
temperature of the four subjects studied increased during exercise
while the skin temperature decreased.g
Loiselle while studying various physiological parameters during
exercise, based upon one pre- and post-test measurement of skin
^Per Olof Astrand and Kaare Rodahl, Textbook of Work Physiology. (New York: McGraw-Hill, 1970), pp. 117-21, 147-73, 343-50; Laurence E. Morehouse and Augustus T. Miller, Jr., Physiology of Exercise, Fifth' Edition, (St. Louis: C. V. Mosby, 1967), pp. 97-104; Peter V.Karpovich and Wayne E. Sinning, Physiology of Muscular Activity,Seventh Edition, (Philadelphia: W. B. Saunders, 1971), pp. 202-11; Herbert A. de Vries, Physiology of Exercise, (Dubuque: W. C. Brown Company, 1966), pp. 72-79.
7B. Saltin and others, "Muscle Temperature During Submaximal Exer
cise in Man," Journal of Applied Physiology, XXV (December,1968),679-88.ODenis Loiselle, "The Effects of Varied Environments on Selected
Physiological Variables," (unpublished master's thesis, University of Alberta, 1966), pp. 14-54.
temperature, found a lower skin temperature directly over exercising
quadriceps muscle when compared with the average skin temperature of
twelve subjects.qIt was determined by Potanin e[t al. that the onset of angina
pectoris during exercise was associated with coolness at specific
sites of the chest and arms. This study stated that thermography
could evaluate and predict the onset of angina pectoris.
Lynch et a l . ^ used a thermograph recorder to study forearm
skin temperature in an attempt to measure forearm skin blood flow in
twelve subjects. While one arm remained static, the other was sub
jected to an isometric work load. This study concluded that there
was no difference in skin temperature between limbs after exercise.
Using twenty-four subjects to conduct a similar study with more 11controls, O ’Connell found a significant difference in skin tempera
ture in favor of the working arm.In attempting to shed light upon the mystery of exercise heart
12rate, Harris and Porter conducted a study to investigate the
QC. Pontanin and others, "Thermographic Patterns of Angina Pectoris," Circulation, XLII (August, 1970), 199-204.
^P. R. Lynch and others, "Results of Studies Using Two Radiological Methods in Investigating the Circulation of Exercising Human Arms," Journal of Physiology, CCXIII (March, 1971), 41P-42P.
**Eugene R. O’Connell, "The Effects of Local Isometric Muscular Activity on Local Skin Temperature," Journal for the Association for Physical and Mental Rehabilitation, XIV (May-June, 1960), 74-75.
12E. A. Harris and B. B. Porter, "On the Heart Rate During Exercise, Esophageal Temperature and the Oxygen Debt." Quarterly Journal of Experimental Physiology, XLIII (July, 1958), 313-19.
possible relationship between heart rate and chemical factors. The
researchers subjected one individual to a series of eight exercise
bouts while recording esophageal temperature, heart rate, and oxygen
debt. The results of this study led to the belief that a rising
deep body temperature may be responsible for cardiac acceleration
after five minutes of exercise in the steady state.
Statement of the Problem
This study was conducted to determine if levels of physical
fitness would cause differences in skin temperature patterns during
exercise stress and through a thirty minute recovery period.
Purpose of the Study
The primary purpose of the study was to determine if the skin
temperature patterns of high and low fitness groups would differ
significantly during exercise stress and through recovery from
exercise.
A secondary purpose was to study the skin temperature patterns
during exercise and through recovery of selected body locations to
determine if a specific site could be found to measure levels of
physical fitness.
Definition of Terms
Heart Rate. Heart rate was determined by the pulse count13obtained from an exercise cardio-tachometer.
Skin Temperature. The skin temperature was the radiant temp-14erature recorded by the Barnes Medical Thermometer on a target area
^Manufactured by the Quinton Instrument Company, Seattle, Wash.
■^Manufactured by the Barnes Engineering Company, Stamford, Connecticut.
one-tenth of an inch in diameter when the instrument's nose cone was
held one-quarter of an inch from the surface of the skin.
Radiometer. The Barnes Medical Thermometer was called a
radiometer.
Exercise Load. Exercise load was defined as work performed on
a treadmill, ^ set at four miles per hour with a twenty percent
grade, with pauses made long enough for a thirty second monitoring
period when the heart rate reached 120, 140, 160, and 180 beats per
minute.
Low and High Fit Subjects. The elapsed time that each of the
sixty subjects took to attain a heart rate of 180 beats per minute
was used for placement into either high or low fitness groups. The low
fitness group was comprised of the subjects with the shortest times
to attain 180 beats per minute; whereas, the high fitness group was
made up of those subjects that possessed the longest times to attain
a heart rate of 180 beats per minute.
Dynalevels. A dynalevel represents a relative heart rate at
tained by a subject while performing the exercise load on the tread
mill. These dynamic heart rate levels were 120, 140, 160 and 180
beats per minute.
Delimitations of the Study
The subjects selected for the study consisted of sixty under
graduate students enrolled at Louisiana State University, Baton Rouge
15Manufactured by the Quinton Instrument Company, Seattle, Washington.
Campus. The ages of the subjects ranged between 18 and 30 years.
Data were collected during the summer and fall semesters of 1973.
Testing sessions were limited to one period per subject. The
attainment of four dynalevels was determined by the visual display
counter of the cardio-tach and the monitoring time was limited to
thirty seconds. Testing was conducted between 3 - 7 P.M. daily to
control circadian rhythm differentials in skin temperature which
fluctuate readily throughout a twenty-four hour span.
Limitations of the Study
The subjects were requested to refrain from eating, drinking,
and smoking for at least four hours prior to testing. Vigorous
exercise was to be avoided on the testing day. It was not possible
to ensure that all sixty subjects abided by the requested guidelines.
To monitor the seven body locations during exercise it was
necessary to have the subject stop exercising for thirty seconds
at each dynalevel. This procedure caused the time for the subject's
heart rate to attain the final dynalevel to be greater than it
would normally require the subject to attain 180 beats per minute.
It was felt that motivational factors were kept to a minimum
since the treadmill exercise was largely submaximal and the subject
received a thirty second rest after attaining each dynalevel.f •Significance of the Study
A need for additional basic information regarding skin tempera
ture changes in normal individuals and those with physiological
abnormalities was expressed in the literature covering skin
16temperature research. This study was conducted to provide basic
information regarding Variables in skin temperature patterns between
highly fit and unfit individuals undergoing exercise stress. In
addition, this study was conducted to determine if a particular body
location could be used to detect variances in skin temperature to a
degree that may enable the determination of an individual's level
of fitness. Such monitorings of skin temperature either during or
after submaximal exercise would provide researchers and evaluators
of physical conditioning with a rapid means of determining physical
fitness.
James F. Connel, Jr., and others, "Thermography in Trauma," Annals of the New York Academy of Sciences, CXXI (October, 1964), 171-6; Travis Winsor and Jesus Bendezu, "Thermography and the Perif- eral Circulation." Annals of the New York Academy of Sciences,CXXI (October, 1964), 135-55; H. L. Karpman, "Current Status of Thermography," Angiology, XXI (February, 1970), 103-109.
CHAPTER 2
REVIEW OF RELATED LITERATURE
The review of literature studied in preparation for the
investigation covered: (a) information related to the history of
thermography; (b) readings related to the physics of thermography;
(c) studies covering the physiology of skin temperature; (d) recent
information related to medical studies and applications of thermo
graphy; and (e) studies related to exercise and skin temperature.
The chapter is concluded with a summary of the review.
Literature Related to the History of Thermography
In 1626 the first recorded clinical use of a thermometer'*' was
conducted by Santorius Sanctorius, an Italian physician. Gabriel
Fahrenheit, a German physicist, introduced the mercury thermometer
graduated into 180 degrees in 1714. The Swedish astronomer, Anders
Celsius invented the Centigrade thermometer in 1714. The modern
clinical thermometer was developed in 1817, by the English physician
Thomas Allbutt.2Thermography was actually an extension of thermometry. Sir
William Herschel, an eminent English astronomer, reported in 1800,
"̂J.E. Schmidt, Medical Discoveries, (Springfield: Charles C.Thomas, 1959), p. 448.
2J. Gershon-Cohen and others, "Medical Thermography: A Summaryof Current Status." Radiologic Clinics of North America, III (December, 1965), 404; C. Maxwell-Cade, "Principles and Practice of Clinical Thermography," Radiography, XXXIV (February, 1968), 23-24.
9
10His observation of certain rays beyond the red end of the visible
spectrum. Herschel named these rays, "Infrared." This finding was
noted with little Interest and lay dormant until Sir John Herschel,
his son, rendered the infrared spectrum visible by developing crude
pictures termed "thermographs." Sir John Herschel's work was also
largely ignored until 1929, when Czerny expanded and improved the
thermographic process and named it "evapography." At approximately
the same time as Sir John Herschel's work, Becquerel discovered that
infrared radiation would stimulate phosphorescent afterglows which
could be excited in certain minerals by visible or ultraviolet
light.3In 1949, Urbach, Nail, and Pearlman presented two methods of
fluorescence thermography based upon Becquerel's studies. The
first, Contact Thermography, involved direct contact of phosphors
with the object to be examined. The second, Projection Thermography,
involved optical projection of heat radiation from the object onto
a phosphorescent screen.4The use of heat radiation to see in darkness and through
camouflage was of interest to the military in the United States,
England, and Russia. The United States military establishment
became interested in infrared emissions as early as 1919, when
Hoffman published a paper on the "Detection of Invisible Objects by
Heat Radiation.""5 By 1932, the U.S. Signal Corps Engineering
3Ibid., p. 23.4Ibid., pp. 23-24.
3R. N. Lawson, "Early Applications of Thermography," Annals of the New York Academy of Sciences, CXXI (October, 1964), 31.
11Laboratories were studying the effects of infrared emissions. How
ever, between 1932 and 1956 when the Baird Evapograph was declassi
fied, military applications related to infrared emissions were highly
classified. Access to a Barnes thermographic scanner was obtained
by Lawson for medical application studies in 1957.
The American Thermographic Society was formed in June of 1967,
with ten members. By June of 1968, the registration in the societyg
had increased to over fifty members.
Literature Related to the Physics
of Thermography
Four physical processes by which heat is released from the
body were reviewed: convection, evaporation, conduction, and
radiation.
Convection7Convection is described as a transfer of heat through a moving
fluid. When a body surface is warmer than the environmental air
temperature, heat will flow from the body to the surrounding air.
As the air becomes heated it will rise and be replaced by cooler
air. Because of this flow, cooler air moves continuously upward to
the body surface, becoming warmed by the heat convected and then
^H. L. Karpman, "Current Status of Thermography," Angiology,XXI (February, 1970), 106.
^Theodore C. Ruch and Harry D. Patton, Eds. Physiology and Biophysics» Nineteenth Edition, (Philadelphia: W. B. Saunders,1965), 1052.
12
flow away. Heat loss as a result of convection depends upon the
existence of a temperature gradient between the body surface and
ambient air. If the surface and air are the same temperature, there
Is no convective heat transfer. The gradient can be altered In
either direction providing an increase or decrease in surface tempera
ture.
Evaporation
The total evaporative heat loss from transcutaneous diffusion
and respiratory ventilation is minor for an individual resting ing
a cool thermal environment. About fifteen percent of the total
heat loss is known as "insensible perspiration." In a warm environ
ment evaporation becomes the dominant factor in heat exchange
because the active secretion of sweat greatly increases the water
availability for evaporation at the surface of the body.
Conduction
Conduction depicts a loss or increase in surface temperature
due to physical contact of the body with some environmental object.
It was pointed out that in any material, heat tended to flow down
a temperature gradient by transfer of thermal energy between adja
cent atoms. It is known that the tissues of the body are not very
good heat conductors. Thus, if the heat exchange within the body
was conductive, large internal temperature gradients would be
necessary to conduct metabolic heat flow from the body. Therefore,
convective heat transfer was reported as the major means of
8Ibid., pp. 1052-55.
13
transferring internal heat through the body to the exterior 9environment.
Radiation
Various physiologists have shown that heat loss from the body
surface via radiation may be accurately measured by the use of
thermography.*^ The skin surface was found to be a nearly perfect
absorber and emitter of infrared energy.*'*' For the physical pur
poses of studying infrared emissions, a single number was assigned
to describe the qualities of an. object to absorb or emit infrared
energy. Hence, something with an emissivity of 1, the ideal "black
body", absorbs all the energy incident upon it and emits the12maximum amount consistent with its temperature.
13Several physiologists have shown that human skin is a nearly
perfect absorber and emitter of infrared energy with an accepted
9Ibid.
*^Gershon-Cohen, pp. 404-5; Maxwell-Cade, pp. 23-24; R.B. Barnes, "Thermography," Annals of the New York Academy of Sciences, CXXI (October, 1964), 34-47; E. E. Brueschke, "Infrared Thermoprofile Analysis in Clinical Medicine," American Journal of Medical Electronics. IV (ND, 1965), 65; J. W. H. Mali, "Some Physiological Aspects of the Temperature of the Body Surface," Proceedings of a Boerhaave Course for Postgraduate Medical Education, 1969, 1-16.
**Gershon-Cohen, pp. 404-5.12Ruch and Patton, p. 1053.13R. B. Barnes, "Determination of Body Temperature in Infrared
Emission," Journal of Applied Physiology, XXII (June, 1967), 1143-6;D. J. Watmough and R. Oliver, "Emissivity of Human Skin in Vivo Between 2.0 y and 5.4pMeasured at Normal Incidence," Nature, CCXVIII (June, 1968), 886; Maxwell-Cade, pp. 23-24; D. Mitchell and others, "Emissivity and Transmittance of Excised Human Skin in Its Thermal Emission Wave Band," Journal of Applied Physiology, XXIII (September, 1967), 390-3.
14emissivity of 0.989. This level of emitted radiation is not affected
by skin color.
The theoretical operation of obtaining skin temperature measures14through the use of radiometry was presented by Karpman. The author
states that the infrared emissions given off by the human body have
radiant energy which can be collected optically, transformed into
electronic impulses, amplified, synthesized, and presented in a final
thermal image.
Literature Related to the Physiology
of Skin Temperature
Physiology of Skin Temperature
Chato et al.̂ ~* studied the physical and physiological parameters
associated with heat transport within living tissue. The purpose of
the study was to analyze the thermal behavior of living humans. The
skin surface area, depth of tissue, thermal conductivity, density,
and specific heats were considered part of the physical parameters;
whereas total metabolic rate, heat generation per unit volume in
living tissue and the blood perfusion rate per unit volume were con
sidered physiological parameters.
Using a model of 63 kilogram adult male with a mean arterial
blood pressure of 90 mm Hg and a total metabolic rate of 85 watts,
Chato et]t al., through mathematical computations, concluded that the
^Karpman, "Current Status of Thermography," p. 103.
^ J . C. Chato and others, "On the Dimensionless Parameters Associated with Heat Transport within Living Tissue." Aerospace Medicine. XLI (April, 1970), 390-3.
15maximum body temperature can occur in the muscle tissue and is depen
dent upon perfusion rate. Occurrence of a maximum temperature in the
tissue would be directly related to the inclusion of blood flow
"since all heat generated in the body is assumed to be removed at the
skin, both heat flowing toward the inner core and heat generated in16the inner core must be transported by blood toward the skin."
Chapman and Mitchell^ believed that the blood flow to the muscle
is increased during exercise. The flow to the skin may also be in
creased, either because of an increasing body temperature or by heat
ing the skin by underlying exercising muscles.18The results of a study conducted by Saltin al. appear to
refute writings of Chapman and Mitchell regarding changes in skin
temperature during exercise. Saltin et̂ al. while working with four
subjects showed that skin temperature decreased during exercise.19Best and Taylor's writings on medical physiology included their
opinions on body heat. These authors stipulated that the rate of
blood flow through the skin is the principle regulator in determining
heat loss from the body. This view was also found in the writings
16Ibid., p. 392.
"^Carleton B. Chapman and Jere H. Mitchell, The Physiology of Exercise, (New York: Scientific American, 1965), 1-72.
18B. Saltin and others, "Muscle Temeprature during Submaximal Exercise in Man," Journal of Applied Physiology, XXV (December, 1968) 679-88.
^Charles H. Best and Normal B. Taylor, Eds., The Physiological Basis of Medical Practice, Seventh Edition, (Baltimore: Williamsand Wilkinson Company, 1961), 884.
1620of other physiologists.
21Fan jat al., while reviewing mathematical models of the human
thermal system, pointed out that heat generated by metabolic reactions
inside the body is either stored within the body or transferred to the
skin surface by two means: conduction through bones, tissues, fat,
and the skin; and by convection accomplished through blood circulation.22This point was also supported by Mali.
23Astrand and Rodahl have written that blood possesses a high
heat capacity and is capable of carrying large amounts of heat with
just a moderate increase in temperature.24Abramson has stipulated that the skin of both the palm and
plantar surface of the foot are primarily sites of heat loss from
the body through convective transfer of the high blood flow within
these two anatomical sites.
20J. D. Hardy, "Physiology of Temperature Regulation," Physiological Reviews, XLI (July, 1961), 521-606; Lawrence M. Baker and William M. Taylor, "The Relationship under Stress between Changes in Skin Temperature, Electrical Skin Resistance, and Pulse Rate,"Journal of Experimental Psychology, XLVIII (May, 1954), 361-66; R. B. Barnes, "Determination of Body Temperature in Infrared Emission," Journal of Applied Physiology. XXII (June, 1967), 1143-6; W. J. B. M. van der Staak, "Experiences with the Heated Thermocouple," Dermatologlca Basel. CXXXII (ND, 1966), 192-205; Chato and others, pp. 390-3.
21Liang-Tseng Fan and others, "A Review on Mathematical Models of the Human Thermal System" Bio-Medical Engineering, XVIII (May, 1971), 218-234.
22Mali, pp 8-16.23Per Olof Astrand and Kaare Rodahl, Textbook of Work Physiology,
(New York: McGraw-Hill Book Company, 1970), 492.O /
David I. Abramson, Circulation in the Extremities, (New York, Academic Press, 1967), 240.
17Abramson, Allen and Baker stated that variation In relative
humidity has little effect on heat loss from the body at normal room25temperature.
Smith and Mansfield et al. have presented evidence of the exis
tence of circadian rhythms In body temperatures which fluctuate2greadily throughout a twenty-four hour period.
27Gershon-Cohen £t _al. mentioned that heat losses due to sweat
ing would not occur below 30°C. In their opinion heat losses below
this temperature were due to radiation and convection.
Procedural Techniques in the Use of Thermography28Gershon-Cohen et al., in reviewing accepted techniques in the
use of thermography, emphasized that although the internal temperature
of the human body remains essentially unchanged at 37°C, the skin
temperature may fluctuate widely due to many factors. These were
reported as "structural abnormalities of vessels, abnormalities of
vascular control, local effects on vessels from systemic reactions,
changes in thermal conductivity of the tissues, and increased heat
production in the tissues."
25Ibid., Edgar Allen and Hines Baker, Pheripheral Vascular Disease, (Philadelphia: W. B. Sanders, 1947), p. 102.
26R. E. Smith, "Circadian Variations in Human Thermoregulatory Responses." Journal of Applied Physiology. XXVI (May, 1969), 557;C. M. Mansfield and others, "A Comparison of the Temperature Curves Recorded over Normal and Abnormal Breasts," Radiology, XCIV (March, 1970), 697.
27Gershon-Cohen, pp. 411-12.
28Ibid., pp. 405-411.
18In outlining the preliminary procedures involved in taking skin
temperature measurements various writers emphasized that the body
should be exposed nude for ten to fifteen minutes in a controlled
ambient temperature of 65-75°F. A rest period is necessary to ensure
that skin temperature will come into equilibrium with the ambient air29and maximize the display of temperature differences.
30Roth e£ al., summarized by Allen and Baker, showed that changes
in posture influenced skin temperature of the extremities. This state
ment was based upon the observation that skin temperature of the toes
and fingers decreased when the extremities were elevated and increased
when lowered.31Mali observed that small changes in the radiating surface
caused by small movements can have effects upon skin temperature, as
does the geometrical location and distance to the surrounding walls
and solid structures.
Literature Related to Medical Studies
and Applications of Thermography
Initial medical interest in thermography began in 1957, when
researchers determined that breast carcinoma could be detected by 32thermography.
29Barnes, "Thermography," p. 45; Gershon-Cohen, pp. 411-12; H.L. Karpman and others, "Clinical Status in Thermography. II. Applications of Thermography in Evaluating Musculoligamentous Injuries of the Spine — A Preliminary Report," Archives of Environmental Health, XX (March, 1970), 413.
anAllen and Baker, p. 102.31Mali, pp. 11-19.3^K. Lloyd Williams, "Infrared Thermometry as a Tool in Medical
Research," Annals of the New York Academy of Sciences, CXXI (October, 1964), 100; BruescEIce, p. 65.
1933In 1965, Gershon-Cohen et.al. . presented skin temperature
data of thermagraphic findings of one hundred cases of cancer in 464
patients screened for breast pathology. Of the 464 patients, 214
normal patients evidenced bilateral symmetry. Four of the 100 who
were diagnosed as having breast cancer had less than 1°C difference
between symmetrical sites and the remaining 96 patients' readings
indicated asymmetry greater than 1°C.
Clinical observations conducted in 1968, showed evidence of
breast asymmetry up to 4°C occurring without pathological signifi
cance. This was apparently due to the differences in many women
whose breasts differ in vascularity as well as size. However, dis
tinct differences were noted in patterns found between asymmetry due34to tumor or absess or to differences in vascularity.
35Mansfield et al. conducted a study in 1970, which compared
Farenheit temperature curves recorded over normal and abnormal breasts
during a twenty-four hour period. The two normal cases studied dis
played bilaterally symmetrical readings throughout the twenty-four
hour period. Three patients harboring malignancies produced asym
metrical readings with the cancerous breast always several degrees
higher during the twenty-four hour period.
32K. Lloyd Williams, "Infrared Thermometry as a Tool in Medical Research." Annals of the New York Academy of Sciences, CXXI (October, 1964), 100; Brueschke, p. 65.
33Gershon-Cohen, p. 417.
^^Maxwell-Cade, p. 28.
^Mansfield, pp. 697-8.
2036Connell et al. presented preliminary information regarding
the use of the Barnes Thermograph and a radiometer in studying
various trauma situations. These investigators studied burn patients,
surgical wounds, traumatic wounds, sprains, and traumatic arthritis.
The opinions of the investigating team were enthusiastic over the
potential of thermography and radiometry for the medical profession.37Winsor and Bendezu, also utilizing the Barnes Thermograph
and radiometer, presented a study to show some of the applications of
thermography in the study of peripheral circulation. Some of the
areas included thrombophlebites, arteriosclerosis, Raynauld’s disease,
trauma to the extremities, and smoking and circulation. The investi
gators believed that the future of thermography appears unlimited
and encouraged studies of circulation as well as other areas.
Thermography also has been used to diagnose carotid arterial 38disease. Price indicated that findings of abnormality in thermo
graphic measurements were highly significant with respect to the
presence of carotid occlusive vascular disease.
36James F. Connel, Jr., and others, "Thermography in Trauma," Annals of the New York Academy of Sciences. CXXI (October, 1964), 171-6.
37Travis Winsor and Jesus Bendezu, "Thermography and the Periferal Circulation," Annals of the New York Academy of Sciences, CXXI (October, 1964), 135-55.
38Thomas R. Price and others, "Correlation of Thermography and Angiography in Carotid Arterial Disease: Thermographic Measurements as a Screening Technique," Neurology, XX (April, 1970), 398.
21The use of thermography and radiometry also hps been utilized
In studying the unknowns of Hansen's disease and related areas of39associated trauma.
Advantages In using a Barnes radiometer were reported In a new
clinical procedure used in detecting varicose veins and venous insuf- 40ficiency. Prior to the use of radiometry, approximately fifty
skin temperature readings were made with a thermistor thermometer
in a time consuming procedure. The use of radiometry greatly faci
litated the time involved in the preparation and monitoring of the
patients. The writers believed that their reported technique ap
peared sufficiently simple and reliable for routine clinical work.41Albert et al. published a preliminary report on the uses of
thermography in various spheres of orthopedics. Brief case studies
were reported with corresponding pictorial thermographic presenta
tions of: trauma, degenerative disc disease, avascular necrosis of
bone, neoplastic lesions, and inflammatory aberrations in bone and
soft tissues.
Additional areas of medicine are presently under investigation
utilizing thermography: placental location, early detection of
OQThomas D. Sabin, "Temperature-linked Sensory Loss," Archives
of Neurology, XX (March, 1960), 257-62; D. Ray Collins, "A Comparison of the 'Slipper-Sock' Footprint Test and the Harris Footprint Test as Possible Indices for Prediction of Skin Temperature Changes of the Feet," A paper read at the Social Rehabilitation Service Research Staff Meeting at the U.S. Public Health Hospital, Carville, Louisiana, April 13, 1971.
^Norman Rosenberg and Anastassios Stefanides, "Thermography in the Management of Veins and Venous Insufficiency." Annals of the New York Academy of Sciences, CXXI (October, 1964), 113-17.
^*S. M. Albert and others, "Thermography in Orthopedics,"Annals of the New York Academy of Sciences, CXXI (October, 1964), 157— 70.
22
pregnancy, industrial and occupational medicine, rheumatism and42arthritis, and urology.
Literature Related to Exercise and
Skin Temperature Studies
Previous observations of angina pectoris, and the suggestion
that regional vasoconstriction does occur during pain of angina,43prompted Potanin, et al., to use liquid crystals as skin tempera
ture sensors in studying fifty male patients with past history of
angina pectoris. The patients were exercised on a treadmill to
induce angina pectoris. Of the fifty subjects, 28 remained free of
pain and their thoracic thermograms were unchanged in pre-and post
test measurements. The investigators noted that 22 patients deve
loped angina pectoris during exercise; 21 had associated ST depres
sion in the electrocardiogram and 17 abnormal thermographic profiles.
In 9 patients, where the pain was unilateral, skin coolness was
localized in the area of pain. Skin coolness was not within the
area of pain in 8 of 13 patients whose pain was central. Upon
relief of pain, skin temperature returned to normal. The authors
believed that thermography has potential as an objective method of
assessing the presence of angina pectoris. Furthermore, it may be
come possible to anticipate the onset of angina.
^Gershon-Choen, p. 431; Karpman, "Current Status of Thermography," pp. 103-9.
^ C . Potanin and others, "Thermographic Patterns of Angina Pectoris." Circulation, XLIII (August, 1970), 199-204.
2344Saltin et al. conducted a study of muscle temperature during
submaximal exercise in man. Four subjects with maximal oxygen up
take levels ranging from 3.87 to 5.17 liters per minute were sub
jected to a two week training program. The subjects trained on a
bicycle ergometer for one to two hours every day. Quadriceps muscle
temperature was measured by thermocouples inside Teflon catheters
six centimeters deep and by needle probes which were used only during
short rest periods. The Teflon catheters were inserted in the lateral
portion of the quadriceps muscle about fifteen centimeters above the
patella. Skin temperatures were measured during rest and exercise at
approximately five minute intervals at ten locations: the hand,
forearm, upper arm, cheek, upper back, lower back, chest, abdomen,
thigh, and calf. An infrared radiometer was used to measure skin
temperature.
Pedal frequency of a bicycle ergometer was kept at fifty
revolutions per minute by use of a metronome. All subjects performed
in ambient temperatures of 10, 20, and 30°C. The resting measurements
were taken five minutes after the subject entered the test chamber.
The subjects also performed at submaximal work loads of 25, 50, and
70 percent of their maximal oxygen uptake. The authors reported
the following results: both legs evidenced bilaterally symmetrical
skin temperatures; resting muscle temperatures were generally lower
than rectal temperature; exercise skin temperature gradually dropped
approximately 2°c during the first ten minutes of exercise and
44Saltin, pp. 679-88.
24
remained rather constant thereafter; and average skin temperature
during exercise was usually 1°C lower than over the active thigh
muscles.45Lynch et. al. used a thermographic recorder to study forearm
skin temperatures in an attempt to measure forearm skin blood flow.
Thermograms of twelve subjects were recorded, with one hand main
taining a ten percent maximum voluntary contraction on a handgrip
ergometer while the other hand performed no work. The thermograms
ranged from 33°C to 36°C. In two subjects the exercising arm was
1°C warmer, in four subjects the arm was about 1°C cooler. There were
no differences among the remaining subjects. The authors concluded (hat
exercise had no major consistent effect on blood flow in the over-
lying skin. The procedures used provided no rest period and the
authors stated that all twelve subjects had worked for "some hours"
before participating in the experiment.
O ’Connell^ found that the effects of local isometric muscular
activity of the forearm flexor muscles caused a significant increase
in skin temperature. With twenty-four subjects and the left arm
serving as a control, thirty maximal contractions of the right
forearm flexor muscles were performed for a one minute period on
two different occasions. Skin temperatures made over the belly of
the biceps muscle by a thermistor thermometer were recorded before
^ P . R. Lynch and others, "Results of Studies using Two Radio- logocal Methods in Investigating the Circulation of Exercising Human Arms." Journal of Physiology. CCXIII (March, 1971), 41P-42P.
^Eugene R. O ’Connell, "The Effect of Local Isometric Muscular Activity on Local Skin Temperature," Journal for the Association for Physical and Mental Rehabilitation, XIV (May-June, 1960), 74-75.
25exercise and three minutes afterwards. In each o f ,the two sessions
it was found that both arms increased in skin temperature with the
increase in the right arm significantly higher.47Loiselle studied the effects of varied thermal environments
on several selected physiological parameters, including skin tempera
ture, upon twelve subjects exercising on a bicycle ergometer. Skin
temperature of the quadreceps femoris was compared with the average
skin temperature of six other anatomical points on the body. Copper
constantan thermocouples were used to record skin temperature data
between the fifth and sixth minute of exercise. The investigator
concluded: skin temperature overlying active muscles was lower than
the average temperature; skin temperature Increased with humidity;
and skin temperature increased with higher humidity and temperature.
In an attempt to determine how heart rate increases during48exercise, Harris and Porter designed a study to investigate the
possible relationship between heart rate and body chemical factors.
The investigators considered it necessary to monitor temperature
changes, heart rate, alveolar CO^ tension, and esophageal tempera
ture. Data were collected on a single subject performing ten
minute bouts on a treadmill set at three and four miles per hour at
zero percent grade. The subject performed at gradients of 2.5, 5.0,
7.5, 10.0, 12.5 and 15.0 percent while the speed on the treadmill
^Denis Loiselle, "The Effects of Varied Thermal Environments on Selected Physiological Variables," Microcarded Master's thesis, University of Alberta, 1966, pp. 14-54.
*8E. A. Harris and B. B. Porter, "On the Heart Rate during Exercise, Esophageal Temperature and the Oxygen Debt," Quarterly Journal of Experimental PhysioloRy, XLIII (July, 1958), 313-19.
26
was set at four miles per hour. After each exercise the subject
rested for twenty minutes. Temperature measurements were made with
a copper constantan thermocouple located in the esophagus immediately
behind the left atrium. Heart rate was measured with a cardio-tach.
The authors were uncertain whether this arrangement gave a true
measure of the left atrial temperature, but concluded that a rising
deep body temperature after five minutes of exercise in the steady
state may be responsible for cardiac acceleration.
Summary of Related Literature
The history of thermography dates from the first clinical use
of a thermometer in 1626, to present day applications in every phaseAQof medicine. Interest in infrared radiation was stimulated by
the military during the first part of this century. When the military
declassified the Baird Evapograph in 1956, researchers in medicine
began applying the infrared theory to detect breast cancer.
The four ways that heat is dissipated from the body were
reviewed.
The theoretical operation of thermography was reviewed. The
literature indicated that rays emitted via radiation from the body
AQ Schmidt, p. 448.
■^Gershon-Cohen, pp. 403-31; Maxwell-Cade, pp. 23-34; Lawson, pp. 31-33.
■^Barries, "Thermography," pp. 34-47; Mitchell, pp. 390-3; Ruch and Patton, p. 1052; Gershon-Cohen, pp. 404-5.
27
could be collected optically, transformed into electronic impulses,52amplified, synthesized, and presented in a final thermal image.
The literature presented many studies relating to skin tempera
ture physiology. It was postulated that maximum body temperature
can occur in the muscle and is dependent upon blood profusion rate53and this heat is transported by the blood toward the skin. A pro
posed theory, which hypothesized an increase in skin temperature
during exercise, was in contrast with results of a controlled experi-54ment measuring skin temperature during exercise. There was evi
dence of a circadian rhythm in variations of skin temperature55measured during a twenty-four hour period.
Literature relating to techniques in the use of thermographic56equipment was reported. To ensure proper results in skin tempera
ture monitoring, the following suggestions were presented: subjects
should be exposed from ten to fifteen minutes in an ambient tempera
ture ranging from 65-75°F; body movement should be kept to a minimum;
changes in body posture should be minimized; subjects should refrain
from smoking and eating for at least three hours; and subjects should
avoid strenuous exercise prior to experimental study.
The medical profession used thermography to study skin tempera
ture variations in patients afflicted with various physiological
i■^Karpman, "Current Status of Thermography," p. 103-9.53Chato, pp. 390-3; Best and Taylor, p. 884; Hardy, pp. 521-601;
Baker and Taylor, pp. 361-6.
■^Chapman, p. 1-72; Saltin, pp. 679-88.
33Smith, p. 557; Mansfield, p. 697.56Mali, pp. 11-19; Barnes, "Thermography," p. 45; Karpman,
"Clinical Studies in Thermography...," p. 413; Gershon-Cohen, p. 404.
abnormalities. Samples of these were: breast cancer, burns,
surgical wounds, traumatic diseases, arteriosclerosis, various
vascular diseases, orthopedics, Hansen's disease, placental location,57urology, and industrial and occupational medicine.
The exact effects of exercise upon skin temperature remains
questionable. Of four studies reviewed relating to the effect of
exercise upon skin temperature, three concluded there was a drop58in skin temperature while one indicated that there was no dif
ference.^
Williams, p. 100; Gershon-Cohen, p. 417; Maxwell-Cade, p. 28; Mansfield, pp. 697-8; Brueschke, p. 65; Connel, pp. 171-6; Winsor, pp. 135-55; Rosenberg, pp. 113-17; Albert, pp. 157-70; Sabin, pp. 257-62; Karpman, "Current Status of Thermography," pp. 103-9.
"^Saltin, pp. 679-88; O'Connell, pp. 74-75; Loiselle, pp. 14-54.
Lynch, pp. 41P-42P.
CHAPTER 3
PROCEDURE FOR THE STUDY
Overview of Procedures
Sixty subjects were used to study the relationships between
heart rate and skin temperature induced by exercise dynalevels per
formed on a motor driven treadmill. High and low fitness groups
were derived for additional study to determine whether selected
differences and/or relationships were present due to the factor of
fitness. The relationships under investigation dealt with measure
ments of heart rate and skin temperature prior, during, and after
a walk on a treadmill at four miles per hour at a twenty percent
incline. Seven anatomical sites located along the frontal plane
and left side of the body were selected for skin temperature measure
ment. Since the literature substantiated that bilateral symmetry^
existed in normal man, monitoring of both sides of the body was not
necessary. This monitoring procedure allowed the investigator to
increase the scope of the study by selecting more anatomical sites
while keeping the monitoring time to a minimum of thirty seconds.
During the laboratory testing period the electrodes of the
cardio-tach were attached to the chest and sternum area of the
■'"Normal F. Boas, "Thermography in Rheumatoid Arthritis," Annals of the New York Academy of Sciences, CXXI (October, 1964), 223-34;C. M. Mansfield and others, "A Comparison of the Temperature Curves Recorded over Normal and Abnormal Breasts," Radiology, XLIV (March, 1970), 897-8; B. Saltin and others, "Muscle Temperature during Submaximal Exercise in Man," Journal of Applied Physiology, XXV (December, 1968), 697-88.
29
30subject's body. The seven anatomical sites for radiometer monitoring
were marked with a felt pen. The subject was then seated for a fif
teen minute rest period. The resting heart rate was recorded along
with the seven resting skin temperature measurements. The subject
began walking on the treadmill and when the heart rate attained
120, 140, 160, and 180 beats per minute, the subject stopped exer
cising long enough to be monitored.
After the last monitoring period, the subject was seated to
undergo a thirty minute rest period. The subject was advised to be
as still as possible. At three minute intervals heart rate and skin
temperature measurements were monitored and recorded. Upon com
pletion of the tenth measuring period, the subject was excused.
A split-plot factorial analysis of variance was used to deter
mine whether differences existed in skin temperature changes at
seven body locations among high and low fitness groups due to the
effects of exercise stress at various heart rates. An additional
split-plot factorial analysis of variance was used to find out what
effects recovery time had upon skin temperature changes experienced
by high and low fitness groups. Curvilinear regression equations
were employed to study the skin temperature and heart rate relation
ship for fitness groups and the total subject population at the seven
body sites during exercise. Curvilinear regression equations were
used to study the relationships between skin temperature and time
and skin temperature and heart rate for both groups and the total
subject population at all seven body locations through thirty
minutes of recovery.
Personnel Required to Conduct the Study
31
One lab assistant was employed to assist with collection of skin
temperature and heart rate data. The assistant was thoroughly indoc
trinated in the procedures developed to collect the data and was
responsible for time monitoring and data recording. The author was
responsible for the skin temperature monitorings which were conducted
in accordance with the procedures recommended by the Barnes Manufactur
ing Company.
Selection of Subjects
Sixty male subjects were selected to participate in this study.
The ages of the subjects fell within a range of eighteen to thirty
years. The subjects were selected from the general university
population in attendance during the summer and fall sessions of 1973,
at Louisiana State University, Baton Rouge, Louisiana. The investigator
personally met with the students and sought volunteers to participate
in the study.
Grouping of Subjects
During several of the statistical analyses fifteen subjects
classified as high fit and fifteen as low fit were separated for
additional study. The criterion for measuring the high and low
fitness levels within the sixty subject sample was the amount of
time necessary for the heart rate of a subject to attain 180 beats
per minute. The subjects with the lowest times (2:22-4:38 minutes)
were placed in the low category and those with the longest times
(8:00-15:12 minutes) comprised the high group.
32
Testing Apparatus
Stop Watch. One stop watch was used for time measurements
before, during, and after exercise performed on the treadmill.
Radiometer. The Barnes Model MT-3 Medical Thermometer was
used to measure the skin temperature of the seven body locations
selected for investigation. The radiometer has a response time of
2 seconds in the slow response mode and .2 seconds in the fast mode.
The sensitivity of the instrument has been determined to be .1°C
in the slow and .25°C in the fast mode. Throughout this study the
fast response mode was used. The radiometer has the capacity of
providing either Fahrenheit or Centigrade readings with a tempera
ture range of 20 to 40°C or 65 to 105°F. The Centigrade scale
was used during this study in keeping with previous studies of this
nature. The recommended field of view was stated to be .1 inch at
.25 inches from the nose cone to the skin surface. Physical contact
was not necessary and the radiometer did not influence the actual
skin temperature of a subject at the time of measurement.
The radiometer consisted of two basic components: the sensing
head which houses the radiation collecting mechanisms and a signal
preamplifier; and the electronics console which consists of the
readout system and power supply. The operating manual suggested
that the radiometer should be operational for approximately thirty
minutes before data collecting if maximum reliability is desired.
Treadmill. A Quinton treadmill, Model 18-49C, was used as the
exercise inducing instrument in this study. The treadmill could
provide speeds between one and ten miles per hour and elevations from
zero to forty percent.
33
Cardio-tach. Model QI-609 Exercise Cardio-tachometer was
designed to obtain accurate heart rate measurements during vigorous
exercise. The cardio-tach has two components. The isolation pre
amplifier provided shielded leads that attached to the body and were
driven by two nine volt batteries. The preamplifier was coupled to
the main display panel by a standard phone plug. The second com
ponent consisted of the control and display unit. This unit provided
instantaneous or twenty second averaging of heart rate data.
Voltmeter. A voltmeter was used to test the voltage levels of
the two batteries used on the isolation preamplifier. The proper
functioning of the cardio-tach depended upon a voltage of no less
than 8.4 volts per battery.
Thermometer. An indoor thermometer was placed within the testing
area to ensure that the room temperature was maintained within a
range of 72 to 76°F.
Resting Chair. The resting chair used was a standard wood
office chair with a padded back. During monitoring periods the sub
ject's arms were allowed to hang down along side of the body in a
relaxed manner.
Procedures for Measuring Skin Temperature and Heart Rate
Before, During, and After Treadmill Walk
Procedures Employed Before the Treadmill Walk
The following procedures were used to collect data prior to
the beginning of exercise:
1. Each day before the first subject reported to the labora
tory, the equipment was checked. The radiometer was
operational 30 minutes prior to the arrival of the first
subject.
When the subject arrived, the investigator ensured that
he was clothed with shorts, socks, and shoes. Also, the
following information was recorded on the data sheet:
name, age, height, weight, and room temperature. To
facilitate a counterbalanced testing procedure the data
sheet was marked to Indicate whether the measuring began
superior or inferior to the transverse plane of the body.
The subject was then marked with a felt pen at those sites
to be monitored by the radiometer. These areas in terms
of the anatomical position were: a point immediately above
the nose and in the center of the forehead along the anterior
aspect of the sagittal plane; a point located immediately
inferior to the sternum near the transpyloric plane; the
belly of the left bicep brachii; immediate center of the
left palm; a central point on the tip of the left thumb;
belly of the left rectus femoris; and belly of the left
gastrocnemius. Appendix B provides a pictorial description
of the above defined locations.
The investigator informed the subject that the treadmill
would be set at a speed of four miles per hour with a
twenty percent grade and that he would walk pausing long
enough for a thirty second monitoring period when the heart
attained 120, 140, 160, and 180 beats per minute.
The subject was seated in the resting chair with the
c a r d i o - t a c h electrodes attached to the subject's chest. The
stop watch was started to begin a fifteen minute rest
35period. Emphasis was placed on ensuring that the subject
remained as still as possible. Upon conclusion of the rest
period, the watch was reset and started after the resting
skin temperature and heart rate data was monitored and
recorded.
Procedures Employed During the Treadmill Walk
The following procedures were adhered to during the exercise
phase of the study:
1. Upon completion of the initial monitorings, the subject
began the treadmill walk. The lab assistant began the '
watch and observed the subject's heart rate on the cardio-
tach. Once the desired dynalevel was attained, the
subject moved to the stationary platform of the tread
mill and while standing erect was monitored for skin
temperature. The running time for the subject to attain
the dynalevel was recorded by the lab assistant. The sites
were monitored perpendicular to the body surface and 1/4
inch away from the skin,
2. These procedures were repeated for the remaining dynalevels.
3. The stop watch was reset to begin timing the thirty minute
recovery period when the subject's heart rate attained 180
beats per minute.
Procedures Employed after the Treadmill Walk
The final monitoring session was conducted in the following
manner:
1. Monitoring of skin temperature and heart rate data continued
36at three minute intervals for thirty minutes.
2. After all measurements were recorded, the subject was
detached from the cardio-tach and excused.
Pilot Study
The author served as a lab assistant in a similar study con- 2ducted by Gantt in order to become familiar with the testing apparatus
and procedures employed in monitoring skin temperature.
A major purpose of the pilot study was to determine whether
significant skin temperature decreases during exercise and increases
through recovery at particular body locations were evident after a
four mile per hour walk on the treadmill at a twenty percent incline.
Ten subjects were studied under these conditions. T-tests for signi
ficance of the difference between correlated means were utilized to
analyze the negative mean gains of the ten subjects from the resting
to the lowest measured temperature recorded at the seven locations
during exercise. It was found during the exercise phase that signi
ficant negative mean gains at the .01 level of probability were evi
dent at the head, heart, bicep, palm, thumb, and rectus femoris.
Temperature loss at the gastrocnemius was significant at the .05 level
of probability. Each of the seven areas appeared to have undergone
enough stress from the selected work load.
Similar t-tests were computed between the initial skin tempera
ture and the peak temperature reached during recovery from exercise.
oRobert B. Gantt, "Bilateral Comparisons of Skin Temperatures of Uninjured and Postoperative Knees Before and After Exercise," Unpublished Master's thesis, Louisiana State University, Baton Rouge, Louisiana, 1972, pp. 1-65.
37
The results showed that temperatures of the head, heart, palm, thumb,
rectus femoris, and gastrocnemius were significant at the .01 level
of probability. The bicep data was not significant.
Additional factors which the pilot study showed were: monitor
ing could be controlled at a constant thirty second period; subjects
who showed initial irregularities in cardio-tach heart rate monitoring
required adjustments in placing the electrode lead attached on or above the sternum; and it was found that the cardio-tach was not
responsive with some individuals.
Statistical Analysis
The data that were statistically analyzed in this study com
prised pre-exercise measures of heart rate and skin temperature;
exercise heart rate and skin temperature; and recovery heart rate,
skin temperature, and time.
For the investigation of the effects of exercise dynalevels
upon changes in skin temperature by fitness groups at the seven body
locations a two-by-five-by-seven split-plot factorial analysis of
variance was used. The high and low fitness groups comprised the
main level A, five dynalevels made up level B, and the level
C consisted of the seven body locations.
A two-by-ten-by-seven split-plot factorial analysis of variance
was used to study skin temperature changes during recovery from
exercise. The fitness levels comprised level A, ten monitorings of
skin temperature spaced at three minute intervals through thirty
minutes of recovery comprised level B, and level C consisted of
seven body locations.
The final analysis used curvilinear regression equations to
determine what type of relationships existed at the seven body loca
tions: between the dependent variable skin temperature and indepen
dent variable heart rate for the fitness groups and the total sub
ject population during the exercise phase of the study; and between
skin temperature, heart rate, and time for the fitness groups and
the total subject population during the recovery phase where skin
temperature was treated as a dependent variable.
CHAPTER 4
PRESENTATION AND ANALYSIS OF DATA
A split-^plot factorial analysis of variance was used to deter
mine whether differences existed in skin temperature changes at
seven body locations among high and low fitness groups due to the
effects of exercise stress at various dynalevels. An additional
split-plot factorial analysis of variance was used to find out
what effects recovery time had upon skin temperature changes ex
perienced by high and low fitness groups. Curvilinear regression
equations were employed to study the skin temperature and heart rate
relationship for fitness groups and the total subject population
at the seven body sites during exercise. Curvilinear regression
equations were used to study the relationships between skin tempera
ture and time and skin temperature and heart rate for both groups
and total subject population at all seven body locations through
thirty minutes of recovery.
Analysis of the Effects of Exercise Dynalevels Upon Skin
Temperature Scores of Fitness Groups and Body Locations
The analysis of variance of skin temperature scores attained
by the high and low fitness subjects who experienced exercise at
the various dynalevels is presented in Table 1. Graphic presenta
tions, Figures 1 through 8, covering the statistical analyses may
be found in the text. See pages 42, 44, 46, 49, 51, 53, 55, and
57. Additionally, the mean data utilized in the analysis of39
40variance and related supplementary analyses may be found in
Appendixes C, D, E, and F.
Comparison of Skin Temperature Scores from Rest through Four Dynalevels
The analysis of data showed a significant difference in skin
temperature among the five dynalevels. Table 1 reveals an F-ratio
of 71.84 with 4 and 112 degrees of freedom; this was significant
at the .01 level of probability. Figure 1 depicts the skin tempera
ture changes of all thirty subjects from the resting rate through
the four exercise dynalevels. To determine whether linear character
istics of the curve were significant, orthogonal comparisons were
employed. These comparisons, as shown in Table 2, indicated that
the slope of the curve in Figure 1 was significantly linear at the
at the .01 level of probability. The C2 comparison showed a signi
ficantly quadratic characteristic at the .01 level of probability.
Both fitness groups experienced a linear decrease in skin tempera
ture from the resting rate through 180 beats per minute, the range
in skin temperature being 31.62°C at rest and 30.93°C at the final
dynalevel. The quadratic trend in the curve occurred between the
beginning of exercise stress, 31.62°C, through a heart rate of 140
beats per minute, 31.08°C, after which a leveling off period
occurred.
Interaction of Fitness Groups During Exercise Dynalevels and Skin Temperature Scores
The A X B interaction of the difference between the high and
low fitness groups during the conditions of rest and performance
through the four dynalevels was significant at the .05 level of
probability. See page 41. The F-value was 2.40 with 4 and 112
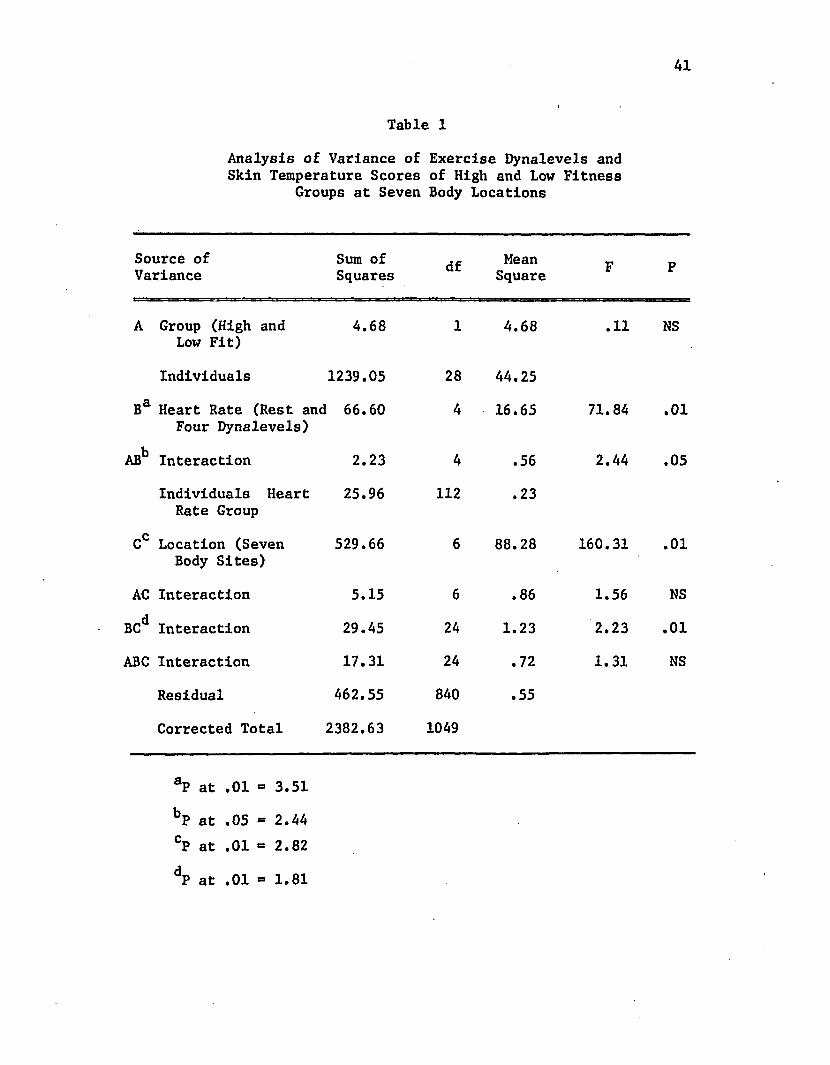
41
Table 1
Analysis of Variance of Exercise Dynalevels and Skin Temperature Scores of High and Low Fitness
Groups at Seven Body Locations
Source of Variance
Sum of Squares df Mean
Square F P
A Group (High and Low Fit)
4.68 1 4.68 .11 MS
Individuals 1239.05 28 44.25
Ba Heart Rate (Rest and 66.60 Four Dynalevels)
4 16.65 71.84 .01
ABb Interaction 2.23 4 .56 2.44 .05
Individuals Heart Rate Group
25.96 112 .23
gC Location (Seven Body Sites)
529.66 6 88.28 160.31 .01
AC Interaction 5.15 6 • 00 1.56 NS
BC Interaction 29.45 24 1.23 2.23 .01
ABC Interaction 17.31 24 .72 1.31 NS
Residual 462.55 840 .55
Corrected Total 2382.63 1049
aP at .01 3.51
bP at .05 SS 2.44CP at .01 xst 2.82
dp at .01 = 1.81
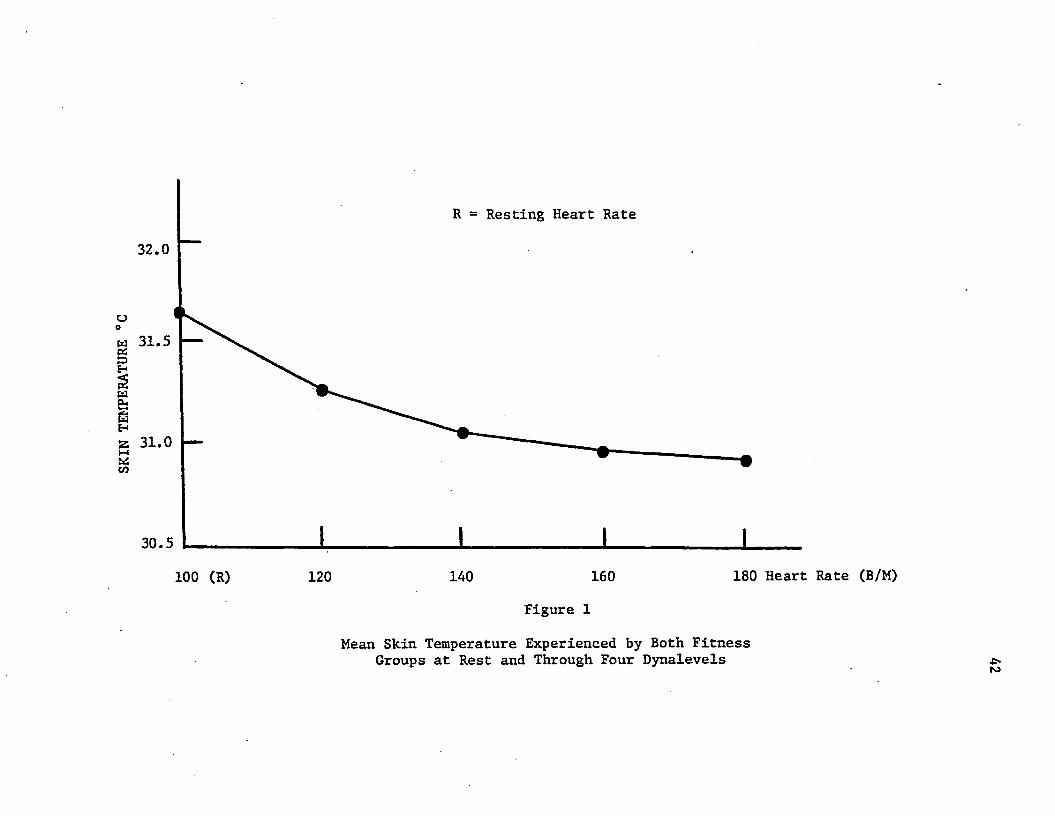
SKIN
TEMP
ERAT
URE
°C
R = Resting Heart Rate
32.0
31.5
31.0
30.5
100 (R) 120 140 160 180 Heart Rate (B/M)
Figure 1
Mean Skin Temperature Experienced by Both Fitness Groups at Rest and Through Four Dynalevels ■ts
to
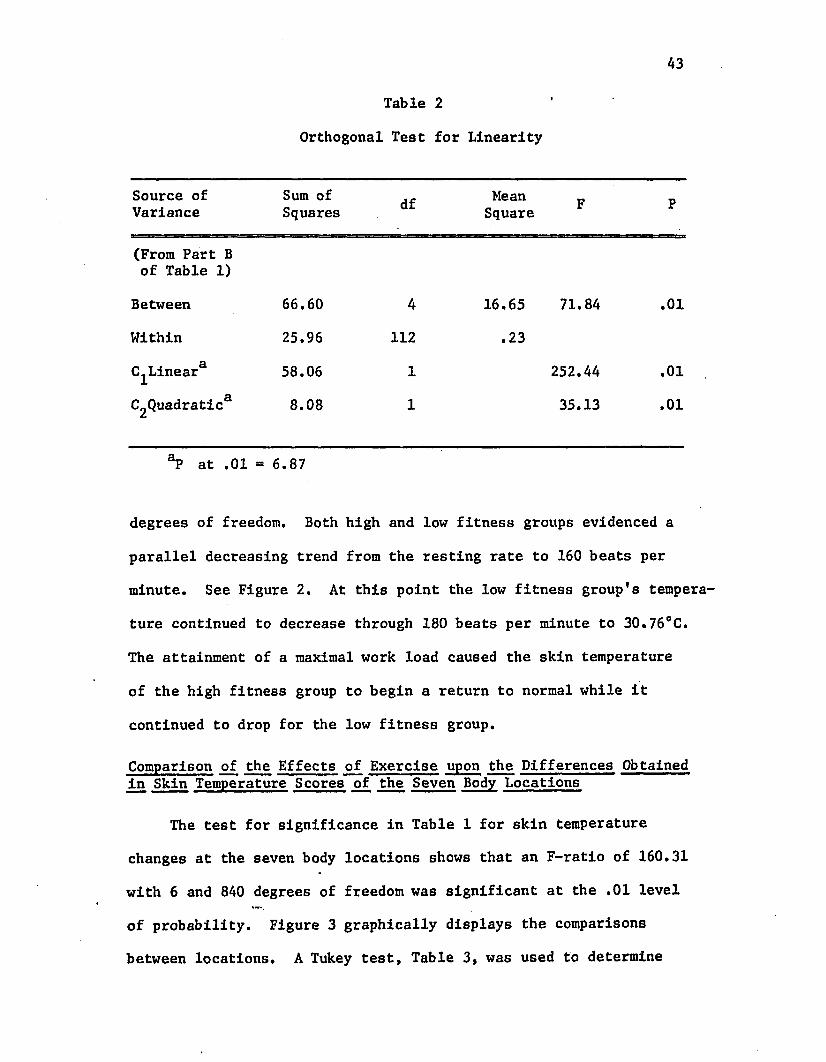
A3
Table 2
Orthogonal Test for Linearity
Source of Variance
Sum of Squares df Mean
Square F P
(From Part B of Table 1)
Between 66.60 4 16.65 71.84 .01
Within 25.96 112 .23
^Linear 58.06 1 252.44 .01
C2Quadratica 8.08 1 35.13 .01
°P at .01 - 6.87
degrees of freedom. Both high and low fitness groups evidenced a
parallel decreasing trend from the resting rate to 160 beats per
minute. See Figure 2. At this point the low fitness group's tempera
ture continued to decrease through 180 beats per minute to 30.76°C.
The attainment of a maximal work load caused the skin temperature
of the high fitness group to begin a return to normal while it
continued to drop for the low fitness group.
Comparison of the Effects of Exercise upon the Differences Obtained in Skin Temperature Scores of the Seven Body Locations
The test for significance in Table 1 for skin temperature
changes at the seven body locations shows that an F-ratio of 160.31
with 6 and 8A0 degrees of freedom was significant at the .01 level
of probability. Figure 3 graphically displays the comparisons
between locations. A Tukey test, Table 3, was used to determine
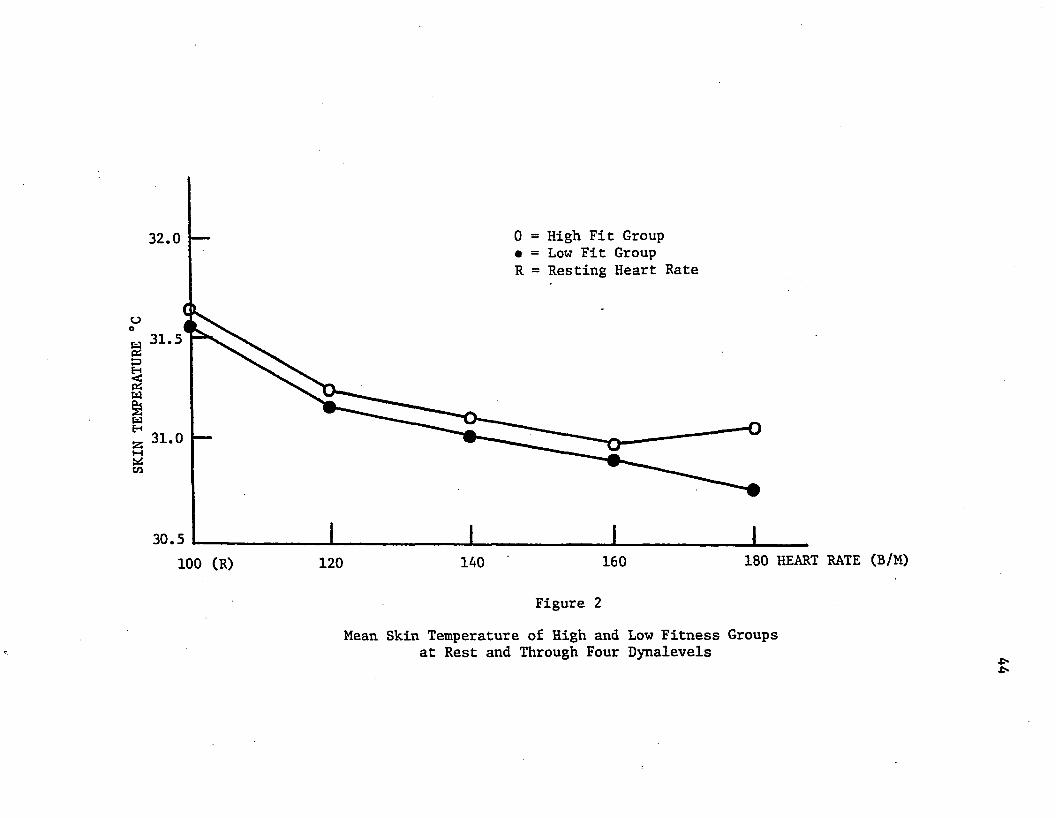
SKIN
TEMP
ERAT
URE
°C
0 = High Fit Group • = Low Fit Group R = Resting Heart Rate
32.0
31.5
31.0
30.5100 (R) 120 140 160 180 HEART RATE (B/M)
Figure 2
Mean Skin Temperature of High and Low Fitness Groups at Rest and Through Four Dynalevels •t*■t*
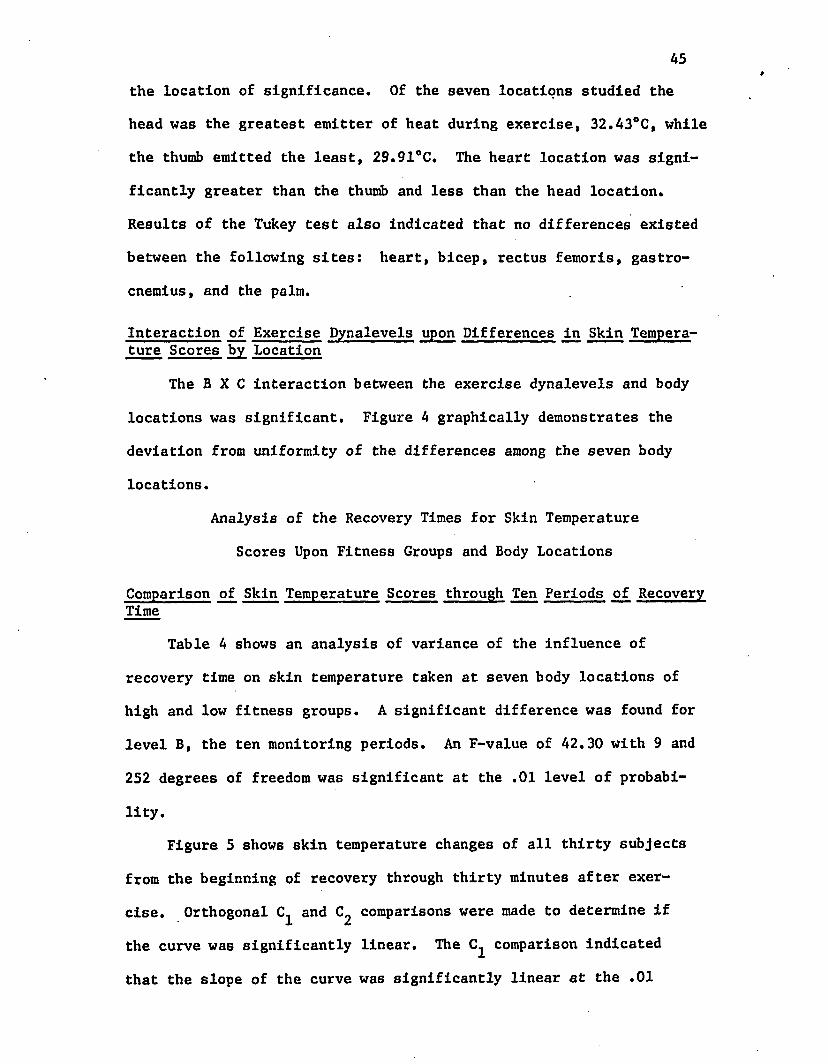
45the location of significance. Of the seven locations studied the
head was the greatest emitter of heat during exercise, 32.43°C, while
the thumb emitted the least, 29.91°C. The heart location was signi
ficantly greater than the thumb and less than the head location.
Results of the Tukey test also indicated that no differences existed
between the following sites: heart, bicep, rectus femoris, gastro
cnemius, and the palm.
Interaction of Exercise Dynalevels upon Differences in Skin Temperature Scores by Location
The B X C interaction between the exercise dynalevels and body
locations was significant. Figure 4 graphically demonstrates the
deviation from uniformity of the differences among the seven body
locations.
Analysis of the Recovery Times for Skin Temperature
Scores Upon Fitness Groups and Body Locations
Comparison of Skin Temperature Scores through Ten Periods of Recovery Time
Table 4 shows an analysis of variance of the influence of
recovery time on skin temperature taken at seven body locations of
high and low fitness groups. A significant difference was found for
level B, the ten monitoring periods. An F-value of 42.30 with 9 and
252 degrees of freedom was significant at the .01 level of probabi
lity.
Figure 5 shows skin temperature changes of all thirty subjects
from the beginning of recovery through thirty minutes after exer
cise. Orthogonal and C^ comparisons were made to determine if
the curve was significantly linear. The comparison indicated
that the slope of the curve was significantly linear at the .01
SKIN
TEMP
ERAT
URE
°C
46
32.5
32.0
31.5
31.0
30.5
30.0
<w§<w
29.5
mmm
inH cnPio M£ £w wPm 25Ocn OP- o PiH HC u inK y <cc s O c I
Figure 3
Mean Skin Temperature of Various Body Locations Experienced by Both Fitness Groups
during Exercise
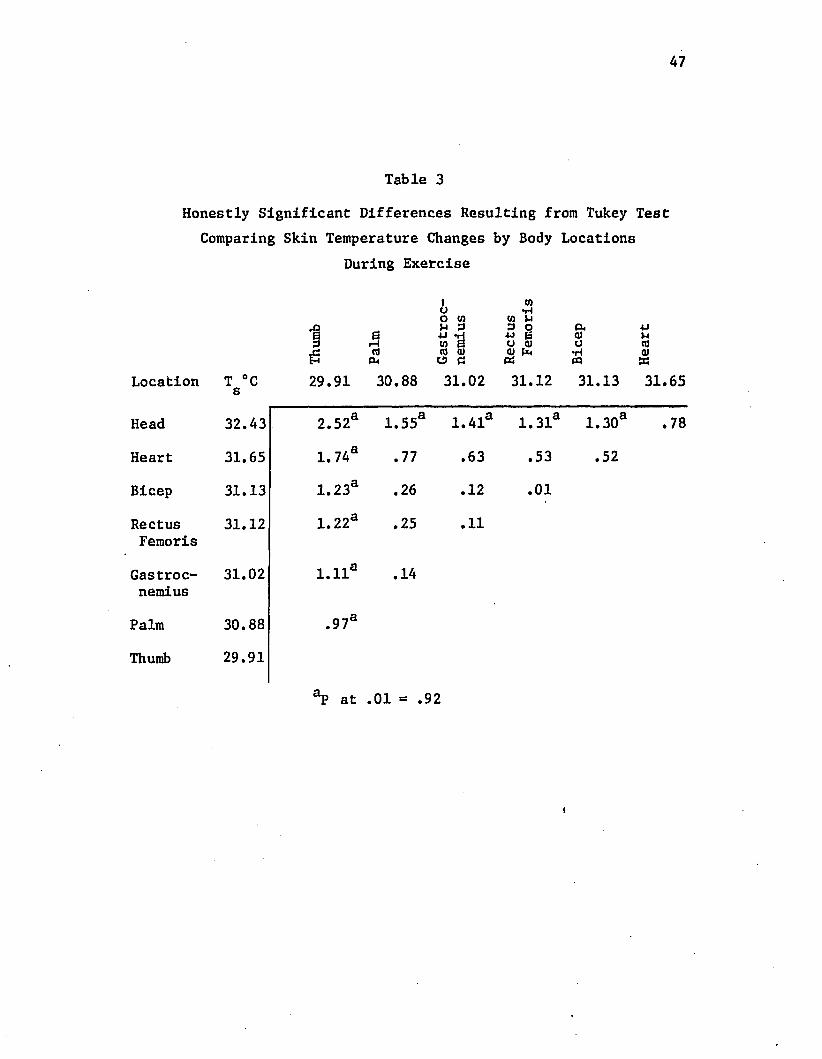
Table 3Honestly Significant Differences Resulting from Tukey Test
Comparing Skin Temperature Changes by Body Locations During Exercise
Location T °C s 29.91 30.88
Head 32.43 2.52a 1.55
Heart 31.65 1.74a .77
Bicep 31.13 1.23a .26
Rectus 31.12 1.22a .25Femoris
Gastroc 31.02 l.lla .14nemius
Palm 30.88 .97a
Thumb 29.91
"̂D a ̂ ni =
I too •rlo to to HVi 3 3 O P. 4Jw *d 4J & a) )-lto B CJ QJ o ton> <u (U Pn •H a)O C PQ
31.02 31.12 31.13 31.65
1.41a 1.31a 1.30a .78
.63 .53 .52
.12 .01
.11
92
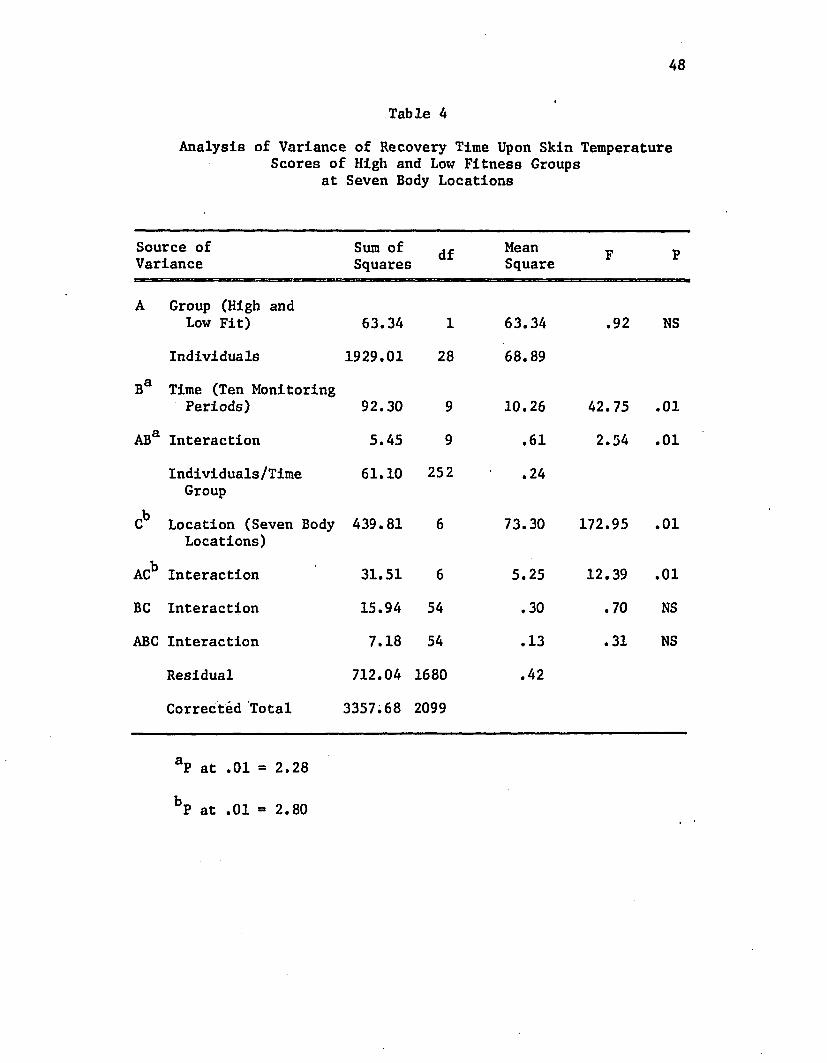
48
Table 4Analysis of Variance of Recovery Time Upon Skin Temperature
Scores of High and Low Fitness Groups at Seven Body Locations
Source of Variance
Sum of Squares df Mean
Square F P
A Group (High and Low Fit) 63.34 1 63.34 .92 NS
Individuals 1929.01 28 68.89
Ba Time (Ten Monitoring Periods) 92.30 9 10.26 42.75 .01
ABa Interaction 5.45 9 .61 2.54 .01
Individuals/Time Group
61.10 252 .24
kC Location (Seven Body
Locations)439.81 6 73.30 172.95 .01
ACb Interaction 31.51 6 5.25 12.39 .01
BC Interaction 15.94 54 .30 .70 NS
ABC Interaction 7.18 54 .13 .31 NS
Residual 712.04 1680 .42
Corrected Total 3357.68 2099
aP at .01 - 2.28
bP at .01 - 2.80
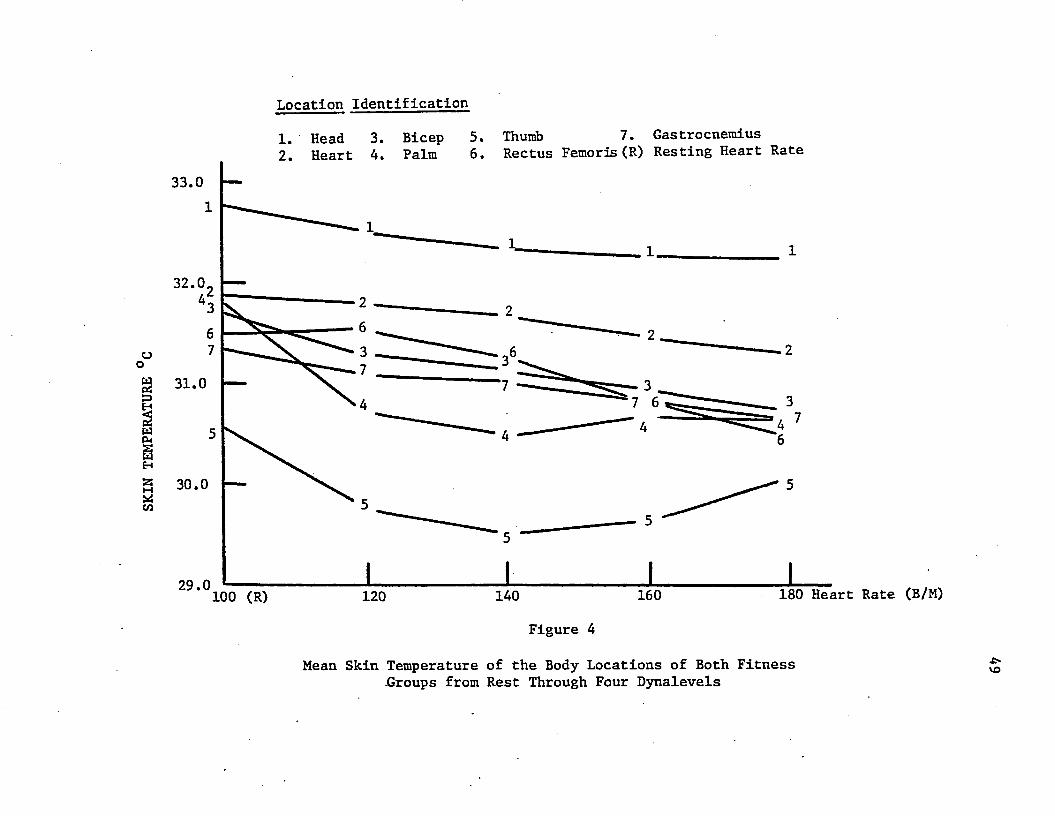
SKIN
TEMP
ERAT
URE
Location Identification1. Head 3. Bicep 5. Thumb 7. Gastrocnemius
6. Rectus Femoris (R) Resting Heart RateHeart 4. Palm33.0
32.0
6
37
o 331.0 7
74
30.0
29.0 180 Heart Rate (B/M)160140100 (R) 120Figure 4
Mean Skin Temperature of the Body Locations of Both Fitness Groups from Rest Through Four Dynalevels
•e*vo
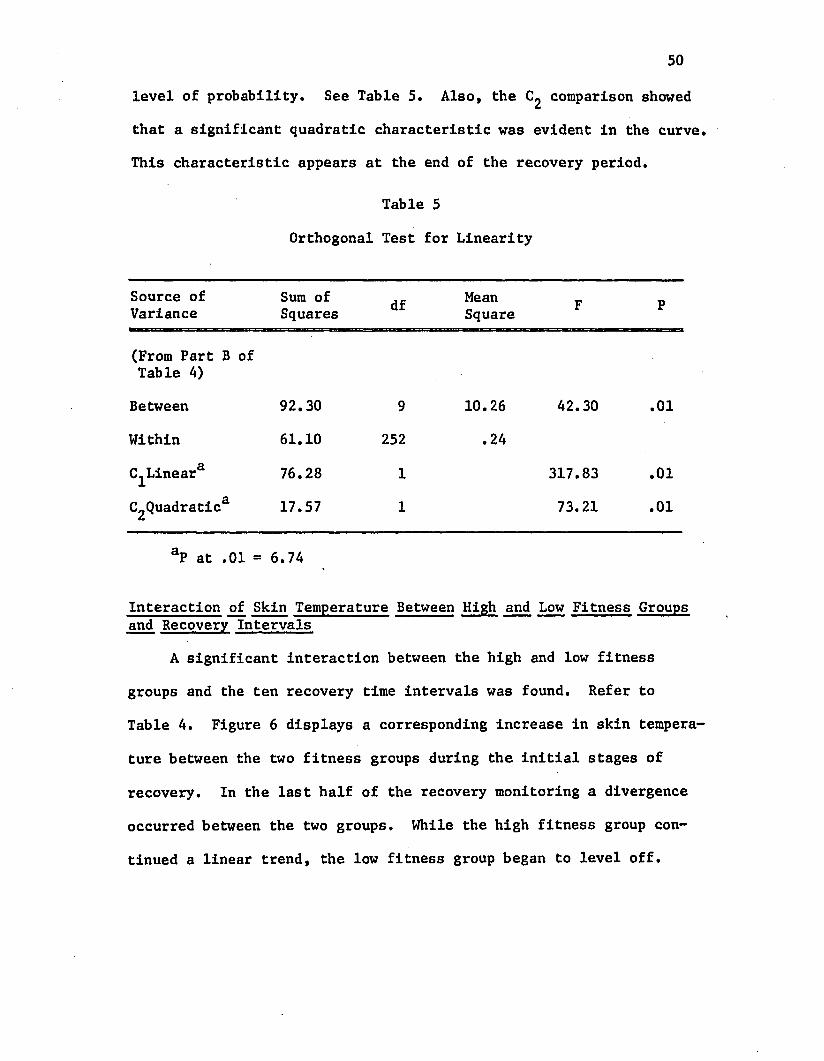
50
level of probability. See Table 5. Also, the C£ comparison showed
that a significant quadratic characteristic was evident in the curve.
This characteristic appears at the end of the recovery period.
Table 5
Orthogonal Test for Linearity
Source of Variance
Sum of Squares df Mean
Square F P
(From Part B of Table 4)
Between 92.30 9 10.26 42.30 .01
Within 61.10 252 .24
(^Linear3 76.28 1 317.83 .01
C2Quadratica 17.57 1 73.21 .01
aP at .01 = 6.74
Interaction of Skin Temperature Between High and Low Fitness Groups and Recovery Intervals
A significant interaction between the high and low fitness
groups and the ten recovery time intervals was found. Refer to
Table 4. Figure 6 displays a corresponding increase in skin tempera
ture between the two fitness groups during the initial stages of
recovery. In the last half of the recovery monitoring a divergence
occurred between the two groups. While the high fitness group con
tinued a linear trend, the low fitness group began to level off.
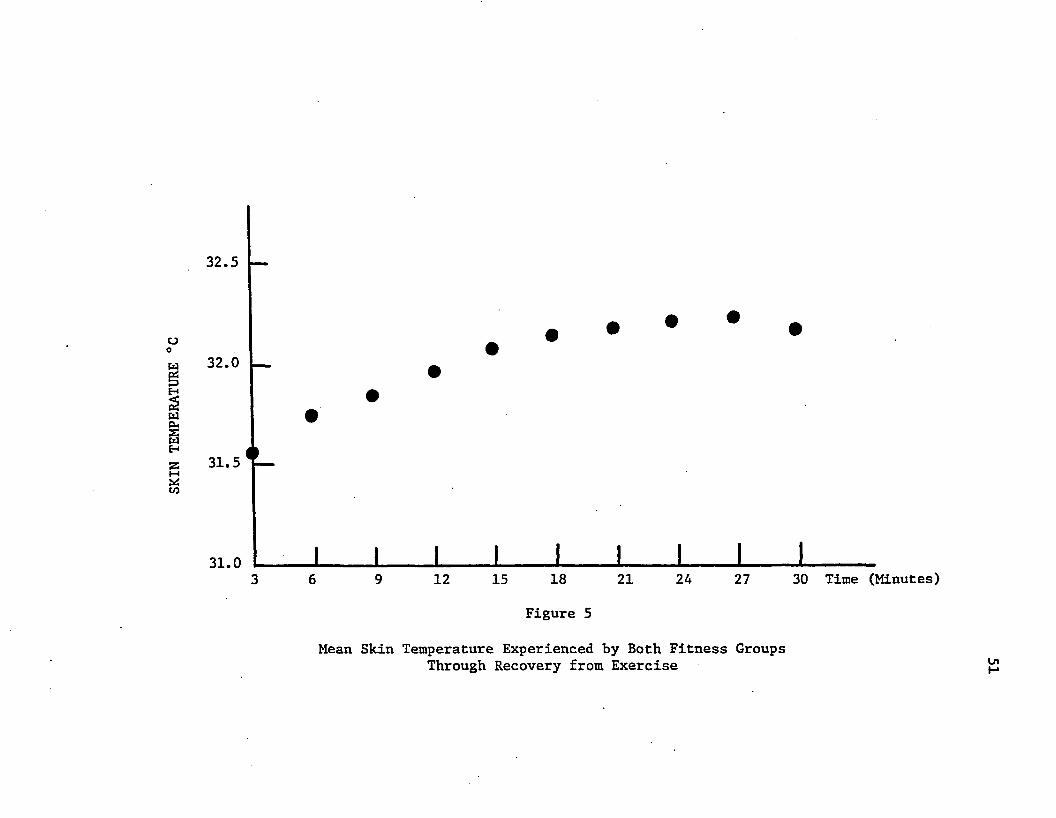
SKIN
TEMP
ERATURE
°C
32.5 —
32.0
31.5 T —
31.0
• •
I l I I I I I I________ I________6 9 12 15 18 21 24 27 30 Time (Minutes)
Figure 5
Mean Skin Temperature Experienced by Both Fitness Groups Through Recovery from Exercise Ul
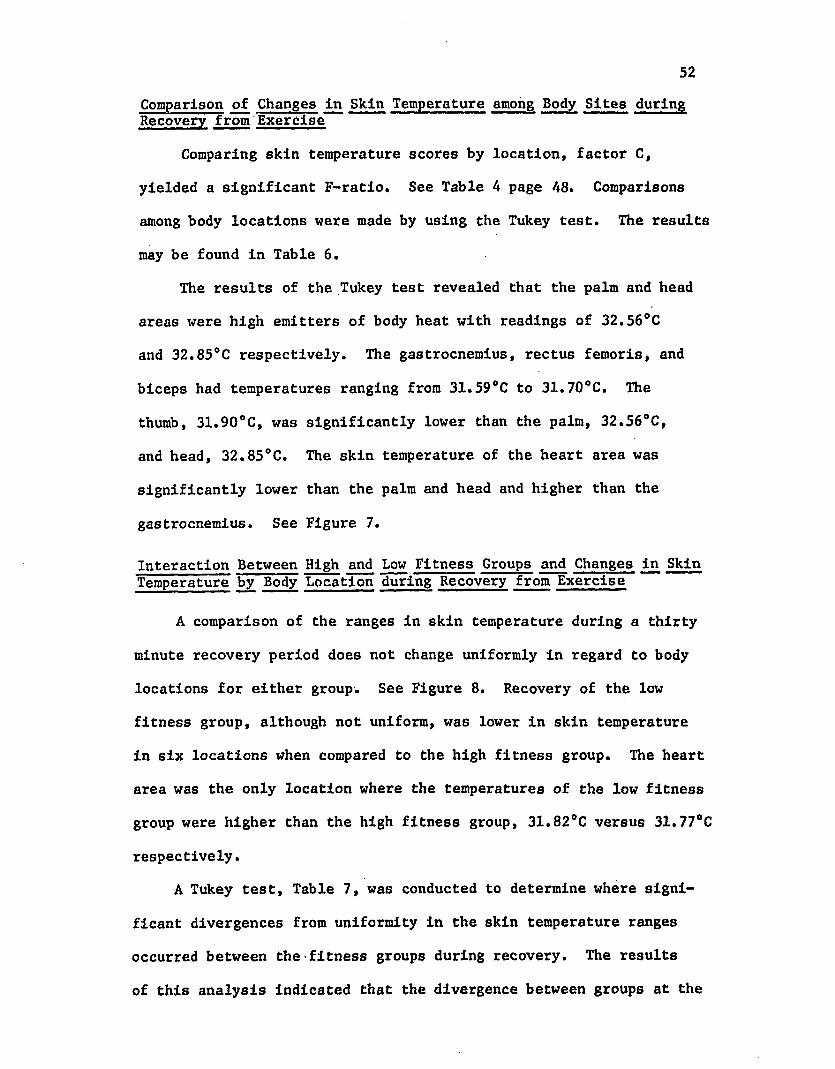
52Comparison of Changes in Skin Temperature among Body Sites during Recovery from Exercise
Comparing skin temperature scores by location, factor C,
yielded a significant F-ratio. See Table 4 page 48. Comparisons
among body locations were made by using the Tukey test. The results
may be found in Table 6.
The results of the Tukey test revealed that the palm and head
areas were high emitters of body heat with readings of 32.56°C
and 32.85°C respectively. The gastrocnemius, rectus femoris, and
biceps had temperatures ranging from 31.59°C to 31.70°C. The
thumb, 31.90°C, was significantly lower than the palm, 32.56°C,
and head, 32.85°C. The skin temperature of the heart area was
significantly lower than the palm and head and higher than the
gastrocnemius. See Figure 7.
Interaction Between High and Low Fitness Groups and Changes in Skin Temperature by Body Location during Recovery from Exercise
A comparison of the ranges in skin temperature during a thirty
minute recovery period does not change uniformly in regard to body
locations for either group. See Figure 8. Recovery of the low
fitness group, although not uniform, was lower in skin temperature
in six locations when compared to the high fitness group. The heart
area was the only location where the temperatures of the low fitness
group were higher than the high fitness group, 31.82°C versus 31.77°C
respectively.
A Tukey test, Table 7, was conducted to determine where signi
ficant divergences from uniformity in the skin temperature ranges
occurred between the fitness groups during recovery. The results
of this analysis indicated that the divergence between groups at the
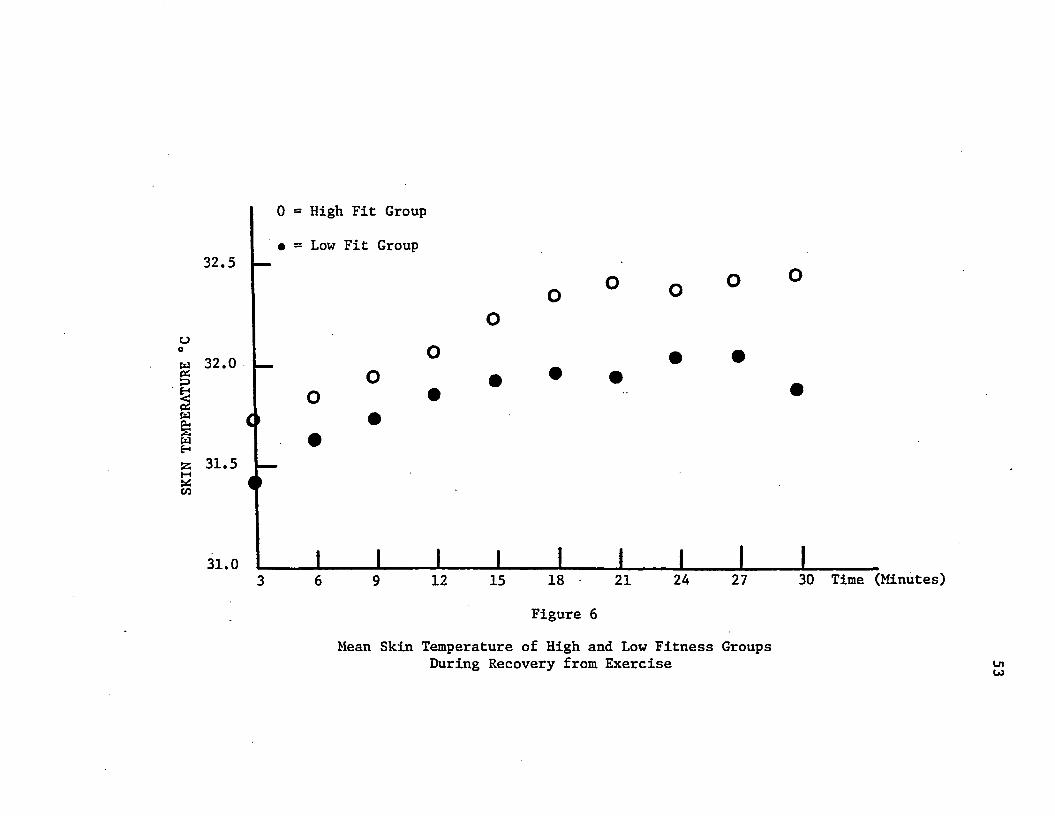
SKIN
TEMP
ERAT
URE
°C0 = High Fit Group
• = Low Fit Group32.5
32.0 • •
31.5
31.0 1______ I________ I______ I________ I I \ I________!_________3 6 9 12 15 18 21 24 27 30 Time (Minutes)
Figure 6
Mean Skin Temperature of High and Low Fitness Groups During Recovery from Exercise Ln
Co
54
Table 6Honestly Significant Differences Resulting from Tukey Test
Comparing Skin Temperature Changes by Body Location During Recovery From Exercise
%
a to o 3+J *Ej co a) to c O
&0)o•Hpq
3 S 0U Q)r
•MM(0(0sj0rHCOa
Location T °C s 31.59 31.66 31.70 31.79 31.91 32.56
Head 32.85 1.26a 1.19a 1.15a 1.06a ,94a .29a
Palm 32.56 .97a .90a . 86a . 77a .65a
Thumb 31.91 . 32a .25a . 21a .12
Heart 31.79 . 20a .13 .09
RectusFemoris
31.70 .11 .04
Bicep 31.66 .07
Gastrocnemius
31.59
aP at .01 = .18
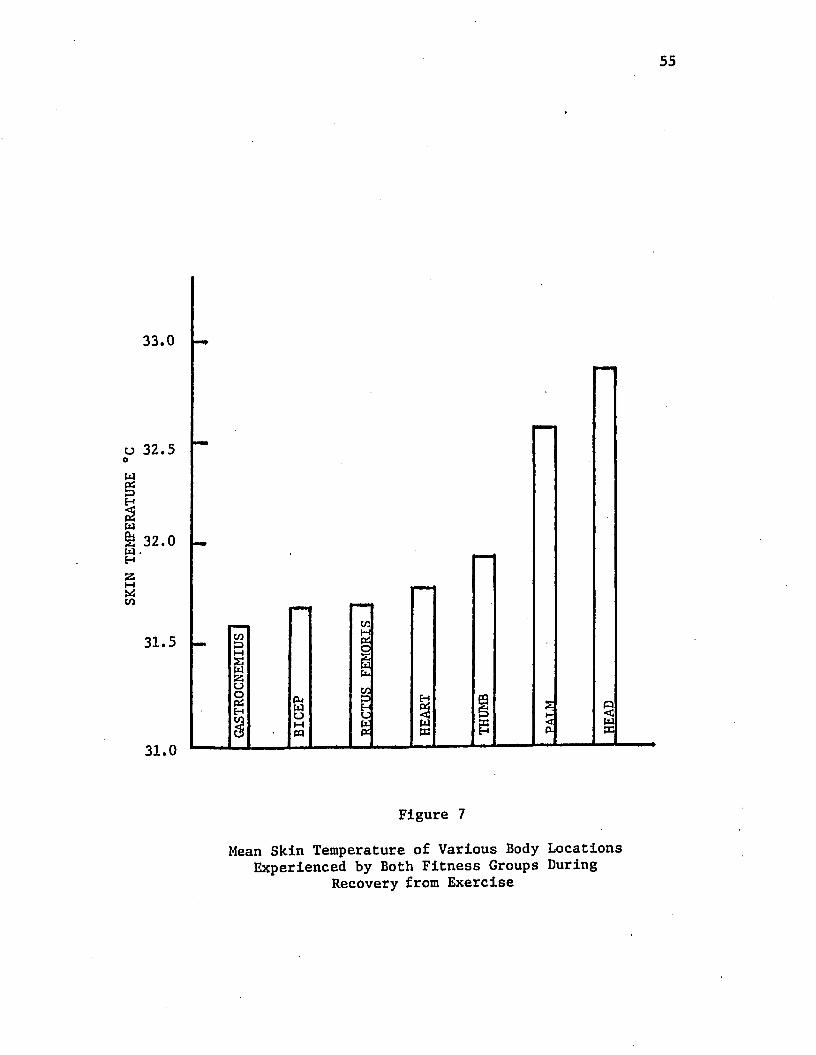
Figure 7
Mean Skin Temperature of Various Body Locations Experienced by Both Fitness Groups During
Recovery from Exercise
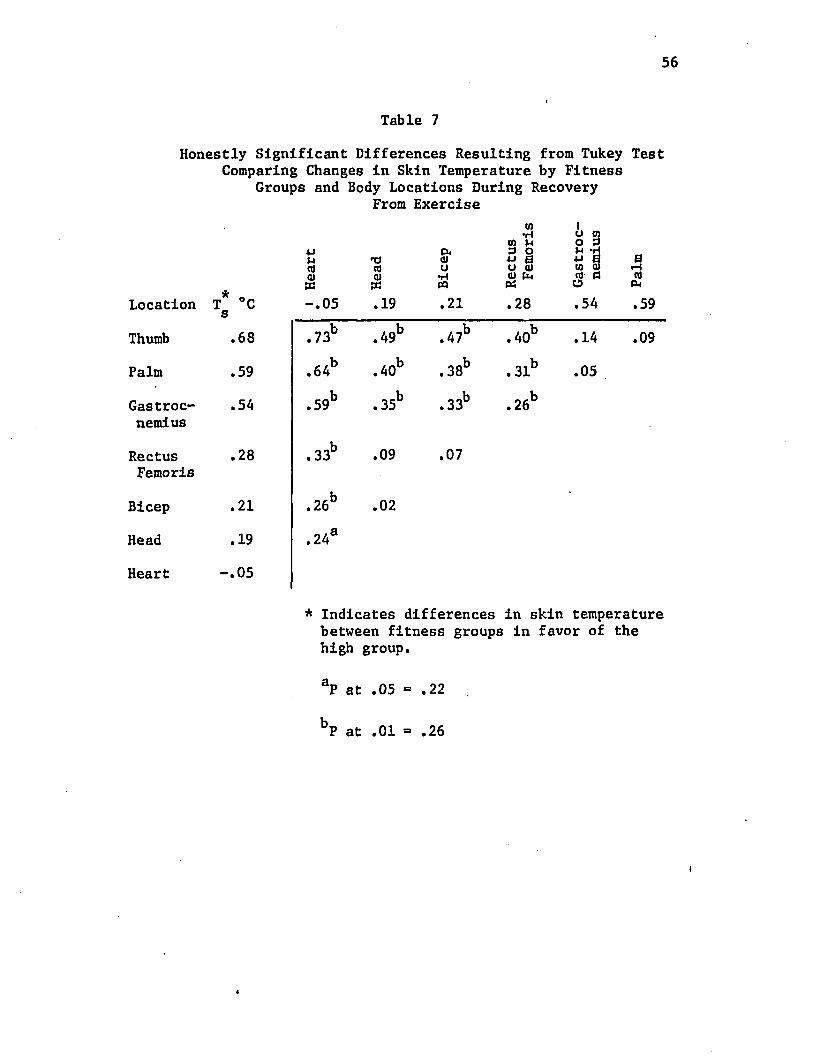
56
Table 7Honestly Significant Differences Resulting from Tukey Test
Comparing Changes In Skin Temperature by Fitness Groups and Body Locations During Recovery
From Exercise
Location * oT °C s
4JMtfa)-.05
X I(001X.19
Pk(UCJ•HPQ.21
Rect
us
» Fe
mori
s
Thumb .68 .73b .49b .47b .40b
Palm .59 .64b .40b . 38b ,31b
Gastroc .54 .59b . 35b .33b . 26bnemius
Rectus .28 . 33b .09 .07Femoris
Bicep .21 .26b .02
Head .19 .24s
Heart -.05
ioon4J(0rtO
to3
a .54
.14
.05
ar - i(0
P-l
.59
.09
* Indicates differences in skin temperature between fitness groups in favor of the high group.
aP at .05 = .22
bP at .01 = .26
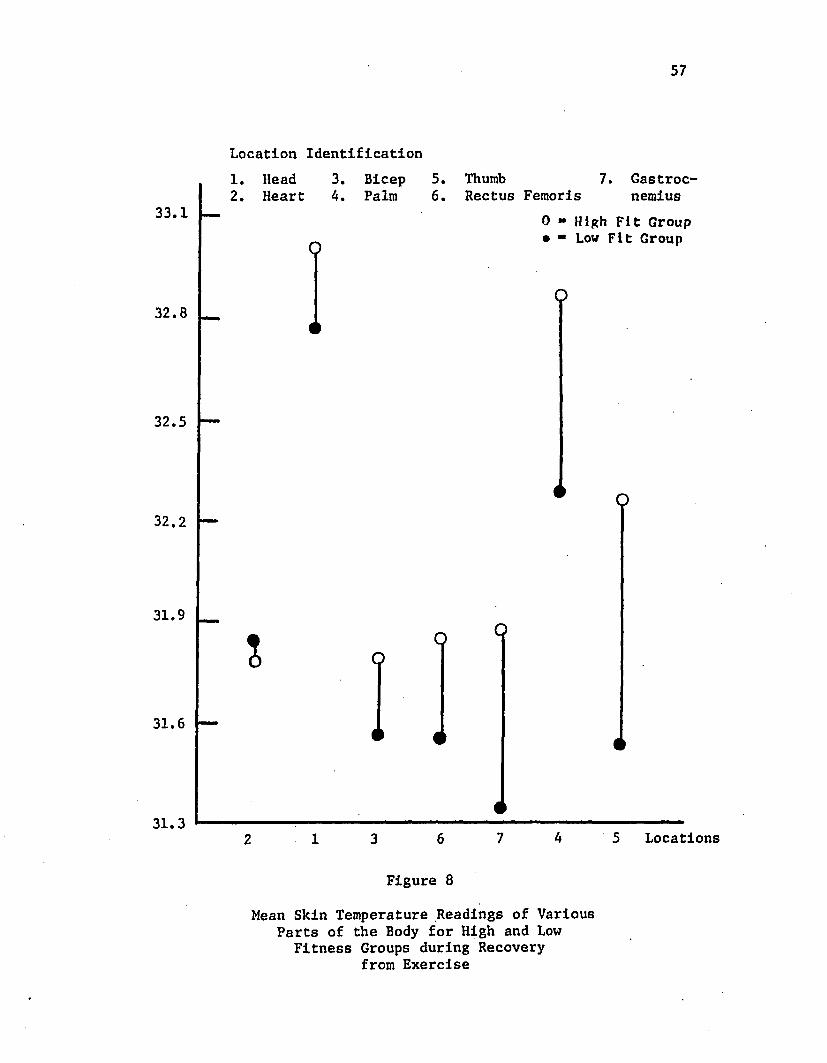
57
Location Identification1. Head 3. Bicep 5. Thumb 7. Gastroc-2. Heart 4. Palm 6. Rectus Femoris nemius
33.1
O0 » High Fit Group • ■ Low Fit Group
O32.8
32.5
32.2
31.9
I
OO
31.6
31.32 1 3 6 7 4 5 Locations
Figure 8
Mean Skin Temperature Readings of Various Parts of the Body for High and Low
Fitness Groups during Recovery from Exercise
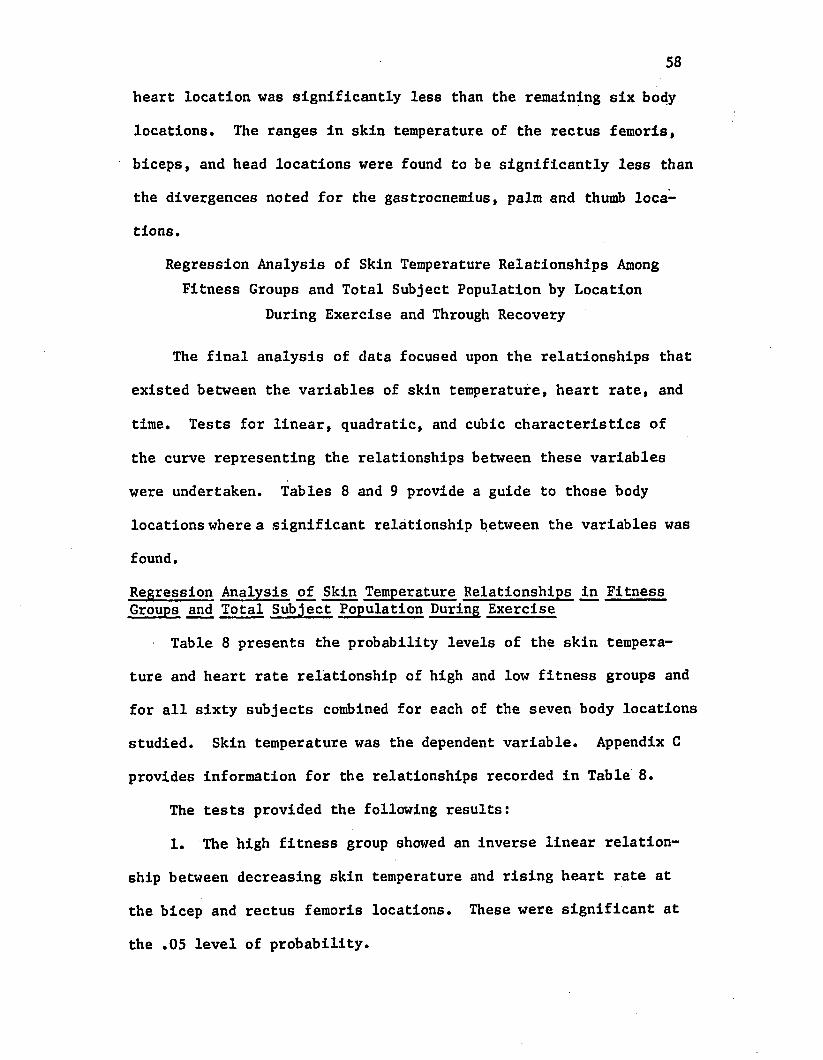
58
heart location was significantly less than the remaining six body
locations. The ranges in skin temperature of the rectus femoris,
biceps, and head locations were found to be significantly less than
the divergences noted for the gastrocnemius, palm and thumb loca
tions.
Regression Analysis of Skin Temperature Relationships Among Fitness Groups and Total Subject Population by Location
During Exercise and Through Recovery
The final analysis of data focused upon the relationships that
existed between the variables of skin temperature, heart rate, and
time. Tests for linear, quadratic, and cubic characteristics of
the curve representing the relationships between these variables
were undertaken. Tables 8 and 9 provide a guide to those body
locations where a significant relationship between the variables was
found.
Regression Analysis of Skin Temperature Relationships in Fitness Groups and Total Subject Population During Exercise
Table 8 presents the probability levels of the skin tempera
ture and heart rate relationship of high and low fitness groups and
for all sixty subjects combined for each of the seven body locations
studied. Skin temperature was the dependent variable. Appendix C
provides information for the relationships recorded in Table 8.
The tests provided the following results:
1. The high fitness group showed an inverse linear relation
ship between decreasing skin temperature and rising heart rate at
the bicep and rectus femoris locations. These were significant at
the .05 level of probability.
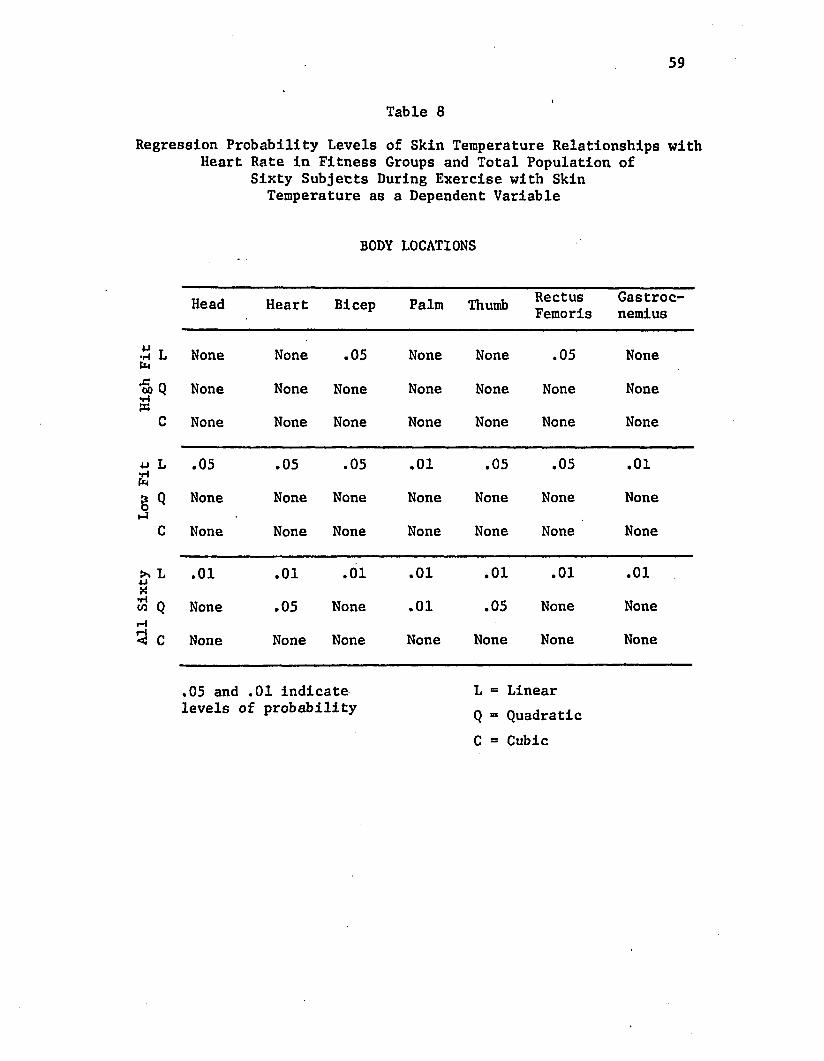
59
Table 8Regression Probability Levels of Skin Temperature Relationships with
Heart Rate in Fitness Groups and Total Population of Sixty Subjects During Exercise with Skin
Temperature as a Dependent Variable
BODY LOCATIONS
Head Heart Bicep Palm Thumb RectusFemoris
Gastrocnemius
4J T •H L fe None None .05 None None .05 None
•S) Q None None None None None None None
C None None None None None None None
4J L .05 .05 .05 .01 .05 .05 .01
§ Q None None None None None None Noneh4
C None None None None None None None
>> L .01 .01 .01 .01 .01 .01 .01
M Q None .05 None .01 .05 None NonerH5} c None None None None None None None
,05 and .01 indicate L = Linearlevels of probability Q = Quadratlc
C = Cubic
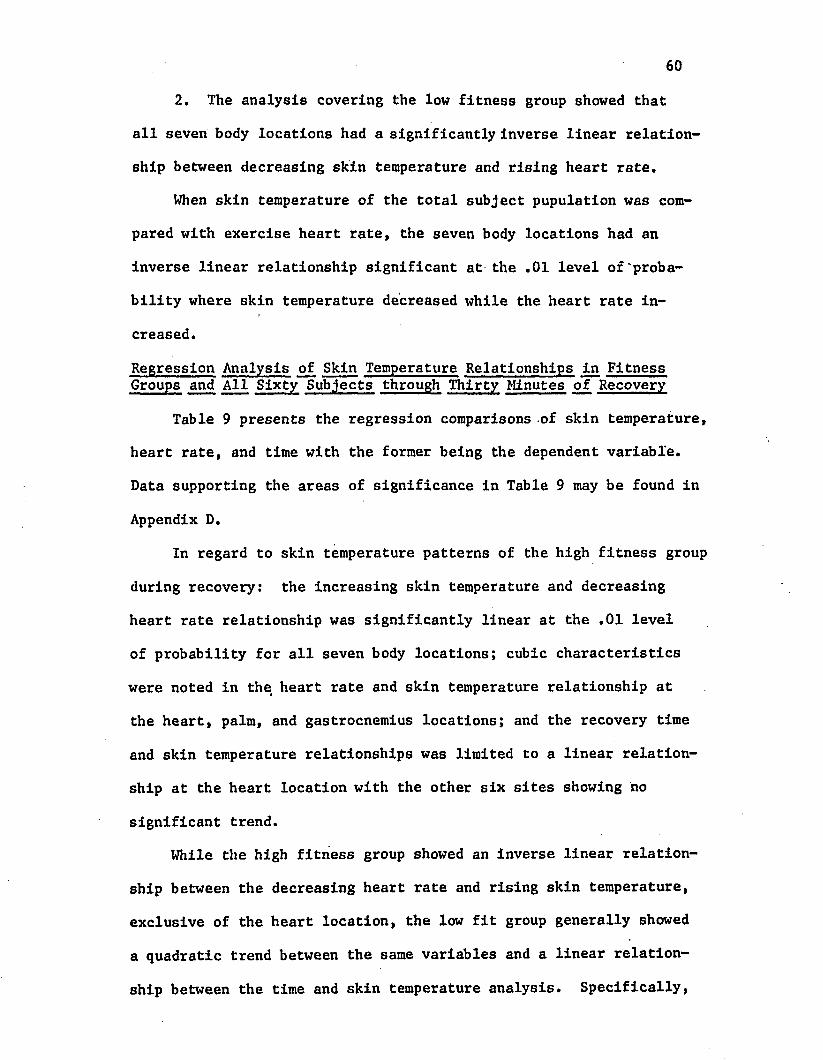
60
2. The analysis covering the low fitness group showed that
all seven body locations had a significantly inverse linear relation
ship between decreasing skin temperature and rising heart rate.
When skin temperature of the total subject pupulation was com
pared with exercise heart rate, the seven body locations had an
inverse linear relationship significant at the .01 level o f ‘proba
bility where skin temperature decreased while the heart rate in
creased.
Regression Analysis of Skin Temperature Relationships in Fitness Groups and All Sixty Subjects through Thirty Minutes of Recovery
Table 9 presents the regression comparisons of skin temperature,
heart rate, and time with the former being the dependent variable.
Data supporting the areas of significance in Table 9 may be found in
Appendix D.
In regard to skin temperature patterns of the high fitness group
during recovery: the increasing skin temperature and decreasing
heart rate relationship was significantly linear at the .01 level
of probability for all seven body locations; cubic characteristics
were noted in the heart rate and skin temperature relationship at
the heart, palm, and gastrocnemius locations; and the recovery time
and skin temperature relationships was limited to a linear relation
ship at the heart location with the other six sites showing no
significant trend.
While the high fitness group showed an inverse linear relation
ship between the decreasing heart rate and rising skin temperature,
exclusive of the heart location, the low fit group generally showed
a quadratic trend between the same variables and a linear relation
ship between the time and skin temperature analysis. Specifically,
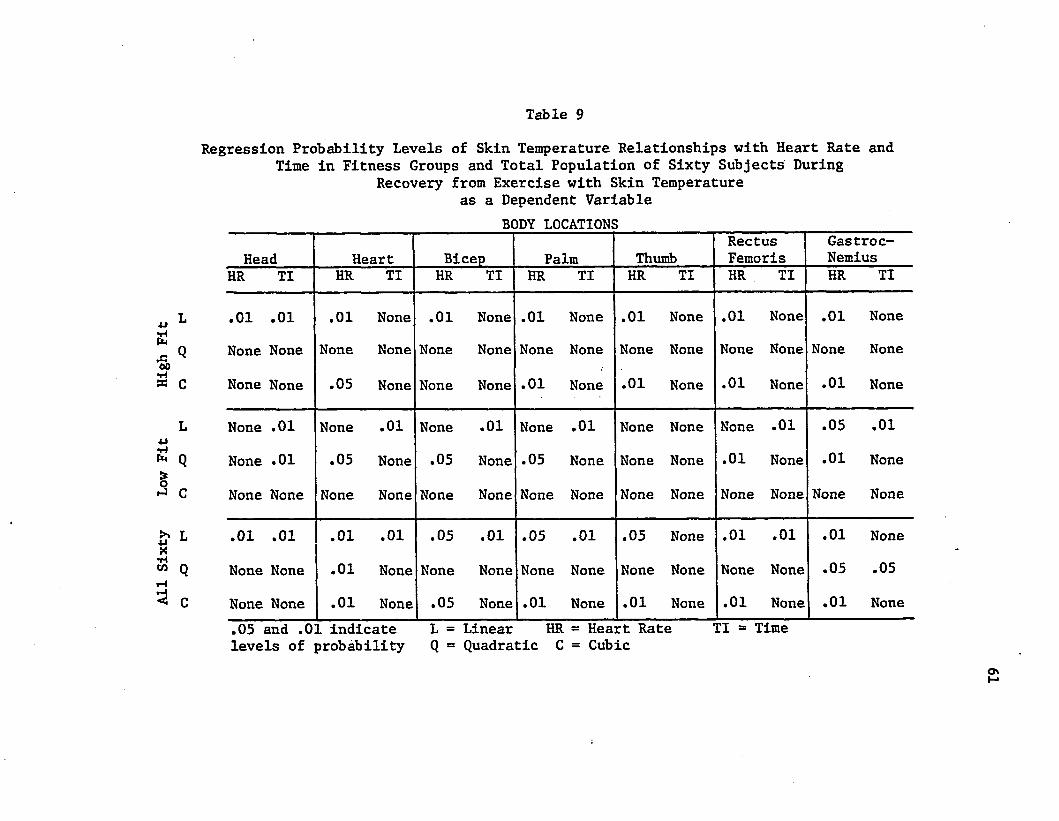
All
Sixty
Low
Fit
High
Fit
Table 9
Regression Probability Levels of Skin Temperature Relationships with Heart Rate and Time in Fitness Groups and Total Population of Sixty Subjects During
Recovery from Exercise with Skin Temperature as a Dependent Variable
BODY LOCATIONS
Head Heart Bicep Palm ThumbRectusFemoris
Gastroc-Nemius
HR TI HR TI HR TI HR TI HR TI HR TI HR TI
.01 .01 .01 None .01 None .01 None .01 None .01 None .01 None
None None None None None None None None None None None None None None
None None .05 None None None .01 None .01 None .01 None .01 None
None .01 None .01 None .01 None .01 None None None .01 .05 .01
None .01 .05 None .05 None .05 None None None .01 None .01 None
None None None None None None None None None None None None None None
.01 .01 .01 .01 .05 .01 .05 .01 .05 None .01 .01 .01 None
None None .01 None None None None None None None None None .05 .05
None None .01 None .05 None .01 None .01 None .01 None .01 None.05 and .01 indicate L = Linear HR = Heart Rate TI *» Timelevels of probability Q = Quadratic C = Cubic
OnM
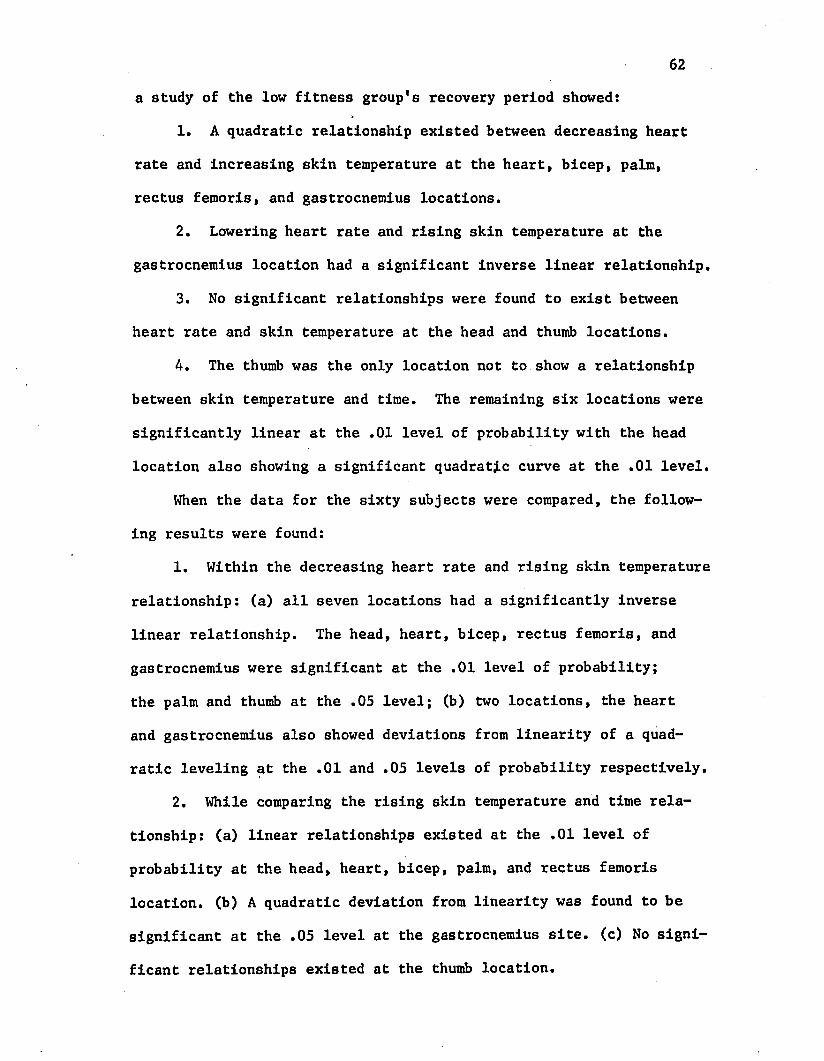
62a study of the low fitness group's recovery period showed:
1. A quadratic relationship existed between decreasing heart
rate and Increasing skin temperature at the heart, bicep, palm,
rectus femoris, and gastrocnemius locations.
2. Lowering heart rate and rising skin temperature at the
gastrocnemius location had a significant Inverse linear relationship.
3. No significant relationships were found to exist between
heart rate and skin temperature at the head and thumb locations.
4. The thumb was the only location not to show a relationship
between skin temperature and time. The remaining six locations were
significantly linear at the .01 level of probability with the head
location also showing a significant quadratic curve at the .01 level.
When the data for the sixty subjects were compared, the follow
ing results were found:
1. Within the decreasing heart rate and rising skin temperature
relationship: (a) all seven locations had a significantly inverse
linear relationship. The head, heart, bicep, rectus femoris, and
gastrocnemius were significant at the .01 level of probability;
the palm and thumb at the .05 level; (b) two locations, the heart
and gastrocnemius also showed deviations from linearity of a quad
ratic leveling at the .01 and .05 levels of probability respectively.
2. While comparing the rising skin temperature and time rela
tionship: (a) linear relationships existed at the .01 level of
probability at the head, heart, bicep, palm, and rectus femoris
location, (b) A quadratic deviation from linearity was found to be
significant at the .05 level at the gastrocnemius site, (c) No signi
ficant relationships existed at the thumb location.
CHAPTER 5
SUMMARY, FINDINGS, DISCUSSION, CONCLUSIONS,
AND RECOMMENDATIONS
Summary
This study was conducted to determine whether variances in
physical fitness as defined in this study would cause differences in
skin temperature patterns during exercise and through a thirty minute4
recovery period. The primary purpose was to determine if the skin
temperature patterns of high and low fitness groups would differ
significantly during an exercise load with four dynalevels and
through recovery from exercise. A secondary purpose was to determine
whether a specific body location could be found which would indicate
that radiometer could be used to measure physical fitness.
Sixty male subjects were randomly selected to study the relation
ships between heart rate and skin temperature induced by exercise
dynalevels performed on a motor driven treadmill. A high and low
fitness group was separated for additional study to determine
whether differences and/or relationships were present due to the
factor of fitness. The subjects were classified by the amount of
time necessary for the heart rate of a subject to attain 180 beats
per minute. Seven body locations were studied: forehead, a point
immediately inferior to the sternum, belly of the left bicep, center
of the left palm, tip of the left thumb, belly of the left rectus
femoris, and belly of the left gastrocnemius.
63
64
Skin temperature and heart rate were obtained by using a Barnes
radiometer and a cardio-tach while subjects were tested in a 72-76°F
environment. Resting skin temperature and heart rate measurements
were taken after a fifteen minute rest period and were continued
throughout the exercise phase as heart rates attained 120, 140, 160,
and 180 beats per minute. Monitoring for skin temperature and
heart rate were continued throughout the thirty minute recovery
period at three minute intervals.
A split-plot factorial analysis of variance was used to deter
mine whether differences existed in skin temperature changes at
seven body locations among high and low fitness groups due to the
effects of exercise stress at various dynalevels. An additional
split-plot factorial analysis of variance was used to find out what
effects recovery time had upon skin temperature changes experienced
by high and low fitness groups. Curvilinear regression equations
were employed to study the skin temperature and heart rate relation
ship for fitness groups and the total subject population at the seven
body sites during exercise. Curvilinear regression equations were
used to study the relationships between skin temperature and time
and skin temperature and heart rate for both groups and the total
subject population at all seven body locations through thirty
minutes of recovery.
Findings
The findings in this study were as follows:
1. Both fitness groups experienced a significant linear de
crease in skin temperature from the resting level as
heart rate increased.
652. Both groups showed a significant drop in skin temperature
at onset of exercise.
3. A significant interaction was found between skin temperature
of high and low fitness groups during exercise; when heart
rate approached the upper limits skin temperature of the
high fitness group demonstrated a return to normal, the
low fitness group experienced a continued drop in tempera
ture.
A. The head location experienced significantly higher tempera
tures during exercise than five other body locations with
the exception of the heart location.
5. The thumb location was significantly lower in skin tempera
ture during exercise than the other six body locations.
6. The seven body locations did not react uniformly in skin
temperature patterns as a result of increased exercise
stress.
7. Both fitness groups experienced a significant linear
increase in skin temperature during recovery from exercise.
8 . A significant leveling was experienced in the skin tempera
ture of the fitness groups during the later phases of
recovery from exercise.
9. A significant interaction between the high and low fitness
groups and skin temperature recovery time intervals was
found; where the high fitness group continued a linear
trend of increasing magnitude, the low fitness group began
to level off.
10. The head and palm locations were high emitters of body
66temperature during the thirty minute recovery period.
11. Skin temperature changes during a thirty minute recovery
period did not change uniformly in regard to body location
for either fitness group.
12. Highly fit exercising subjects displayed a significant inverse
linear relationship between decreasing skin temperature
and rising heart rate at the bicep and rectus femoris
locations.
13. Low fit exercising subjects displayed a significant
inverse linear relationship between decreasing skin tempera
ture and increasing heart rate at all seven body locations.
14. The total subject population experienced a significant
inverse linear relationship between decreasing skin tempera
ture and increasing heart rate during exercise for all
seven body locations; significant deviations from linearity
were found for the heart, palm, and thumb locations.
15. The high fitness group experienced a significant inverse
linear relationship between rising skin temperature and
decreasing heart rate during recovery from exercise for
all seven body locations.
16. The low fitness group experienced a significant linear
increase in skin temperature during recovery from exercise
at all body locations except the thumb.
17. A significant linear pattern was found with the total
subject population where skin temperature increased through
67
recovery time at the head, heart, bicep, palm, and
rectus femoris locations.
Discussion
The findings in this study were in partial agreement with the1 2 results of studies conducted by Saltin e£ al. and Loiselle.
Saltin found that skin temperature gradually dropped approximately
2°C and remained rather constant during the first ten minutes of
exercise. Fitness groups of the present study experienced a
gradual drop from the resting rate through a heart rate of 180 beats
per minute, but did not display as large a variation in skin tempera
ture. A change of .69°C was noted in this study.
The findings of Loiselle, who stated that exercising skin
temperature overlying an active muscle was lower than the average
temperature of six other nonworking body areas, were not in total
agreement with the findings of the present study. Although in the
present study the head and heart were higher in skin temperature
during exercise than the working muscles, (rectus femoris, gastroc
nemius, and bicep) the palm and thumb showed changes lower than the
working muscle groups.
^B. Saltin and others, "Muscle Temperature During Submaximai Exercise in Man," Journal of Applied Physiology, XXV (December,1968), 679-88.
oDenis Loiselle, "The Effects of Varied Thermal Environments on Selected Physiological Variables," Microcarded Master's thesis, University of Alberta, Edmonton, 1966, pp. 14-54.
68This investigator's findings did not support, the conclusion of
3Lynch et al. that exercise had no major consistent effect on blood
flow in overlying skin during exercise, since a significant difference
in the drop in skin temperature was found from the resting rate
through 180 beats per minute.
The finding by O'Connell^ that skin temperature increased signi
ficantly during recovery from exercise stress was also observed
in the present study.
A brief summary of the present study shows that skin tempera
ture dropped from the resting rate of 31.62°C to 30.93°C at 180 beats
per minute and began a return to normal at the first recovery moni
toring at three minutes to 31.57°C. From this point skin tempera
ture continued to rise above the resting level to 32.16°C at the
thirty minute monitoring period.
Although a return to the normal resting skin temperature level
was not experienced in this study, the quadratic deviation from
linearity which occurred during the last ten minutes of monitoring
indicated that such a trend could occur within a short period of
time.
The primary problem of the study was to determine whether high
and low fitness individuals would differ significantly in skin
3P. R. Lynch and others, "Results of Studies Using Two Radiologi
cal Methods in Investigating the Circulation of Exercising Human Arms," Journal of Physiology, CCXIII (March, 1971), 41P-42P.
^Eugene R. O'Connell, "The Effect of Local Isometric Muscular Activity on Local Skin Temperature," Journal for the Association for Physical and Mental Rehabilitation, XIV (May-June, 1960), 74-75.
temperature patterns due to exercise stress and through a thirty
minute recovery period. Although a drop in skin temperature was
expected during the increased exercise stress, the fact that both
fitness groups displayed a linear decreasing trend was not expected.
The significant interaction which resulted between the high and low
fitness groups reaction to exercise stress answered the primary
question. The physical fitness level of a subject caused variations
in the skin temperature patterns when subjected to exercise stress
of increased proportions. The difference in reaction to exercise
stress occurred as the heart rate approached the dynalevel of 180
beats per minute. At this point the skin temperature of the high
fitness group began a return to the resting level, whereas the low
fitness group continued its decreasing linear trend. A possible
explanation for this divergence between the two fitness groups may
lie in the extended time required for the high fitness group to
attain 180 beats per minute. Such stress possibly necessitated the
dissipation of heat through vasodilation of the subcutaneous
tissue even though a shunting of this blood flow is commonly assumed
to take place to provide additional blood flow to the underlying
working muscles. Vasodilation in the subcutaneous tissue area could
be a result of the impending maximal stress experienced by the high
fitness group since there was uniformity between both groups in
skin temperature patterns even up to the 160 beat per minute level.
The recovery patterns for both fitness groups demonstrated a
linear trend of increasing skin temperature with a quadratic leveling .
during the last ten minutes of exercise. The interaction between
the fitness groups suggested that the more fit individual experienced
70
higher skin temperature values than the low fit individual. Uniformity
of increasing skin temperature between both groups existed for the
first fifteen minutes. After this point the low fitness group began
experiencing a leveling followed by a drop in temperature.
The high fitness group continued to experience an increase in
skin temperature throughout the thirty minutes. This divergence from
the low fitness group could possibly be explained by the greater
amount of time the high fitness group had to exercise to reach the
dynalevel of 180 beats per minute. Although lower fit subjects
recovered more quickly from the work load, it may be due to the fact
that they had exercised for a shorter period of time.
An additional possibility for the difference between the tempera
ture recovery patterns of the groups may lie in physiological tempera-5ture adjustments, an area which Astrand and Rodahl indicated was
largely unknown. Since the higher fitness group was accustomed to
exercise in greater amounts at the equivalent heart rate, they may
have developed more efficient heat releasing mechanisms through vaso
dilation than the low fitness group. This adjustment would seem
imperative if the core temperature is to be maintained within the
4°C range as reported by Astrand and Rodahl.^The interaction between the fitness groups and changes in skin
temperature by body location during recovery from exercise showed
that a lack of uniformity existed among several sites. The main
working muscle groups monitored, the rectus femoris and gastrocnemius,
5per-0lof Astrand and Kaare Rodahl, Textbook of Work Physiology, (New York: McGraw-Hill Book Company, 1970), p. 509.
6Ibid., p. 491.
71$
showed divergences of .28°C and .54°C, respectively. Temperatures
for the high fitness group were high for both locations. Again,
the difference in the temperature recovery patterns of these working
muscles could be related to the extended time it took for the high
fitness group to complete the exercise task.
The heart site was the only area where the unfit group experi
enced a higher temperature than the fit group. This variation,
.05°C, was so small that any possible significance which could be
assumed was that there was no difference. The heart was the only
location to show such agreement. The heart area did not experience
any changes through recovery regardless of fitness whereas the
extremities did show such a divergence. It would seem logical to
assume that the time taken for the fit group to reach the final
heart rate dynalevel did not affect the reaction of the heart area in
any way differently than the unfit group. There was little differ
ence in the heat producing heart functions of both groups as a
result of exercise. Differences lie in the vascular extremities
in relation to skin temperature. Also, it must be realized that
the only muscle still in a working state during recovery, was the
heart. The cause for the uniformity between groups through recovery
may be related to the continued activity of the heart during the
resting period.
The secondary purpose of the study was to determine if a
specific body location could be found that possessed the necessary
qualities that may establish radiometry as a method for determining
an individual's level of physical fitness.
72A review'of the regression analyses to find such a location
was conducted. During the exercise phase of the study the bicep
brachii and rectus femoris locations possessed linear qualities for
the high and low fitness groups and the sixty subject sample.
However, little divergence between the two fitness groups was noted
in the plots, (see Appendixes G and H) and the two sites were not
considered further.
The recovery from exercise results indicated the head location
was the only site demonstrating a linear relationship between skin
temperature and time among all three groups. The fitness group
displayed no distinguishing qualities in skin temperature change
through recovery time that could be utilized to develop a testing
criterion. See Appendix I.
After reviewing the data collected the palm site provided the
best possibility for further study. Appendixes J and K present the
skin temperature graphic plots of the palm location during exercise
and through recovery. There appears to be enough differences in
skin temperature between the fitness groups beginning with the
dynalevel of 140 beats per minute, ,35°C, and increasing to the
final exercise monitoring at 180 beats per minute, ,83°C, to warrant
further study. The use of this site may allow the development of
a physical fitness test that would monitor skin temperature
immediately after the heart rate attained 140, 160, or 180 beats
per minute and through an index provide the fitness level of the
individual. In addition to the above monitoring periods, there
seems to be enough difference in skin temperature between the two
fitness groups at three minutes into recovery, .65°C, to merit further
investigation.
Conclusions
Within the limitations of this study the following conclusions
were made:
1. Low fit individuals experience lower skin temperature than
highly fit individuals as exercise increases to maximal levels.
2. Highly fit individuals experience higher skin temperatures
during recovery from exercise than low fit individuals.
3. There is evidence that the fitness level of an individual
may be determined by measuring skin temperature at the center of
the palm.
Recommendations
1. A longitudinal study should be conducted to determine
what effects age would have upon skin temperature patterns as a
result of exercise stress.
2. A study should be conducted to determine whether resting
skin temperature monitoring of the palm would correlate highly
with the results of an established test of physical fitness.

BIBLIOGRAPHY

BIBLIOGRAPHY
A. BOOKS
Abramson, David I. Circulation in the Extremities. New York: Academic Press, 1967.
Allen, Edgar, and Hines Baker. Peripheral Vascular Disease. Philadelphia: W. B. Sanders, 1947.
Astrand, Per-Olof, and Kaare Rodahl. Textbook of Work Physiology.New York: McGraw-Hill, 1970.
Barnes Engineering Company. Operating and Service Manual. Stanford, Connecticut: Products Division, Barnes Engineering Company.
Best, Charles H., and Norman B, Taylor, Eds. The Physiological Basis of Medical Practice. Seventh Edition, Baltimore:Williams and Wilkinson, 1961.
Chapman, Carleton B., and Jere H. Mitchell. The Physiology of Exercise. New York: Scientific American, 1965.
de Vries, Herbert A. Physiology of Exercise. Dubuque: W. C.Brown, 1966.
Dorland's Illustrated Medical Dictionary. Twenty-fourth Edition, Philadelphia: W. B. Saunders, 1965.
Karpovich, Peter V., and Wayne E. Sinning. Physiology of MuscularActivity. Seventh Edition, Philadelphia: W. B. Saunders, 1971.
Quinton Instruments. Instrument Manual. Seattle: Quinton Instruments, 1968.
Morehouse, Laurence E., and Augustus T. Miller, Jr. Physiology of Exercise. Fifth Edition, St. Louis: C. V. Mosby, 1967.
Ruch, Theodore C., and Harry D. Patton. Eds. Physiology and Biophysics. Nineteenth Edition, Philadelphia: W. B. Saunders,1965.
Schmidt, J. E. Medical Discoveries. Springfield: Charles C. Thomas,1959.
- 75
76
B. PERIODICALS AND PUBLICATIONS
Albert, S. M., M. Glickman and M. Kalllsh. "Thermography in Orthopedics," Annals of the New York Academy of Sciences, CXXI (October, 1964), 157-70.
Baker, Lawrence M., and William M. Taylor. "The Relationship Under Stress Between Changes in Skin Temperature, Electrical Skin Resistance, and Pulse Rate," Journal of Experimental Psychology, XLVIII (May, 1954), 361-66,
Barnes, R. B. "Determination of Body Temperature in Infrared Emission," Journal of A££lied Ph^sioLag^r, XXII (June, 1967), 1143- 46.
. "Thermography," Annals of the New York Academy of Sciences,CXXI (October, 1964), 34-47.
Boas, Norman F. "Thermography in Rheumatoid Arthritis," Annals of the New York Academy of Sciences, CXXI (October, 1964), 223-34.
Brueschke, E. E, "Infrared Thermoprofile Analysis in ClinicalMedicine," American Journal of Medical Electronics, IV (ND), 65.
Chato, J. C., and others. "On the Dimensionless Parameters Associated with Heat Transport within Living Tissue," Aerospace Medicine,XLI (April, 1970), 390-3.
Connel, James F. Jr., and others. "Thermography in Trauma," Annalsof the New York Academy of Sciences, CXXI (October, 1964), 171-6.
Fan, Liang-Tseng., and others. "A Review on Mathematical Models of the Human Thermal System," Bio-Medical Engineering, XVIII (May, 1971), 218-234.
Gershon-Cohen, J., and others. "Medical Thermography: A Summary ofCurrent Status," Radiologic Clinics of. North America, III (December, 1965), 403-31.
Hardy, J. D. "Physiology of Temperature Regulation," Physiological Reviews, XLI (July, 1961), 521-606.
Harris, E. A., and B. B. Porter. "On the Heart Rate during Exercise, Esophageal Temperature and the Oxygen Debt," Quarterly Journal of Experimental Physiology, XLIII (July, 1958), 313-19.
Karpman, H. L. "Current Status of Thermography," Angiology, XXI (February, 1970), 103-9.
., and others. "Clinical Studies in Thermography. II. Applications of Thermography in Evaluating Musculoligamentous Injuries of the Spine — A Preliminary Report," Archives of Environmental Health, XX (March, 1970), 412-17.
77
Lawson, R. N. "Early Applications of Thermography," Annals of the New York Academy of Sciences, CXXI (October, 1964), 31-33.
Lynch, P. R., and others. "Results of Studies Using Two Radiological Methods in Investigating the Circulation of Exercising Human Arms," Journal of Physiology, CCXIII (March, 1971), 41P-42P.
Mali, J. W. H. "Some Physiological Aspects of the Temperature of the Body Surface," Proceedings of a Boerhaave Course for Postgraduate Medical Education, (ND, 1969), 8-16.
Mansfield, C. M., and others. "A Comparison of the Temperature Curves Recorded Over Normal and Abnormal Breasts," Radiology, XCIV (March, 1970), 697-8.
Maxwell-Cade, C. "Principles and Practice of Clinical Thermography," Radiography, XXXIV (February, 1968), 23-34.
Mitchell, D., and others. "Emissivlty and Transmittance of Exercised Human Skin in Its Thermal Emission Wave Band," Journal of Applied Physiology, XXIII (September, 1967), 390-4.
O'Connell, Eugene R. "The Effect of Local Isometric Muscular Activity on Local Skin Temperature," Journal for the Association for Physical and Mental Rehabilitation, XIV (May-June, 1960), 74-75.
Potanin, C., and others. "Thermographic Patterns on Angina Pectoris," Circulation, XLII (August, 1970), 199-204.
Price, Thomas R., and others. "Correlation of Thermography andAngiography in Carotid Arterial Disease: Thermographic Measurement as a Screening Technique," Neurology, XX (April, 1970),398.
Rosenberg, Norman., and Anastassios Stefanides. "Thermography in the Management of Varicose Veins and Venous Insufficiency," Annals of the New York Academy of Sciences, CXXI (October, 1964), 113-7.
Sabin, Thomas D. "Temperature-linked Sensory Loss," Archives of Neurology, XX (March, 1969), 257-62.
Saltin, B., and others. "Muscle Temperature During Submaximal Exercise in Man," Journal of Applied Physiology, XXV (December, 1968), 679-88.
Smith, R. E. "Circardian Variations in Human Thermoregulatory Responses," Journal of Applied Physiology, XXVI (May, 1969), 554-60.
van der Staak, W. J. B. M. "Experiences with the Heated Thermocouple," Dermatologies, Basel, CXXXII (ND, 1966), 192-205.
78Watmough, D. J., and R. Oliver. "Emissivity of Human Skin in Vivo
between 2.0y and 5.4 u Measured at Normal Incidence." Nature, CCXVIII (June, 1968), 885-6.
Williams, K. Lloyd, "Infrared Thermometry as a Tool in Medical Research," Annals of the New York Academy of Sciences, CXXI (October, 1964), 99-112.
Winsor, Travis, and Jesus Bendezu. "Thermography and the Periferal Circulation," Annals of the New York Academy of Sciences. CXXI (October, 1964), 135-55.
C. UNPUBLISHED MATERIALS
Collins, D. Ray. "A Comparison of the 'Slipper-Sock" Footprint Test and the Harris Footprint Test as Possible Indices for Prediction of Skin Temperature Changes of the Feet," A paper read at the Social Rehabilitation Service Research Staff Meeting at U. S. Public Health Service Hospital, Carville, Louisiana,April 13, 1971.
Gantt, Robert B. "Bilateral Comparisons of Skin Temperatures of Uninjured and Postoperative Knees Before and After Exercise," Unpublished Master's thesis, Louisiana State University, 1972.
Loiselle, Denis. "The Effects of Varied Thermal Environments onSelected Physiological Variables," Microcarded Master's thesis, University of Alberta, 1966.
Quinton Instruments. "Instruction Sheet for the Exercise Cardio Tachometer Model QI-609," Seattle, Washington.

APPENDIXES
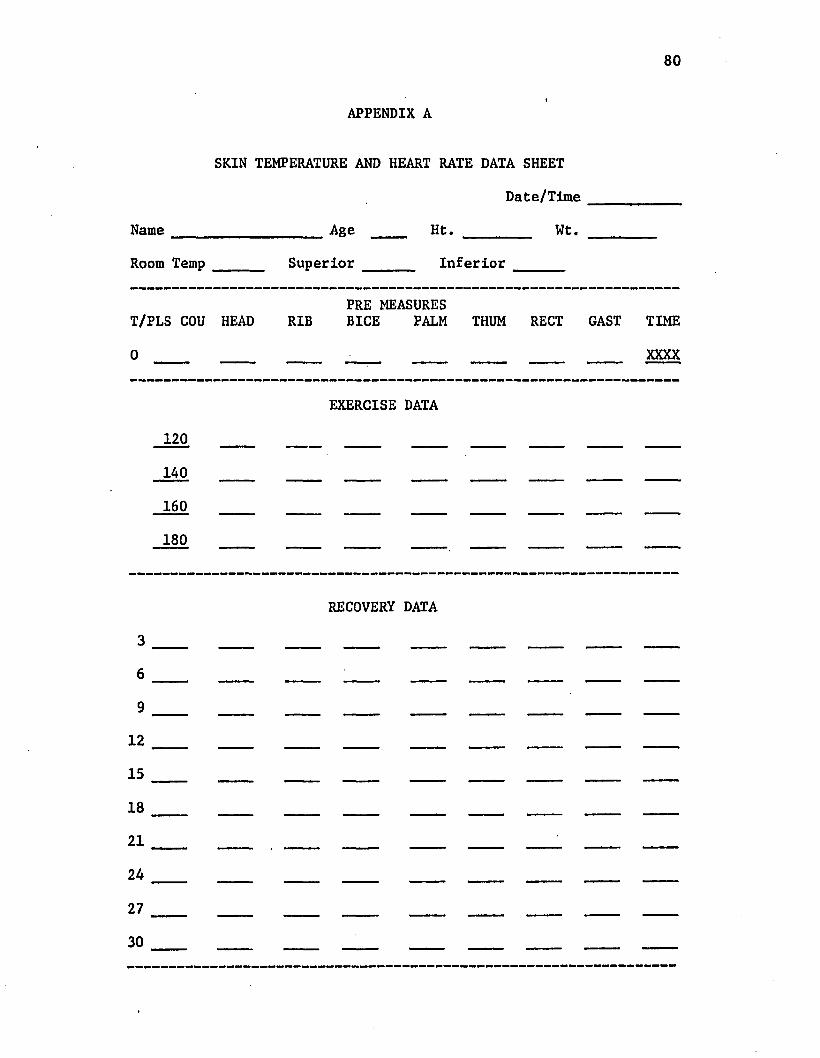
APPENDIX A
Name
SKIN TEMPERATURE AND HEART RATE DATA SHEET
Date/Time
_______________ Age ____ Ht. _________ Wt.
Room Temp Superior Inferior
PRE MEASUREST/PLS COU HEAD RIB BICE PALM THUM RECT GAST TIME
XXXX
120140
160
180
EXERCISE DATA
RECOVERY DATA
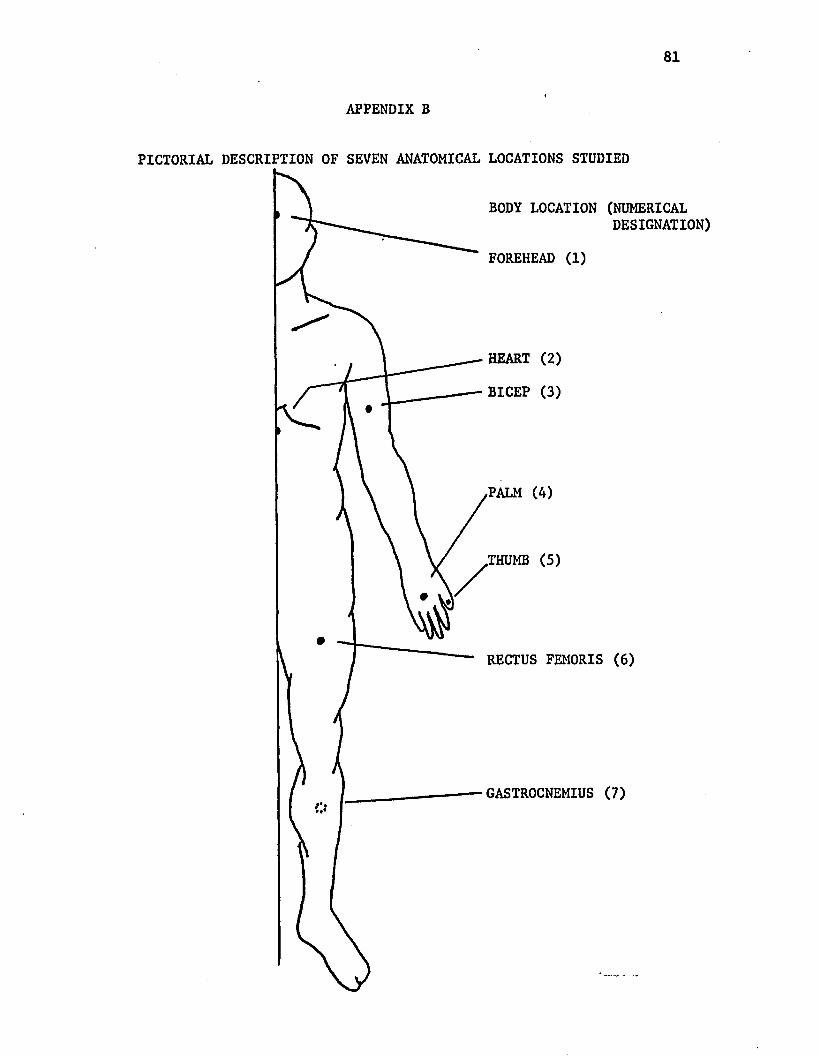
APPENDIX B
PICTORIAL DESCRIPTION OF SEVEN ANATOMICAL LOCATIONS STUDIED
BODY LOCATION (NUMERICALDESIGNATION)
FOREHEAD (1)
HEART (2)
BICEP (3)
PALM (4)
.THUMB (5)
RECTUS FEMORIS (6)
GASTROCNEMIUS (7)
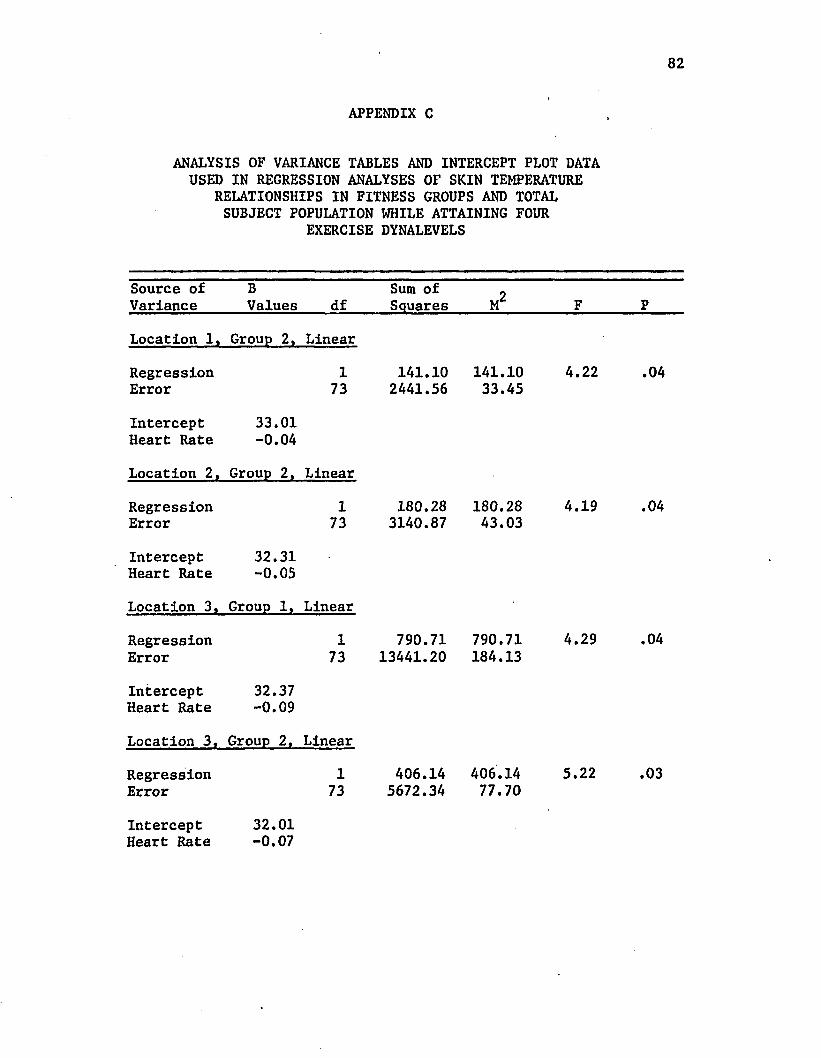
82
APPENDIX C
ANALYSIS OF VARIANCE TABLES AND INTERCEPT PLOT DATA USED IN REGRESSION ANALYSES OF SKIN TEMPERATURE
RELATIONSHIPS IN FITNESS GROUPS AND TOTAL SUBJECT POPULATION WHILE ATTAINING FOUR
EXERCISE DYNALEVELS
Source of Variance
BValues df
Sum of Squares M 2 F P
Location 1, Group 2, Linear
RegressionError
173
141.102441.56
141.1033.45
4.22 .04
Intercept Heart Rate
33.01-0.04
Location 2, Group 2, Linear
RegressionError
173
180.283140.87
180.2843.03
4.19 .04
Intercept Heart Rate
32.31-0.05
Location 3, Group 1, Linear
RegressionError
173
790.7113441.20
790.71184.13
4.29 .04
Intercept Heart Rate
32.37-0.09
Location 3, Group 2, Linear
RegressionError
173
406.145672.34
406.1477.70
5.22 .03
Intercept 32.01a n*7
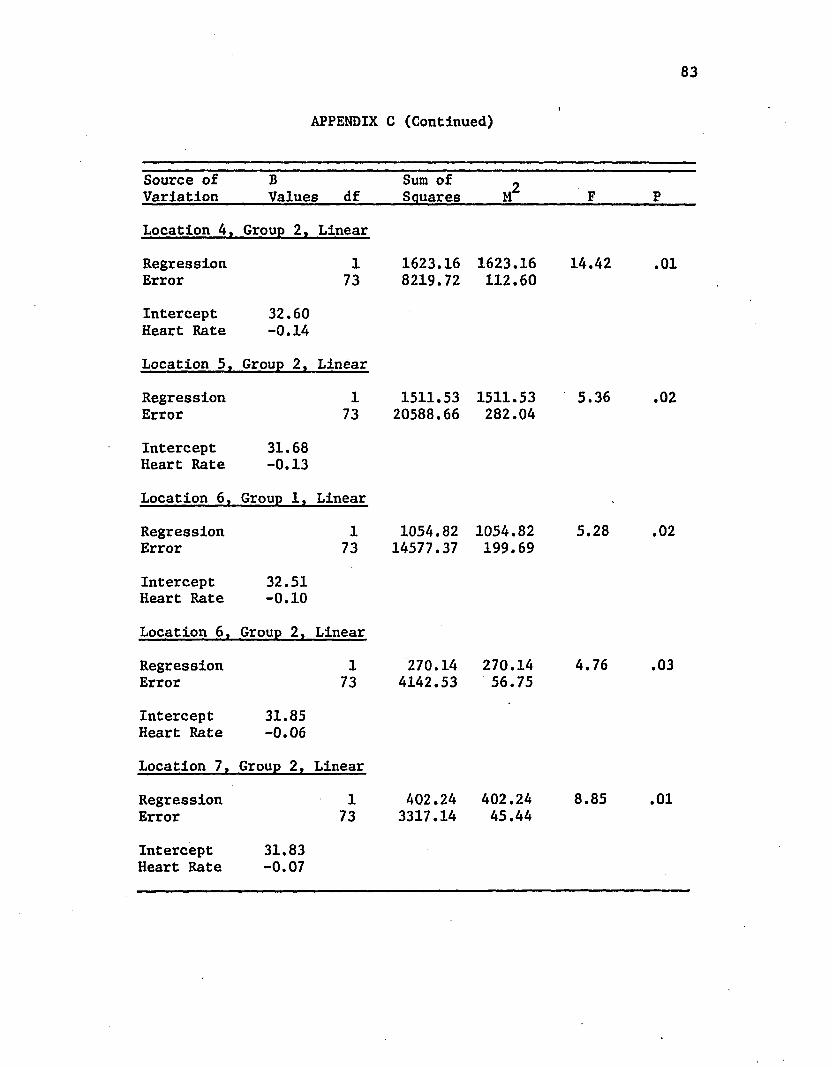
83
APPENDIX C (Continued)
Source of Variation
BValues df
Sum of Squares M2 F P
Location 4. Group 2. Linear
RegressionError
173
1623.168219.72
1623.16112.60
14.42 .01
Intercept 32.60 Heart Rate -0.14
Location 5, Group 2, Linear
RegressionError
173
1511.5320588.66
1511.53282.04
5.36 .02
Intercept 31.68 Heart Rate -0.13
Location 6, Group 1, Linear
RegressionError
173
1054.8214577.37
1054.82199.69
5.28 .02
Intercept 32.51 Heart Rate -0.10
Location 6 , Group 2, Linear
RegressionError
173
270.144142.53
270.1456.75
4.76 .03
Intercept 31.85 Heart Rate -0.06
Location 7, Group 2, Linear
Regression 1 A02.24 402.24 8.85 .01Error 73 3317.14 45.44
InterceptHeart Rate
31.83-0.07
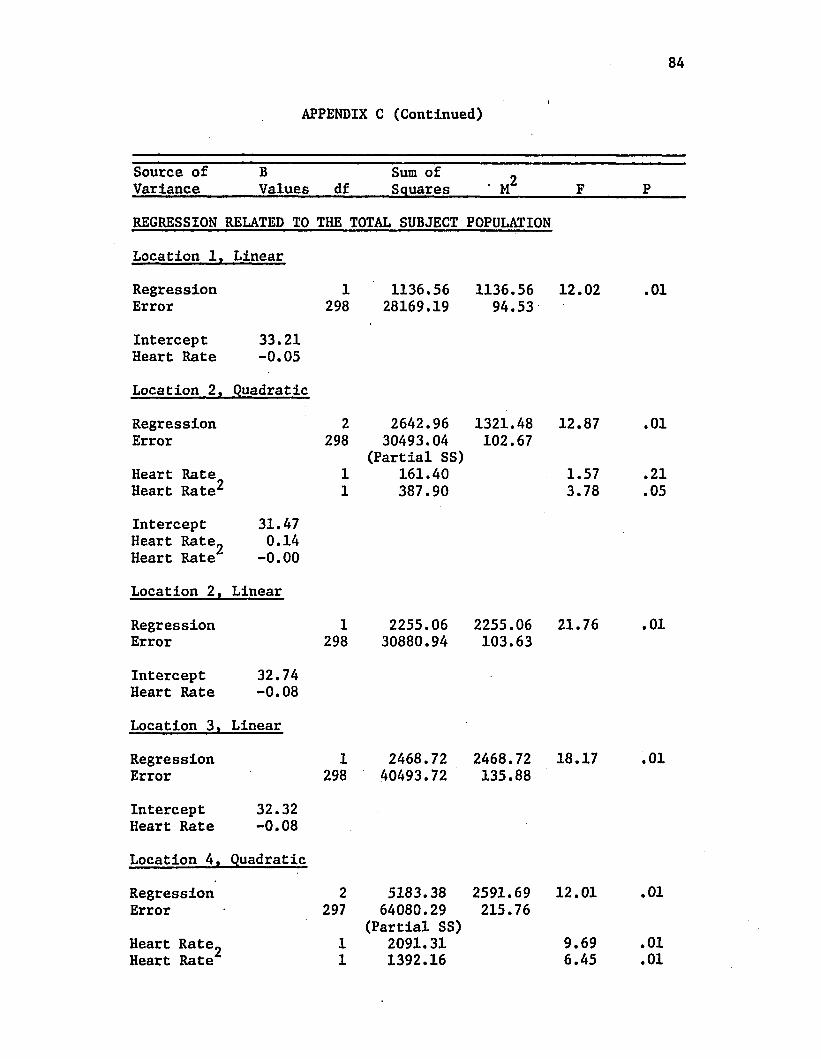
84
APPENDIX C (Continued)
Source of Variance
BValues df
Sum of Squares • M 2 F P
REGRESSION RELATED TO THE TOTAL SUBJECT POPULATION
Location 1, Linear
RegressionError
1298
1136.5628169.19
1136.5694.53
12.02 .01
Intercept Heart Rate
33.21-0.05
Location 2, Quadratic
RegressionError
Heart Rate Heart Rate^
2298
11
2642.96 30493.04
(Partial SS) 161.40 387.90
1321.48102.67
12.87
1.573.78
.01
.21
.05
Intercept Heart Rate_ Heart Rate
31.470.14
-0.00
Location 2, Linear
RegressionError
1298
2255.0630880.94
2255.06103.63
21.76 .01
Intercept Heart Rate
32.74-0.08
Location 3, Linear
RegressionError
1298
2468.7240493.72
2468.72135.88
18.17 .01
Intercept Heart Rate
32.32-0.08
Location 4, Quadratic
RegressionError
Heart Rate„ Heart Rate
2297
11
5183.38 64080.29
(Partial SS) 2091.31 1392.16
2591.69215.76
12.01
9.696.45
.01
.01
.01
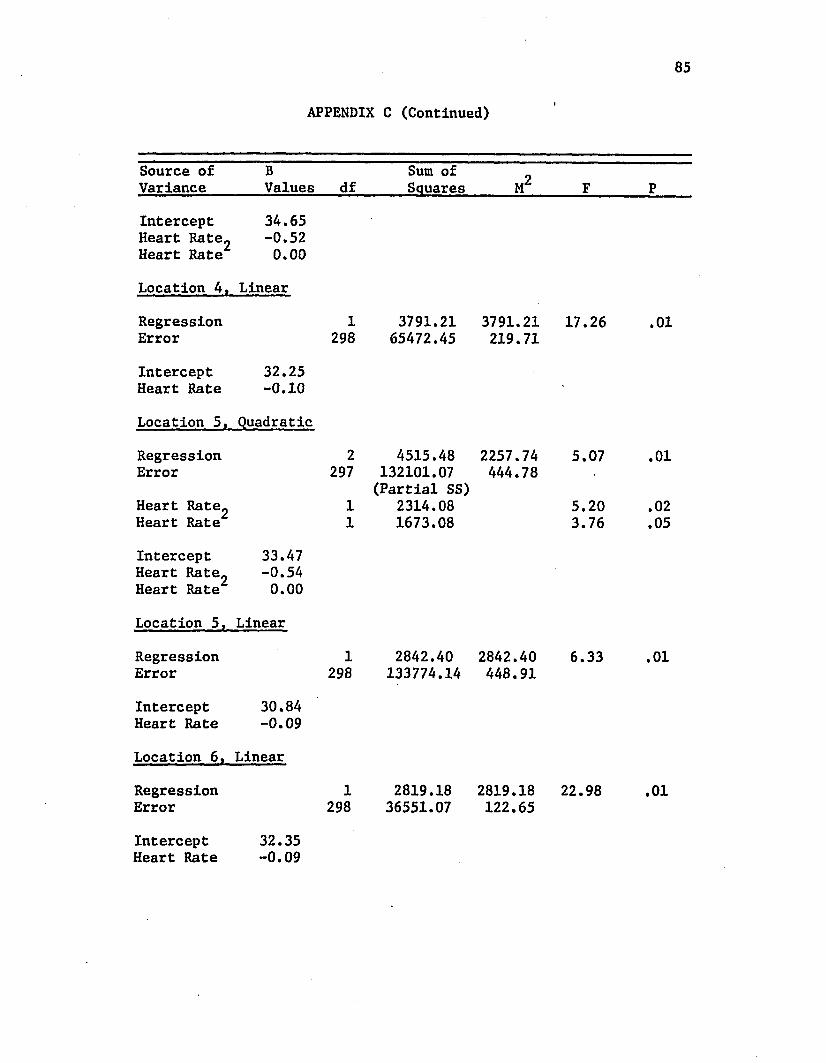
85
APPENDIX C (Continued)
Source of Variance
BValues df
Sum of Squares M2 F P
Intercept Heart Rate^ Heart Rate
34.65-0.520.00
Location 4, Linear
RegressionError
1298
3791.2165472.45
3791.21219.71
17.26 .01
Intercept Heart Rate
32.25-0.10
Location 5, Quadratic
RegressionError
Heart Rate^ Heart Rate
2297
11
4515.48 132101.07 (Partial SS)
2314.081673.08
2257.74444.78
5.07
5.203.76
.01
.02
.05
Intercept Heart Rate. Heart Rate
33.47-0.540.00
Location 5, Linear
RegressionError
1298
2842.40133774.14
2842.40448.91
6.33 .01
Intercept Heart Rate
30.84-0.09
Location 6. Linear
RegressionError
1298
2819.1836551.07
2819.18122.65
22.98 .01
InterceptHeart Rate
32.35-0.09
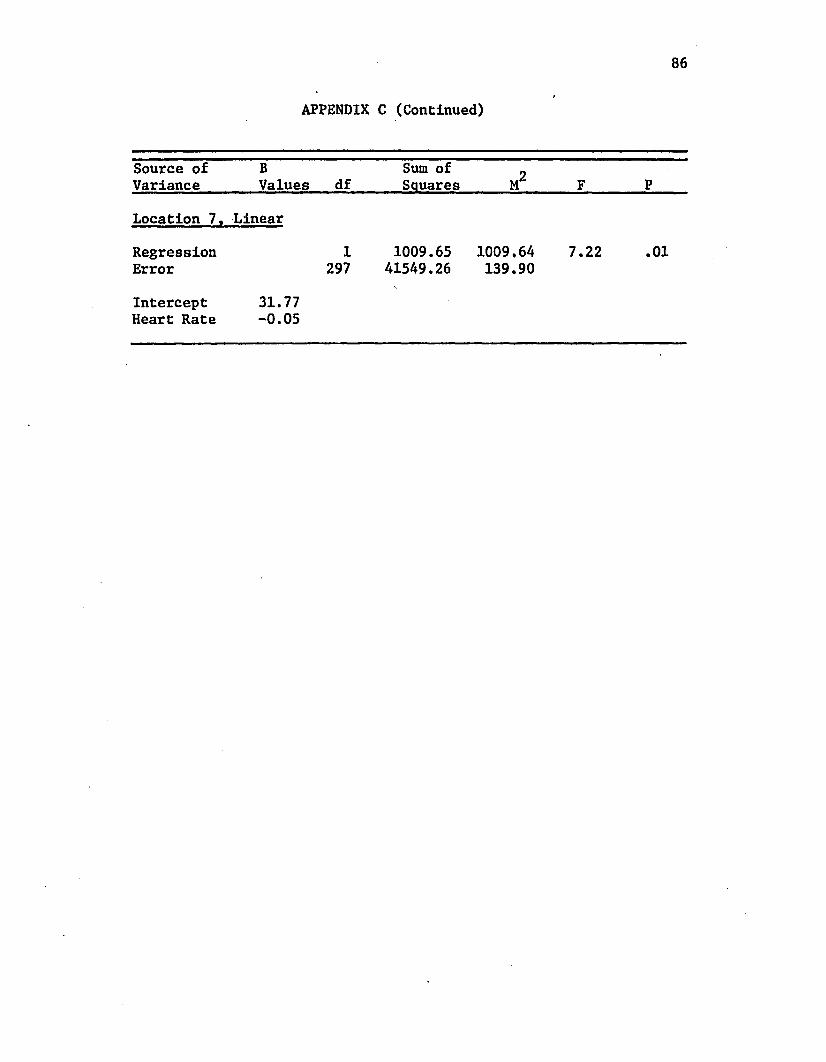
86
APPENDIX C (Continued)
Source of Variance
BValues df
Sum of Squares M 2 F P
Location 7, Linear
Regression 1 1009.65 1009.64 7.22 .01Error 297 41549.26 139.90
Intercept 31.77Heart Rate -0.05
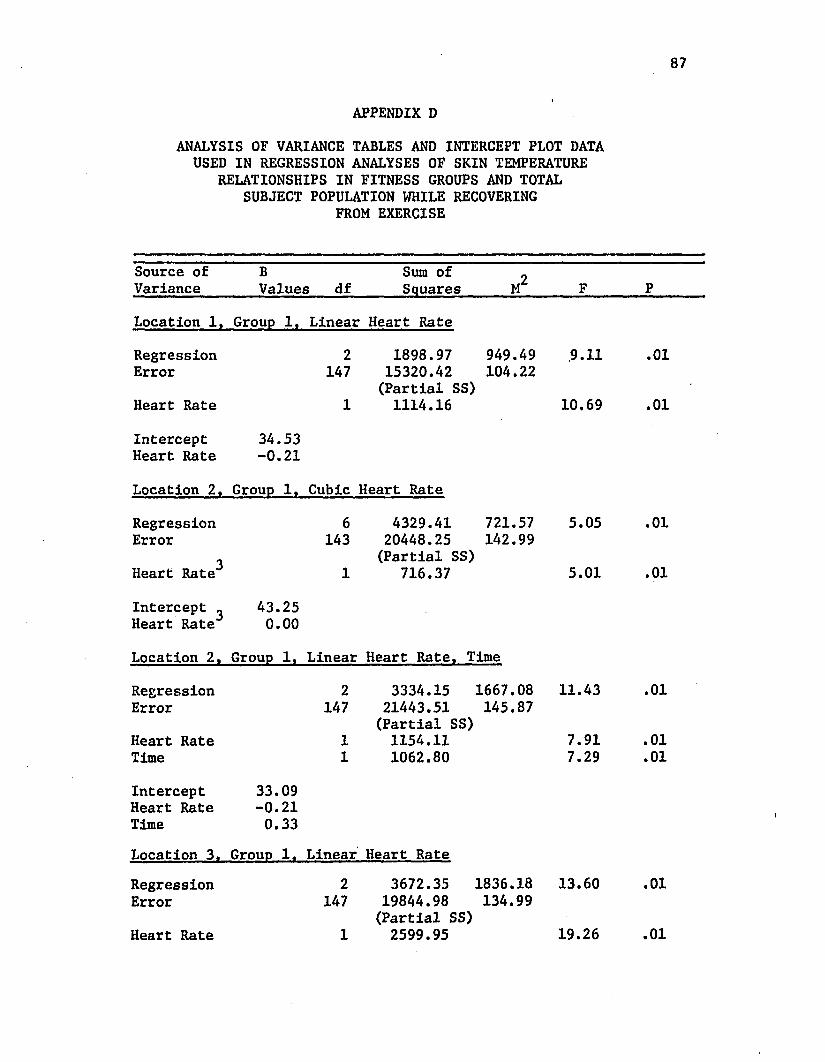
87
APPENDIX DANALYSIS OF VARIANCE TABLES AND INTERCEPT PLOT DATA
USED IN REGRESSION ANALYSES OF SKIN TEMPERATURE RELATIONSHIPS IN FITNESS GROUPS AND TOTAL
SUBJECT POPULATION WHILE RECOVERING FROM EXERCISE
Source of Variance
BValues df
Sum of Squares M2 F P
Location 1, Group 1, Linear Heart Rate
Regression 2 1898.97 949.49 .9.11 .01Error 147 15320.42 104.22
(Partial SS)Heart Rate 1 1114.16 10.69 .01
Intercept 34.53Heart Rate -0.21
Location 2, Group 1, Cubic Heart Rate
Regression 6 4329.41 721.57 5.05 .01Error 143 20448.25 142.99
3 (Partial SS)Heart Rate 1 716.37 5.01 .01
Intercept _ 43.25Heart Rate 0.00
Location 2, Group 1, Linear Heart Rate, Time
Regression 2 3334.15 1667.08 11.43 .01Error 147 21443.51 145.87
(Partial SS)Heart Rate 1 1154.11 7.91 .01Time 1 1062.80 7.29 .01
Intercept 33.09Heart Rate -0.21Time 0.33Location 3. Group 1. Linear Heart Rate
Regression 2 3672.35 1836.18 13.60 .01Error 147 19844.98 134.99
(Partial SS)Heart Rate 1 2599.95 19.26 .01
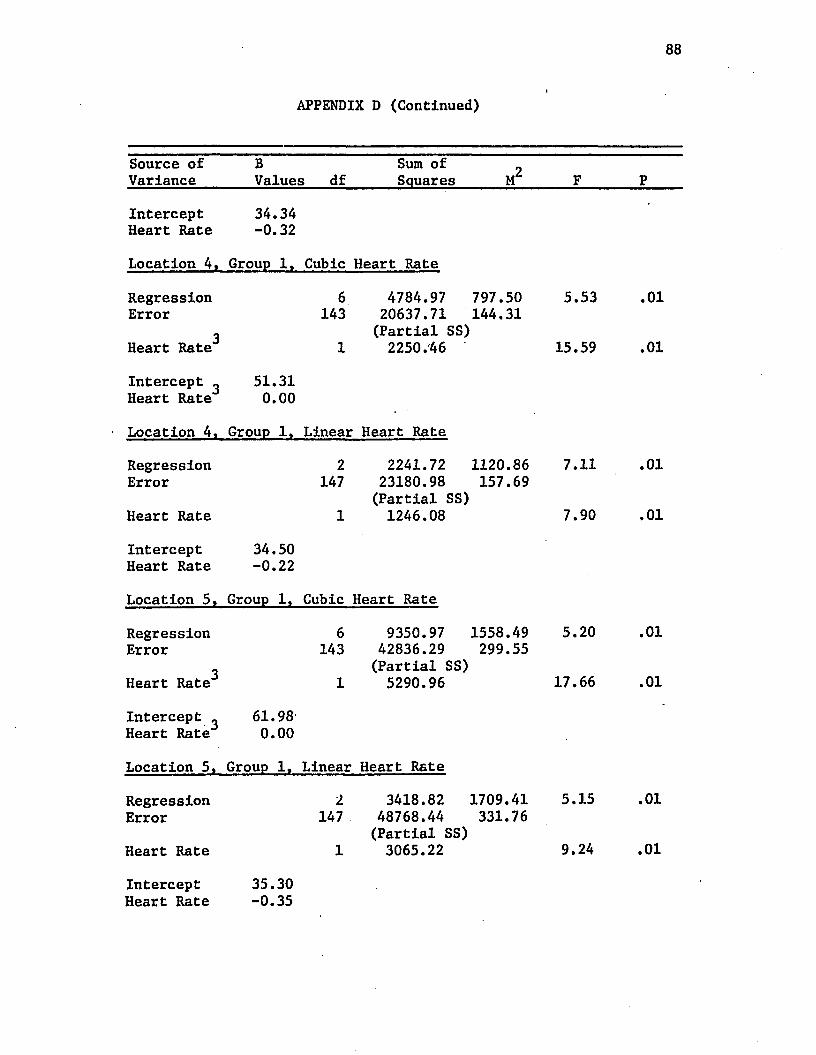
88
APPENDIX D (Continued)
Source of Variance
BValues df
Sum of ^ Squares M F P
Intercept Heart Rate
34.34-0.32
Location 4, Group 1, Cubic Heart Rate
RegressionError
3Heart Rate
6143
1
4784.97 797.50 20637.71 144.31 (Partial SS) 2250.46
5.53
15.59
.01
.01
Intercept ^ Heart Rate
51.310.00
Location 4, Group 1, Linear Heart Rate
RegressionError
Heart Rate
2147
1
2241.72 1120.86 23180.98 157.69 (Partial SS)1246.08
7.11
7.90
.01
.01
Intercept Heart Rate
34.50-0.22
Location 5, Group 1, Cubic Heart Rate
RegressionError
3Heart Rate
6143
1
9350.97 1558.49 42836.29 299.55 (Partial SS)5290.96
5.20
17.66
.01
.01
Intercept . Heart Rate
61.980.00
Location 5, Group 1, Linear Heart Rate
RegressionError
Heart Rate
2147
1
3418.82 1709.41 48768.44 331.76 (Partial SS)3065.22
5.15
9.24
.01
.01
Intercept Heart Rate
35.30-0.35
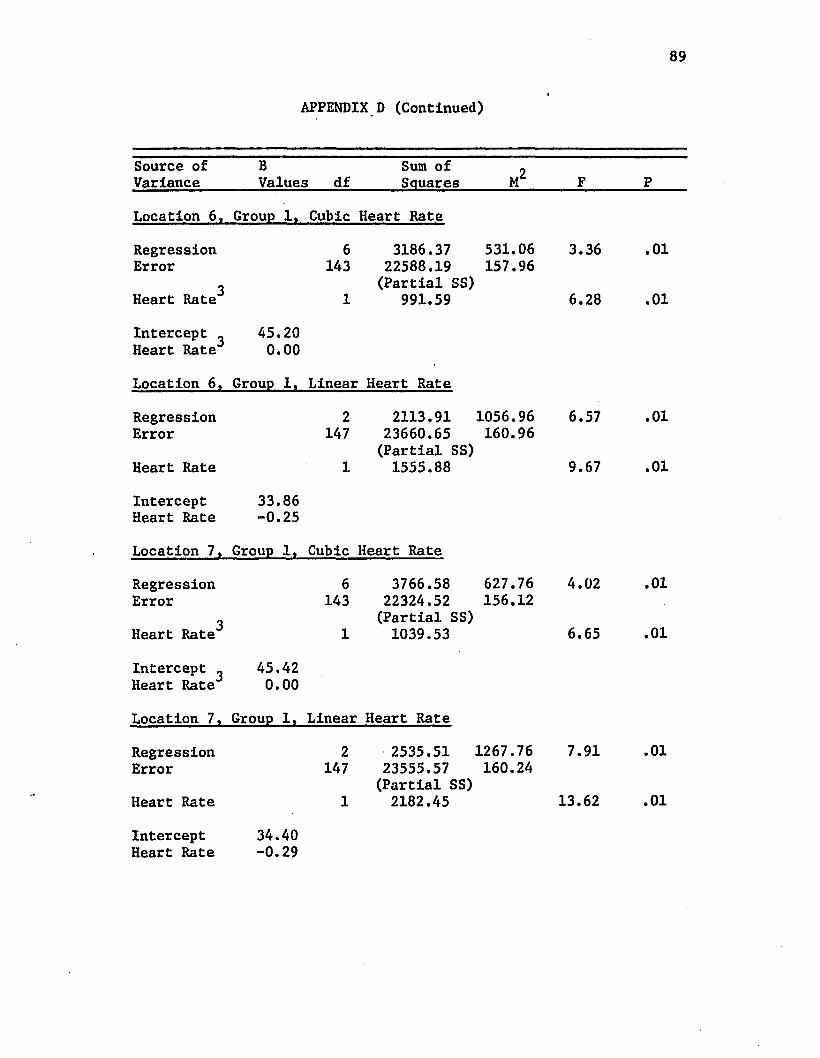
89
APPENDIX D (Continued)
Source of Variance
BValues df
Sum of Squares M2 F P
Location 6, Group 1, Cubic Heart Rate
Regression 6 3186.37 531.06 3.36 .01Error 143 22588.19 157.96
3 (Partial SS)Heart Rate 1 991.59 6.28 .01
Intercept , 45.20Heart Rate 0.00
Location 6 , Group 1, Linear Heart Rate
Regression 2 2113.91 1056.96 6.57 .01Error 147 23660.65 160.96
(Partial SS)Heart Rate 1 1555.88 9.67 .01
Intercept 33.86Heart Rate -0.25
Location 7, Group 1, Cubic Heart Rate
Regression 6 3766.58 627.76 4.02 .01Error 143 22324.52 156.12
3 (Partial SS)Heart Rate 1 1039.53 6.65 .01
Intercept _ 45.42Heart Rate 0.00
Location 7, Group 1, Linear Heart Rate
Regression 2 2535.51 1267.76 7.91 .01Error 147 23555.57 160.24
(Partial SS)Heart Rate 1 2182.45 13.62 .01
InterceptHeart Rate
34.40-0.29
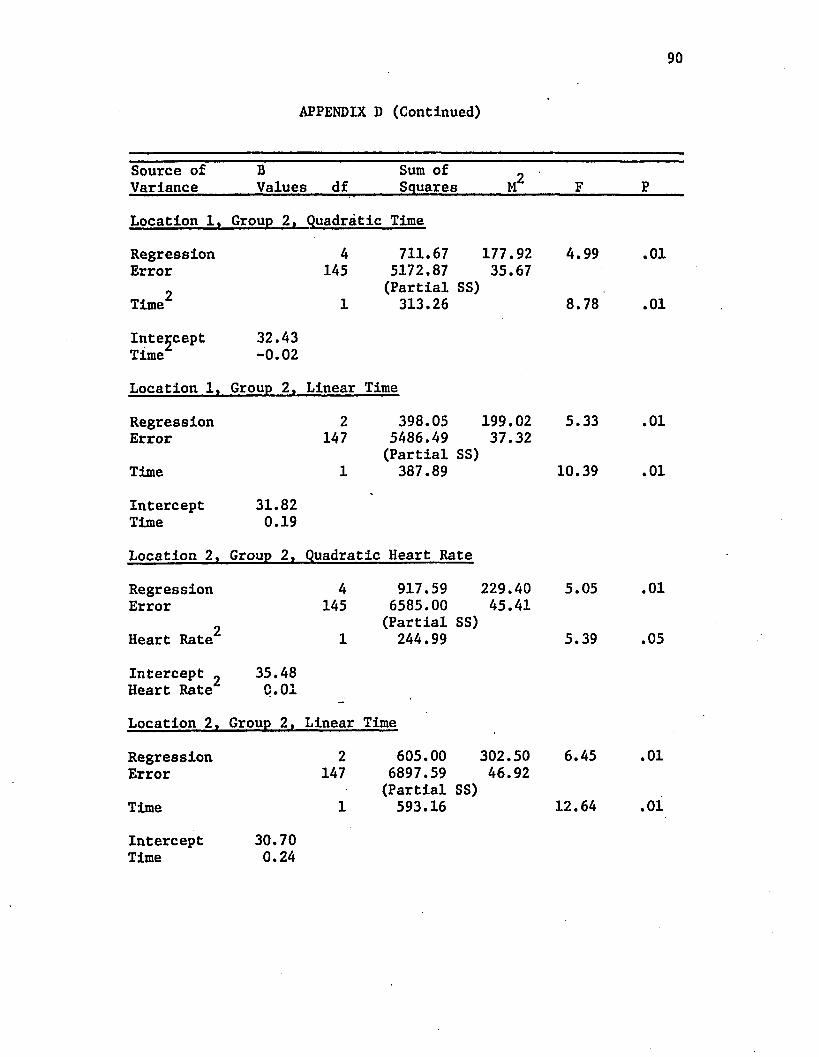
APPENDIX D (Continued)
90
Source of Variance
BValues df
Sum of Squares M2 F P
Location 1, Group 2, Quadratic Time
RegressionError
Time2
4145
1
711.675172.87(Partial313.26
177.9235.67
SS)
4.99
8.78
.01
.01
InterceptTime
32.43-0.02
Location 1, Group 2, Linear Time
RegressionError
Time
2147
1
398.055486.49(Partial387.89
199.0237.32
SS)
5.33
10.39
.01
.01
InterceptTime
31.820.19
Location 2, Group 2, Quadratic Heart Rate
RegressionError
2Heart Rate
4145
1
917.596585.00(Partial
244.99
229.4045.41
SS)
5.05
5.39
.01
.05
Intercept ^ Heart Rate
35.48C.01
Location 2, Group 2, Linear Time
RegressionError
Time
2147
1
605.006897.59(Partial593.16
302.5046.92
SS)
6.45
12.64
.01
.01
Intercept 30.70Time 0.24
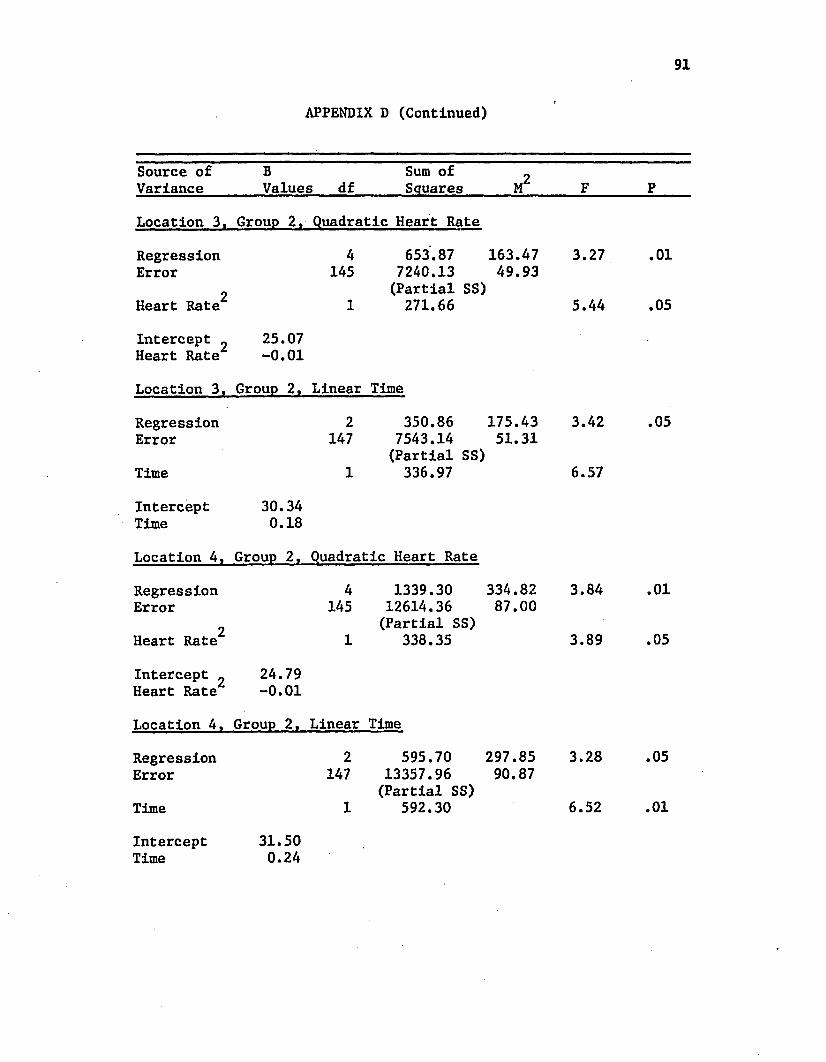
91
APPENDIX D (Continued)
Source of B Sum of oVariance Values df Squares M F P
Location 3, Group 2, Quadratic Heart Rate
Regression 4 653.87 163.47 3.27 .01Error 145 7240.13 49.93
2 (Partial SS)Heart Rate 1 271.66 5.44 .05
Intercept _ 25.07Heart Rate -0.01
Location 3, Group 2, Linear Time
Regression 2 350.86 175.43 3.42 .05Error 147 7543.14 51.31
(Partial SS)Time 1 336.97 6.57
Intercept 30.34Time 0.18
Location 4, Group 2, Quadratic Heart Rate
Regression 4 1339.30 334.82 3.84 .01Error 145 12614.36 87.00
2 (Partial SS)Heart Rate 1 338.35 3.89 .05
Intercept ^ 24.79Heart Rate -0.01
Location 4, Group 2, Linear Time
Regression 2 595.70 297.85 3.28 .05Error 147 13357.96 90.87
(Partial SS)Time 1 592.30 6.52 .01
InterceptTime
31.500.24
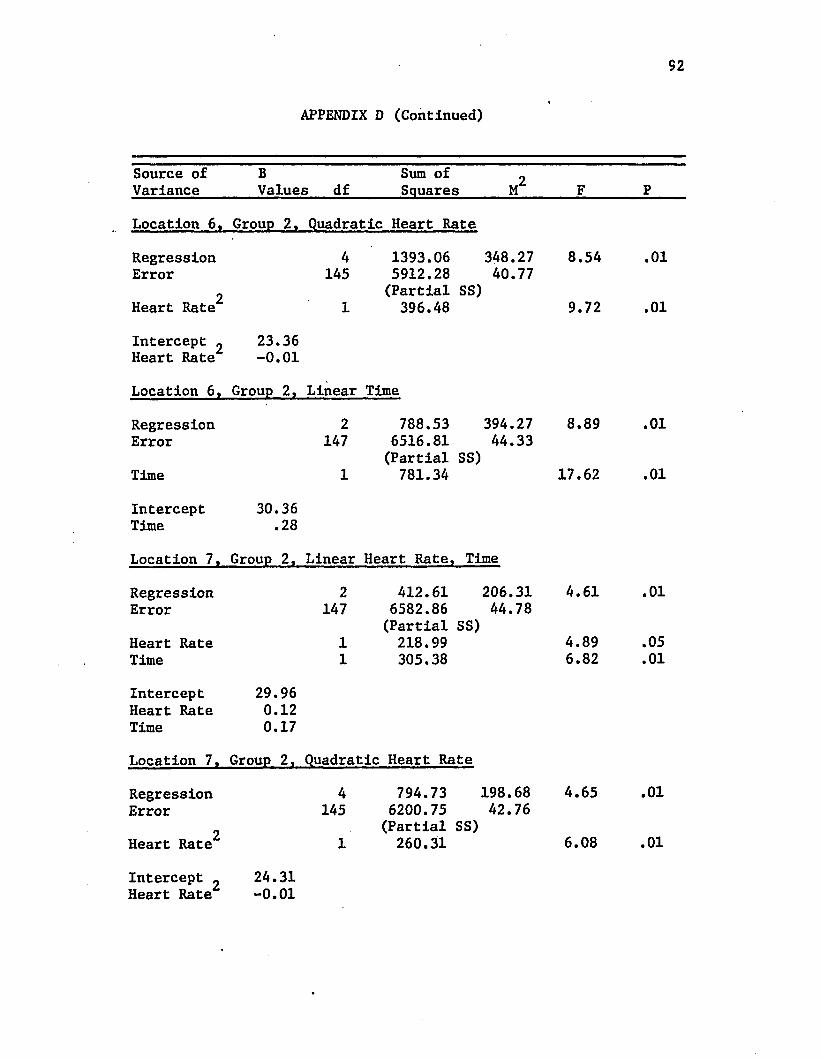
APPENDIX D (Continued)»
92
Source of B Sum of 2Variance Values df Squares M F P
Location 6. Group 2, Quadratic Heart Rate
Regression 4 1393.06 348.27 8.54 .01Error 145 5912.28 40.77
2 (Partial SS)Heart Rate 1 396.48 9.72 .01
Intercept „ 23.36Heart Rate -0.01
Location 6, Group 2, Linear Time
Regression 2 788.53 394.27 8.89 .01Error 147 6516.81 44.33
(Partial SS)Time 1 781.34 17.62 .01
Intercept 30.36Time .28
Location 7, Group 2, Linear Heart Rate, Time
Regression 2 412.61 206.31 4.61 .01Error 147 6582.86 44.78
(Partial SS)Heart Rate 1 218.99 4.89 .05Time 1 305.38 6.82 .01
Intercept 29.96Heart Rate 0.12Time 0.17
Location 7, Group 2, Quadratic Heart Rate
Regression 4 794.73 198.68 4.65 .01Error 145 6200.75 42.76
2 (Partial SS)Heart Rate 1 260.31 6.08 .01
Intercept „ 24.31Heart Rate -0.01
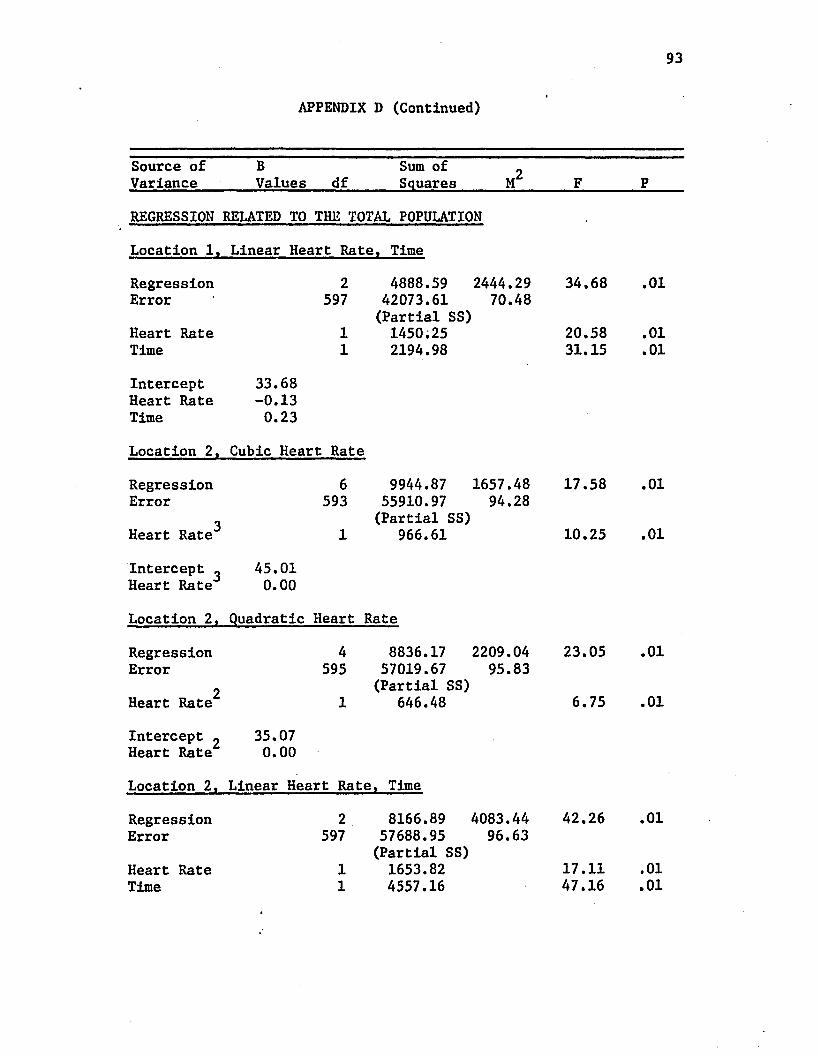
93
APPENDIX D (Continued)
Source of Variance
BValues df
Sum of Squares M 2 F P
REGRESSION RELATED TO THE TOTAL POPULATION
Location 1, Linear Heart Rate!, Time
Regression 2 4888.59 2444.29 34.68 .01Error 597 42073.61 70.48
(Partial SS)Heart Rate 1 1450.25 20.58 .01Time 1 2194.98 31.15 .01
Intercept 33.68Heart Rate -0.13Time 0.23
Location 2, Cubic Heart Rate
Regression 6 9944.87 1657.48 17.58 .01Error 593 55910.97 94.28
3 (Partial SS)Heart Rate 1 966.61 10.25 .01
Intercept ^ 45.01Heart Rate 0.00
Location 2, Quadratic Heart Rate
Regression 4 8836.17 2209.04 23.05 .01Error 595 57019.67 95.83
2 (Partial SS)Heart Rate 1 646.48 6.75 .01
Intercept ^ 35.07Heart Rate 0.00
Location 2, Linear Heart Rate , Time
Regression 2 8166.89 4083.44 42.26 .01Error 597 57688.95 96.63
(Partial SS)Heart Rate 1 1653.82 17.11 .01Time 1 4557.16 47.16 .01
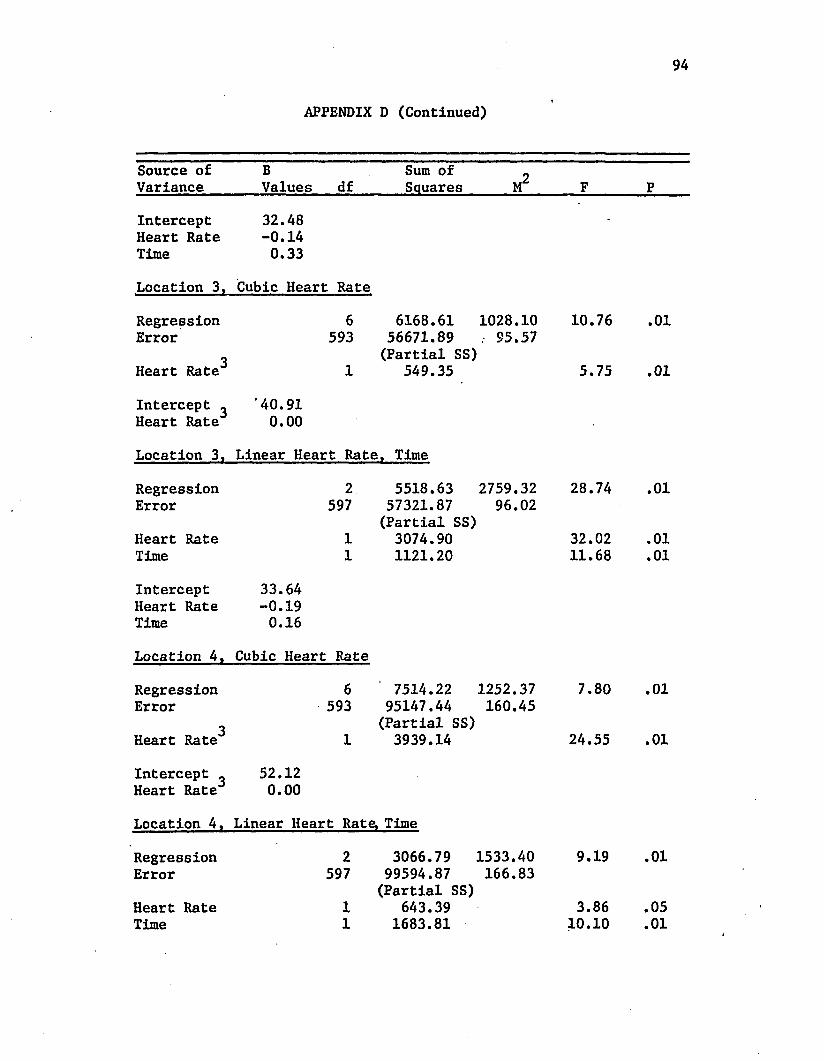
APPENDIX D (Continued)
94
Source of B Sum of 2Variance Values df Squares M F P
Intercept 32.48'
Heart Rate -0.14Time 0.33
Location 3, Cubic Heart Rate
Regression 6 6168.61 1028.10 10.76 .01Error 593 56671.89 . 95.57
3 (Partial SS)Heart Rate 1 549.35 5.75 .01
Intercept ^ '40.91Heart Rate 0.00
Location 3, Linear Heart Rate Time
Regression 2 5518.63 2759.32 28.74 .01Error 597 57321.87 96.02
(Partial SS)Heart Rate 1 3074.90 32.02 .01Time 1 1121.20 11.68 .01
Intercept 33.64Heart Rate -0.19Time 0.16
Location 4, Cubic Heart Rate
Regression 6 7514.22 1252.37 7.80 .01Error 593 95147.44 160.45
3 (Partial SS)Heart Rate 1 3939.14 24.55 .01
Intercept _ 52.12Heart Rate 0.00
Location 4, Linear Heart Rate, Time
Regression 2 3066.79 1533.40 9.19 .01Error 597 99594.87 166.83
(Partial SS)Heart Rate 1 643.39 3.86 .05Time 1 1683.81 10.10 .01
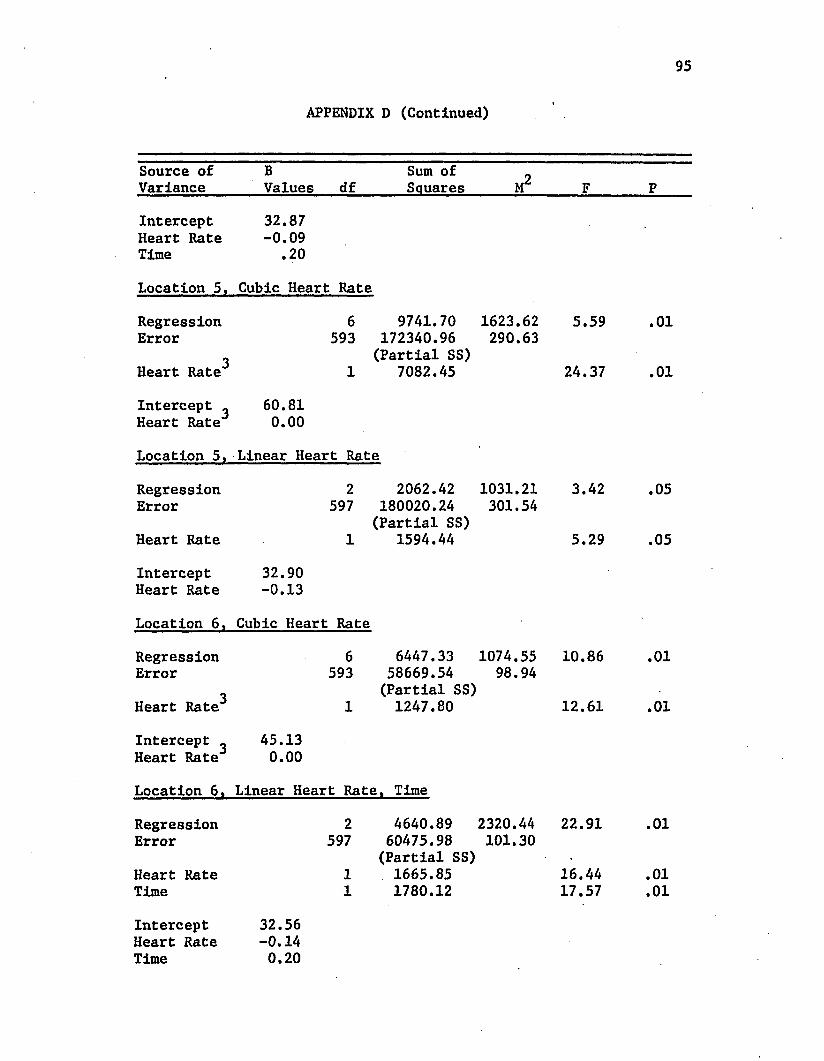
95
APPENDIX D (Continued)
Source of Variance
BValues df
Sum of Squares M2 F P
Intercept 32.87Heart Rate -0.09Time .20
Location 5, Cubic Heart Rate
Regression 6 9741.70 1623.62 5.59 .01Error 593 172340.96 290.63
3 (Partial SS)Heart Rate 1 7082.45 24.37 .01
Intercept _ 60.81Heart Rate 0.00
Location 5, Linear Heart Rate
Regression 2 2062.42 1031.21 3.42 .05Error 597 180020.24 301.54
(Partial SS)Heart Rate 1 1594.44 5.29 .05
Intercept 32.90Heart Rate -0.13
Location 6 , Cubic Heart Rate
Regression 6 6447.33 1074.55 10.86 .01Error 593 58669.54 98.94
3 (Partial SS)Heart Rate 1 1247.80 12.61 .01
Intercept » 45.13Heart Rate 0.00
Location 6 , Linear Heart Rate , Time
Regression 2 4640.89 2320.44 22.91 .01Error 597 60475.98 101.30
(Partial SS) •
Heart Rate 1 1665.85 16.44 .01Time 1 1780.12 17.57 .01
Intercept 32.56Heart Rate -0.14Time 0.20
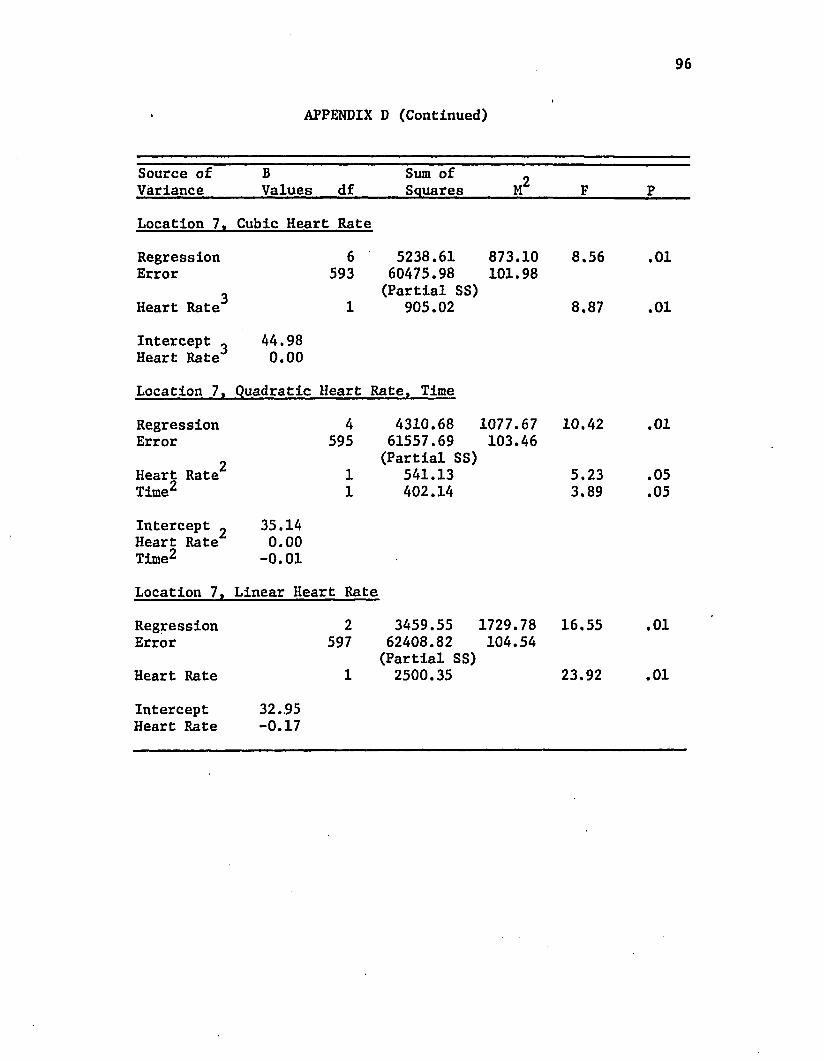
96
APPENDIX D (Continued)
Source of Variance
BValues df
Sum of Squares M 2 F P
Location 7, Cubic Heart Rate
Regression 6 5238.61 873.10 8.56 .01Error 593 60475.98 101.98
3 (Partial SS)Heart Rate 1 905.02 8.87 .01
Intercept _ 44.98Heart Rate 0.00
Location 7, Quadratic Heart Rate, Time
Regression 4 4310.68 1077.67 10.42 .01Error 595 61557.69 103.46
2 (Partial SS)Heart Rate 1 541.13 5.23 .05Time2 1 402.14 3.89 .05
Intercept ^ 35.14Heart Rate 0.00Time^ -0.01
Location 7, Linear Heart Rate
Regression 2 3459.55 1729.78 16.55 .01Error 597 62408.82 104.54
(Partial SS)Heart Rate 1 2500.35 23.92 .01
Intercept 32.95Heart Rate -0.17
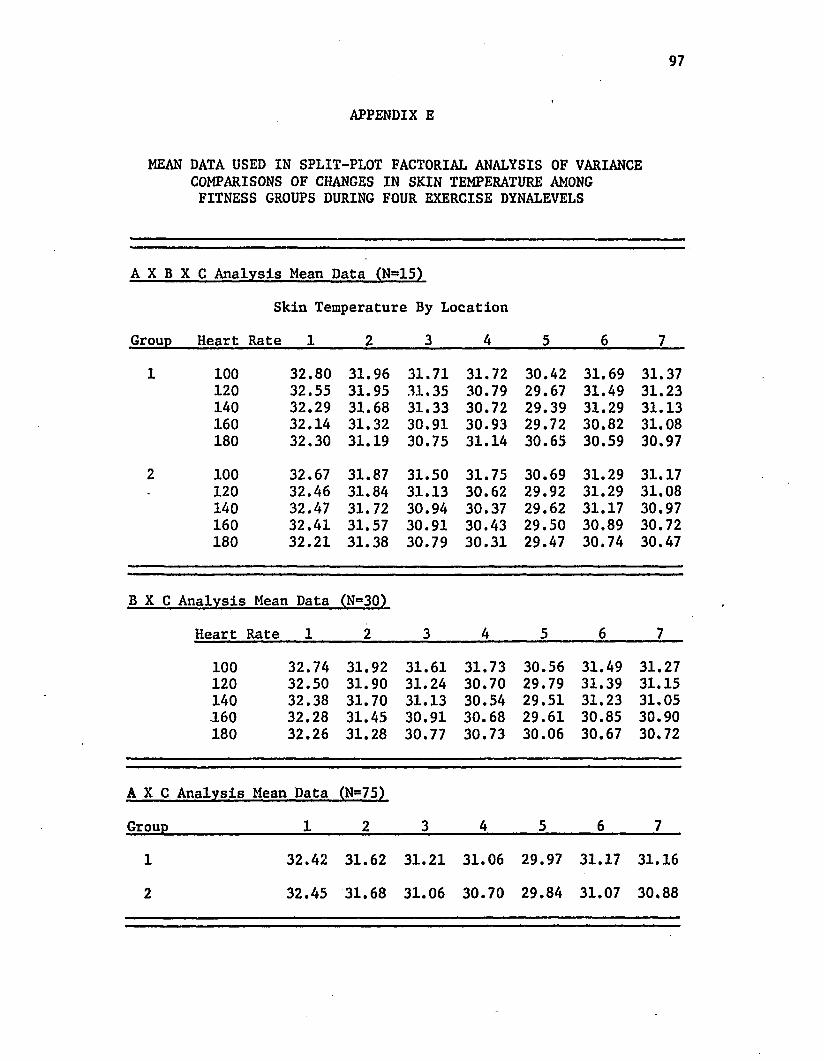
97
APPENDIX E
MEAN DATA USED IN SPLIT-PLOT FACTORIAL ANALYSIS OF VARIANCE COMPARISONS OF CHANGES IN SKIN TEMPERATURE AMONG FITNESS GROUPS DURING FOUR EXERCISE DYNALEVELS
A X B X C Analysis Mean Data (N^IS)
Skin Temperature By Location
Group Heart Rate 1 2 3 4 5 6 7
1 100 32.80 31.96 31.71 31.72 30.42 31.69 31.37120 32.55 31.95 31.35 30.79 29.67 31.49 31.23140 32.29 31.68 31.33 30.72 29.39 31.29 31.13160 32.14 31.32 30.91 30.93 29.72 30.82 31.08180 32.30 31.19 30.75 31.14 30.65 30.59 30.97
2 100 32.67 31.87 31.50 31.75 30.69 31.29 31.17. 120 32.46 31.84 31.13 30.62 29.92 31.29 31.08
140 32.47 31.72 30.94 30.37 29.62 31.17 30.97160 32.41 31.57 30.91 30.43 29.50 30.89 30.72180 32.21 31.38 30.79 30.31 29.47 30.74 30.47
B X C Analysis Mean Data (N=30)
Heart Rate 1 2 3 4 5 6 7
100 32.74 31.92 31.61 31.73 30.56 31.49 31.27120 32.50 31.90 31.24 30.70 29.79 31.39 31.15140 32.38 31.70 31.13 30.54 29.51 31.23 31.05160 32.28 31.45 30.91 30.68 29.61 30.85 30.90180 32.26 31.28 30.77 30.73 30.06 30.67 30.72
A X C Analysis Mean Data (N=75)
Group 1 2 3 4 5 6 7
1 32.42 31.62 31.21 31.06 29.97 31.17 31.16
2 32.45 31.68 31.06 30.70 29.84 31.07 30.88
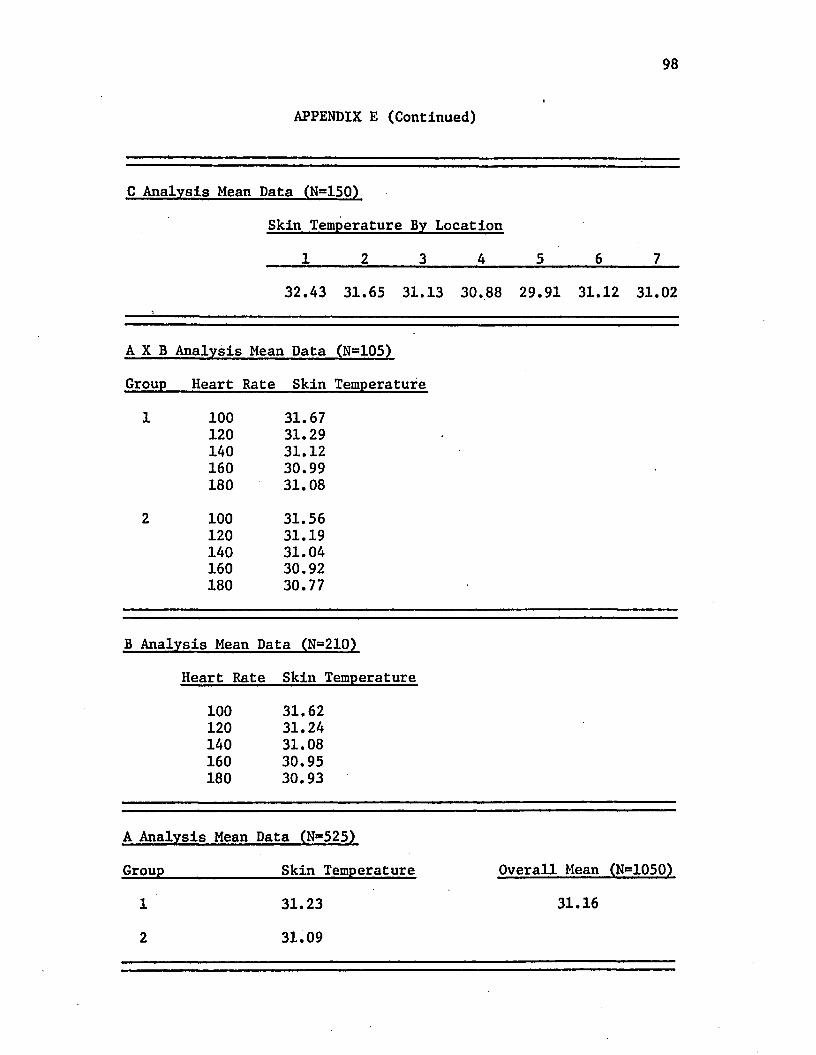
98
APPENDIX E (Continued)
C Analysis Mean Data (Ng150)
Skin Temperature By Location
1 2 3 4 5 6 7
32.43 31.65 31.13 30.88 29.91 31.12 31.02
A X B Analysis Mean Data (N=105)
Group Heart Rate Skin Temperature
100 31.67120 31.29140 31.12160 30.99180 31.08
100 31.56120 31.19140 31.04160 30.92180 30.77
B Analysis Mean Data (N=210)
Heart Rate Skin Temperature
100 31.62120 31.24140 31.08160 30.95180 30.93
A Analysis Mean Data (N=525)
Group_______________ Skin Temperature Overall Mean (N=1050)
12
31.2331.09
31.16
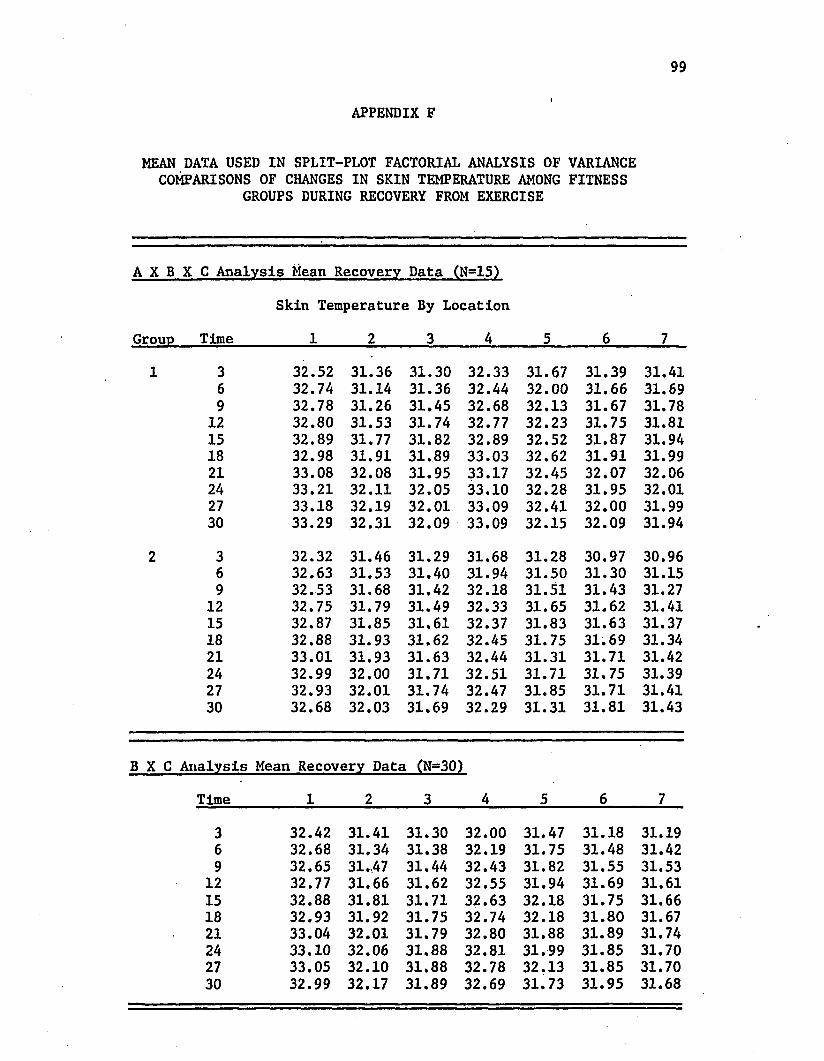
99
APPENDIX F
MEAN DATA USED IN SPLIT-PLOT FACTORIAL ANALYSIS OF VARIANCE COMPARISONS OF CHANGES IN SKIN TEMPERATURE AMONG FITNESS
GROUPS DURING RECOVERY FROM EXERCISE
A X B X C Analysis Mean Recovery Data (N=15)
Skin Temperature By Location
Group Time 1 2 3 4 5 6 7
3 32.52 31.36 31.30 32.33 31.67 31.39 31.416 32.74 31.14 31.36 32.44 32.00 31.66 31.699 32.78 31.26 31.45 32.68 32.13 31.67 31.78
12 32.80 31.53 31.74 32.77 32.23 31.75 31.8115 32.89 31.77 31.82 32.89 32.52 31.87 31.9418 32.98 31.91 31.89 33.03 32.62 31.91 31.9921 33.08 32.08 31.95 33.17 32.45 32.07 32.0624 33.21 32.11 32.05 33.10 32.28 31.95 32.0127 33.18 32.19 32.01 33.09 32.41 32.00 31.9930 33.29 32.31 32.09 33.09 32.15 32.09 31.94
3 32.32 31.46 31.29 31.68 31.28 30.97 30.966 32.63 31.53 31.40 31.94 31.50 31.30 31.159 32.53 31.68 31.42 32.18 31.51 31.43 31.27
12 32.75 31.79 31.49 32.33 31.65 31.62 31.4115 32.87 31.85 31.61 32.37 31.83 31.63 31.3718 32.88 31.93 31.62 32.45 31.75 31.69 31.3421 33.01 31.93 31.63 32.44 31.31 31.71 31.4224 32.99 32.00 31.71 32.51 31.71 31.75 31.3927 32.93 32.01 31.74 32.47 31.85 31.71 31.4130 32.68 32.03 31.69 32.29 31.31 31.81 31.43
rime 1 2 3 4 e 6 7
3 32. 42 31.41 31.30 32.00 31. 47 31.18 31.196 32. 68 31.34 31.38 32.19 31. 75 31.48 31.429 32. 65 31.,47 31.44 32.43 31. 82 31.55 31.53
12 32. 77 31.66 31.62 32.55 31. 94 31.69 31.6115 32. 88 31.81 31.71 32.63 32. 18 31.75 31.6618 32. 93 31.92 31.75 32.74 32. 18 31.80 31.6721 33. 04 32.01 31.79 32.80 31. 88 31.89 31.7424 33. 10 32.06 31.88 32.81 31. 99 31.85 31.7027 33. 05 32.10 31.88 32.78 32. 13 31.85 31.7030 32. 99 32.17 31.89 32.69 31. 73 31.95 31.68
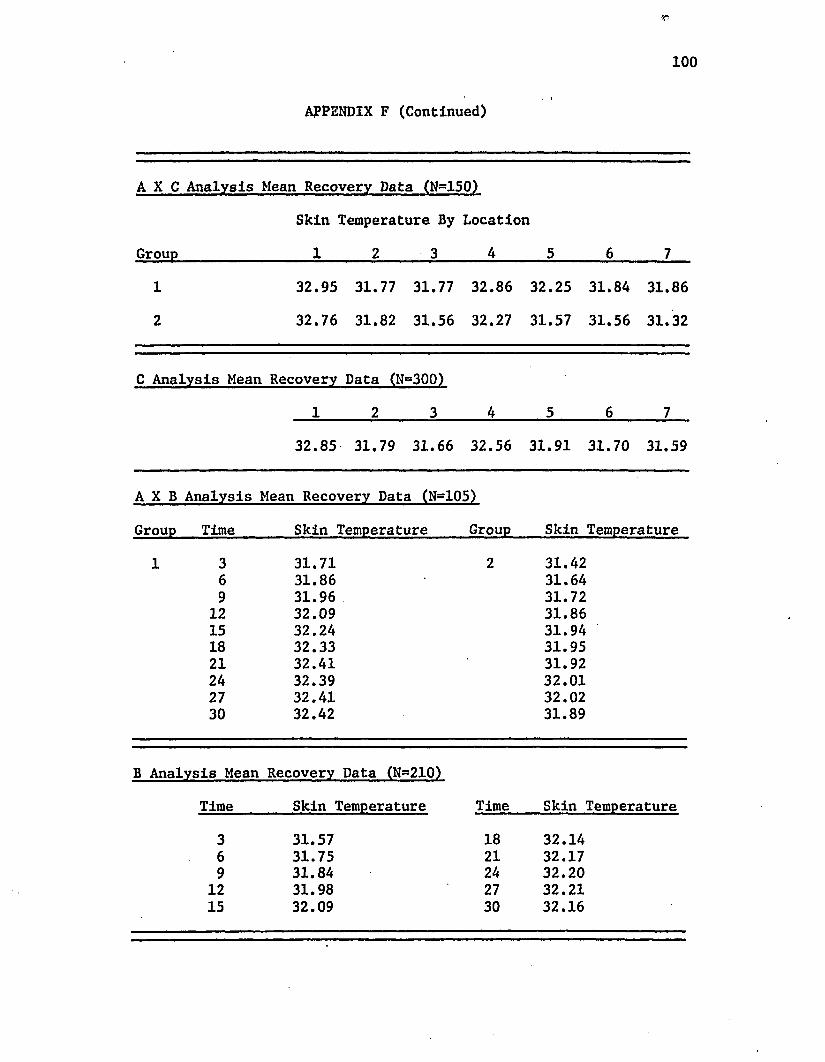
r
100. I
APPENDIX F (Continued)
A X C Analysis Mean Recovery Data (N-150)
Skin Temperature By Location
Group_________________ 1______ 2_____ _3______ 4______ 5______ 6______ 7
1 32.95 31.77 31.77 32.86 32.25 31.84 31.86
2 32.76 31.82 31.56 32.27 31.57 31.56 31.32
C Analysis Mean Recovery Data (N=300)
1 2 3 4 5 6 7
32.85 31.79 31.66 32.56 31.91 31.70 31.59
A X B Analysis Mean Recovery Data (N=105)
Group Time_______ Skin Temperature_____ Group Skin Temperature
3 31.71 2 31.426 31.86 31.649 31.96 31.72
12 32.09 31.8615 32.24 31.9418 32.33 31.9521 32.41 31.9224 32.39 32.0127 32.41 32.0230 32.42 31.89
B Analysis Mean Recovery Data (N=210)
Time Skin Temperature Time Skin Temperature
3 31.57 18 32.146 31.75 21 32.179 31.84 24 32.20
12 31.98 27 32.2115 32.09 30 32.16
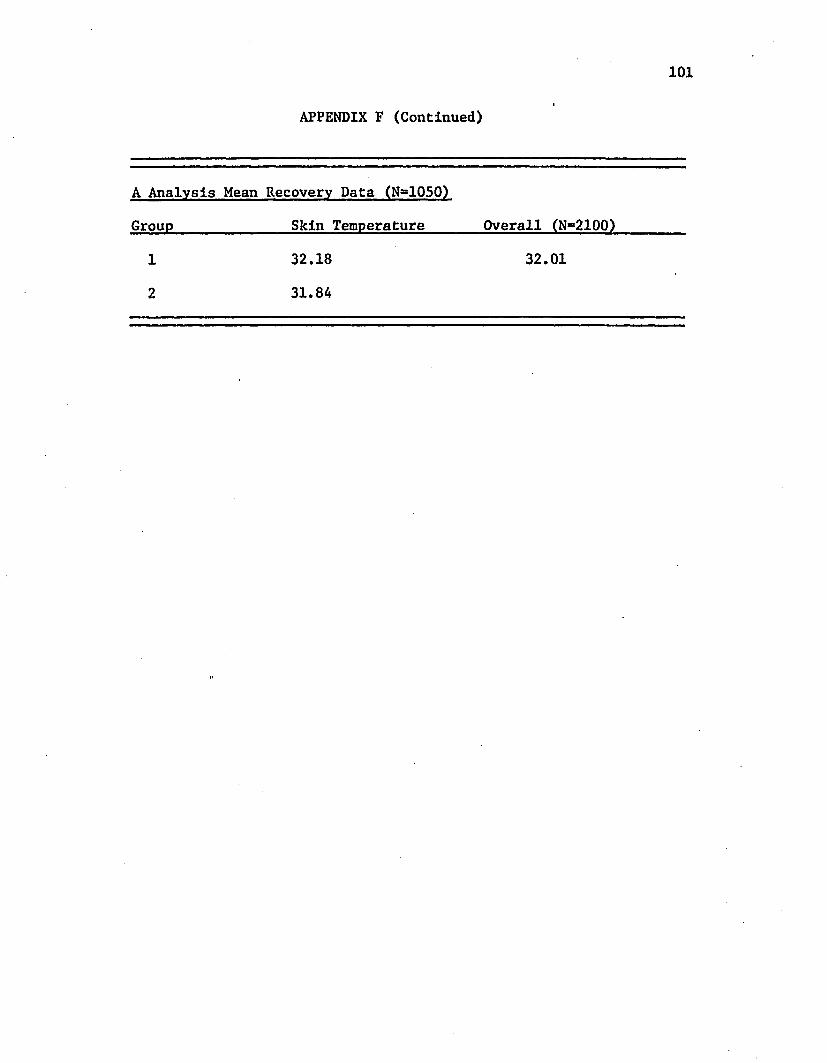
101I
APPENDIX F (Continued)
A Analysis Mean Recovery Data (N=1050)
Group Skin Temperature Overall (N=2100)
1 32.18 32.01
2 31.84
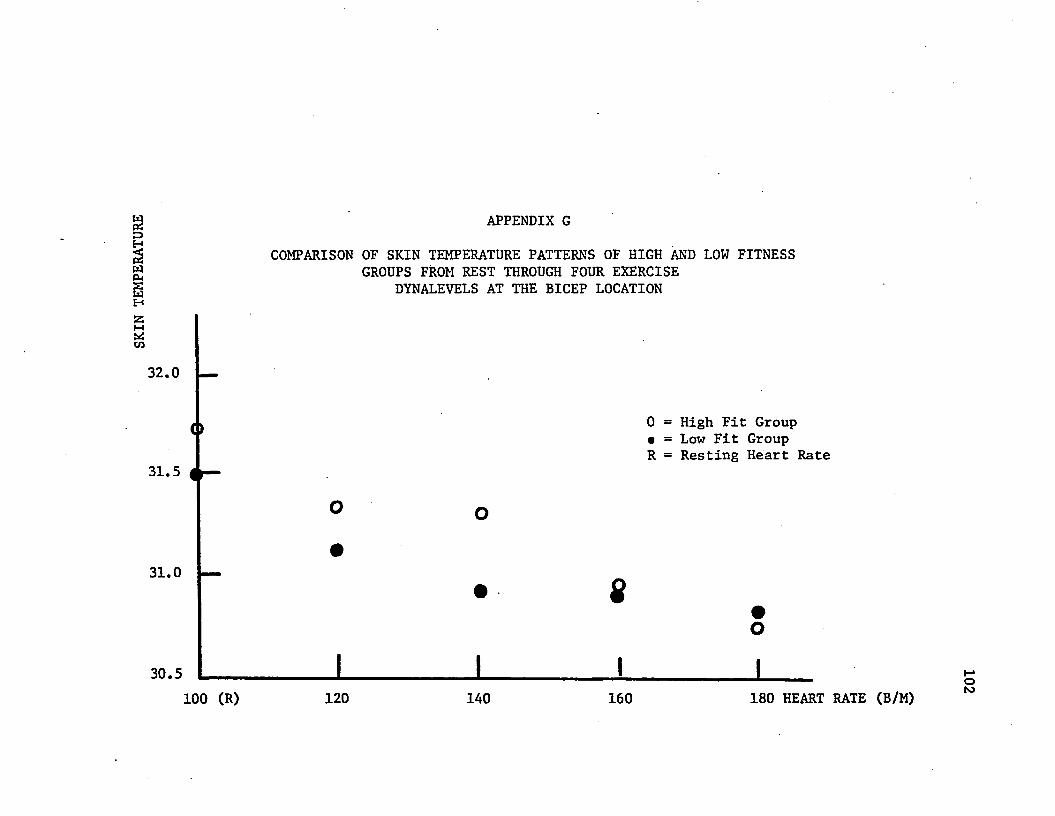
SKIN
TEMP
ERAT
URE APPENDIX G
COMPARISON OF SKIN TEMPERATURE PATTERNS OF HIGH AND LOW FITNESS GROUPS FROM REST THROUGH FOUR EXERCISE
DYNALEVELS AT THE BICEP LOCATION
32.0
31.5
31.0
o
0 = High Fit Group • = Low Fit Group R = Resting Heart Rate
30.5100 (R) 120 140 160 180 HEART RATE (B/M)
102
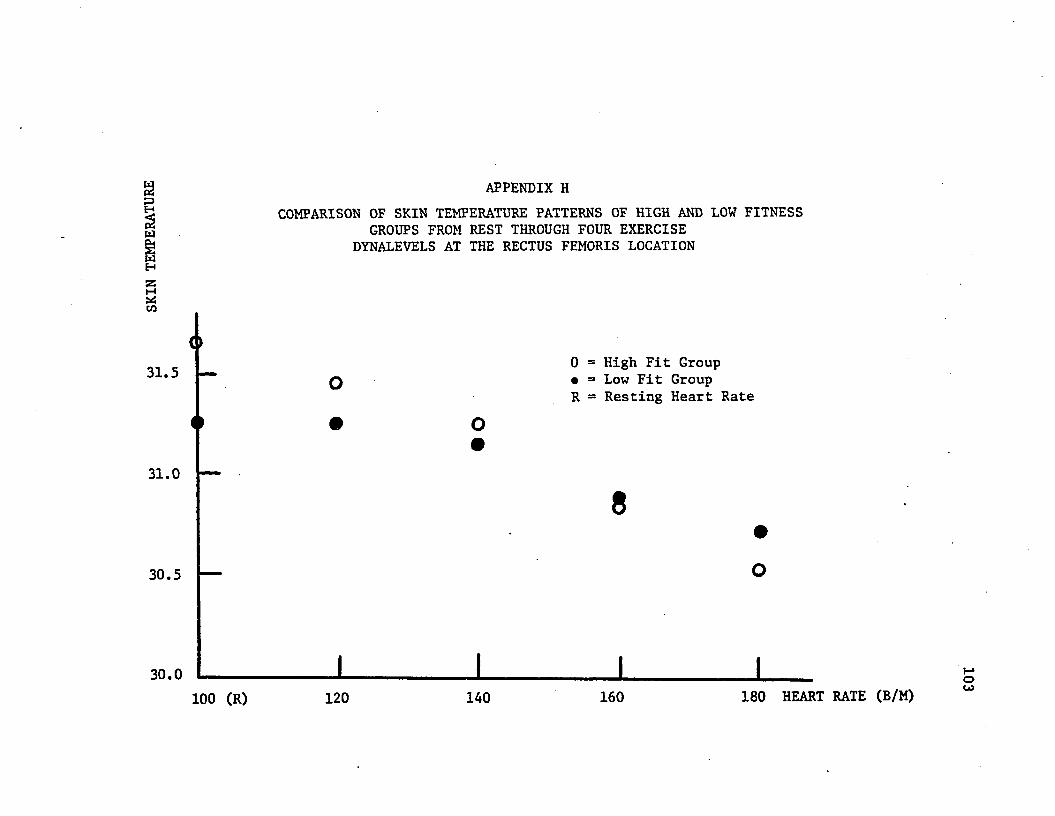
WwH
t*Scn
APPENDIX HCOMPARISON OF SKIN TEMPERATURE PATTERNS OF HIGH AND LOW FITNESS
GROUPS FROM REST THROUGH FOUR EXERCISE DYNALEVELS AT THE RECTUS FEMORIS LOCATION
31.5 o0 = High Fit Group • = Low Fit Group R = Resting Heart Rate
31.0
30.5
30.0 1100 (R) 120 140 160 180 HEART RATE (B/M)
103
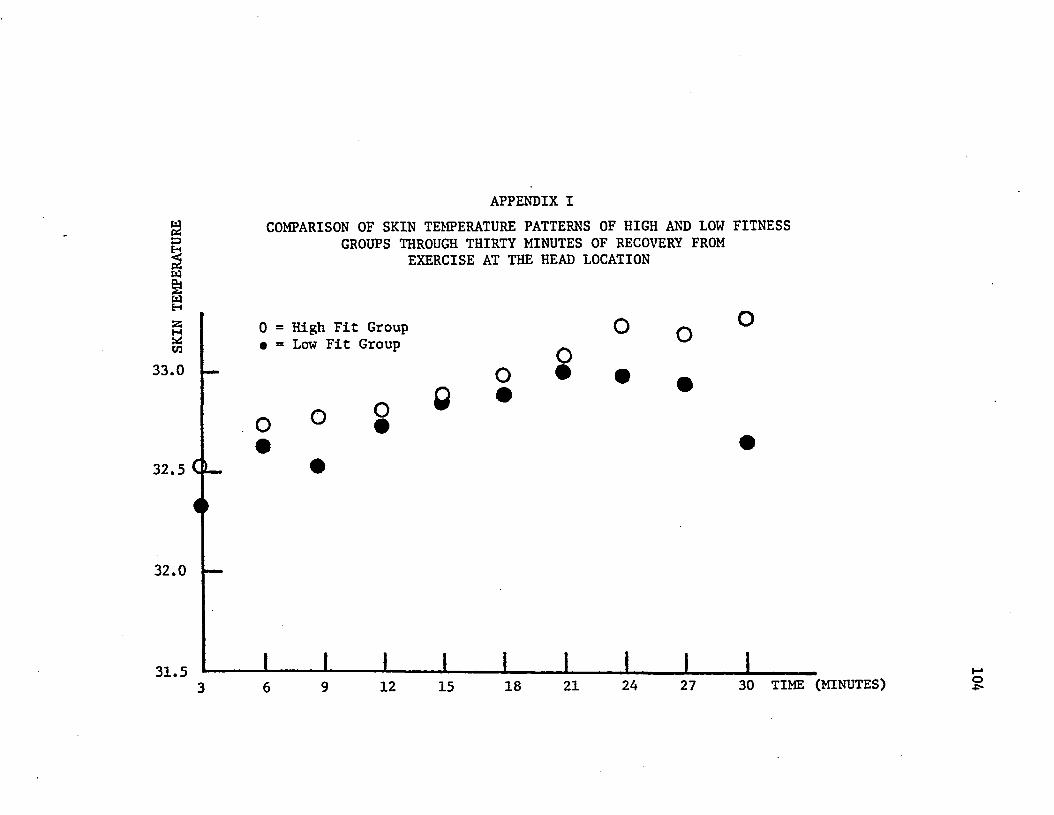
APPENDIX I
:=>HW
COMPARISON OF SKIN TEMPERATURE PATTERNS OF HIGH AND LOW FITNESS GROUPS THROUGH THIRTY MINUTES OF RECOVERY FROM
EXERCISE AT THE HEAD LOCATION
wHzsMUSC/3
33.0
0 = High Fit Group • = Low Fit Group o
o
32.5 CL-o o o
32.0
31.5 J L j i i i12 15 18 21 24 27 30 TIME (MINUTES) o
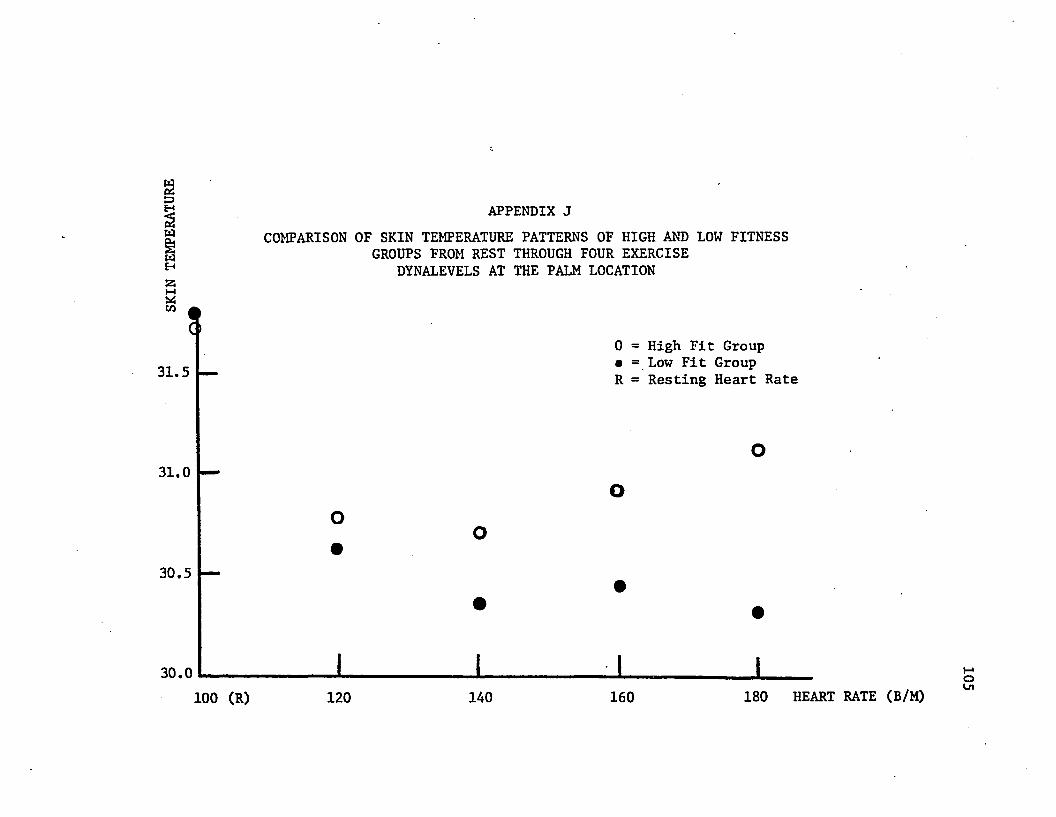
wCJoy APPENDIX JSi£ COMPARISON OF SKIN TEMPERATURE PATTERNS OF HIGH AND LOW FITNESS§ GROUPS FROM REST THROUGH FOUR EXERCISEH DYNALEVELS AT THE PALM LOCATION
CO
31.50 = High Fit Group • = Low Fit Group R = Resting Heart Rate
31.0
30.5
30.0 1100 (R) 120 140 160 180 HEART RATE (B/M)
105
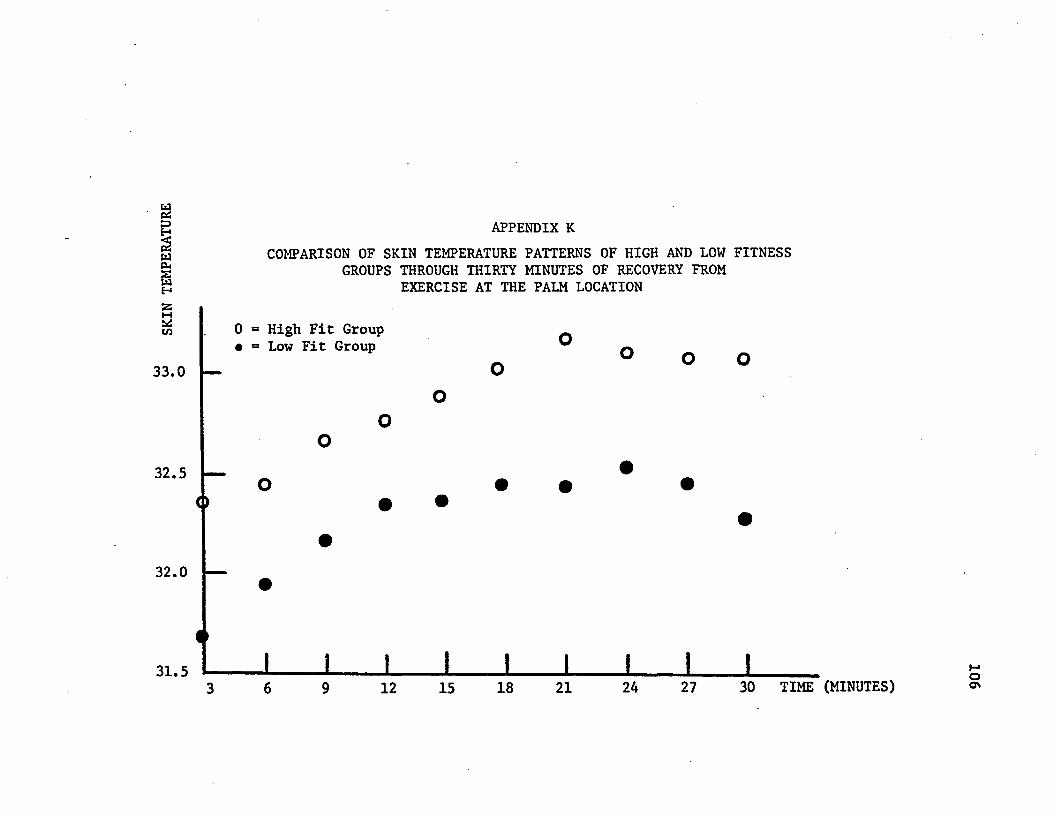
3P3§wPm
APPENDIX KCOMPARISON OF SKIN TEMPERATURE PATTERNS OF HIGH AND LOW FITNESS
GROUPS THROUGH THIRTY MINUTES OF RECOVERY FROM EXERCISE AT THE PALM LOCATION
M0 = High Fit Group • = Low Fit Group
to
33.0
32.5
32.0
31.512 15 18 21 24 27 30 TIME (MINUTES)
106
VITA
The author was born in Milwaukee, Wisconsin on March 7, 1941.
He attended Jesuit High School in New Orleans and graduated in
1959. He earned a Bachelor of Science Degree with a double major
in physical education and science in 1963, from the University of
Southwestern Louisiana.
The author served in the U.S. Navy from 1963 through 1967 as
a Lieutenant (junior grade) and served at duty stations in Morocco,
Rhode Island, and Hawaii.
In May, 1968, the Master of Education degree was earned from
Northwestern State University of Louisiana.
The author held the position of Assistant Professor and Gym
nastic Coach at Old Dominion University for two years. He then
entered the graduate program at Louisiana State University in 1970.
107
EXAMINATION AND THESIS REPORT
Candidate:
Major Field:
Title of Thesis:
Richard J. Smith
Physical Education
Effects of Varying Exercise Stress Upon Skin Temperature During Exercise and Through RecoveryApproved:
;ajor/Professor and Chairman
Dean of the Graduate School
EXAMINING COMMITTEE:
Date of Examination:
November 25, 1974
Related Documents