THE EFFECTS OF VAGUS NERVE STIMULATION UPON EEG AS RECORDED FROM OCCIPITAL SUBDURAL ELECTRODES IN A HUMAN CASE Piotr W. Olejniczak, John D. England, and Michael E. Carey Departments of Neurology and Neurosurgery at the Louisiana State University Medical Center in New Orleans Abstract. Although vagus nerve stimulation (VNS) can reduce clinical seizure frequency, human EEG studies using scalp recordings have failed to demonstrate an effect of VNS on either interictal epileptiform or background activity. The purpose of the study was to examine the effects of VNS on intracranially recorded EEG activity in humans. We report a patient with a vagus nerve stimulator who was subsequently admitted for implantation of subdural electrodes for video/EEG analysis in preparation for epilepsy surgery. The EEG background power spectra recorded from a left intracranial occipital contact were smaller with the VNS device “on” compared to when the device was “off”. Despite these changes in EEG background, VNS did not prevent or alter the course of electrographic seizures. Key words. Vagus nerve stimulation (VNS) – intracranial electrodes – seizures - EEG background activity – power spectra.

Welcome message from author
This document is posted to help you gain knowledge. Please leave a comment to let me know what you think about it! Share it to your friends and learn new things together.
Transcript
THE EFFECTS OF VAGUS NERVE STIMULATION UPON EEG
AS RECORDED FROM OCCIPITAL SUBDURAL
ELECTRODES IN A HUMAN CASE
Piotr W. Olejniczak, John D. England, and Michael E. Carey
Departments of Neurology and Neurosurgery at the Louisiana State
University Medical Center in New Orleans
Abstract. Although vagus nerve stimulation (VNS) can reduce
clinical seizure frequency, human EEG studies using scalp recordings have failed
to demonstrate an effect of VNS on either interictal epileptiform or background
activity. The purpose of the study was to examine the effects of VNS on
intracranially recorded EEG activity in humans. We report a patient with a vagus
nerve stimulator who was subsequently admitted for implantation of subdural
electrodes for video/EEG analysis in preparation for epilepsy surgery. The EEG
background power spectra recorded from a left intracranial occipital contact were
smaller with the VNS device “on” compared to when the device was “off”.
Despite these changes in EEG background, VNS did not prevent or alter the
course of electrographic seizures. Key words. Vagus nerve stimulation (VNS) –
intracranial electrodes – seizures - EEG background activity – power spectra.

INTRODUCTION
Vagus nerve stimulation (VNS) using the Neuro-Cybernetic Prosthesis
(NCP) system by CyberonicsTM was approved by the Federal Drug
Administration (FDA) in July 1997 for use as an adjunctive therapy in reducing
the frequency of seizures in adults or adolescents over 12 years of age who have
medically refractory partial onset seizures. Although its efficacy in the treatment
of partial-onset seizures has been established (Salinsky et al. 1995; Handforth et
al. 1998), the exact mechanism of action of VNS remains unknown. Recent
studies suggest that metabolic activation of certain thalamic, brainstem, and
limbic structures may be important in mediating the effect of VNS (Fisher and
Handforth 1999). Animal studies have shown that stimulation of the cervical
portion of the vagus nerve can terminate electrographic seizure discharges in
epileptogenic foci caused by topical or systemic administration of strychnine or
pentylenetetrazol (PTZ) (Zabara 1992)) and can block the development of kindled
seizures (Fernandez-Guardiola et al. 1999). Human EEG studies using scalp
recordings have failed to show any effect of VNS upon interictal epileptiform
activity or background activity. Hammond et al. (1992) studied 9 patients with
medically intractable seizures who were participating in an epilepsy clinical trial
of chronic vagus nerve stimulation. Stimulation at various stimulus frequencies
and amplitudes had no noticeable effect on EEG background activity whether the
patient was under general anesthesia, awake, or asleep; however vagus nerve
stimulation interrupted ongoing ictal EEG activity in one patient. Similarly,
Salinsky and Burchiel (1993) found no VNS effect on background activity. In our

initial description of the VNS effects on intracranial EEG activity (Olejniczak et
al., American Clinical Neurophysiology Society Meeting Abstracts, Nov. 99’) we
demonstrated that VNS at 30 Hz (but not 5 Hz) and 1.0 mA decreased the
frequency of interictal rhythmic sharp waves recorded from a hippocampal depth
electrode in a patient with medically intractable complex partial seizures of
temporal onset. VNS did not, however, influence the frequency of hippocampal
interictal spikes. Thompson et al. (American Epilepsy Society Meeting Abstracts,
Dec. 99’) found that VNS at 30 Hz and 1.5 mA induced significant changes
(mostly increases) in gamma power (i.e. EEG beta rhythm above 40 Hz) in direct
cortical and thalamic recordings. A significant power increase was noted in the
delta power at 1.0 mA.
CASE REPORT
A 13-year old girl with tuberous sclerosis had medically intractable daily
multifocal partial seizures with secondary generalization. Approximately 60% of
the seizures consisted of an aura with a vague gastric discomfort followed by
staring, lip smacking and turning of the eyes and head to the right. The typical
episode lasted 2-3 minutes, followed by postictal confusion of 20-30 minutes.
Less common seizures had more abrupt onset and a strong motor component,
mostly focal clonic movements of the right extremities and frequent secondary
generalization. The motor seizures would last 30-60 seconds on the average but
those with secondary generalization would extend to 3 minutes and be followed
by postictal confusion. A Neuro-Cybernetic Prosthesis (NCP) by CyberonicsTM
was implanted one year before the current study with approximately a 15-20%

decrease of seizure frequency. Despite this modest seizure reduction the patient
continued having frequent seizures, and, so, was evaluated further for epilepsy
surgery. Previous video/EEG monitoring with scalp electrodes had demonstrated
that approximately 60% of the seizures originated focally from the left
parietal/occipital head region. The remaining seizures had a diffuse bihemispheric
electroencephalographic onset with a strong motor component localizing
behaviorally to the left cerebral hemisphere. She was admitted on 6/7/99 (day 1)
for surgical implantation of left hemispheric subdural electrodes: a 28-contact
parietal grid, a 6-contact superior medial strip (SM - motor area), a 6-contact
anterior temporal strip and two occipital strips a (4- and 6-contact)(FIGURE 1).
The VNS was put in the “off” mode immediately before the implantation surgery
and the patient’s phenytoin was discontinued immediately after it. On day 4 the
patient developed frequent partial seizures (designated for this report as type 1)
which often began with a cry, followed by staring, obtundation and finally
rhythmic clonic movements of the right arm. Electrographically, these type 1
seizures were characterized either by diffuse onset or an onset within the superior
medial strip (SM – motor area, contacts 3, 4, and 5). Since the seizures became
extremely frequent with prominent interictal activity mostly in the superior medial
contacts, the patient was given two 500 mg PE (phenytoin equivalents) boluses of
fosphenytoin on day 4. The seizures continued almost unabated through day 5
requiring treatment with an additional fosphenytoin dose of 1250 mg PE. On day
5 the patient was also started on felbamate at a dose of 600 mg po bid. After this
therapeutic adjustment the behavioral manifestations of the seizures changed with
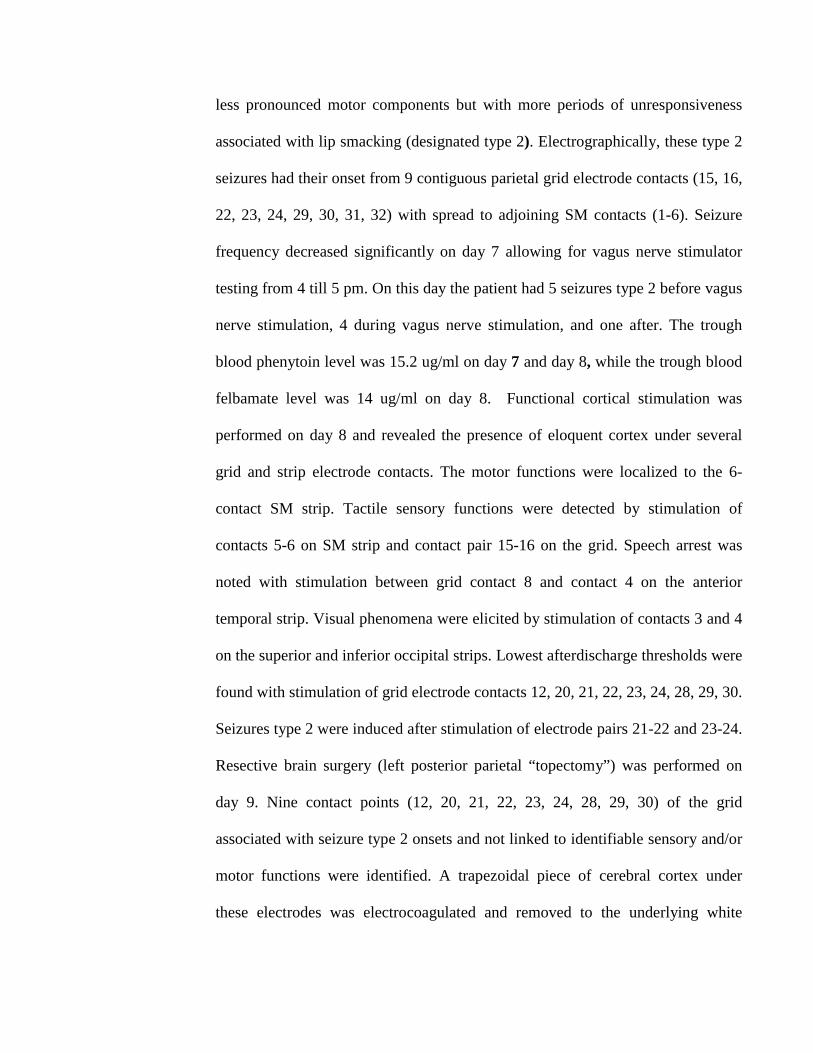
less pronounced motor components but with more periods of unresponsiveness
associated with lip smacking (designated type 2). Electrographically, these type 2
seizures had their onset from 9 contiguous parietal grid electrode contacts (15, 16,
22, 23, 24, 29, 30, 31, 32) with spread to adjoining SM contacts (1-6). Seizure
frequency decreased significantly on day 7 allowing for vagus nerve stimulator
testing from 4 till 5 pm. On this day the patient had 5 seizures type 2 before vagus
nerve stimulation, 4 during vagus nerve stimulation, and one after. The trough
blood phenytoin level was 15.2 ug/ml on day 7 and day 8, while the trough blood
felbamate level was 14 ug/ml on day 8. Functional cortical stimulation was
performed on day 8 and revealed the presence of eloquent cortex under several
grid and strip electrode contacts. The motor functions were localized to the 6-
contact SM strip. Tactile sensory functions were detected by stimulation of
contacts 5-6 on SM strip and contact pair 15-16 on the grid. Speech arrest was
noted with stimulation between grid contact 8 and contact 4 on the anterior
temporal strip. Visual phenomena were elicited by stimulation of contacts 3 and 4
on the superior and inferior occipital strips. Lowest afterdischarge thresholds were
found with stimulation of grid electrode contacts 12, 20, 21, 22, 23, 24, 28, 29, 30.
Seizures type 2 were induced after stimulation of electrode pairs 21-22 and 23-24.
Resective brain surgery (left posterior parietal “topectomy”) was performed on
day 9. Nine contact points (12, 20, 21, 22, 23, 24, 28, 29, 30) of the grid
associated with seizure type 2 onsets and not linked to identifiable sensory and/or
motor functions were identified. A trapezoidal piece of cerebral cortex under
these electrodes was electrocoagulated and removed to the underlying white

matter. This partial cortical parietal resection (a “topectomy”) resulted in a 75%
seizure reduction judged in a year-long follow-up.
METHODS
VNS was temporarily restarted on postoperative day 7 after obtaining
appropriate consent from the patient and her guardian. The following stimulus
parameters were used: square wave, 30 seconds “on” (real time 34 s) alternating
with 30 seconds “off” (real time 34 s), output current 1.0 mA, pulse width 500 us,
pulse frequency 30 Hz. Power spectra analysis included 30 periods “on”
alternating with contiguous 30 periods “off “ with the patient awake and watching
TV. 4-second long artifact-free epochs at the end of each period (preferably 29th -
32nd second) were selected for spectral analysis. The VNS – induced artifact was
monitored in two EKG channels (FIGUREs 3 and 4).
For background evaluation needle scalp electrodes Fz and Cz (10-20
system) were referred to the left occipital scalp electrode O1 (FIGURE 2) and the
underlying contact SO1 (FIGURE 3) on a subdural 4-contact strip electrode
overlying the visual cortex. The power spectra were calculated using TelefactorTM
Twin 1.50 system separately for the delta (0.0 to 4.0 Hz), theta (4.0 to 8.0 Hz),
alpha (8.0 to 13.0 Hz), beta (13.0 to 40.0 Hz), and total band (0.0 to 100.0 Hz)
ranges.
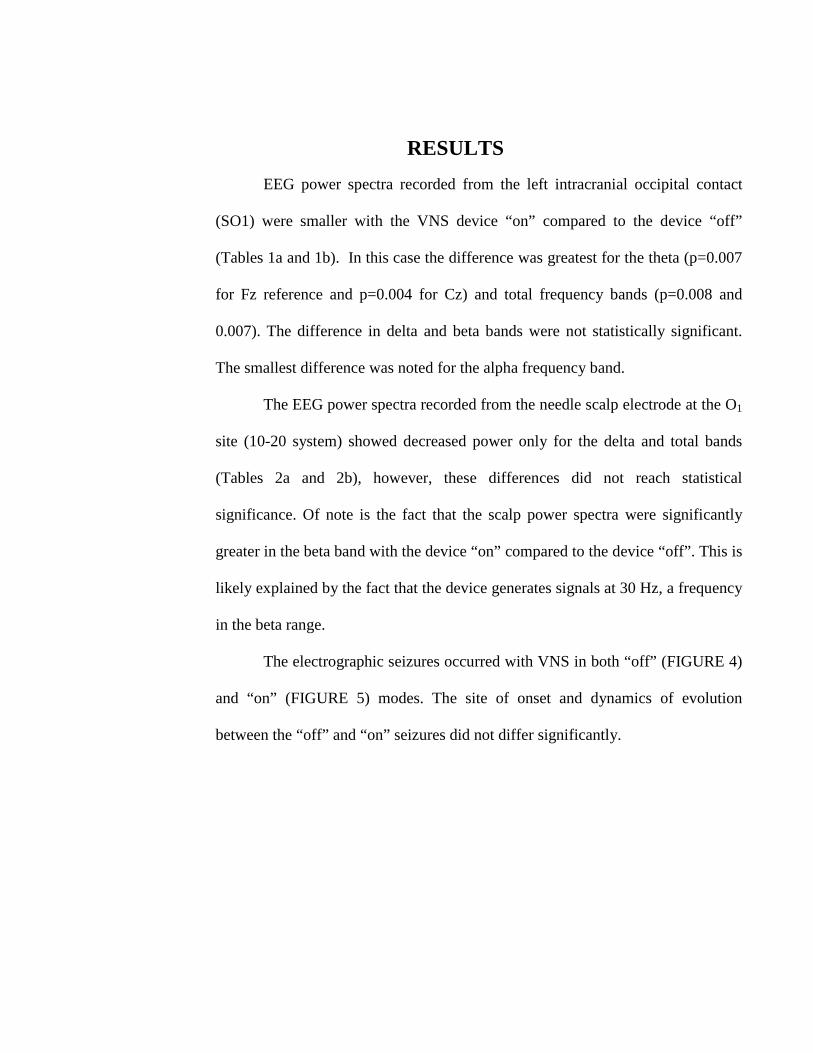
RESULTSEEG power spectra recorded from the left intracranial occipital contact
(SO1) were smaller with the VNS device “on” compared to the device “off”
(Tables 1a and 1b). In this case the difference was greatest for the theta (p=0.007
for Fz reference and p=0.004 for Cz) and total frequency bands (p=0.008 and
0.007). The difference in delta and beta bands were not statistically significant.
The smallest difference was noted for the alpha frequency band.
The EEG power spectra recorded from the needle scalp electrode at the O1
site (10-20 system) showed decreased power only for the delta and total bands
(Tables 2a and 2b), however, these differences did not reach statistical
significance. Of note is the fact that the scalp power spectra were significantly
greater in the beta band with the device “on” compared to the device “off”. This is
likely explained by the fact that the device generates signals at 30 Hz, a frequency
in the beta range.
The electrographic seizures occurred with VNS in both “off” (FIGURE 4)
and “on” (FIGURE 5) modes. The site of onset and dynamics of evolution
between the “off” and “on” seizures did not differ significantly.

Table 1a. Average power spectra for Fz- SO1reference (uV2)
Band range power spectra with comparison VNS of on/off
differenceOn Off by t-test
(p-value)
Delta 422.3369 512.8254 0.077Theta 253.9224 359.3966 0.007Alpha 142.3164 169.733 0.124Beta 206.0248 241.3979 0.044Total 1077.091 1325.247 0.008
Table 1b. Average power spectra for Cz- SO1reference (uV2)
Band range power spectra with comparison VNS of on/off
differenceOn Off by t-test
(p-value)
Delta 411.7746 502.349 0.074Theta 245.6192 351.3749 0.004Alpha 139.9269 164.5737 0.175Beta 201.54 238.9052 0.036Total 1049.409 1300.633 0.007

Table 2a. Average power spectra for Fz- O1reference (uV2)
Band range power spectra with comparison VNS of on/off
differenceOn Off by t-test
(p-value)
Delta 11.3551 15.3815 0.218Theta 5.8228 5.2823 0.667Alpha 3.3335 3.2812 0.95Beta 6.6311 2.4075 6.027E-11Total 30.5097 26.3553 0.316
Table 2b. Average power spectra for Cz- O1reference (uV2)
Band range power spectra with comparison VNS of on/off
differenceOn Off by t-test
(p-value)
Delta 7.1414 9.3755 0.269Theta 3.7583 3.2311 0.475Alpha 2.4908 2.4123 0.897Beta 5.042 2.008 8.913E-11Total 21.282 17.4123 0.118

DISCUSSION
Using intracranial subdural recording we have shown that VNS at 1.0 mA
and 30 Hz can significantly affect power spectra of occipital waking EEG by
desynchronizing the background activity (i.e. decreasing the power spectra) in the
delta, theta (most robust effect), and alpha bands. We agree with Thompson et al.
that in the beta band (at 30 Hz) there is a significant driving effect increasing the
beta power. Despite these effects upon occipital EEG activity, we were unable to
demonstrate an effect of VNS upon the frequency or dynamics of electrographic
seizures.
Stimulation of the vagus nerve in experimental animals can cause
profound changes in the EEG (Zanchetti et al. 1952; Chase et al. 1967 and 1968;
Chase and Nakamura 1968; Hammond et al. 1992; Salinsky and Burchiel 1993).
Acute effects of VNS on EEG were found in cats by Rutecki (1990). Zanchetti et
al. (1952) discovered that VNS blocked spindle-like activity and reduced the
amplitude of the EEG background. Chase et al. (1967 and 1968) found a complex
relation between VNS and EEG with either synchronization or desynchronization
of the rhythms depending upon the population of stimulated nerve fibers. Magnes
et al. (1961) by directly stimulating one of the afferent terminations of the vagus
nerve, the nucleus tractus solitarius, induced synchronization or
desynchronization of the EEG depending on the exact location of the stimulation
electrode, frequency of stimulation, and the animal’s state of arousal. Although
high frequency stimulation (>30 Hz) resulted in EEG desynchronization, slower
stimulation (1-17 Hz) caused synchronization.
Studies in humans using scalp electrode monitoring have not shown
demonstrable effects of VNS on background EEG activity (Hammond et al. 1992;
Salinsky and Burchiel 1993). Thompson et al. (1999) in their case report claim
that VNS synchronized the EEG background activity recorded from subdural strip
electrodes in a patient evaluated for resective epilepsy surgery. Our experience
was different: the EEG displayed reduced power spectra with VNS “on”
compared to VNS “off”. Unfortunately, we were unable to compare the
stimulation periods to a baseline with longer periods “off”. However, VNS did not
appear to affect the development of electrographic seizures. Attempts to compute
the power spectra for individual seizures produced inconsistent results and will be
the subject of a separate study. Prior to initiating the stimulation, the observed
background activity was very unstable and contaminated by movement artifacts
and prominent carry-over effects from seizure activity. Significant VNS carry-
over effects from periods “on” are also expected to extend into periods “off”.
VNS achieved a modest degree of seizure reduction (15-20%) in the year
prior to cortical resection. The cortical resection, however, gave a more
significant 75% reduction in seizure frequency and improvement of quality of life.
The major unanswered question that arises from this case is why VNS appeared to
decrease the frequency of clinical seizures, yet paradoxically, had no clear effect
upon electrographic seizures. The answer is likely complicated (Schachter and
Saper 1998) and may be influenced by the limitations of this study. A few
possible explanations include the following: (1) Trauma associated with surgical
implantation of intracranial electrodes and occurrence of electrographic and

clinical seizures preceding the VNS analysis may have influenced background or
epileptiform activity during baseline and stimulation periods (Gotman 1991). (2)
The duration of restarted VNS (30s “on”/30s “off”) could have been too short to
develop any therapeutic activity. Perhaps with further monitoring one might have
shown decreased frequency of electrographic seizures with VNS “on”. (3) VNS
may not have been effective in controlling seizures originating in areas not
covered by intracranial electrodes. After all, many clinical studies have shown
only a modest decrease in frequency of seizures with VNS (Fisher and Handforth
1999; Shachter and Saper 1998). (4) Finally, VNS may be more effective in
suppressing epileptiform activity in some individuals compared to others.
Comparisons with the only other center (Thompson et al. 1999) investigating
VNS effects on intracranial EEG recordings are difficult because of different
study paradigms (essentially designed “ad hoc” in both groups).
REFERENCES
Chase MH, Nakamura Y, Clements CD: Afferent vagal stimulation: neurographic
correlates of induced EEG synchronization and desynchronization. Brain Res
5:236-249, 1967.
Chase MH, Nakamura Y: Cortical and subcortical EEG patterns of response to
afferent abdominal vagal stimulation: Neurographic correlates. Physiol Behav
3:605-610, 1968.

Fernandez-Guardiola A, Martinez A, Valdes-Cruz A, Magdaleno-Madrigal
VM, Martinez D, Fernandez-Mas R: Vagus nerve prolonged stimulation in cats:
effects on epileptogenesis (amygdala electrical kindling): behavioral and
electrographic changes. Epilepsia 40(7):822-829, 1999.
Fisher RS and Handforth A: Reassessment: Vagus nerve stimulation for epilepsy.
A report of the Therapeutics and Technology Assessment Subcommittee of the
American Academy of Neurology. Neurology 53:666-669, 1999.
Gotman J: Relationship between interictal spiking and seizures: human and
experimental evidence. Can J Neurol Sci 18(4):S573-S576, 1991.
Hammond EJ, Uthman BM, Reid SA, and Wilder BJ: Vagus nerve stimulation
in humans: I. EEG effects. Epilepsia 33(6):1013-1020, 1992.
Handforth A, DeGiorgio, CM, Schachter SC, Uthman BM, Naritoku DK,
Tecoma ES, Henry TR, Collins SD, Vaughn BV, Gilmartin RC, Labar DR,
Morris GL 3rd, Salinsky MC, Osorio I, Ristanovic RK, Labiner DM, Jones JC,
Murphy JV, Ney GC, Wheless JW: Vagus nerve stimulation therapy for
partial-onset seizures: a randomized active-control trial. Neurology 51(1):48-55,
1998.
Magnes J, Moruzzi G, Pompeiano O: Synchronization of the EEG produced by
low frequency electrical stimulation of the region of the solitary tract. Arch Ital
Biol 99:33-67, 1961.
Olejniczak PW, Butterbaugh G, Fisch B, and Carey M: Effects of vagus nerve
stimulation on EEG using hippocampal depth electrodes: a case report and
review. American Clinical Neurophysiology Meeting, St. Louis, MO 1999.
Abstracts, C103, p.29.
Rutecki P: Anatomical, physiological, and theoretical basis for the antiepileptic
effect of vagus nerve stimulation. Epilepsia 1990;31(suppl 2):S1-6.
Salinsky MC and Burchiel KJ: Vagus nerve stimulation has no effect on awake
EEG rhythms in humans. Epilepsia 34(2):299-304, 1993.
Salinsky M, George R, Sonnen A, and Vagus Nerve Stimulation Group: A
randomized controlled trial of chronic VNS for treatment of medically intractable
seizures. Neurology 45(2):224-230, 1995.
Schachter SC and Saper CB: Progress in epilepsy research. Vagus nerve
stimulation. Epilepsia 39(7):677-686, 1998.
Thompson JL, Jr, Zaveri HP, McCarthy K, Carpentier A, Spencer SS, Spencer D:
Vagus nerve stimulation effects on intracranial EEG spectra recorded from cortex
and thalamus. Epilepsia 40(7):S138, 1999.
Zabara J: Inhibition of experimental seizures in canines by repetitive vagal
stimulation. Epilepsia 33(6):1005-1012, 1992.
Zanchetti A, Wang SC, Moruzzi G: The effect of vagal afferent stimulation on the
EEG pattern of the cat. Electroencephalogr Clin Neurophysiol 4:357, 1952.

FIGURES
FIGURE 1. Lateral skull X-Ray obtained after implantation of subdural strip and grid electrodes.6 electrode contacts in the upper row belong to the SM strip (motor area) . The extreme rightcontact is number 1, extreme left – number 6. Right below the SM strip is a 28-contact parietalgrid. Grid contact 32 lies under SM contact 4. Grid contact 30 lies under SM contact 6. Theanterior temporal (AT) strip is identifiable anterior and inferior to the grid. The superior (SO) andinferior (IO) strips can be identified behind the low posterior corner of the grid.
[ Click to return to Page 4 ]

FIGURE 2. Interictal background activity recorded using O1 (10-20 system) reference. Thedashed arrow indicates VNS artifact in 2 EKG channels. X marks the beginning of electricalstimulation. No significant background change can be appreciated with VNS.
[ Click to return to Page 6 ]

FIGURE 3. Interictal background activity (same epoch as in Figure 2) recorded using SO1(contact 1 in the subdural superior occipital strip) reference. The dashed arrow indicates VNSartifact in 2 EKG channels. X marks the beginning of electrical stimulation. Onset of significantbackground change is marked by solid arrow.
[ Click to return to Page 6 ]

FIGURE 4. A seizure recorded with VNS in the “off “ mode.
[ Click to return to Page 6 | Page 7 ]
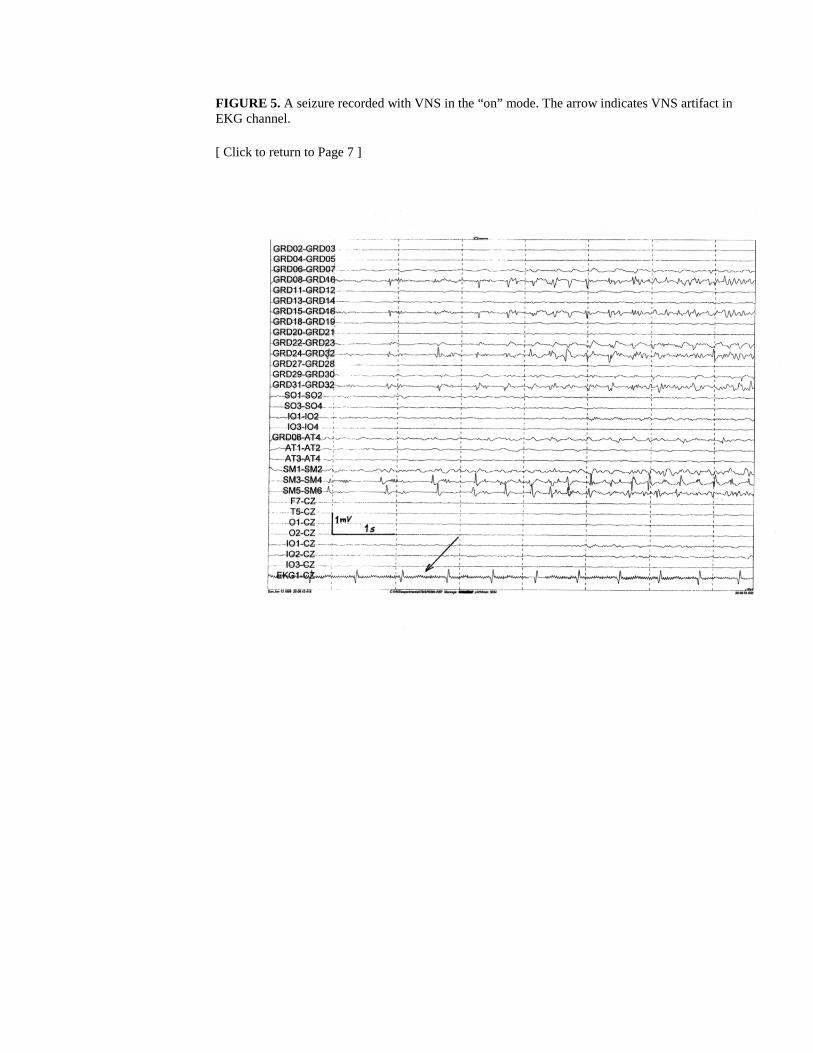
FIGURE 5. A seizure recorded with VNS in the “on” mode. The arrow indicates VNS artifact inEKG channel.
[ Click to return to Page 7 ]
Related Documents