EFFECTS OF STOCKING DENSITY ON GROWTH AND SURVIVAL OF NILE TILAPIA, Oreochromis niloticus L. FRY AT SON FISH FARM BY NTANZI RONALD BFA(III)10/U/1036 8/15/2013 1

effects of stocking density presentation
Jul 13, 2015
Welcome message from author
This document is posted to help you gain knowledge. Please leave a comment to let me know what you think about it! Share it to your friends and learn new things together.
Transcript
EFFECTS OF STOCKING DENSITY ON
GROWTH AND SURVIVAL OF NILE
TILAPIA, Oreochromis niloticus L.
FRY AT SON FISH FARM
BY
NTANZI RONALD BFA(III)10/U/1036
8/15/2013 1
OUTLINE
Introduction
Materials and methods
Results and discussion
Conclusion and recommendations
8/15/2013 2

IntroductionTilapia is the world’s second most
important fish in aquaculture after carp
and Uganda’s second important in
aquaculture after catfish
Stocking density is an important factor
affecting fish maturation and growth.
In Nile tilapia fry it can range from as low
as 500fry/m3 to as high as 20,000fry/m3
8/15/2013 3
Problem Statement
Lack of sufficient knowledge on the best
practice of Nile tilapia fry stocking densities
that would maximize production.
8/15/2013 4
Objectives of the study
To establish the most appropriate stocking density by determining how growth rate and survival vary with stocking density
for Nile tilapia fry in hapas set in earthen ponds
8/15/2013 5
Methodology(1)
Experimental Units
Breeding
• One (1) 500 m2 (20x25) earthen pond
Sex-Reversal Treatment
• Twelve (12) 2 x 1 x 1 m fine mesh hapas
• One (1) 2100 m2 (70x30) earthen pond
8/15/2013 6
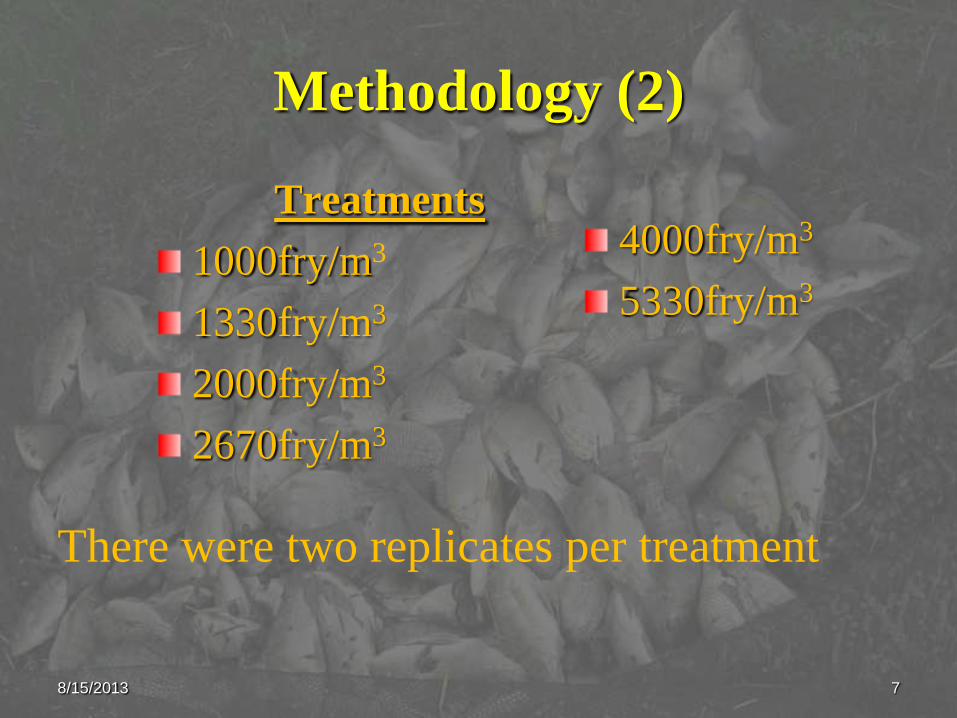
Methodology (2)
Treatments
1000fry/m3
1330fry/m3
2000fry/m3
2670fry/m3
4000fry/m3
5330fry/m3
There were two replicates per treatment
8/15/2013 7
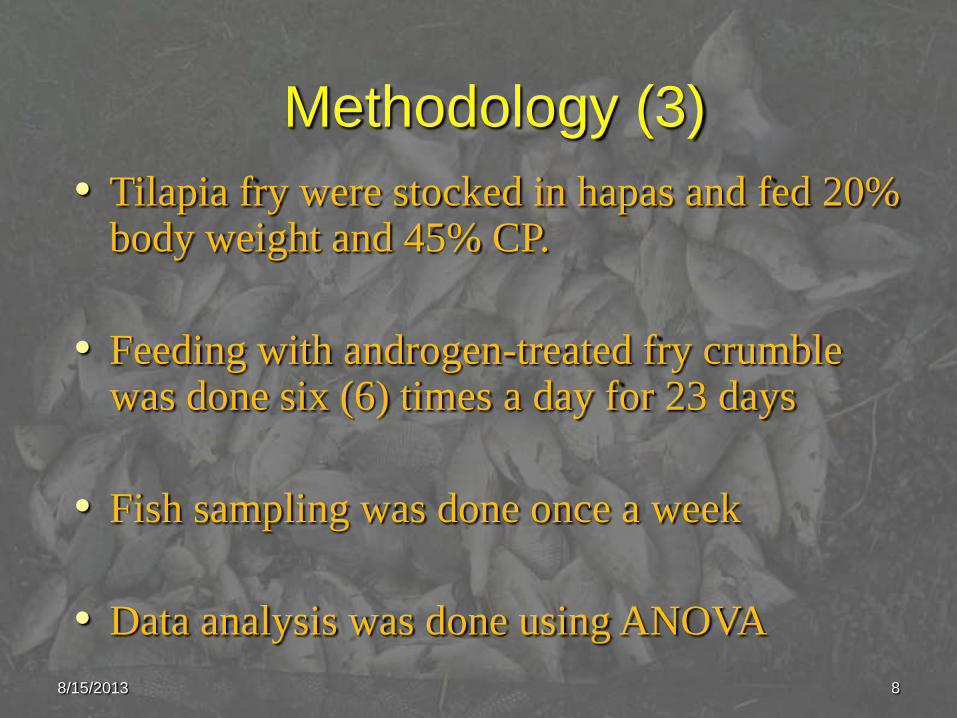
Methodology (3)
• Tilapia fry were stocked in hapas and fed 20% body weight and 45% CP.
• Feeding with androgen-treated fry crumble was done six (6) times a day for 23 days
• Fish sampling was done once a week
• Data analysis was done using ANOVA
8/15/2013 8
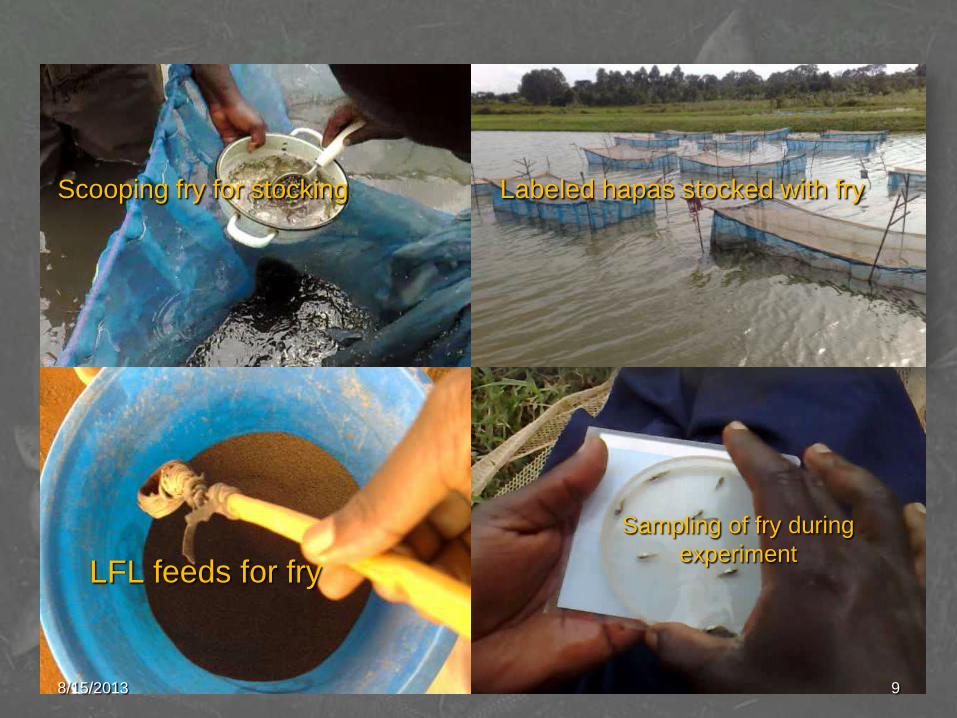
Sampling of fry during
experiment
Scooping fry for stocking Labeled hapas stocked with fry
LFL feeds for fry
8/15/2013 9
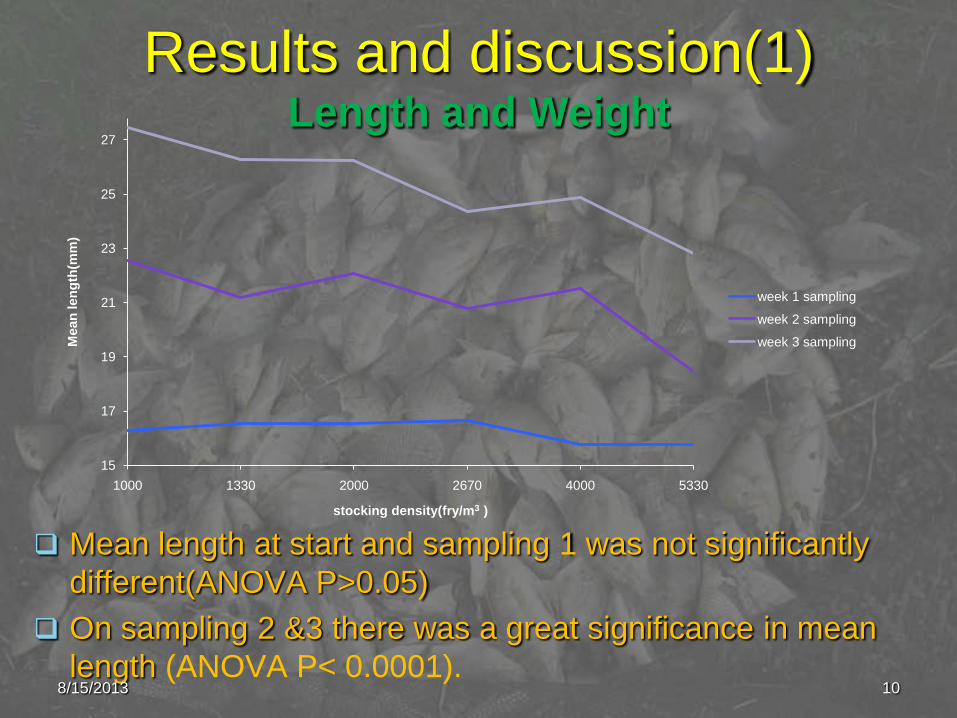
Results and discussion(1)Length and Weight
15
17
19
21
23
25
27
1000 1330 2000 2670 4000 5330
Mean
len
gth
(mm
)
stocking density(fry/m3 )
week 1 sampling
week 2 sampling
week 3 sampling
Mean length at start and sampling 1 was not significantly
different(ANOVA P>0.05)
On sampling 2 &3 there was a great significance in mean
length (ANOVA P< 0.0001). 8/15/2013 10
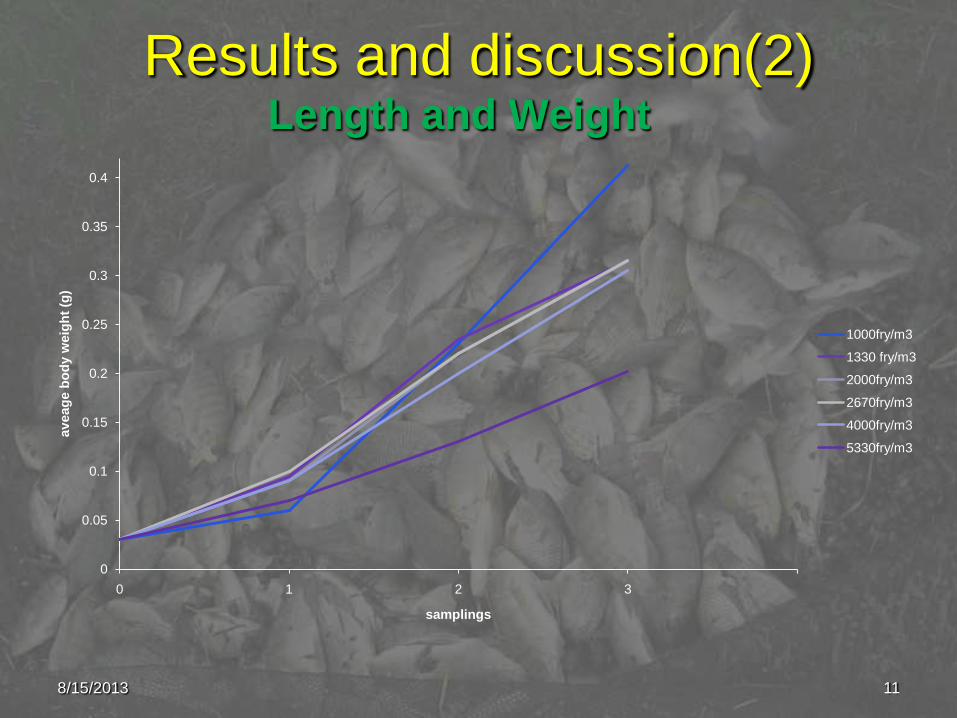
Results and discussion(2)Length and Weight
0
0.05
0.1
0.15
0.2
0.25
0.3
0.35
0.4
0 1 2 3
av
eag
e b
od
y w
eig
ht
(g)
samplings
1000fry/m3
1330 fry/m3
2000fry/m3
2670fry/m3
4000fry/m3
5330fry/m3
8/15/2013 11
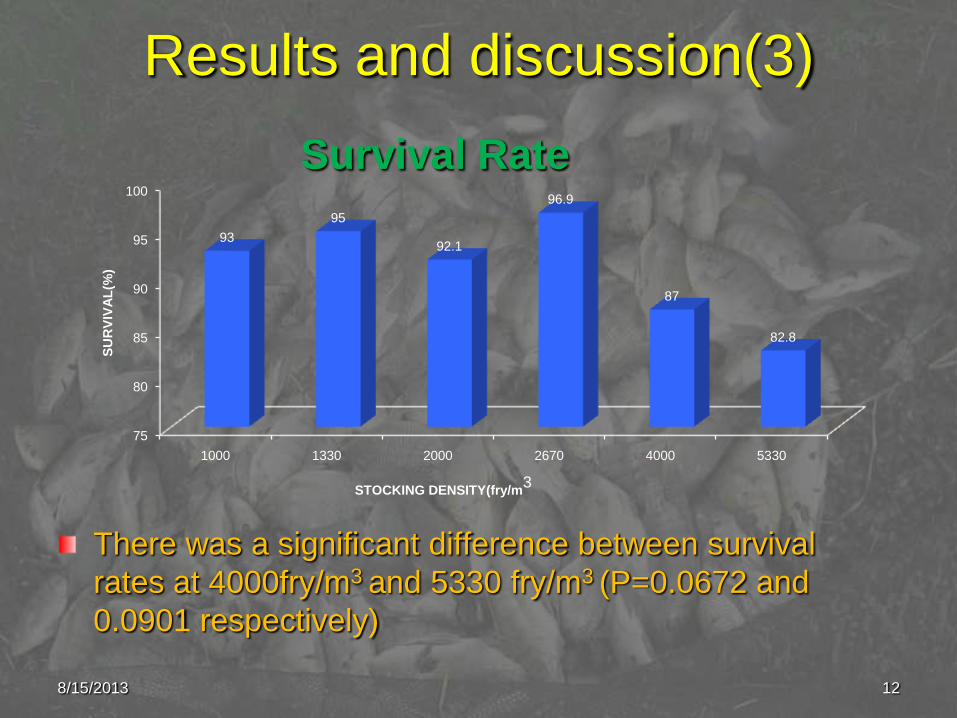
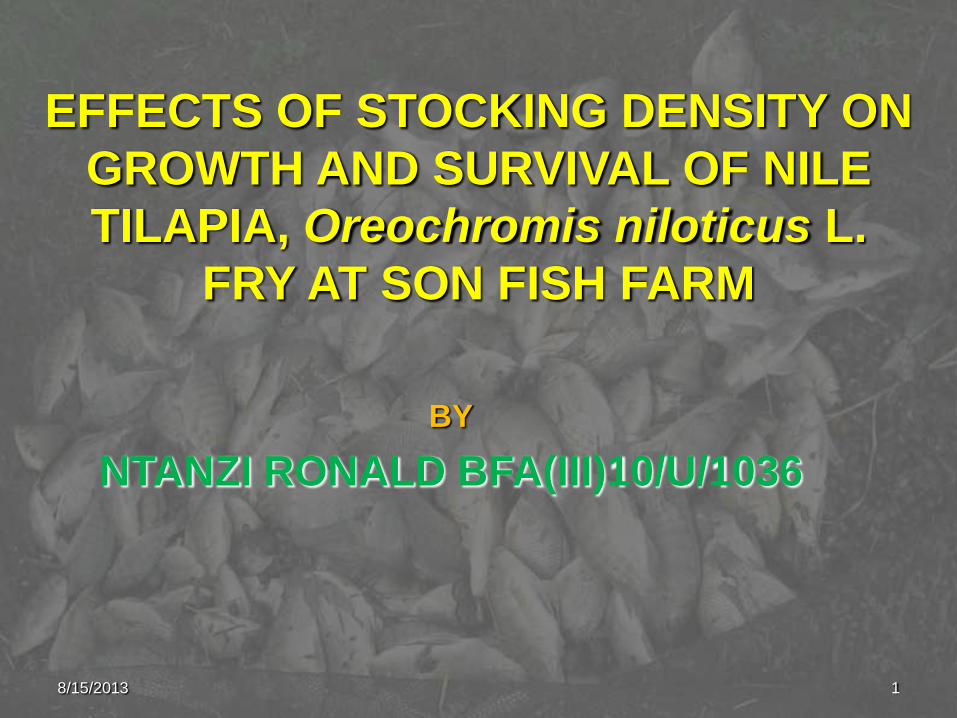
Results and discussion(3)
Survival Rate
There was a significant difference between survival
rates at 4000fry/m3 and 5330 fry/m3 (P=0.0672 and
0.0901 respectively)
75
80
85
90
95
100
1000 1330 2000 2670 4000 5330
93
95
92.1
96.9
87
82.8
SU
RV
IVA
L(%
)
STOCKING DENSITY(fry/m3
8/15/2013 12

Results and discussion(4)Growth homogeneity
1000 1330 2000 2670 4000 5330
Below 24 4 7 3 22 7 36
24-25 2 22 14 15 26 10
26-27 18 12 19 8 10 4
28-29 18 6 11 4 7 0
30-31 7 2 3 1 0 0
32+ 1 1 0 0 0 0
Length frequency groups for week three sampling in millimeters
Length frequency groups for week one sampling in millimeters
Length frequency groups for week two sampling in millimeters1000 1330 2000 2670 4000 5330
Below 19 4 8 1 6 1 28
19-20 8 13 15 23 19 10
21-22 16 13 11 9 17 12
23-24 10 12 19 6 10 0
25-26 8 4 4 6 3 0
27+ 4 0 0 0 0 0
1000 1330 2000 2670 4000 5330
Below 13 1 4 0 0 1 5
13-14 13 3 13 9 14 11
15-16 13 18 14 18 21 16
17-18 12 16 8 12 6 12
19-20 10 8 15 10 8 5
21+ 1 1 0 1 0 1
. 13
Conclusion and recommendations(1)
Conclusion
Survival is the most important factor as
far as rearing tilapia fish fry in nursery
ponds is concerned.
Increasing stocking density in Nile tilapia
fry to extremes results into homogenous
growth.
Further research is needed to know how
these factors vary along the whole
production line.
8/15/2013 14
Conclusion and recommendations(2)
Recommendations
Its recommended not to have stocking
densities of more than 2670 fry/m3 while
rearing Nile tilapia fry in the same conditions
as in the study.
8/15/2013 15
.
Thank
You!
8/15/2013 16
Related Documents