Citation: Shamsuddin, M.; Hossain, M.B.; Rahman, M.; Kawla, M.S.; Tazim, M.F.; Albeshr, M.F.; Arai, T. Effects of Stocking Larger-Sized Fish on Water Quality, Growth Performance, and the Economic Yield of Nile Tilapia (Oreochromis niloticus L.) in Floating Cages. Agriculture 2022, 12, 942. https://doi.org/ 10.3390/agriculture12070942 Academic Editors: Ronald Kennedy Luz and Vito Laudadio Received: 16 May 2022 Accepted: 27 June 2022 Published: 29 June 2022 Publisher’s Note: MDPI stays neutral with regard to jurisdictional claims in published maps and institutional affil- iations. Copyright: © 2022 by the authors. Licensee MDPI, Basel, Switzerland. This article is an open access article distributed under the terms and conditions of the Creative Commons Attribution (CC BY) license (https:// creativecommons.org/licenses/by/ 4.0/). agriculture Article Effects of Stocking Larger-Sized Fish on Water Quality, Growth Performance, and the Economic Yield of Nile Tilapia (Oreochromis niloticus L.) in Floating Cages Md Shamsuddin 1 , Mohammad Belal Hossain 2,3, * , Moshiur Rahman 1, * , Mst Salamun Kawla 4 , Md. Farhan Tazim 1 , Mohammed Fahad Albeshr 5 and Takaomi Arai 6 1 Department of Fisheries (DoF), Ministry of Fisheries and Livestock, Dhaka 1000, Bangladesh; [email protected] (M.S.); [email protected] (M.F.T.) 2 Department of Fisheries and Marine Science, Noakhali Science and Technology University, Noakhali 3814, Bangladesh 3 School of Engineering and Built Environment, Griffith University, Brisbane, QLD 4111, Australia 4 Department of Fisheries Management, Bangladesh Agricultural University, Mymensingh 2202, Bangladesh; [email protected] 5 Department of Zoology, College of Science, King Saud University, P.O. Box 2455, Riyadh 11451, Saudi Arabia; [email protected] 6 Environmental and Life Sciences Programme, Faculty of Science, University Brunei Darussalam, Jala Tungku Link, Gadong BE 1410, Brunei; [email protected] * Correspondence: [email protected] (M.B.H.); [email protected] (M.R.) Abstract: Earlier research has mostly focused on the impacts of stocking density on fish growth, yield, and survival rate; however, knowledge of the effects of stocking larger-sized fish, particularly Nile Tilapia, is lacking. This type of research is critically important for increasing food security, achieving sustainable goals, and facing the challenges of climate change in the near future. Therefore, we investigated the effects of initial stocking body sizes of Nile Tilapia (Oreochromis niloticus) on water quality, growth performance, and economic yield in tropical riverine cages for 120 days in two culture cycles. Nile Tilapia of three different body sizes (34.06 ± 0.22 g, 10.98 ± 0.09 g, and 5.47 ± 0.04 for the first cycle and 33.85 ± 0.01 g, 11.07 ± 0.05 g, and 5.38 ± 0.06 g for the second cycle, indicated as T1, T2, and T3) were stocked in the culture treatments where unique stocking density and feed rations were maintained. The results revealed that water quality parameters did not differ significantly (p > 0.5) and were within a suitable range for Nile Tilapia culture. Treatments with larger-sized fish demonstrated a higher growth performance. The stocking fish size of 34.14–34.71 g was found to be the best among the three treatments regarding growth performance and economic return. As a result, except for T1 and T2 at a rural site and T1 at a semi-urban site, all of the treatments had negative allometry (b < 3.0), indicating that larger-sized fish and the rural site of the river are more suitable for cage culture. The rural site was found to be more suitable, possibly due to less variation of water parameters, more natural foods, and less pollution. The cages with larger-sized fish stocked had a higher net present value (NPV); internal rate of return (IRR); benefit–cost ratio (BCR); and rate on return (ROI), indicating that cage culture with larger-sized fish stocked is economically viable in the riverine system. Therefore, stocking the larger-sized fish (T1) and rural site are more suitable for cage culture. Keywords: cage culture; relative condition factor; growth performance; stocking density; the survival rate 1. Introduction Bangladesh, a self-sufficient fish-producing country, has the second-highest growth rate (9.1%) after Indonesia [1]. Its total fish production has expanded by around six-fold during the last three decades (0.754 million MT (Metric Ton) in 1983–1984 to 4.503 million Agriculture 2022, 12, 942. https://doi.org/10.3390/agriculture12070942 https://www.mdpi.com/journal/agriculture

Welcome message from author
This document is posted to help you gain knowledge. Please leave a comment to let me know what you think about it! Share it to your friends and learn new things together.
Transcript
Citation: Shamsuddin, M.; Hossain,
M.B.; Rahman, M.; Kawla, M.S.;
Tazim, M.F.; Albeshr, M.F.; Arai, T.
Effects of Stocking Larger-Sized Fish
on Water Quality, Growth
Performance, and the Economic Yield
of Nile Tilapia (Oreochromis niloticus
L.) in Floating Cages. Agriculture
2022, 12, 942. https://doi.org/
10.3390/agriculture12070942
Academic Editors: Ronald
Kennedy Luz and Vito Laudadio
Received: 16 May 2022
Accepted: 27 June 2022
Published: 29 June 2022
Publisher’s Note: MDPI stays neutral
with regard to jurisdictional claims in
published maps and institutional affil-
iations.
Copyright: © 2022 by the authors.
Licensee MDPI, Basel, Switzerland.
This article is an open access article
distributed under the terms and
conditions of the Creative Commons
Attribution (CC BY) license (https://
creativecommons.org/licenses/by/
4.0/).
agriculture
Article
Effects of Stocking Larger-Sized Fish on Water Quality, GrowthPerformance, and the Economic Yield of Nile Tilapia(Oreochromis niloticus L.) in Floating CagesMd Shamsuddin 1 , Mohammad Belal Hossain 2,3,* , Moshiur Rahman 1,* , Mst Salamun Kawla 4,Md. Farhan Tazim 1, Mohammed Fahad Albeshr 5 and Takaomi Arai 6
1 Department of Fisheries (DoF), Ministry of Fisheries and Livestock, Dhaka 1000, Bangladesh;[email protected] (M.S.); [email protected] (M.F.T.)
2 Department of Fisheries and Marine Science, Noakhali Science and Technology University,Noakhali 3814, Bangladesh
3 School of Engineering and Built Environment, Griffith University, Brisbane, QLD 4111, Australia4 Department of Fisheries Management, Bangladesh Agricultural University, Mymensingh 2202, Bangladesh;
[email protected] Department of Zoology, College of Science, King Saud University, P.O. Box 2455, Riyadh 11451, Saudi Arabia;
[email protected] Environmental and Life Sciences Programme, Faculty of Science, University Brunei Darussalam,
Jala Tungku Link, Gadong BE 1410, Brunei; [email protected]* Correspondence: [email protected] (M.B.H.); [email protected] (M.R.)
Abstract: Earlier research has mostly focused on the impacts of stocking density on fish growth, yield,and survival rate; however, knowledge of the effects of stocking larger-sized fish, particularly NileTilapia, is lacking. This type of research is critically important for increasing food security, achievingsustainable goals, and facing the challenges of climate change in the near future. Therefore, weinvestigated the effects of initial stocking body sizes of Nile Tilapia (Oreochromis niloticus) on waterquality, growth performance, and economic yield in tropical riverine cages for 120 days in two culturecycles. Nile Tilapia of three different body sizes (34.06 ± 0.22 g, 10.98 ± 0.09 g, and 5.47 ± 0.04 for thefirst cycle and 33.85 ± 0.01 g, 11.07 ± 0.05 g, and 5.38 ± 0.06 g for the second cycle, indicated as T1,T2, and T3) were stocked in the culture treatments where unique stocking density and feed rationswere maintained. The results revealed that water quality parameters did not differ significantly(p > 0.5) and were within a suitable range for Nile Tilapia culture. Treatments with larger-sized fishdemonstrated a higher growth performance. The stocking fish size of 34.14–34.71 g was found to bethe best among the three treatments regarding growth performance and economic return. As a result,except for T1 and T2 at a rural site and T1 at a semi-urban site, all of the treatments had negativeallometry (b < 3.0), indicating that larger-sized fish and the rural site of the river are more suitable forcage culture. The rural site was found to be more suitable, possibly due to less variation of waterparameters, more natural foods, and less pollution. The cages with larger-sized fish stocked had ahigher net present value (NPV); internal rate of return (IRR); benefit–cost ratio (BCR); and rate onreturn (ROI), indicating that cage culture with larger-sized fish stocked is economically viable in theriverine system. Therefore, stocking the larger-sized fish (T1) and rural site are more suitable forcage culture.
Keywords: cage culture; relative condition factor; growth performance; stocking density; thesurvival rate
1. Introduction
Bangladesh, a self-sufficient fish-producing country, has the second-highest growthrate (9.1%) after Indonesia [1]. Its total fish production has expanded by around six-foldduring the last three decades (0.754 million MT (Metric Ton) in 1983–1984 to 4.503 million
Agriculture 2022, 12, 942. https://doi.org/10.3390/agriculture12070942 https://www.mdpi.com/journal/agriculture
Agriculture 2022, 12, 942 2 of 19
MT in 2019–2020). The inland culture fishery consists primarily of ponds; ox-bow lakes(baor); shrimp/prawn farms; seasonal cultured water bodies; pens; and cage culture,producing approximately 25.84 lakh metric tons in 2019–2020, accounting for approximately57.38% of the total fish production [2]. The fisheries sector contributed about 3.52% to theGross Domestic Production (GDP) and approximately 26.37% of the agricultural sector’stotal income. The inland fisheries accounted for 85.10% of the total catch (inland openwater 27.72% and inland closed water 57.38%), and the remaining 14.90% came from themarine fisheries [2]. However, it is well documented that most capture fisheries have beenover-exploited due to overfishing, habitat degradation, and pollution [3,4].
An improved or intensive aquaculture system has many negative impacts on theenvironment. Therefore, to reduce the environmental impacts or to continue the aquacul-ture practice over time with minimum environmental impacts, sustainable aquaculture isgaining popularity. It is also a way to reduce pressure on wild stock. However, sustainableaquaculture varies with species, geographical location, knowledge, and technology thatis developed.
Furthermore, climate change is already having an impact on specific biological pro-cesses, altering freshwater food webs, and creating unforeseeable consequences for fishproduction, including increased risks of species invasions and the spread of vector-borne dis-eases. Freshwater aquatic species are experiencing changes in abundance, productivity, com-munity composition, dispersion, and migration. Bangladesh’s fisheries sector—especiallyinland fish culture—is sensitive to climate change as it influences the rainy season andcauses flooding [5]. As sea levels rise, flooding of low-lying areas and the salinization ofgroundwater and soil will make many areas ideal for aquaculture, while also making themunsuitable for regular agriculture (MAB, 2009). Due to this and other flooding, it has beensuggested that Bangladesh could transform from a "rice bowl" to a “fish pond”. The highlevel of fishing pressure on natural water resources worldwide requires the implementationof innovative solid mitigation measures such as cage-culture farming [6].
Floating cage culture is an effective culture system that uses freshwater and marinehabitats, such as rivers, lakes, floodplain areas, estuaries, seas, and reservoirs to producequick fish production [7,8]. Since it can use communal water sources, this cage-cultureapproach offers an alternative aquaculture method, especially for landless people [9].The close observation of fish behavior, easy disease detection, predator protection, easyrelocation, relatively little capital investment, and the potential for improved prices are alladvantages of cage culture [3,10]. Globally, comprehensive fish culture in cages has alreadybeen achieved with great success. In Bangladesh, aquaculture activities are still mostlyfocused on pond-based culture systems; however, fish production by cage aquaculturesystems using various water resources was around 4590 MT in the fiscal year 2019–2020 [2].
Since the fish is resistant to harsh climatic fluctuations, has a low mortality rate, andhas a faster growth rate, Nile Tilapia culture in cages has become popular. Nile Tilapiaproduction in cages is especially advantageous because of disease resistance, hardiness,omnivory, ease of harvesting, adaptive capacity, and the ability to be grown with a highstocking density [11–13]. As a result, the cage culture of Nile Tilapia (Oreochromis. niloticusL.) has exploded in Bangladesh’s Dakatia River, Kaptai Lake, and Titas River. In terms ofgenerating money, animal protein intake, and improving the livelihood position of small-scale farmers, the Titas River may offer significant potential for floating-cage aquaculture.Titas River’s annual fish production reached 1955 MT in 2018–2019 [2], which played asignificant role in fulfilling the protein demand of Brahmanbaria.
Fish culture in net cages needs adherence to best practices, such as adopting anappropriate fish stocking density and fish size to enhance production efficiency. Theidentification of optimal-sized fish stockings is a critical aspect for the success of NileTilapia cage culture, as it has a direct impact on the fish’s growth rate and survival, as wellas their health and water quality, and, as a result, the farm’s economics and profitability in2018–2019 [2,14]. However, due to a lack of knowledge about the fish’s appropriate stockingsize, this business has frequently failed to reach full commercialization [15]. Moreover, the
Agriculture 2022, 12, 942 3 of 19
cage aquaculture of O. niloticus, considering the stocking density of different sized fish,growth, yield, and farm economics, has not been studied in detail in Bangladesh. Althoughstocking with different sized fish and management measures are practiced in Bangladeshby cage operators, these are not based on modern technical knowledge, resulting in thepoor growth and survival rate of fingerlings, as well as low income. Therefore, the purposeof this study was to evaluate the effects of stocking with larger-sized fish on a growthperformance, cost–benefit, and business feasibility analysis of Nile Tilapia (O. niloticus L.)in net-cage culture placed in a riverine system of Bangladesh. This is the first report ofits kind and will help to improve the knowledge on cage-culture techniques in a riverineecosystem, in order to achieve sustainable development goals and to expand climate-adaptive culture techniques.
2. Materials and Methods2.1. Study Area and Experimental Design
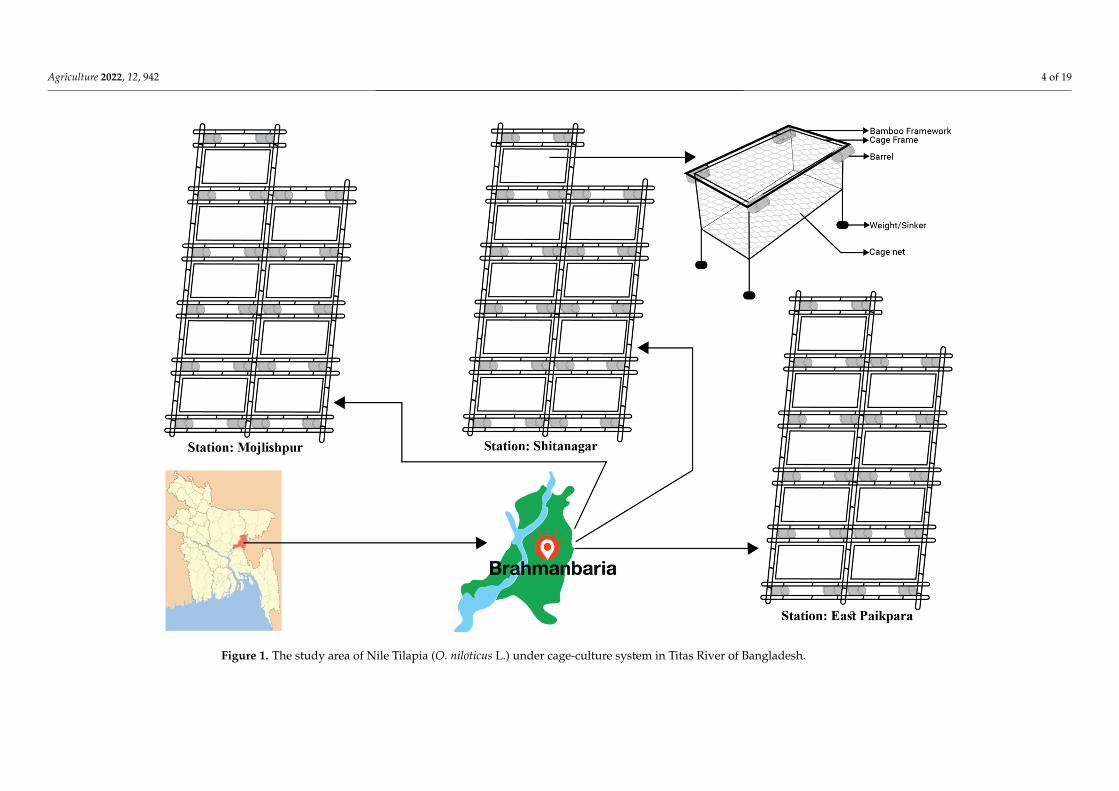
The study was undertaken in twenty-seven nylon net cages that were installed onthe Titas River of Bangladesh for two cycles, each lasting 120 days, from 16 March 2020to 14 July 2020 (first cycle) and 20 July 2020 to 17 November 2020 (second cycle). Threesites on the Titas River with different geographic locations were chosen for conductingthe study: Mojlishpur (Lat: 24◦1′57.5688′′ N; Lng: 91◦8′41.6364′′ E) as the site in the ruralarea; Shitanagar (Lat: 23◦59′1.6908′′ N; Lng: 91◦6′53.0388′′ E) as the semi-urban area; andPaikpara (Lat: 23◦58′52.8348′′ N; Lng: 91◦30′49.122′′ E) as the urban area (Figure 1). For thecurrent study, twenty-seven newly constructed cages were used, where nine cages weretriplicated with three treatments. The net cages hung with a cage frame were made of a knot-less polyethylene net (mesh 1.0 cm). The cage’s frame was made of a one-inch diameter GI(Galvanised Iron) pipe. Plastic drums were used as cage floats. A bamboo-made platformwas set up over the cages, and all the cages were fixed to the platform’s poles. Cages wereinstalled on both sides of the platform for easy feed supply and intensive observation.In the present study, three different sizes of monosex Nile Tilapia with unique stockingdensity (500 fish/cage) were designed as T1, T2, and T3, respectively, with triplicates foreach treatment group in three different cage sites. Moreover, the treatments were namedwith respecting cage sites as MT1, MT2, and MT3 for Mojlishpur; ST1, ST2, and ST3 forShitanagar, and PT1, PT2, and PT3 for Paikpara. In brief, hormonally sex-reversed juvenilemonosex male tilapia, O. niloticus L. averaging 34.06 ± 0.22 g for T1; 10.98 ± 0.09 g for T2;and 5.47 ± 0.04 g for T3 in the first cycle, and 33.85 ± 0.01 g for T1; 11.07 ± 0.05 g for T2;and 5.38 ± 0.06 g for T3 in the second cycle were transported to the experimental sites.The fish were kept in three net hapas for three hours for acclimation to the environment.The initial length of the fish in cm and weight in g were recorded individually with thehelp of a measuring scale and a digital electronic balance (OHAUS, Model CT 1200-S,Parsippany, NJ, USA). Finally, the cages (6.10 m × 3.05 m × 1.52 m or, 28.28 m3 each) wererandomly stocked with monosex Nile Tilapia, and the number of fish stocked in each cagewas recorded simultaneously.
Agriculture 2022, 12, 942 4 of 19
Agriculture 2022, 12, x FOR PEER REVIEW 4 of 22
Figure 1. The study area of Nile Tilapia (O. niloticus L.) under cage-culture system in Titas River of Bangladesh.
Figure 1. The study area of Nile Tilapia (O. niloticus L.) under cage-culture system in Titas River of Bangladesh.
Agriculture 2022, 12, 942 5 of 19
2.2. Feeding and Management
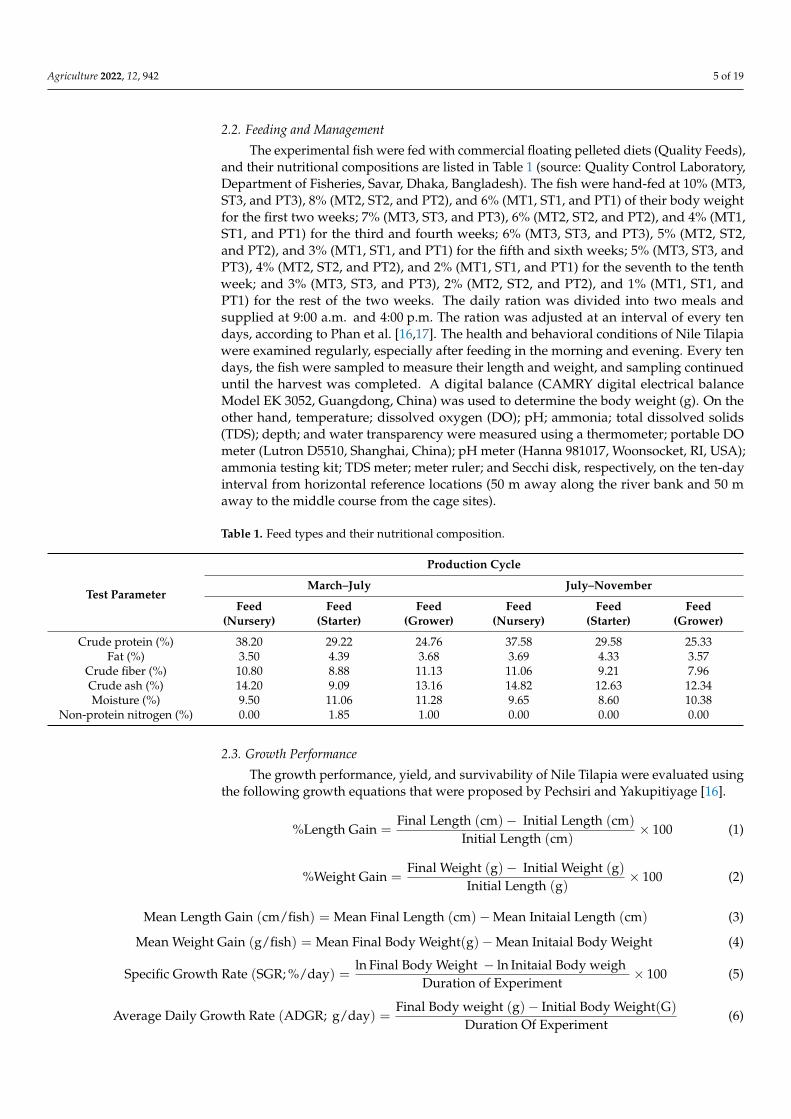
The experimental fish were fed with commercial floating pelleted diets (Quality Feeds),and their nutritional compositions are listed in Table 1 (source: Quality Control Laboratory,Department of Fisheries, Savar, Dhaka, Bangladesh). The fish were hand-fed at 10% (MT3,ST3, and PT3), 8% (MT2, ST2, and PT2), and 6% (MT1, ST1, and PT1) of their body weightfor the first two weeks; 7% (MT3, ST3, and PT3), 6% (MT2, ST2, and PT2), and 4% (MT1,ST1, and PT1) for the third and fourth weeks; 6% (MT3, ST3, and PT3), 5% (MT2, ST2,and PT2), and 3% (MT1, ST1, and PT1) for the fifth and sixth weeks; 5% (MT3, ST3, andPT3), 4% (MT2, ST2, and PT2), and 2% (MT1, ST1, and PT1) for the seventh to the tenthweek; and 3% (MT3, ST3, and PT3), 2% (MT2, ST2, and PT2), and 1% (MT1, ST1, andPT1) for the rest of the two weeks. The daily ration was divided into two meals andsupplied at 9:00 a.m. and 4:00 p.m. The ration was adjusted at an interval of every tendays, according to Phan et al. [16,17]. The health and behavioral conditions of Nile Tilapiawere examined regularly, especially after feeding in the morning and evening. Every tendays, the fish were sampled to measure their length and weight, and sampling continueduntil the harvest was completed. A digital balance (CAMRY digital electrical balanceModel EK 3052, Guangdong, China) was used to determine the body weight (g). On theother hand, temperature; dissolved oxygen (DO); pH; ammonia; total dissolved solids(TDS); depth; and water transparency were measured using a thermometer; portable DOmeter (Lutron D5510, Shanghai, China); pH meter (Hanna 981017, Woonsocket, RI, USA);ammonia testing kit; TDS meter; meter ruler; and Secchi disk, respectively, on the ten-dayinterval from horizontal reference locations (50 m away along the river bank and 50 maway to the middle course from the cage sites).
Table 1. Feed types and their nutritional composition.
Test Parameter
Production Cycle
March–July July–November
Feed(Nursery)
Feed(Starter)
Feed(Grower)
Feed(Nursery)
Feed(Starter)
Feed(Grower)
Crude protein (%) 38.20 29.22 24.76 37.58 29.58 25.33Fat (%) 3.50 4.39 3.68 3.69 4.33 3.57
Crude fiber (%) 10.80 8.88 11.13 11.06 9.21 7.96Crude ash (%) 14.20 9.09 13.16 14.82 12.63 12.34Moisture (%) 9.50 11.06 11.28 9.65 8.60 10.38
Non-protein nitrogen (%) 0.00 1.85 1.00 0.00 0.00 0.00
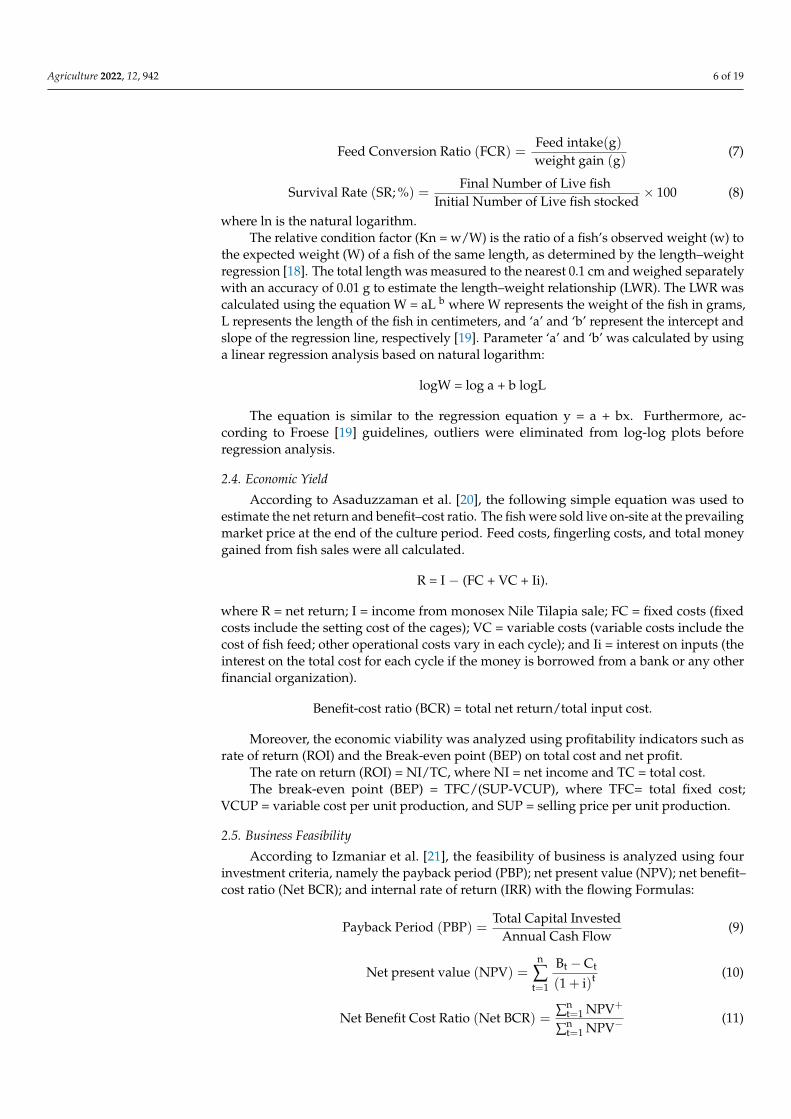
2.3. Growth Performance
The growth performance, yield, and survivability of Nile Tilapia were evaluated usingthe following growth equations that were proposed by Pechsiri and Yakupitiyage [16].
%Length Gain =Final Length (cm)− Initial Length (cm)
Initial Length (cm)× 100 (1)
%Weight Gain =Final Weight (g)− Initial Weight (g)
Initial Length (g)× 100 (2)
Mean Length Gain (cm/fish) = Mean Final Length (cm)−Mean Initaial Length (cm) (3)
Mean Weight Gain (g/fish) = Mean Final Body Weight(g)−Mean Initaial Body Weight (4)
Specific Growth Rate (SGR; %/day) =ln Final Body Weight − ln Initaial Body weigh
Duration of Experiment× 100 (5)
Average Daily Growth Rate (ADGR; g/day) =Final Body weight (g)− Initial Body Weight(G)
Duration Of Experiment(6)
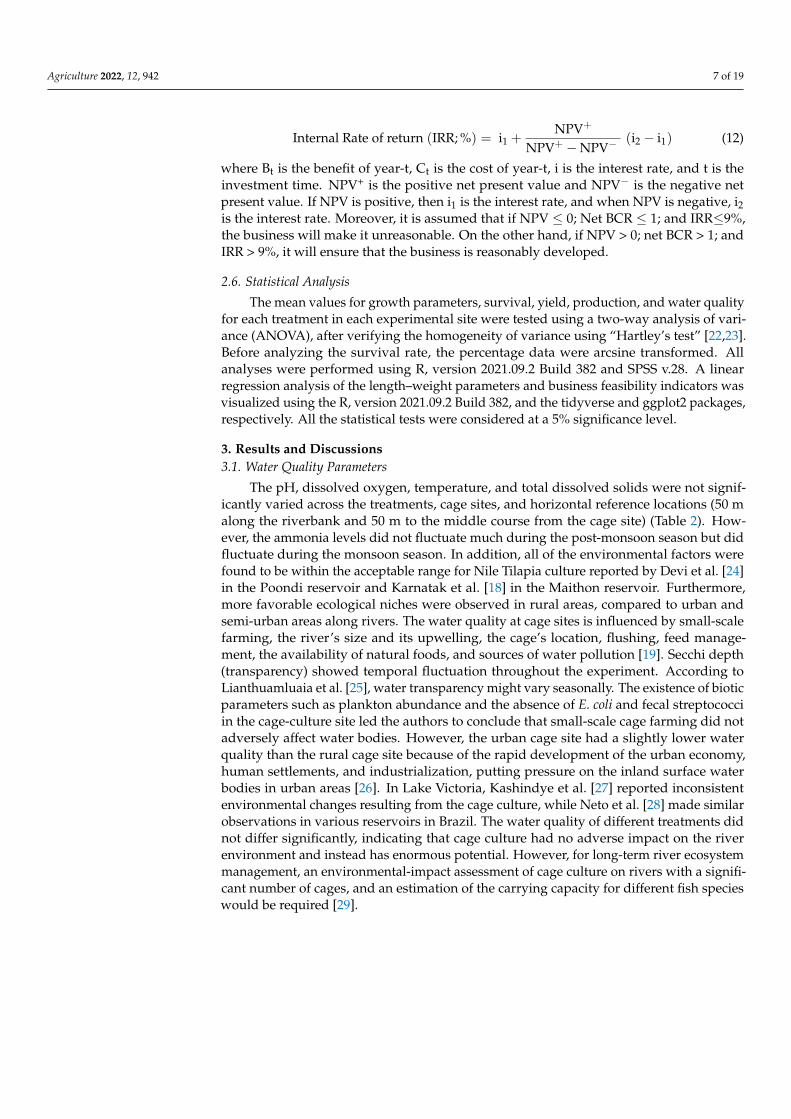
Agriculture 2022, 12, 942 6 of 19
Feed Conversion Ratio (FCR) =Feed intake(g)weight gain (g)
(7)
Survival Rate (SR; %) =Final Number of Live fish
Initial Number of Live fish stocked× 100 (8)
where ln is the natural logarithm.The relative condition factor (Kn = w/W) is the ratio of a fish’s observed weight (w) to
the expected weight (W) of a fish of the same length, as determined by the length–weightregression [18]. The total length was measured to the nearest 0.1 cm and weighed separatelywith an accuracy of 0.01 g to estimate the length–weight relationship (LWR). The LWR wascalculated using the equation W = aL b where W represents the weight of the fish in grams,L represents the length of the fish in centimeters, and ‘a’ and ‘b’ represent the intercept andslope of the regression line, respectively [19]. Parameter ‘a’ and ‘b’ was calculated by usinga linear regression analysis based on natural logarithm:
logW = log a + b logL
The equation is similar to the regression equation y = a + bx. Furthermore, ac-cording to Froese [19] guidelines, outliers were eliminated from log-log plots beforeregression analysis.
2.4. Economic Yield
According to Asaduzzaman et al. [20], the following simple equation was used toestimate the net return and benefit–cost ratio. The fish were sold live on-site at the prevailingmarket price at the end of the culture period. Feed costs, fingerling costs, and total moneygained from fish sales were all calculated.
R = I − (FC + VC + Ii).
where R = net return; I = income from monosex Nile Tilapia sale; FC = fixed costs (fixedcosts include the setting cost of the cages); VC = variable costs (variable costs include thecost of fish feed; other operational costs vary in each cycle); and Ii = interest on inputs (theinterest on the total cost for each cycle if the money is borrowed from a bank or any otherfinancial organization).
Benefit-cost ratio (BCR) = total net return/total input cost.
Moreover, the economic viability was analyzed using profitability indicators such asrate of return (ROI) and the Break-even point (BEP) on total cost and net profit.
The rate on return (ROI) = NI/TC, where NI = net income and TC = total cost.The break-even point (BEP) = TFC/(SUP-VCUP), where TFC= total fixed cost;
VCUP = variable cost per unit production, and SUP = selling price per unit production.
2.5. Business Feasibility
According to Izmaniar et al. [21], the feasibility of business is analyzed using fourinvestment criteria, namely the payback period (PBP); net present value (NPV); net benefit–cost ratio (Net BCR); and internal rate of return (IRR) with the flowing Formulas:
Payback Period (PBP) =Total Capital Invested
Annual Cash Flow(9)
Net present value (NPV) =n
∑t=1
Bt −Ct
(1 + i)t (10)
Net Benefit Cost Ratio (Net BCR) =∑n
t=1 NPV+
∑nt=1 NPV−
(11)
Agriculture 2022, 12, 942 7 of 19
Internal Rate of return (IRR; %) = i1 +NPV+
NPV+ −NPV−(i2 − i1) (12)
where Bt is the benefit of year-t, Ct is the cost of year-t, i is the interest rate, and t is theinvestment time. NPV+ is the positive net present value and NPV− is the negative netpresent value. If NPV is positive, then i1 is the interest rate, and when NPV is negative, i2is the interest rate. Moreover, it is assumed that if NPV ≤ 0; Net BCR ≤ 1; and IRR≤9%,the business will make it unreasonable. On the other hand, if NPV > 0; net BCR > 1; andIRR > 9%, it will ensure that the business is reasonably developed.
2.6. Statistical Analysis
The mean values for growth parameters, survival, yield, production, and water qualityfor each treatment in each experimental site were tested using a two-way analysis of vari-ance (ANOVA), after verifying the homogeneity of variance using “Hartley’s test” [22,23].Before analyzing the survival rate, the percentage data were arcsine transformed. Allanalyses were performed using R, version 2021.09.2 Build 382 and SPSS v.28. A linearregression analysis of the length–weight parameters and business feasibility indicators wasvisualized using the R, version 2021.09.2 Build 382, and the tidyverse and ggplot2 packages,respectively. All the statistical tests were considered at a 5% significance level.
3. Results and Discussions3.1. Water Quality Parameters
The pH, dissolved oxygen, temperature, and total dissolved solids were not signif-icantly varied across the treatments, cage sites, and horizontal reference locations (50 malong the riverbank and 50 m to the middle course from the cage site) (Table 2). How-ever, the ammonia levels did not fluctuate much during the post-monsoon season but didfluctuate during the monsoon season. In addition, all of the environmental factors werefound to be within the acceptable range for Nile Tilapia culture reported by Devi et al. [24]in the Poondi reservoir and Karnatak et al. [18] in the Maithon reservoir. Furthermore,more favorable ecological niches were observed in rural areas, compared to urban andsemi-urban areas along rivers. The water quality at cage sites is influenced by small-scalefarming, the river’s size and its upwelling, the cage’s location, flushing, feed manage-ment, the availability of natural foods, and sources of water pollution [19]. Secchi depth(transparency) showed temporal fluctuation throughout the experiment. According toLianthuamluaia et al. [25], water transparency might vary seasonally. The existence of bioticparameters such as plankton abundance and the absence of E. coli and fecal streptococciin the cage-culture site led the authors to conclude that small-scale cage farming did notadversely affect water bodies. However, the urban cage site had a slightly lower waterquality than the rural cage site because of the rapid development of the urban economy,human settlements, and industrialization, putting pressure on the inland surface waterbodies in urban areas [26]. In Lake Victoria, Kashindye et al. [27] reported inconsistentenvironmental changes resulting from the cage culture, while Neto et al. [28] made similarobservations in various reservoirs in Brazil. The water quality of different treatments didnot differ significantly, indicating that cage culture had no adverse impact on the riverenvironment and instead has enormous potential. However, for long-term river ecosystemmanagement, an environmental-impact assessment of cage culture on rivers with a signifi-cant number of cages, and an estimation of the carrying capacity for different fish specieswould be required [29].
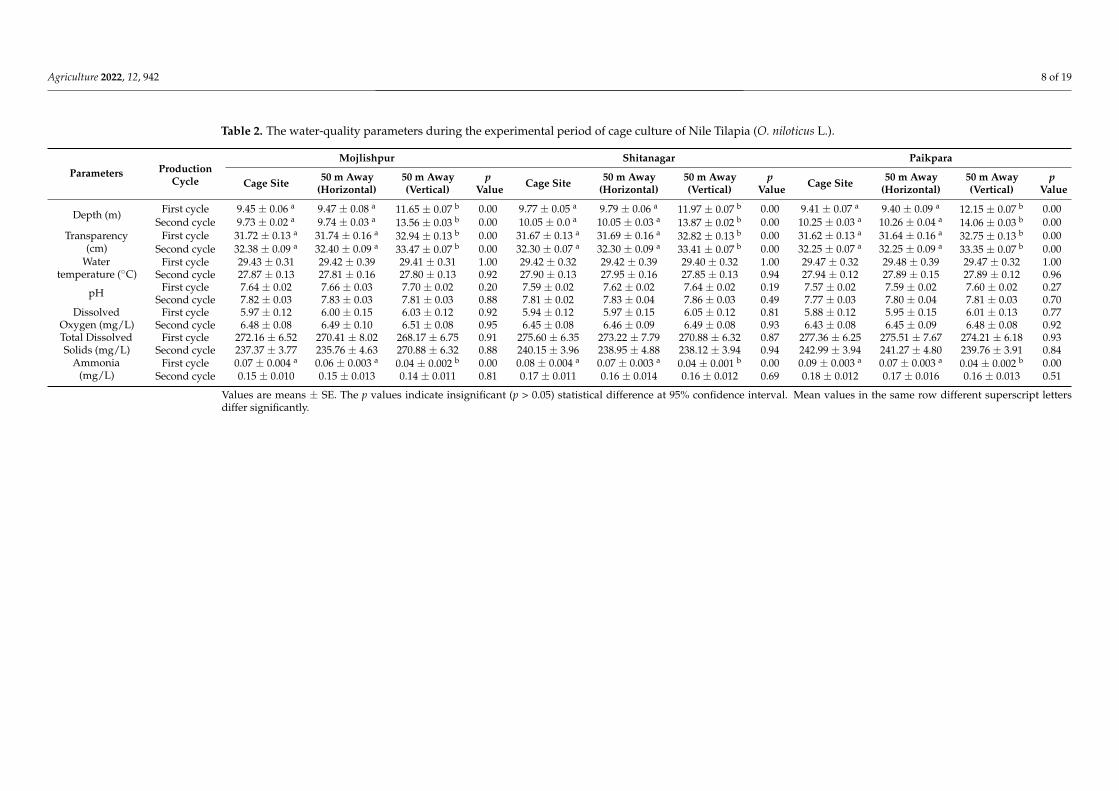
Agriculture 2022, 12, 942 8 of 19
Table 2. The water-quality parameters during the experimental period of cage culture of Nile Tilapia (O. niloticus L.).
Parameters ProductionCycle
Mojlishpur Shitanagar Paikpara
Cage Site 50 m Away(Horizontal)
50 m Away(Vertical)
pValue Cage Site 50 m Away
(Horizontal)50 m Away(Vertical)
pValue Cage Site 50 m Away
(Horizontal)50 m Away(Vertical)
pValue
Depth (m) First cycle 9.45 ± 0.06 a 9.47 ± 0.08 a 11.65 ± 0.07 b 0.00 9.77 ± 0.05 a 9.79 ± 0.06 a 11.97 ± 0.07 b 0.00 9.41 ± 0.07 a 9.40 ± 0.09 a 12.15 ± 0.07 b 0.00Second cycle 9.73 ± 0.02 a 9.74 ± 0.03 a 13.56 ± 0.03 b 0.00 10.05 ± 0.0 a 10.05 ± 0.03 a 13.87 ± 0.02 b 0.00 10.25 ± 0.03 a 10.26 ± 0.04 a 14.06 ± 0.03 b 0.00
Transparency(cm)
First cycle 31.72 ± 0.13 a 31.74 ± 0.16 a 32.94 ± 0.13 b 0.00 31.67 ± 0.13 a 31.69 ± 0.16 a 32.82 ± 0.13 b 0.00 31.62 ± 0.13 a 31.64 ± 0.16 a 32.75 ± 0.13 b 0.00Second cycle 32.38 ± 0.09 a 32.40 ± 0.09 a 33.47 ± 0.07 b 0.00 32.30 ± 0.07 a 32.30 ± 0.09 a 33.41 ± 0.07 b 0.00 32.25 ± 0.07 a 32.25 ± 0.09 a 33.35 ± 0.07 b 0.00
Watertemperature (◦C)
First cycle 29.43 ± 0.31 29.42 ± 0.39 29.41 ± 0.31 1.00 29.42 ± 0.32 29.42 ± 0.39 29.40 ± 0.32 1.00 29.47 ± 0.32 29.48 ± 0.39 29.47 ± 0.32 1.00Second cycle 27.87 ± 0.13 27.81 ± 0.16 27.80 ± 0.13 0.92 27.90 ± 0.13 27.95 ± 0.16 27.85 ± 0.13 0.94 27.94 ± 0.12 27.89 ± 0.15 27.89 ± 0.12 0.96
pH First cycle 7.64 ± 0.02 7.66 ± 0.03 7.70 ± 0.02 0.20 7.59 ± 0.02 7.62 ± 0.02 7.64 ± 0.02 0.19 7.57 ± 0.02 7.59 ± 0.02 7.60 ± 0.02 0.27Second cycle 7.82 ± 0.03 7.83 ± 0.03 7.81 ± 0.03 0.88 7.81 ± 0.02 7.83 ± 0.04 7.86 ± 0.03 0.49 7.77 ± 0.03 7.80 ± 0.04 7.81 ± 0.03 0.70
DissolvedOxygen (mg/L)
First cycle 5.97 ± 0.12 6.00 ± 0.15 6.03 ± 0.12 0.92 5.94 ± 0.12 5.97 ± 0.15 6.05 ± 0.12 0.81 5.88 ± 0.12 5.95 ± 0.15 6.01 ± 0.13 0.77Second cycle 6.48 ± 0.08 6.49 ± 0.10 6.51 ± 0.08 0.95 6.45 ± 0.08 6.46 ± 0.09 6.49 ± 0.08 0.93 6.43 ± 0.08 6.45 ± 0.09 6.48 ± 0.08 0.92
Total DissolvedSolids (mg/L)
First cycle 272.16 ± 6.52 270.41 ± 8.02 268.17 ± 6.75 0.91 275.60 ± 6.35 273.22 ± 7.79 270.88 ± 6.32 0.87 277.36 ± 6.25 275.51 ± 7.67 274.21 ± 6.18 0.93Second cycle 237.37 ± 3.77 235.76 ± 4.63 270.88 ± 6.32 0.88 240.15 ± 3.96 238.95 ± 4.88 238.12 ± 3.94 0.94 242.99 ± 3.94 241.27 ± 4.80 239.76 ± 3.91 0.84
Ammonia(mg/L)
First cycle 0.07 ± 0.004 a 0.06 ± 0.003 a 0.04 ± 0.002 b 0.00 0.08 ± 0.004 a 0.07 ± 0.003 a 0.04 ± 0.001 b 0.00 0.09 ± 0.003 a 0.07 ± 0.003 a 0.04 ± 0.002 b 0.00Second cycle 0.15 ± 0.010 0.15 ± 0.013 0.14 ± 0.011 0.81 0.17 ± 0.011 0.16 ± 0.014 0.16 ± 0.012 0.69 0.18 ± 0.012 0.17 ± 0.016 0.16 ± 0.013 0.51
Values are means ± SE. The p values indicate insignificant (p > 0.05) statistical difference at 95% confidence interval. Mean values in the same row different superscript lettersdiffer significantly.
Agriculture 2022, 12, 942 9 of 19
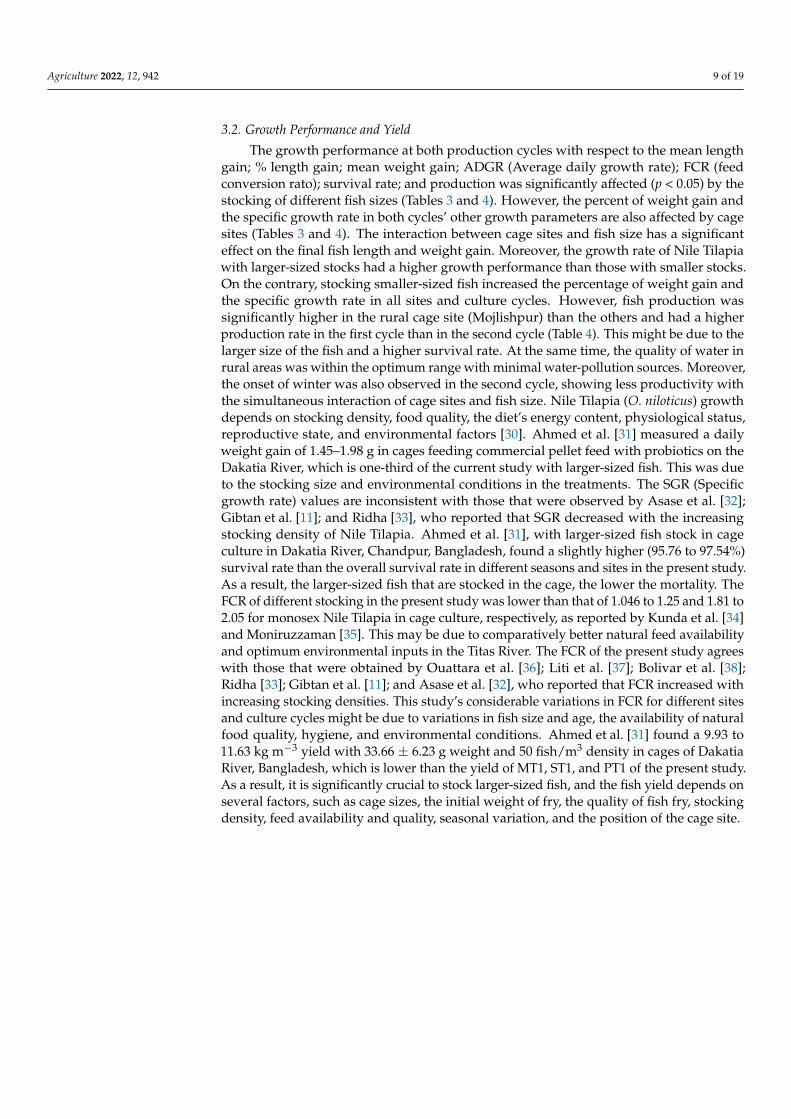
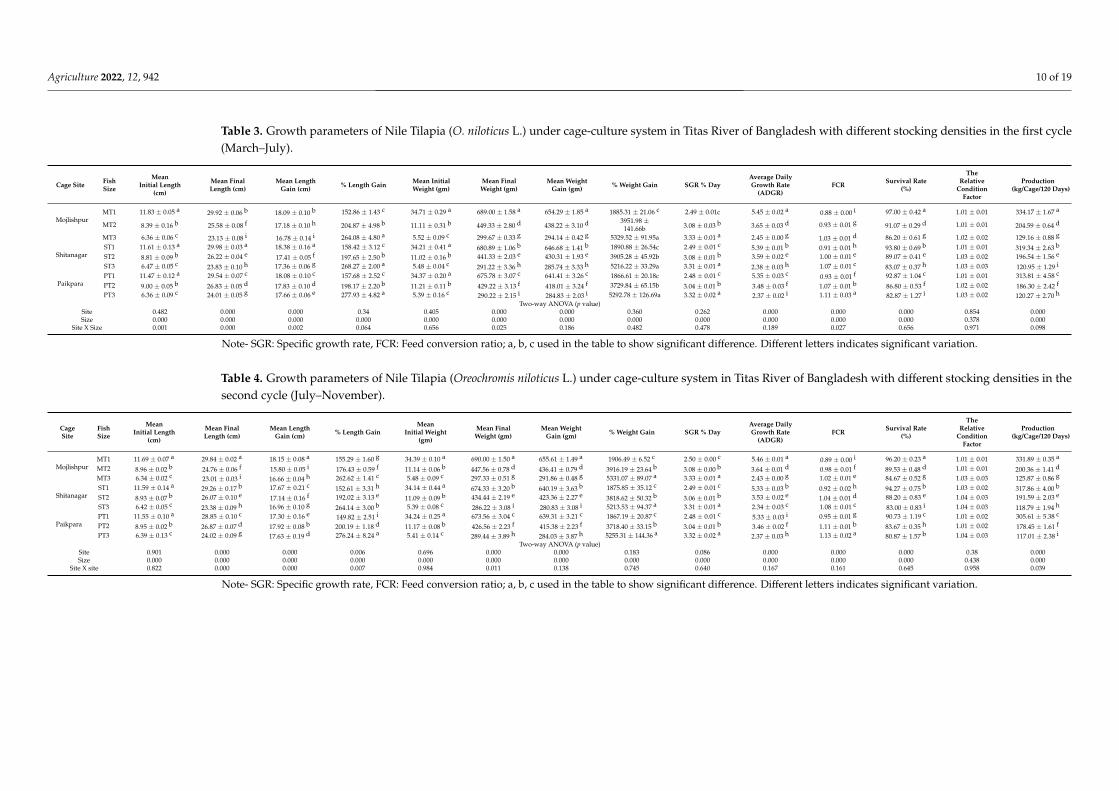
3.2. Growth Performance and Yield
The growth performance at both production cycles with respect to the mean lengthgain; % length gain; mean weight gain; ADGR (Average daily growth rate); FCR (feedconversion rato); survival rate; and production was significantly affected (p < 0.05) by thestocking of different fish sizes (Tables 3 and 4). However, the percent of weight gain andthe specific growth rate in both cycles’ other growth parameters are also affected by cagesites (Tables 3 and 4). The interaction between cage sites and fish size has a significanteffect on the final fish length and weight gain. Moreover, the growth rate of Nile Tilapiawith larger-sized stocks had a higher growth performance than those with smaller stocks.On the contrary, stocking smaller-sized fish increased the percentage of weight gain andthe specific growth rate in all sites and culture cycles. However, fish production wassignificantly higher in the rural cage site (Mojlishpur) than the others and had a higherproduction rate in the first cycle than in the second cycle (Table 4). This might be due to thelarger size of the fish and a higher survival rate. At the same time, the quality of water inrural areas was within the optimum range with minimal water-pollution sources. Moreover,the onset of winter was also observed in the second cycle, showing less productivity withthe simultaneous interaction of cage sites and fish size. Nile Tilapia (O. niloticus) growthdepends on stocking density, food quality, the diet’s energy content, physiological status,reproductive state, and environmental factors [30]. Ahmed et al. [31] measured a dailyweight gain of 1.45–1.98 g in cages feeding commercial pellet feed with probiotics on theDakatia River, which is one-third of the current study with larger-sized fish. This was dueto the stocking size and environmental conditions in the treatments. The SGR (Specificgrowth rate) values are inconsistent with those that were observed by Asase et al. [32];Gibtan et al. [11]; and Ridha [33], who reported that SGR decreased with the increasingstocking density of Nile Tilapia. Ahmed et al. [31], with larger-sized fish stock in cageculture in Dakatia River, Chandpur, Bangladesh, found a slightly higher (95.76 to 97.54%)survival rate than the overall survival rate in different seasons and sites in the present study.As a result, the larger-sized fish that are stocked in the cage, the lower the mortality. TheFCR of different stocking in the present study was lower than that of 1.046 to 1.25 and 1.81 to2.05 for monosex Nile Tilapia in cage culture, respectively, as reported by Kunda et al. [34]and Moniruzzaman [35]. This may be due to comparatively better natural feed availabilityand optimum environmental inputs in the Titas River. The FCR of the present study agreeswith those that were obtained by Ouattara et al. [36]; Liti et al. [37]; Bolivar et al. [38];Ridha [33]; Gibtan et al. [11]; and Asase et al. [32], who reported that FCR increased withincreasing stocking densities. This study’s considerable variations in FCR for different sitesand culture cycles might be due to variations in fish size and age, the availability of naturalfood quality, hygiene, and environmental conditions. Ahmed et al. [31] found a 9.93 to11.63 kg m−3 yield with 33.66 ± 6.23 g weight and 50 fish/m3 density in cages of DakatiaRiver, Bangladesh, which is lower than the yield of MT1, ST1, and PT1 of the present study.As a result, it is significantly crucial to stock larger-sized fish, and the fish yield depends onseveral factors, such as cage sizes, the initial weight of fry, the quality of fish fry, stockingdensity, feed availability and quality, seasonal variation, and the position of the cage site.
Agriculture 2022, 12, 942 10 of 19
Table 3. Growth parameters of Nile Tilapia (O. niloticus L.) under cage-culture system in Titas River of Bangladesh with different stocking densities in the first cycle(March–July).
Cage Site FishSize
MeanInitial Length
(cm)
Mean FinalLength (cm)
Mean LengthGain (cm) % Length Gain Mean Initial
Weight (gm)Mean FinalWeight (gm)
Mean WeightGain (gm) % Weight Gain SGR % Day
Average DailyGrowth Rate
(ADGR)FCR Survival Rate
(%)
TheRelative
ConditionFactor
Production(kg/Cage/120 Days)
MojlishpurMT1 11.83 ± 0.05 a 29.92 ± 0.06 b 18.09 ± 0.10 b 152.86 ± 1.43 c 34.71 ± 0.29 a 689.00 ± 1.58 a 654.29 ± 1.85 a 1885.31 ± 21.06 c 2.49 ± 0.01c 5.45 ± 0.02 a 0.88 ± 0.00 i 97.00 ± 0.42 a 1.01 ± 0.01 334.17 ± 1.67 a
MT2 8.39 ± 0.16 b 25.58 ± 0.08 f 17.18 ± 0.10 h 204.87 ± 4.98 b 11.11 ± 0.31 b 449.33 ± 2.80 d 438.22 ± 3.10 d 3951.98 ±141.66b 3.08 ± 0.03 b 3.65 ± 0.03 d 0.93 ± 0.01 g 91.07 ± 0.29 d 1.01 ± 0.01 204.59 ± 0.64 d
MT3 6.36 ± 0.06 c 23.13 ± 0.08 i 16.78 ± 0.14 i 264.08 ± 4.80 a 5.52 ± 0.09 c 299.67 ± 0.33 g 294.14 ± 0.42 g 5329.52 ± 91.95a 3.33 ± 0.01 a 2.45 ± 0.00 g 1.03 ± 0.01 d 86.20 ± 0.61 g 1.02 ± 0.02 129.16 ± 0.88 g
ShitanagarST1 11.61 ± 0.13 a 29.98 ± 0.03 a 18.38 ± 0.16 a 158.42 ± 3.12 c 34.21 ± 0.41 a 680.89 ± 1.06 b 646.68 ± 1.41 b 1890.88 ± 26.54c 2.49 ± 0.01 c 5.39 ± 0.01 b 0.91 ± 0.01 h 93.80 ± 0.69 b 1.01 ± 0.01 319.34 ± 2.63 b
ST2 8.81 ± 0.09 b 26.22 ± 0.04 e 17.41 ± 0.05 f 197.65 ± 2.50 b 11.02 ± 0.16 b 441.33 ± 2.03 e 430.31 ± 1.93 e 3905.28 ± 45.92b 3.08 ± 0.01 b 3.59 ± 0.02 e 1.00 ± 0.01 e 89.07 ± 0.41 e 1.03 ± 0.02 196.54 ± 1.56 e
ST3 6.47 ± 0.05 c 23.83 ± 0.10 h 17.36 ± 0.06 g 268.27 ± 2.00 a 5.48 ± 0.04 c 291.22 ± 3.36 h 285.74 ± 3.33 h 5216.22 ± 33.29a 3.31 ± 0.01 a 2.38 ± 0.03 h 1.07 ± 0.01 c 83.07 ± 0.37 h 1.03 ± 0.03 120.95 ± 1.29 i
PaikparaPT1 11.47 ± 0.12 a 29.54 ± 0.07 c 18.08 ± 0.10 c 157.68 ± 2.52 c 34.37 ± 0.20 a 675.78 ± 3.07 c 641.41 ± 3.26 c 1866.61 ± 20.18c 2.48 ± 0.01 c 5.35 ± 0.03 c 0.93 ± 0.01 f 92.87 ± 1.04 c 1.01 ± 0.01 313.81 ± 4.58 c
PT2 9.00 ± 0.05 b 26.83 ± 0.05 d 17.83 ± 0.10 d 198.17 ± 2.20 b 11.21 ± 0.11 b 429.22 ± 3.13 f 418.01 ± 3.24 f 3729.84 ± 65.15b 3.04 ± 0.01 b 3.48 ± 0.03 f 1.07 ± 0.01 b 86.80 ± 0.53 f 1.02 ± 0.02 186.30 ± 2.42 f
PT3 6.36 ± 0.09 c 24.01 ± 0.05 g 17.66 ± 0.06 e 277.93 ± 4.82 a 5.39 ± 0.16 c 290.22 ± 2.15 i 284.83 ± 2.03 i 5292.78 ± 126.69a 3.32 ± 0.02 a 2.37 ± 0.02 i 1.11 ± 0.03 a 82.87 ± 1.27 i 1.03 ± 0.02 120.27 ± 2.70 h
Two-way ANOVA (p value)Site 0.482 0.000 0.000 0.34 0.405 0.000 0.000 0.360 0.262 0.000 0.000 0.000 0.854 0.000Size 0.000 0.000 0.000 0.000 0.000 0.000 0.000 0.000 0.000 0.000 0.000 0.000 0.378 0.000
Site X Size 0.001 0.000 0.002 0.064 0.656 0.025 0.186 0.482 0.478 0.189 0.027 0.656 0.971 0.098
Note- SGR: Specific growth rate, FCR: Feed conversion ratio; a, b, c used in the table to show significant difference. Different letters indicates significant variation.
Table 4. Growth parameters of Nile Tilapia (Oreochromis niloticus L.) under cage-culture system in Titas River of Bangladesh with different stocking densities in thesecond cycle (July–November).
CageSite
FishSize
MeanInitial Length
(cm)
Mean FinalLength (cm)
Mean LengthGain (cm) % Length Gain
MeanInitial Weight
(gm)
Mean FinalWeight (gm)
Mean WeightGain (gm) % Weight Gain SGR % Day
Average DailyGrowth Rate
(ADGR)FCR Survival Rate
(%)
TheRelative
ConditionFactor
Production(kg/Cage/120 Days)
MojlishpurMT1 11.69 ± 0.07 a 29.84 ± 0.02 a 18.15 ± 0.08 a 155.29 ± 1.60 g 34.39 ± 0.10 a 690.00 ± 1.50 a 655.61 ± 1.49 a 1906.49 ± 6.52 c 2.50 ± 0.00 c 5.46 ± 0.01 a 0.89 ± 0.00 i 96.20 ± 0.23 a 1.01 ± 0.01 331.89 ± 0.35 a
MT2 8.96 ± 0.02 b 24.76 ± 0.06 f 15.80 ± 0.05 i 176.43 ± 0.59 f 11.14 ± 0.06 b 447.56 ± 0.78 d 436.41 ± 0.79 d 3916.19 ± 23.64 b 3.08 ± 0.00 b 3.64 ± 0.01 d 0.98 ± 0.01 f 89.53 ± 0.48 d 1.01 ± 0.01 200.36 ± 1.41 d
MT3 6.34 ± 0.02 c 23.01 ± 0.03 i 16.66 ± 0.04 h 262.62 ± 1.41 c 5.48 ± 0.09 c 297.33 ± 0.51 g 291.86 ± 0.48 g 5331.07 ± 89.07 a 3.33 ± 0.01 a 2.43 ± 0.00 g 1.02 ± 0.01 e 84.67 ± 0.52 g 1.03 ± 0.03 125.87 ± 0.86 g
ShitanagarST1 11.59 ± 0.14 a 29.26 ± 0.17 b 17.67 ± 0.21 c 152.61 ± 3.31 h 34.14 ± 0.44 a 674.33 ± 3.20 b 640.19 ± 3.63 b 1875.85 ± 35.12 c 2.49 ± 0.01 c 5.33 ± 0.03 b 0.92 ± 0.02 h 94.27 ± 0.75 b 1.03 ± 0.02 317.86 ± 4.00 b
ST2 8.93 ± 0.07 b 26.07 ± 0.10 e 17.14 ± 0.16 f 192.02 ± 3.13 e 11.09 ± 0.09 b 434.44 ± 2.19 e 423.36 ± 2.27 e 3818.62 ± 50.32 b 3.06 ± 0.01 b 3.53 ± 0.02 e 1.04 ± 0.01 d 88.20 ± 0.83 e 1.04 ± 0.03 191.59 ± 2.03 e
ST3 6.42 ± 0.05 c 23.38 ± 0.09 h 16.96 ± 0.10 g 264.14 ± 3.00 b 5.39 ± 0.08 c 286.22 ± 3.08 i 280.83 ± 3.08 i 5213.53 ± 94.37 a 3.31 ± 0.01 a 2.34 ± 0.03 c 1.08 ± 0.01 c 83.00 ± 0.83 i 1.04 ± 0.03 118.79 ± 1.94 h
PaikparaPT1 11.55 ± 0.10 a 28.85 ± 0.10 c 17.30 ± 0.16 e 149.82 ± 2.51 i 34.24 ± 0.25 a 673.56 ± 3.04 c 639.31 ± 3.21 c 1867.19 ± 20.87 c 2.48 ± 0.01 c 5.33 ± 0.03 i 0.95 ± 0.01 g 90.73 ± 1.19 c 1.01 ± 0.02 305.61 ± 5.38 c
PT2 8.95 ± 0.02 b 26.87 ± 0.07 d 17.92 ± 0.08 b 200.19 ± 1.18 d 11.17 ± 0.08 b 426.56 ± 2.23 f 415.38 ± 2.23 f 3718.40 ± 33.15 b 3.04 ± 0.01 b 3.46 ± 0.02 f 1.11 ± 0.01 b 83.67 ± 0.35 h 1.01 ± 0.02 178.45 ± 1.61 f
PT3 6.39 ± 0.13 c 24.02 ± 0.09 g 17.63 ± 0.19 d 276.24 ± 8.24 a 5.41 ± 0.14 c 289.44 ± 3.89 h 284.03 ± 3.87 h 5255.31 ± 144.36 a 3.32 ± 0.02 a 2.37 ± 0.03 h 1.13 ± 0.02 a 80.87 ± 1.57 b 1.04 ± 0.03 117.01 ± 2.38 i
Two-way ANOVA (p value)Site 0.901 0.000 0.000 0.006 0.696 0.000 0.000 0.183 0.086 0.000 0.000 0.000 0.38 0.000Size 0.000 0.000 0.000 0.000 0.000 0.000 0.000 0.000 0.000 0.000 0.000 0.000 0.438 0.000
Site X site 0.822 0.000 0.000 0.007 0.984 0.011 0.138 0.745 0.640 0.167 0.161 0.645 0.958 0.039
Note- SGR: Specific growth rate, FCR: Feed conversion ratio; a, b, c used in the table to show significant difference. Different letters indicates significant variation.
Agriculture 2022, 12, 942 11 of 19
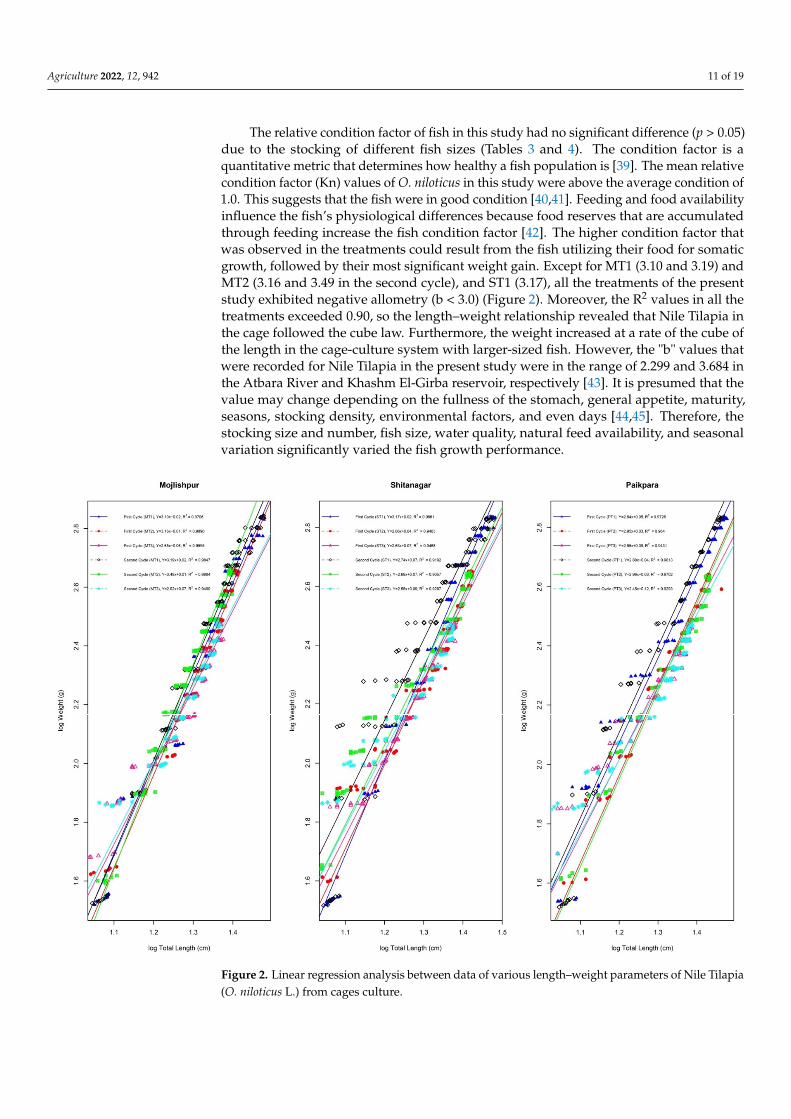
The relative condition factor of fish in this study had no significant difference (p > 0.05)due to the stocking of different fish sizes (Tables 3 and 4). The condition factor is aquantitative metric that determines how healthy a fish population is [39]. The mean relativecondition factor (Kn) values of O. niloticus in this study were above the average condition of1.0. This suggests that the fish were in good condition [40,41]. Feeding and food availabilityinfluence the fish’s physiological differences because food reserves that are accumulatedthrough feeding increase the fish condition factor [42]. The higher condition factor thatwas observed in the treatments could result from the fish utilizing their food for somaticgrowth, followed by their most significant weight gain. Except for MT1 (3.10 and 3.19) andMT2 (3.16 and 3.49 in the second cycle), and ST1 (3.17), all the treatments of the presentstudy exhibited negative allometry (b < 3.0) (Figure 2). Moreover, the R2 values in all thetreatments exceeded 0.90, so the length–weight relationship revealed that Nile Tilapia inthe cage followed the cube law. Furthermore, the weight increased at a rate of the cube ofthe length in the cage-culture system with larger-sized fish. However, the "b" values thatwere recorded for Nile Tilapia in the present study were in the range of 2.299 and 3.684 inthe Atbara River and Khashm El-Girba reservoir, respectively [43]. It is presumed that thevalue may change depending on the fullness of the stomach, general appetite, maturity,seasons, stocking density, environmental factors, and even days [44,45]. Therefore, thestocking size and number, fish size, water quality, natural feed availability, and seasonalvariation significantly varied the fish growth performance.
Agriculture 2022, 12, x FOR PEER REVIEW 13 of 22
Figure 2. Linear regression analysis between data of various length–weight parameters of Nile Tilapia (O. niloticus L.) from cages culture.
Figure 2. Linear regression analysis between data of various length–weight parameters of Nile Tilapia(O. niloticus L.) from cages culture.
Agriculture 2022, 12, 942 12 of 19
3.3. Economic and Business Feasibility Analyses
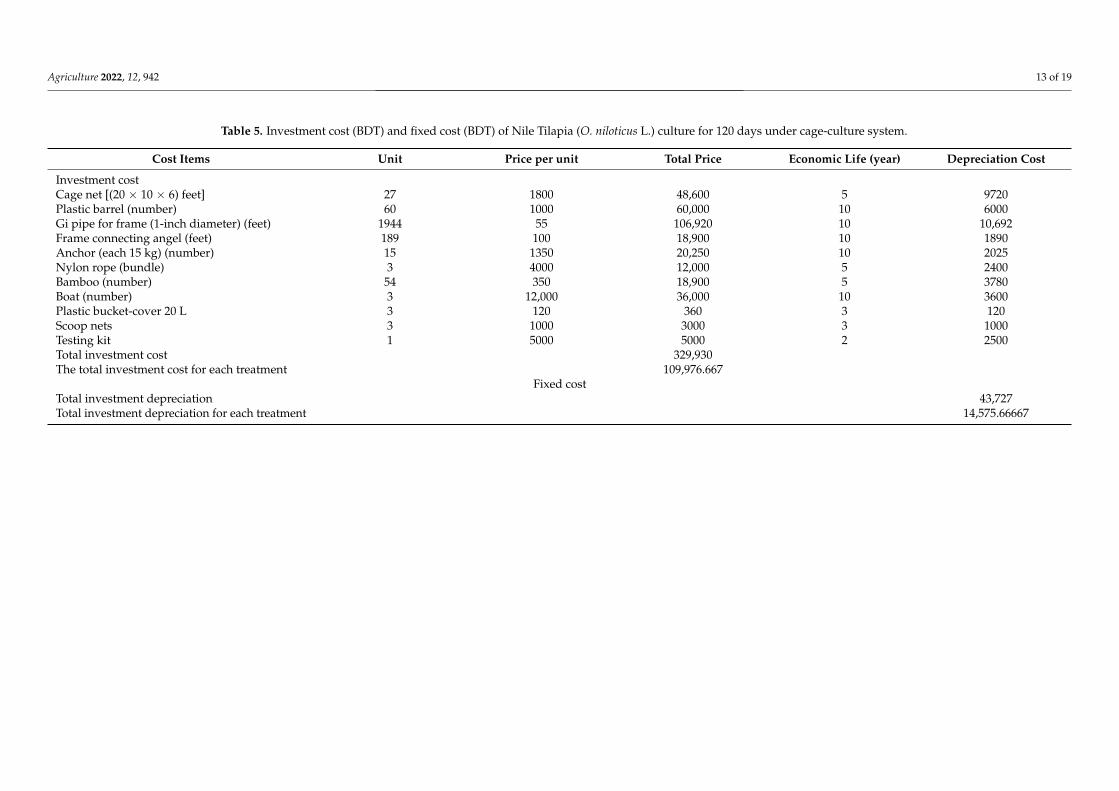
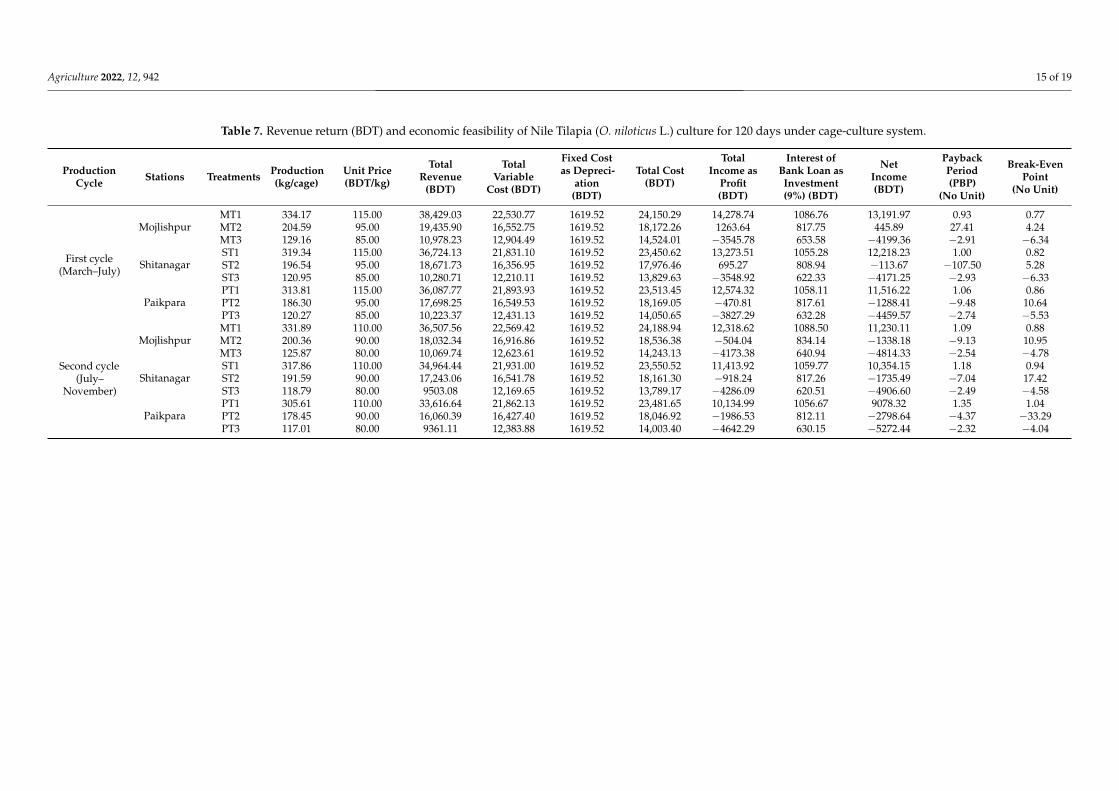
Stocking larger sizes of Nile Tilapia and geographical location influenced productioneconomics in the present study. Total variable cost, total cost, and gross return weresignificantly different among the treatments (Tables 5 and 6). The depreciation cost for eachtreatment was calculated as Bangladeshi Taka (BDT) 1619.52/cage. The net return (profit)in MT1 (BDT 13,191.97); ST1 (BDT 12,218.23); and PT1 (BDT 11,516.22) were significantlyhigher than all other treatments in the first cycle (Table 7). A similar net return (profit)pattern was observed in the second culture cycle. Although MT1, ST1, and PT1 had thehighest total variable cost and total cost, the lowest payback period (PBP) value (lessthan 1) was obtained from MT1 in both production cycles (Table 7), demonstrating thatthe investment capital can be recovered after only one crop yield. After the second cropcollection from the rural culture site (Mojlishpur) along the river, the business will receiveincome. On the other hand, ST1 and PT1 in the remaining cage sites must incur earningsafter two crops. The rest of the treatments yielded negative payback periods, showing theeconomic loss of the culture of Nile Tilapia with small-sized fish stock. The productioneconomics were mainly affected by the cost of feed and fingerlings, irrespective of thestocking densities, and accounted for about 70–80% of the total production cost. Theseprime factors affect profitability in cage farming [35] and the lowest stocking density withlarger-sized fish, probably due to high survival and better growth rates [46].
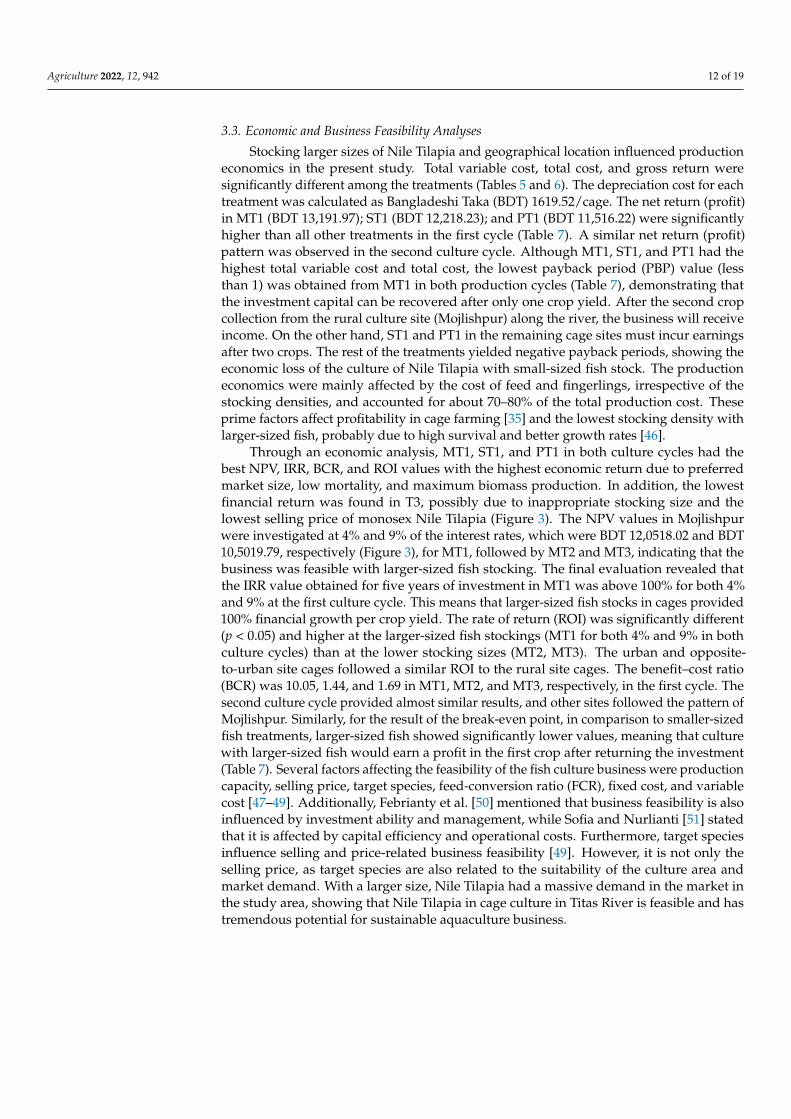
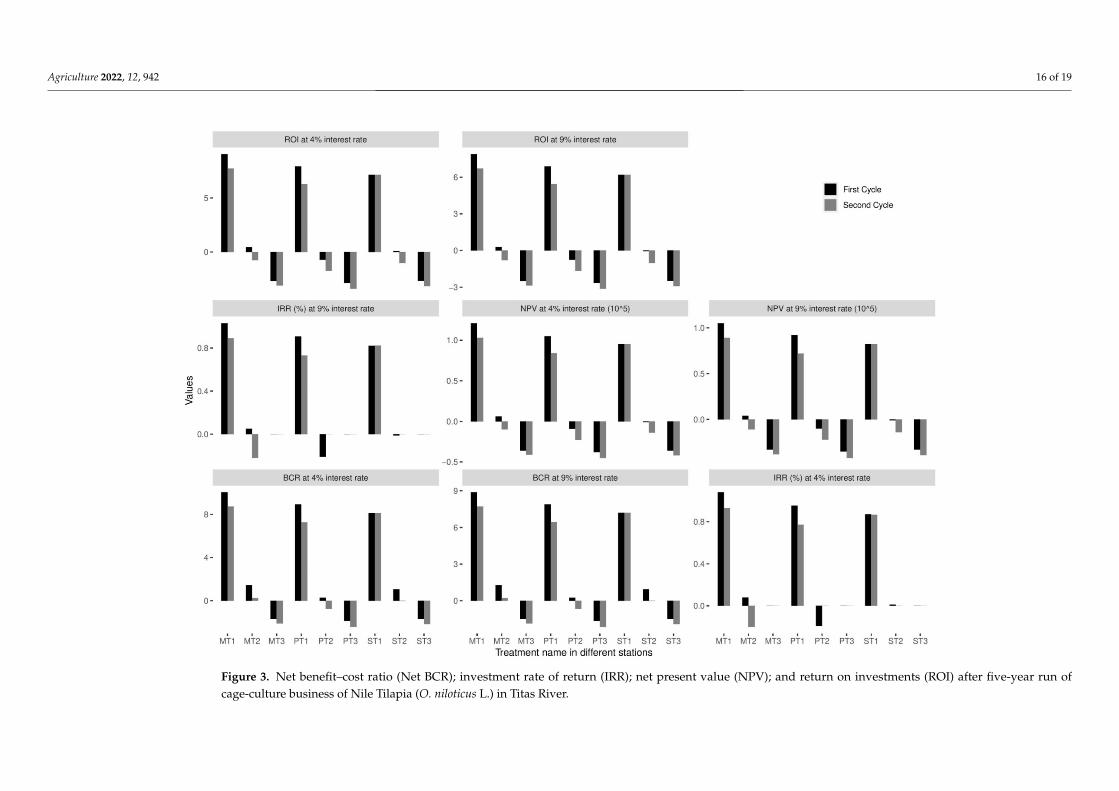
Through an economic analysis, MT1, ST1, and PT1 in both culture cycles had thebest NPV, IRR, BCR, and ROI values with the highest economic return due to preferredmarket size, low mortality, and maximum biomass production. In addition, the lowestfinancial return was found in T3, possibly due to inappropriate stocking size and thelowest selling price of monosex Nile Tilapia (Figure 3). The NPV values in Mojlishpurwere investigated at 4% and 9% of the interest rates, which were BDT 12,0518.02 and BDT10,5019.79, respectively (Figure 3), for MT1, followed by MT2 and MT3, indicating that thebusiness was feasible with larger-sized fish stocking. The final evaluation revealed thatthe IRR value obtained for five years of investment in MT1 was above 100% for both 4%and 9% at the first culture cycle. This means that larger-sized fish stocks in cages provided100% financial growth per crop yield. The rate of return (ROI) was significantly different(p < 0.05) and higher at the larger-sized fish stockings (MT1 for both 4% and 9% in bothculture cycles) than at the lower stocking sizes (MT2, MT3). The urban and opposite-to-urban site cages followed a similar ROI to the rural site cages. The benefit–cost ratio(BCR) was 10.05, 1.44, and 1.69 in MT1, MT2, and MT3, respectively, in the first cycle. Thesecond culture cycle provided almost similar results, and other sites followed the pattern ofMojlishpur. Similarly, for the result of the break-even point, in comparison to smaller-sizedfish treatments, larger-sized fish showed significantly lower values, meaning that culturewith larger-sized fish would earn a profit in the first crop after returning the investment(Table 7). Several factors affecting the feasibility of the fish culture business were productioncapacity, selling price, target species, feed-conversion ratio (FCR), fixed cost, and variablecost [47–49]. Additionally, Febrianty et al. [50] mentioned that business feasibility is alsoinfluenced by investment ability and management, while Sofia and Nurlianti [51] statedthat it is affected by capital efficiency and operational costs. Furthermore, target speciesinfluence selling and price-related business feasibility [49]. However, it is not only theselling price, as target species are also related to the suitability of the culture area andmarket demand. With a larger size, Nile Tilapia had a massive demand in the market inthe study area, showing that Nile Tilapia in cage culture in Titas River is feasible and hastremendous potential for sustainable aquaculture business.
Agriculture 2022, 12, 942 13 of 19
Table 5. Investment cost (BDT) and fixed cost (BDT) of Nile Tilapia (O. niloticus L.) culture for 120 days under cage-culture system.
Cost Items Unit Price per unit Total Price Economic Life (year) Depreciation Cost
Investment costCage net [(20 × 10 × 6) feet] 27 1800 48,600 5 9720Plastic barrel (number) 60 1000 60,000 10 6000Gi pipe for frame (1-inch diameter) (feet) 1944 55 106,920 10 10,692Frame connecting angel (feet) 189 100 18,900 10 1890Anchor (each 15 kg) (number) 15 1350 20,250 10 2025Nylon rope (bundle) 3 4000 12,000 5 2400Bamboo (number) 54 350 18,900 5 3780Boat (number) 3 12,000 36,000 10 3600Plastic bucket-cover 20 L 3 120 360 3 120Scoop nets 3 1000 3000 3 1000Testing kit 1 5000 5000 2 2500Total investment cost 329,930The total investment cost for each treatment 109,976.667
Fixed costTotal investment depreciation 43,727Total investment depreciation for each treatment 14,575.66667
Agriculture 2022, 12, 942 14 of 19
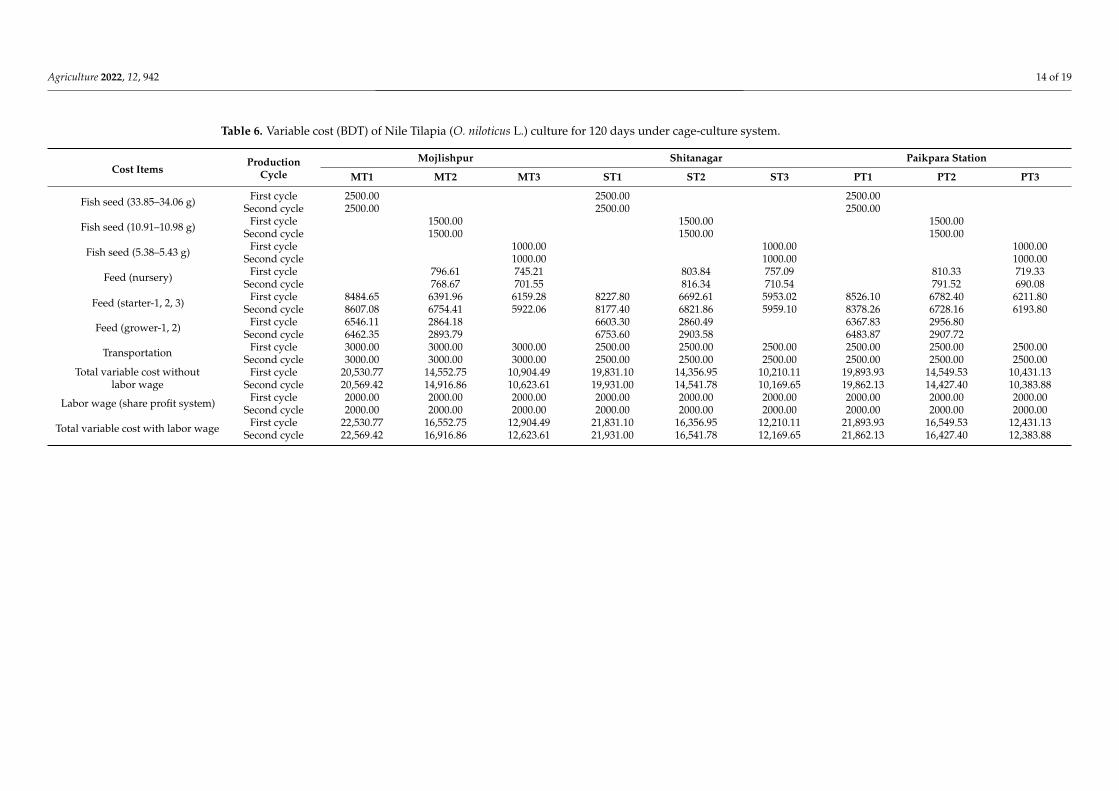
Table 6. Variable cost (BDT) of Nile Tilapia (O. niloticus L.) culture for 120 days under cage-culture system.
Cost ItemsProduction
Cycle
Mojlishpur Shitanagar Paikpara Station
MT1 MT2 MT3 ST1 ST2 ST3 PT1 PT2 PT3
Fish seed (33.85–34.06 g) First cycle 2500.00 2500.00 2500.00Second cycle 2500.00 2500.00 2500.00
Fish seed (10.91–10.98 g) First cycle 1500.00 1500.00 1500.00Second cycle 1500.00 1500.00 1500.00
Fish seed (5.38–5.43 g) First cycle 1000.00 1000.00 1000.00Second cycle 1000.00 1000.00 1000.00
Feed (nursery) First cycle 796.61 745.21 803.84 757.09 810.33 719.33Second cycle 768.67 701.55 816.34 710.54 791.52 690.08
Feed (starter-1, 2, 3) First cycle 8484.65 6391.96 6159.28 8227.80 6692.61 5953.02 8526.10 6782.40 6211.80Second cycle 8607.08 6754.41 5922.06 8177.40 6821.86 5959.10 8378.26 6728.16 6193.80
Feed (grower-1, 2) First cycle 6546.11 2864.18 6603.30 2860.49 6367.83 2956.80Second cycle 6462.35 2893.79 6753.60 2903.58 6483.87 2907.72
Transportation First cycle 3000.00 3000.00 3000.00 2500.00 2500.00 2500.00 2500.00 2500.00 2500.00Second cycle 3000.00 3000.00 3000.00 2500.00 2500.00 2500.00 2500.00 2500.00 2500.00
Total variable cost withoutlabor wage
First cycle 20,530.77 14,552.75 10,904.49 19,831.10 14,356.95 10,210.11 19,893.93 14,549.53 10,431.13Second cycle 20,569.42 14,916.86 10,623.61 19,931.00 14,541.78 10,169.65 19,862.13 14,427.40 10,383.88
Labor wage (share profit system) First cycle 2000.00 2000.00 2000.00 2000.00 2000.00 2000.00 2000.00 2000.00 2000.00Second cycle 2000.00 2000.00 2000.00 2000.00 2000.00 2000.00 2000.00 2000.00 2000.00
Total variable cost with labor wage First cycle 22,530.77 16,552.75 12,904.49 21,831.10 16,356.95 12,210.11 21,893.93 16,549.53 12,431.13Second cycle 22,569.42 16,916.86 12,623.61 21,931.00 16,541.78 12,169.65 21,862.13 16,427.40 12,383.88
Agriculture 2022, 12, 942 15 of 19
Table 7. Revenue return (BDT) and economic feasibility of Nile Tilapia (O. niloticus L.) culture for 120 days under cage-culture system.
ProductionCycle Stations Treatments Production
(kg/cage)Unit Price(BDT/kg)
TotalRevenue
(BDT)
TotalVariable
Cost (BDT)
Fixed Costas Depreci-
ation(BDT)
Total Cost(BDT)
TotalIncome as
Profit(BDT)
Interest ofBank Loan asInvestment(9%) (BDT)
NetIncome(BDT)
PaybackPeriod(PBP)
(No Unit)
Break-EvenPoint
(No Unit)
First cycle(March–July)
MojlishpurMT1 334.17 115.00 38,429.03 22,530.77 1619.52 24,150.29 14,278.74 1086.76 13,191.97 0.93 0.77MT2 204.59 95.00 19,435.90 16,552.75 1619.52 18,172.26 1263.64 817.75 445.89 27.41 4.24MT3 129.16 85.00 10,978.23 12,904.49 1619.52 14,524.01 −3545.78 653.58 −4199.36 −2.91 −6.34
ShitanagarST1 319.34 115.00 36,724.13 21,831.10 1619.52 23,450.62 13,273.51 1055.28 12,218.23 1.00 0.82ST2 196.54 95.00 18,671.73 16,356.95 1619.52 17,976.46 695.27 808.94 −113.67 −107.50 5.28ST3 120.95 85.00 10,280.71 12,210.11 1619.52 13,829.63 −3548.92 622.33 −4171.25 −2.93 −6.33
PaikparaPT1 313.81 115.00 36,087.77 21,893.93 1619.52 23,513.45 12,574.32 1058.11 11,516.22 1.06 0.86PT2 186.30 95.00 17,698.25 16,549.53 1619.52 18,169.05 −470.81 817.61 −1288.41 −9.48 10.64PT3 120.27 85.00 10,223.37 12,431.13 1619.52 14,050.65 −3827.29 632.28 −4459.57 −2.74 −5.53
Second cycle(July–
November)
MojlishpurMT1 331.89 110.00 36,507.56 22,569.42 1619.52 24,188.94 12,318.62 1088.50 11,230.11 1.09 0.88MT2 200.36 90.00 18,032.34 16,916.86 1619.52 18,536.38 −504.04 834.14 −1338.18 −9.13 10.95MT3 125.87 80.00 10,069.74 12,623.61 1619.52 14,243.13 −4173.38 640.94 −4814.33 −2.54 −4.78
ShitanagarST1 317.86 110.00 34,964.44 21,931.00 1619.52 23,550.52 11,413.92 1059.77 10,354.15 1.18 0.94ST2 191.59 90.00 17,243.06 16,541.78 1619.52 18,161.30 −918.24 817.26 −1735.49 −7.04 17.42ST3 118.79 80.00 9503.08 12,169.65 1619.52 13,789.17 −4286.09 620.51 −4906.60 −2.49 −4.58
PaikparaPT1 305.61 110.00 33,616.64 21,862.13 1619.52 23,481.65 10,134.99 1056.67 9078.32 1.35 1.04PT2 178.45 90.00 16,060.39 16,427.40 1619.52 18,046.92 −1986.53 812.11 −2798.64 −4.37 −33.29PT3 117.01 80.00 9361.11 12,383.88 1619.52 14,003.40 −4642.29 630.15 −5272.44 −2.32 −4.04
Agriculture 2022, 12, 942 16 of 19Agriculture 2022, 12, x FOR PEER REVIEW 19 of 22
Figure 3. Net benefit–cost ratio (Net BCR); investment rate of return (IRR); net present value (NPV); and return on investments (ROI) after five-year run of cage-culture business of Nile Tilapia (O. niloticus L.) in Titas River. Figure 3. Net benefit–cost ratio (Net BCR); investment rate of return (IRR); net present value (NPV); and return on investments (ROI) after five-year run ofcage-culture business of Nile Tilapia (O. niloticus L.) in Titas River.
Agriculture 2022, 12, 942 17 of 19
4. Conclusions
The research shows that stocking cages with larger Nile Tilapia produces the optimumgrowth and survival rates. This shows that O. niloticus growth and survival in cages issize dependent. In terms of survival rate, growth, fish output, and economic return, aNile Tilapia stocking size of 34.14–34.71 g is the best of the three treatments. Therefore,these stocking sizes of fish can be suggested to follow in Nile Tilapia cage farming inopen water bodies, in order to increase fish production with a high economic return. Thewater-quality parameters in the farming area on the Titas River are still within permissiblelevels for the growth of O. niloticus in cages. The difficulty of achieving sustainability ofsmall-scale aquaculture, especially cage culture due to climate change effects and shorterperiods of culture, can be minimized, and sustainability significantly adopted by stockinglarger-sized fish.
Author Contributions: Conceptualization, M.S. and M.R.; methodology, M.S. and M.R.; software,M.S. and M.R; validation, M.B.H. and M.S.K.; formal analysis, M.S.K, M.S, M.R. and M.F.T.; investiga-tion, M.R; resources, M.B.H.; data curation, M.F.T.; writing—original draft preparation, M.S., M.R.,M.F.T. and M.S.K.; writing—review and editing, M.B.H. and T.A.; visualization, M.F.A.; supervision,M.S. and M.B.H.; project administration, M.S.; funding acquisition, M.S., M.F.A. and T.A. All authorshave read and agreed to the published version of the manuscript.
Funding: The field work of this research was funded by the Greater Cumilla District FisheriesDevelopment Project, Department of Fisheries, Ministry of Fisheries and Livestock, Bangladesh(Letter No: 33.02.0000.943.09.044.18.501 and 33.02.0000.943.09.044.18.638). This study was alsopartially funded by Universiti Brunei Darussalam under the Faculty/Institute/Center Research Grant(No. UBD/RSCH/1.4/FICBF(b)/2020/029) and (No. UBD/RSCH/1.4/FICBF(b)/2021/037). Thisstudy was also supported by Researchers Supporting Project number (RSP-2022R436), King SaudUniversity, Riyadh, Saudi Arabia.
Institutional Review Board Statement: Not applicable.
Informed Consent Statement: Not applicable.
Data Availability Statement: Data are provided in the article.
Acknowledgments: Special thanks are due to our colleagues Md. Shahidul Hossain for preparingthe experimental setup and Md. Monirul Hossain for preparing the experimental design and thewater quality analysis. The authors would like to extend their sincere appreciation to the ResearchersSupporting Project number (RSP-2022R436), King Saud University, Riyadh, Saudi Arabia. Commentsfrom three reviewers have significantly improved the manuscript.
Conflicts of Interest: The authors declare no conflict of interest.
References1. FAO. The State of World Fisheries and Aquaculture 2020; In brief; FAO: Rome, Italy, 2020.2. DoF. Yearbook of Fisheries Statistics of Bangladesh, 2018–2019; Bangladesh Government Press: Dhaka, Bangladesh, 2020; Volume 37,
p. 135.3. FAO. Cultured Aquatic Species Information Program-Oreochromis niloticus (Linnaeus, 1758); Food and Agriculture Organization of
the United Nations: Rome, Italy, 2013.4. Gupta, M.V.; Acosta, B.O. From drawing board to dining table: The success story of the GIFT project. NAGA WorldFish Cent. Q.
2005, 27, 4–14.5. Chowdhury, M.; Sukhan, Z.; Hannan, M. Climate change and its impact on fisheries resource in Bangladesh. In Proceedings of the
International Conference on Environmental Aspects of Bangladesh (ICEAB10), Kitakyushu, Japan, 4 September 2010; pp. 95–98.6. Mbowa, S.; Odokonyero, T.; Munyaho, A. Harnessing Floating Cage Technology to Increase Fish Production in Uganda. Res. Ser.
2017, 262886, 44.7. Conte, L.; Sonoda, D.Y.; Shirota, R.; Cyrino, J.E.P. Productivity and economics of Nile tilapia Oreochromis niloticus cage culture in
South-East Brazil. J. Appl. Aquac. 2008, 20, 18–37. [CrossRef]8. Beveridge, M.; Dabbadie, L.; Soto, D.; Ross, L.; Bueno, P. Climate Change and Aquaculture: Interactions with Fisheries and Agriculture;
FAO: Rome, Italy, 2018.9. Balkhande, J.V. Cage culture of Oreochromis Mossambicus (Tilapia) in back water of river Godavari, Nanded, Maharashtra India.
MOJ Ecol. Environ. Sci. 2019, 4, 100–105. [CrossRef]
Agriculture 2022, 12, 942 18 of 19
10. Mcginty, A.S.; Rakocy, J.E. Cage Culture of Tilapia. The Fish Site, 1 November 2005.11. El-Sebai, A.; El-Murr, A.E.H.; Galal, A.A.A.; Abd El-Motaal, S.M.A. Effect of ginger dietary supplementation on growth
performance, immune response and vaccine efficacy in Oreochromis niloticus challenged with Aeromonas hydrophila. Slov. Vet. Res.2018, 55, 31–39. [CrossRef]
12. Gibtan, A.; Getahun, A.; Mengistou, S. Effect of stocking density on the growth performance and yield of Nile tilapia [Oreochromisniloticus (L. 1758)] in a cage culture system in Lake Kuriftu, Ethiopia. Aquac. Res. 2008, 39, 1450–1460. [CrossRef]
13. Rojas, A.; Wadsworth, S. A review of cage aquaculture: Latin America and the Caribbean. In Cage Aquaculture: Regional Reviewsand Global Overview; FAO: Rome, Italy, 2007; pp. 77–100.
14. Rahman, M.M.; Islam, M.S.; Halder, G.C.; Tanaka, M. Cage culture of sutchi catfish, Pangasius sutchi (Fowler 1937): Effects ofstocking density on growth, survival, yield and farm profitability. Aquac. Res. 2006, 37, 33–39. [CrossRef]
15. Osofero, S.A.; Otubusin, S.O.; Daramola, J.A. Effect of stocking density on tilapia Oreochromis niloticus Linnaeus 1757 growth andsurvival in bamboo—Net cages trial. Afr. J. Biotechnol. 2009, 8, 1322–1325. [CrossRef]
16. Phan, L.T.; Bui, T.M.; Nguyen, T.T.T.; Gooley, G.J.; Ingram, B.A.; Nguyen, H.V.; Nguyen, P.T.; De Silva, S.S. Current statusof farming practices of striped catfish, Pangasianodon hypophthalmus in the Mekong Delta, Vietnam. Aquaculture 2009, 296,227–236. [CrossRef]
17. Pechsiri, J.; Yakupitiyage, A. A comparative study of growth and feed utilization efficiency of sex-reversed diploid and triploidNile tilapia, Oreochromis niloticus L. Aquac. Res. 2005, 36, 45–51. [CrossRef]
18. Cren, E.D. Le The Length-Weight Relationship and Seasonal Cycle in Gonad Weight and Condition in the Perch (Perca fluviatilis).J. Anim. Ecol. 1951, 20, 201. [CrossRef]
19. Karnatak, G.; Das, B.K.; Mishal, P.; Tayung, T.; Kumari, S.; Sarkar, U.K.; Das, A.K.; Ali, Y. Impact of stocking density on growth,feed utilization and survival of cage reared minor carp, Labeo bata (Hamilton, 1822) in Maithon reservoir, India. Aquaculture 2021,532, 736078. [CrossRef]
20. Froese, R. Cube law, condition factor and weight-length relationships: History, meta-analysis and recommendations. J. Appl.Ichthyol. 2006, 22, 241–253. [CrossRef]
21. Asaduzzaman, M.; Wahab, M.A.; Verdegem, M.C.J.; Adhikary, R.K.; Rahman, S.M.S.; Azim, M.E.; Verreth, J.A.J. Effects ofcarbohydrate source for maintaining a high C:N ratio and fish driven re-suspension on pond ecology and production inperiphyton-based freshwater prawn culture systems. Aquaculture 2010, 301, 37–46. [CrossRef]
22. Izmaniar, H.; Mahyudin, I.; Agusliani, E.; Ahmadi, A. The Business Prospect of Climbing Perch Fish Farming with BioflocTechnology at De’ Papuyu Farm Banjarbaru. Int. J. Environ. Agric. Biotechnol. 2018, 3, 1145–1153. [CrossRef]
23. Hartley, H.O. Smallest Composite Designs for Quadratic Response Surfaces. Biometrics 1959, 15, 611. [CrossRef]24. Devi, P.; Padmavathy, P.; Srinivasan, A.; Jawahar, P. Environmental Impact of Cage Culture on Poondi Reservoir, Tamil Nadu.
Curr. World Environ. 2015, 10, 1048–1054. [CrossRef]25. Lianthuamluaia, L.; Mishal, P.; Panda, D.; Sarkar, U.K.; Kumar, V.; Sandhya, K.M.; Karnatak, G.; Kumari, S.; Bera, A.K.; Das, S.;
et al. Understanding spatial and temporal patterns of fish diversity and assemblage structure vis-a-vis environmental parametersin a tropical Indian reservoir. Environ. Sci. Pollut. Res. 2019, 26, 9089–9098. [CrossRef]
26. Gatica, E.A.; Almeida, C.A.; Mallea, M.A.; Del Corigliano, M.C.; González, P. Water quality assessment, by statistical analysis, onrural and urban areas of Chocancharava River (Río Cuarto), Córdoba, Argentina. Environ. Monit. Assess. 2012, 184, 7257–7274.[CrossRef]
27. Kashindye, B.B.; Nsinda, P.; Kayanda, R.; Ngupula, G.W.; Mashafi, C.A.; Ezekiel, C.N. Environmental impacts of cage culture inLake Victoria: The case of Shirati Bay-Sota, Tanzania. SpringerPlus 2015, 4, 475. [CrossRef]
28. Neto, R.M.; Nocko, H.R.; Ostrensky, A. Environmental characterization and impacts of fish farming in the cascade reservoirs ofthe Paranapanema River, Brazil. Aquac. Environ. Interact. 2015, 6, 255–272. [CrossRef]
29. Sarkar, U.K.; Sandhya, K.M.; Mishal, P.; Karnatak, G.; Lianthuamluaia, L.; Kumari, S.; Panikkar, P.; Palaniswamy, R.; Karthikeyan,M.; Mol, S.S.; et al. Status, Prospects, Threats, and the Way Forward for Sustainable Management and Enhancement of theTropical Indian Reservoir Fisheries: An Overview. Rev. Fish. Sci. Aquac. 2018, 26, 155–175. [CrossRef]
30. Wilson, R.P.; Corraze, G.; Kaushik, S. Nutrition and feeding of fish. Aquaculture 2007, 267, 1–2. [CrossRef]31. Ahmed, T.; Jahedul Hasan, S.; Robiul Awal Hossain, M.; Haidar, I.; Shafiqul Alam Rubel, A.; Hasan Pramanik, M. Assessment
on Impact of Dietary Probiotic Supplementation on Growth Indices of Mono-Sex Tilapia (Oreochromis niloticus) Cage Culture atDakatia River, Chandpur, Bangladesh. World J. Fish Mar. Sci. 2014, 6, 441–446. [CrossRef]
32. Asase, A.; Ewusie Nunoo, F.K.; Klenam Attipoe, F.Y. Lake-Based Nursery Rearing of Nile Tilapia (Oreochromis niloticus) Fingerlingsin Nylon Hapas: Effects of Stocking Density on Growth, Survival and Profitability. Agric. Sci. 2016, 07, 660–669. [CrossRef]
33. Ridha, M.T. Comparative study of growth performance of three strains of Nile tilapia, Oreochromis niloticus, L. at two stockingdensities. Aquac. Res. 2006, 37, 172–179. [CrossRef]
34. Kunda, M.; Pandit, D.; Harun-Al-Rashid, A. Optimization of stocking density for mono-sex Nile tilapia (Oreochromis niloticus)production in riverine cage culture in Bangladesh. Heliyon 2021, 7, E08334. [CrossRef]
35. Moniruzzaman, M. Effects of Stocking Density on Growth, Body Composition, Yield and Economic Returns of Monosex Tilapia(Oreochromis niloticus L.) under Cage Culture System in Kaptai Lake of Bangladesh. J. Aquac. Res. Dev. 2015, 6, 8. [CrossRef]
Agriculture 2022, 12, 942 19 of 19
36. Ouattara, N. Aquaculture Potential of the Black-Chinned Tilapia, Sarotherodon Melanotheron (Cichlidae). Comparative Study of the Effectof Stocking Density on Growth Performance of Landlocked and Natural Populations under Cage Culture Conditions in Lake Ayame (Coted’Ivoire); Blackwell Publishing Ltd.: Hoboken, NJ, USA, 2003.
37. Liti, D.M.; Fulanda, B.; Munguti, J.M.; Straif, M.; Waidbacher, H.; Winkler, G. Effects of open-pond density and caged biomass ofNile Tilapia (Oreochromis niloticus L.) on growth, feed utilization, economic returns and water quality in fertilized ponds. Aquac.Res. 2005, 36, 1535–1543. [CrossRef]
38. Bolivar, R.; Jimenez, E.T.; Sugue, J.R.A.; Brown, C.L. Effect of stocking sizes on the yield and survival of Nile tilapia (Oreochromisniloticus L.) on-grown in ponds. In Proceedings of the 6th International Symposium on Tilapia in Aquaculture, Manila, Philippines,12–16 September 2004; pp. 574–583.
39. Chambel, J.; Severiano, V.; Baptista, T.; Mendes, S.; Pedrosa, R. Effect of stocking density and different diets on growth of PerculaClownfish, Amphiprion percula (Lacepede, 1802). SpringerPlus 2015, 4, 183. [CrossRef]
40. Ayoade, A.A. Length-weight relationship and diet of African carp labeo ogunensis (boulenger, 1910) in asejire lake southwesternNigeria. J. Fish. Aquat. Sci. 2011, 6, 472–478. [CrossRef]
41. Yosuva, M.; Jeyapragash, D.; Manigandan, V.; Machendiranathan, M.; Saravanakumar, A. Length-weight relationship and relativecondition factor of yellowfin tuna (Thunnus albacares) from Parangipettai coast, southeast coast of India. Zool. Ecol. 2018, 28,94–99. [CrossRef]
42. Anani, F.; Ofori-Danson, P.; Abban, E. Pen Culture of the Black-Chinned Tilapia, Sarotherodon Melanotheron in the Aglor Lagoon inGhana. J. Ghana Sci. Assoc. 2010, 12. [CrossRef]
43. Ahmed, E.O.; Ali, M.E.; Aziz, A.A. Length-Weight Relationships and Condition Factors of Six Fish Species in Atbara River andKhashm El-Girba Reservoir, Sudan. Int. J. Agric. Sci. 2011, 3, 65–70. [CrossRef]
44. De Giosa, M.; Czerniejewski, P.; Rybczyk, A. Seasonal Changes in Condition Factor and Weight-Length Relationship of InvasiveCarassius gibelio (Bloch, 1782) from Leszczynskie Lakeland, Poland. Adv. Zool. 2014, 2014, 678763. [CrossRef]
45. Datta, S.N.; Kaur, V.I.; Dhawan, A.; Jassal, G. Estimation of length-weight relationship and condition factor of spotted snakeheadChanna punctata (Bloch) under different feeding regimes. SpringerPlus 2013, 2, 436. [CrossRef]
46. Mensah, E.T.D.; Dankwa, H.R.; Torben, L.L.; Asmah, R.; Campion, B.B.; Edziyie, R. Effects of seasonal and environmental changeson aquaculture production in tropical Lake Volta, Ghana. Aquac. Int. 2018, 26, 1387–1400. [CrossRef]
47. Arikan, M.; Aral, Y. Economic analysis of aquaculture enterprises and determination of factors affecting sustainability of thesector in Turkey. Ank. Üniversitesi Vet. Fakültesi Derg. 2019, 66, 59–66.
48. Mohsin, A.B.M.; Islam, M.N.; Hossain, M.A.; Galib, S.M. Cost-Benefit Analyses of Carp Polyculture in Ponds: A Survey Study inRajshahi and Natore Districts of Bangladesh. Bangladesh J. Environ. Sci. 2012, 23, 103–107.
49. Jia, B.; St-Hilaire, S.; Singh, K.; Gardner, I.A. Farm-level returns and costs of yellow catfish (Pelteobagrus fulvidraco) aquaculture inGuangdong and Zhejiang provinces, China. Aquac. Rep. 2016, 4, 48–56. [CrossRef]
50. Febrianty, I.; Mahreda, E.S.; Bachri, A. Fatmawati the Economies of Scale of Catfish Pond Culture in Banjar Regency, SouthKalimantan. J. Biodivers. Environ. Sci. 2018, 13, 101–108.
51. Sofia, L.A.; Nurlianti, S. The economic value of the resource utilization of wetlands: Comparative study of beje fisheries in NorthHulu, Sungai Regency, South Kalimantan, Indonesia. AACL Bioflux. 2019, 12, 143–150.
Related Documents