Eur J Plant Pathol (2010) 126:293–303 DOI 10.1007/s10658-009-9546-8 Effects of sowing date on severity of blight caused by Ascochyta rabiei and yield components of five chickpea cultivars grown under two climatic conditions in Tunisia Lobna Ben Mohamed · Mohamed Cherif · Moncef Harrabi · Rex F. Galbraith · Richard N. Strange Received: 7 May 2009 / Accepted: 1 October 2009 / Published online: 22 October 2009 © KNPV 2009 Abstract Five chickpea cultivars, Chitoui, Neyer, Kasseb, Beja 1 and Bouchra, were planted on three sowing dates at two Experimental Stations in Tunisia: Bou Salem in the north and the more Electronic supplementary material The online version of this article (doi:10.1007/s10658-009-9546-8) contains supplementary material, which is available to authorized users. L. Ben Mohamed (B ) Département de production et protection végétale, Institut Supérieur d’Enseignement Technologiques de Rosso (ISET), Rosso, Mauritanie e-mail: [email protected] M. Cherif Laboratoire de Phytopathologie, Institut National Agronomique de Tunisie, 43 Avenue Charles Nicolle, Mahragéne, 1082 Tunis, Tunisia M. Harrabi Laboratoire de Génétique de la Résistance aux Maladies, Institut National Agronomique de Tunisie, 43 Avenue Charles Nicolle, Mahragéne, 1082 Tunis, Tunisia R. F. Galbraith Department of Statistical Science, University College London, Gower Street, London WC1E 6BT, UK e-mail: [email protected] R. N. Strange School of Biological and Chemical Sciences, Birkbeck College, University of London, Malet Street, London WC1E 7HX, UK southerly Mornag, where the climate is drier. Severity of blight, caused by Ascochyta rabiei, was measured on a 1–9 scale (defined) on vegetative parts and on pods as percent infected and per- cent infected that were empty. At both locations, disease was essentially absent on plants sown on the third dates but present on plants sown on the two earlier dates. At Bou Salem, disease severity was highest for the second sowing date whereas at Mornag it was highest for the first sowing date; but for each sowing date, disease severity was lower at Mornag than at Bou Salem. Yield components were measured as number of pods per plant, number of seeds per plant, number of seeds per 100 pods, 100 seed weight and weight of seeds per plant. Both disease severity and yield differed significantly among sowing dates (differ- ently at each location) and also among cultivars for each sowing date, these differences depending both on sowing date and location. A lower yield was always associated with a higher disease sever- ity, although the quantitative relationship differed between cultivars and locations. Cultivar Beja 1 had the lowest vegetative disease scores at both locations and both sowing dates 1 and 2. Beja 1 also scored well for all yield components. Plants sown on the third (latest) date gave the highest yields for all cultivars at both locations (except for an unusually high yield of Neyer at Mornag on sowing date 2), in some instances being more than double those from the earlier sowing dates.

Welcome message from author
This document is posted to help you gain knowledge. Please leave a comment to let me know what you think about it! Share it to your friends and learn new things together.
Transcript
Eur J Plant Pathol (2010) 126:293–303DOI 10.1007/s10658-009-9546-8
Effects of sowing date on severity of blight causedby Ascochyta rabiei and yield components of five chickpeacultivars grown under two climatic conditions in Tunisia
Lobna Ben Mohamed · Mohamed Cherif ·Moncef Harrabi · Rex F. Galbraith ·Richard N. Strange
Received: 7 May 2009 / Accepted: 1 October 2009 / Published online: 22 October 2009© KNPV 2009
Abstract Five chickpea cultivars, Chitoui, Neyer,Kasseb, Beja 1 and Bouchra, were planted onthree sowing dates at two Experimental Stationsin Tunisia: Bou Salem in the north and the more
Electronic supplementary material The online versionof this article (doi:10.1007/s10658-009-9546-8) containssupplementary material, which is available toauthorized users.
L. Ben Mohamed (B)Département de production et protection végétale,Institut Supérieur d’Enseignement Technologiques deRosso (ISET), Rosso, Mauritaniee-mail: [email protected]
M. CherifLaboratoire de Phytopathologie, Institut NationalAgronomique de Tunisie, 43 Avenue Charles Nicolle,Mahragéne, 1082 Tunis, Tunisia
M. HarrabiLaboratoire de Génétique de la Résistance auxMaladies, Institut National Agronomique de Tunisie,43 Avenue Charles Nicolle, Mahragéne,1082 Tunis, Tunisia
R. F. GalbraithDepartment of Statistical Science, University CollegeLondon, Gower Street, London WC1E 6BT, UKe-mail: [email protected]
R. N. StrangeSchool of Biological and Chemical Sciences,Birkbeck College, University of London,Malet Street, London WC1E 7HX, UK
southerly Mornag, where the climate is drier.Severity of blight, caused by Ascochyta rabiei, wasmeasured on a 1–9 scale (defined) on vegetativeparts and on pods as percent infected and per-cent infected that were empty. At both locations,disease was essentially absent on plants sown onthe third dates but present on plants sown on thetwo earlier dates. At Bou Salem, disease severitywas highest for the second sowing date whereasat Mornag it was highest for the first sowingdate; but for each sowing date, disease severitywas lower at Mornag than at Bou Salem. Yieldcomponents were measured as number of podsper plant, number of seeds per plant, number ofseeds per 100 pods, 100 seed weight and weightof seeds per plant. Both disease severity and yielddiffered significantly among sowing dates (differ-ently at each location) and also among cultivarsfor each sowing date, these differences dependingboth on sowing date and location. A lower yieldwas always associated with a higher disease sever-ity, although the quantitative relationship differedbetween cultivars and locations. Cultivar Beja 1had the lowest vegetative disease scores at bothlocations and both sowing dates 1 and 2. Beja 1also scored well for all yield components. Plantssown on the third (latest) date gave the highestyields for all cultivars at both locations (exceptfor an unusually high yield of Neyer at Mornagon sowing date 2), in some instances being morethan double those from the earlier sowing dates.
294 Eur J Plant Pathol (2010) 126:293–303
Thus, in contrast to other studies, late sowing didnot result in yield loss.
Keywords Field trial · Cicer arietinum ·Infected pods · Seeds per plant · 100 seed weight
Introduction
The fungus, Ascochyta rabiei, is the causal agent ofchickpea blight and is the major biotic constraintlimiting chickpea production in the Mediter-ranean region and most other parts of the worldwhere chickpea is grown, such as west and centralAsia, North Africa, Australia and North America(Nene 1982). Severe attacks may result in totalloss of the crop (Reddy and Singh 1990; Singhet al. 1981; Singh and Reddy 1990; Solh et al.1994) and, in some years, the disease has even af-fected international trade (Dusunceli et al. 2007b).Pande et al. (2005) recently reviewed the biologyand management options of Ascochyta blight ofchickpea.
Spread of the disease is favoured by cool andwet weather such as occurs in winter in theMediterranean region. Here, in order to avoidthe disease, some farmers sow chickpea as late asearly March or even April but yields may then belimited by the onset of hot and dry weather be-fore maturity (Dusunceli et al. 2007a). In contrast,providing that blight is controlled, yields of wintersowings may be double those of spring sowings(Singh and Reddy 1990).
In Tunisia, chickpea is the second most im-portant grain legume crop after beans, occupy-ing about 33,400 ha. Annual production duringthe last decade has been nearly 17,800 tonnes,the yield fluctuating generally between 500 and800 kg ha−1. This variation has been attributedto variation in the severity of attacks by A. rabiei.Djerbi et al. (1979) estimated that, under con-ditions of moderate disease severity, yield losseswere about 40%. Although in the semi-arid re-gions of Tunisia, yields of autumn or winter sownchickpeas were greater than chickpeas sown inthe spring (Bouslama et al. 1988), optimal sowingdates which would allow stable yields and minimalAscochyta blight remain to be established, par-ticularly in northern areas where the wetter and
cooler climate favours the disease. One aim ofthe current work was therefore to determine theeffect of using earlier sowing dates on the severityof Ascochyta blight and yield components of fivechickpea cultivars grown under wet and semi-aridconditions in Tunisia.
Materials and methods
Experimental stations
Two field trials were conducted, one at Bou SalemExperimental Station (latitude 36◦36′N, longitude88◦8′E, altitude 143 m) which is located in thewetter northern part of Tunisia 128 km north westof Tunis in the valley of the Medjerda river andabout 80 km from the Mediterranean Sea, and theother at Mornag Experimental Station (latitude32◦7′N, longitude 10◦14′E, altitude 33 m) whichis located 16 km South East of Tunis and about16 km from the Mediterranean Sea, and has asemi-arid climate. Five chickpea cultivars weresown manually according to a split-split plot de-sign with three replications. Each of three blocksof land was divided into three main plots withone sowing date allocated to each, and each mainplot was divided into five sub-plots with one cul-tivar allocated to each, giving three replicates ofthe 15 sowing date×cultivar combinations at eachlocation.
The cultivars (Chitoui, Kasseb, Bouchra, Beja 1and Neyer) were kindly provided by Dr MohamedKharrat of the Grain Legume Laboratory, Insti-tut National de la Recherche Agronomique deTunisie (INRAT). They were all thought to be re-sistant to disease, although not equally so: Kharratand Halila (2006) classified Chitoui and Kassebto be less resistant than Bouchra, and Beja 1 andNeyer to be more resistant.
Sowing dates at Bou Salem were 8th December2001, 3rd January 2002 and 5th February 2002 andat Mornag 5th December 2001, 24th January 2002and 9th March 2002. Farmers in Tunisia often sowchickpea as late as March to avoid disease. Weused earlier sowing dates, with higher likelihoodof disease, partly to study how yield might beaffected and partly to compare the cultivars un-
Eur J Plant Pathol (2010) 126:293–303 295
der higher disease pressure and different climaticconditions.
Individual plots were 2 m ×1.5 m and containedfour rows spaced 50 cm apart with a sowing den-sity of 10 seeds per linear meter, giving a totalof 80 seeds per plot (20 plants per m2). Farmersnormally sow 20–25 plants per m2. The susceptiblecultivar Amdoun1 was sown as a border croparound each plot (width 1.5 m). Inoculum wasprovided by infected chickpea seeds, prepared inthe laboratory according to the method of Alamet al. (1987) and distributed immediately aftereach sowing (50 g/row). At Bou Salem, plantsfrom sowing dates 1 and 2 were harvested on 14thJune and those from sowing date 3 on 1st July. AtMornag plants from sowing dates 1 and 2 wereharvested on 16th June and those from sowingdate 3 on 5th July.
Weather conditions
Temperature, relative humidity (RH) and rainfallwere monitored in November 2001 and through-out the experiment. For Bou Salem, tempera-ture and RH data were provided by the NationalInstitute of Meteorology of Tunis, while the localrainfall was measured at the Jenjouba weather sta-tion, about 20 km from the experimental station.At Mornag, the climatic data were measured atthe INAT weather station on the same location asthe field trial.
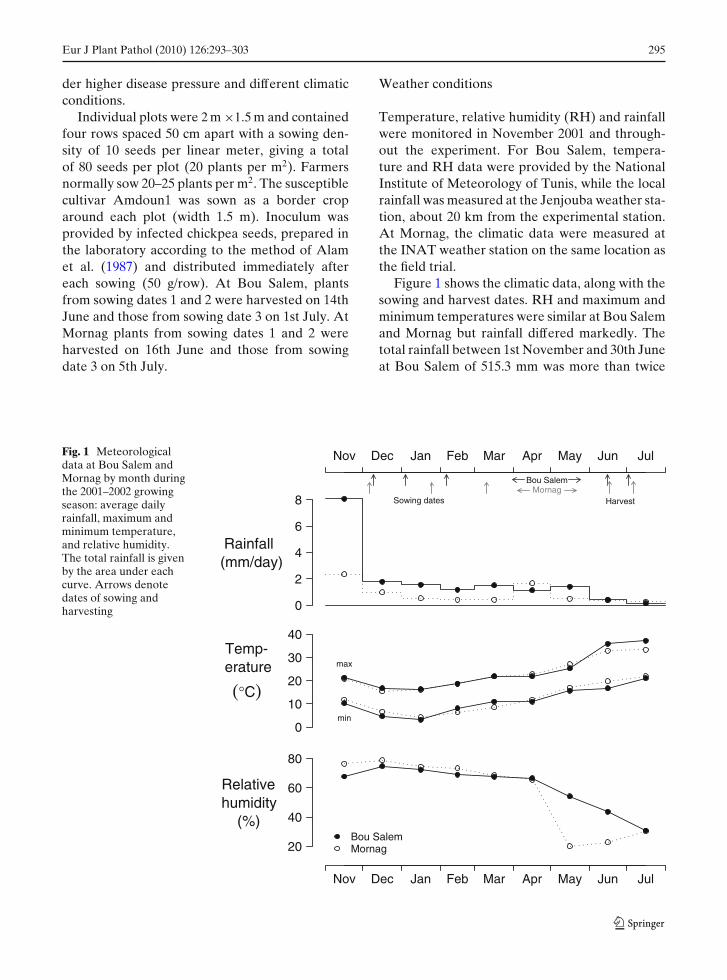
Figure 1 shows the climatic data, along with thesowing and harvest dates. RH and maximum andminimum temperatures were similar at Bou Salemand Mornag but rainfall differed markedly. Thetotal rainfall between 1st November and 30th Juneat Bou Salem of 515.3 mm was more than twice
Fig. 1 Meteorologicaldata at Bou Salem andMornag by month duringthe 2001–2002 growingseason: average dailyrainfall, maximum andminimum temperature,and relative humidity.The total rainfall is givenby the area under eachcurve. Arrows denotedates of sowing andharvesting 0
2
4
6
8
Rainfall(mm/day)
Nov Dec Jan Feb Mar Apr May Jun Jul
Bou Salem
Sowing dates Harvest
0
10
20
30
40
max
min
Temp-erature
(°C)
20
40
60
80
Nov Dec Jan Feb Mar Apr May Jun Jul
Relativehumidity
(%)Bou SalemMornag
296 Eur J Plant Pathol (2010) 126:293–303
that at Mornag, 220.6 mm. However, nearly half ofthe rainfall at Bou Salem fell in November, beforethe first sowing date, but even if this month isdisregarded, the rainfall for the remaining monthsat Bou Salem, 273.3 mm, was still almost twice thatof the same period at Mornag, 149.6 mm.
Disease evaluation
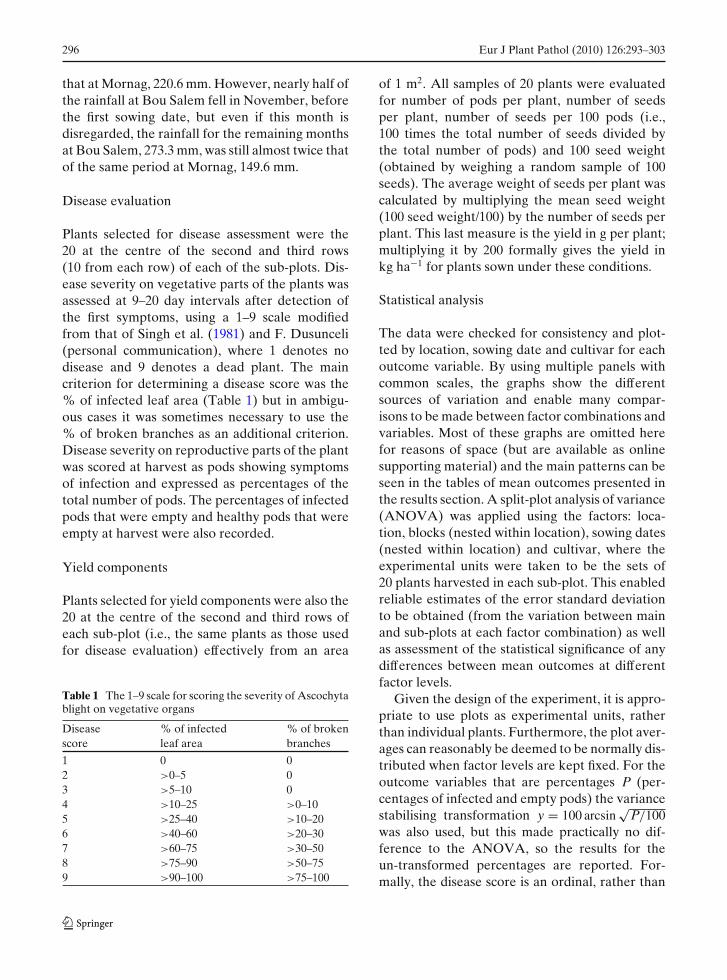
Plants selected for disease assessment were the20 at the centre of the second and third rows(10 from each row) of each of the sub-plots. Dis-ease severity on vegetative parts of the plants wasassessed at 9–20 day intervals after detection ofthe first symptoms, using a 1–9 scale modifiedfrom that of Singh et al. (1981) and F. Dusunceli(personal communication), where 1 denotes nodisease and 9 denotes a dead plant. The maincriterion for determining a disease score was the% of infected leaf area (Table 1) but in ambigu-ous cases it was sometimes necessary to use the% of broken branches as an additional criterion.Disease severity on reproductive parts of the plantwas scored at harvest as pods showing symptomsof infection and expressed as percentages of thetotal number of pods. The percentages of infectedpods that were empty and healthy pods that wereempty at harvest were also recorded.
Yield components
Plants selected for yield components were also the20 at the centre of the second and third rows ofeach sub-plot (i.e., the same plants as those usedfor disease evaluation) effectively from an area
Table 1 The 1–9 scale for scoring the severity of Ascochytablight on vegetative organs
Disease % of infected % of brokenscore leaf area branches
1 0 02 >0–5 03 >5–10 04 >10–25 >0–105 >25–40 >10–206 >40–60 >20–307 >60–75 >30–508 >75–90 >50–759 >90–100 >75–100
of 1 m2. All samples of 20 plants were evaluatedfor number of pods per plant, number of seedsper plant, number of seeds per 100 pods (i.e.,100 times the total number of seeds divided bythe total number of pods) and 100 seed weight(obtained by weighing a random sample of 100seeds). The average weight of seeds per plant wascalculated by multiplying the mean seed weight(100 seed weight/100) by the number of seeds perplant. This last measure is the yield in g per plant;multiplying it by 200 formally gives the yield inkg ha−1 for plants sown under these conditions.
Statistical analysis
The data were checked for consistency and plot-ted by location, sowing date and cultivar for eachoutcome variable. By using multiple panels withcommon scales, the graphs show the differentsources of variation and enable many compar-isons to be made between factor combinations andvariables. Most of these graphs are omitted herefor reasons of space (but are available as onlinesupporting material) and the main patterns can beseen in the tables of mean outcomes presented inthe results section. A split-plot analysis of variance(ANOVA) was applied using the factors: loca-tion, blocks (nested within location), sowing dates(nested within location) and cultivar, where theexperimental units were taken to be the sets of20 plants harvested in each sub-plot. This enabledreliable estimates of the error standard deviationto be obtained (from the variation between mainand sub-plots at each factor combination) as wellas assessment of the statistical significance of anydifferences between mean outcomes at differentfactor levels.
Given the design of the experiment, it is appro-priate to use plots as experimental units, ratherthan individual plants. Furthermore, the plot aver-ages can reasonably be deemed to be normally dis-tributed when factor levels are kept fixed. For theoutcome variables that are percentages P (per-centages of infected and empty pods) the variancestabilising transformation y = 100 arcsin
√P/100
was also used, but this made practically no dif-ference to the ANOVA, so the results for theun-transformed percentages are reported. For-mally, the disease score is an ordinal, rather than
Eur J Plant Pathol (2010) 126:293–303 297
quantitative, variable. However, inspection of thefrequency distributions of scores for each sub-plot and factor level (i.e., the contingency table)showed that (a) the distributions are homoge-neous between the three sub-plots at each factorlevel and (b) that the mean disease score is botha sensible and useful summary measure (TableESM–1). We therefore report the ANOVA of themean disease score also.
Because the actual sowing dates differed ateach location, and the climates also differed,the factor sowing date was treated as beingnested within locations. Standard diagnostic plotswere made to confirm the appropriateness of theanalysis.
Results
Disease severity
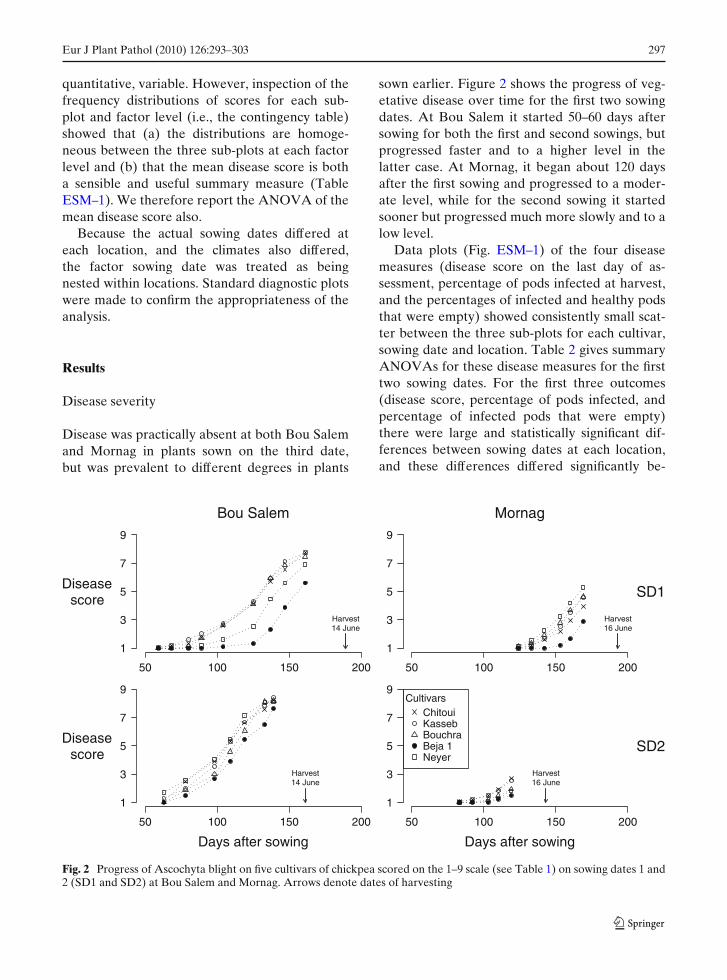
Disease was practically absent at both Bou Salemand Mornag in plants sown on the third date,but was prevalent to different degrees in plants
sown earlier. Figure 2 shows the progress of veg-etative disease over time for the first two sowingdates. At Bou Salem it started 50–60 days aftersowing for both the first and second sowings, butprogressed faster and to a higher level in thelatter case. At Mornag, it began about 120 daysafter the first sowing and progressed to a moder-ate level, while for the second sowing it startedsooner but progressed much more slowly and to alow level.
Data plots (Fig. ESM–1) of the four diseasemeasures (disease score on the last day of as-sessment, percentage of pods infected at harvest,and the percentages of infected and healthy podsthat were empty) showed consistently small scat-ter between the three sub-plots for each cultivar,sowing date and location. Table 2 gives summaryANOVAs for these disease measures for the firsttwo sowing dates. For the first three outcomes(disease score, percentage of pods infected, andpercentage of infected pods that were empty)there were large and statistically significant dif-ferences between sowing dates at each location,and these differences differed significantly be-
50 100 150 200
1
3
5
7
9
Disease score
Bou Salem
Harvest14 June
50 100 150 200
1
3
5
7
9
SD1
Mornag
Harvest16 June
50 100 150 200
1
3
5
7
9
Disease score
Days after sowing
Harvest14 June
50 100 150 200
1
3
5
7
9
Days after sowing
SD2
Harvest16 June
Cultivars ChitouiKassebBouchraBeja 1Neyer
Fig. 2 Progress of Ascochyta blight on five cultivars of chickpea scored on the 1–9 scale (see Table 1) on sowing dates 1 and2 (SD1 and SD2) at Bou Salem and Mornag. Arrows denote dates of harvesting
298 Eur J Plant Pathol (2010) 126:293–303
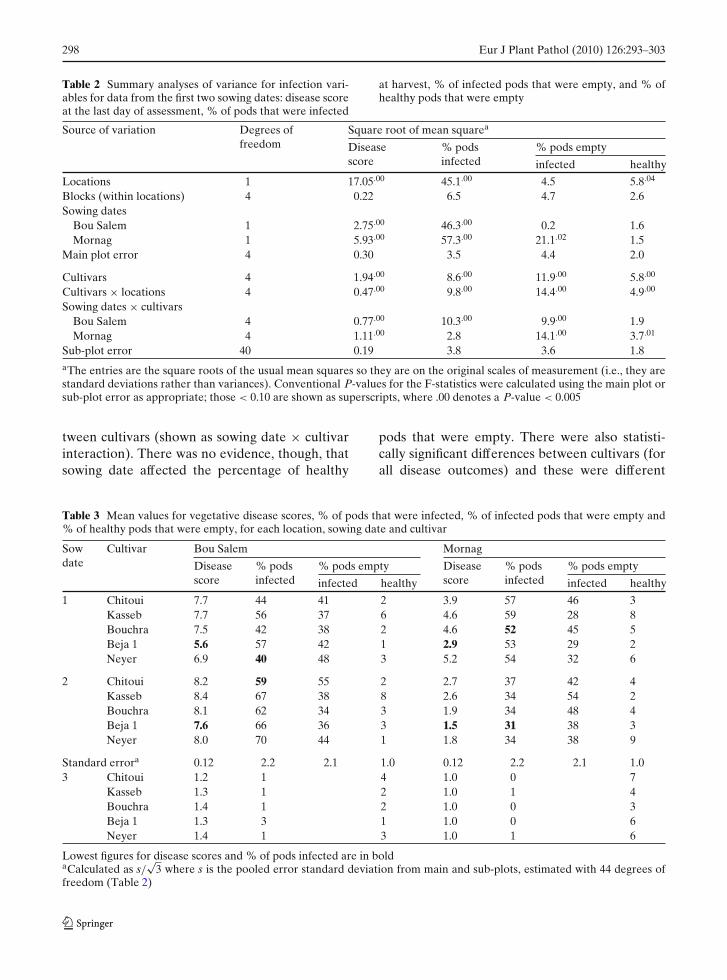
Table 2 Summary analyses of variance for infection vari-ables for data from the first two sowing dates: disease scoreat the last day of assessment, % of pods that were infected
at harvest, % of infected pods that were empty, and % ofhealthy pods that were empty
Source of variation Degrees of Square root of mean squarea
freedom Disease % pods % pods emptyscore infected infected healthy
Locations 1 17.05.00 45.1.00 4.5 5.8.04
Blocks (within locations) 4 0.22 6.5 4.7 2.6Sowing dates
Bou Salem 1 2.75.00 46.3.00 0.2 1.6Mornag 1 5.93.00 57.3.00 21.1.02 1.5
Main plot error 4 0.30 3.5 4.4 2.0
Cultivars 4 1.94.00 8.6.00 11.9.00 5.8.00
Cultivars × locations 4 0.47.00 9.8.00 14.4.00 4.9.00
Sowing dates × cultivarsBou Salem 4 0.77.00 10.3.00 9.9.00 1.9Mornag 4 1.11.00 2.8 14.1.00 3.7.01
Sub-plot error 40 0.19 3.8 3.6 1.8aThe entries are the square roots of the usual mean squares so they are on the original scales of measurement (i.e., they arestandard deviations rather than variances). Conventional P-values for the F-statistics were calculated using the main plot orsub-plot error as appropriate; those < 0.10 are shown as superscripts, where .00 denotes a P-value < 0.005
tween cultivars (shown as sowing date × cultivarinteraction). There was no evidence, though, thatsowing date affected the percentage of healthy
pods that were empty. There were also statisti-cally significant differences between cultivars (forall disease outcomes) and these were different
Table 3 Mean values for vegetative disease scores, % of pods that were infected, % of infected pods that were empty and% of healthy pods that were empty, for each location, sowing date and cultivar
Sow Cultivar Bou Salem Mornagdate Disease % pods % pods empty Disease % pods % pods empty
score infected infected healthy score infected infected healthy
1 Chitoui 7.7 44 41 2 3.9 57 46 3Kasseb 7.7 56 37 6 4.6 59 28 8Bouchra 7.5 42 38 2 4.6 52 45 5Beja 1 5.6 57 42 1 2.9 53 29 2Neyer 6.9 40 48 3 5.2 54 32 6
2 Chitoui 8.2 59 55 2 2.7 37 42 4Kasseb 8.4 67 38 8 2.6 34 54 2Bouchra 8.1 62 34 3 1.9 34 48 4Beja 1 7.6 66 36 3 1.5 31 38 3Neyer 8.0 70 44 1 1.8 34 38 9
Standard errora 0.12 2.2 2.1 1.0 0.12 2.2 2.1 1.03 Chitoui 1.2 1 4 1.0 0 7
Kasseb 1.3 1 2 1.0 1 4Bouchra 1.4 1 2 1.0 0 3Beja 1 1.3 3 1 1.0 0 6Neyer 1.4 1 3 1.0 1 6
Lowest figures for disease scores and % of pods infected are in boldaCalculated as s/
√3 where s is the pooled error standard deviation from main and sub-plots, estimated with 44 degrees of
freedom (Table 2)
Eur J Plant Pathol (2010) 126:293–303 299
at Bou Salem and Mornag (location × cultivarinteraction).
Table 3 presents mean values for the diseasemeasures along with their standard errors for thefirst two sowings. Each mean in the same columnhas the same standard error, calculated as s/
√3
where s was obtained (with 44 degrees of free-dom) by pooling the main and sub-plot error stan-dard deviations in Table 2 as these were similarin size. A 95% confidence interval for any meanof interest may be calculated by adding and sub-tracting 2 standard errors to the estimate. For ex-ample, for the cv. Beja 1 at Bou Salem on sowingdate 2, the 95% confidence interval for the meanpercentage of infected pods is 66 ± 2 × 2.2 =(61.6, 70.4).
In Table 3, useful comparisons can be madebetween cultivars at each sowing date and be-tween sowing dates for each cultivar. The localcultivar Beja 1 stands out as having the lowestvegetative disease score under all conditions, butis not generally lower than the others with respectto the percentage of pods that were infected atharvest. Both the disease score and the percentageof infected pods increased at Bou Salem for thesecond sowing but decreased at Mornag, for allcultivars. The disease also affected the percentageof empty pods, which is much higher for infectedpods than for healthy ones; the former varying
between 37% and 55% on average, while thelatter varied between 1% and 8%.
For comparison, Table 3 also gives means forthe third sowing date, except for the percentageof infected pods that were empty, because therewere very few infected pods. Here the percentagesof healthy pods that were empty are compara-ble with those for the earlier sowing dates. Notethat a disease score of 1 represents no vegetativedisease.
Yield components
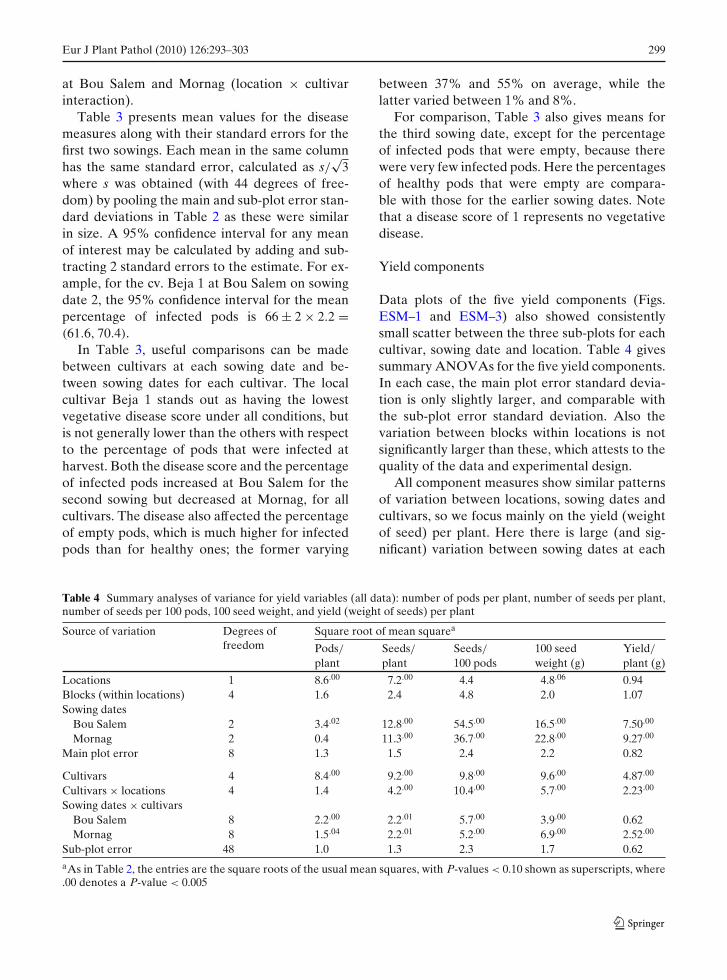
Data plots of the five yield components (Figs.ESM–1 and ESM–3) also showed consistentlysmall scatter between the three sub-plots for eachcultivar, sowing date and location. Table 4 givessummary ANOVAs for the five yield components.In each case, the main plot error standard devia-tion is only slightly larger, and comparable withthe sub-plot error standard deviation. Also thevariation between blocks within locations is notsignificantly larger than these, which attests to thequality of the data and experimental design.
All component measures show similar patternsof variation between locations, sowing dates andcultivars, so we focus mainly on the yield (weightof seed) per plant. Here there is large (and sig-nificant) variation between sowing dates at each
Table 4 Summary analyses of variance for yield variables (all data): number of pods per plant, number of seeds per plant,number of seeds per 100 pods, 100 seed weight, and yield (weight of seeds) per plant
Source of variation Degrees of Square root of mean squarea
freedom Pods/ Seeds/ Seeds/ 100 seed Yield/
plant plant 100 pods weight (g) plant (g)
Locations 1 8.6.00 7.2.00 4.4 4.8.06 0.94Blocks (within locations) 4 1.6 2.4 4.8 2.0 1.07Sowing dates
Bou Salem 2 3.4.02 12.8.00 54.5.00 16.5.00 7.50.00
Mornag 2 0.4 11.3.00 36.7.00 22.8.00 9.27.00
Main plot error 8 1.3 1.5 2.4 2.2 0.82
Cultivars 4 8.4.00 9.2.00 9.8.00 9.6.00 4.87.00
Cultivars × locations 4 1.4 4.2.00 10.4.00 5.7.00 2.23.00
Sowing dates × cultivarsBou Salem 8 2.2.00 2.2.01 5.7.00 3.9.00 0.62Mornag 8 1.5.04 2.2.01 5.2.00 6.9.00 2.52.00
Sub-plot error 48 1.0 1.3 2.3 1.7 0.62aAs in Table 2, the entries are the square roots of the usual mean squares, with P-values < 0.10 shown as superscripts, where.00 denotes a P-value < 0.005
300 Eur J Plant Pathol (2010) 126:293–303
location. At Mornag, the sowing date × cultivarinteraction is also large, showing that the differ-ences in yield between sowing dates differ be-tween cultivars. This is not the case at Bou Salem,where a similar cultivar pattern was seen for eachsowing date. However, for the other yield com-ponents, the sowing date × cultivar interactionis significant at both Mornag and Bou Salem. Fi-nally, there are statistically significant differencesin yield between cultivars and these differencesalso differ between locations.
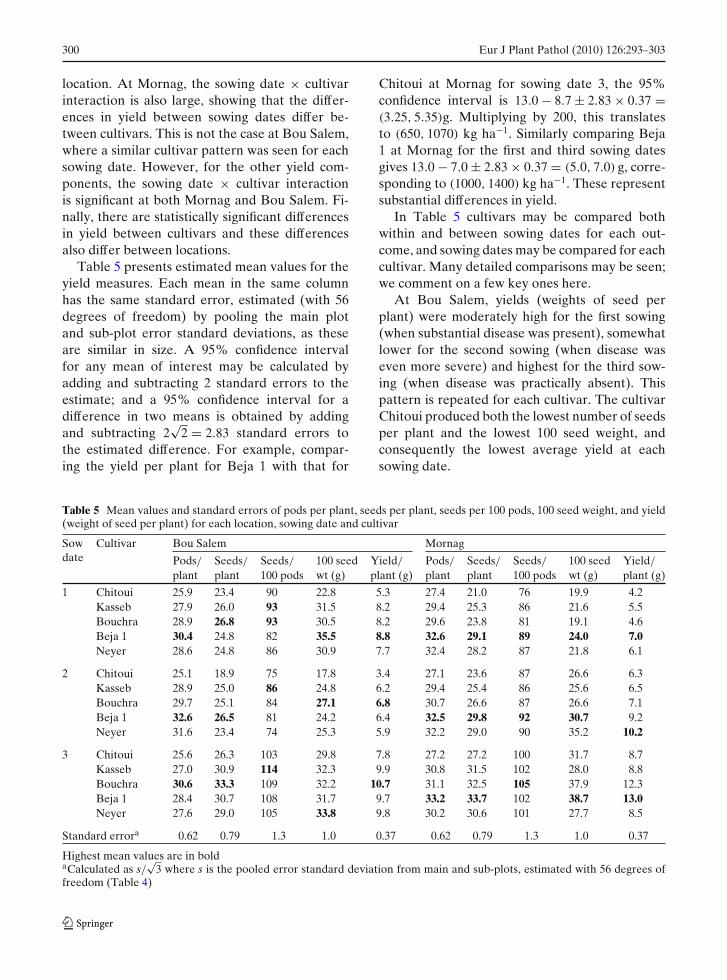
Table 5 presents estimated mean values for theyield measures. Each mean in the same columnhas the same standard error, estimated (with 56degrees of freedom) by pooling the main plotand sub-plot error standard deviations, as theseare similar in size. A 95% confidence intervalfor any mean of interest may be calculated byadding and subtracting 2 standard errors to theestimate; and a 95% confidence interval for adifference in two means is obtained by addingand subtracting 2
√2 = 2.83 standard errors to
the estimated difference. For example, compar-ing the yield per plant for Beja 1 with that for
Chitoui at Mornag for sowing date 3, the 95%confidence interval is 13.0 − 8.7 ± 2.83 × 0.37 =(3.25, 5.35)g. Multiplying by 200, this translatesto (650, 1070) kg ha−1. Similarly comparing Beja1 at Mornag for the first and third sowing datesgives 13.0 − 7.0 ± 2.83 × 0.37 = (5.0, 7.0) g, corre-sponding to (1000, 1400) kg ha−1. These representsubstantial differences in yield.
In Table 5 cultivars may be compared bothwithin and between sowing dates for each out-come, and sowing dates may be compared for eachcultivar. Many detailed comparisons may be seen;we comment on a few key ones here.
At Bou Salem, yields (weights of seed perplant) were moderately high for the first sowing(when substantial disease was present), somewhatlower for the second sowing (when disease waseven more severe) and highest for the third sow-ing (when disease was practically absent). Thispattern is repeated for each cultivar. The cultivarChitoui produced both the lowest number of seedsper plant and the lowest 100 seed weight, andconsequently the lowest average yield at eachsowing date.
Table 5 Mean values and standard errors of pods per plant, seeds per plant, seeds per 100 pods, 100 seed weight, and yield(weight of seed per plant) for each location, sowing date and cultivar
Sow Cultivar Bou Salem Mornagdate Pods/ Seeds/ Seeds/ 100 seed Yield/ Pods/ Seeds/ Seeds/ 100 seed Yield/
plant plant 100 pods wt (g) plant (g) plant plant 100 pods wt (g) plant (g)
1 Chitoui 25.9 23.4 90 22.8 5.3 27.4 21.0 76 19.9 4.2Kasseb 27.9 26.0 93 31.5 8.2 29.4 25.3 86 21.6 5.5Bouchra 28.9 26.8 93 30.5 8.2 29.6 23.8 81 19.1 4.6Beja 1 30.4 24.8 82 35.5 8.8 32.6 29.1 89 24.0 7.0Neyer 28.6 24.8 86 30.9 7.7 32.4 28.2 87 21.8 6.1
2 Chitoui 25.1 18.9 75 17.8 3.4 27.1 23.6 87 26.6 6.3Kasseb 28.9 25.0 86 24.8 6.2 29.4 25.4 86 25.6 6.5Bouchra 29.7 25.1 84 27.1 6.8 30.7 26.6 87 26.6 7.1Beja 1 32.6 26.5 81 24.2 6.4 32.5 29.8 92 30.7 9.2Neyer 31.6 23.4 74 25.3 5.9 32.2 29.0 90 35.2 10.2
3 Chitoui 25.6 26.3 103 29.8 7.8 27.2 27.2 100 31.7 8.7Kasseb 27.0 30.9 114 32.3 9.9 30.8 31.5 102 28.0 8.8Bouchra 30.6 33.3 109 32.2 10.7 31.1 32.5 105 37.9 12.3Beja 1 28.4 30.7 108 31.7 9.7 33.2 33.7 102 38.7 13.0Neyer 27.6 29.0 105 33.8 9.8 30.2 30.6 101 27.7 8.5
Standard errora 0.62 0.79 1.3 1.0 0.37 0.62 0.79 1.3 1.0 0.37
Highest mean values are in boldaCalculated as s/
√3 where s is the pooled error standard deviation from main and sub-plots, estimated with 56 degrees of
freedom (Table 4)
Eur J Plant Pathol (2010) 126:293–303 301
At Mornag, where disease decreased with sow-ing date, yield per plant increased with sowingdate for four of the cultivars. The exception wasNeyer, which had an unusually high yield forthe second sowing; it produced good numbers ofseeds, and heavier ones, compared to the othercultivars (both seeds per plant and 100 seed weightbeing relatively high). For the third sowing date,Beja 1 and Bouchra produced exceptionally highyields, with both more and heavier seeds com-pared with the other cultivars. Chitoui had thelowest numbers of seed per plant, though notthe lowest 100 seed weight, and was the lowestyielding cultivar for the first two sowings, whendisease was present.
No one cultivar stands out as being the highestyielding under all conditions, but Beja 1 producedthe highest yields for the first sowing date atboth locations and came a close second at BouSalem for the second sowing, when disease levelswere highest. Beja 1 also performed relatively wellwhen disease was low or absent, including havingthe highest yield at Mornag for the third sowingdate.
It is also worth noting that, for the first sowingdate, the average yields at Bou Salem were higherthan at Mornag, even though disease scores werealso higher (although the % pods infected at har-
vest were lower at Bou Salem). This holds for allcultivars.
Finally, we note that all cultivars averagedmore than one seed per pod in the absence ofdisease (sowing date 3) but rather less than this inthe presence of disease (sowing dates 1 and 2), nodoubt reflecting the higher proportions of emptypods amongst diseased plants.
Relationship between disease and yield
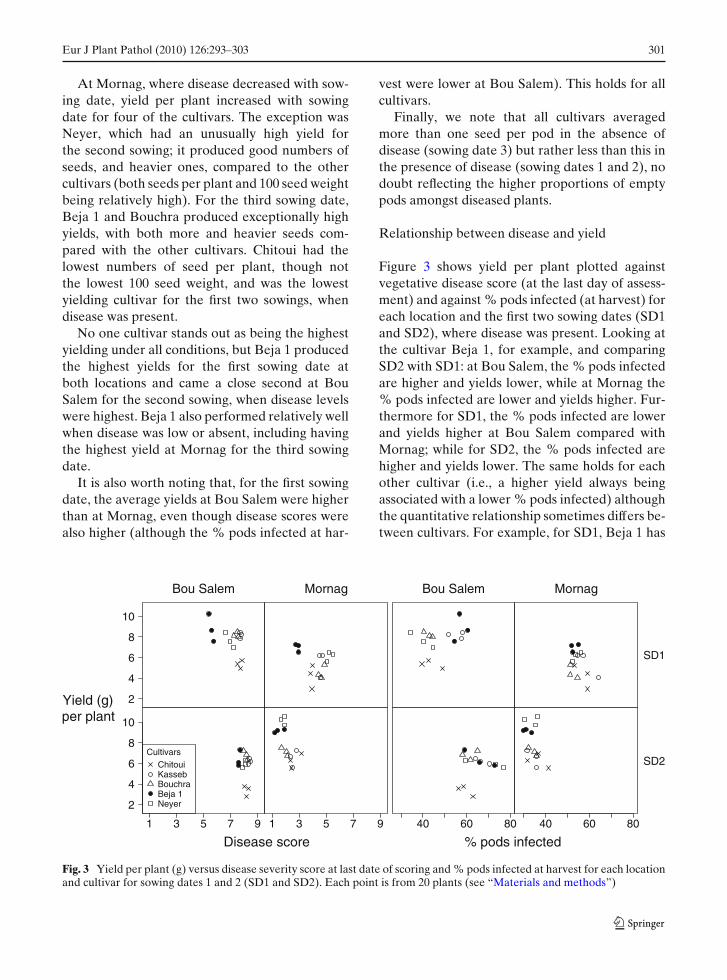
Figure 3 shows yield per plant plotted againstvegetative disease score (at the last day of assess-ment) and against % pods infected (at harvest) foreach location and the first two sowing dates (SD1and SD2), where disease was present. Looking atthe cultivar Beja 1, for example, and comparingSD2 with SD1: at Bou Salem, the % pods infectedare higher and yields lower, while at Mornag the% pods infected are lower and yields higher. Fur-thermore for SD1, the % pods infected are lowerand yields higher at Bou Salem compared withMornag; while for SD2, the % pods infected arehigher and yields lower. The same holds for eachother cultivar (i.e., a higher yield always beingassociated with a lower % pods infected) althoughthe quantitative relationship sometimes differs be-tween cultivars. For example, for SD1, Beja 1 has
2
4
6
8
10
Bou Salem
Yield (g)per plant
Mornag Bou Salem Mornag
SD1
1 3 5 7 9
2
4
6
8
10
Cultivars ChitouiKassebBouchraBeja 1Neyer
1 3 5 7 9
Disease score40 60 80
SD2
40 60 80
% pods infected
Fig. 3 Yield per plant (g) versus disease severity score at last date of scoring and % pods infected at harvest for each locationand cultivar for sowing dates 1 and 2 (SD1 and SD2). Each point is from 20 plants (see “Materials and methods”)
302 Eur J Plant Pathol (2010) 126:293–303
higher yields and % pods infected compared withNeyer, but for SD2 these two cultivars have simi-lar yields and % pods infected. Other differencesin the relation (and some similarities) can also beseen in Fig. 3.
The plots of yield against disease score alsoshow a negative association for each cultivarand location. However, comparing Bou Salemand Mornag for SD1 shows an exception, whereboth the disease scores and yields were higherat Bou Salem. This may be partly because thedisease scores were last assessed several days be-fore the plants were harvested (Fig. 2) so thatcomparatively more vegetative disease may sub-sequently have appeared at Mornag. Note thatthe relation between yield and % pods infected atharvest does show the negative association here.Nevertheless, Fig. 3 suggests that the relationshipbetween yield and disease is not straightforwardand may depend on factors that differ betweenlocations as well as on the cultivar used.
It has been suggested that linear regressionparameters could be used to describe the relation-ship between yield and disease score. However,this would not be sensible, partly because theywould be mainly reflecting differences betweencultivars rather than an intrinsic association be-tween disease and yield, and partly because dis-ease scores are not measured on a linear scale—which is especially relevant when they are close to1 or 9, as they are for SD2.
Discussion
Dusunceli et al. (2007a) found that sowing dateprofoundly affected the severity of Ascochytablight in Turkey and, as demonstrated in this pa-per, this is also true in Tunisia. Here disease atboth Bou Salem and Mornag was present in plantsfrom the first two sowing dates but essentiallyabsent for the third sowing. Moisture may havebeen an important factor as the disease was moresevere at Bou Salem than at Mornag where theclimate was drier.
The lower yields when Ascochyta blight wassevere suggests that the disease may be at leastpartly responsible. Disease severity of vegetativeorgans was greatest at Bou Salem SD2 with an av-
erage score over the five cultivars of 8.1 and 64.8%pod infection. The overall average yield of theseplants was 5.74 g/plant. However, the figure foryield/plant was little different from that of MornagSD1, 5.48, where average disease severity was only4.28 and pod infection 55%. If the low yield wasreally caused principally by Ascochyta blight, thenit may be that timing of infection is important, theplants perhaps being at a particularly vulnerablestage at Mornag SD1 when comparatively low dis-ease severity had an apparently disproportionateeffect on yield. The lower severity level of diseaseof Bou Salem plants at SD1 compared with SD2 isless easy to explain.
In this study, the individual cultivars have beencompared under five different levels of disease,effectively covering the whole range from 1 to 9.Beja 1 was the most successful overall in termsof having the lowest disease scores for vegeta-tive parts of the plant when conditions conduciveto Ascochyta blight were prevalent and was oneof the highest yielders under these conditions.It also out-yielded the other cultivars at MornagSD3, when the disease was essentially absent,with 13.0 g seed/plant but did not do so well atBou Salem with only 9.7 g seed/plant whereasBouchra had 10.7 g seed/plant at this location(Table 5). Cultivar Chitoui would seem to be bestavoided as its yields were the lowest whether ornot the disease was present.
In order to determine if A. rabiei was respon-sible for lower yields, a crucial test would be toset up further plots in which the disease was con-trolled by a fungicide, allowing for any iatrogeniceffects (such as an adverse effect of fungicideon yield). Also it would be important to repeatthe experiment in successive years in order todetermine if there is a causal relationship betweenweather conditions and disease severity. Coakley(1988) has suggested that a minimum of 8–12 yearsis required to define climatic factors important indetermining disease occurrence.
On the basis of the results reported in this paperit would seem that the latest planting dates atboth locations were the most appropriate onesfor obtaining the highest yields. These resultscontrast with those of Dusunceli et al. (2007a)where yields were severely depressed at the laterplanting dates. Perhaps this difference may be
Eur J Plant Pathol (2010) 126:293–303 303
attributable to drought stress in Turkey and amore benign climate in Tunisia. Dusunceli et al.(2007a) reported yields that varied from 570 to>2,000 kg ha−1 which are similar to those ofthe present report which, when scaled up fromg/plant, varied from 840 to 2,600 kg ha−1.
On a more general level, the normal agronomicpractices of only using seed that is not infectedby the fungus, avoiding areas in which infectedchickpea debris from a previous year is present onthe soil surface and interspersing chickpea fieldswith other crops in order to limit inoculum wouldhelp to reduce the risk of severe outbreaks ofAscochyta blight on chickpea.
Acknowledgements This study was part of the project‘ASCORAB’ supported by the INCODEV programme ofthe EU (contract no. ICA4-CT-2000-30003). The authorsthank Jane Galbraith, Department of Statistical Science,University College London, for constructive commentsthat improved the content and presentation of this article.
References
Alam S. S., Strange, R. N., & Qureshi, S. H. (1987).Isolation of Ascochyta rabiei and a convenientmethod for copious inoculum production. Mycologist,1, 20.
Bouslama, M., Harrabi, M., & Daaloul, A. (1988). Contri-bution à l’identification de quelques techniques cultur-ales pour la culture du pois chiche (Cicer arietinum L.)dans le semi-aride de la Tunisie. Revue de l’INAT, 3,93–101.
Coakley, S. M. (1988). Variation in climate and predic-tion of disease. Annual Review of Phytopathology, 26,163–181.
Dusunceli, F., Meyveci, K., Cetin, L., Avci, M., Surek,D., Albustan, S., et al. (2007a). Determination of
agronomic practices for the management of blight ofchickpea caused by Ascochyta rabiei in Turkey: 1.Appropriate sowing date. European Journal of PlantPathology, 119, 449–456.
Dusunceli, F., Wood, J. A., Gupta, A., Yadav, A. & Yadav,S. S. (2007b). International trade. In S. S. Yadav,R. Redden, W. Chen, & B. Sharma (Eds.), Chickpeabreeding and management (pp. 562–582). Wallingford:CAB International.
Djerbi, M., Malaiki, A., & Bouslama, M. (1979). Foodlegume diseases in North Africa. In Food legume im-provement and development (pp. 103–105). Ottawa:IDRC.
Kharrat, M., & Halila, M. H. (2006). Progress in breedingchickpea varieties combining tolerance to Ascochytaand resistance to Fusarium wilt in Tunisia. In Posterpresented at the 1st international workshop on grainlegumes. Le Tranchey, France.
Nene, Y. L. (1982). A review of Ascochyta blight of chick-pea. Tropical Pest Management, 28, 61–70.
Pande, S., Siddique, K. H. M., Kishore, G. K., Bayaa, B.,Gaur, P. M., Gowda, C. L. L., et al. (2005). Ascochytablight of chickpea (Cicer arietinum L.): A reviewof biology, pathogenicity, and disease management.Australian Journal of Agricultural Research, 56,317–332.
Reddy, M. V., & Singh, K. B. (1990). Relationship betweenAscochyta blight severity and yield loss in chickpeaand identification of resistant lines. PhytopathologiaMediterranea, 29, 32–38.
Singh, K. B., & Reddy, M. V. (1990). Patterns of resistanceand susceptibility to races of Ascochyta rabiei amonggerm plasm accessions and breeding lines of chickpea.Plant Disease, 74, 127–129.
Singh, K. B., Hawtin, G. C., Nene, Y. L., & Reddy, M. V.(1981). Resistance in chickpea to Ascochyta rabiei.Plant Disease, 65, 586–587.
Solh, M. B., Halila, H. M., Hernandez-Bravo, G., Malik,B. A., Mihov, M. I., & Sadri, B. (1994). Biotic and abi-otic stresses constraining the productivity of cool sea-son food legumes in different farming systems: Specificexamples. In F. J. Muehlbauer, & W. J. Kaiser (Eds.),Expanding the production and use of cool season foodlegumes (pp. 219–230). The Netherlands: Kluwer.
Related Documents