Ascochyta blights of grain legumes

Welcome message from author
This document is posted to help you gain knowledge. Please leave a comment to let me know what you think about it! Share it to your friends and learn new things together.
Transcript

Ascochyta blights of grain legumes
Ascochyta blights of grain legumes
Edited by
Bernard Tivoli, Alain Baranger, Fred J. Muehlbauer and B.M. Cooke
Reprinted from European Journal of Plant Pathology, Volume 119 Issue 1, 2007
123
A C.I.P catalogue record for this book is available from the library of Congress
ISBN 978-1-4020-6064-9 (HB)ISBN 978-1-4020-6065-6 (e-book)
Published by Springer,P.O. Box 17, 3300 AA, Dordrecht, The Netherlands
Printed on acid-free paper
Cover photos:From top to bottom: Ascochyta blight (Didymella rabiei) on chickpea leaflets; Faba bean seeds infected byAscochyta fabae; Mycosphaerella pinodes colony on Petri dish; Ascochyta blight (Mycosphaerella pinodes)on pea; Pycnidia of Ascochyta fabae in leaf tissue
Springeronline.comAll Rights Reserved� 2007 SpringerNo part of the material protected by this copyright notice may be reproduced or utilized in any form or byany means, electronic or mechanical, including photocopying, recording or by any information storage andretrieval system, without written permission from the copyright owner.
Printed in the Netherlands
Contents
Foreword
Full Research PapersTowards identifying pathogenic determinants of the chickpea pathogen Ascochyta rabieiD. White and W. Chen
Biotic factors affecting the expression of partial resistance in pea to ascochyta blight in adetached stipule assayC. Onfroy, A. Baranger and B. Tivoli
Validation of a QTL for resistance to ascochyta blight linked to resistance to fusarium wiltrace 5 in chickpea (Cicer arietinum L.)M. Iruela, P. Castro, J. Rubio, J.I. Cubero, C. Jacinto, T. Millán and J. Gil
Genetic relationships among Chickpea (Cicer arietinum L.) genotypes based on the SSRs atthe quantitative trait Loci for resistance to Ascochyta BlightB. Tar’an, T. Warkentin, A. Tullu and A. Vandenberg
Inheritance of resistance to Mycosphaerella pinodes in two wild accessions of PisumS. Fondevilla, J.I. Cubero and D. Rubiales
Comparison of the epidemiology of ascochyta blights on grain legumesB. Tivoli and S. Banniza
Development of ascochyta blight (Ascochyta rabiei) in chickpea as affected by host resistance and plant ageA.K. Basandrai, D. Basandrai, S. Pande, M. Sharma, S.K. Thakur and H.L. Thakur
Assessment of airborne primary inoculum availability and modelling of disease onset ofascochyta blight in field peasA. Schoeny, S. Jumel, F. Rouault, C.L. May and B. Tivoli
ReviewsIntegrated disease management of ascochyta blight in pulse cropsJ.A. Davidson and R.B.E. Kimber
The sympatric Ascochyta pathosystems of Near Eastern legumes, a key for better understanding of pathogen biologyS. Abbo, O. Frenkel, A. Sherman and D. Shtienberg
Role of host specificity in the speciation of Ascochyta pathogens of cool season food legumesT.L. Peever
Diagnostics, genetic diversity and pathogenic variation of ascochyta blight of cool seasonfood and feed legumesP.W.J. Taylor and R. Ford
Resistance to ascochyta blights of cool season food legumesF.J. Muehlbauer and W. Chen
1–2
3–12
13–27
29–37
39–51
53–58
59–76
77–86
87–97
99–110
111–118
119–126
127–133
135–141
Foreword
Robert (Bob) A. Henson
Received: 9 November 2006 / Accepted: 20 November 2006 / Published online: 2 February 2007� KNPV 2007
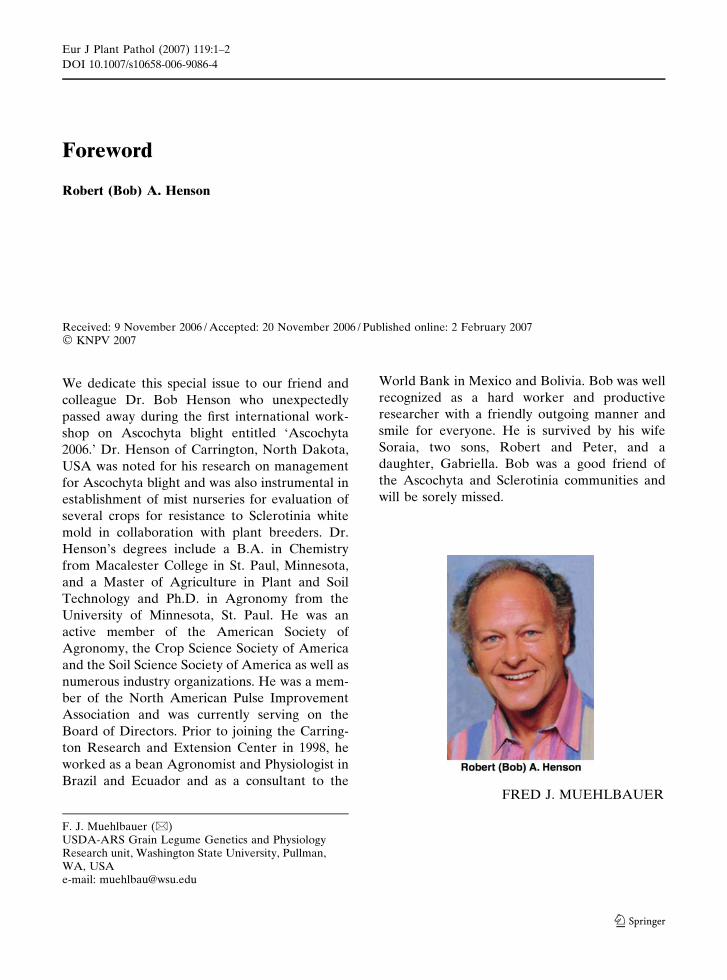
We dedicate this special issue to our friend and
colleague Dr. Bob Henson who unexpectedly
passed away during the first international work-
shop on Ascochyta blight entitled ‘Ascochyta
2006.’ Dr. Henson of Carrington, North Dakota,
USA was noted for his research on management
for Ascochyta blight and was also instrumental in
establishment of mist nurseries for evaluation of
several crops for resistance to Sclerotinia white
mold in collaboration with plant breeders. Dr.
Henson’s degrees include a B.A. in Chemistry
from Macalester College in St. Paul, Minnesota,
and a Master of Agriculture in Plant and Soil
Technology and Ph.D. in Agronomy from the
University of Minnesota, St. Paul. He was an
active member of the American Society of
Agronomy, the Crop Science Society of America
and the Soil Science Society of America as well as
numerous industry organizations. He was a mem-
ber of the North American Pulse Improvement
Association and was currently serving on the
Board of Directors. Prior to joining the Carring-
ton Research and Extension Center in 1998, he
worked as a bean Agronomist and Physiologist in
Brazil and Ecuador and as a consultant to the
World Bank in Mexico and Bolivia. Bob was well
recognized as a hard worker and productive
researcher with a friendly outgoing manner and
smile for everyone. He is survived by his wife
Soraia, two sons, Robert and Peter, and a
daughter, Gabriella. Bob was a good friend of
the Ascochyta and Sclerotinia communities and
will be sorely missed.
FRED J. MUEHLBAUER
F. J. Muehlbauer (&)USDA-ARS Grain Legume Genetics and PhysiologyResearch unit, Washington State University, Pullman,WA, USAe-mail: [email protected]
123
Eur J Plant Pathol (2007) 119:1–2
DOI 10.1007/s10658-006-9086-4
Ascochyta blights of grain legumesAscochyta blights of the cool season food
legumes (peas, lentils, chickpeas and faba beans)
are important production constraints in all re-
gions where these crops are grown and in severe
cases result in complete crop loss. The global
importance of Ascochyta as a production con-
straint to these legumes is well documented. To
review past research and to develop plans for
overcoming this production constraint, the first
international workshop on Ascochyta blight enti-
tled ‘Ascochyta 2006’ was organized and con-
ducted at Le Tronchet, France during the week of
2–6 July 2006. The workshop brought together
experts on all aspects of the problem to review
current knowledge and to formulate plans for
future research and collaboration. Plenary ses-
sions were devoted to pathogen biology, plant
resistance, epidemiology and integrated disease
management. Presentations of posters of current
research complimented these sessions and pro-
vided additional insights into the disease. Four
additional talks followed by informal round tables
were given in order to enlarge the thematic
sessions: interest in Medicago truncatula for
disease resistance in grain legumes(Alain Barang-
er, INRA, France); the Ascochyta genus (Ivan
Sache, INRA, France); grain legume research and
extension (Robert Morrall, University of Sas-
katchewan, Canada); the place of legumes in crop
rotations (Raphael Charles, University of Chan-
gins, Switzerland). The goal of the workshop was
to identify gaps in knowledge, identify new
research approaches and to establish collabora-
tive relationships among Ascochyta blight
researchers. Sixty-five participants from 13 coun-
tries were in attendance. Most of the participants
reported on their current research on Ascochyta
on one or more of the cool season food legumes.
The workshop was very successful in achieving
its goals set out by its organizers, and the
participants enjoyed the venue and hospitality
provided by the local organizing committee. This
special issue will serve as a useful reference for
years to come. Recommendations of the group
were formulated to stimulate future collaborative
research on the Ascochyta blight problem as it
affects the cool season food legumes. A commit-
tee was established for developing a follow-up
workshop to be held at Washington State Uni-
versity in Pullman, Washington, USA in June of
2009 entitled ‘Ascochyta 2009.’
This special issue of EJPP contains invited
presentations and contributed papers by work-
shop participants. The workshop was organized
by INRA (French National Institute of Agro-
nomical Research), Agrocampus Rennes (Col-
lege of Agronomy), AEP (European Association
of Grain Legumes), USDA (United States
Department of Agriculture) and SFP (French
Plant Pathology Society).
BERNARD TIVOLI
ALAIN BARANGER
FRED J. MUEHLBAUER
MIKE COOKE
2 Eur J Plant Pathol (2007) 119:1–2
123
FULL RESEARCH PAPER
Towards identifying pathogenic determinants of thechickpea pathogen Ascochyta rabiei
David White Æ Weidong Chen
Received: 30 October 2006 / Accepted: 8 March 2007 / Published online: 3 April 2007� KNPV 2007
Abstract Ascochyta blight is a serious disease of
cool-season grain legumes (chickpea, faba bean,
lentil and pea) caused by fungal species of the
anamorphic genus Ascochyta and related genera.
Despite extensive studies on the biology, ecology,
epidemiology and management of the disease,
little is known about the pathogenic determinants
of these pathogens. This research aims at using
Ascochyta rabiei as a model for the genus in
investigating genetic factors of pathogenicity,
with the ultimate goal of elucidating pathogenic
mechanisms. Three advances were made: (1)
insertional mutants with altered pathogenicity
were identified through in vivo screening, and
genomic regions adjacent to the insertion sites in
selected mutants were determined; (2) a phage
library of A. rabiei genomic DNA was con-
structed, and the library was estimated to provide
complete coverage of the A. rabiei genome. This
library was used successfully to recover clones
with DNA adjacent to insertional mutation sites
and to isolate specific genes; (3) DNA probes
specific for an acyl-CoA ligase (cps1) and a
polyketide synthase gene (pks1) were developed
and library clones containing the corresponding
genomic regions were identified from the phage
library. These advances provide the foundation
and necessary tools for experimentation of
ectopic complementation assays and targeted
mutagenesis to elucidate the genetic mechanisms
of pathogenicity of A. rabiei.
Keywords Agrobacterium-mediated
transformation � Gene disruption � Phage library
Introduction
Ascochyta blight is an important disease of cool-
season grain legume crops including chickpea,
faba bean, lentil, and pea. The pathogens are
often host-specific, each species causing the dis-
ease with economical significance only on specific
crops, e.g. Ascochyta rabiei on chickpea, A. fabae
on faba bean, A. lentis on lentil, and A. pisi
Mycosphaerella pinodes, and Phoma medicaginis
var. pinodella on pea (Peever 2007). Extensive
studies have been conducted on a number of the
species on pathogen ecology (Taylor and Ford
2007), epidemiology and management (Tivoli and
D. WhiteDepartment of Crop and Soil Sciences, WashingtonState University, Pullman, WA 99164, USA
W. Chen (&)USDA, Agricultural Research Service, Grain LegumeGenetics and Physiology Research Unit, andDepartment of Plant Pathology, Washington StateUniversity, 303 Johnson Hall, Pullman, WA 99164,USAe-mail: [email protected]
123
Eur J Plant Pathol (2007) 119:3–12
DOI 10.1007/s10658-007-9122-z
Banniza 2007; Davidson and Kimber 2007).
However, research on pathogenic determinants
of Ascochyta spp. in general has received little
attention.
Ascochyta blight pathogens are all necrotroph-
ic, killing plant cells in advance of mycelial
development. Therefore, toxins and cell-wall
degrading enzymes are often presumed to be
important biochemical determinants of pathogen-
esis. Among the ascochyta pathogens, A. rabiei on
chickpea is probably the most intensively studied
pathosystem in terms of biochemical interactions
between the host and the pathogen. Ascochyta
rabiei, causal agent of chickpea ascochyta blight,
produces toxin solanopyrones through the poly-
ketide synthesis pathway (Alam et al. 1989; Hohl
et al. 1991), and hydrolytic or cell-wall degrading
enzymes (Tenhaken and Barz 1991; Tenhaken
et al. 1997). Several lines of evidence show the
roles of the phytotoxins in causing blight (Chen
and Strange 1991; Kaur 1995). The hydrolytic
enzymes are considered necessary for fungal
nutrition and to facilitate spatial spread of fungi
(Walton 1994). Ascochyta rabiei was first trans-
formed with the protoplast/PEG protocol with a
GUS reporter gene for observing the infection
process (Kohler et al. 1995), and later trans-
formed with Agrobacterium-mediated transfor-
mation (AMT) for studying pathogenicity factors
(White and Chen 2006; Morgensen et al. 2006).
However, little information is currently available
about the genetic determinants of pathogenicity
of the ascochyta pathogens. Knowledge of path-
ogenic determinants will allow us to develop a
better understanding of host-pathogen interac-
tions to devise novel or more effective measures
in managing the disease.
There are two approaches to investigate
pathogenic determinants of fungal pathogens.
One is targeted gene disruption to construct
mutants defective of a defined gene of interest.
In this instance, target genes could be previ-
ously-reported pathogenicity genes in other
pathosystems. The role of the gene in infection
can be assessed by comparing the pathogenicity
of the mutant with that of the wild-type. The
other approach is to generate random and
tagged mutations within the pathogen genome.
The modern technique in this approach is
through insertional mutagenesis of either restric-
tion-enzyme-mediated integration (Oliver and
Osbourn 1995; Kahmann and Basse 1999) or
AMT (Michielse et al. 2005). This approach does
not require a priori knowledge of gene function,
and it involves generation of a library of random
mutations, screening the library for altered
phenotypes or pathogenicity, and characteriza-
tion of disrupted genomic regions. This strategy
is powerful in the identification of previously
unknown pathogenicity factors.
There are a number of previously reported
conserved fungal virulence factors that could
be explored in A. rabiei. Lu et al. (2003)
described a general fungal virulence factor
(an acyl-CoA ligase cps1) in several plant-
pathogenic ascomycetes. Disruption of the cps1
homolog in several plant pathogens produced
no observable growth phenotype, but showed
reduced virulence. Production of melanin has
also been shown to be a virulence factor in
some pathogenic fungi (Henson et al. 1999;
Kawamura et al. 1999). Ascochyta rabiei pro-
duces melanin through the 1,8-dihydroxynaph-
thalene pathway via polyketide synthesis (Chen
et al. 2004b). Thus, polyketide synthases could
potentially be pathogenicity factors in A. rabiei
through their involvement in melanin biosyn-
thesis or in the synthesis of phytotoxin solan-
apyrones (Hohl et al. 1991).
The goal of our research is to use A. rabiei as a
model for the other ascochyta pathogens to open
the door for investigating pathogenic determi-
nants. Our research hypotheses are (1) insertional
mutagenesis can be applied to A. rabiei to
elucidate pathogenic determinants, and (2) some
of the previously-reported pathogenicity factors
from other plant pathogens could be identified
and isolated from A. rabiei. Here we report
successful identification and characterization of
tagged mutants with reduced or lost pathogenic-
ity, development of gene-specific probes, con-
struction of a phage library of the A. rabiei
genome, and the isolation of clones containing
potential pathogenicity factors through screening
the library. The research provides the foundation
and necessary tools for further assessing the roles
of the respective genes in causing ascochyta
blight.
4 Eur J Plant Pathol (2007) 119:3–12
123
Materials and methods
Fungal strains, transformation, and
pathogenicity screening of transformants
The pathotype II strain AR628 (Chen et al.
2004a) of A. rabiei was used in transformation
experiments. The transformation was carried out
as previously described (White and Chen 2006).
Briefly, conidia of strain AR628 were co-cultured
with cells of Agrobacterium tumefaciens carrying
T-DNA. The co-cultivation was spread on a
membrane and incubated on medium containing
timentin and hygromycin to select against bacte-
ria and select for hygromycin-resistant transfor-
mants. Transformed conidia that grew on the
selective medium were further purified by single-
conidium isolation. After confirming resistance to
hygromycin, the transformants were screened for
altered pathogenicity before further characteriza-
tion.
The mini-dome bioassay (Chen et al. 2005) was
used to screen transformants for reduced patho-
genicity. The transformants were always com-
pared with wild-type strains AR19 (pathotype I)
and AR628 in the pathogenicity assays on chick-
pea cvs Dwelley and Spanish White (six plants in
three replicates of each cultivar per strain).
Disease severity was assessed according to the
1–9 rating scale (Chen et al. 2004a). The trans-
formants that showed reduced pathogenicity in
the first assay were tested again in a second assay.
Nine transformants that showed significantly
reduced pathogenicity in both assays were
selected for further study. In addition, two trans-
formants that lost ability to produce conidia were
also selected for further characterization.
Southern hybridization, inverse-PCR and
sequence analysis of transformants
Southern hybridization was used to determine the
number of insertions in transformants. Genomic
DNA from transformants and wild-type AR628
were digested with XhoI (New England Biolabs,
Ipswich, MA, USA), separated on an agarose gel,
and transferred to a nylon membrane. A DIG-
labelled DNA probe was synthesized from an
internal region of the hygromycin B gene using
PCR (White and Chen 2006). Probed membranes
were processed according to the manufacturer’s
instructions, and detected using the anti-DIG-
alkaline phosphatase conjugate antibody and the
chemiluminescent substrate CSPD (Roche) by
exposure to autoradiograph film to visualize
hybridized fragments.
To isolate DNA regions flanking the insertion
sites in the transformants, an inverse-PCR tech-
nique was used. Genomic DNA of selected
transformants was digested with XhoI to isolate
DNA flanking the right border, and digested with
either SacI, SalI or KpnI to isolate DNA flanking
the left border. Digested DNA was ligated to
itself and used as template for the inverse PCR
using primers LB5IP and RB5IP (White and
Chen 2006). Products were isolated from agarose
gels and ligated to the pGEM-T Easy vector
(Promega, Madison, WI, USA) for further anal-
ysis.
To determine the gene disrupted by the T-
DNA in each transformant, the ends of each
cloned inverse-PCR product were sequenced
using the M13F (-20) and M13R (-21) primers
(New England Biolabs). Forward and reverse
sequences were joined after removing all vector
and T-DNA border sequences. Assembled se-
quences were compared to each other to verify
that each contained a unique region of the A.
rabiei genome and translated in all six reading
frames for comparison to the GenBank database
as well as the Stagonospora nodorum genome
(http://www.broad.mit.edu). The S. nodorum gen-
ome was selected because, for the fungi with
genomes available, S. nodorum is the closest
phylogenetically related to A. rabiei (Peever et al.
2007).
Development of gene-specific probes for A.
rabiei
Specific probes were developed for genes that
could be potential virulence factors in A. rabiei.
The genes encoding the polyketide synthase
(pks1) from Glarea lozoyensis (Zhang et al.
2003) and an acyl-CoA ligase (cps1) from Coch-
liobolus heterostrophus (Lu et al. 2003) were
selected as candidate virulence factors. These
gene products were compared to and aligned with
Eur J Plant Pathol (2007) 119:3–12 5
123

the translated genome of S. nodorum, and
conserved locations were selected to design
PCR primers. PCR primers pksF2 (5¢-CAC-
TACCACTGCCGTCGCAT) and pksR2 (5¢-TAGACTTGACCATGCCACTGCA) were de-
signed to amplify a 562-bp region of the pks1
gene, and primers cpsF (5¢-GGGACAAGAG-
CAACCTCTA) and cpsR (5¢-TGGTAGTTG-
TATGCAGC) to amplify a 683-bp region of the
cps1 gene. PCR products were cloned into the
pGEM-T Easy vector (Promega) and sequenced
using the M13F and M13R primers as described
above.
Construction and screening of a genomic
library of A. rabiei
To construct a genomic library of A. rabiei,
genomic DNA of strain AR628 was digested with
ApoI and fragments between 7,000 and 10,000 bp
were eluted from agarose gels, desalted, and
ligated to pre-digested and phosphatased (EcoRI)
Lambda ZAPII vector arms (Stratagene, La Jolla,
CA, USA), packaged using Gigapack III extracts,
and amplified in E. coli strain XL1-Blue. The
efficiency of the ligation and packaging reactions
were determined using X-GAL and IPTG. To
determine the average insert size of the recombi-
nant phage library, plasmid rescue (in vivo exci-
sion) was performed on phage collected from ten
random plaques using the ExAssist� helper
phage and E. coli strain SOL-R. Recovered
plasmids were digested with ApoI and separated
on an agarose gel. A single round of library
amplification was performed and the phage sus-
pension stored in 7% DMSO at –80�C until use.
To isolate clones from the library that contain
either pks1 or cps1 homologs, probes were con-
structed using PCR with the pks or cps primers
and labelling procedures described above.
Approximately 80,000 plaques were transferred
from NZY agar to nylon membranes (Amer-
sham) and probed sequentially, first with the cps1
probe, then with the pks1 probe. Single plaques
that hybridized with each probe were recovered
from the corresponding NZY plate and in vivo
excision reactions were performed to rescue
phagemid DNA. Recovered phagemid DNA
was used as template for PCR with the corre-
sponding primer pairs used to generate the probe,
and were also digested with ApoI to estimate the
insert size by agarose gel electrophoresis.
To isolate clones from the phage library that
contain DNA adjacent to the T-DNA insertion
sites, approximately 80,000 plaques were screened
with probes generated from inverse-PCR prod-
ucts. Probes from the transformants were mixed
together for the primary hybridization and detec-
tion screen. Phage from positive plaques from the
primary screen was harvested and pooled in SM
buffer to make an enriched phage stock for
infecting E. coli XL-1 Blue cells. Plaques gener-
ated from the enriched phage stock were trans-
ferred to nylon membranes and screened with
individual probes. Phagemids were recovered by
in vivo excision as described above from phage
collected from three plaques identified by each
probe and analyzed by restriction digestion and
sequencing.
Results
Identification and characterization of
transformants with altered pathogenicity
Approximately 800 transformants were generated
and screened for pathogenicity in this study. The
transformants exhibited a wide range of variation
in colony morphology, growth rate, and conidial
production. For example, six transformants had
lost ability to produce conidia. Some transfor-
mants produced constitutively black mycelium. In
general, under selection conditions (V8 agar with
200 lg ml–1 hygromycin) many transformants
produced less conidia than when grown in the
absence of selection (V8 agar without hygromy-
cin). The wild-type strain AR628 consistently
produced about 3.7 · 107 conidia per plate, 63
transformants produced about 10% of conidia of
WT, seven transformants produced about 1.5% of
conidia of the wild type. Two transformants
produced 5· more conidia than the wild type.
In pathogenicity screening, the transformants
that lost ability to produce conidia were not
screened because the screening procedure uses
conidia as inoculum (Chen et al. 2004a). Most of
the transformants screened were about equally
6 Eur J Plant Pathol (2007) 119:3–12
123
virulent as the parental wild-type strain, produc-
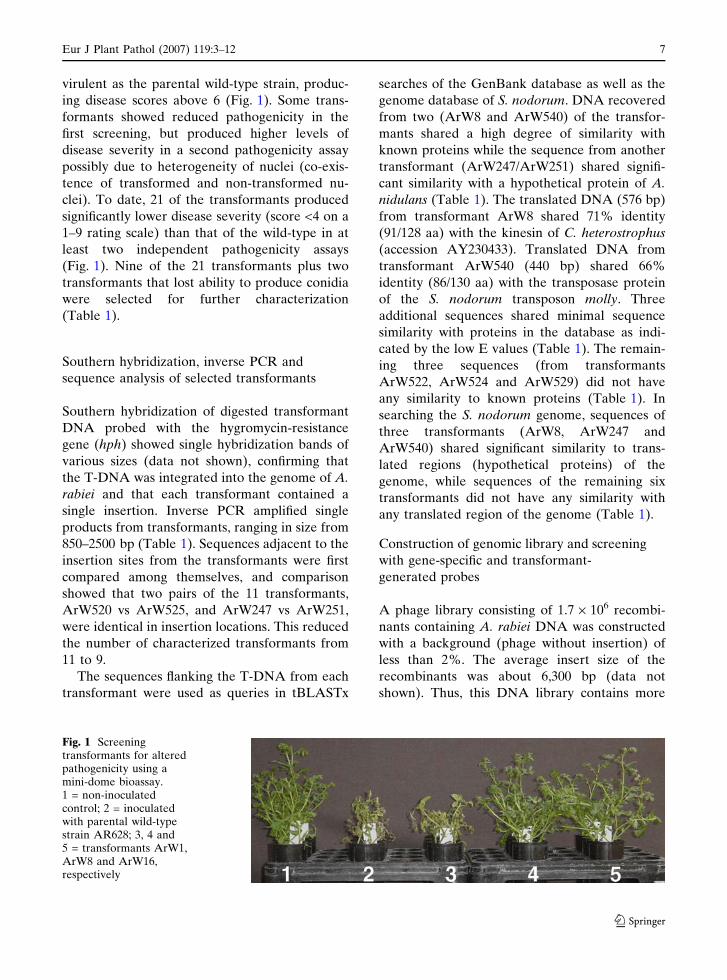
ing disease scores above 6 (Fig. 1). Some trans-
formants showed reduced pathogenicity in the
first screening, but produced higher levels of
disease severity in a second pathogenicity assay
possibly due to heterogeneity of nuclei (co-exis-
tence of transformed and non-transformed nu-
clei). To date, 21 of the transformants produced
significantly lower disease severity (score <4 on a
1–9 rating scale) than that of the wild-type in at
least two independent pathogenicity assays
(Fig. 1). Nine of the 21 transformants plus two
transformants that lost ability to produce conidia
were selected for further characterization
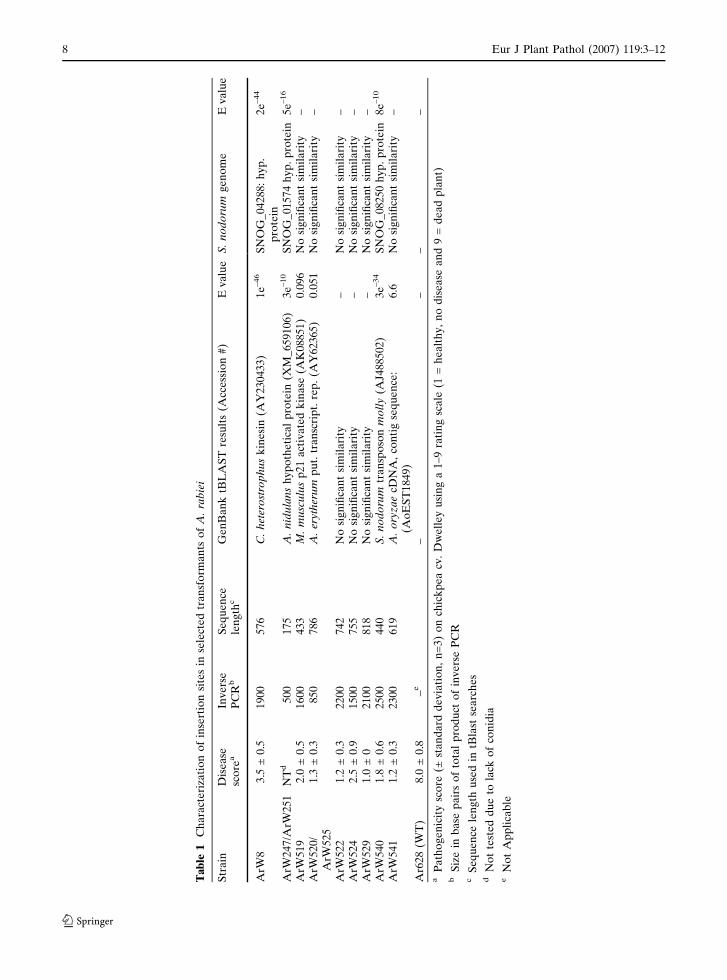
(Table 1).
Southern hybridization, inverse PCR and
sequence analysis of selected transformants
Southern hybridization of digested transformant
DNA probed with the hygromycin-resistance
gene (hph) showed single hybridization bands of
various sizes (data not shown), confirming that
the T-DNA was integrated into the genome of A.
rabiei and that each transformant contained a
single insertion. Inverse PCR amplified single
products from transformants, ranging in size from
850–2500 bp (Table 1). Sequences adjacent to the
insertion sites from the transformants were first
compared among themselves, and comparison
showed that two pairs of the 11 transformants,
ArW520 vs ArW525, and ArW247 vs ArW251,
were identical in insertion locations. This reduced
the number of characterized transformants from
11 to 9.
The sequences flanking the T-DNA from each
transformant were used as queries in tBLASTx
searches of the GenBank database as well as the
genome database of S. nodorum. DNA recovered
from two (ArW8 and ArW540) of the transfor-
mants shared a high degree of similarity with
known proteins while the sequence from another
transformant (ArW247/ArW251) shared signifi-
cant similarity with a hypothetical protein of A.
nidulans (Table 1). The translated DNA (576 bp)
from transformant ArW8 shared 71% identity
(91/128 aa) with the kinesin of C. heterostrophus
(accession AY230433). Translated DNA from
transformant ArW540 (440 bp) shared 66%
identity (86/130 aa) with the transposase protein
of the S. nodorum transposon molly. Three
additional sequences shared minimal sequence
similarity with proteins in the database as indi-
cated by the low E values (Table 1). The remain-
ing three sequences (from transformants
ArW522, ArW524 and ArW529) did not have
any similarity to known proteins (Table 1). In
searching the S. nodorum genome, sequences of
three transformants (ArW8, ArW247 and
ArW540) shared significant similarity to trans-
lated regions (hypothetical proteins) of the
genome, while sequences of the remaining six
transformants did not have any similarity with
any translated region of the genome (Table 1).
Construction of genomic library and screening
with gene-specific and transformant-
generated probes
A phage library consisting of 1.7 · 106 recombi-
nants containing A. rabiei DNA was constructed
with a background (phage without insertion) of
less than 2%. The average insert size of the
recombinants was about 6,300 bp (data not
shown). Thus, this DNA library contains more
Fig. 1 Screeningtransformants for alteredpathogenicity using amini-dome bioassay.1 = non-inoculatedcontrol; 2 = inoculatedwith parental wild-typestrain AR628; 3, 4 and5 = transformants ArW1,ArW8 and ArW16,respectively
Eur J Plant Pathol (2007) 119:3–12 7
123
Ta
ble
1C
ha
ract
eri
zati
on
of
inse
rtio
nsi
tes
inse
lect
ed
tra
nsf
orm
an
tso
fA
.ra
bie
i
Str
ain
Dis
ea
sesc
ore
aIn
ve
rse
PC
Rb
Se
qu
en
cele
ng
thc
Ge
nB
an
ktB
LA
ST
resu
lts
(Acc
ess
ion
#)
Ev
alu
eS
.n
od
oru
mg
en
om
eE
va
lue
ArW
83
.5±
0.5
19
00
57
6C
.h
eter
ost
rop
hu
sk
ine
sin
(AY
23
04
33
)1
e–46
SN
OG
_0
42
88
:h
yp
.p
rote
in2
e–44
ArW
24
7/A
rW2
51
NT
d5
00
17
5A
.n
idu
lan
sh
yp
oth
eti
cal
pro
tein
(XM
_6
59
10
6)
3e
–10
SN
OG
_0
15
74
hy
p.
pro
tein
5e
–16
ArW
51
92
.0±
0.5
16
00
43
3M
.m
usc
ulu
sp
21
act
iva
ted
kin
ase
(AK
08
85
1)
0.0
96
No
sig
nifi
can
tsi
mil
ari
ty–
ArW
52
0/
ArW
52
51
.3±
0.3
85
07
86
A.
ery
ther
um
pu
t.tr
an
scri
pt.
rep
.(A
Y6
23
65
)0
.05
1N
osi
gn
ifica
nt
sim
ila
rity
–
ArW
52
21
.2±
0.3
22
00
74
2N
osi
gn
ifica
nt
sim
ila
rity
–N
osi
gn
ifica
nt
sim
ila
rity
–A
rW5
24
2.5
±0
.91
50
07
55
No
sig
nifi
can
tsi
mil
ari
ty–
No
sig
nifi
can
tsi
mil
ari
ty–
ArW
52
91
.0±
02
10
08
18
No
sig
nifi
can
tsi
mil
ari
ty–
No
sig
nifi
can
tsi
mil
ari
ty–
ArW
54
01
.8±
0.6
25
00
44
0S
.n
od
oru
mtr
an
spo
son
mo
lly
(AJ4
88
50
2)
3e
–34
SN
OG
_0
82
50
hy
p.
pro
tein
8e
–10
ArW
54
11
.2±
0.3
23
00
61
9A
.o
ryz
ae
cDN
A,
con
tig
seq
ue
nce
:(A
oE
ST
18
49
)6
.6N
osi
gn
ifica
nt
sim
ila
rity
–
Ar6
28
(WT
)8
.0±
0.8
–e
––
––
aP
ath
og
en
icit
ysc
ore
(±st
an
da
rdd
ev
iati
on
,n
=3
)o
nch
ick
pe
acv
.D
we
lle
yu
sin
ga
1–
9ra
tin
gsc
ale
(1=
he
alt
hy
,n
od
ise
ase
an
d9
=d
ea
dp
lan
t)b
Siz
ein
ba
sep
air
so
fto
tal
pro
du
cto
fin
ve
rse
PC
Rc
Se
qu
en
cele
ng
thu
sed
intB
last
sea
rch
es
dN
ot
test
ed
du
eto
lack
of
con
idia
eN
ot
Ap
pli
cab
le
8 Eur J Plant Pathol (2007) 119:3–12
123
than 10,000 MB of A. rabiei DNA. Assuming a
genome size of 40 MB for A. rabiei (Akamatsu
and Peever 2005), this library would provide more
than 250· coverage. After a single round of
amplification the final titer of the library was
1 · 109 pfu ml–1.
Screening with gene-specific probes
The amplified pks1 DNA fragment had 81% (455/
562) identity to the Bipolaris oryzae polyketide
synthase gene (accession AB176546). The ampli-
fied cps1 fragment was 82% (560/683) identical to
the cps1 gene (accession AF332878) of C. hetero-
strophus. The two sequences were deposited into
GenBank and assigned the accession numbers
EF092313 (ARcps1) and EF092314 (ARpks1).
Two positive clones were identified with the pks
probe, and the two clones contained 5,800- and
7,000-bp inserts, respectively. The 7,000-bp clone
contained an intact DNA region defined by the
two PCR primers pksF2 and pksR2. A single
positive clone with 5,500-bp insert was identified
with the cps probe and it contained the entire
DNA region defined by the cps primers cpsF and
cpsR (data not shown).
Screening with transformant-generated probes
After a primary screening of approximately
80,000 plaques with a mixture of the nine probes
of the transformants, phage from 55 positive
plaques was harvested and pooled to form an
enriched phage stock for a secondary screen using
individual probes. Each probe in the secondary
screening was exposed to approximately 30,000
plaques generated from the enriched phage stock.
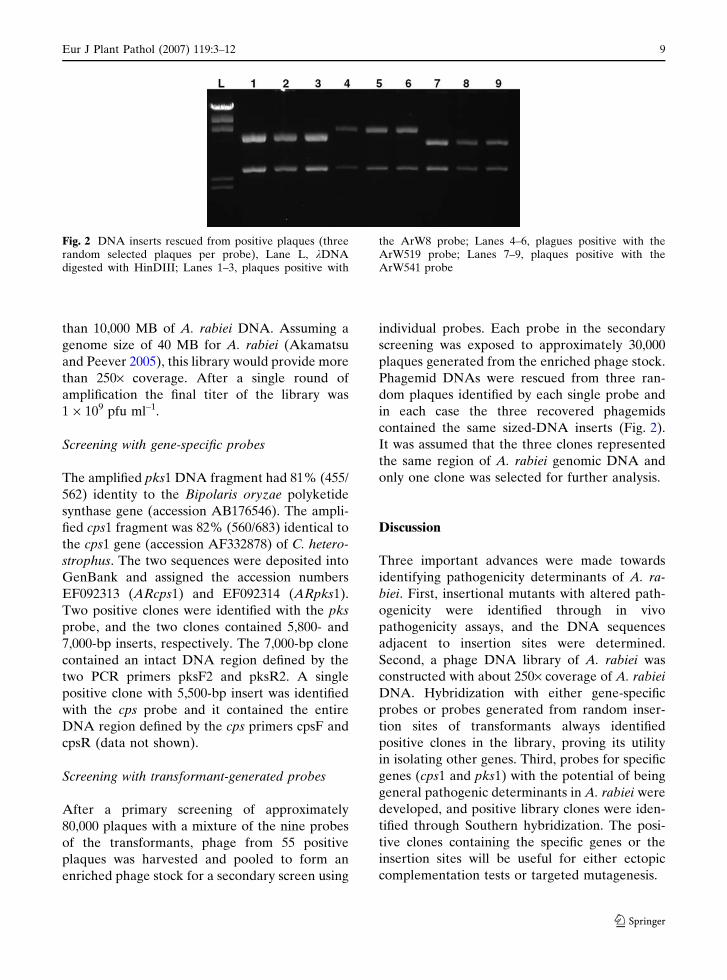
Phagemid DNAs were rescued from three ran-
dom plaques identified by each single probe and
in each case the three recovered phagemids
contained the same sized-DNA inserts (Fig. 2).
It was assumed that the three clones represented
the same region of A. rabiei genomic DNA and
only one clone was selected for further analysis.
Discussion
Three important advances were made towards
identifying pathogenicity determinants of A. ra-
biei. First, insertional mutants with altered path-
ogenicity were identified through in vivo
pathogenicity assays, and the DNA sequences
adjacent to insertion sites were determined.
Second, a phage DNA library of A. rabiei was
constructed with about 250· coverage of A. rabiei
DNA. Hybridization with either gene-specific
probes or probes generated from random inser-
tion sites of transformants always identified
positive clones in the library, proving its utility
in isolating other genes. Third, probes for specific
genes (cps1 and pks1) with the potential of being
general pathogenic determinants in A. rabiei were
developed, and positive library clones were iden-
tified through Southern hybridization. The posi-
tive clones containing the specific genes or the
insertion sites will be useful for either ectopic
complementation tests or targeted mutagenesis.
Fig. 2 DNA inserts rescued from positive plaques (threerandom selected plaques per probe), Lane L, kDNAdigested with HinDIII; Lanes 1–3, plaques positive with
the ArW8 probe; Lanes 4–6, plagues positive with theArW519 probe; Lanes 7–9, plaques positive with theArW541 probe
Eur J Plant Pathol (2007) 119:3–12 9
123
Insertion in one of the transformants appears
to be within a known fungal gene. Transformant
ArW8 is less pathogenic (Table 1), and the T-
DNA has disrupted a kinesin-like gene. Kinesins
play important roles in the transport of cell
organelles, polarized growth, and secretion
(Schoch et al. 2003), and the kinesins of the yeast
Schizosaccharomyces pombi as well as the corn
smut fungus Ustilago maydis have been studied
extensively (Steinberg and Fuchs 2004; Straube
et al. 2006). However, this is the first report of a
kinesin-like gene potentially being involved in
plant pathogenesis. Its role remains to be con-
firmed and its mechanisms in pathogenesis are not
clear.
Diverse DNA sequences are found in the
insertion sites, showing the randomness of the
insertion mutagenesis. Pathogenesis is a complex
biological process involving diverse factors. Path-
ogenesis of the necrotrophic pathogen A. rabiei is
predicted to involve a number of processes
including attachment and penetration of host
plant tissue, as well as production and secretion
of extracellular enzymes and phytotoxins, and
each process is likely to be controlled by several
genes. A mutation in any gene involved in these
processes could result in altered pathogenicity.
Many of the sequences recovered from the
nine transformants had no significant matches
either in the GenBank database or within the S.
nodorum genome, and the significant in silico
similarity identified in three of the transformants
is primarily with hypothetical proteins. This
inability to detect any known sequences with
significant similarity could be due to the limited
length of query sequences available, to the fact
that they are unique pathogenicity factors in A.
rabiei, or to the fact that small deletions of
genomic DNA occurred during T-DNA integra-
tion events (Bundock and Hooykaas 1996),
resulting in the loss of a coding region flanking
the insertion.
Gene-specific probes were developed to isolate
a polyketide synthase gene and an acyl-CoA
ligase gene from the A. rabiei library. These genes
were selected because they were shown to be
conserved pathogenicity factors in other patho-
systems (Kawamura et al. 1999; Lu et al. 2003).
Screening using these gene-specific probes also
served the purpose to test the completeness and
usefulness of the DNA library. Both probes
identified positive plaques in the library despite
the fact only a portion (80,000 plaques) of the
library was exposed to the probes. Thus, this
library should be useful for isolating other genes
of interest and it will be a valuable resource
available to the scientific community for studying
A. rabiei or other related plant pathogens.
Two pairs of transformants were shown to be
identical, likely to have resulted from conidia of
the same transformation events, since they were
isolated from the same transformation mem-
brane. Although the unintentional inclusion of
these transformants resulted in redundancy of
work, in retrospect, it provided an important
internal control. This result showed that the
characterization procedures from pathogenicity
screening to inverse PCR are reliable and repro-
ducible, giving us confidence in the techniques
developed in this study.
Two approaches need to be taken to unequiv-
ocally demonstrate the roles of the identified
potential pathogenicity determinants in A. rabiei.
One approach is to use ectopic complementation
tests to prove the role of the genes disrupted in
the random insertional mutants. A second shuttle
vector carrying the nptII gene for geneticin
resistance expressed by the A. nidulans trpC
promoter has been created for delivering library
DNA via AMT to hygromycin-resistant transfor-
mants, and selection on hygromycin and geneticin
has been shown to be stable (unpublished).
Additionally, A. rabiei is heterothallic (Trapero-
Casas and Kaiser 1992). Thus segregation analysis
could also be employed.
Another approach is to carry out targeted
mutagenesis specifically on the cps and pks genes
to create knockout mutants. To create deletions
in the pks and cps library fragments, a short
region of each clone has been removed by
restriction digest and replaced with the trpC-hph
antibiotic resistance cassette. Disruption cassettes
containing library clones in a markerless T-DNA
shuttle vector are being constructed for delivery
into A. rabiei wild-type strains via AMT. Inte-
gration can occur at the genomic site of interest
(homologous recombination) or at other sites
(illegitimate recombination), which would be
10 Eur J Plant Pathol (2007) 119:3–12
123

distinguished by PCR or Southern hybridization.
Since transformation may induce unexpected
changes in chromosome structure or complement,
it is prudent to evaluate the phenotypes including
pathogenicity of a number of independent trans-
formants including those that have not undergone
disruption at the gene of interest.
Despite significant advances in understanding
genetic factors of pathogenicity in a number of
phytopathogenic fungi (e.g., Gilbert et al. 2004;
Talbot 2004), little information is available about
pathogenicity determinants in Ascochyta spp.
Using A. rabiei as a model for Ascochyta and
other closely related plant pathogens, the re-
search presented here showed the feasibility of
and provided necessary tools for studying patho-
genicity determinants in ascochyta blight patho-
gens of grain legumes. A detailed knowledge of
pathogenic determinants of A. rabiei and of
chickpea resistance response (Cho et al. 2005;
Coram and Pang 2006) will be invaluable in
developing our understanding of the interaction
between A. rabiei and chickpea, and in devising
novel or more effective measures in managing the
disease. The information may also be applicable
to ascochyta blight of other cool-season grain
legumes.
References
Akamatsu, H., & Peever, T. L. (2005). Molecular karyo-types of the phytopathogenic fungus Ascochyta rabieiand related legume-infecting Ascochyta spp. XXIIIFungal Genetics Conference. Fungal Genetics News-letter, 52(Supplement), 204.
Alam, S. S., Bilton, J. N., Slawin, A. M. Z., Williams, D. J.,Sheppard, R. N., & Strange, R. N. (1989). Chickpeablight – Production of the phytotoxins solanapyroneA and C by Ascochyta rabiei. Phytochemistry, 28,2627–2630.
Bundock, P., & Hooykaas, P. J. J. (1996). Integration ofAgrobacterium tumefaciens T-DNA in the Saccharo-myces cerevisiae genome by illegitimate recombina-tion. Proceedings of National Academy of ScienceUSA, 93, 15272–15275.
Chen, W., Coyne, C., Peever, T., & Muehbauer, F. J.(2004a). Characterization of chickpea differentials forAscochyta blight and identification of resistancesources for Ascochyta rabiei. Plant Pathology, 53, 759–769.
Chen, W., McPhee, K. E., & Muehlbauer, F. J. (2005). Useof a min-dome bioassay and grafting to study resis-
tance of chickpea to Ascochyta blight. Journal ofPhytopathology, 153, 579–587.
Chen, W., Sharma, K. D., & Wheeler, M. H. (2004b).Demonstration of the 1,8-dihydroxynaphthalenemelanin pathway in Ascochyta rabiei. Inoculum, 55, 11(Abstract).
Chen, Y. M., & Strange, R. N. (1991). Synthesis of thesolanapyrone phytotoxin by Ascochyta rabiei in re-sponse to metal cations and development of a definedmedium for toxin production. Plant Pathology, 40,401–407.
Cho, S., Chen, W., & Muehlbauer, F. J. (2005). Constitu-tive expression of the flavanone 3-hydroxylase generelated to pathotype-specific ascochyta blight resis-tance in Cicer arietinum L. Physiological and Molec-ular Plant Pathology, 67, 100–107.
Coram, T. E., & Pang, E. C. K. (2006). Expression profilingof chickpea genes differentially regulated during aresistance response to Ascochyta rabiei. Plant Bio-technology Journal, 4, 647–666.
Davidson, J., & Kimber, R. B. E. (2007). Integrated dis-ease management of Ascochyta blight in pulse crops.European Journal of Plant Pathology, 117 (this specialissue).
Gilbert, M. J., Soanes, D. M., & Talbot, N. J. (2004).Functional genomic analysis of the rice blast fungusMagnaporthe grisea. In D. K. Arora & G. G. Kha-chatourians (Eds.), Applied mycology and biotech-nology: Fungal genomics (Vol. 4, pp. 331–352).Amsterdam, Netherlands: Elsevier Science.
Henson, J., Butler, M., & Day, A. (1999). The dark side ofthe mycelium: Melanins and phytopathogenic fungi.Annual Review of Phytopathology, 37, 447–471.
Hohl, B., Weidemann, C., Hohl, U., & Barz, W. (1991).Isolation of solanapyrones A, B and C from culturefiltrates and spore germination fluids of Ascochytarabiei and aspects of phytotoxin action. Journal ofPhytopathology, 132, 193–206.
Kahmann, R., & Basse, C. (1999). REMI (Restrictionenzyme mediated integration) and its impact on theisolation of pathogenicity genes in fungi attackingplants. European Journal of Plant Pathology, 105,221–229.
Kaur, S. (1995). Phytotoxicity of solanapyrones producedby the fungus Ascochyta rabiei and their possible rolein blight of chickpea (Cicer arietinum). Plant Science109, 23–29.
Kawamura, C., Tsujimoto, T., & Tsuge, T. (1999). Tar-geted disruption of a melanin biosynthesis gene af-fects conidial development and UV tolerance in theJapanese pear pathotype of Alternaria alternata.Molecular Plant-Microbe Interactions, 12, 59–63.
Kohler, G., Linkert, C., & Barz, W. (1995). Infectionstudies of Cicer arietinum (L.) with GUS-(E. coli b-glucuronidase) transformed Ascochyta rabiei strains.Journal of Phytopathology, 143, 589–595.
Lu, S., Kroken, S., Lee, B. N., Robbertse, B., Churchill, A.,Yoder, O. C., & Turgeon, B. (2003). A novel class ofgene controlling virulence in plant pathogenic asco-mycete fungi. Proceedings of National Academy ofScience USA, 100, 5980–5985.
Eur J Plant Pathol (2007) 119:3–12 11
123
Michielse, C., Hooykaas, P., Cees, A., van den Hondel, J.,& Ram, A. (2005). Agrobacterium mediated trans-formation as a tool for functional genomics in fungi.Current Genetics, 48, 1–17.
Morgensen, E., Challen, M., & Strange, R. N. (2006).Reduction in solanapyrone phytotoxin production byAscochyta rabiei transformed with Agrobacteriumtumefaciens. FEMS Microbiology Letters, 255, 255–261.
Oliver, R., & Osborun, A. (1995). Molecular dissection offungal phyopathogenicity. Microbiology, 141, 1–9.
Peever, T. L. (2007). The role of host specificity in thespeciation of Ascochyta pathogens of cool seasonfood legumes. European Journal of Plant Pathology,117, (this special issue).
Peever, T. L., Barve, M. P., Stone, L. J., & Kaiser, W. J.(2007). Evolutionary relationships among Ascochytaspecies infecting wild and cultivated hosts in the le-gume tribes Cicereae and Vicereae. Mycologia, 99, (inpress).
Schoch, C. L., Aist, J. R., Yoder, O. C., & Turgeon, B. G.(2003). A complete inventory of fungal kinesins inrepresentative filamentous ascomycetes. FungalGenetics and Biology, 39, 1–15.
Steinberg, G., & Fuchs, U. (2004). The role of microtubl-ues in cellular organization and endocytosis in theplant pathogen Ustilago maydis. Journal of Micros-copy, 214, 114–123.
Straube, A., Hause, G., Fink, G., & Steinberg, G. (2006).Conventional kinesin mediates microtubule-microtu-bule interactions in vivo. Molecular Biology of theCell, 17, 907–916.
Talbot, N. J. (Ed.) (2004). Plant-pathogen interactions.Oxford, UK: Blackwell Publishing.
Taylor, P., & Ford, R. (2007). Biology of Ascochyta blightof cool season food and feed legumes. EuropeanJournal of Plant Pathology, 117, (this special issue).
Tenhaken, R., & Barz, W. (1991). Characterization ofpectic enzymes from the chickpea pathogen Asco-chyta rabiei. Verlag der Zeitschrift fur Naturforschung,46c, 51–57.
Tenhaken, R., Arnemann, M., Kohler, G., & Barz, W.(1997). Characterization and cloning of cutinase fromAscochyta rabiei. Verlag der Zeitschrift fur Naturf-orschung, 52c, 197–208.
Tivoli, B., & Banniza, S. (2007). Comparative epidemiol-ogy of ascochyta blight on grain legumes. EuropeanJournal of Plant Pathology, 117, (this special issue).
Trapero-Casas, A., & Kaiser, W. J. (1992). Developmentof Didymella rabiei, the telomorph of Ascochyta ra-biei, on chickpea straw. Phytopathology, 82, 1261–1266.
Walton, J. (1994). Deconstructing the plant cell wall. PlantPhysiology, 104, 1113–1118.
White, D., & Chen, W. (2006). Genetic transformation ofAscochyta rabiei using Agrobacterium-mediatedtransformation. Current Genetics, 49, 272–280.
Zhang, A., Lu, P., Dahl-Roshak, A. M., Paress, P. S.,Kennedy, S., Tkacz, J. S., & An, Z. (2003). Efficientdisruption of a polyketide synthase gene (pks1) re-quired for melanin synthesis through Agrobacterium-mediated transformation of Glarea lozoyensis.Molecular Genetics and Genomics, 268, 645–655.
12 Eur J Plant Pathol (2007) 119:3–12
123
FULL RESEARCH PAPER
Biotic factors affecting the expression of partial resistancein pea to ascochyta blight in a detached stipule assay
Caroline Onfroy Æ Alain Baranger Æ Bernard Tivoli
Received: 26 October 2006 / Accepted: 26 April 2007 / Published online: 23 May 2007
� KNPV 2007
Abstract The expression of partial resistance in pea
to ascochyta blight (caused by Mycosphaerella
pinodes) was studied in a detached stipule assay by
quantifying two resistance components (fleck coales-
cence and lesion expansion) using the method of
point inoculation of stipules. Factors determining
optimal conditions for the observation of partial
resistance are spore concentration, the age of the
fungal culture prior to spore harvest and the patho-
genicity of the isolate used for testing. Partial
resistance was not expressed when spore concentra-
tion was high or when the selected isolate was
aggressive. Furthermore, assessments of components
of partial resistance were highly correlated with
disease severity in a seedling test. A screening
protocol was developed based on inoculations of
detached stipules to study partial resistance in pea. To
simplify the rating process, a more comprehensive
disease rating scale which took into account fleck
coalescence and lesion expansion was tested by
screening a large number of genotypes.
Keywords Pisum sativum � Mycosphaerella
pinodes � Phoma medicaginis var. pinodella �Components of resistance � Fleck coalescence �Lesion extension � Screening test � Spore
concentration � Age of spores
Introduction
Ascochyta blight of pea (Pisum sativum) is caused by
three related fungal species, commonly referred to as
the Ascochyta complex: Ascochyta pisi, Ascochyta
pinodes (teleomorph: Mycosphaerella pinodes) and
Phoma medicaginis var. pinodella, formerly known
as Ascochyta pinodella (Jones 1927). Mycosphaerella
pinodes and P. medicaginis var. pinodella cause foot
rot, and similar symptoms on leaves, stems, pods and
seeds (Hare and Walker 1944) which can result in
substantial yield and seed quality losses in France
(Allard et al. 1993) and throughout the major pea
cropping regions worldwide (Bretag and Ramsey
2001). The first studies on pea resistance to M.
pinodes have shown the absence of specific resistance
(Nasir et al. 1992; Clulow et al. 1992). Most recent
studies on resistance to the ascochyta blight complex
in pea have described the observed resistance as
partial (Onfroy et al. 1999; Wroth and Khan 1999;
Wang et al. 2000; Xue and Warkentin 2001;
C. Onfroy � B. Tivoli (&)
UMR INRA-Agrocampus Rennes BiO3P, BP 35327,
35653 Le Rheu cedex, France
e-mail: [email protected]
C. Onfroy
Union Nationale Interprofessionnelle des Plantes riches en
Proteines (UNIP), 12 avenue George V, 75008 Paris,
France
A. Baranger
UMR INRA-Agrocampus Rennes APBV, BP 35327,
35653 Le Rheu cedex, France
123
Eur J Plant Pathol (2007) 119:13–27
DOI 10.1007/s10658-007-9153-5
Timmerman et al. 2002; Prioul et al. 2003, 2004;
Fondevilla et al. 2005). Partial disease resistance is
defined as an interference with one or more steps of
the epidemic cycle, resulting in a slow-down of
disease progress and/or a reduction in the pathogen
multiplication (Parlevliet 1979). The growth of the
pathogen can be assessed quantitatively both by
directly assessing disease severity (symptoms) and
disease development over time, or by considering
disease severity as the result of different factors
(Parlevliet 1979). These epidemiological components
of quantitative resistance include resistance to infec-
tion (i.e., reduced germination, appressorium forma-
tion or penetration), delayed incubation period (from
inoculation to the occurrence of the first symptoms),
delayed latency period (from inoculation to sporula-
tion), reduced infectious period (sporulation dura-
tion), and reduced intensity of spore production
(spore quantity per time unit).
Specific and reliable methodologies are needed for
the assessment of these components of resistance
under field or controlled conditions. The use of point
inoculation on leaflets, either detached or in situ
under controlled conditions, can be helpful in
dissecting plant reactions and for providing insight
into the different steps of the epidemic cycle. In the
Botrytis fabae/faba bean pathosystem, Tivoli et al.
(1986) used a detached leaf assay to determine three
main epidemic phases, namely appearance of symp-
toms (number of spots 15 h after inoculation, rate of
new spot formation), disease development (disease
severity score 6 days after inoculation), and
sporulation (number of spores/leaflet 11 days after
inoculation). More recently, Bouhassan et al. (2003),
using this methodology in the same pathosystem,
quantified five components of partial resistance: the
incubation period, the number of spots, lesion
diameter, the latency period and the intensity level
of sporulation.
Few references pertaining to the use of point
inoculation of leaves to study ascochyta blight on pea
are available. Heath and Wood (1969) used excised
leaves to determine the factors acting on the phases of
the epidemic cycles of M. pinodes and A. pisi (spore
concentration, leaf age, water content of the leaf).
This method has also been used to screen for cultivar
susceptibility and/or pathogenicity of isolates. Wang
et al. (2000), using excised leaves to study suscep-
tibility in pea to A. pisi, reported significant
isolate · genotype interactions. Based on point
inoculation of leaves in situ on plants, Nasir et al.
(1992) described the development of different M. pin-
odes pathotype groups in susceptible and partially
resistant pea genotypes. Wroth (1998a, b) also used
in situ inoculations to screen progeny families for
their resistance to M. pinodes, and to study variation
in pathogenicity among and within M. pinodes
populations.
To date, no study has specifically focused on
factors affecting the expression of partial resistance
to ascochyta blight in pea. We therefore carried out
experiments to identify which factors influence the
expression of partial resistance to M. pinodes and
P. medicaginis var pinodella in pea, and to determine
optimum screening conditions to achieve maximum
levels of differentiation among pea genotypes. We
focused our study on two main components of partial
resistance which are key factors in disease expres-
sion, namely fleck coalescence and lesion expansion.
Fleck coalescence takes into account the early stages
of interaction, from the inoculation to the first typical
necrotic symptom, corresponding to the hemibio-
trophic phase of the pathogen (Clulow et al. 1991),
where different mechanisms of resistance are
involved (Wroth 1998a). Lesion expansion reflects
the growth rate of the pathogen in the host during the
necrotrophic phase (Parlevliet 1979). A set of six
genotypes differing in their levels of susceptibility to
M. pinodes and P. medicaginis var. pinodella as
determined by Onfroy et al. (1999), was used to
define the effects of spore concentrations, fungal
colony age prior to harvest of spores, and pathoge-
nicity of isolates on these components of partial
resistance assessed on detached leaves. As a result, a
protocol is proposed for a reliable screening test to
identify and quantify partial resistance to ascochyta
blight in pea.
Materials and methods
Plant material
A set of six genotypes differing in their levels of
susceptibility to M. pinodes and P. medicaginis var.
pinodella (Onfroy et al. 1999) were used to test the
effect of different factors on the expression of
resistance. The germplasm line DP and the breeding
14 Eur J Plant Pathol (2007) 119:13–27
123
line FP (synonym CE101, Baranger et al. 2004) were
defined as having a high level of partial resistance.
The cv. Melrose was defined as partially resistant, the
germplasm line JI 252 and the field pea cv. Solara
(afila type) were found to be moderately susceptible,
and the line JI 296 (garden pea cv. Chemin long) was
highly susceptible. Seven other genotypes were
included to study the correlation between disease
reaction on detached stipules and seedlings, chosen
on the basis of screening results for plantlet or adult
plant resistance (Onfroy, unpublished results;
Baranger, unpublished results): breeding lines CP
and GP (synonym CF100, Baranger et al. 2004),
germplasm lines JI96, GSP935 (PI288025) and
GSP940a (PI343292), and winter pea cvs Champagne
and Froidure. Origin and morphology data for all
genotypes are described in Baranger et al. (2004),
except for GSP935 (PI288025) and GSP940a
(PI343292), which are described on the Pullman
genebank website (http://www.ars-grin.gov). Three
seeds of each genotype were planted in 9 cm diam
pots containing a mixture of unsterilised soil/sand/
peat (1:1:1). The soil originated from an experimental
plot at the INRA research centre in Le Rheu. Six
plants were used per genotype for the detached
stipule assays. The pots were placed in trays in a
growth chamber with a temperature of 158C night/
188C day and a 14 h photoperiod with a light
intensity of 160 ± 2 lEm�2s�1, until the plants
reached the 5–6 leaf stage. For the seedling test, plant
preparation and experimental design were carried out
according to Onfroy et al. (1999).
Production of inoculum
Three M. pinodes isolates (Mp1, Mp2, Mp3),
originating from different regions in France (Midi-
Pyrenees, Normandy, Champagne), were compared
for their effect on resistance expression to a P. med-
icaginis var. pinodella isolate (Pm1) originating from
the central region of France. Subcultures of the
isolates were taken from malt agar slants and grown
on V8 medium (99 ml V8 vegetable juice (Campbell,
France), 35 g agar, 801 ml distilled water, autoclaved
at 1058C for 30 min) under white light with a 12 h
photoperiod at 208C (wavelengths between 350 and
750 nm). Pycnidiospore suspensions were prepared
by flooding the surface of 10 day-old cultures with
sterile distilled water, gently scraping the colony with
a glass rod and filtering the suspension through two
layers of sterile cheesecloth (except for the experi-
ment testing the age of the spores where 7-, 10- and
14 day-old cultures were used). The concentration of
spores was determined with a haemocytometer and
was adjusted to the required spore concentration
(100, 500, 1000 and 5000 10 ml�1). Tween 20 (VWR
International SAS, Strasbourg, France) was added
as a wetting agent (two drops 500 ml�1 spore
suspension).
Inoculation and disease assessment on detached
leaflets and stipules
The inoculation method used was based on that
proposed by Heath and Wood (1969), consisting of
depositing a drop of spore suspension on detached
leaflets. Preliminary studies with the six genotypes
used by Onfroy et al. (1999) revealed that (1) the
reaction to ascochyta blight was identical on detached
leaflets and on detached stipules, (2) the largest range
between resistant and susceptible genotypes was
observed on stipules from nodes 2, 3 or 4 of seedlings
with 5–6 nodes (node 1 generally showed early
senescence), and (3) a drop of 10 ml was optimal for
inoculation (a drop of 5 ml evaporated too quickly, a
drop of 20 ml induced lesions too large for accurate
assessments). Short stem segments with attached
stipules (referred to as detached stipules hereafter)
from nodes 3 or 4 were used in all subsequent
experiments because the cv. Solara is semi-leafless,
and therefore lacks leaflets. After cutting, the
detached stipules were floated, lower surface down,
on tap water in a compartmented square Petri dish
(12 cm side, Gosselin, France). Inoculation was with
a drop of 10 ml of spore suspension placed on the
upper surface of the stipules, avoiding the main veins.
To avoid drop evaporation, Petri dishes were placed
into large transparent plastic boxes.
From the six plants per genotype, two stipules
were detached and inoculated each with a drop of the
spore suspension resulting in 12 replicate assessments
for each genotype. Detached stipules were incubated
in a climatic chamber for an initial period of 18 h in
the dark, followed subsequently by 7 days with a
continuous cycle of 14 h light and 10 h darkness at
208C. Symptom appearance on detached stipules was
assessed each day after inoculation (dai) using a 0–3
semi-quantitative scale (fleck coalescence scale):
Eur J Plant Pathol (2007) 119:13–27 15
123
0 = symptom-free; 1 = flecks appearing; 2 = flecks
covering half of the area of drop deposition; 3 = coa-
lescence of the flecks within the area of drop
deposition (approx. 3 mm).
Once necrosis had developed beyond the borders
of each drop deposit, disease progress was assessed
by measuring lesion diameter (mm) daily, with a
graduated ruler, and was summarized as Area Under
the Disease Progression Curve (AUDPC) calculated
by plotting mean disease expansion against time
according to the formulae proposed by Shaner and
Finney (1977). In addition, the 0–7 scale based on
different types of symptoms as described by Wroth
(1998a) was adapted to our experimental conditions
on detached stipules: 0 = symptom-free; 1 = flecks
appearing; 2 = flecks covering half of the drop
deposit; 3 = coalescence of the flecks in the area of
the drop deposit (approx. 3 mm diam); 4 = 3–6 mm
lesion diam; 5 = 6–9 mm lesion diam; 6 = 9–12 mm
lesion diam, 7 = superior to 12mn lesion diam.
Inoculation and disease assessment on plantlets
Inoculation of seedlings by spraying spore suspen-
sions of M. pinodes or P. medicaginis var pinodella
was conducted as described by Onfroy et al. (1999).
A spore suspension of 105 spores ml�1 was applied to
plants at the 4–5 leaf stage using a hand-held garden
sprayer and plants were incubated under a continuous
cycle of 14 h at 188C in light and 10 h at 158C in
darkness. Disease severity was assessed daily after
inoculation using a 0–5 disease scale described
previously (Onfroy et al. 1999). AUDPC was calcu-
lated using the formula proposed by Shaner and
Finney (1977).
Data analysis
The effect of various factors on fleck coalescence and
lesion expansion (including AUDPC) were analysed
by ANOVA using the General Linear Model (GLM)
procedure of the statistical package SAS version 8.1
(SAS 1988). The Student Newman-Keul’s test
(P = 0.05) was used to determine whether differences
between plant genotypes, between fungal species or
between isolates were statistically significant. Rela-
tionships between scoring criteria were tested by
Pearson correlation analysis (SAS 1988).
Results
Effect of spore concentrations
The effect of inoculum pressure on partial resistance
expression was investigated by inoculating detached
stipules with different numbers of spores per drop:
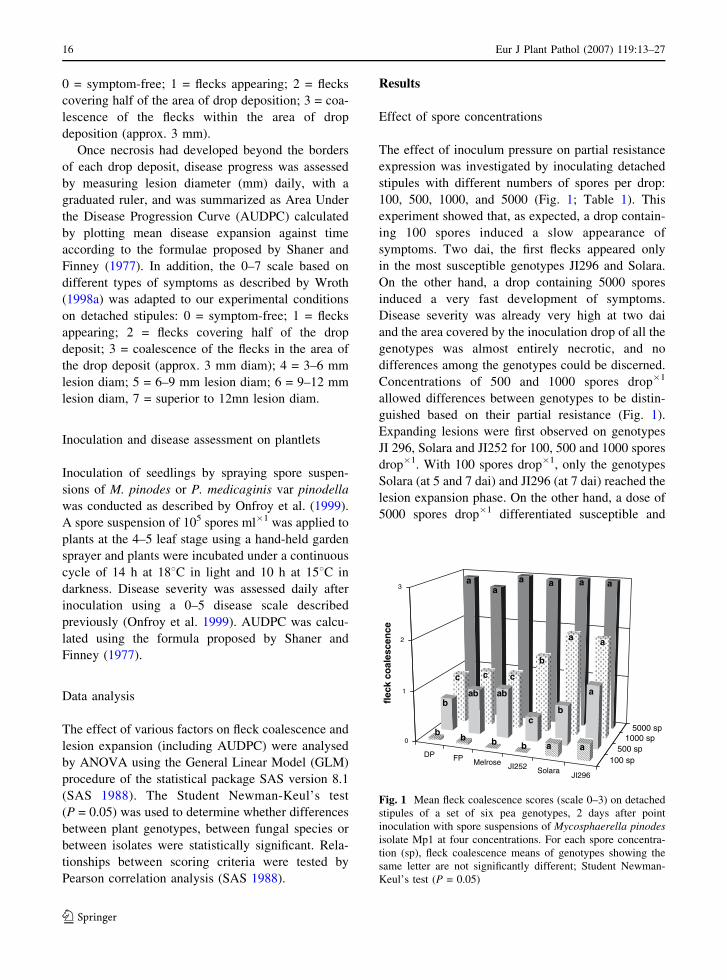
100, 500, 1000, and 5000 (Fig. 1; Table 1). This
experiment showed that, as expected, a drop contain-
ing 100 spores induced a slow appearance of
symptoms. Two dai, the first flecks appeared only
in the most susceptible genotypes JI296 and Solara.
On the other hand, a drop containing 5000 spores
induced a very fast development of symptoms.
Disease severity was already very high at two dai
and the area covered by the inoculation drop of all the
genotypes was almost entirely necrotic, and no
differences among the genotypes could be discerned.
Concentrations of 500 and 1000 spores drop�1
allowed differences between genotypes to be distin-
guished based on their partial resistance (Fig. 1).
Expanding lesions were first observed on genotypes
JI 296, Solara and JI252 for 100, 500 and 1000 spores
drop�1. With 100 spores drop�1, only the genotypes
Solara (at 5 and 7 dai) and JI296 (at 7 dai) reached the
lesion expansion phase. On the other hand, a dose of
5000 spores drop�1 differentiated susceptible and
DP FP Melrose JI252 SolaraJI296
100 sp500 sp
1000 sp5000 sp
aa
a a a a
c c c
b
a a
bab ab
cb
a
bb b b a a
0
1
2
3
flec
k co
ales
cen
ce
Fig. 1 Mean fleck coalescence scores (scale 0–3) on detached
stipules of a set of six pea genotypes, 2 days after point
inoculation with spore suspensions of Mycosphaerella pinodesisolate Mp1 at four concentrations. For each spore concentra-
tion (sp), fleck coalescence means of genotypes showing the
same letter are not significantly different; Student Newman-
Keul’s test (P = 0.05)
16 Eur J Plant Pathol (2007) 119:13–27
123
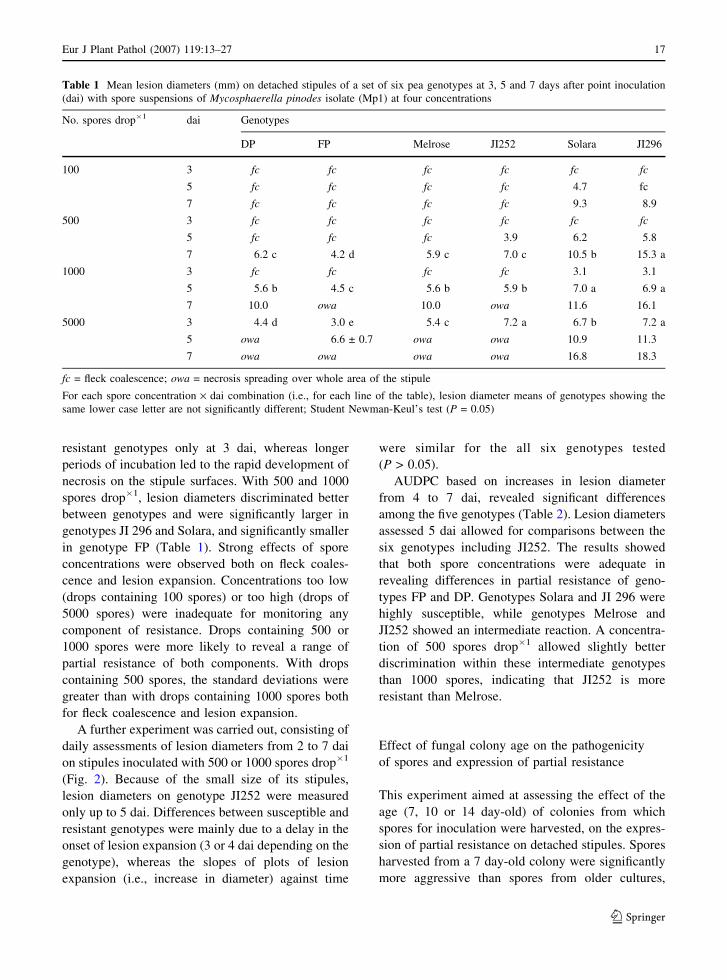
resistant genotypes only at 3 dai, whereas longer
periods of incubation led to the rapid development of
necrosis on the stipule surfaces. With 500 and 1000
spores drop�1, lesion diameters discriminated better
between genotypes and were significantly larger in
genotypes JI 296 and Solara, and significantly smaller
in genotype FP (Table 1). Strong effects of spore
concentrations were observed both on fleck coales-
cence and lesion expansion. Concentrations too low
(drops containing 100 spores) or too high (drops of
5000 spores) were inadequate for monitoring any
component of resistance. Drops containing 500 or
1000 spores were more likely to reveal a range of
partial resistance of both components. With drops
containing 500 spores, the standard deviations were
greater than with drops containing 1000 spores both
for fleck coalescence and lesion expansion.
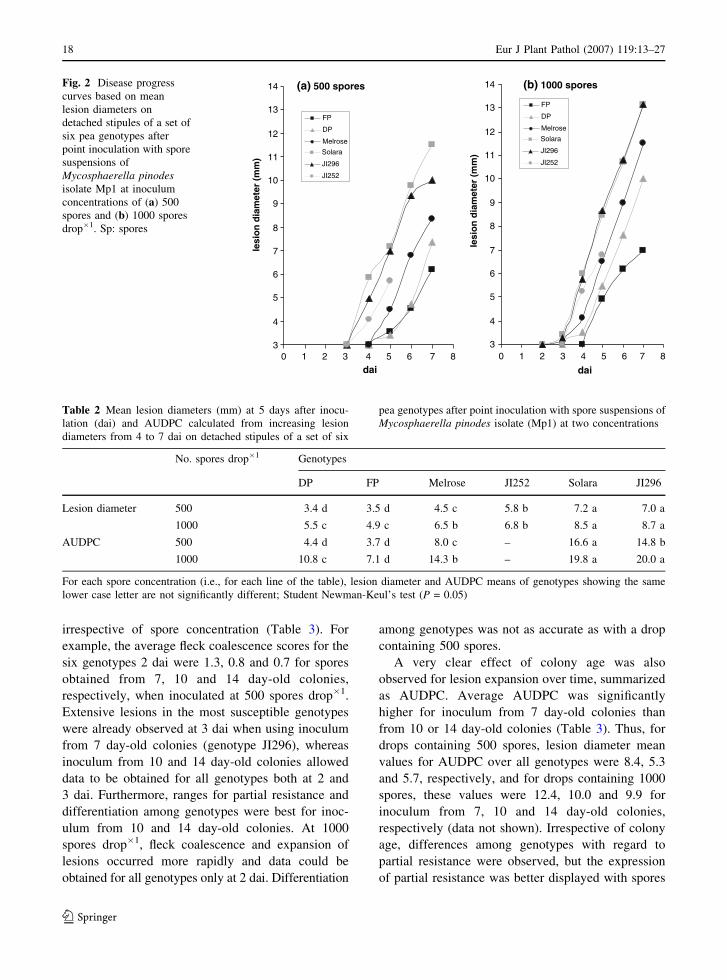
A further experiment was carried out, consisting of
daily assessments of lesion diameters from 2 to 7 dai
on stipules inoculated with 500 or 1000 spores drop�1
(Fig. 2). Because of the small size of its stipules,
lesion diameters on genotype JI252 were measured
only up to 5 dai. Differences between susceptible and
resistant genotypes were mainly due to a delay in the
onset of lesion expansion (3 or 4 dai depending on the
genotype), whereas the slopes of plots of lesion
expansion (i.e., increase in diameter) against time
were similar for the all six genotypes tested
(P > 0.05).
AUDPC based on increases in lesion diameter
from 4 to 7 dai, revealed significant differences
among the five genotypes (Table 2). Lesion diameters
assessed 5 dai allowed for comparisons between the
six genotypes including JI252. The results showed
that both spore concentrations were adequate in
revealing differences in partial resistance of geno-
types FP and DP. Genotypes Solara and JI 296 were
highly susceptible, while genotypes Melrose and
JI252 showed an intermediate reaction. A concentra-
tion of 500 spores drop�1 allowed slightly better
discrimination within these intermediate genotypes
than 1000 spores, indicating that JI252 is more
resistant than Melrose.
Effect of fungal colony age on the pathogenicity
of spores and expression of partial resistance
This experiment aimed at assessing the effect of the
age (7, 10 or 14 day-old) of colonies from which
spores for inoculation were harvested, on the expres-
sion of partial resistance on detached stipules. Spores
harvested from a 7 day-old colony were significantly
more aggressive than spores from older cultures,
Table 1 Mean lesion diameters (mm) on detached stipules of a set of six pea genotypes at 3, 5 and 7 days after point inoculation
(dai) with spore suspensions of Mycosphaerella pinodes isolate (Mp1) at four concentrations
No. spores drop�1 dai Genotypes
DP FP Melrose JI252 Solara JI296
100 3 fc fc fc fc fc fc
5 fc fc fc fc 4.7 fc
7 fc fc fc fc 9.3 8.9
500 3 fc fc fc fc fc fc
5 fc fc fc 3.9 6.2 5.8
7 6.2 c 4.2 d 5.9 c 7.0 c 10.5 b 15.3 a
1000 3 fc fc fc fc 3.1 3.1
5 5.6 b 4.5 c 5.6 b 5.9 b 7.0 a 6.9 a
7 10.0 owa 10.0 owa 11.6 16.1
5000 3 4.4 d 3.0 e 5.4 c 7.2 a 6.7 b 7.2 a
5 owa 6.6 ± 0.7 owa owa 10.9 11.3
7 owa owa owa owa 16.8 18.3
fc = fleck coalescence; owa = necrosis spreading over whole area of the stipule
For each spore concentration · dai combination (i.e., for each line of the table), lesion diameter means of genotypes showing the
same lower case letter are not significantly different; Student Newman-Keul’s test (P = 0.05)
Eur J Plant Pathol (2007) 119:13–27 17
123
irrespective of spore concentration (Table 3). For
example, the average fleck coalescence scores for the
six genotypes 2 dai were 1.3, 0.8 and 0.7 for spores
obtained from 7, 10 and 14 day-old colonies,
respectively, when inoculated at 500 spores drop�1.
Extensive lesions in the most susceptible genotypes
were already observed at 3 dai when using inoculum
from 7 day-old colonies (genotype JI296), whereas
inoculum from 10 and 14 day-old colonies allowed
data to be obtained for all genotypes both at 2 and
3 dai. Furthermore, ranges for partial resistance and
differentiation among genotypes were best for inoc-
ulum from 10 and 14 day-old colonies. At 1000
spores drop�1, fleck coalescence and expansion of
lesions occurred more rapidly and data could be
obtained for all genotypes only at 2 dai. Differentiation
among genotypes was not as accurate as with a drop
containing 500 spores.
A very clear effect of colony age was also
observed for lesion expansion over time, summarized
as AUDPC. Average AUDPC was significantly
higher for inoculum from 7 day-old colonies than
from 10 or 14 day-old colonies (Table 3). Thus, for
drops containing 500 spores, lesion diameter mean
values for AUDPC over all genotypes were 8.4, 5.3
and 5.7, respectively, and for drops containing 1000
spores, these values were 12.4, 10.0 and 9.9 for
inoculum from 7, 10 and 14 day-old colonies,
respectively (data not shown). Irrespective of colony
age, differences among genotypes with regard to
partial resistance were observed, but the expression
of partial resistance was better displayed with spores
(a) 500 spores
3
4
5
6
7
8
9
10
11
12
13
14
dai
FP
DP
Melrose
Solara
JI296
JI252
(b) 1000 spores
3
4
5
6
7
8
9
10
11
12
13
14
0 1 2 3 4 5 6 7 80 1 2 3 4 5 6 7 8
dai
lesi
on
dia
met
er (
mm
)
lesi
on
dia
met
er (
mm
)
FP
DP
Melrose
Solara
JI296
JI252
Fig. 2 Disease progress
curves based on mean
lesion diameters on
detached stipules of a set of
six pea genotypes after
point inoculation with spore
suspensions of
Mycosphaerella pinodesisolate Mp1 at inoculum
concentrations of (a) 500
spores and (b) 1000 spores
drop�1. Sp: spores
Table 2 Mean lesion diameters (mm) at 5 days after inocu-
lation (dai) and AUDPC calculated from increasing lesion
diameters from 4 to 7 dai on detached stipules of a set of six
pea genotypes after point inoculation with spore suspensions of
Mycosphaerella pinodes isolate (Mp1) at two concentrations
No. spores drop�1 Genotypes
DP FP Melrose JI252 Solara JI296
Lesion diameter 500 3.4 d 3.5 d 4.5 c 5.8 b 7.2 a 7.0 a
1000 5.5 c 4.9 c 6.5 b 6.8 b 8.5 a 8.7 a
AUDPC 500 4.4 d 3.7 d 8.0 c – 16.6 a 14.8 b
1000 10.8 c 7.1 d 14.3 b – 19.8 a 20.0 a
For each spore concentration (i.e., for each line of the table), lesion diameter and AUDPC means of genotypes showing the same
lower case letter are not significantly different; Student Newman-Keul’s test (P = 0.05)
18 Eur J Plant Pathol (2007) 119:13–27
123
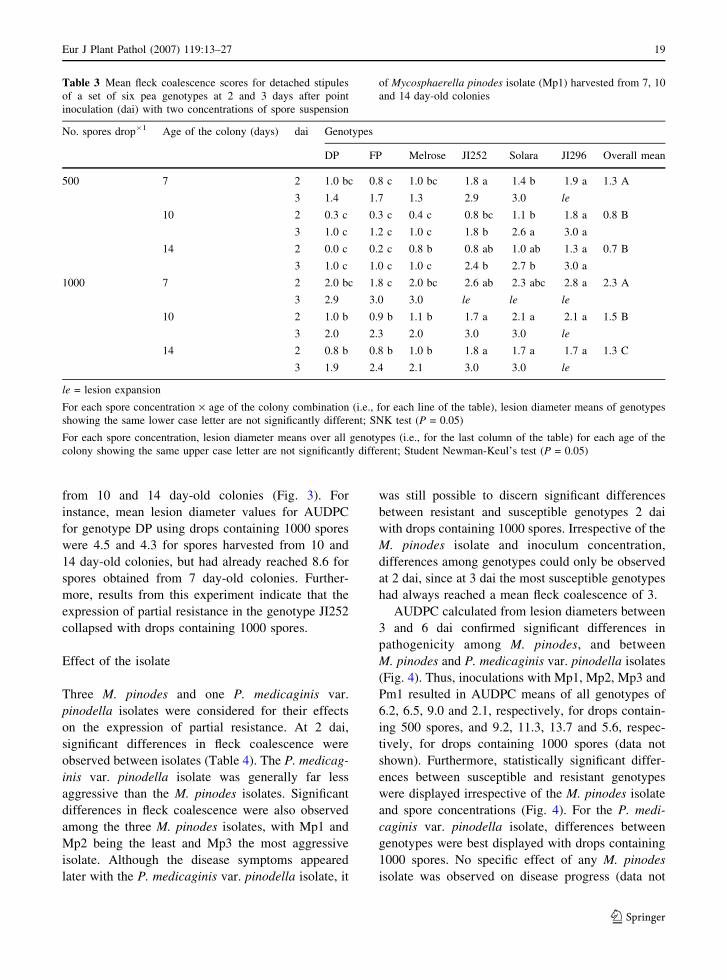
from 10 and 14 day-old colonies (Fig. 3). For
instance, mean lesion diameter values for AUDPC
for genotype DP using drops containing 1000 spores
were 4.5 and 4.3 for spores harvested from 10 and
14 day-old colonies, but had already reached 8.6 for
spores obtained from 7 day-old colonies. Further-
more, results from this experiment indicate that the
expression of partial resistance in the genotype JI252
collapsed with drops containing 1000 spores.
Effect of the isolate
Three M. pinodes and one P. medicaginis var.
pinodella isolates were considered for their effects
on the expression of partial resistance. At 2 dai,
significant differences in fleck coalescence were
observed between isolates (Table 4). The P. medicag-
inis var. pinodella isolate was generally far less
aggressive than the M. pinodes isolates. Significant
differences in fleck coalescence were also observed
among the three M. pinodes isolates, with Mp1 and
Mp2 being the least and Mp3 the most aggressive
isolate. Although the disease symptoms appeared
later with the P. medicaginis var. pinodella isolate, it
was still possible to discern significant differences
between resistant and susceptible genotypes 2 dai
with drops containing 1000 spores. Irrespective of the
M. pinodes isolate and inoculum concentration,
differences among genotypes could only be observed
at 2 dai, since at 3 dai the most susceptible genotypes
had always reached a mean fleck coalescence of 3.
AUDPC calculated from lesion diameters between
3 and 6 dai confirmed significant differences in
pathogenicity among M. pinodes, and between
M. pinodes and P. medicaginis var. pinodella isolates
(Fig. 4). Thus, inoculations with Mp1, Mp2, Mp3 and
Pm1 resulted in AUDPC means of all genotypes of
6.2, 6.5, 9.0 and 2.1, respectively, for drops contain-
ing 500 spores, and 9.2, 11.3, 13.7 and 5.6, respec-
tively, for drops containing 1000 spores (data not
shown). Furthermore, statistically significant differ-
ences between susceptible and resistant genotypes
were displayed irrespective of the M. pinodes isolate
and spore concentrations (Fig. 4). For the P. medi-
caginis var. pinodella isolate, differences between
genotypes were best displayed with drops containing
1000 spores. No specific effect of any M. pinodes
isolate was observed on disease progress (data not
Table 3 Mean fleck coalescence scores for detached stipules
of a set of six pea genotypes at 2 and 3 days after point
inoculation (dai) with two concentrations of spore suspension
of Mycosphaerella pinodes isolate (Mp1) harvested from 7, 10
and 14 day-old colonies
No. spores drop�1 Age of the colony (days) dai Genotypes
DP FP Melrose JI252 Solara JI296 Overall mean
500 7 2 1.0 bc 0.8 c 1.0 bc 1.8 a 1.4 b 1.9 a 1.3 A
3 1.4 1.7 1.3 2.9 3.0 le
10 2 0.3 c 0.3 c 0.4 c 0.8 bc 1.1 b 1.8 a 0.8 B
3 1.0 c 1.2 c 1.0 c 1.8 b 2.6 a 3.0 a
14 2 0.0 c 0.2 c 0.8 b 0.8 ab 1.0 ab 1.3 a 0.7 B
3 1.0 c 1.0 c 1.0 c 2.4 b 2.7 b 3.0 a
1000 7 2 2.0 bc 1.8 c 2.0 bc 2.6 ab 2.3 abc 2.8 a 2.3 A
3 2.9 3.0 3.0 le le le
10 2 1.0 b 0.9 b 1.1 b 1.7 a 2.1 a 2.1 a 1.5 B
3 2.0 2.3 2.0 3.0 3.0 le
14 2 0.8 b 0.8 b 1.0 b 1.8 a 1.7 a 1.7 a 1.3 C
3 1.9 2.4 2.1 3.0 3.0 le
le = lesion expansion
For each spore concentration · age of the colony combination (i.e., for each line of the table), lesion diameter means of genotypes
showing the same lower case letter are not significantly different; SNK test (P = 0.05)
For each spore concentration, lesion diameter means over all genotypes (i.e., for the last column of the table) for each age of the
colony showing the same upper case letter are not significantly different; Student Newman-Keul’s test (P = 0.05)
Eur J Plant Pathol (2007) 119:13–27 19
123
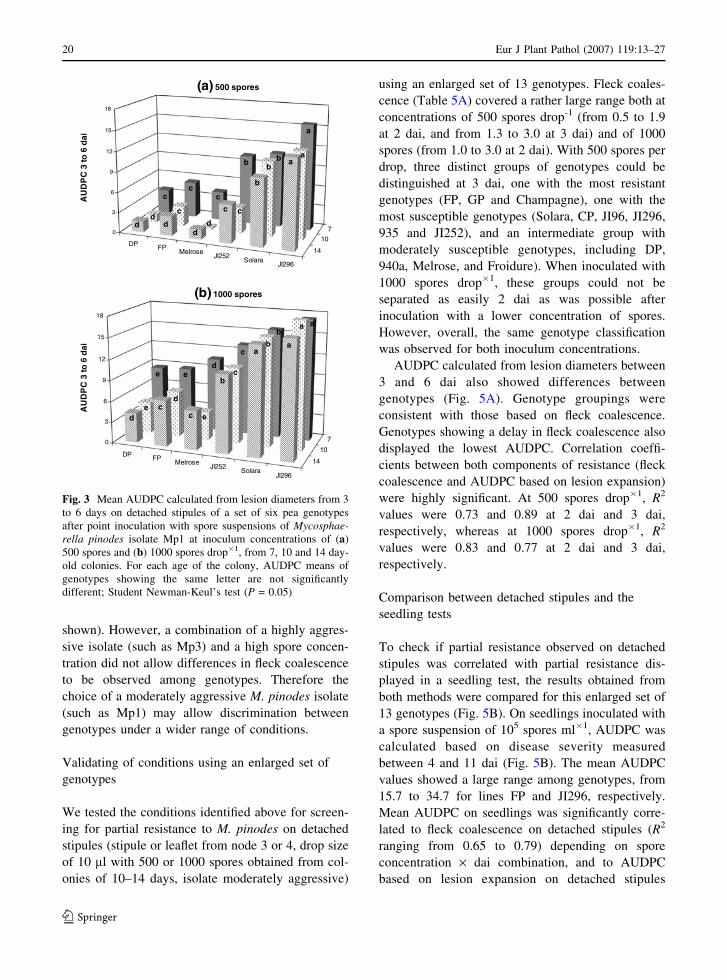
shown). However, a combination of a highly aggres-
sive isolate (such as Mp3) and a high spore concen-
tration did not allow differences in fleck coalescence
to be observed among genotypes. Therefore the
choice of a moderately aggressive M. pinodes isolate
(such as Mp1) may allow discrimination between
genotypes under a wider range of conditions.
Validating of conditions using an enlarged set of
genotypes
We tested the conditions identified above for screen-
ing for partial resistance to M. pinodes on detached
stipules (stipule or leaflet from node 3 or 4, drop size
of 10 ml with 500 or 1000 spores obtained from col-
onies of 10–14 days, isolate moderately aggressive)
using an enlarged set of 13 genotypes. Fleck coales-
cence (Table 5A) covered a rather large range both at
concentrations of 500 spores drop-1 (from 0.5 to 1.9
at 2 dai, and from 1.3 to 3.0 at 3 dai) and of 1000
spores (from 1.0 to 3.0 at 2 dai). With 500 spores per
drop, three distinct groups of genotypes could be
distinguished at 3 dai, one with the most resistant
genotypes (FP, GP and Champagne), one with the
most susceptible genotypes (Solara, CP, JI96, JI296,
935 and JI252), and an intermediate group with
moderately susceptible genotypes, including DP,
940a, Melrose, and Froidure). When inoculated with
1000 spores drop�1, these groups could not be
separated as easily 2 dai as was possible after
inoculation with a lower concentration of spores.
However, overall, the same genotype classification
was observed for both inoculum concentrations.
AUDPC calculated from lesion diameters between
3 and 6 dai also showed differences between
genotypes (Fig. 5A). Genotype groupings were
consistent with those based on fleck coalescence.
Genotypes showing a delay in fleck coalescence also
displayed the lowest AUDPC. Correlation coeffi-
cients between both components of resistance (fleck
coalescence and AUDPC based on lesion expansion)
were highly significant. At 500 spores drop�1, R2
values were 0.73 and 0.89 at 2 dai and 3 dai,
respectively, whereas at 1000 spores drop�1, R2
values were 0.83 and 0.77 at 2 dai and 3 dai,
respectively.
Comparison between detached stipules and the
seedling tests
To check if partial resistance observed on detached
stipules was correlated with partial resistance dis-
played in a seedling test, the results obtained from
both methods were compared for this enlarged set of
13 genotypes (Fig. 5B). On seedlings inoculated with
a spore suspension of 105 spores ml�1, AUDPC was
calculated based on disease severity measured
between 4 and 11 dai (Fig. 5B). The mean AUDPC
values showed a large range among genotypes, from
15.7 to 34.7 for lines FP and JI296, respectively.
Mean AUDPC on seedlings was significantly corre-
lated to fleck coalescence on detached stipules (R2
ranging from 0.65 to 0.79) depending on spore
concentration · dai combination, and to AUDPC
based on lesion expansion on detached stipules
DP FPMelrose
JI252Solara
JI296
14
10
7
cc
c
b b
a
dc
d
c
b
a
d dd
c
b
a
0
3
6
9
12
15
18
iad
6ot
3C
PD
UA
(a) 500 spores
DP FPMelrose
JI252Solara
JI296
14
10
7
e ed
c
ba
ed
e
c
b
a
dc
c
b
aa
0
3
6
9
12
15
18
iad
6ot
3C
PD
UA
(b) 1000 spores
Fig. 3 Mean AUDPC calculated from lesion diameters from 3
to 6 days on detached stipules of a set of six pea genotypes
after point inoculation with spore suspensions of Mycosphae-rella pinodes isolate Mp1 at inoculum concentrations of (a)
500 spores and (b) 1000 spores drop�1, from 7, 10 and 14 day-
old colonies. For each age of the colony, AUDPC means of
genotypes showing the same letter are not significantly
different; Student Newman-Keul’s test (P = 0.05)
20 Eur J Plant Pathol (2007) 119:13–27
123
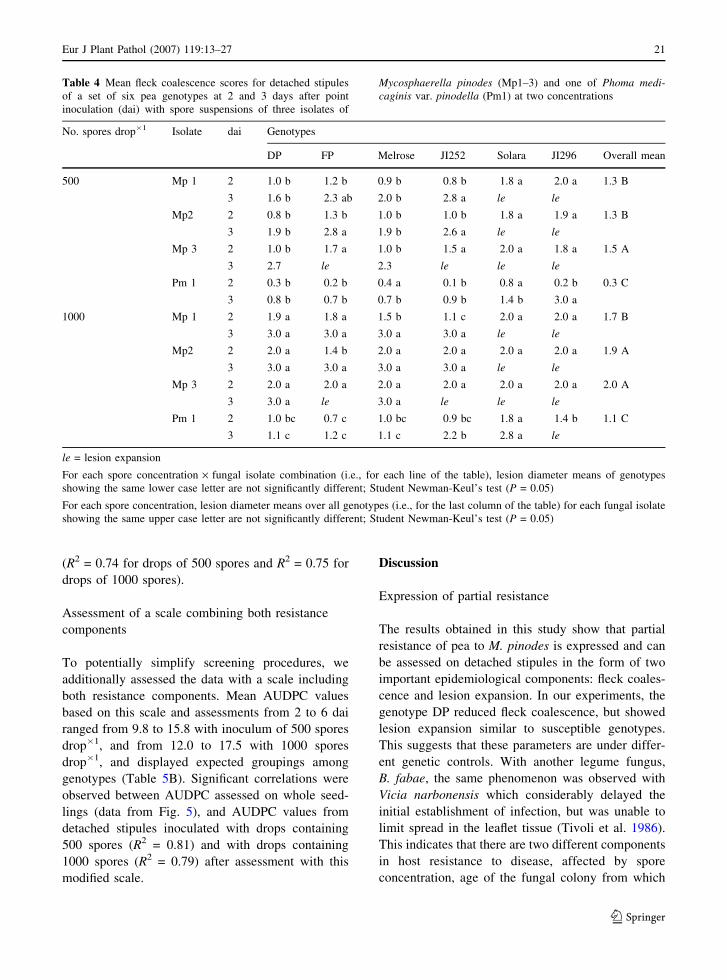
(R2 = 0.74 for drops of 500 spores and R2 = 0.75 for
drops of 1000 spores).
Assessment of a scale combining both resistance
components
To potentially simplify screening procedures, we
additionally assessed the data with a scale including
both resistance components. Mean AUDPC values
based on this scale and assessments from 2 to 6 dai
ranged from 9.8 to 15.8 with inoculum of 500 spores
drop�1, and from 12.0 to 17.5 with 1000 spores
drop�1, and displayed expected groupings among
genotypes (Table 5B). Significant correlations were
observed between AUDPC assessed on whole seed-
lings (data from Fig. 5), and AUDPC values from
detached stipules inoculated with drops containing
500 spores (R2 = 0.81) and with drops containing
1000 spores (R2 = 0.79) after assessment with this
modified scale.
Discussion
Expression of partial resistance
The results obtained in this study show that partial
resistance of pea to M. pinodes is expressed and can
be assessed on detached stipules in the form of two
important epidemiological components: fleck coales-
cence and lesion expansion. In our experiments, the
genotype DP reduced fleck coalescence, but showed
lesion expansion similar to susceptible genotypes.
This suggests that these parameters are under differ-
ent genetic controls. With another legume fungus,
B. fabae, the same phenomenon was observed with
Vicia narbonensis which considerably delayed the
initial establishment of infection, but was unable to
limit spread in the leaflet tissue (Tivoli et al. 1986).
This indicates that there are two different components
in host resistance to disease, affected by spore
concentration, age of the fungal colony from which
Table 4 Mean fleck coalescence scores for detached stipules
of a set of six pea genotypes at 2 and 3 days after point
inoculation (dai) with spore suspensions of three isolates of
Mycosphaerella pinodes (Mp1–3) and one of Phoma medi-caginis var. pinodella (Pm1) at two concentrations
No. spores drop�1 Isolate dai Genotypes
DP FP Melrose JI252 Solara JI296 Overall mean
500 Mp 1 2 1.0 b 1.2 b 0.9 b 0.8 b 1.8 a 2.0 a 1.3 B
3 1.6 b 2.3 ab 2.0 b 2.8 a le le
Mp2 2 0.8 b 1.3 b 1.0 b 1.0 b 1.8 a 1.9 a 1.3 B
3 1.9 b 2.8 a 1.9 b 2.6 a le le
Mp 3 2 1.0 b 1.7 a 1.0 b 1.5 a 2.0 a 1.8 a 1.5 A
3 2.7 le 2.3 le le le
Pm 1 2 0.3 b 0.2 b 0.4 a 0.1 b 0.8 a 0.2 b 0.3 C
3 0.8 b 0.7 b 0.7 b 0.9 b 1.4 b 3.0 a
1000 Mp 1 2 1.9 a 1.8 a 1.5 b 1.1 c 2.0 a 2.0 a 1.7 B
3 3.0 a 3.0 a 3.0 a 3.0 a le le
Mp2 2 2.0 a 1.4 b 2.0 a 2.0 a 2.0 a 2.0 a 1.9 A
3 3.0 a 3.0 a 3.0 a 3.0 a le le
Mp 3 2 2.0 a 2.0 a 2.0 a 2.0 a 2.0 a 2.0 a 2.0 A
3 3.0 a le 3.0 a le le le
Pm 1 2 1.0 bc 0.7 c 1.0 bc 0.9 bc 1.8 a 1.4 b 1.1 C
3 1.1 c 1.2 c 1.1 c 2.2 b 2.8 a le
le = lesion expansion
For each spore concentration · fungal isolate combination (i.e., for each line of the table), lesion diameter means of genotypes
showing the same lower case letter are not significantly different; Student Newman-Keul’s test (P = 0.05)
For each spore concentration, lesion diameter means over all genotypes (i.e., for the last column of the table) for each fungal isolate
showing the same upper case letter are not significantly different; Student Newman-Keul’s test (P = 0.05)
Eur J Plant Pathol (2007) 119:13–27 21
123
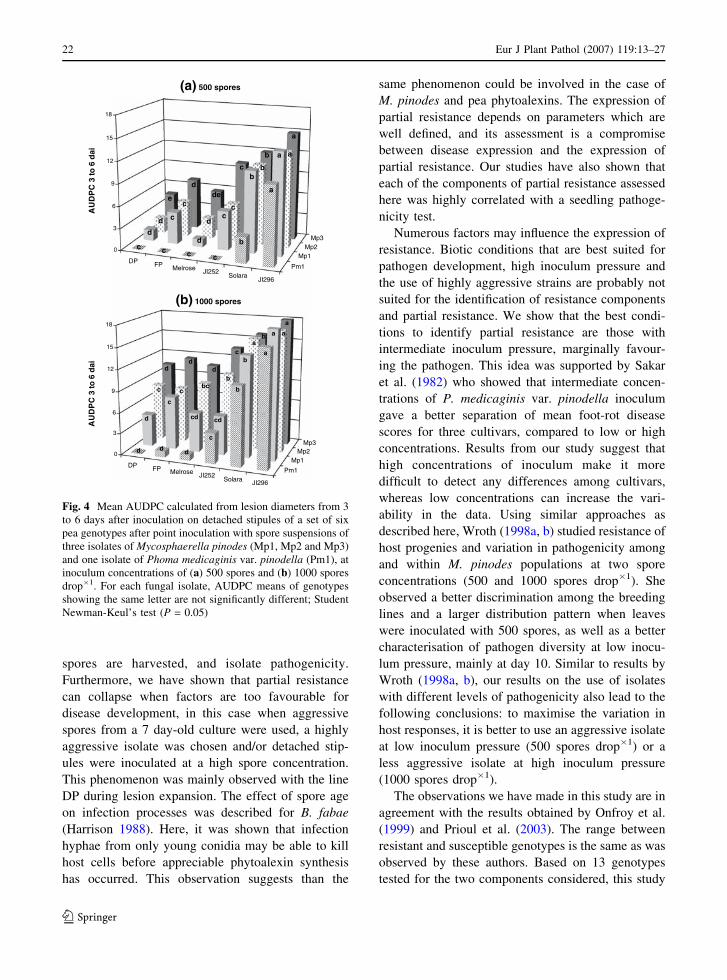
spores are harvested, and isolate pathogenicity.
Furthermore, we have shown that partial resistance
can collapse when factors are too favourable for
disease development, in this case when aggressive
spores from a 7 day-old culture were used, a highly
aggressive isolate was chosen and/or detached stip-
ules were inoculated at a high spore concentration.
This phenomenon was mainly observed with the line
DP during lesion expansion. The effect of spore age
on infection processes was described for B. fabae
(Harrison 1988). Here, it was shown that infection
hyphae from only young conidia may be able to kill
host cells before appreciable phytoalexin synthesis
has occurred. This observation suggests than the
same phenomenon could be involved in the case of
M. pinodes and pea phytoalexins. The expression of
partial resistance depends on parameters which are
well defined, and its assessment is a compromise
between disease expression and the expression of
partial resistance. Our studies have also shown that
each of the components of partial resistance assessed
here was highly correlated with a seedling pathoge-
nicity test.
Numerous factors may influence the expression of
resistance. Biotic conditions that are best suited for
pathogen development, high inoculum pressure and
the use of highly aggressive strains are probably not
suited for the identification of resistance components
and partial resistance. We show that the best condi-
tions to identify partial resistance are those with
intermediate inoculum pressure, marginally favour-
ing the pathogen. This idea was supported by Sakar
et al. (1982) who showed that intermediate concen-
trations of P. medicaginis var. pinodella inoculum
gave a better separation of mean foot-rot disease
scores for three cultivars, compared to low or high
concentrations. Results from our study suggest that
high concentrations of inoculum make it more
difficult to detect any differences among cultivars,
whereas low concentrations can increase the vari-
ability in the data. Using similar approaches as
described here, Wroth (1998a, b) studied resistance of
host progenies and variation in pathogenicity among
and within M. pinodes populations at two spore
concentrations (500 and 1000 spores drop�1). She
observed a better discrimination among the breeding
lines and a larger distribution pattern when leaves
were inoculated with 500 spores, as well as a better
characterisation of pathogen diversity at low inocu-
lum pressure, mainly at day 10. Similar to results by
Wroth (1998a, b), our results on the use of isolates
with different levels of pathogenicity also lead to the
following conclusions: to maximise the variation in
host responses, it is better to use an aggressive isolate
at low inoculum pressure (500 spores drop�1) or a
less aggressive isolate at high inoculum pressure
(1000 spores drop�1).
The observations we have made in this study are in
agreement with the results obtained by Onfroy et al.
(1999) and Prioul et al. (2003). The range between
resistant and susceptible genotypes is the same as was
observed by these authors. Based on 13 genotypes
tested for the two components considered, this study
DP FP Melrose JI252Solara
JI296
Pm1
Mp1Mp2
Mp3
e
dde
c
b
a
d
c
d
c
b
a
d
c
d
c
b
a
c c c c
b
a
0
3
6
9
12
15
18
iad
6ot
3C
PD
UA
(a) 500 spores
DP FP Melrose JI252Solara JI296
Pm1
Mp1Mp2
Mp3
dd
d
c
b
a
c cbc
b
aa
d
c
cd cd
b
a
d d d
c
b
a
0
3
6
9
12
15
18
iad
6ot
3C
PD
UA
(b) 1000 spores
Fig. 4 Mean AUDPC calculated from lesion diameters from 3
to 6 days after inoculation on detached stipules of a set of six
pea genotypes after point inoculation with spore suspensions of
three isolates of Mycosphaerella pinodes (Mp1, Mp2 and Mp3)
and one isolate of Phoma medicaginis var. pinodella (Pm1), at
inoculum concentrations of (a) 500 spores and (b) 1000 spores
drop�1. For each fungal isolate, AUDPC means of genotypes
showing the same letter are not significantly different; Student
Newman-Keul’s test (P = 0.05)
22 Eur J Plant Pathol (2007) 119:13–27
123
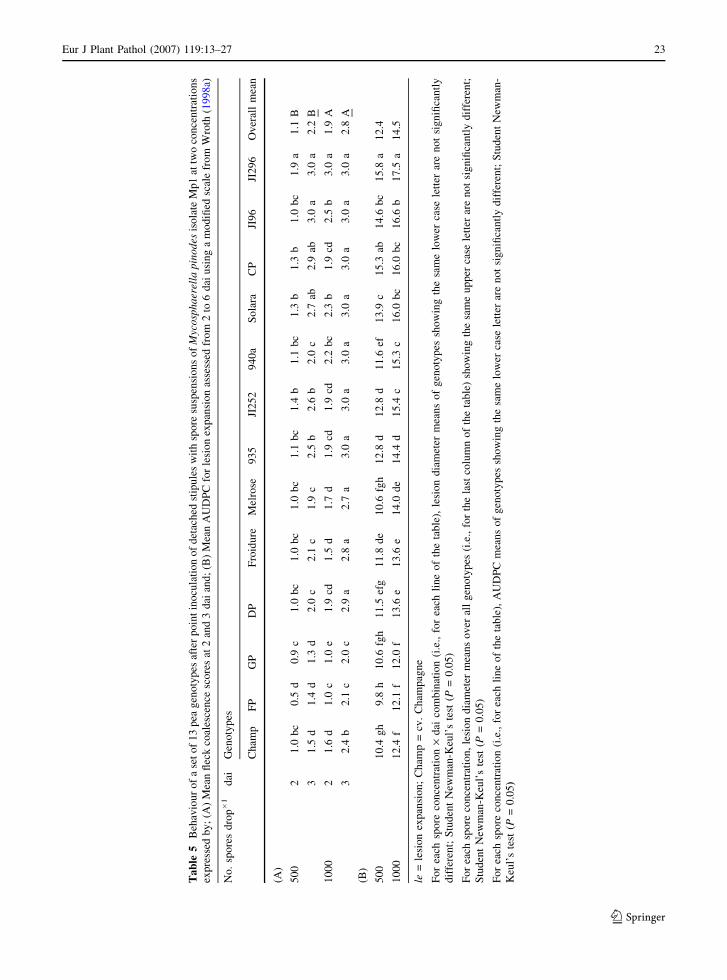
Ta
ble
5B
ehav
iou
ro
fa
set
of
13
pea
gen
oty
pes
afte
rp
oin
tin
ocu
lati
on
of
det
ach
edst
ipu
les
wit
hsp
ore
susp
ensi
on
so
fM
yco
sph
aer
ella
pin
od
esis
ola
teM
p1
attw
oco
nce
ntr
atio
ns
exp
ress
edb
y;
(A)
Mea
nfl
eck
coal
esce
nce
sco
res
at2
and
3d
aian
d;
(B)
Mea
nA
UD
PC
for
lesi
on
exp
ansi
on
asse
ssed
fro
m2
to6
dai
usi
ng
am
od
ified
scal
efr
om
Wro
th(1
99
8a)
No
.sp
ore
sd
rop�
1d
aiG
eno
typ
es
Ch
amp
FP
GP
DP
Fro
idu
reM
elro
se9
35
JI2
52
94
0a
So
lara
CP
JI9
6JI
29
6O
ver
all
mea
n
(A)
50
02
1.0
bc
0.5
d0
.9c
1.0
bc
1.0
bc
1.0
bc
1.1
bc
1.4
b1
.1b
c1
.3b
1.3
b1
.0b
c1
.9a
1.1
B
31
.5d
1.4
d1
.3d
2.0
c2
.1c
1.9
c2
.5b
2.6
b2
.0c
2.7
ab2
.9ab
3.0
a3
.0a
2.2
B
10
00
21
.6d
1.0
c1
.0e
1.9
cd1
.5d
1.7
d1
.9cd
1.9
cd2
.2b
c2
.3b
1.9
cd2
.5b
3.0
a1
.9A
32
.4b
2.1
c2
.0c
2.9
a2
.8a
2.7
a3
.0a
3.0
a3
.0a
3.0
a3
.0a
3.0
a3
.0a
2.8
A
(B)
50
01
0.4
gh
9.8
h1
0.6
fgh
11
.5ef
g1
1.8
de
10
.6fg
h1
2.8
d1
2.8
d1
1.6
ef1
3.9
c1
5.3
ab1
4.6
bc
15
.8a
12
.4
10
00
12
.4f
12
.1f
12
.0f
13
.6e
13
.6e
14
.0d
e1
4.4
d1
5.4
c1
5.3
c1
6.0
bc
16
.0b
c1
6.6
b1
7.5
a1
4.5
le=
lesi
on
exp
ansi
on
;C
ham
p=
cv.
Ch
amp
agn
e
Fo
rea
chsp
ore
con
cen
trat
ion
·d
aico
mb
inat
ion
(i.e
.,fo
rea
chli
ne
of
the
tab
le),
lesi
on
dia
met
erm
ean
so
fg
eno
typ
essh
ow
ing
the
sam
elo
wer
case
lett
erar
en
ot
sig
nifi
can
tly
dif
fere
nt;
Stu
den
tN
ewm
an-K
eul’
ste
st(P
=0
.05
)
Fo
rea
chsp
ore
con
cen
trat
ion
,le
sio
nd
iam
eter
mea
ns
ov
eral
lg
eno
typ
es(i
.e.,
for
the
last
colu
mn
of
the
tab
le)
sho
win
gth
esa
me
up
per
case
lett
erar
eno
tsi
gn
ifica
ntl
yd
iffe
ren
t;
Stu
den
tN
ewm
an-K
eul’
ste
st(P
=0
.05
)
Fo
rea
chsp
ore
con
cen
trat
ion
(i.e
.,fo
rea
chli
ne
of
the
tab
le),
AU
DP
Cm
ean
so
fg
eno
typ
essh
ow
ing
the
sam
elo
wer
case
lett
erar
en
ot
sig
nifi
can
tly
dif
fere
nt;
Stu
den
tN
ewm
an-
Keu
l’s
test
(P=
0.0
5)
Eur J Plant Pathol (2007) 119:13–27 23
123
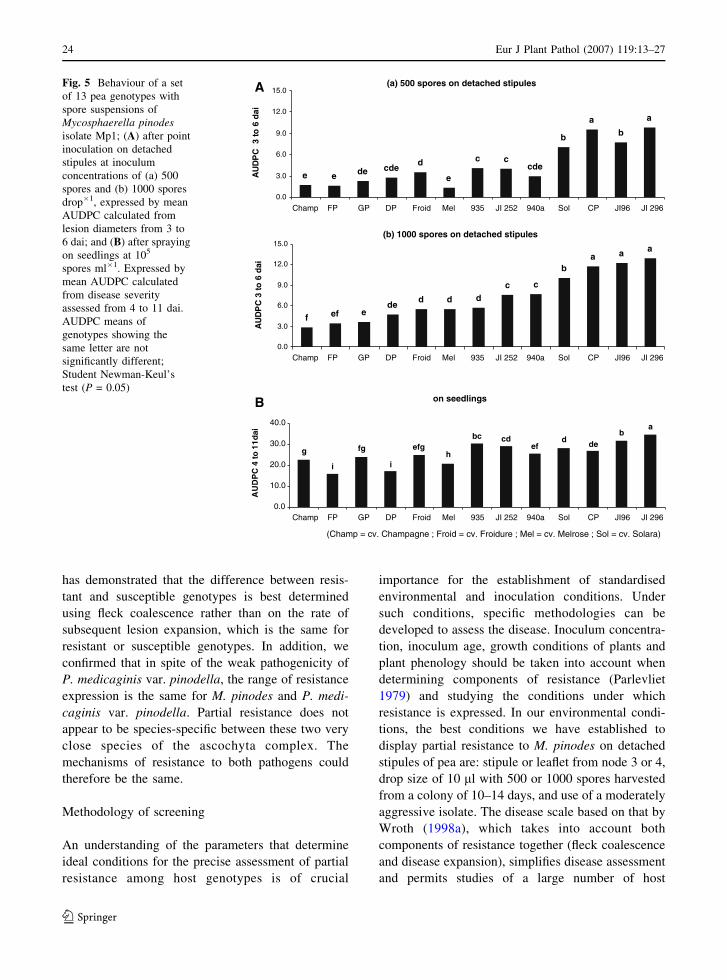
has demonstrated that the difference between resis-
tant and susceptible genotypes is best determined
using fleck coalescence rather than on the rate of
subsequent lesion expansion, which is the same for
resistant or susceptible genotypes. In addition, we
confirmed that in spite of the weak pathogenicity of
P. medicaginis var. pinodella, the range of resistance
expression is the same for M. pinodes and P. medi-
caginis var. pinodella. Partial resistance does not
appear to be species-specific between these two very
close species of the ascochyta complex. The
mechanisms of resistance to both pathogens could
therefore be the same.
Methodology of screening
An understanding of the parameters that determine
ideal conditions for the precise assessment of partial
resistance among host genotypes is of crucial
importance for the establishment of standardised
environmental and inoculation conditions. Under
such conditions, specific methodologies can be
developed to assess the disease. Inoculum concentra-
tion, inoculum age, growth conditions of plants and
plant phenology should be taken into account when
determining components of resistance (Parlevliet
1979) and studying the conditions under which
resistance is expressed. In our environmental condi-
tions, the best conditions we have established to
display partial resistance to M. pinodes on detached
stipules of pea are: stipule or leaflet from node 3 or 4,
drop size of 10 ml with 500 or 1000 spores harvested
from a colony of 10–14 days, and use of a moderately
aggressive isolate. The disease scale based on that by
Wroth (1998a), which takes into account both
components of resistance together (fleck coalescence
and disease expansion), simplifies disease assessment
and permits studies of a large number of host
A (a) 500 spores on detached stipules
e e de cded
e
c ccde
b
ab
a
0.0
3.0
6.0
9.0
12.0
15.0
Champ FP GP DP Froid Mel 935 JI 252 940a Sol CP JI96 JI 296
Champ FP GP DP Froid Mel 935 JI 252 940a Sol CP JI96 JI 296
Champ FP GP DP Froid Mel 935 JI 252 940a Sol CP JI96 JI 296
dai
6o t
3C
PD
UA
(b) 1000 spores on detached stipules
aaab
ccddd
deeeff
0.0
3.0
6.0
9.0
12.0
15.0
dai
6ot
3C
PD
UA
B on seedlings
g
i
fg
i
efgh
bc cdef
d deb
a
0.0
10.0
20.0
30.0
40.0
dai
11ot
4C
PD
UA
(Champ = cv. Champagne ; Froid = cv. Froidure ; Mel = cv. Melrose ; Sol = cv. Solara)
Fig. 5 Behaviour of a set
of 13 pea genotypes with
spore suspensions of
Mycosphaerella pinodesisolate Mp1; (A) after point
inoculation on detached
stipules at inoculum
concentrations of (a) 500
spores and (b) 1000 spores
drop�1, expressed by mean
AUDPC calculated from
lesion diameters from 3 to
6 dai; and (B) after spraying
on seedlings at 105
spores ml�1. Expressed by
mean AUDPC calculated
from disease severity
assessed from 4 to 11 dai.
AUDPC means of
genotypes showing the
same letter are not
significantly different;
Student Newman-Keul’s
test (P = 0.05)
24 Eur J Plant Pathol (2007) 119:13–27
123
genotypes. The strong correlation we obtained
between the seedling test and the test on detached
organs, which has also been observed by Dolar et al.
(1994) on chickpea and Hwang et al. (2006) on pea
inoculated with the respective ascochyta blight
pathogens, strongly supports the feasibility of using
detached leaf methods for resistance screening or
other purposes. Both methodologies (seedling and
detached stipule), address different resistance reac-
tions. Spray inoculation of intact seedlings with spore
suspensions, gives information on the overall behav-
iour of a genotype for its level of resistance whereas
the detached stipule methodology is better suited for
giving information on different components of resis-
tance. Point inoculations of leaves have already been
used for several objectives: to study resistance and/or
components of resistance (Dolar et al. 1994; Bou-
hassan et al. 2003) and factors acting on phases of
epidemic cycles (Heath and Wood 1969; Carisse and
Peyrachon 1999), to characterise isolates for their
pathogenicity/virulence (Nasir et al. 1992; Wroth
1998b) and to screen genotypes/lines for their
resistance (Wroth 1999; Warkentin et al. 1995;
Kohpina et al. 2000; Zhang et al. 2006).
The choice of method for scoring disease progress
depends upon the objectives of the work. If the
objective is to dissect partial resistance on a few host
genotypes, both components of resistance, fleck
coalescence and lesion diameter, can be used in
routine screening, which were well correlated with a
seedling test. A simplification of the method could be
envisaged, consisting of an assessment of fleck
coalescence at 2–3 dai, and lesion diameter at
5–6 dai (respectively for inoculum 1000 and 500
spores per 10 ml drop�1). However, in some
situations, earlier assessments better aligned to
differentiate between different incubation times,
may be more appropriate. For screening tests using
hundreds of lines, it is likely to be more suitable to
use the more comprehensive scale as described here,
and modified from Wroth (1998a) as a first step,
before dissecting specific components of resistance.
Assessing disease with this scale at two dates will
implicitly take into account both components of
resistance, fleck coalescence and lesion expansion
beyond the inoculation drop.
As shown by Bretag and Brouwer (1995) and
Wroth and Khan (1999), it is difficult to evaluate
partial resistance to ascochyta blight in the field, due
to factors interacting with disease severity assess-
ments: agronomic traits (such as plant maturity,
lodging, plant height and canopy architecture) or
environmental conditions (such as climatic conditions
and disease pressure levels). To obtain clearer insight
into the main genetic effects involved in resistance,
Prioul et al. (2003) and Hwang et al. (2006) tried to
minimize these interactions by assessing resistance
under controlled conditions. Fondevilla et al. (2005)
and Hwang et al. (2006) have shown that cultivar
rankings fluctuated across methodologies, but that
ranking tended to be stable at the extremes (most
resistant, most susceptible) between field and con-
trolled conditions assessments. Likewise in most field
trials, we observed significant differences between
extreme genotypes DP and JI296 for their resistance
to M. pinodes (data not shown). This methodology of
detached stipules was used by Baranger et al. (2006)
to develop further studies on genetic knowledge of
resistance and QTL or gene identification. These
authors have identified six QTL specifically involved
in reducing M. pinodes fleck coalescence and lesion
expansion.
We conclude that quantitative resistance can be
expressed on detached pea stipules only under certain
conditions, by expression on fleck coalescence and on
lesion expansion. Other resistance components,
mainly the reproduction of the pathogen (latent
period, pycnidia/pseudothecial formation, number of
spores), need to be studied. Reports show that often
experimental conditions are the same to display
different components of resistance. Vijanen-Rollin-
son et al. (1998) for instance, used the same
conditions to study diverse components of quantita-
tive resistance to powdery mildew in pea (conidial
germination, infection efficiency, latent period and
conidial production). Bouhassan et al. (2003) also
analysed various components of partial resistance to
chocolate spot in faba bean (incubation period,
number of spots, lesion diameter, latency period
and sporulation) under environmental conditions
common to all components. The optimal experimen-
tal conditions we have defined for the expression of
pea resistance to M. pinodes on fleck coalescence and
lesion expansion might therefore be adapted to the
study of other components of resistance. Further
studies are needed to confirm this or show that
some component evaluation would need specific
environmental conditions. Furthermore, how these
Eur J Plant Pathol (2007) 119:13–27 25
123
components affect epidemic development on resistant
genotypes in the field remains to be determined.
Acknowledgements This study was supported by UNIP
(Union Nationale Interprofessionnelle des Plantes riches en
Proteines, Paris). We are grateful to Pr Sabine Banniza
(University of Saskatoon, Canada) for critical comments on
this manuscript.
References
Allard, C., Bill, L., & Touraud, G. (1993). L’anthracnose du
pois. Revue bibliographique et synthese. Agronomie, 3,
5–24.
Baranger, A., Aubert, G., Arnau, G., Laine, A. L., Deniot, G.,
Potier, J., Weinachter, C., Lejeune, I., Lallemand, J., &
Burstin, J. (2004). Genetic diversity within Pisum sativumusing protein and PCR-based markers. Theoretical andApplied Genetics, 108, 1309–1321.
Baranger , A., Miteul, H., Prioul-Gervais, S., Pilet-Nayel, M.
L., Deniot, G., Morin, G., Onfroy, C., & Tivoli, B. (2006).
QTLs for components of partial resistance to Mycosp-haerella pinodes in pea. First International workshop on
Ascochyta of grain legumes, 2–6 July, Le Tronchet,
France.
Bouhassan, A., Sadiki, M., Tivoli, B., & El Khiati, N. (2003).
Analysis by detached leaf assay of components of partial
resistance of faba bean (Vicia faba L.) to chocolate spot
caused by Botrytis fabae Sard. Phytopathologia Mediter-ranea, 42, 183–190.
Bretag , T. W., & Brouwer, J. (1995). Effects of different plant
phenotypes on the severity of ascochyta blight in field
peas (Pisum sativum L.) in southern Australia. Proceed-
ings 2nd European Conference on Grain Legumes, 9–13
July, Copenhagen, Denmark, p. 92.
Bretag , T. W., & Ramsey, M. (2001). Foliar diseases caused
by fungi: Ascochyta spp. In: Kraft and Pfleger (eds.),
Compendium of pea diseases and pests (2nd ed.).
(pp. 24–28). APS Press.
Carisse, O., & Peyrachon, B. (1999). Influence of temperature,
cultivar and time on sporulation of Mycosphaerella fra-gariae on detached strawberry leaves. Canadian Journalof Plant Pathology, 21, 276–283.
Clulow, S. A., Lewis, B. G., & Matthews, P. (1992). Expres-
sion of resistance to Mycosphaerella pinodes in Pisumsativum. Plant Pathology, 41, 362–369.
Clulow, S. A., Lewis, B. G., Parker, M. L., & Matthews, P.
(1991). Infection of pea epicotyls by Mycosphaerellapinodes. Mycological Research, 95, 817–820.
Dolar, F. S., Tenuta, A., & Higgins, V. J. (1994). Detached leaf
assay for screening chickpea for resistance to ascochyta
blight. Canadian Journal of Plant Pathology, 16, 215–
220.
Fondevilla, S., Avila, C. M., Cubero, J. I., & Rubiales, D. (2005).
Response to Mycosphaerella pinodes in a germplasm
collection of Pisum spp. Plant Breeding, 124, 313–315.
Hare, W. W., & Walker, J. C. (1944). Ascochyta diseases of
canning pea. Wisconsin Research Bulletin, 150, 1–31.
Harrison, J. G. (1988). The biology of Botrytis spp. on Viciabeans and chocolate spot disease – a review. PlantPathology, 37, 168–201.
Heath, M. C., & Wood, R. K. S. (1969). Leaf spots induced by
Ascochyta pisi and Mycosphaerella pinodes. Annals ofBotany, 33, 657–670.
Hwang, S. F., Zhang, R., Chang, K. F., Gossen, B. D., Turn-
bull, G. D., & Bing, D. J. (2006). Comparison of three
methods for assessing disease reaction to Mycosphaerellapinodes in field pea (Pisum sativum). Journal of PlantDisease and Protection, 113, 20–23.
Jones, L. K. (1927). Studies of the nature and control of blight,
leaf and pod spot, and footrot of peas caused by species of
Ascochyta. NY State Agricultural Experiment StationBulletin, 547, 1–45.
Kohpina, S., Knight, R., & Stoddard, F. L. (2000). Evaluating
faba beans resistance to ascochyta blight using detached
organs. Australian Journal of Experimental Agriculture,40, 707–713.
Nasir, M., Hoppe, M. H., & Ebrahim-Nesbat, F. (1992). The
development of different pathotypes groups of Mycosp-haerella pinodes in susceptible and partially resistant pea
leaves. Plant Pathology, 41, 187–194.
Onfroy, C., Tivoli, B., Corbiere, R., & Bouznad, Z. (1999).
Cultural, molecular and pathogenic variability of My-cosphaerella pinodes and Phoma medicaginis var.
pinodella isolates from dried pea in France. PlantPathology, 48, 218–229.
Parlevliet, J. E. (1979). Components of resistance that reduce
the rate of epidemic development. Annual Review ofPhytopathology, 17, 203–222.
Prioul S., Frankewitz, A., Deniot, G., Morin, G., & Baranger,
A. (2004). Mapping of quantitative trait loci for partial
resistance to Mycosphaerella pinodes on pea (Pisum sat-ivum L.), at the seedling and adult plant stages. Theoret-ical and Applied Genetics, 108, 1322–1334.
Prioul, S., Onfroy, C., Tivoli, B., & Baranger, A. (2003).
Controlled environment assessment of partial resistance to
Mycosphaerella pinodes in pea (Pisum sativum L.) seed-
lings. Euphytica, 131, 121–130.
Sakar, D., Muehlbauer, F. J., & Kraft, J. M. (1982). Techniques
of screening peas for resistance to Phoma medicaginisvar. pinodella. Crop Science, 22, 988–992.
SAS Institute. (1988). SAS user guide: Statistic. Cary, NC,
USA: SAS Institute.
Shaner, G., & Finney, F. E. (1977). The effect of nitrogen
fertilization on the expression of slow-mildewing in Knox
wheat. Phytopathology, 67, 1051–1056.
Timmerman, G. M., Frew, T. J., Russell, A. C., Khan, T.,
Butler, R., Gilpin, M., Murray, S., & Falloon, K. (2002).
Mapping of partial resistance to field epidemics of asco-
chyta blight of pea. Crop Science, 42, 2100–2111.
Tivoli, B., Berthelem, D., Le Guen, J., & Onfroy, C. (1986).
Comparison of some methods for evaluation of reaction of
different winter faba bean genotypes to Botrytis fabae.
Fabis Newsletter, 16, 46–51.
Vijanen-Rollinson, S. L. J., Gaunt, R. E., Frampton, C. M. A.,
Faloon, R. E., & McNeil, D. L. (1998). Components of
quantitative resistance to powdery mildew (Erysiphe pisi)in pea (Pisum sativum). Plant Pathology, 47, 137–147.
26 Eur J Plant Pathol (2007) 119:13–27
123
Wang H., Hwang, S. F., Chang, K. F., Turnbull, G. D., &
Howard, R. J. (2000). Characterization of Ascochyta iso-
lates, & susceptibility of pea cultivars to the ascochyta
disease complex in Alberta. Plant Pathology, 49, 540–545.
Warkentin, T. D., Rashid, K. Y., & Zimmer, R. C. (1995).
Effectiveness of a detached leaf assay for determination of
the reaction of pea plants to powdery mildew. CanadianJournal of Plant Pathology, 17, 87–89.
Wroth, J. M. (1998a). Possible role for wild genotypes of
Pisum spp. to enhance ascochyta blight resistance in pea.
Australian Journal of experimental Agriculture, 38,
469–479.
Wroth, J. M. (1998b). Variation in pathogenicity among and
within Mycosphaerella pinodes populations collected
from field pea in Australia. Canadian Journal of Botany,76, 1955–1966.
Wroth, J. M. (1999). Evidence suggests that Mycosphaerellapinodes infection of Pisum sativum is inherited as a
quantitative trait. Euphytica, 107, 193–204.
Wroth, J. M., & Khan, T. N. (1999). Differential responses of
field pea (Pisum sativum L.) to ascochyta blight
(Mycosphaerella pinodes): Rating disease in the field.
Australian Journal of Agricultural Research, 50,
601–615.
Xue, A. G., & Warkentin, T. D. (2001). Partial resistance to
Mycosphaerella pinodes in field pea. Canadian Journal ofPlant Science, 81, 535–540.
Zhang , R., Hwang, S. F., Chang, K.F., Gossen, B. D., Strelkov,
S. E., Turnbull, G. D., & Blade S. F. (2006). Genetic
resistance to Mycosphaerella pinodes in 558 field pea
accessions. Crop Science, on line: 2409–2414.
Eur J Plant Pathol (2007) 119:13–27 27
123

FULL RESEARCH PAPER
Validation of a QTL for resistance to ascochyta blightlinked to resistance to fusarium wilt race 5 in chickpea(Cicer arietinum L.)
M. Iruela Æ P. Castro Æ J. Rubio Æ J. I. Cubero ÆC. Jacinto Æ T. Millan Æ J. Gil
Received: 27 October 2006 / Accepted: 8 March 2007 / Published online: 28 March 2007� KNPV 2007
Abstract Ascochyta blight caused by Ascochyta
rabiei and fusarium wilt caused by Fusarium
oxysporum. f. sp. ciceris are the two most serious
diseases of chickpea (Cicer arietinum). Quantita-
tive trait loci (QTL) or genes for ascochyta blight
resistance and a cluster of resistance genes for
several fusarium wilt races (foc1, foc3, foc4 and
foc5) located on LG2 of the chickpea map have
been reported independently. In order to validate
these results and study the linkage relationship
between the loci that confer resistance to blight
and wilt, an intraspecific chickpea recombinant
inbred lines (RIL) population that segregates for
resistance to both diseases was studied. A new
LG2 was established using sequence tagged
microsatellite sites (STMS) markers selected from
other chickpea maps. Resistance to race 5 of
F. oxysporum (foc5) was inherited as a single
gene and mapped to LG2, flanked by the STMS
markers TA110 (6.5 cM apart) and TA59 (8.9 cM
apart). A QTL for resistance to ascochyta blight
(QTLAR3) was also detected on LG2 using
evaluation data obtained separately in two crop-
ping seasons. This genomic region, where
QTLAR3 is located, was highly saturated with
STMS markers. STMS TA194 appeared tightly
linked to QTLAR3 and was flanked by the STMS
markers TR58 and TS82 (6.5 cM apart). The
genetic distance between foc5 and QTLAR3 peak
was around 24 cM including six markers within
this interval. The markers linked to both loci
could facilitate the pyramiding of resistance genes
for both diseases through MAS.
Keywords Cicer arietinum � Ascochyta rabiei �Fusarium oxysporum � Molecular markers �Linkage analysis
Introduction
Chickpea (Cicer arietinum) is an autogamous
annual cool-season grain legume cultivated in
arid and semi-arid areas across the six continents.
It is valued for its high protein content and the
absence of specific major anti-nutritional factors
means that it is considered nutritional and healthy
(Williams and Singh 1987; Gil et al. 1996). It is
mostly used for human consumption and to a
lesser extent for animal feed. Chickpea yield is
M. Iruela � P. Castro � J. RubioArea de Mejora y Biotecnologıa, IFAPA, Alamedadel obispo, Apdo. 3092, 14080 Cordoba, Spain
J. I. Cubero � T. Millan � J. Gil (&)Departamento de Genetica, Universidad de Cordoba,Campus Rabanales Edif. C-5, 14071 Cordoba, Spaine-mail: [email protected]
C. JacintoINIFAP, Campo Experimental Valle de Mexico,Mexico, DF, Mexico
123
Eur J Plant Pathol (2007) 119:29–37
DOI 10.1007/s10658-007-9121-0
low and unstable with a global average below
0.8 t ha–1 (FAOSTAT 2005). Two fungal dis-
eases, ascochyta blight (caused by Ascochyta
rabiei; syn. Phoma rabiei) and fusarium wilt
(caused by Fusarium oxysporum f. sp. ciceris),
are important limiting factors for yield worldwide.
Ascochyta blight is the most destructive dis-
ease affecting chickpea in many farming regions
of the world. Ascochyta rabiei can attack at any
growth stage and affect all aerial parts of the
plant, producing lesions with concentric rings of
pycnidia and stem breakage due to girdling.
Sources of resistance to ascochyta blight have
been identified from C. arietinum and wild Cicer
species (Singh and Reddy 1993; Collard et al.
2001; Chen et al. 2004). This resistance, available
in cultivated chickpea, has been exploited in
conventional breeding programmes, producing
new resistant cultivars worldwide. Knowledge of
the genetic bases of both virulence in A. rabiei
and resistance in chickpea is essential in order to
develop cultivars with more durable resistance.
To date, the pathogen has been classified mainly
into two broad pathotypes: pathotype I (less
aggressive) and pathotype II (aggressive) (Chen
et al. 2004); but further research is required to
identify the genes that control aggressiveness. As
for the host, early studies on the inheritance of
blight resistance indicated that it could be con-
ferred by one, two or three genes (Singh and
Reddy 1983; Tewari and Pandey 1986; Dey and
Singh 1993; Tekeoglu et al. 2000). Furthermore,
evidence that resistance might be inherited as a
quantitative trait has been reported (Muehlbauer
and Kaiser, 1994). Resistance to blight is consid-
ered partial or incomplete in chickpea. Climatic
conditions, inoculum density, pathotype variation
and plant age all affect disease development.
Thus, the use of RIL populations (homozygous
lines) provides a more accurate evaluation of the
disease than F2 populations. Furthermore, RILs
can be evaluated for reaction to different patho-
types and under differing environmental condi-
tions. The use of RIL populations and molecular
markers has contributed a great deal to the
identification of quantitative trait loci (QTL) for
resistance to ascochyta blight. Several QTL have
been located on different maps developed by
various authors and the STMS markers linked to
these QTL have helped to assign them to linkage
groups relating to the most extensive chick-
pea map (Winter et al. 2000). Two major QTL
(QTL-1 and QTL-2) that confer resistance have
been located on linkage group 4 (LG4) by
different authors (Santra et al. 2000; Tekeoglu
et al. 2002; Collard et al. 2003; Flandez-Galvez
et al. 2003; Millan et al. 2003; Rakshit et al. 2003;
Udupa and Baum 2003; Cho et al. 2004; Iruela
et al. 2006). We suggest labelling them QTLAR1
and QTLAR2 (Iruela et al., 2006). These two QTL
seem to confer resistance to pathotype II of A.
rabiei according to the results of Udupa and
Baum (2003) and Cho et al. (2004). QTLAR2 has
been located in a genomic region with a high
density of markers (Iruela et al. 2006) whereas
QTLAR1 appeared in a loose genomic region.
Other genes or QTL for resistance to blight have
been reported on LG2 in a poorly saturated
region (Udupa and Baum 2003; Cho et al. 2004;
Cobos et al. 2006) and seem to be more
associated with pathotype I of A. rabiei (Udupa
and Baum 2003; Cho et al. 2004).
Fusarium wilt is another serious disease that
affects chickpea, decreasing production in many
countries. Eight pathogenic races (races 0, 1A,
1B/C, 2, 3, 4, 5 and 6) have been reported. In
susceptible chickpea cultivars, races 1A, 2, 3, 4, 5
and 6 induce the wilting syndrome, whereas races
0 and 1B/C induce the yellowing syndrome. Races
0, 1A, 1B/C, 5 and 6 are found mainly in the
Mediterranean region and California (see review
by Jimenez-Gasco et al. 2004). In Spain, race 5 is
the most virulent (Landa et al. 2004) and along
with race 6 is the second most common after race
0 (Jimenez-Diaz et al. 1989). Breeding pro-
grammes have been developed using resistant
desi cultivars but the pathogenic variability of the
fungus is an added difficulty. Studies using inter
and intraspecific populations of chickpea and
random amplified polymorphic DNA (RAPD),
inter simple sequence repeats (ISSR), sequence
characterised amplified regions (SCAR) and
sequence tagged microsatellite sites (STMS)
markers indicated that resistance genes for fusa-
rium wilt races 1, 3, 4 and 5 (foc1, foc3, foc4 and
foc5) are located on LG2, forming a cluster
(Mayer et al. 1997; Ratnaparkhe et al. 1998a;
Tullu et al. 1998; Winter et al. 2000; Sharma et al.
30 Eur J Plant Pathol (2007) 119:29–37
123
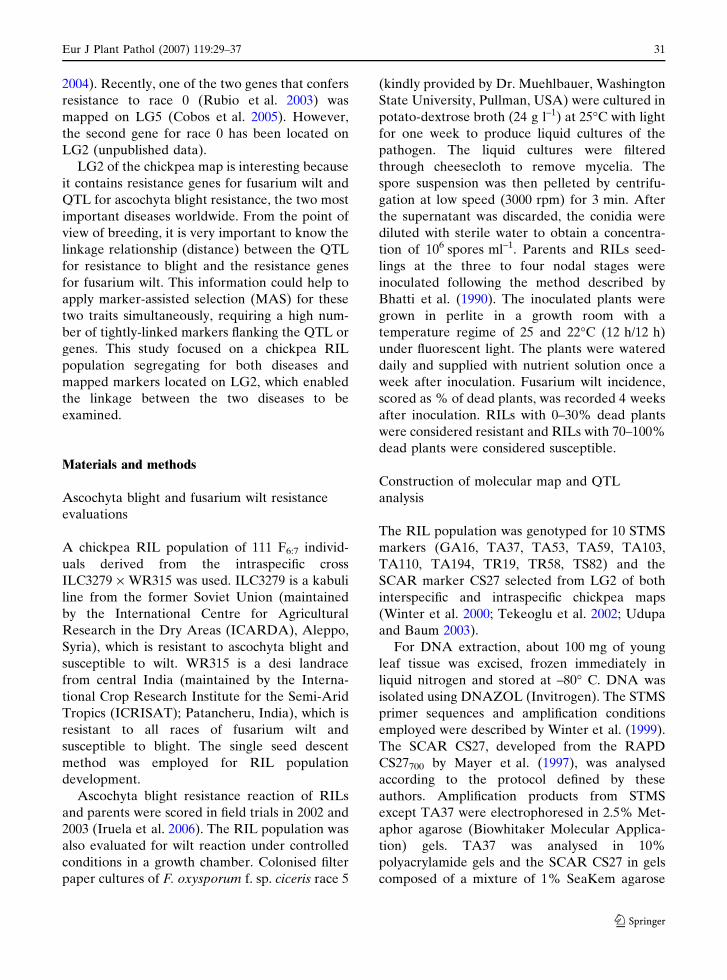
2004). Recently, one of the two genes that confers
resistance to race 0 (Rubio et al. 2003) was
mapped on LG5 (Cobos et al. 2005). However,
the second gene for race 0 has been located on
LG2 (unpublished data).
LG2 of the chickpea map is interesting because
it contains resistance genes for fusarium wilt and
QTL for ascochyta blight resistance, the two most
important diseases worldwide. From the point of
view of breeding, it is very important to know the
linkage relationship (distance) between the QTL
for resistance to blight and the resistance genes
for fusarium wilt. This information could help to
apply marker-assisted selection (MAS) for these
two traits simultaneously, requiring a high num-
ber of tightly-linked markers flanking the QTL or
genes. This study focused on a chickpea RIL
population segregating for both diseases and
mapped markers located on LG2, which enabled
the linkage between the two diseases to be
examined.
Materials and methods
Ascochyta blight and fusarium wilt resistance
evaluations
A chickpea RIL population of 111 F6:7 individ-
uals derived from the intraspecific cross
ILC3279 · WR315 was used. ILC3279 is a kabuli
line from the former Soviet Union (maintained
by the International Centre for Agricultural
Research in the Dry Areas (ICARDA), Aleppo,
Syria), which is resistant to ascochyta blight and
susceptible to wilt. WR315 is a desi landrace
from central India (maintained by the Interna-
tional Crop Research Institute for the Semi-Arid
Tropics (ICRISAT); Patancheru, India), which is
resistant to all races of fusarium wilt and
susceptible to blight. The single seed descent
method was employed for RIL population
development.
Ascochyta blight resistance reaction of RILs
and parents were scored in field trials in 2002 and
2003 (Iruela et al. 2006). The RIL population was
also evaluated for wilt reaction under controlled
conditions in a growth chamber. Colonised filter
paper cultures of F. oxysporum f. sp. ciceris race 5
(kindly provided by Dr. Muehlbauer, Washington
State University, Pullman, USA) were cultured in
potato-dextrose broth (24 g l–1) at 25�C with light
for one week to produce liquid cultures of the
pathogen. The liquid cultures were filtered
through cheesecloth to remove mycelia. The
spore suspension was then pelleted by centrifu-
gation at low speed (3000 rpm) for 3 min. After
the supernatant was discarded, the conidia were
diluted with sterile water to obtain a concentra-
tion of 106 spores ml–1. Parents and RILs seed-
lings at the three to four nodal stages were
inoculated following the method described by
Bhatti et al. (1990). The inoculated plants were
grown in perlite in a growth room with a
temperature regime of 25 and 22�C (12 h/12 h)
under fluorescent light. The plants were watered
daily and supplied with nutrient solution once a
week after inoculation. Fusarium wilt incidence,
scored as % of dead plants, was recorded 4 weeks
after inoculation. RILs with 0–30% dead plants
were considered resistant and RILs with 70–100%
dead plants were considered susceptible.
Construction of molecular map and QTL
analysis
The RIL population was genotyped for 10 STMS
markers (GA16, TA37, TA53, TA59, TA103,
TA110, TA194, TR19, TR58, TS82) and the
SCAR marker CS27 selected from LG2 of both
interspecific and intraspecific chickpea maps
(Winter et al. 2000; Tekeoglu et al. 2002; Udupa
and Baum 2003).
For DNA extraction, about 100 mg of young
leaf tissue was excised, frozen immediately in
liquid nitrogen and stored at –80� C. DNA was
isolated using DNAZOL (Invitrogen). The STMS
primer sequences and amplification conditions
employed were described by Winter et al. (1999).
The SCAR CS27, developed from the RAPD
CS27700 by Mayer et al. (1997), was analysed
according to the protocol defined by these
authors. Amplification products from STMS
except TA37 were electrophoresed in 2.5% Met-
aphor agarose (Biowhitaker Molecular Applica-
tion) gels. TA37 was analysed in 10%
polyacrylamide gels and the SCAR CS27 in gels
composed of a mixture of 1% SeaKem agarose
Eur J Plant Pathol (2007) 119:29–37 31
123
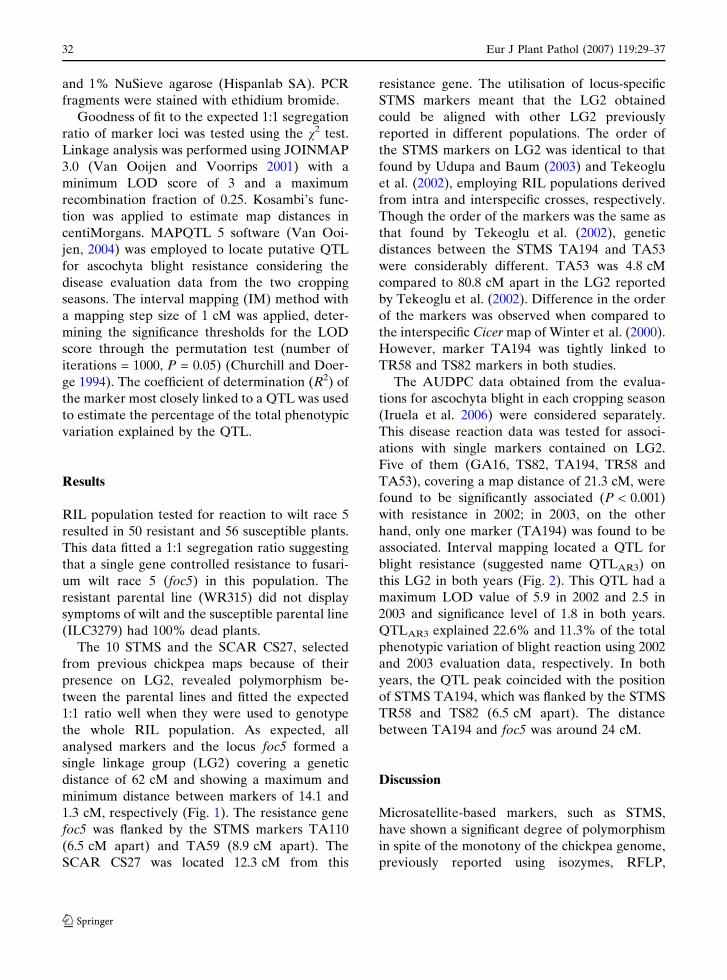
and 1% NuSieve agarose (Hispanlab SA). PCR
fragments were stained with ethidium bromide.
Goodness of fit to the expected 1:1 segregation
ratio of marker loci was tested using the v2 test.
Linkage analysis was performed using JOINMAP
3.0 (Van Ooijen and Voorrips 2001) with a
minimum LOD score of 3 and a maximum
recombination fraction of 0.25. Kosambi’s func-
tion was applied to estimate map distances in
centiMorgans. MAPQTL 5 software (Van Ooi-
jen, 2004) was employed to locate putative QTL
for ascochyta blight resistance considering the
disease evaluation data from the two cropping
seasons. The interval mapping (IM) method with
a mapping step size of 1 cM was applied, deter-
mining the significance thresholds for the LOD
score through the permutation test (number of
iterations = 1000, P = 0.05) (Churchill and Doer-
ge 1994). The coefficient of determination (R2) of
the marker most closely linked to a QTL was used
to estimate the percentage of the total phenotypic
variation explained by the QTL.
Results
RIL population tested for reaction to wilt race 5
resulted in 50 resistant and 56 susceptible plants.
This data fitted a 1:1 segregation ratio suggesting
that a single gene controlled resistance to fusari-
um wilt race 5 (foc5) in this population. The
resistant parental line (WR315) did not display
symptoms of wilt and the susceptible parental line
(ILC3279) had 100% dead plants.
The 10 STMS and the SCAR CS27, selected
from previous chickpea maps because of their
presence on LG2, revealed polymorphism be-
tween the parental lines and fitted the expected
1:1 ratio well when they were used to genotype
the whole RIL population. As expected, all
analysed markers and the locus foc5 formed a
single linkage group (LG2) covering a genetic
distance of 62 cM and showing a maximum and
minimum distance between markers of 14.1 and
1.3 cM, respectively (Fig. 1). The resistance gene
foc5 was flanked by the STMS markers TA110
(6.5 cM apart) and TA59 (8.9 cM apart). The
SCAR CS27 was located 12.3 cM from this
resistance gene. The utilisation of locus-specific
STMS markers meant that the LG2 obtained
could be aligned with other LG2 previously
reported in different populations. The order of
the STMS markers on LG2 was identical to that
found by Udupa and Baum (2003) and Tekeoglu
et al. (2002), employing RIL populations derived
from intra and interspecific crosses, respectively.
Though the order of the markers was the same as
that found by Tekeoglu et al. (2002), genetic
distances between the STMS TA194 and TA53
were considerably different. TA53 was 4.8 cM
compared to 80.8 cM apart in the LG2 reported
by Tekeoglu et al. (2002). Difference in the order
of the markers was observed when compared to
the interspecific Cicer map of Winter et al. (2000).
However, marker TA194 was tightly linked to
TR58 and TS82 markers in both studies.
The AUDPC data obtained from the evalua-
tions for ascochyta blight in each cropping season
(Iruela et al. 2006) were considered separately.
This disease reaction data was tested for associ-
ations with single markers contained on LG2.
Five of them (GA16, TS82, TA194, TR58 and
TA53), covering a map distance of 21.3 cM, were
found to be significantly associated (P < 0.001)
with resistance in 2002; in 2003, on the other
hand, only one marker (TA194) was found to be
associated. Interval mapping located a QTL for
blight resistance (suggested name QTLAR3) on
this LG2 in both years (Fig. 2). This QTL had a
maximum LOD value of 5.9 in 2002 and 2.5 in
2003 and significance level of 1.8 in both years.
QTLAR3 explained 22.6% and 11.3% of the total
phenotypic variation of blight reaction using 2002
and 2003 evaluation data, respectively. In both
years, the QTL peak coincided with the position
of STMS TA194, which was flanked by the STMS
TR58 and TS82 (6.5 cM apart). The distance
between TA194 and foc5 was around 24 cM.
Discussion
Microsatellite-based markers, such as STMS,
have shown a significant degree of polymorphism
in spite of the monotony of the chickpea genome,
previously reported using isozymes, RFLP,
32 Eur J Plant Pathol (2007) 119:29–37
123
RAPD, DAF and AFLP (see review by Winter
et al. 2003). All STMS markers chosen from
interspecific and intraspecific maps (Winter et al.
2000; Tekeoglu et al. 2002; Udupa and Baum
2003) were polymorphic, thus validating the
potential of STMS in MAS. Differences in the
order of markers compared with the linkage
group of Winter et al. (2000) and a greater
genetic distance between TA194 and TA53 in
Tekeoglu et al. (2000) were observed. These may
be due to the different origin of the RIL popu-
lation used, which were derived from interspecific
crosses in the case of Winter et al. (2000) and
Tekeoglu et al. (2002), and intraspecific in this
study. Furthermore, different software packages
based on different procedures could affect the
order or distance between markers. Population
size is another factor to take into account; large
populations would give a more accurate order of
the markers. Consensus maps using different
chickpea mapping populations that segregate for
common markers across the populations, as
reported in other crops (Doligez et al. 2006; Song
301AT
011AT
5cof/5coF
95AT73AT72SC
91RT
35AT85RT491AT
28ST
61AG
1.41
5.6
9.8
3.11.28.3
5.38.20.25.4
0.21
2GL
95AT
011AT
35AT
61AG
28ST
72SC
61AG
5coF
95AT
28ST85RT491AT
73AT
011AT
91RT
Winter et al. (2000)
)2002( .la teulgoekeT
Udupa and Baum (2003)
2GL
2GL
35AT
91RT
95AT
301AT
491AT
2GL
Fig. 1 Linkage groupobtained in the chickpeaRIL populationILC3279 · WR315 (blackbar) and its alignmentthrough common markersincluded in LG2 ofWinter et al. (2000),Tekeoglu et al. (2002) andUdupa and Baum (2003).Map distances are in cM.Fusarium wilt race 5resistant gene is in bold,the SCAR marker isunderlined and theremainder of the markersare STMS
0
1
2
3
4
5
6
7
TA
103
TA
110
Foc
5/fo
c5
TA
59T
A37
CS2
7T
R19
TA
53T
R58
TA
194
TS8
2
GA
16
LOD
cM
Significance level
LG2
Fig. 2 QTL for ascochyta blight resistance obtained in thechickpea RIL population ILC3279 · WR315 evaluated in2002 (––) and 2003 (–�–�). Fusarium wilt race 5 resistantgene is in bold, the SCAR marker is underlined and theremainder of the markers are STMS
Eur J Plant Pathol (2007) 119:29–37 33
123

et al. 2004), could be one way of obtaining a more
accurate chickpea map (Tekeoglu et al. 2002).
Resistance to race 5 of F. oxysporum was
monogenic and was mapped to LG2, considering
common STMS markers related to the reference
chickpea genetic map of Winter et al. (2000). This
result confirms previous reports of the monogenic
nature of resistance to race 5 in WR315 (Sharma
et al. 2005). Using another source of resistance,
ICC4958, Tekeoglu et al. (2000) also demon-
strated monogenic inheritance to race 5. This
gene for resistance to race 5 present in ICC4958
was also located on LG2, linked to genes for
resistance to races 1, 3 and 4 (Ratnaparkhe et al.
1998a, b; Tekeoglu et al. 2000; Winter et al.
2000). Genes for resistance to races 1, 3 and 4
present in WR315 have been also mapped to LG2
(indicative marker CS27) and could be considered
to be the same as the one present in ICC4958
(Mayer et al. 1997; Tullu et al. 1998; Sharma
et al. 2004). The gene conferring resistance to
race 5 present in WR315 could be also considered
the same as the one in ICC4958.
In addition to fusarium wilt resistance genes
reported on LG2, genes or QTL associated with
resistance to ascochyta blight were also found on
this LG (Udupa and Baum 2003; Cho et al. 2004;
Cobos et al. 2006). A major locus and a tightly
linked QTL, which confer resistance to pathotype
I and II respectively, were identified by Udupa
and Baum (2003), who used the same resistant
source employed in this study (ILC3279). Cho
et al. (2004), using a different resistant parental
line (FILP84-92C), also reported a major gene
(Ar19) for resistance to pathotype I on LG2. In
both studies, the genes or QTL were located in a
poorly saturated genomic region and the closest
marker was the STMS GA16 (around 20 cM
apart). More recently, using an interspecific RIL
population, another QTL for resistance to blight
was located on LG2, flanked by a RAPD and a
ISSR markers (14.1 cM apart) and the STMS
TA103 was over 20 cM away from the peak of the
QTL (Cobos et al. 2006). In this case, the resis-
tance source was ILC72. Both markers flanked
the QTL reported by Cobos et al. (2006) were
monomorphic in the intraspecific population used
in this study. There would need to be a higher
density of markers around the genes in question
in order to know whether these genes or QTL are
or not the same as those present in different
parental lines, and also in order to use MAS for
resistance. This study detected a QTL far away
from STMS TA103 (>30 cM) and around 20 cM
from GA16. This QTL might be the same as that
reported by Cobos et al. (2006) (indicative
marker TA103), and possibly the same as those
reported by Udupa and Baum (2003) and Cho
et al. (2004) (indicative marker GA16). STMS
TA194, which was tightly linked to the QTL, was
not present in the maps reported by the afore-
mentioned authors. However, STMS markers
flanking the QTL such as TA53 and TS82 were
present in the map defined by Udupa and Baum
(2003), but located more than 25 cM away from
the gene for pathotype I (ar1) or the QTL for
pathotype II (ar2a) of ascochyta blight. The latter
were closer to GA16, located midway between
TS82 and ar1 or ar2a.
As mentioned previously, the order of markers
in a linkage group can be affected by different
factors. Furthermore, experimental error in the
disease score might have contributed to a differ-
ent order. Udupa and Baum (2003) phenotyped
the RILs for pathotype I on the basis of a bimodal
rather than continuous distribution, where the
score of the RILs with intermediate reactions
might contribute to the experimental error. Cho
et al. (2004) reported a major gene (Ar19) for
pathotype I on LG2+6, mapped between TR19
and GA16. They suggested that Ar19 appeared to
provide most of the quantitative resistance to
pathotype I and, to a lesser extent, resistance to
pathotype II. In a previous study, using the same
RIL population as in the current study as well as
the same scoring data obtained during 2002 and
2003, two strong QTL (QTLAR1 and QTLAR2)
located on LG4 were reported in the second year
only, suggesting that different pathotypes might
be present in each of the evaluated years (Iruela
et al. 2006). The QTL obtained on LG2 was more
important in the first year and had only a slight
presence in the second year. These results suggest
that QTLAR3 on LG2 could be the same as
the QTL or genes for resistance to pathotype I of
A. rabiei proposed by the cited authors. More
work needs to be done to saturate the genomic
region of LG2 where these genes or QTL have
34 Eur J Plant Pathol (2007) 119:29–37
123
been detected in order to get a more accurate
validation. TA194 could be a good reference
marker for verification.
In conclusion, this study has confirmed that
the loci responsible for the two most economi-
cally important diseases of chickpea appear as a
cluster on LG2. Complex clusters of disease
resistance genes are common in plant genomes .
Examples of R genes that are present in clusters
include Rp1, Rpp5, Xa21, Pto, Dm3, I2, N, M
and the Cf genes (Takken et al. 2000). In
Arabidopsis, 109 of the 149 NB-LRR genes
reside in 40 clusters ranging in size from two to
eight genes, while the remaining 40 genes exist
as singletons (Meyers et al. 2003). These clusters
can span large chromosome segments and confer
resistance to different races of the same patho-
gen as well as to different pathogens. For
example, a common bean map revealed numer-
ous resistance gene clusters, including the co-
location of genes for resistance to two fungal
diseases, anthracnose and rust (Miklas et al.
2006). Resistance genes to powdery mildew
(Rmd-c), Phytophthora stem and root rot
(Rps2), and an ineffective nodulation gene
(Rj2) have been mapped within a cluster on
linkage group J in soybean (Polzin et al. 1994).
From the point of view of chickpea breeding, the
genetic distance (around 24 cM) between both
loci (foc5 and TA194 ) do not appear to pose a
problem for pyramiding resistance to fusarium
wilt race 5 and the QTLAR3 for ascochyta blight.
The closely linked STMS markers to both loci
could be used, via MAS, to achieve these
objectives.
Acknowledgements This work has been supported by theEuropean Union project: GLIP, contract no. FOOD-CT-2004-50622, and the national project : INIA, contract no.RTA04-067. M. Iruela acknowledges grant support fromIFAPA-CICE Junta de Andalucia (Spain).
References
Bhatti, M. A. (1990). The effects of inoculum density andenvironmental factors on wilt and root rot of chickpea(Cicer arietinum L.). Ph.D. Dissertation, Departmentof Plant Pathology, Washington State University,Pullman, Washington, 132 pp.
Chen, W., Coyne, C. J., Peever, T. L., & Muehlbauer, F. J.(2004). Characterization of chickpea differentials forpathogenicity assay of ascochyta blight and identifi-cation of chickpea accessions resistant to Didymellarabiei. Plant Pathology, 53, 759–769.
Cho, S., Chen, W., & Muehlbauer, F. J. (2004). Pathotype-specific genetic factors in chickpea (Cicer arietinumL.) for quantitative resistance to ascochyta blight.Theoretical and Applied Genetics, 109, 733–739.
Churchill, G. A., & Doerge, R. W. (1994). Empiricalthreshold values for quantitative trait mapping.Genetics, 138, 963–971.
Cobos, M. J., Fernandez, M. J., Rubio, J., Kharrat, M.,Moreno, M. T., Gil, J., & Millan, T. (2005). A linkagemap of chickpea (Cicer arietinum L.) based on pop-ulations from Kabuli´ Desi crosses: location of genesfor resistance to fusarium wilt race 0. Theoretical andApplied Genetics, 110, 1347–1353.
Cobos, M. J., Rubio, J., Strange, R. N., Moreno, M. T., Gil,J., & Millan, T. (2006). A new QTL for Ascochytablight resistance in an RIL population derived froman interspecific cross in chickpea. Euphytica, 149, 105–111.
Collard, B. C. Y., Ades, P. K., Pang, E. C. K., Brouwer, J.B., & Taylor, P. W. J. (2001). Prospecting for sourcesof resistance to ascochyta blight in wild Cicer species.Australasian Plant Pathology, 30, 271–276.
Collard, B. C. Y., Pang, E. C. K., Ades, P. K., & Taylor, P.W. J. (2003). Preliminary investigation of QTL asso-ciated with seedling resistance to ascochyta blightfrom Cicer echinospermum, a wild relative of chick-pea. Theoretical and Applied Genetics, 107, 719–729.
Dey, S. K., & Singh, G. (1993). Resistance to ascochytablight in chickpea – Genetic basis. Euphytica, 68, 147–153.
Doligez, A., Adam-Blondon, A. F., Cipriani, G., DiGaspero, G., Laucou Merdinoglu, V. D., Meredith, C.P., Riaz, S., Roux, C., & This, P. (2006). An integratedSSR map of grapevine based on five mapping popu-lations. Theoretical and Applied Genetics, 113, 369–382.
FAOSTAT data (2005). http://faostat.fao.org/faostat/col-lections? subset=agriculture. Last updated February2005.
Flandez-Galvez, H., Ades, P. K., Ford, R., Pang, E. C. K.,& Taylor, P. W. J. (2003). QTL analysis for ascochytablight resistance in an intraspecific population ofchickpea (Cicer arietinum L.). Theoretical and Ap-plied Genetics, 107, 1257–1265.
Gil, J., Nadal, S., Luna, D., Moreno, M. T., & de Haro, A.(1996). Variability of some physico-chemical charac-ters in Desi and Kabuli chickpea types. Journal of theScience of Food and Agriculture, 71, 179–184.
Iruela, M., Rubio, J., Barro, F., Cubero, J. I., Millan, T., &Gil, J. (2006). Detection of two quantitative trait locifor resistance to ascochyta blight in an intra-specificcross of chickpea (Cicer arietinum L.): development ofSCAR markers associated with resistance. Theoreticaland Applied Genetics, 112, 278–287.
Jimenez-Dıaz, R. M., Trapero-Casas, A., & Cabrera de laColina, J. (1989). Races of Fusarium oxysporum f. sp.
Eur J Plant Pathol (2007) 119:29–37 35
123
ciceris infecting chickpea in southern Spain. In E. C.Tjamos & C. H. Beckman (Eds.), Vascular Wilt Dis-eases of Plants. NATO ASI Series, Vol. H28 (pp. 515–520). Springer-Verlag: Berlin.
Jimenez-Gasco, M. M., Navas-Cortes, J. A., & Jimenez-Dıaz, R. M. (2004). The Fusarium oxysporum f. sp.ciceris/Cicer arietinum pathosystem: a case study ofthe evolution of plant-pathogenic fungi into races andpathotypes. International Microbiology, 7, 95–104.
Landa, B. B., Navas-Cortes, J. A., & Jimenez-Dıaz, R. M.(2004). Integrated management of Fusarium wilt ofchickpea with sowing date, host resistance, and bio-logical control. Phytopathology, 94, 946–960.
Mayer, M. S., Tullu, A., Simon, C. J., Kumar, J., Kaise, W.J., Kraft, J. M., & Muehlbauer, F. J. (1997). Devel-opment of a DNA marker for fusarium wilt resistancein chickpea. Crop Science, 37, 1625–1629.
Meyers, B. C., Kozik, A., Griego, A., Kuang, H. H., &Michelmore, R. W. (2003). Genome-wide analysis ofNBS-LRR-encoding genes in Arabidopsis. Plant Cell,15, 809–834.
Miklas, P. N., Kelly, J. D., Beebe, S. E., & Blair, M. W.(2006). Common bean breeding for resistance againstbiotic and abiotic stresses: from classical to MASbreeding. Euphytica, 147, 105–131.
Millan, T., Rubio, J., Iruela, M., Daly, K., Cubero, J. I., &Gil, J. (2003). Markers associated with Ascochytablight resistance in chickpea an their potential inmarker-assisted selection. Field Crops Research, 84,373–384.
Muehlbauer, F. J., & Kaiser, W. J. (1994). Using host plantresistance to manage biotic stresses in cool seasongrain legumes. Euphytica, 73, 1–10.
Polzin, K. M., Lohnes, D. G., Nickell, C. D., & Shoemaker,R. C. (1994). Integration of Rps2, Rmd, and Rj2 intolinkage group J of the soybean molecular map. Jour-nal of Heredity, 85, 300–303.
Rakshit, S., Winter, P., Tekeoglu, M., Juarez Munoz, J.,Pfaff, T., Benko-Iseppon, A. M., Muehlbauer, F. J., &Kahl, G. (2003). DAF marker tightly linked to amajor locus for Ascochyta blight resistance in chick-pea (Cicer arietinum L.). Euphytica, 132, 23–30.
Ratnaparkhe, M. B., Santra, D. K., Tullu, A., & Mu-ehlbauer, F. J. (1998a) Inheritance of inter-simple-sequence-repeat polymorphisms and linkage with afusarium wilt resistance gene in chickpea. Theoreticaland Applied Genetics, 96, 348–353.
Ratnaparkhe, M. B., Tekeoglu, M., & Muehlbauer, F. J.(1998b). Intersimple-sequence-repeat (ISSR) poly-morphisms are useful for finding markers associatedwith disease resistance gene clusters. Theoretical andApplied Genetics, 97, 515–519.
Rubio, J., Moussa, E., Kharrat, M., Moreno, M. T., Millan,T., & Gil, J. (2003). Two genes and linked RAPDmarkers involved in resistance to Fusarium oxyspo-rum f. sp. ciceris race 0 in chickpea. Plant Breeding,122, 188–191.
Santra, D. K., Tekeoglu, M., Ratnaparkhe, M., Kaiser, W.J., & Muehlbauer, F. J. (2000). Identification andmapping of QTLs conferring resistance to ascochytablight in chickpea. Crop Science, 40, 1606–1612.
Sharma, K. D., Winter, P., Kahl, G., & Muehlbauer, F. J.(2004). Molecular mapping of Fusarium oxysporum f.sp. ciceris race 3 resistance gene in chickpea. Theo-retical and Applied Genetics, 108, 1243–1248.
Sharma, K. D., Chen, W., & Muehlbauer, F. J. (2005).Genetics of chickpea resistance to five races of Fusa-rium wilt and a concise set of race differentials forFusarium oxysporum f. sp. ciceris. Plant Disease, 89,385–390.
Singh, K. B., & Reddy, M. V. (1983). Inheritance ofresistance to ascochyta blight in chickpea. Crop Sci-ence, 23, 9–10.
Singh, K. B., & Reddy, M. V. (1993). Resistance to sixraces of Ascochyta rabiei in the world germplasmcollection of chickpea. Crop Science, 33, 186–189.
Song, Q. J., Marek, L. F., Shoemaker, R. C., Lark, K. G.,Concibido, V. C., Delannay, X., Specht, J. E., &Cregan, P. B. (2004). A new integrated genetic link-age map of the soybean. Theoretical and AppliedGenetics, 109, 122–128.
Takken, F. L. W., & Joosten, M. H. A. J. (2000). Plantresistancegenes: their structure, function andevolution.European Journal of Plant Pathology, 106, 699–713.
Tekeoglu, M., Santra, D. K., Kaiser, W. J., & Muehlbauer,F. J. (2000). Ascochyta blight resistance inheritance inthree chickpea recombinant inbred line populations.Crop Science, 40, 1251–1256.
Tekeoglu, M., Rajesh, P. N., & Muehlbauer, F. J. (2002).Integration of sequence tagged microsatellite sites tothe chickpea genetic map. Theoretical and AppliedGenetics, 105, 847–854.
Tewari, S. K., & Pandey, M. P. (1986). Genetics of resis-tance to ascochyta blight in chickpea (Cicer arietinumL.). Euphytica, 35, 211–215.
Tullu, A, Muehlbauer, F. J., Simon, C. J., Mayer, M. S.,Kumar, J, Kaiser, W. J., & Kraft, J. M., (1998).Inheritance and linkage of a gene for resistance torace 4 of fusarium wilt and RAPD markers in chick-pea. Euphytica, 102, 227–232.
Udupa, S. M., & Baum, M (2003). Genetic dissection ofpathotype-specific resistance to ascochyta blight dis-ease in chickpea (Cicer arietinum L.) using microsat-ellite markers. Theoretical and Applied Genetics, 106,1196–1202.
Van Ooijen J. W. (2004). MAPQIL� 5, Software for themapping of quantitative trait loci in experimentalpopulations. Wageningen, the Netherlands: PlantResearch International.
Van Ooijen J. W., & Voorrips R. E. (2001). Joinmap� 3.0,Software for the calculation of genetic maps. Wagen-ingen, the Netherlands: Plant Research International.
Williams, P. C., & Singh, U. (1987). The Chickpea–Nutritional quality and the evaluation of quality. InM. C. Saxena & K. B. Singh (Eds.), The Chickpea (pp.329–356). Wallingford, UK: CAB International.
Winter, P., Pfaff, T., Udupa, S. M., Huttel, B., Sharma, P.C., Sahi, S., Arreguin-Espinoza, R., Weigand, F.,Muehlbauer, F. J., & Kahl, G. (1999). Characteriza-tion and mapping of sequence-tagged microsatellitesites in the chickpea (Cicer arietinum L.) genome.Molecular & General Genetics, 262, 90–101.
36 Eur J Plant Pathol (2007) 119:29–37
123
Winter, P., Benko-Iseppon, A. M., Huttel, B., Ratnapar-khe, M., Tullu, A., Sonnante, G., Pfaff, T., Tekeoglu,M., Santra, D., Sant, V. J., Rajesh, P. N., Kahl, G., &Muehlbauer, F. J. (2000). A linkage map of thechickpea (Cicer arietinum L.) genome based on re-combinant inbred lines from a C. arietinum C. retic-ulatum cross: localization of resistance gene forfusarium wilt races 4 and 5. Theoretical and AppliedGenetics, 101, 1155–1163.
Winter, P., Staginnus, C., Sharma, P. C., & Kahl, G. (2003).Organisation and genetic mapping of the chickpeagenome. In P. K. Jaiwal, & R. P. Singh (Eds.),Improvement strategies for leguminosae biotechnology(pp. 303–351). The Netherlands: Kluwer AcademicPublishers, Dordrecht.
Eur J Plant Pathol (2007) 119:29–37 37
123
FULL RESEARCH PAPER
Genetic relationships among Chickpea (Cicer arietinum L.)genotypes based on the SSRs at the quantitative trait Locifor resistance to Ascochyta Blight
B. Tar’an Æ T. Warkentin Æ A. Tullu ÆA. Vandenberg
Received: 30 October 2006 / Accepted: 1 March 2007 / Published online: 30 March 2007
� KNPV 2007
Abstract Breeding for resistance to ascochyta
blight in chickpea has been challenged by several
factors including the limited sources of good
resistance. Characterization of a set of genotypes
that may contain different genes for resistance may
help breeders to develop better and more durable
resistance compared to current cultivars. The objec-
tive of this study was to evaluate the genetic
relationships of 37 chickpea germplasm accessions
differing in reaction to ascochyta blight using Simple
Sequence Repeat (SSR) markers linked to Quantita-
tive Trait Loci (QTL) for resistance. The results
demonstrated that ILC72 and ILC3279, landraces
from the former Soviet Union, had SSR alleles that
were common among the kabuli breeding lines and
cultivars. A lower SSR allele diversity was found on
LG4 than on other regions. No correlation was found
between the dendrogram derived using SSRs at the
QTL regions and the SSRs derived from other parts
of the genome. The clustering based on 127 alleles of
17 SSRs associated with the QTL for ascochyta blight
resistance enabled us to differentiate three major
groups within the current germplasm accessions. The
first group was the desi germplasm originating from
India and cultivars derived from it. The second group
was a mix of desi genotypes originating from India
and Greece, and kabuli breeding lines from ICARDA
and the University of Saskatchewan. The third and
largest group consisted of landraces originating
mostly from the former Soviet Union and breeding
lines/cultivars of the kabuli type. Several moderately
resistance genotypes that are distantly related were
identified. Disease evaluation on three test popula-
tions suggested that it is possible to enhance the level
of resistance by crossing moderately resistant parents
with distinct genetic backgrounds at the QTL for
resistance to ascochyta blight.
Keywords Chickpea � Ascochyta blight resistance �Quantitative Trait Loci (QTL) � Simple Sequence
Repeat (SSR)
Introduction
Ascochyta blight caused by the fungus Ascochyta
rabiei is one of the most destructive diseases of
chickpea worldwide resulting in reduced yield and
quality. Yield losses of up to 100% have been
reported in severely infected fields (Acikgoz et al.
1994). Seed treatment and foliar application of
fungicides, as well as cultural practices are often
unsuccessful and uneconomical for controlling this
disease (Nene and Reddy 1987). The use of cultivars
with high levels of resistance is considered the most
B. Tar’an (&) � T. Warkentin � A. Tullu �A. Vandenberg
Crop Development Centre, College of Agriculture
and Bioresources, University of Saskatchewan, 51
Campus Drive, Saskatoon, SK, CanadaS7N 5A8
e-mail: [email protected]
123
Eur J Plant Pathol (2007) 119:39–51
DOI 10.1007/s10658-007-9118-8
economical solution for long-term disease manage-
ment. The use of resistant cultivars will also help to
stabilize chickpea production. Breeding for resis-
tance to ascochyta blight in chickpea has been
limited by several factors, including the high
pathogenic variability of the fungus and the limited
sources of good resistance (Khan et al. 1999; Singh
and Reddy 1993).
Early studies by Singh and Reddy (1993) demon-
strated that only five genotypes (ICC4475, ICC6328,
ICC12004, ILC200 and ILC6482) out of 19,343
accessions were resistant to ascochyta blight in
repeated field and greenhouse evaluations. Chen
et al. (2004) further reported that the germplasm
lines ICC3996, ICC4475 and ICC12004 were resis-
tant against a number of A. rabiei isolates originating
from northwestern United States. Several other
accessions of different origins with reported resis-
tance to ascochyta blight included: ILC72, ILC195,
ILC200, ILC482, ILC3279 and ILC6482 (Reddy and
Singh 1992; Singh et al. 1992; 1993). Most breeding
programmes worldwide have relied heavily on two
kabuli genotypes, ILC72 and ILC3279, as sources for
ascochyta blight resistance (Crino 1990; Muehlbauer
et al. 1998, 2004; Muehlbauer and Kaiser 2002;
Millan et al. 2003; Rubio et al. 2004). In many cases,
the occurrence of new pathotypes or the increased
aggressiveness of the current A. rabiei pathotypes
have broken the resistance in several of these
varieties. For example, cv. Sanford was initially
considered as a resistant variety; however, after
several years of production under Saskatchewan
environments it became very susceptible. The use
of additional resistance sources in breeding pro-
grammes is needed to diversify the genetic basis of
resistance in elite chickpea germplasm and/or to
increase the level of resistance through gene
pyramiding. It is crucial, therefore, to characterize
accessions from diverse origins that may contain
different genes for resistance to ascochyta blight.
This will allow breeders to select sources of resis-
tance that may contain different genes and to
accumulate those genes in one cultivar to enhance
the levels of resistance.
Several approaches have been used to differentiate
disease resistance genes. These include the use of
differential isolates of the pathogen, the test of
allelism, the localization of the resistance genes in the
host genome and the use of molecular markers.
Several classifications have been suggested for
A. rabiei isolates based on the reactions of a set of
differential host plants (Udupa et al. 1998; Chen et al.
2004; Chongo et al. 2004). However, the lack of
universal differential host plants for isolate charac-
terization and the use of different screening tech-
niques or conditions, as well as the absence of a
consensus as to whether the variability of A. rabiei is
due to race or aggressiveness of a single race, make it
difficult to distinguish different resistance genes
using different pathogen isolates. Furthermore, reac-
tion of different genotypes with potentially different
genes for resistance to ascochyta blight often results
in similar phenotypes. Therefore, resistance that may
be contributed by different genes cannot be separated
on the basis of disease evaluation alone. Molecular
markers linked to the resistance genes offer an
alternative tool for tracing genes for resistance to
ascochyta blight. In addition, molecular markers can
be used to assess the diversity at specific genomic
regions that are associated with resistance to disease
and to measure genetic relationships among geno-
types. This approach has been used in wheat to
separate germplasm with different resistance genes to
fusarium head blight caused by Fusarium graminea-
rum (McCartney et al. 2004).
To date, a number of Quantitative Trait Loci
(QTL) for resistance to ascochyta blight were
identified by different groups (Santra et al. 2000;
Tekeoglu et al. 2002; Flandez-Galvez et al. 2003;
Millan et al. 2003; Udupa and Baum 2003; Cho et al.
2004; Iruela et al. 2006). The use of common Simple
Sequence Repeat (SSR) markers in most of these
studies provided general conclusions that a major
QTL on LG 2 close to the GA16 marker controlled
the resistance to pathotype I of A. rabiei. Another
region on LG2 at the proximity of TA37 locus also
contributed to the resistance to pathotype I. Most
reports demonstrated that the resistance to pathotype
II is located on LG4. A number of SSR loci (GAA47,
TA130, TR20, TA72, TS72 and TA2) were mapped
within this region (Winter et al. 2000; Udupa and
Baum 2003; Cho et al. 2004). By single-point
analysis Cho et al. (2004) identified an additional
SSR marker (TA46) that was strongly associated with
the resistance derived from FLIP84-92C. This marker
explained between 59% and 69% of the variation for
resistance using different isolates under controlled
environments; however, this marker did not show
40 Eur J Plant Pathol (2007) 119:39–51
123
linkage to other markers on the map. Using
ICC12004 as the source of resistance, Flandez-
Galvez et al. (2003) identified additional QTL for
resistance to ascochyta blight under field conditions
on a 5.6 cM interval between TS12b and STMS28 on
LG1. Furthermore, a region flanked by TS45 and
TA3b on LG2 was significantly associated with the
disease reaction under controlled environments
(Flandez-Galvez et al. 2003). The SSR marker loci
on LG2 of the map reported by Flandez-Galvez et al.
(2003) correspond to LG8 of the map constructed by
Winter et al. (2000).
The current study used the available SSRs from
previous mapping and QTL studies to evaluate the
genetic relationships among 37 chickpea germplasm
accessions differing in reaction to ascochyta blight.
The chickpea germplasm accessions used for the
analysis were derived from diverse geographical
origins. The study provided information for the
effective use of diverse genetic resources to improve
ascochyta blight resistance in chickpea.
Materials and methods
Plant materials and field disease screening
One hundred and eighty-two chickpea germplasm
accessions with putative resistance to ascochyta
blight derived from the International Crop Research
Institute for the Semi-Arid Tropics (ICRISAT),
International Centre for Agricultural Research in the
Dry Areas (ICARDA), Washington State University,
Regional Plant Introduction Station (WRPIS), United
States Department of Agriculture (USDA) and Crop
Development Centre, University of Saskatchewan
collections were tested in the field in Saskatoon,
Canada in the summers of 2003 and 2004. In this
screening the germplasm accessions were exposed to
naturally occurring mixed populations of A. rabiei.
To increase the disease pressure, dried infected plant
debris collected from chickpea production areas in
Saskatchewan, Canada in the previous year was
spread throughout the plot area and high humidity
was maintained with misting irrigation. Thirty-five
genotypes with the lowest disease scores (6 or lower
using the same scale as for indoor disease screening)
were selected and planted in the greenhouse for
further disease evaluation under controlled environ-
ments. The summary of indoor disease screening is
presented in Table 1.
Indoor disease screening
A single-spore derived culture of A. rabiei isolate
ar68–2001 was used for indoor disease screening.
The ar68–2001 isolate was collected from cv.
Sanford from a commercial production field in
Saskatchewan in 2001. The isolate was selected for
a high level of aggressiveness from a collection of
more than 250 isolates obtained from different
chickpea cultivars and production areas across Sas-
katchewan between 1998 and 2002. The isolate was
grown at room temperature under continuous fluo-
rescent light. Primary inoculum was produced by
diluting 7 day-old colonies with sterile distilled water
followed by agitating the cultures with a sterile glass
rod. The suspensions were filtered through a Mira-
cloth layer and adjusted to the final concentration of
2 · 105 conidia ml�1 using a hemacytometer. Tween
20 surfactant (polyoxyethylene sorbitan monolaurate)
was added at a rate of one drop 100 ml�1 suspension.
Ten seeds of each chickpea genotype were grown
in 10 cm square pots (1 seed per pot) in a greenhouse
for four weeks. The plants were inoculated by
spraying 2 ml of conidial suspension per plant or
until run-off using an atomizer. Immediately after
inoculation, the plants were transferred into a misting
chamber covered with a translucent plastic sheet to
provide 100% RH during the infection period. After
48 h incubation, the plants were transferred to a
greenhouse bench. The temperature was maintained
at 20/168C (day/night) and 16 h photoperiod with
fluorescent and incandescent lights. Plant reactions
were scored visually two weeks after inoculation.
Scoring was made on an individual plant basis on a
scale of 0–9 (Singh and Reddy 1993; Chongo et al.
2004); where 0 = immune, no symptoms of disease;
1 = few, very small lesions (<2 mm2) on leaves and
stems (1–2% plant area infected); 2 = many, very
small lesions and few small lesions (2–5 mm2) on
leaves and stems (3–5% plant area infected); 3 = many
small lesions (6–10% plant area infected); 4 = few
small and few large lesions (>5 mm2), 11–25% plant
area infected; 5 = many small and large lesions
(26–50% plant area infected); 6 = many small and
large lesions, lesions coalescing (51–75% plant area
Eur J Plant Pathol (2007) 119:39–51 41
123
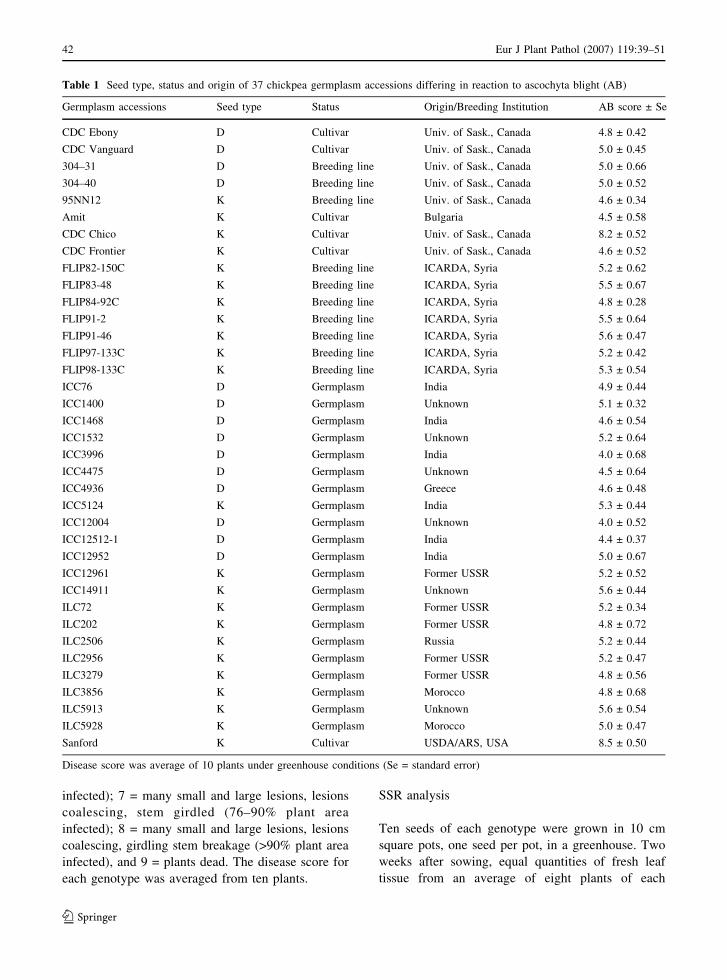
infected); 7 = many small and large lesions, lesions
coalescing, stem girdled (76–90% plant area
infected); 8 = many small and large lesions, lesions
coalescing, girdling stem breakage (>90% plant area
infected), and 9 = plants dead. The disease score for
each genotype was averaged from ten plants.
SSR analysis
Ten seeds of each genotype were grown in 10 cm
square pots, one seed per pot, in a greenhouse. Two
weeks after sowing, equal quantities of fresh leaf
tissue from an average of eight plants of each
Table 1 Seed type, status and origin of 37 chickpea germplasm accessions differing in reaction to ascochyta blight (AB)
Germplasm accessions Seed type Status Origin/Breeding Institution AB score ± Se
CDC Ebony D Cultivar Univ. of Sask., Canada 4.8 ± 0.42
CDC Vanguard D Cultivar Univ. of Sask., Canada 5.0 ± 0.45
304–31 D Breeding line Univ. of Sask., Canada 5.0 ± 0.66
304–40 D Breeding line Univ. of Sask., Canada 5.0 ± 0.52
95NN12 K Breeding line Univ. of Sask., Canada 4.6 ± 0.34
Amit K Cultivar Bulgaria 4.5 ± 0.58
CDC Chico K Cultivar Univ. of Sask., Canada 8.2 ± 0.52
CDC Frontier K Cultivar Univ. of Sask., Canada 4.6 ± 0.52
FLIP82-150C K Breeding line ICARDA, Syria 5.2 ± 0.62
FLIP83-48 K Breeding line ICARDA, Syria 5.5 ± 0.67
FLIP84-92C K Breeding line ICARDA, Syria 4.8 ± 0.28
FLIP91-2 K Breeding line ICARDA, Syria 5.5 ± 0.64
FLIP91-46 K Breeding line ICARDA, Syria 5.6 ± 0.47
FLIP97-133C K Breeding line ICARDA, Syria 5.2 ± 0.42
FLIP98-133C K Breeding line ICARDA, Syria 5.3 ± 0.54
ICC76 D Germplasm India 4.9 ± 0.44
ICC1400 D Germplasm Unknown 5.1 ± 0.32
ICC1468 D Germplasm India 4.6 ± 0.54
ICC1532 D Germplasm Unknown 5.2 ± 0.64
ICC3996 D Germplasm India 4.0 ± 0.68
ICC4475 D Germplasm Unknown 4.5 ± 0.64
ICC4936 D Germplasm Greece 4.6 ± 0.48
ICC5124 K Germplasm India 5.3 ± 0.44
ICC12004 D Germplasm Unknown 4.0 ± 0.52
ICC12512-1 D Germplasm India 4.4 ± 0.37
ICC12952 D Germplasm India 5.0 ± 0.67
ICC12961 K Germplasm Former USSR 5.2 ± 0.52
ICC14911 K Germplasm Unknown 5.6 ± 0.44
ILC72 K Germplasm Former USSR 5.2 ± 0.34
ILC202 K Germplasm Former USSR 4.8 ± 0.72
ILC2506 K Germplasm Russia 5.2 ± 0.44
ILC2956 K Germplasm Former USSR 5.2 ± 0.47
ILC3279 K Germplasm Former USSR 4.8 ± 0.56
ILC3856 K Germplasm Morocco 4.8 ± 0.68
ILC5913 K Germplasm Unknown 5.6 ± 0.54
ILC5928 K Germplasm Morocco 5.0 ± 0.47
Sanford K Cultivar USDA/ARS, USA 8.5 ± 0.50
Disease score was average of 10 plants under greenhouse conditions (Se = standard error)
42 Eur J Plant Pathol (2007) 119:39–51
123
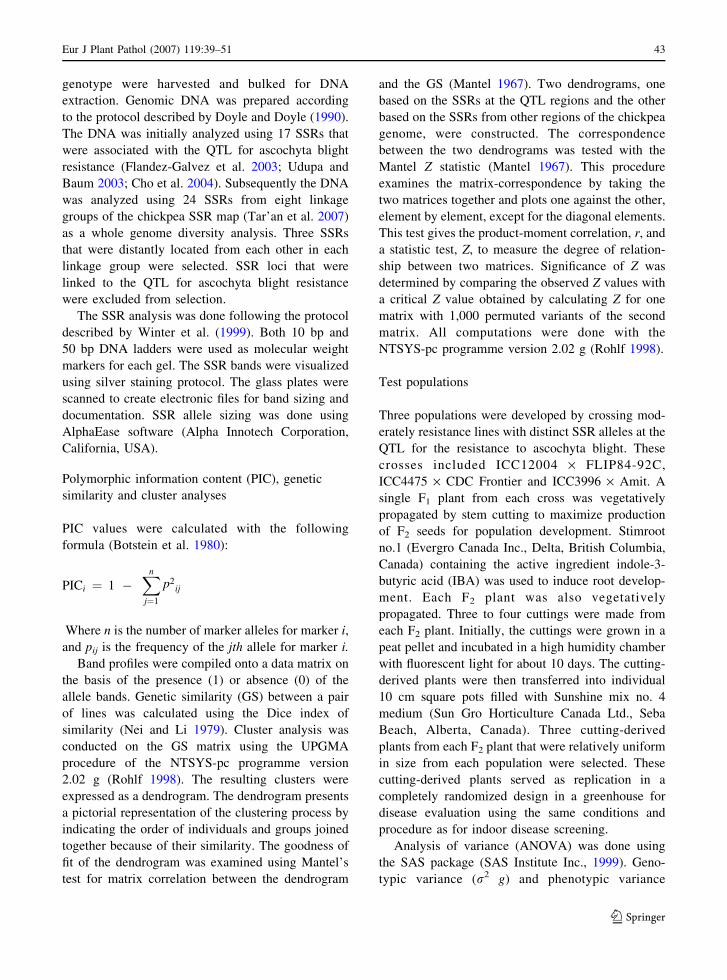
genotype were harvested and bulked for DNA
extraction. Genomic DNA was prepared according
to the protocol described by Doyle and Doyle (1990).
The DNA was initially analyzed using 17 SSRs that
were associated with the QTL for ascochyta blight
resistance (Flandez-Galvez et al. 2003; Udupa and
Baum 2003; Cho et al. 2004). Subsequently the DNA
was analyzed using 24 SSRs from eight linkage
groups of the chickpea SSR map (Tar’an et al. 2007)
as a whole genome diversity analysis. Three SSRs
that were distantly located from each other in each
linkage group were selected. SSR loci that were
linked to the QTL for ascochyta blight resistance
were excluded from selection.
The SSR analysis was done following the protocol
described by Winter et al. (1999). Both 10 bp and
50 bp DNA ladders were used as molecular weight
markers for each gel. The SSR bands were visualized
using silver staining protocol. The glass plates were
scanned to create electronic files for band sizing and
documentation. SSR allele sizing was done using
AlphaEase software (Alpha Innotech Corporation,
California, USA).
Polymorphic information content (PIC), genetic
similarity and cluster analyses
PIC values were calculated with the following
formula (Botstein et al. 1980):
PICi ¼ 1 �Xn
j¼1
p2ij
Where n is the number of marker alleles for marker i,
and pij is the frequency of the jth allele for marker i.
Band profiles were compiled onto a data matrix on
the basis of the presence (1) or absence (0) of the
allele bands. Genetic similarity (GS) between a pair
of lines was calculated using the Dice index of
similarity (Nei and Li 1979). Cluster analysis was
conducted on the GS matrix using the UPGMA
procedure of the NTSYS-pc programme version
2.02 g (Rohlf 1998). The resulting clusters were
expressed as a dendrogram. The dendrogram presents
a pictorial representation of the clustering process by
indicating the order of individuals and groups joined
together because of their similarity. The goodness of
fit of the dendrogram was examined using Mantel’s
test for matrix correlation between the dendrogram
and the GS (Mantel 1967). Two dendrograms, one
based on the SSRs at the QTL regions and the other
based on the SSRs from other regions of the chickpea
genome, were constructed. The correspondence
between the two dendrograms was tested with the
Mantel Z statistic (Mantel 1967). This procedure
examines the matrix-correspondence by taking the
two matrices together and plots one against the other,
element by element, except for the diagonal elements.
This test gives the product-moment correlation, r, and
a statistic test, Z, to measure the degree of relation-
ship between two matrices. Significance of Z was
determined by comparing the observed Z values with
a critical Z value obtained by calculating Z for one
matrix with 1,000 permuted variants of the second
matrix. All computations were done with the
NTSYS-pc programme version 2.02 g (Rohlf 1998).
Test populations
Three populations were developed by crossing mod-
erately resistance lines with distinct SSR alleles at the
QTL for the resistance to ascochyta blight. These
crosses included ICC12004 · FLIP84-92C,
ICC4475 · CDC Frontier and ICC3996 · Amit. A
single F1 plant from each cross was vegetatively
propagated by stem cutting to maximize production
of F2 seeds for population development. Stimroot
no.1 (Evergro Canada Inc., Delta, British Columbia,
Canada) containing the active ingredient indole-3-
butyric acid (IBA) was used to induce root develop-
ment. Each F2 plant was also vegetatively
propagated. Three to four cuttings were made from
each F2 plant. Initially, the cuttings were grown in a
peat pellet and incubated in a high humidity chamber
with fluorescent light for about 10 days. The cutting-
derived plants were then transferred into individual
10 cm square pots filled with Sunshine mix no. 4
medium (Sun Gro Horticulture Canada Ltd., Seba
Beach, Alberta, Canada). Three cutting-derived
plants from each F2 plant that were relatively uniform
in size from each population were selected. These
cutting-derived plants served as replication in a
completely randomized design in a greenhouse for
disease evaluation using the same conditions and
procedure as for indoor disease screening.
Analysis of variance (ANOVA) was done using
the SAS package (SAS Institute Inc., 1999). Geno-
typic variance (r2 g) and phenotypic variance
Eur J Plant Pathol (2007) 119:39–51 43
123
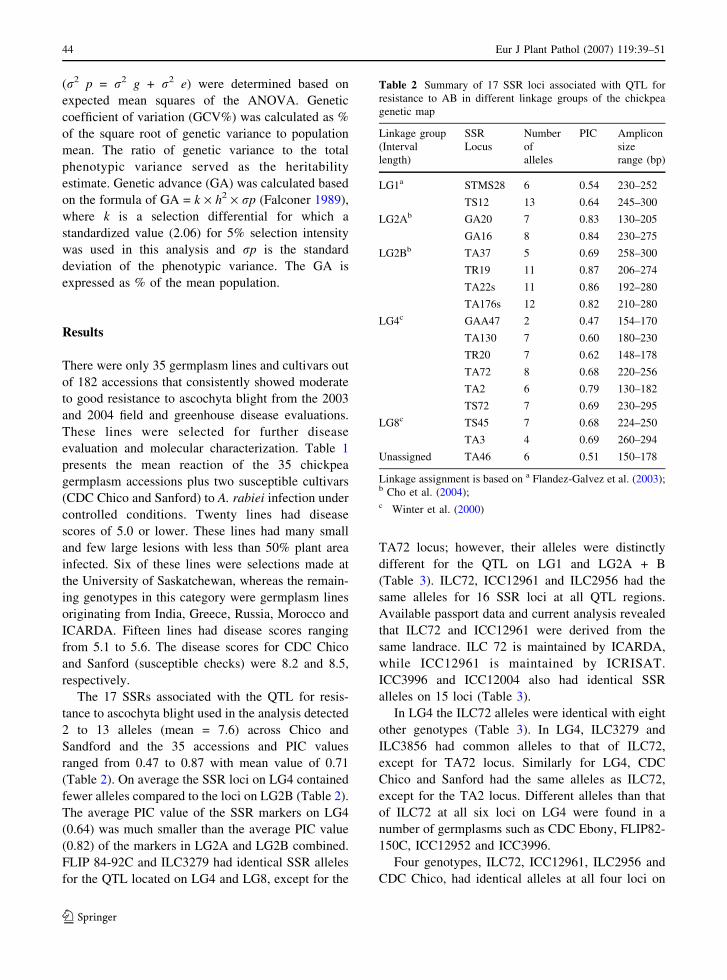
(r2 p = r2 g + r2 e) were determined based on
expected mean squares of the ANOVA. Genetic
coefficient of variation (GCV%) was calculated as %
of the square root of genetic variance to population
mean. The ratio of genetic variance to the total
phenotypic variance served as the heritability
estimate. Genetic advance (GA) was calculated based
on the formula of GA = k · h2 · rp (Falconer 1989),
where k is a selection differential for which a
standardized value (2.06) for 5% selection intensity
was used in this analysis and rp is the standard
deviation of the phenotypic variance. The GA is
expressed as % of the mean population.
Results
There were only 35 germplasm lines and cultivars out
of 182 accessions that consistently showed moderate
to good resistance to ascochyta blight from the 2003
and 2004 field and greenhouse disease evaluations.
These lines were selected for further disease
evaluation and molecular characterization. Table 1
presents the mean reaction of the 35 chickpea
germplasm accessions plus two susceptible cultivars
(CDC Chico and Sanford) to A. rabiei infection under
controlled conditions. Twenty lines had disease
scores of 5.0 or lower. These lines had many small
and few large lesions with less than 50% plant area
infected. Six of these lines were selections made at
the University of Saskatchewan, whereas the remain-
ing genotypes in this category were germplasm lines
originating from India, Greece, Russia, Morocco and
ICARDA. Fifteen lines had disease scores ranging
from 5.1 to 5.6. The disease scores for CDC Chico
and Sanford (susceptible checks) were 8.2 and 8.5,
respectively.
The 17 SSRs associated with the QTL for resis-
tance to ascochyta blight used in the analysis detected
2 to 13 alleles (mean = 7.6) across Chico and
Sandford and the 35 accessions and PIC values
ranged from 0.47 to 0.87 with mean value of 0.71
(Table 2). On average the SSR loci on LG4 contained
fewer alleles compared to the loci on LG2B (Table 2).
The average PIC value of the SSR markers on LG4
(0.64) was much smaller than the average PIC value
(0.82) of the markers in LG2A and LG2B combined.
FLIP 84-92C and ILC3279 had identical SSR alleles
for the QTL located on LG4 and LG8, except for the
TA72 locus; however, their alleles were distinctly
different for the QTL on LG1 and LG2A + B
(Table 3). ILC72, ICC12961 and ILC2956 had the
same alleles for 16 SSR loci at all QTL regions.
Available passport data and current analysis revealed
that ILC72 and ICC12961 were derived from the
same landrace. ILC 72 is maintained by ICARDA,
while ICC12961 is maintained by ICRISAT.
ICC3996 and ICC12004 also had identical SSR
alleles on 15 loci (Table 3).
In LG4 the ILC72 alleles were identical with eight
other genotypes (Table 3). In LG4, ILC3279 and
ILC3856 had common alleles to that of ILC72,
except for TA72 locus. Similarly for LG4, CDC
Chico and Sanford had the same alleles as ILC72,
except for the TA2 locus. Different alleles than that
of ILC72 at all six loci on LG4 were found in a
number of germplasms such as CDC Ebony, FLIP82-
150C, ICC12952 and ICC3996.
Four genotypes, ILC72, ICC12961, ILC2956 and
CDC Chico, had identical alleles at all four loci on
Table 2 Summary of 17 SSR loci associated with QTL for
resistance to AB in different linkage groups of the chickpea
genetic map
Linkage group
(Interval
length)
SSR
Locus
Number
of
alleles
PIC Amplicon
size
range (bp)
LG1a STMS28 6 0.54 230–252
TS12 13 0.64 245–300
LG2Ab GA20 7 0.83 130–205
GA16 8 0.84 230–275
LG2Bb TA37 5 0.69 258–300
TR19 11 0.87 206–274
TA22s 11 0.86 192–280
TA176s 12 0.82 210–280
LG4c GAA47 2 0.47 154–170
TA130 7 0.60 180–230
TR20 7 0.62 148–178
TA72 8 0.68 220–256
TA2 6 0.79 130–182
TS72 7 0.69 230–295
LG8c TS45 7 0.68 224–250
TA3 4 0.69 260–294
Unassigned TA46 6 0.51 150–178
Linkage assignment is based on a Flandez-Galvez et al. (2003);b Cho et al. (2004);c Winter et al. (2000)
44 Eur J Plant Pathol (2007) 119:39–51
123
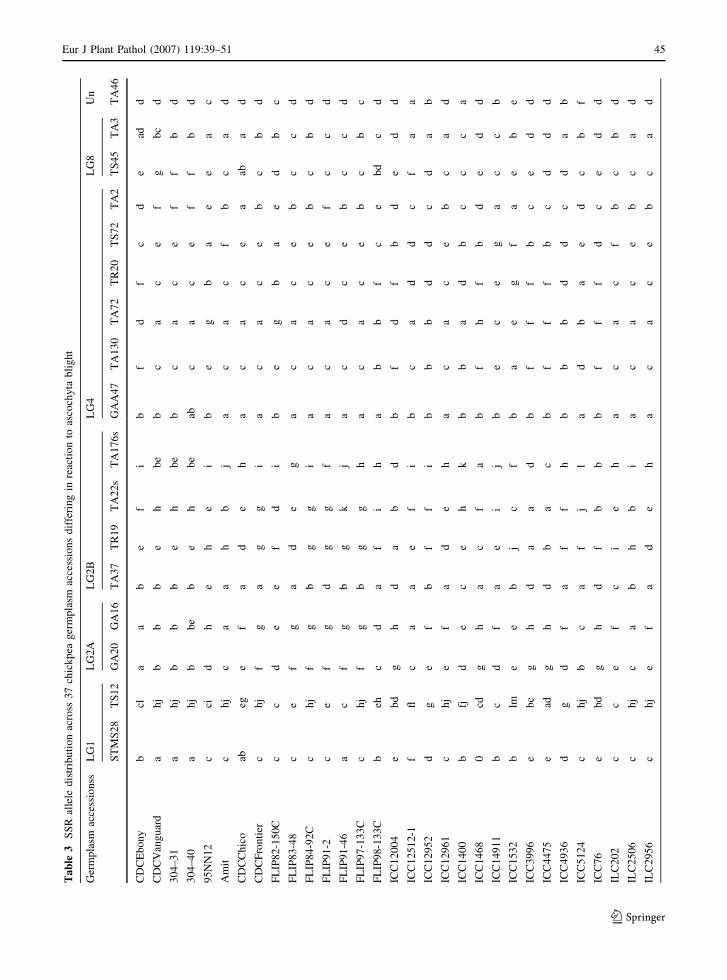
Ta
ble
3S
SR
alle
led
istr
ibu
tio
nac
ross
37
chic
kp
eag
erm
pla
smac
cess
ion
sd
iffe
rin
gin
reac
tio
nto
asco
chy
tab
lig
ht
Ger
mp
lasm
acce
ssio
nss
LG
1L
G2
AL
G2
BL
G4
LG
8U
n
ST
MS
28
TS
12
GA
20
GA
16
TA
37
TR
19
TA
22
sT
A1
76
sG
AA
47
TA
13
0T
A7
2T
R2
0T
S7
2T
A2
TS
45
TA
3T
A4
6
CD
CE
bo
ny
bcl
aa
be
fi
bf
df
cd
ead
d
CD
CV
ang
uar
da
hj
bb
be
hb
eb
ca
ce
fg
bc
d
30
4–
31
ah
jb
bb
eh
be
bc
ac
ef
fb
d
30
4–
40
ah
jb
be
be
hb
eab
ca
ce
ff
bd
95
NN
12
cci
dh
eh
ei
be
gb
ae
ea
c
Am
itc
hj
ca
ah
bj
ac
ac
fb
ca
d
CD
CC
hic
oab
ege
fa
de
ha
ca
ce
aab
ad
CD
CF
ron
tier
ch
jf
ga
gg
ia
ca
ce
bc
bd
FL
IP8
2-1
50
Cc
cd
ee
fd
ib
eg
ba
ed
bc
FL
IP8
3-4
8c
ef
ga
de
ga
ca
ce
bc
cd
FL
IP8
4-9
2C
ch
jf
gb
gg
ia
ca
ce
bc
bd
FL
IP9
1-2
ce
fg
dg
gf
ac
ac
ef
cc
d
FL
IP9
1-4
6a
cf
gb
gk
ja
cd
ce
bc
cd
FL
IP9
7-1
33
Cc
hj
fg
bg
gh
ac
ac
eb
cb
c
FL
IP9
8-1
33
Cb
ehc
da
fi
ha
bb
fc
eb
dc
d
ICC
12
00
4e
bd
gh
da
bd
bf
df
bd
ed
d
ICC
12
51
2-1
ffl
ca
ae
fi
bc
ad
dc
fa
a
ICC
12
95
2d
ge
fb
ff
ib
bb
dd
cd
ab
ICC
12
96
1c
hj
ef
ad
eh
ac
ac
eb
ca
d
ICC
14
00
bfj
de
ce
hk
bb
ad
bc
cc
a
ICC
14
68
0cd
gh
ac
fa
bf
hf
bd
ed
d
ICC
14
91
1b
cd
fa
ei
jb
ec
eg
ac
cb
ICC
15
32
blm
ee
bj
cf
ba
eg
fa
eb
e
ICC
39
96
eb
cg
hd
aa
db
ff
fb
ce
dd
ICC
44
75
ead
gh
db
ac
bf
ff
bc
dd
d
ICC
49
36
dg
df
af
fh
bb
bd
dc
da
b
ICC
51
24
ch
jb
ca
fj
la
db
ae
dc
bf
ICC
76
eb
dg
hd
fb
bb
ff
fd
ce
dd
ILC
20
2c
ce
fc
ie
ha
ca
cf
bc
bd
ILC
25
06
ch
jc
ab
hb
ia
ca
ce
bc
ad
ILC
29
56
ch
je
fa
de
ha
ca
ce
bc
ad
Eur J Plant Pathol (2007) 119:39–51 45
123
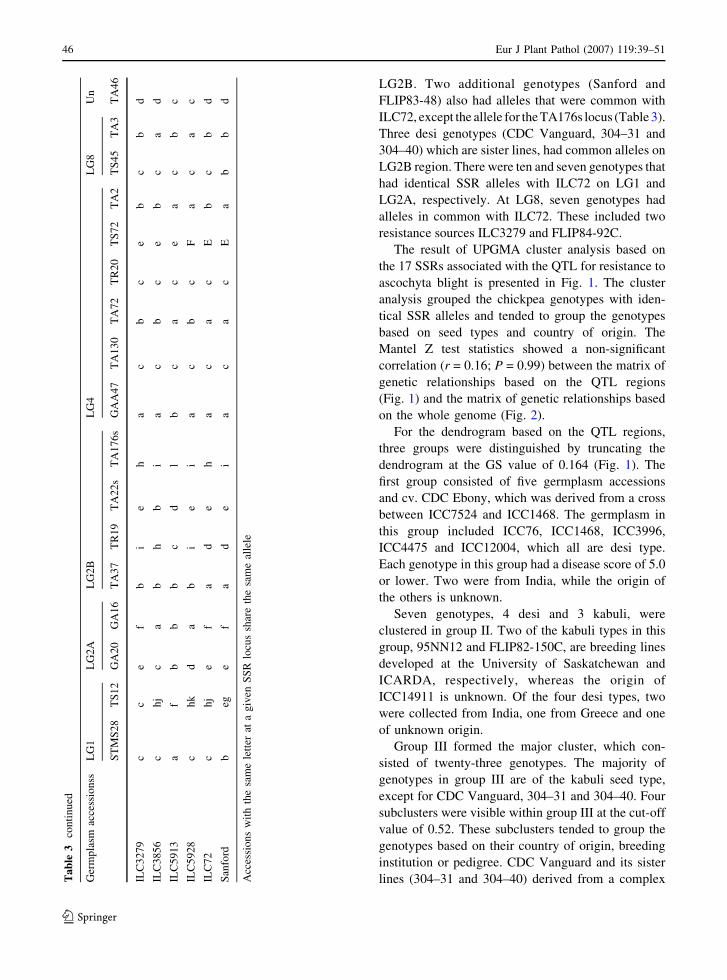
LG2B. Two additional genotypes (Sanford and
FLIP83-48) also had alleles that were common with
ILC72, except the allele for the TA176s locus (Table 3).
Three desi genotypes (CDC Vanguard, 304–31 and
304–40) which are sister lines, had common alleles on
LG2B region. There were ten and seven genotypes that
had identical SSR alleles with ILC72 on LG1 and
LG2A, respectively. At LG8, seven genotypes had
alleles in common with ILC72. These included two
resistance sources ILC3279 and FLIP84-92C.
The result of UPGMA cluster analysis based on
the 17 SSRs associated with the QTL for resistance to
ascochyta blight is presented in Fig. 1. The cluster
analysis grouped the chickpea genotypes with iden-
tical SSR alleles and tended to group the genotypes
based on seed types and country of origin. The
Mantel Z test statistics showed a non-significant
correlation (r = 0.16; P = 0.99) between the matrix of
genetic relationships based on the QTL regions
(Fig. 1) and the matrix of genetic relationships based
on the whole genome (Fig. 2).
For the dendrogram based on the QTL regions,
three groups were distinguished by truncating the
dendrogram at the GS value of 0.164 (Fig. 1). The
first group consisted of five germplasm accessions
and cv. CDC Ebony, which was derived from a cross
between ICC7524 and ICC1468. The germplasm in
this group included ICC76, ICC1468, ICC3996,
ICC4475 and ICC12004, which all are desi type.
Each genotype in this group had a disease score of 5.0
or lower. Two were from India, while the origin of
the others is unknown.
Seven genotypes, 4 desi and 3 kabuli, were
clustered in group II. Two of the kabuli types in this
group, 95NN12 and FLIP82-150C, are breeding lines
developed at the University of Saskatchewan and
ICARDA, respectively, whereas the origin of
ICC14911 is unknown. Of the four desi types, two
were collected from India, one from Greece and one
of unknown origin.
Group III formed the major cluster, which con-
sisted of twenty-three genotypes. The majority of
genotypes in group III are of the kabuli seed type,
except for CDC Vanguard, 304–31 and 304–40. Four
subclusters were visible within group III at the cut-off
value of 0.52. These subclusters tended to group the
genotypes based on their country of origin, breeding
institution or pedigree. CDC Vanguard and its sister
lines (304–31 and 304–40) derived from a complexTa
ble
3co
nti
nu
ed
Ger
mp
lasm
acce
ssio
nss
LG
1L
G2
AL
G2
BL
G4
LG
8U
n
ST
MS
28
TS
12
GA
20
GA
16
TA
37
TR
19
TA
22
sT
A1
76
sG
AA
47
TA
13
0T
A7
2T
R2
0T
S7
2T
A2
TS
45
TA
3T
A4
6
ILC
32
79
cc
ef
bi
eh
ac
bc
eb
cb
d
ILC
38
56
ch
jc
ab
hb
ia
cb
ce
bc
ad
ILC
59
13
af
bb
bc
dl
bc
ac
ea
cb
c
ILC
59
28
ch
kd
ab
ie
ia
cb
cF
ac
ac
ILC
72
ch
je
fa
de
ha
ca
cE
bc
bd
San
ford
beg
ef
ad
ei
ac
ac
Ea
bb
d
Acc
essi
on
sw
ith
the
sam
ele
tter
ata
giv
enS
SR
locu
ssh
are
the
sam
eal
lele
46 Eur J Plant Pathol (2007) 119:39–51
123
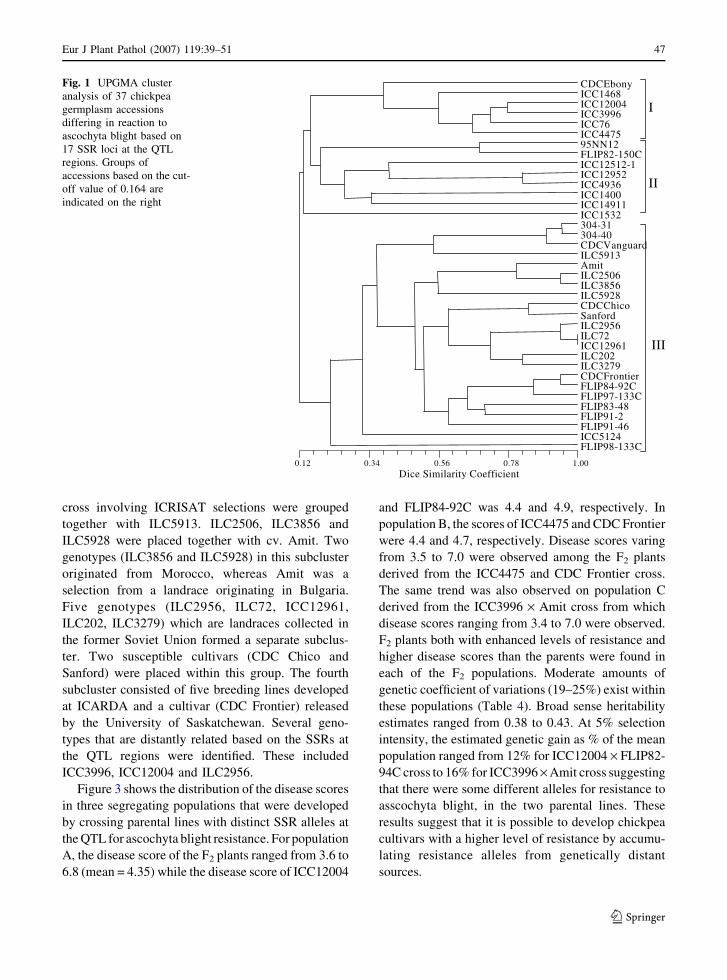
cross involving ICRISAT selections were grouped
together with ILC5913. ILC2506, ILC3856 and
ILC5928 were placed together with cv. Amit. Two
genotypes (ILC3856 and ILC5928) in this subcluster
originated from Morocco, whereas Amit was a
selection from a landrace originating in Bulgaria.
Five genotypes (ILC2956, ILC72, ICC12961,
ILC202, ILC3279) which are landraces collected in
the former Soviet Union formed a separate subclus-
ter. Two susceptible cultivars (CDC Chico and
Sanford) were placed within this group. The fourth
subcluster consisted of five breeding lines developed
at ICARDA and a cultivar (CDC Frontier) released
by the University of Saskatchewan. Several geno-
types that are distantly related based on the SSRs at
the QTL regions were identified. These included
ICC3996, ICC12004 and ILC2956.
Figure 3 shows the distribution of the disease scores
in three segregating populations that were developed
by crossing parental lines with distinct SSR alleles at
the QTL for ascochyta blight resistance. For population
A, the disease score of the F2 plants ranged from 3.6 to
6.8 (mean = 4.35) while the disease score of ICC12004
and FLIP84-92C was 4.4 and 4.9, respectively. In
population B, the scores of ICC4475 and CDC Frontier
were 4.4 and 4.7, respectively. Disease scores varing
from 3.5 to 7.0 were observed among the F2 plants
derived from the ICC4475 and CDC Frontier cross.
The same trend was also observed on population C
derived from the ICC3996 · Amit cross from which
disease scores ranging from 3.4 to 7.0 were observed.
F2 plants both with enhanced levels of resistance and
higher disease scores than the parents were found in
each of the F2 populations. Moderate amounts of
genetic coefficient of variations (19–25%) exist within
these populations (Table 4). Broad sense heritability
estimates ranged from 0.38 to 0.43. At 5% selection
intensity, the estimated genetic gain as % of the mean
population ranged from 12% for ICC12004 · FLIP82-
94C cross to 16% for ICC3996 · Amit cross suggesting
that there were some different alleles for resistance to
asscochyta blight, in the two parental lines. These
results suggest that it is possible to develop chickpea
cultivars with a higher level of resistance by accumu-
lating resistance alleles from genetically distant
sources.
Dice Similarity Coefficient0.12 0.34 0.56 0.78 1.00
CDCEbonyICC1468ICC12004ICC3996ICC76ICC447595NN12FLIP82-150CICC12512-1ICC12952ICC4936ICC1400ICC14911ICC1532304-31304-40CDCVanguardILC5913AmitILC2506ILC3856ILC5928CDCChicoSanfordILC2956ILC72ICC12961ILC202ILC3279CDCFrontierFLIP84-92CFLIP97-133CFLIP83-48FLIP91-2FLIP91-46ICC5124FLIP98-133C
I
II
III
Fig. 1 UPGMA cluster
analysis of 37 chickpea
germplasm accessions
differing in reaction to
ascochyta blight based on
17 SSR loci at the QTL
regions. Groups of
accessions based on the cut-
off value of 0.164 are
indicated on the right
Eur J Plant Pathol (2007) 119:39–51 47
123
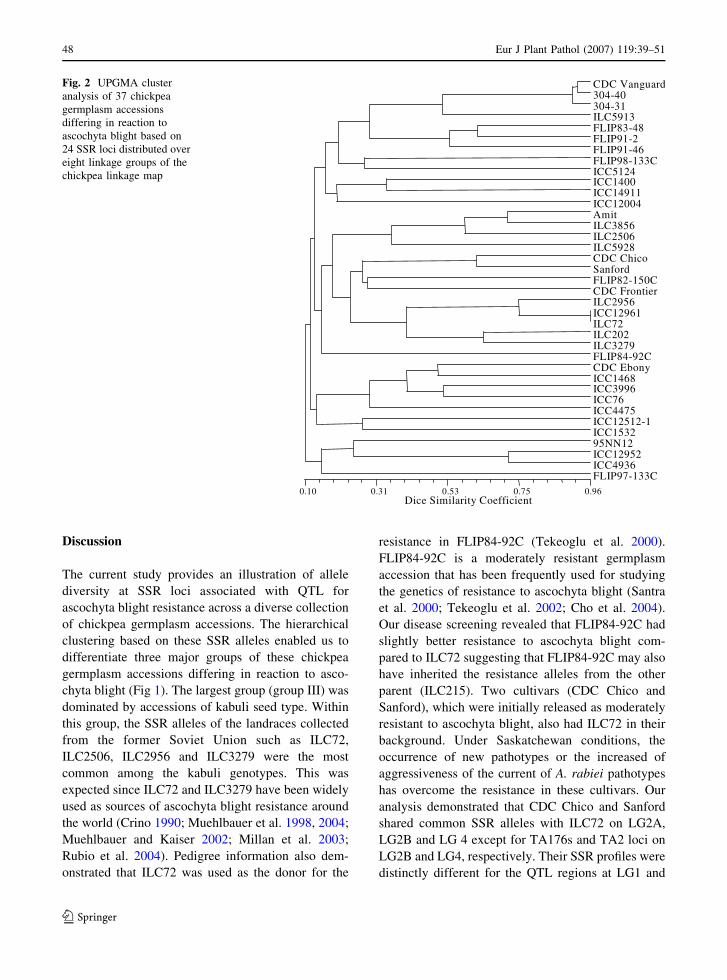
Discussion
The current study provides an illustration of allele
diversity at SSR loci associated with QTL for
ascochyta blight resistance across a diverse collection
of chickpea germplasm accessions. The hierarchical
clustering based on these SSR alleles enabled us to
differentiate three major groups of these chickpea
germplasm accessions differing in reaction to asco-
chyta blight (Fig 1). The largest group (group III) was
dominated by accessions of kabuli seed type. Within
this group, the SSR alleles of the landraces collected
from the former Soviet Union such as ILC72,
ILC2506, ILC2956 and ILC3279 were the most
common among the kabuli genotypes. This was
expected since ILC72 and ILC3279 have been widely
used as sources of ascochyta blight resistance around
the world (Crino 1990; Muehlbauer et al. 1998, 2004;
Muehlbauer and Kaiser 2002; Millan et al. 2003;
Rubio et al. 2004). Pedigree information also dem-
onstrated that ILC72 was used as the donor for the
resistance in FLIP84-92C (Tekeoglu et al. 2000).
FLIP84-92C is a moderately resistant germplasm
accession that has been frequently used for studying
the genetics of resistance to ascochyta blight (Santra
et al. 2000; Tekeoglu et al. 2002; Cho et al. 2004).
Our disease screening revealed that FLIP84-92C had
slightly better resistance to ascochyta blight com-
pared to ILC72 suggesting that FLIP84-92C may also
have inherited the resistance alleles from the other
parent (ILC215). Two cultivars (CDC Chico and
Sanford), which were initially released as moderately
resistant to ascochyta blight, also had ILC72 in their
background. Under Saskatchewan conditions, the
occurrence of new pathotypes or the increased of
aggressiveness of the current of A. rabiei pathotypes
has overcome the resistance in these cultivars. Our
analysis demonstrated that CDC Chico and Sanford
shared common SSR alleles with ILC72 on LG2A,
LG2B and LG 4 except for TA176s and TA2 loci on
LG2B and LG4, respectively. Their SSR profiles were
distinctly different for the QTL regions at LG1 and
Dice Similarity Coefficient0.10 0.31 0.53 0.75 0.96
CDC Vanguard304-40304-31ILC5913FLIP83-48FLIP91-2FLIP91-46FLIP98-133CICC5124ICC1400ICC14911ICC12004AmitILC3856ILC2506ILC5928CDC ChicoSanfordFLIP82-150CCDC FrontierILC2956ICC12961ILC72ILC202ILC3279FLIP84-92CCDC EbonyICC1468ICC3996ICC76ICC4475ICC12512-1ICC153295NN12ICC12952ICC4936FLIP97-133C
Fig. 2 UPGMA cluster
analysis of 37 chickpea
germplasm accessions
differing in reaction to
ascochyta blight based on
24 SSR loci distributed over
eight linkage groups of the
chickpea linkage map
48 Eur J Plant Pathol (2007) 119:39–51
123

LG8. Further analyses are needed to examine if these
differences may contribute to the maintenance of
resistance in ILC72 under Saskatchewan conditions.
The SSR allele diversity analysis demonstrated a
highly conserved allele combination for the SSR
across the QTL regions on LG4 compared to the QTL
on other linkage groups. These results suggested that
this region might have been targeted for selection for
ascochyta blight resistance reducing the overall
variation compared to other genomic regions.
0
10
20
30
40
50
3.0-4.0 4.1-5.0 5.1-6.0 6.1-7.0
ICC12004 (P1) x FLIP84-92C (P2); n = 111; mean 4.35
0
10
20
30
40
50
60
70
3.0-4.0 4.1-5.0 5.1-6.0 6.1-7.0
ICC4475 (P1) x CDC Frontier (P2); n =141; mean= 4.77
0
10
20
30
40
50
3.0-4.0 4.1-5.0 5.1-6.0 6.1-7.0
ICC3996 (P1) x Amit (P2); n = 144; mean= 4.60
A
B
C
P1 P2
P1 P2
P1 P2
Disease score
Num
bp
fore
lna
stu
Nm
bo
ref
lpan
tsN
umb
nalpfo
rest
Fig. 3 Frequency distributions of three F2 populations of chickpea derived from crosses of moderately resistant parents
(A = ICC12004 · FLIP84-92C; B = ICC4475 · CDC Frontier; C = ICC3996 · Amit). The number of F2 plants (n) for each
population and mean disease score for each populations are presented. Arrows show disease score for each parental line in each
population. The disease was rated using a 0 to 9 scale, where 0 = no symptoms and 9 = plants dead
Table 4 Mean ascochyta blight (AB), genetic coefficient of variation (GCV), heritability (H2) and predicted genetic advance (GA) of
three F2 populations derived from crosses of moderately resistant genotypes
Cross Population size Mean AB GCV (%) H2 GA (%)
ICC12004 · FLIP84-92C 111 4.35 19 0.38 12
ICC4475 · CDC Frontier 141 4.77 23 0.41 14
ICC3996 · Amit 144 4.60 25 0.43 16
Eur J Plant Pathol (2007) 119:39–51 49
123
The relationships among the chickpea germplasm
accessions as revealed by the SSR alleles at the QTL
regions were not correlated with those based on the
SSR loci derived from other regions of different
linkage groups, suggesting that the diversity at the
QTL regions may not reflect the overall diversity at
the whole genome. However, to some extent, sub-
clusters containing few genotypes that had common
parents in their pedigree were consistent on both
dendrograms. For example, the sub-cluster of CDC
Vanguard, 304–431 and 304–40, which are sister
lines, were clustered together on both dendrograms.
Several genotypes such as ICC3996, ICC12004
and ILC2956 were distantly related based on the
SSRs at the QTL regions. These lines might be used
as sources of resistance to broaden the genetic base
for the newer cultivars. For example, the SSR alleles
on LG2A + B and LG4 in ICC3996 were relatively
rare in this germplasm collection and were com-
pletely different from those in ILC72 and ILC3279.
Moderate amounts of genetic variability exist within
the population derived from a cross between
ICC3996 and Amit. Disease evaluation of this
population demonstrated some transgressive segre-
gants with enhanced resistance and some with
increased susceptibility compared to the parents.
These results suggested that there were different
minor resistance genes with additive gene actions in
each of the two parental lines. The same results were
also found from the other test populations from
crosses between ICC12004 · FLIP84-92C and
ICC4475 · CDC Frontier. The estimated genetic
gain from selection in these three test populations
averaged 14%. These results suggest that it is
possible to develop chickpea cultivars with a higher
level of resistance by accumulating resistance genes
from different sources.
The current analysis of the genetic diversity using
SSRs at the QTL regions associated with resistance to
ascochyta blight suggest that the SSR alleles of the
germplasm originating from the former Soviet Union
were relatively common among the collection of
chickpea germplasm accessions used in the study.
Available pedigree information also showed that only
a few sources were widely used in breeding pro-
grammes to develop resistant cultivars. Several
potential sources of resistance from germplasm or
breeding lines from different geographical origins
may be used in breeding programmes in combination
with adapted varieties to develop better and possibly
more durable resistance to ascochyta blight. The
current analyses provided information on genotypes
with distinct genetic backgrounds at genomic regions
associated with the QTL for ascochyta blight resis-
tance. Our evaluation using three F2 populations
derived from crosses of moderately resistance parents
with diverse genetic backgrounds at regions associ-
ated with resistance suggest that it is possible to
recover progeny with better resistance to ascochyta
blight than either parent.
Acknowledgements Financial support from the Agricultural
Development Fund of Saskatchewan Agriculture and Food and
the Saskatchewan Pulse Growers is gratefully acknowledged.
We thank Carmen Breitkreutz, Parvaneh Hashemi and Brent
Barlow for their technical assistance.
References
Acikgoz, N., Karaca, M., Er, C., & Meyveci, K. (1994).
Chickpea and lentil production in Turkey. In F. J.
Muehlbauer & W. J. Kaiser (Eds.), Expanding theproduction and use of cool season food legumes (pp. 388–
398). Dordrecht, The Netherlands: Kluwer Academic
Publishers
Botstein, D., White, R. L., Skolnick, M., & Davis, R. W.
(1980). Construction of a genetic linkage map in man
using restriction fragment length polymorphisms. Ameri-can Journal of Human Genetics, 32, 314–331.
Chen, W., Coyne, C. J., Peever, T. L., & Muehlbauer, F. J.
(2004). Characterization of chickpea differentials for
pathogenicity assay of ascochyta blight and identification
of chickpea accessions resistant to Didymella rabiei. PlantPathology, 53, 759–769.
Cho, S., Chen, W., & Muehlbauer, F. J. (2004). Pathotype-
specific genetic factors in chickpea (Cicer arietinum L.)
for quantitative resistance to ascochyta blight. Theoreticaland Applied Genetics, 109, 733–739.
Chongo, G., Gossen, B. D., Buchwaldt, L., Adhikari, T., &
Rimmer, S. R. (2004). Genetic diversity of Ascochytarabiei in Canada. Plant Disease, 88, 4–10.
Crino, P. (1990). Chickpea breeding for resistance to ascochyta
blight. Options Mediterraneennes, 9, 55–60.
Doyle, J., & Doyle, J. (1990). Isolation of plant DNA from
fresh tissue. Focus, 12, 13–15.
Falconer, D. S. (1989). Introduction to quantitative genetics.
(3rd ed.). UK: Longman Scientific and Technical.
Flandez-Galvez, H., Ades, P. K., Ford, R., Pang, E. C. K., &
Taylor, P. W. J. (2003). QTL analysis for ascochyta blight
resistance in an intraspecific population of chickpea
(Cicer arietinum L.). Theoretical and Applied Genetics,107, 1257–1265.
Iruela, M., Rubio, J., Barro, F., Cubero, J. I., Millan, T., & Gil, J.
(2006). Detection of two QTL for resistance to ascochyta
blight in an intraspecific cross of chickpea (Cicer arietinum
50 Eur J Plant Pathol (2007) 119:39–51
123
L.): Development of SCAR markers associated to resis-
tance. Theoretical and Applied Genetics, 112, 278–287.
Khan, M. S. A., Ramsey, M. D., Corbiere, R., Infantino, A.,
Porta-Puglia, A., Bouznad, Z., & Scott, E. S. (1999).
Ascochyta blight of chickpea in Australia: identification,
pathogenicity and mating type. Plant Pathology, 48,
230–234.
Mantel, N. (1967). The detection of disease clustering and a
generalized regression approach. Cancer Research, 27,
209–220.
McCartney, C. A., Somers, D. J., Fedak, G., & Cao, W. (2004).
Haplotype diversity at fusarium head blight resistance
QTLs in wheat. Theoretical and Applied Genetics, 109,
261–271.
Millan, T., Rubio, J., Iruela, M., Daly, K., Cubero, J. I., & Gil,
J. (2003). Markers associated with ascochyta blight
resistance in chickpea and their potential in marker-as-
sisted selection. Field Crops Research, 84, 373–384.
Muehlbauer, F. J., Temple, S. R., & Chen, W. (2004). Regis-
tration of ‘Sierra’ chickpea. Crop Science, 38, 282.
Muehlbauer, F. J., & Kaiser, W. J. (2002). Registration of
‘Evans’ chickpea. Crop Science, 42, 301.
Muehlbauer, F. J., Kaiser, W. J., & Kusmenoglu, I. (1998).
Registration of ‘Sanford’ chickpea. Crop Science, 38, 282.
Nei, M., & Li, W. H. (1979). Mathematical model for studying
genetic variation in terms of restriction endonuclease.
Proceedings of National Academy of Sciences of theUnited States of America, 79, 5269–5273.
Nene, Y. L., & Reddy, M. V. (1987). Chickpea diseases and
their control. In M. C. Saxena & K. B. Singh (Eds.), Thechickpea (pp. 233–270). UK: CAB International.
Reddy, M. V., & Singh, K. B. (1992). Registration of five
chickpea germplasm lines resistant to ascochyta blight.
Crop Science, 32, 1079–1080.
Rohlf, F. J. (1998). NTSYSpc: Numerical taxonomy and mul-tivariate analysis system version 2.02 g. Setauket, New
York: Exeter Software.
Rubio, J., Martinez, C., Gil, J., & Moreno, M. T. (2004).
Registration of ascochyta blight and fusarium wilt resis-
tant CA2954 kabuli chickpea germplasm. Crop Science,44, 1881–1882.
Santra, D. K., Tekeoglu, M., Ratnaparkhe, M.-L., Kaiser, W. J.,
& Muehlbauer, F. J. (2000). Identification and mapping of
QTLs conferring resistance to Ascochyta blight in
chickpea. Crop Science, 40, 1606–1612.
SAS Institute Inc. (1999). SAS language and procedure: Usage
version 8–2. (North Carolina, USA).
Singh, K. B., & Reddy, M. V. (1993). Resistance to six races of
Ascochyta rabiei in the world germplasm collection of
chickpea. Crop Science, 33, 186–189.
Singh, K. B., Malhotra, R. S., & Saxena, M. C. (1993). Reg-
istration of ILC72 chickpea. Crop Science, 33, 1409.
Singh, K. B., Malhotra, R. S., & Saxena, M. C. (1992). Regis-
tration of ILC3279 chickpea. Crop Science, 32, 826–827.
Tar’an, B., Warkentin, T. D., Tullu, A., & Vandenberg, A.
(2007). Genetic mapping of ascochyta blight resistance in
chickpea (Cicer arietinum L.) using an SSR linkage map.
Genome, (in press)..Tekeoglu, M., Rajesh, P. N., & Muehlbauer, F. J. (2002).
Integration of sequence tagged microsatellite sites to the
chickpea genetic map. Theoretical and Applied Genetics,105, 847–854.
Tekeoglu, M., Santra, D. K., Kaiser, W. J., & Muehlbauer, F. J.
(2000). Ascochyta blight resistance inheritance in three
chickpea recombinant inbred line populations. Crop Sci-ence, 40, 1251–1256.
Udupa, S. M., & Baum, M. (2003). Genetic dissection of path-
otype-specific resistance to ascochyta blight resistance in
chickpea (Cicer arietinum L.) using microsatellite markers.
Theoretical and Applied Genetics, 106, 1196–1202.
Udupa, S. M., Weigand, F., Saxena, M. C., & Kahl, G. (1998).
Genotyping with RAPD and microsatellite markers
resolves pathotype diversity in the ascochyta blight
pathogen of chickpea. Theoretical and Applied Genetics,97, 299–307.
Winter, P., Benko-Iseppon, A. M., Huttel, B., Ratnaparkhe, M.,
Tullu, A., Sonnante, G., Pfaff, T., Tekeoglu, M., Santra,
D., Sant, V. J., Rajesh, P. N., Kahl, G., & Muehlbauer, F.
J. (2000). A linkage map of the chickpea (Cicer arietinumL.) genome based on recombinant inbred lines from a C.arietinum · C. reticulatum cross: localization of resis-
tance genes for fusarium wilt races 4 and 5. Theoreticaland Applied Genetics, 101, 1155–1160.
Winter, P., Pfaff, T., Udupa, S. M., Huttel, B., Sharma, P. C.,
Sahi, S., Arreguin-Espinoza, R., Weigand, F., Mu-
ehlbauer, F. J., & Kahl, G. (1999). Characterization and
mapping of sequence-tagged microsatellite sites in the
chickpea (Cicer arietinum L.) genome. Molecular andGeneral Genetics, 262, 90–101.
Eur J Plant Pathol (2007) 119:39–51 51
123
FULL RESEARCH PAPER
Inheritance of resistance to Mycosphaerella pinodesin two wild accessions of Pisum
Sara Fondevilla Æ Jose I. Cubero Æ Diego Rubiales
Received: 10 October 2006 / Accepted: 19 April 2007 / Published online: 25 May 2007
� KNPV 2007
Abstract Mycosphaerella pinodes is one of the
most devastating pea pathogens. Pea cultivars with
adequate levels of resistance to control the disease
are not so far available. However, promising levels
of resistance have been identified in wild acces-
sions of pea. In the present investigation the
inheritance of resistance to M. pinodes was studied
in two crosses between the susceptible pea cv.
‘Ballet’ and the partially wild resistant accessions
P665 (Pisum sativum subsp. syriacum) and P42
(P. sativum subsp. sativum var. arvense). Both
additive and dominant effects were important in
control of resistance and susceptibility dominated
over resistance.
Keywords Ascochyta blight � Pea � Genetic
Introduction
Pea is the most commonly produced grain legume in
Europe and second-most in the world (FAOSTAT
data, 2005; http://faostat.fao.org/). Ascochyta blight,
caused by Mycosphaerella pinodes, the teleomorph
of Ascochyta pinodes, is one of the most important
pea pathogens (Moussart et al. 1998). It is wide-
spread throughout the major pea-growing areas,
especially in temperate regions of Europe, North
America, Australia and New Zealand (Wallen 1965;
Lawyer 1984; Bretag et al. 1995). Average yield
losses in commercial pea fields have been estimated
at 10%, and losses of >50% have been measured in
some trials (Xue et al. 1997). The disease reduces
number of seeds per stem and seed size (Tivoli et al.
1996).
Management of the disease by fungicide seed
treatment, crop rotation and sanitation is possible, but
each has deficiencies. Resistance appears to be the
more practical way to reduce its effects (Zimmer and
Sabourin 1986). Although extensive screening of pea
germplasm has been conducted, only partial resis-
tance has been identified that by itself, is inadequate
to control the disease. Good levels of partial resis-
tance have been reported in wild pea accessions
(Zimmer and Sabourin 1986; Clulow et al. 1991a,
Wroth 1998; Fondevilla et al. 2005). Knowledge of
the genetic factors controlling resistance to M.
pinodes in these wild accessions would facilitate
gene transfer to pea cultivars. With this aim, the
present work examines the inheritance of resistance
to M. pinodes in two partially resistant wild acces-
sions of pea.
S. Fondevilla
Centro-Alameda del Obispo, IFAPA, Junta de Andalucıa,
Apdo. 3092, Cordoba 14080, Spain
J. I. Cubero � D. Rubiales
Instituto de Agricultura Sostenible, CSIC, Apdo. 4084,
Cordoba 14080, Spain
123
Eur J Plant Pathol (2007) 119:53–58
DOI 10.1007/s10658-007-9146-4
Materials and methods
Plant material
Two partially resistant accessions P42 (Pisum sati-
vum subsp. sativum var. arvense) and P665 (P.
sativum subsp. syriacum) (Fondevilla et al. 2005)
were crossed with the susceptible commercial culti-
var ‘Ballet’ (P. sativum subsp. sativum). The derived
F1 plants of both crosses were evaluated for resis-
tance to M. pinodes and selfed to obtain the F2
generation. In addition, the reaction to M. pinodes
was examined in backcrosses obtained by crossing F1
plants derived from the cross P665 · ‘Ballet’, with
‘Ballet’ (BC1) and P665 (BC2). The testa of seeds
was pierced to aid inbibition before seeds were
germinated and sown, one seed per pot, containing
440 cm3 of 1:1 sand–peat mixture. Plants were grown
in a glasshouse to the 3–4 leaf stage (approximately
14 days after planting). They were then transferred to
a growth chamber (21 ± 28C with a 12 h dark/12 h
light photoperiod, at 106 mmol m�2 s�1) and arranged
according to a complete randomised design for
inoculation.
Inoculation and incubation
Plants were inoculated using the monoconidial isolate
CO-99 obtained from infected pea plants collected in
commercial fields at Cordoba (Spain). The isolate
was multiplied in Petri dishes of V8 medium (200 ml
of V8 vegetable juice + 40 g of technical
agar + 800 ml of sterile water litre�1) at 238C,
subjected to a 16 h photoperiod of fluorescent
illumination at 27 mmol m�2 s�1. A spore suspension
was prepared by flooding the surface of 12–14 day-
old cultures with sterile water, scraping the colony
with a needle and filtering the suspension through two
layers of sterile cheesecloth. The concentration of
spores was determined with a haemocytometer and
adjusted to 5 · 105 spores ml�1. Tween-20 (120 ml
100 ml�1 of spore suspension) was added as a wetting
agent and the spore suspension was applied with a
sprayer at a rate of 1 ml per plant. After inoculation,
plants were incubated in a growth chamber at
21 ± 28C with a 12 h dark/12 h light photoperiod,
the first dark period commencing immediately after
inoculation. During the first 24 h, plants were covered
with a polyethylene sheet and high humidity was
ensured by ultrasonic humidifiers operating for
15 min every 2 h. The polyethylene cover was then
removed.
Disease assessment
Disease was visually assessed 14 days after inocula-
tion using a 0–5 scale defined by Roger and Tivoli
(1996) as follows:
0 = no lesions
1 = a few scattered flecks
2 = numerous flecks
3 = 10–15% of the leaf area necrotic and appear-
ance of coalescent necrosis
4 = 50% of the leaf area dehydrated or necrotic
5 = 75–100% of the leaf area dehydrated or
necrotic.
Average disease rating (DR) for each plant was
defined as the mean disease score over its first,
second and third leaves.
Data analysis
The joint scaling test proposed by Cavalli (Mather
and Jinks 1971, pp 71–76) was used to analyse data.
The test checks the conformity with the additive-
dominance model and gives additional information
about the weight of dominance and additive effects in
the control of the trait. Cavalli’s test estimates the
parameters ‘m’, ‘d’ and ‘h’, from means of the
available types of generations; with ‘m’ defined as
the mid-parental value, ‘d’ as the half of the
difference between parental values and ‘h’ as the
deviation of F1 generation from their respective mid-
parental values. Subsequently, the observed genera-
tion means were compared with expected values
derived from the estimates of the three parameters
assuming that the cross fitted the additive-dominance
model. In this study this comparison was performed
by using the chi-square (v2) test and linear regression.
The requirements of the additive-dominance
model are (I) normal diploid segregation of chromo-
somes, (II) homozygous parents, (III) no genotype by
environment interaction, (IV) no reciprocal differ-
ences, (V) no epistasis, (VI) no uncorrelated gene
distribution and (VII) no multiple alleles (Hill 1964).
Broad sense heritabilities (H) were calculated by
dividing the genetic component (additive + domi-
54 Eur J Plant Pathol (2007) 119:53–58
123
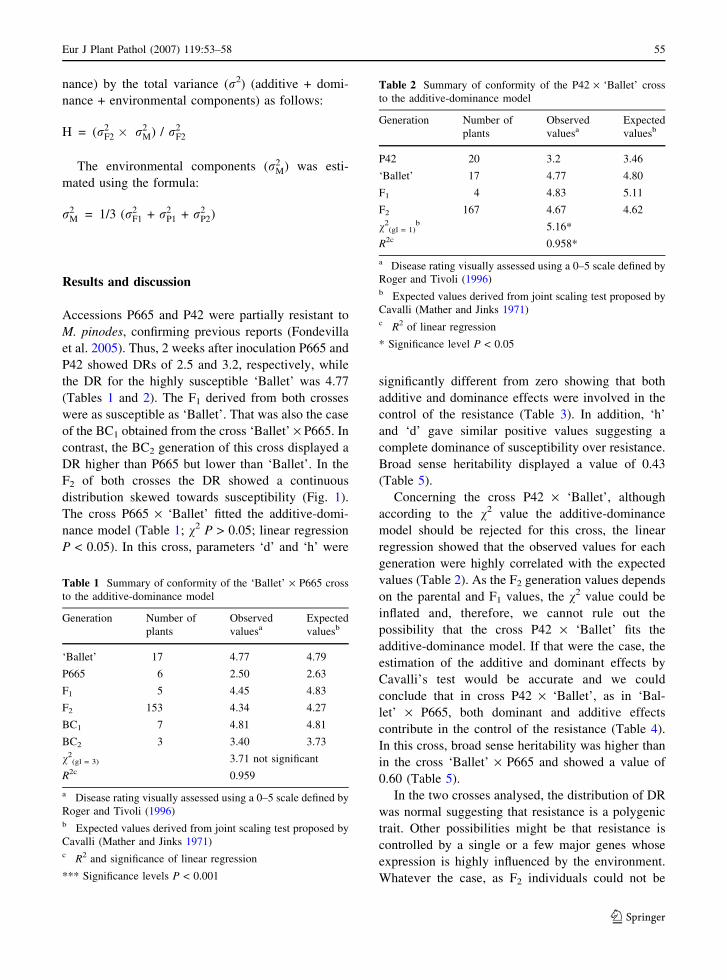
nance) by the total variance (r2) (additive + domi-
nance + environmental components) as follows:
H = (r2F2 � r2
M) / r2F2
The environmental components (r2M) was esti-
mated using the formula:
r2M = 1/3 (r2
F1 + r2P1 + r2
P2)
Results and discussion
Accessions P665 and P42 were partially resistant to
M. pinodes, confirming previous reports (Fondevilla
et al. 2005). Thus, 2 weeks after inoculation P665 and
P42 showed DRs of 2.5 and 3.2, respectively, while
the DR for the highly susceptible ‘Ballet’ was 4.77
(Tables 1 and 2). The F1 derived from both crosses
were as susceptible as ‘Ballet’. That was also the case
of the BC1 obtained from the cross ‘Ballet’ · P665. In
contrast, the BC2 generation of this cross displayed a
DR higher than P665 but lower than ‘Ballet’. In the
F2 of both crosses the DR showed a continuous
distribution skewed towards susceptibility (Fig. 1).
The cross P665 · ‘Ballet’ fitted the additive-domi-
nance model (Table 1; v2 P > 0.05; linear regression
P < 0.05). In this cross, parameters ‘d’ and ‘h’ were
significantly different from zero showing that both
additive and dominance effects were involved in the
control of the resistance (Table 3). In addition, ‘h’
and ‘d’ gave similar positive values suggesting a
complete dominance of susceptibility over resistance.
Broad sense heritability displayed a value of 0.43
(Table 5).
Concerning the cross P42 · ‘Ballet’, although
according to the v2 value the additive-dominance
model should be rejected for this cross, the linear
regression showed that the observed values for each
generation were highly correlated with the expected
values (Table 2). As the F2 generation values depends
on the parental and F1 values, the v2 value could be
inflated and, therefore, we cannot rule out the
possibility that the cross P42 · ‘Ballet’ fits the
additive-dominance model. If that were the case, the
estimation of the additive and dominant effects by
Cavalli’s test would be accurate and we could
conclude that in cross P42 · ‘Ballet’, as in ‘Bal-
let’ · P665, both dominant and additive effects
contribute in the control of the resistance (Table 4).
In this cross, broad sense heritability was higher than
in the cross ‘Ballet’ · P665 and showed a value of
0.60 (Table 5).
In the two crosses analysed, the distribution of DR
was normal suggesting that resistance is a polygenic
trait. Other possibilities might be that resistance is
controlled by a single or a few major genes whose
expression is highly influenced by the environment.
Whatever the case, as F2 individuals could not be
Table 1 Summary of conformity of the ‘Ballet’ · P665 cross
to the additive-dominance model
Generation Number of
plants
Observed
valuesaExpected
valuesb
‘Ballet’ 17 4.77 4.79
P665 6 2.50 2.63
F1 5 4.45 4.83
F2 153 4.34 4.27
BC1 7 4.81 4.81
BC2 3 3.40 3.73
v2(gl = 3) 3.71 not significant
R2c 0.959
a Disease rating visually assessed using a 0–5 scale defined by
Roger and Tivoli (1996)b Expected values derived from joint scaling test proposed by
Cavalli (Mather and Jinks 1971)c R2 and significance of linear regression
*** Significance levels P < 0.001
Table 2 Summary of conformity of the P42 · ‘Ballet’ cross
to the additive-dominance model
Generation Number of
plants
Observed
valuesaExpected
valuesb
P42 20 3.2 3.46
‘Ballet’ 17 4.77 4.80
F1 4 4.83 5.11
F2 167 4.67 4.62
v2(gl = 1)
b 5.16*
R2c 0.958*
a Disease rating visually assessed using a 0–5 scale defined by
Roger and Tivoli (1996)b Expected values derived from joint scaling test proposed by
Cavalli (Mather and Jinks 1971)c R2 of linear regression
* Significance level P < 0.05
Eur J Plant Pathol (2007) 119:53–58 55
123
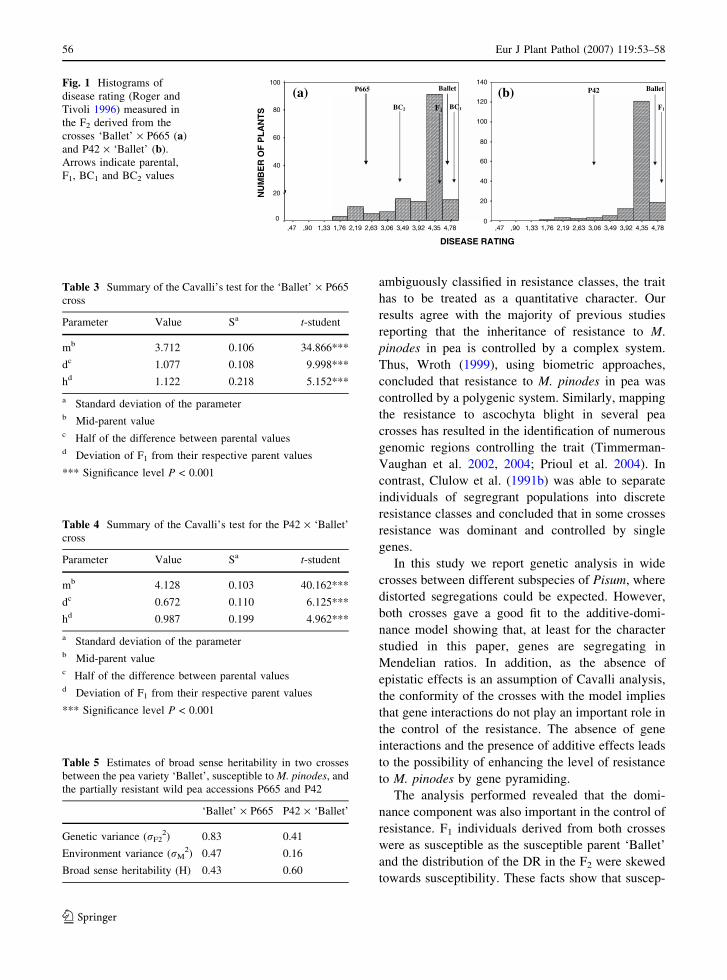
ambiguously classified in resistance classes, the trait
has to be treated as a quantitative character. Our
results agree with the majority of previous studies
reporting that the inheritance of resistance to M.
pinodes in pea is controlled by a complex system.
Thus, Wroth (1999), using biometric approaches,
concluded that resistance to M. pinodes in pea was
controlled by a polygenic system. Similarly, mapping
the resistance to ascochyta blight in several pea
crosses has resulted in the identification of numerous
genomic regions controlling the trait (Timmerman-
Vaughan et al. 2002, 2004; Prioul et al. 2004). In
contrast, Clulow et al. (1991b) was able to separate
individuals of segregrant populations into discrete
resistance classes and concluded that in some crosses
resistance was dominant and controlled by single
genes.
In this study we report genetic analysis in wide
crosses between different subspecies of Pisum, where
distorted segregations could be expected. However,
both crosses gave a good fit to the additive-domi-
nance model showing that, at least for the character
studied in this paper, genes are segregating in
Mendelian ratios. In addition, as the absence of
epistatic effects is an assumption of Cavalli analysis,
the conformity of the crosses with the model implies
that gene interactions do not play an important role in
the control of the resistance. The absence of gene
interactions and the presence of additive effects leads
to the possibility of enhancing the level of resistance
to M. pinodes by gene pyramiding.
The analysis performed revealed that the domi-
nance component was also important in the control of
resistance. F1 individuals derived from both crosses
were as susceptible as the susceptible parent ‘Ballet’
and the distribution of the DR in the F2 were skewed
towards susceptibility. These facts show that suscep-
4,784,353,923,493,062,632,191,761,33,90,47
140
120
100
80
60
40
20
04,784,353,923,493,062,632,191,761,33,90,47
100
80
60
40
20
0
P665 Ballet
DISEASE RATING
NU
MB
ER
OF
PL
AN
TS
BalletP42
F1F1 BC1BC2
(a) (b)Fig. 1 Histograms of
disease rating (Roger and
Tivoli 1996) measured in
the F2 derived from the
crosses ‘Ballet’ · P665 (a)
and P42 · ‘Ballet’ (b).
Arrows indicate parental,
F1, BC1 and BC2 values
Table 3 Summary of the Cavalli’s test for the ‘Ballet’ · P665
cross
Parameter Value Sa t-student
mb 3.712 0.106 34.866***
dc 1.077 0.108 9.998***
hd 1.122 0.218 5.152***
a Standard deviation of the parameterb Mid-parent valuec Half of the difference between parental valuesd Deviation of F1 from their respective parent values
*** Significance level P < 0.001
Table 5 Estimates of broad sense heritability in two crosses
between the pea variety ‘Ballet’, susceptible to M. pinodes, and
the partially resistant wild pea accessions P665 and P42
‘Ballet’ · P665 P42 · ‘Ballet’
Genetic variance (rF22) 0.83 0.41
Environment variance (rM2) 0.47 0.16
Broad sense heritability (H) 0.43 0.60
Table 4 Summary of the Cavalli’s test for the P42 · ‘Ballet’
cross
Parameter Value Sa t-student
mb 4.128 0.103 40.162***
dc 0.672 0.110 6.125***
hd 0.987 0.199 4.962***
a Standard deviation of the parameterb Mid-parent valuec Half of the difference between parental valuesd Deviation of F1 from their respective parent values
*** Significance level P < 0.001
56 Eur J Plant Pathol (2007) 119:53–58
123
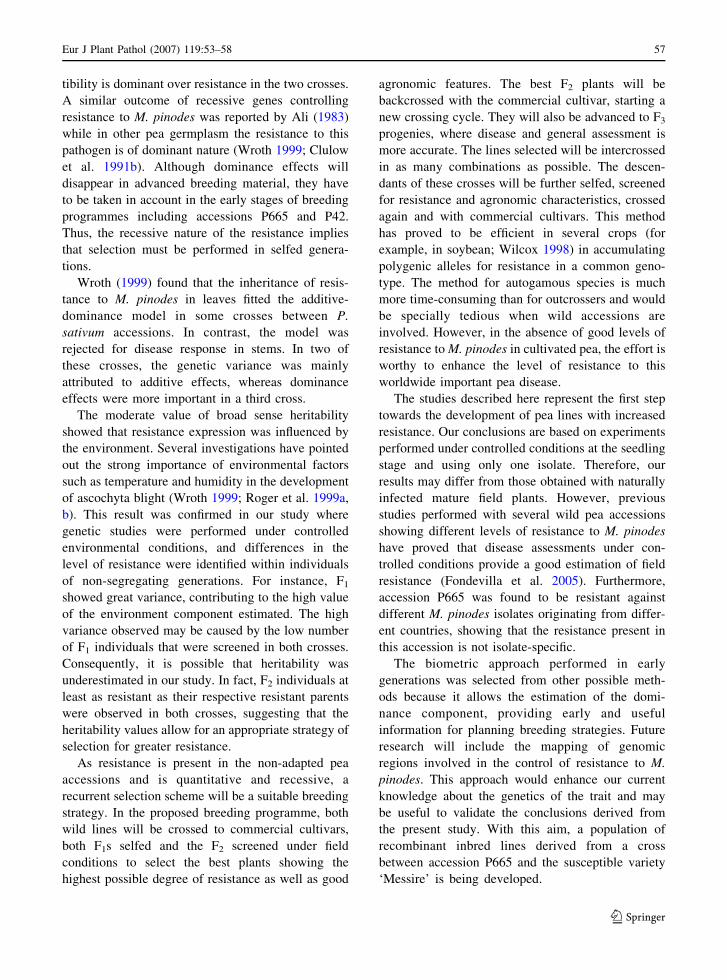
tibility is dominant over resistance in the two crosses.
A similar outcome of recessive genes controlling
resistance to M. pinodes was reported by Ali (1983)
while in other pea germplasm the resistance to this
pathogen is of dominant nature (Wroth 1999; Clulow
et al. 1991b). Although dominance effects will
disappear in advanced breeding material, they have
to be taken in account in the early stages of breeding
programmes including accessions P665 and P42.
Thus, the recessive nature of the resistance implies
that selection must be performed in selfed genera-
tions.
Wroth (1999) found that the inheritance of resis-
tance to M. pinodes in leaves fitted the additive-
dominance model in some crosses between P.
sativum accessions. In contrast, the model was
rejected for disease response in stems. In two of
these crosses, the genetic variance was mainly
attributed to additive effects, whereas dominance
effects were more important in a third cross.
The moderate value of broad sense heritability
showed that resistance expression was influenced by
the environment. Several investigations have pointed
out the strong importance of environmental factors
such as temperature and humidity in the development
of ascochyta blight (Wroth 1999; Roger et al. 1999a,
b). This result was confirmed in our study where
genetic studies were performed under controlled
environmental conditions, and differences in the
level of resistance were identified within individuals
of non-segregating generations. For instance, F1
showed great variance, contributing to the high value
of the environment component estimated. The high
variance observed may be caused by the low number
of F1 individuals that were screened in both crosses.
Consequently, it is possible that heritability was
underestimated in our study. In fact, F2 individuals at
least as resistant as their respective resistant parents
were observed in both crosses, suggesting that the
heritability values allow for an appropriate strategy of
selection for greater resistance.
As resistance is present in the non-adapted pea
accessions and is quantitative and recessive, a
recurrent selection scheme will be a suitable breeding
strategy. In the proposed breeding programme, both
wild lines will be crossed to commercial cultivars,
both F1s selfed and the F2 screened under field
conditions to select the best plants showing the
highest possible degree of resistance as well as good
agronomic features. The best F2 plants will be
backcrossed with the commercial cultivar, starting a
new crossing cycle. They will also be advanced to F3
progenies, where disease and general assessment is
more accurate. The lines selected will be intercrossed
in as many combinations as possible. The descen-
dants of these crosses will be further selfed, screened
for resistance and agronomic characteristics, crossed
again and with commercial cultivars. This method
has proved to be efficient in several crops (for
example, in soybean; Wilcox 1998) in accumulating
polygenic alleles for resistance in a common geno-
type. The method for autogamous species is much
more time-consuming than for outcrossers and would
be specially tedious when wild accessions are
involved. However, in the absence of good levels of
resistance to M. pinodes in cultivated pea, the effort is
worthy to enhance the level of resistance to this
worldwide important pea disease.
The studies described here represent the first step
towards the development of pea lines with increased
resistance. Our conclusions are based on experiments
performed under controlled conditions at the seedling
stage and using only one isolate. Therefore, our
results may differ from those obtained with naturally
infected mature field plants. However, previous
studies performed with several wild pea accessions
showing different levels of resistance to M. pinodes
have proved that disease assessments under con-
trolled conditions provide a good estimation of field
resistance (Fondevilla et al. 2005). Furthermore,
accession P665 was found to be resistant against
different M. pinodes isolates originating from differ-
ent countries, showing that the resistance present in
this accession is not isolate-specific.
The biometric approach performed in early
generations was selected from other possible meth-
ods because it allows the estimation of the domi-
nance component, providing early and useful
information for planning breeding strategies. Future
research will include the mapping of genomic
regions involved in the control of resistance to M.
pinodes. This approach would enhance our current
knowledge about the genetics of the trait and may
be useful to validate the conclusions derived from
the present study. With this aim, a population of
recombinant inbred lines derived from a cross
between accession P665 and the susceptible variety
‘Messire’ is being developed.
Eur J Plant Pathol (2007) 119:53–58 57
123
Acknowledgements We thank project AGF2005-01781 of
the Spanish Comision Interministerial de Ciencia y Tecnologıa
(CICYT) for financial support.
References
Ali, S. M. (1983). Pathotypes of ‘black spot’ complex patho-
gens of field peas, selection and inheritance of resistance
in pea lines. Adelaide, Australia: Standing Committee on
Agriculture, pp. 246–248.
Bretag, T. W., Keane, P. J., & Price, T. V. (1995). Effect of
ascochyta blight on the grain yield of field pea (Pisumsativum L.). Australian Journal of Experimental Agricul-ture, 35, 531–536.
Clulow, S. A., Lewis, B. G., & Matthews, P. (1991a). A
pathotype classification for Mycosphaerella pinodes.
Phytopathology, 131, 322–332.
Clulow, S. A., Matthews, P., Lewis, B. G. (1991b). Genetical
analysis of resistance to Mycosphaerella pinodes in pea
seedlings. Euphytica, 58, 183–189.
Fondevilla, S., Avila, C. M., Cubero, J. I., & Rubiales, D.
(2005). Response to Mycosphaerella pinodes in a germ-
plasm collection of Pisum spp. Plant Breeding, 124, 313–
315.
Hill, J. (1964). Effects of correlated gene distributions in the
analysis of diallel crosses. Heredity, 19, 27–46.
Lawyer, A. S. (1984). Diseases caused by Ascochyta spp. In D.
J. Hagedorn (Ed.), The compendium of pea diseases(pp. 11–15). Minnesota, USA: The American Phytopath.
Soc.
Mather, K, & Jinks, J. L. (1971). Biometrical genetics. The
study of continuous variation. Chapman and Hall Ltd.
Moussart, A., Tivoli, B., Lemarchand, E., Deneufbourg, F.,
Roi, S., & Sicard, G. (1998). Role of seed infection by the
Ascochyta blight pathogen of dried pea (Mycosphaerellapinodes) in seedling emergence, early disease develop-
ment and transmission of the disease to aerial plant parts.
European Journal of Plant Pathology, 104, 93–102.
Prioul, S., Frankewitz, A., Deniot, G., Morin, G., & Baranger,
A. (2004). Mapping of quantitative trait loci for partial
resistance to Mycosphaerella pinodes in pea (Pisum sat-ivum L.) at the seedling and adult plant stages. Theoreticaland Applied Genetic, 108, 1322–1334.
Roger, C., & Tivoli, R. (1996). Spatio temporal development
of pynidia and perithecia and dissemination of spores of
Mycosphaerella pinodes on pea (Pisum sativum). PlantPathology, 45, 518–528.
Roger, C., Tivoli, B., & Huber, L. (1999a). Effects of tem-
perature and moisture on disease and fruit body devel-
opment of Mycosphaerella pinodes on pea (Pisumsativum). Plant Pathology, 48, 1–9.
Roger, C., Tivoli B., & Huber L. (1999b). Effects of inter-
rupted wet periods and different temperatures on the
development of ascochyta blight caused by Mycosphae-rella pinodes on pea (Pisum sativum) seedlings. PlantPathology, 48, 10–18.
Timmerman-Vaughan, G. M., Frew, T. J., Butler, R., Murray,
S., Gilpin, M., Falloon, K., Johnston, P., Lakeman, M. B.,
Russell, A. C., & Khan, T. (2004). Validation of quanti-
tative trait loci for Ascochyta blight resistance in pea
(Pisum sativum L.), using populations from two crosses.
Theoretical and Applied Genetics, 109, 1620–1631.
Timmerman-Vaughan, G. M., Frew, T. J., Russell, A. C., Khan,
T., Butler, R., Gilpin, M., Murray, S., & Falloon, K.
(2002). QTL mapping of partial resistance to field
epidemics of ascochyta blight of pea. Crop Science, 42,
2100–2111.
Tivoli, B., Beasse, C., Lemarchand, E., & Masson, E. (1996).
Effect of ascochyta blight (Mycosphaerella pinodes) on
yield components of single pea (Pisum sativum) plants
under field conditions. Annals of Applied Biology, 129,
207–216.
Wallen, V. R. (1965). Field evaluation of the importance of the
Ascochyta complex of peas. Canadian Journal of PlantScience, 45, 27–33.
Wilcox, J. R. (1998). Increasing seed protein in soybean with
eight cycles of recurrent selection. Crop Science, 38,
1536–1540.
Wroth, J. M. (1998). Possible role for wild genotypes of Pisumspp. to enhance ascochyta blight resistance in pea. Aus-tralian Journal of Experimental Agriculture, 38, 469–479.
Wroth, J. M. (1999). Evidence suggests that Mycosphaerellapinodes infection of Pisum sativum is inherited as a
quantitative trait. Euphytica, 107, 193–204.
Xue, A. G., Warkentin, T. D., & Kenaschuk, E. O. (1997).
Effect of timings of inoculation with Mycosphaerellapinodes on yield and seed infection on field pea. CanadianJournal of Plant Science, 77, 685–689.
Zimmer, M. C., & Sabourin, D. (1986). Determining resistance
reaction of field pea cultivars at the seedling stage to
Mycosphaerella pinodes. Phytopathology, 76, 878–881.
58 Eur J Plant Pathol (2007) 119:53–58
123
FULL RESEARCH PAPER
Comparison of the epidemiology of ascochyta blights ongrain legumes
Bernard Tivoli Æ Sabine Banniza
Received: 28 September 2006 / Accepted: 1 March 2007 / Published online: 27 March 2007� KNPV 2007
Abstract Asochyta blights of grain legumes are
caused by fungal pathogens in the genus Asco-
chyta. Different species infect the different legume
species, and in pea three species including Phoma
medicaginis var. pinodella have been implicated in
ascochyta blight. The impact of the diseases varies
between crops, countries, seasons and cropping
systems, and yield loss data collected under well-
defined conditions is scarce. However, ascochyta
blights are considered major diseases in many
areas where legumes are grown. Symptoms appear
on all aerial parts of the plant, and lesions are
similar for most of the species, except for M.
pinodes and P. medicaginis var. pinodella. Infected
seed, stubble and/or air-borne ascospores are
major sources of primary inoculum. Their impor-
tance varies between species and also between
regions. All Ascochyta spp. produce rain-splashed
conidia during the cropping season which are
responsible for the spread of the disease within the
crop canopy. Only in pea are ascospores involved
in secondary disease spread. Limited data suggests
that Ascochyta spp. may be hemibiotrophs; how-
ever, toxins characteristic for necrotrophs have
been isolated from some of the species. Modelling
of ascochyta blights is still in the developmental
stage and implementation of such models for
disease forecasting is the exception.
Keywords Pea � Faba bean � Chickpea � Lentil �Ascochyta � Mycosphaerella pinodes � Phoma
medicaginis � Didymella � Life-cycle
Introduction
Grain legumes, also referred to as pulse crops (faba
bean, chickpea, pea, lentil and lupin), play an
important role in farming systems worldwide
(Halila et al. 1990; Kelley et al. 1997). Their seed
protein content is high ranging from 22% in pea to
45% in lupin, and they are used for human and
animal consumption in the southern and northern
hemispheres. Most of the genotypes of food and
feed legume species are characterised by an inde-
terminate growth habit: the reproductive structures
are not initiated at the same time along the stem, but
flowers and pods develop continuously on the
plants. As a consequence, all plant organs (vegeta-
tive aerial parts, nodules, roots, reproductive
organs) are competing for assimilates at any given
time.
B. Tivoli (&)UMR INRA/Agrocampus Rennes, ‘‘Biologie desOrganismes et des Populations appliquee a laProtection des Plantes’’ (BiO3P), BP 35327, Le RheuCedex 35653, Francee-mail: [email protected]
S. BannizaCrop Development Centre, University ofSaskatchewan, 51 Campus Drive, Saskatoon,Canada S7N 5A8
123
Eur J Plant Pathol (2007) 119:59–76
DOI 10.1007/s10658-007-9117-9
Pulse crops are infected by fungal diseases such
as grey mould or chocolate spot, ascochyta
blights, anthracnose, powdery and downy mil-
dews and rusts. The relative importance of these
diseases and their effect on yield vary among
countries. However, ascochyta blights affect large
areas in many countries where pulses are culti-
vated and cause considerable losses in seed
quality and quantity. In crops seeded in the
autumn and winter, a practice associated with
significantly higher seed yield due to the crop
flowering and producing seeds in a cooler and
more humid environment during the second part
of the crop’s life, ascochyta blights can be of
particular importance. These diseases which can
occur on all above-ground parts of the plant are
the main foliar disease on grain legumes except
for lupin.
The primary objective for this review is to
highlight similarities and differences in the epi-
demiology across the species and across countries.
The intention is to promote thinking across
systems and to explore the potential of adapting
successful research strategies from one agricul-
tural system to another, and from one Ascochyta
spp. to other species of this genus.
The pathogens
All pathogens responsible for ascochyta blights
belong to the genus Ascochyta, with the different
species pisi and pinodes (on pea), rabiei (on
chickpea), lentis (on lentil), fabae (on faba bean),
and viciae (on vicia). Another closely related
species is Phoma medicaginis var. pinodella which
frequently occurs on pea and causes symptoms on
internodes and leaves similar to those induced by
A. pinodes. It is one of the three species implied
in the ascochyta blight complex of pea (Hare and
Walker 1944; Wallen 1965), which differentiates
ascochyta blight of pea from that on lentil, faba
bean and chickpea, all of which are caused by a
single fungal species. An understanding of the
interrelationship between the three pathogens of
the pea ascochyta complex is still lacking, but
appears to involve interspecies competition and
possibly different climatic optima as well as
resistance in pea cultivars to particular species.
In Australia, Bretag et al. (1995a) observed that
in 436 seed lots tested 94.8% of isolates were M.
pinodes, 4.2% P. medicaginis and 1.0% A. pisi.
Skolko et al. (1954 ) reported that 85% of
Canadian ascochyta blight-infected seed lots were
infected by A. pisi. However, since the introduc-
tion of resistance to A. pisi in the mid 1960s M.
pinodes has become the dominant species found
on Canadian pea seed (R.A.A. Morrall, Depart-
ment of Biology, University of Saskatchewan,
Canada, pers. comm.). In France, M. pinodes is
the dominant pea pathogen, but A. pisi can be
found in southern France (C. Le May, INRA,
France, pers. comm.). Comparison of these
pathogens in terms of culture characteristics,
symptoms, and disease cycle are given by Jones
(1927) and Hare and Walker (1944).
Reproduction
All of the Ascochyta spp. produce pycnidia with
hyaline, straight or slightly curved conidia (py-
cnidiospores), and generally with one septum
except those from P. medicaginis var. pinodella
which are in most cases unicellular.
The teleomorph of these fungi belong to the
genera Mycosphaerella (A. pinodes) or Didymella
(A. lentis, A. rabiei, A. fabae) with the exception
of A. pisi for which the teleomorph has not been
described to date (Table 1). The teleomorph of P.
medicaginis var. pinodella was described as M.
pinodes by Bowen et al. (1997), but this was not
supported by subsequent morphological studies
and RAPD analysis (Onfroy et al. 1999).
Mycosphaerella pinodes is homothallic and forms
its pseudothecia on the senescent stipules during
the second part of the cropping season. In
contrast, all Didymella species are heterothallic
with two mating types (Wilson and Kaiser 1995;
Kaiser et al. 1997; Barve et al. 2003; Peever et al.
2004) and pseudothecia, if present, develop at the
end of the cropping season on dead plants. These
sexual fruiting structures permit the fungi
to overwinter and are considered to play an
important role in generating pathogen variability
(Kaiser 1997).
60 Eur J Plant Pathol (2007) 119:59–76
123
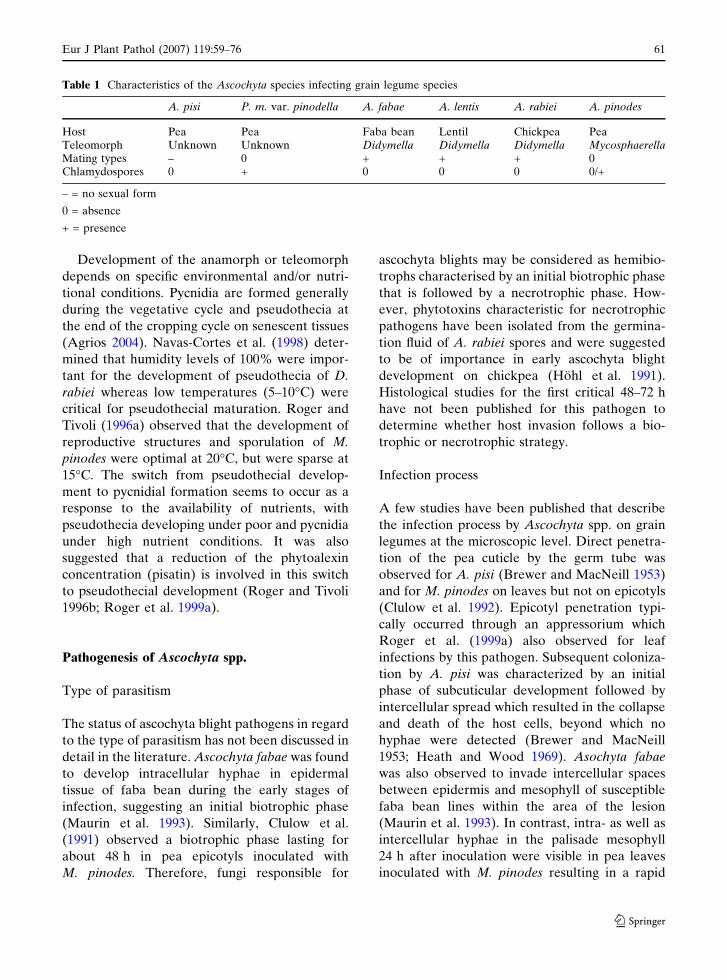
Development of the anamorph or teleomorph
depends on specific environmental and/or nutri-
tional conditions. Pycnidia are formed generally
during the vegetative cycle and pseudothecia at
the end of the cropping cycle on senescent tissues
(Agrios 2004). Navas-Cortes et al. (1998) deter-
mined that humidity levels of 100% were impor-
tant for the development of pseudothecia of D.
rabiei whereas low temperatures (5–10�C) were
critical for pseudothecial maturation. Roger and
Tivoli (1996a) observed that the development of
reproductive structures and sporulation of M.
pinodes were optimal at 20�C, but were sparse at
15�C. The switch from pseudothecial develop-
ment to pycnidial formation seems to occur as a
response to the availability of nutrients, with
pseudothecia developing under poor and pycnidia
under high nutrient conditions. It was also
suggested that a reduction of the phytoalexin
concentration (pisatin) is involved in this switch
to pseudothecial development (Roger and Tivoli
1996b; Roger et al. 1999a).
Pathogenesis of Ascochyta spp.
Type of parasitism
The status of ascochyta blight pathogens in regard
to the type of parasitism has not been discussed in
detail in the literature. Ascochyta fabae was found
to develop intracellular hyphae in epidermal
tissue of faba bean during the early stages of
infection, suggesting an initial biotrophic phase
(Maurin et al. 1993). Similarly, Clulow et al.
(1991) observed a biotrophic phase lasting for
about 48 h in pea epicotyls inoculated with
M. pinodes. Therefore, fungi responsible for
ascochyta blights may be considered as hemibio-
trophs characterised by an initial biotrophic phase
that is followed by a necrotrophic phase. How-
ever, phytotoxins characteristic for necrotrophic
pathogens have been isolated from the germina-
tion fluid of A. rabiei spores and were suggested
to be of importance in early ascochyta blight
development on chickpea (Hohl et al. 1991).
Histological studies for the first critical 48–72 h
have not been published for this pathogen to
determine whether host invasion follows a bio-
trophic or necrotrophic strategy.
Infection process
A few studies have been published that describe
the infection process by Ascochyta spp. on grain
legumes at the microscopic level. Direct penetra-
tion of the pea cuticle by the germ tube was
observed for A. pisi (Brewer and MacNeill 1953)
and for M. pinodes on leaves but not on epicotyls
(Clulow et al. 1992). Epicotyl penetration typi-
cally occurred through an appressorium which
Roger et al. (1999a) also observed for leaf
infections by this pathogen. Subsequent coloniza-
tion by A. pisi was characterized by an initial
phase of subcuticular development followed by
intercellular spread which resulted in the collapse
and death of the host cells, beyond which no
hyphae were detected (Brewer and MacNeill
1953; Heath and Wood 1969). Asochyta fabae
was also observed to invade intercellular spaces
between epidermis and mesophyll of susceptible
faba bean lines within the area of the lesion
(Maurin et al. 1993). In contrast, intra- as well as
intercellular hyphae in the palisade mesophyll
24 h after inoculation were visible in pea leaves
inoculated with M. pinodes resulting in a rapid
Table 1 Characteristics of the Ascochyta species infecting grain legume species
A. pisi P. m. var. pinodella A. fabae A. lentis A. rabiei A. pinodes
Host Pea Pea Faba bean Lentil Chickpea PeaTeleomorph Unknown Unknown Didymella Didymella Didymella MycosphaerellaMating types – 0 + + + 0Chlamydospores 0 + 0 0 0 0/+
– = no sexual form
0 = absence
+ = presence
Eur J Plant Pathol (2007) 119:59–76 61
123
disorganisation and browning of the contents of
invaded cells and those adjacent to intercellular
hyphae beyond the necrosis (Heath and Wood
1969).
The second phase of infection consists of
aggressive mycelium extension which coincides
with the diffusion of toxins, enzymes and/or
suppressors allowing rapid fungal progression in
dead tissues by removing physical barriers (toxins
and enzymes) and delaying or suppressing the
host defense responses (suppressors). Among
toxins, enzymes and suppressors, toxins have
received most attention to date, whereas less is
known about enzymes and suppressors. All three
types of compounds are produced by A. rabiei
which has been studied most extensively (re-
viewed by Barz and Welle 1992 and Jayakakumar
et al. 2005), and the toxins solanopyrones A, B
and C have been isolated from culture filtrates
and spore germination fluids (Hohl et al. 1991;
Kaur 1995). The role of the phytotoxin ascochi-
tine has been comprehensively studied on faba
bean infected with A. fabae (Beed et al. 1994),
and on pea infected with A. pisi (Marcinkowska
et al. 1991). Suppressors (reviewed by Shiraishi
et al. 1994) and cell wall-degrading enzymes
(Heath and Wood 1971a) were isolated and
characterised from M. pinodes on pea leaves.
Phytoalexins
Phytoalexins with activity against Ascochyta spp.
have been identified such as medicarpin and
maackiain in chickpea (Daniel et al. 1990), and
pisatin in pea (Bailey 1969; Heath and Wood
1971b). Experiments have shown that resistant
chickpea cultivars infected with A. rabiei showed
a significantly higher accumulation of phytoalex-
ins than susceptible cultivars (Weigand et al.
1986; Daniel et al. 1990). On pea, Bailey (1969)
showed that pisatin concentrations decreased
with plant senescence while the tissue became
more susceptible to infection by M. pinodes,
leading Roger and Tivoli (1996b) to conclude
that any factor contributing to decreased pisatin
concentration and accelerated plant senescence
may favour the production of pseudothecia of M.
pinodes. Roger et al. (1999a) suggested that leaf
wetness possibly favours pycnidial development
by M. pinodes because of a dilution of pisatin.
Toyoda et al. (1995) found that exogenously
applied plant lectins were able to induce the
production of pisatin.
In faba bean, six phytoalexins have been
described with activity against germ tubes of
primarily Botrytis cinerea, and some against B.
fabae (Hargreaves et al. 1977), but no phyto-
alexin has been identified with activity against A.
fabae.
Symptoms
Symptoms develop on all aerial parts of the plant
and consist of necrotic lesions. Interestingly, the
different ascochyta blight fungi induce similar
symptoms except for those of M. pinodes and P.
medicaginis var. pinodella. All other Ascochyta
spp. cause well delineated lesions with clear
borders, in the centre of which numerous pycnidia
are formed. On the stems, these fungi cause deep
necrotic lesions which can lead to breaking of
stems and death of plant parts above the affected
zone. Mycosphaerella pinodes initially produces
small lesions in the form of numerous flecks.
Leaves with many lesions wither before the
lesions become large, especially on the lower
portion of the plants. Stem lesions are initiated at
the bases of dead leaves and spread above and
below that point. They coalesce to encircle the
entire lower stem which generally does not break.
All species cause necrosis on pods which results in
seed infection. Heavily infected seeds have more
or less severe discolourations and can shrivel in
the most serious cases. Phoma medicaginis var.
pinodella can cause the same necrosis on foliage
as M. pinodes, but foot-rot is the more typical
symptom.
Disease prevalence and yield losses
Yield losses include both weight and quality
losses due to seed infection. The difficulty to
precisely determine the impact of ascochyta
blights on yield is evident in the large ranges
reported for yield losses in published papers. In
field pea, Bretag et al. (2000) found that disease
severity varied considerably between years,
62 Eur J Plant Pathol (2007) 119:59–76
123
regions and fields in the same region and was
attributed to differences in climatic conditions
and in the availability of inoculum (Bretag 1991).
In chickpea, Nene (1981) quoted yield losses
ranging from 10–20% to 50–70% depending upon
the country and the year. Similar ranges of yield
losses have been published for other ascochyta
blight diseases. Very few publications list yield
loss assessments as an explicit objective, and
consequently there is a lack of data collected
under well-characterised conditions. As a result,
diseases are frequently classified as important or
major with a % loss in the introduction, but
without any indication of frequency of such
losses, or how and under what conditions they
were encountered.
A survey of 68 pea fields in Victoria (Australia)
in 1986 by Bretag et al. (1995b) showed that yield
losses varied from 3.1 to 26.4% with a mean of
18.1%. In field experiments, Ahmed and Morrall
(1996) observed seed infections ranging between
12 and 29% among 10 lentil genotypes, between
35 and 43% among five A. lentis isolates, and a
significant relationship between Area Under the
Disease Progress Curve (AUDPC) and % seed
infection. On around 150 commercial lentil seed
samples collected from four states of the US
Pacific Northwest between 1982 and 1985, the
levels of infection with A. lentis ranged from 0 to
100% between years, and from 7 and 100%
between three states (Kaiser and Hannan 1986).
On faba bean, Gaunt and Liew (1981) reported
incidence levels of A. fabae between 0.3 and 12%
from 23 fields in New Zealand in 1977–1978 which
were correlated with percentages of infected
plants.
Apart from climatic factors and the availability
of inoculum, yield losses or variation in seed
quality also depend upon the pathogen species
and the physiological stage of the plants at the
time of infection. For example, in plots artificially
infested with M. pinodes, P. medicaginis var.
pinodella and A. pisi, Wallen (1965) showed that
M. pinodes caused the greatest reduction in yield
(45%). Plots inoculated with P. medicaginis var.
pinodella yielded 25% lower and those inoculated
with A. pisi 11% lower than control plots. In these
plots, seed infection rates were 5.0, 15.6 and
16.6% for P. medicaginis var. pinodella,
M. pinodes and A. pisi, respectively. For M.
pinodes, a relationship between yield loss and the
growth stage of the pea plants at the time of
inoculation was demonstrated experimentally.
Xue et al. (1997) observed that M. pinodes
reduced yield of field pea by 31, 24 and 19% in
1994, and 33, 43 and 30% in 1995 when plants
were inoculated at 8–10 nodes, mid-flowering and
the pod swell stages, respectively. All inoculations
reduced seed weight in both years compared to
the control.
Survival and primary inoculum
Four main sources of primary inoculum have
been described for ascochyta blight diseases:
seeds, plant debris, soil and volunteers.
Seeds
Ascochyta spp. are generally considered to be
seedborne pathogens, and infected seed can be
the most important source of inoculum for long
distance spread. Kaiser (1997) reviewed inter-
and intra-national spread of ascochyta blight
pathogens of chickpea, faba bean and lentil, and
showed that seeds were responsible for the
introduction of various Ascochyta spp. into, and
for dissemination within many countries world-
wide. Movement of infected seed of these three
crops not only leads to the introduction of
virulent pathotypes, but may also spread compat-
ible mating types into new areas which can result
in the development of the teleomorph. In the case
of Canada, Gossen and Morrall (1986) pointed
out that seed-borne inoculum was the means by
which ascochyta blights of faba bean, chickpea
and lentil initially became established in this
country.
The penetration of these pathogens into the
inner parts of the seeds permits their survival for
several years, mainly when seeds are stored at low
temperatures. Corbiere et al. (1994) determined
that M. pinodes was able to survive in pea seed
for four years. When pea seeds were highly
infected by M. pinodes, the pathogen was
detected in the embryo and pycnidia were
observed in internal cotyledons (Moussart et al.
Eur J Plant Pathol (2007) 119:59–76 63
123
1998). On faba bean, Michail et al. (1983)
observed that A. fabae could be isolated from
the seed coat, cotyledons and embryo axis at the
rate of 100%, 46% and 27%, respectively. Asco-
chyta rabiei was located on or in the seed coat, in
a very few cases penetrated into the cotyledons,
and rarely grew to the embryo. Ascochyta lentis
was found in 36% of testae and cotelydons from
seeds with more than 12% seed discolouration
(Morrall and Beauchamp 1988). The mode of
transmission from seed to the foliar plant parts
was described as non-systemic (Dey and Singh
1994).
The rate of seed-to-seedling transmission
determines how many infected seeds develop
into infected seedlings and thus can influence the
development of an epidemic. Pea seeds infected
by A. pisi gave rise to only 40% infected seedlings
with lesions on stems and the first two leaves,
whereas almost all seedlings developing from
seeds infected with M. pinodes showed symptoms
at or below soil level (Maude 1966; Moussart
et al. 1998). Low temperatures were found to
increase the frequency of transmission in the case
of pea (Moussart et al. 1998), but also in lentil
(Gossen and Morrall 1986). Corbiere et al. (1994)
found seed-to-seedling transmission rates for M.
pinodes of 100% at 15�C compared to 61.5% at
18�C and 70% at 25�C. Although seed-to-seedling
frequencies are high in M. pinodes, Bretag et al.
(1995a) found there was no correlation between
the level of seed infection and the severity of
ascochyta blight. This lack of correlation between
incidences of seed infection and ascochyta blight
severity in pea has been attributed to the impor-
tance of air-borne ascospores in the epidemiology
of this disease. However, seed infection signifi-
cantly influences seedling emergence.
Field experiments in lentil showed that seed
infection with A. lentis had a significant negative
effect on germination rates (Gossen and Morrall
1986). In experiments under controlled condi-
tions, lentil seed with no visible discolouration,
slight discolouration and large lesions due to A.
lentis had seed-to-seedling transmission frequen-
cies of 0.07, 0.21 and 0.39, respectively (Gossen
and Morrall 1986).
With A. rabiei, Weltzien and Kaack (1984)
observed that out of 95 infected seeds, 32%
produced infected plants. Surface inoculation of
seed with spore suspensions of 109–1010 spores of
A. rabiei ml–1 reduced germination rates to 46%
compared to 99% in uninoculated seeds, and
resulted in 6% healthy seedlings compared to
99% in uninoculated seed lots (Kaiser et al.
1973).
Asochyta fabae is seed-borne and splash dis-
persed, and the primary source of inoculum is
thought to be infected seeds in commercial seed
lots (reviewed by Gaunt 1983). Gaunt and Liew
(1981) used six seed lots with incidences of seed
infection ranging from 0.2 to 12% in field exper-
iments and found disease incidences ranging from
2.6 to 50.0%, incidence of seed infection from
15.0 to 22.0%, and yield from 4.3 to 2.4 t ha–1,
respectively.
Infected stubble
In many countries, crop residue has traditionally
been buried in the soil by ploughing, a procedure
that generally promotes the decomposition of the
stubble and thus the destruction of pathogen
structures. In some countries, agronomic practices
in this respect have changed dramatically, pri-
marily to avoid soil erosion by wind after harvest,
and low- or zero-till agriculture is practised where
the stubble remains at the soil surface. This
change in cropping practice may have had a
significant impact on the importance of stubble in
the epidemiological cycle in some systems. Two
main cases have demonstrated the epidemiolog-
ical importance of fungal survival in infected
stubbles.
In Washington State, USA, the teleomorph of
A. rabiei develops on chickpea crop residues that
remain on the soil surface during winter. The
number of ascospores has been estimated to reach
about 15,000 mm–2 of tissue surface of infested
stubble, and spores are released during the
vegetative stage of the following chickpea crop
(Trapero-Casas and Kaiser 1992a). In Spain,
Navas-Cortes et al. (1995) observed that on
chickpea debris left on the soil surface under
natural conditions, A. rabiei rapidly colonized the
tissues, formed abundant pseudothecia and
pycnidia, and remained viable throughout the
two years of their study. When plant debris was
64 Eur J Plant Pathol (2007) 119:59–76
123
buried, A. rabiei was restricted to the original
lesions and lost viability within 2–4 months (Kai-
ser 1973). Although Navas-Cortes et al. (1995)
often observed brown, thick-walled, swollen
hyphae associated with fruiting structures in the
infected tissues, they were unable to distinguish
specialized fungal survival structures such as
chlamydospores or sclerotia on either surface or
buried debris as described for A. pinodes and P.
medicaginis var. pinodella (Table 1). These struc-
tures are important allowing these species to
survive in the soil for more than one year after
the complete destruction of host tissues. Gossen
and Morrall (1986) observed that A. fabae, A.
rabiei and A. lentis survived at the soil surface for
at least one winter season. Steep ascochyta blight
gradients were modelled in lentil fields by Peder-
sen et al. (1993) who found that one-year old
residue and volunteers present at the field border
affected the new crop up to 50 m into the lentil
field.
In the case of M. pinodes under growing
conditions in Australia, pseudothecia are formed
on crop residues from the previous year and the
concentration of air-borne ascospores is highest in
late autumn to early winter when pseudothecia
mature and first become productive (Bretag 1991;
Peck et al. 2001).
Soil
Few reports have investigated the behaviour of
Ascochyta spp. in the soil. Some detailed studies
have been conducted only on the species involved
in the ascochyta blight complex of pea. The
ability of soil cultures of P. medicaginis var.
pinodella and A. pinodes to form chlamydospores
was considered to be a major factor for their
survival, whereas no chlamydospores were
formed in soil cultures of A. pisi (Wallen and
Jeun 1968). The authors observed that chlamy-
dospores enabled these fungi to survive for at
least 12 months in sterilised soils. Wallen et al.
(1967) reported that P. medicaginis var. pinodella
was present in most soils where peas were grown
in eastern Canada, and also in some soils where
peas had not been grown for one to five years.
Ascochyta pinodes, in comparison, was isolated
less frequently from these soil samples. Studying
A. pinodes survival in soil and aerial dissemina-
tion through the pea cropping season, Peck et al.
(2001) observed that infection from stubble was
initially high but dropped to low levels after one
year, while infection from soil inoculum declined
slowly over three years.
Volunteers
Volunteers have sometimes been indicated in the
transmission of inoculum from field borders into
the fields. The role of the volunteer plants has
been well described for faba bean. For this crop,
Bond and Pope (1980) found a distinct gradient of
ascochyta blight-infected winter bean plants from
the border to the centre suggesting that spread
from volunteer plants in adjacent fields was a
much more important source of infection than
infected seed. However, debris from previous
crops may also be important (Lockwood et al.
1985).
In general, the importance of the different
sources of primary inoculum may vary depending
upon the species, cropping practices and climatic
factors. For example, based on the distribution of
primary symptoms on upper parts of the chickpea
plants, Milgroom and Peever (2003) concluded
that D. rabiei ascospores were the dominant type
of primary inoculum, and were more important
than infected seeds in the northwest of the USA.
In contrast, in Canadian and Australian chickpea
fields, infected seeds and chickpea stubble are
considered to be the primary sources of inoculum,
although airborne ascospores are of relevance for
long-distance dispersal (Chongo et al. 2004;
Pande et al. 2005).
Disease development
Ascochyta blights are polycyclic and secondary
cycles are generally due to a succession of
pycnospores released from plant tissue to tissue,
or from plant to plant. Researchers have gener-
ally described five to ten cycles of pycnidiospore
production and re-infection during the cropping
season which results in a progression of the
disease along the plant from the base to the top.
Leaves or leaf axils tend to be the first plant
Eur J Plant Pathol (2007) 119:59–76 65
123
tissues that are infected, followed by stems, pods
and seeds. It is only in the case of M. pinodes that
ascospores are involved in secondary cycles of
infections.
Different phases of the disease cycle
The epidemiological development of ascochyta
blights can be considered as a race between the
host plant which grows and develops depending
on environmental conditions, and the pathogen
which may infect the plant at the early stage of
development at the base of the plant and from
there continues to spread to upper plant parts as
they develop. As a consequence, for some crops
like faba bean and pea, ascochyta blight severity
is generally very high on the lower parts of the
plants, but can be very low on the uppermost
parts where plant tissue has escaped infection
until that time.
Maurin and Tivoli (1992) described this epide-
miological pattern in three phases for winter faba
bean starting with the first lesions caused by A.
fabae until seed infection has occurred:
(1) Disease initiation is characterised by the
appearance of a few lesions on seedlings
during the winter. The fungus spreads from
plant to plant and disease incidence in-
creases rapidly. The cold, wet weather dur-
ing crop establishment is usually favourable
to pathogen development on slow-growing
seedlings.
(2) The subsequent phase of plant infection
starts at the end of the winter when plants
begin to grow more rapidly. Lesions, initially
limited to the foliage, develop on stems and
spread to the top of the plant. The epidemic
spreads on foliage from node to node.
Disease severity may be reduced when the
climatic conditions are unfavourable for
spreading (very little rainfall) while the
number of foliar nodes increases with plant
growth. Hence, plants may escape a severe
attack temporarily because plant growth is
significantly faster than the progression of
the pathogen. During this second epidemic
phase, the spread of the fungus strongly
depends on rainfall, but it is very likely that
disease severity during this phase also
depends on inoculum pressure, a conse-
quence of the initial infection.
(3) During the pod infection phase the pathogen
infects those pods that develop on infected
nodes. Conidial dispersal by splashing dur-
ing rain facilitates the contamination of the
lowest pods. This third phase takes place
when plant growth slows down after the
flowering stage, and during pod initiation
and filling. At this growth stage of the plant,
even light disease pressure can induce severe
damage because pod infection causes infec-
tion of the seeds.
This epidemiological cycle can be generalised
for different legume crop species. Regarding the
respective roles of ascospores and pycnidiospores,
three scenarios of increasing complexity are
described among the grain legume species con-
sidered.
In the first scenario (Fig. 1), the epidemic is
exclusively based on successive pycnidiospore
cycles. This scenario is characteristic for epidem-
ics caused by A. pisi, A. lentis, A. fabae, P.
medicaginis var. pinodella and A. rabiei (under
certain growing conditions). Primary inoculum
can be infected seeds (for all of these species),
infected debris and in some cases chlamydospores
in the soil, or ascospores (for A. fabae, A. lentis
and A. rabiei). For some of the species, the sexual
form has been identified but the epidemic role of
ascospores is not evident or unknown in the
epidemiological cycle. For example, in ascochyta
blight on lentil, the commonly described disease
cycle observed in Canadian lentil fields is only
based on pycnidiospore dispersal during the
cropping period and ascospores are not present
(Morrall 1997). In contrast, in Australia (Gallo-
way et al. 2004) and in the northwest of the USA
(Kaiser and Hellier 1993), the teleomorph has
been detected in the field on lentil straw. Simi-
larly, Porta-Puglia (1990) described A. rabiei
epidemics for the Mediterranean basin caused
by pycnidiospores which are dispersed by rainfall
and intensified by wind. However, the life-cycle of
A. fabae on faba bean described by Jellis and
Punithalingam (1991) includes the teleomorph D.
fabae.
66 Eur J Plant Pathol (2007) 119:59–76
123
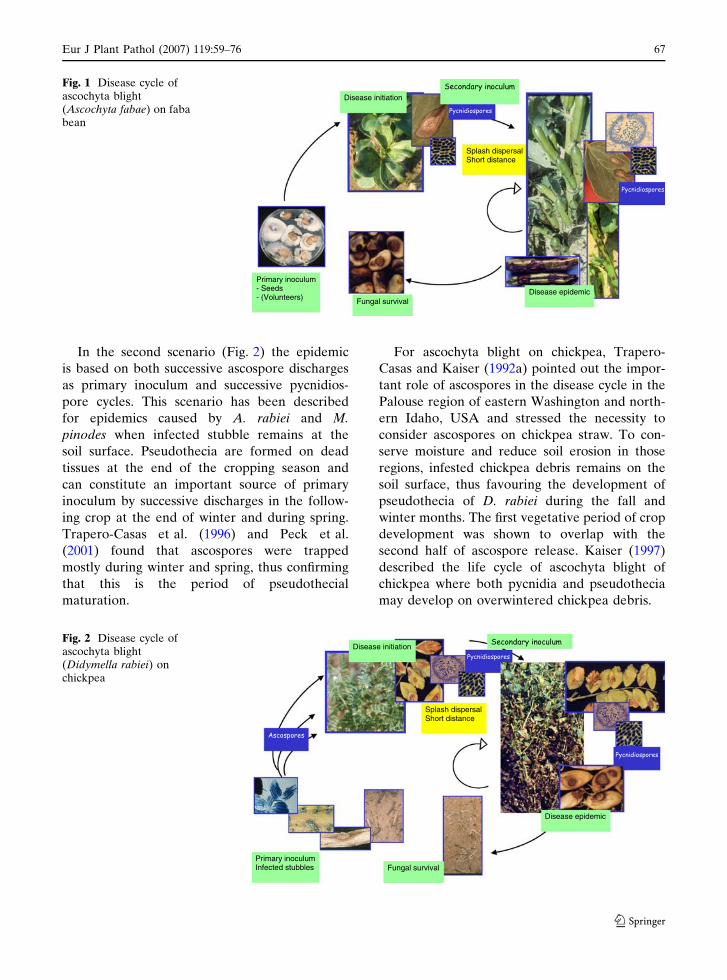
In the second scenario (Fig. 2) the epidemic
is based on both successive ascospore discharges
as primary inoculum and successive pycnidios-
pore cycles. This scenario has been described
for epidemics caused by A. rabiei and M.
pinodes when infected stubble remains at the
soil surface. Pseudothecia are formed on dead
tissues at the end of the cropping season and
can constitute an important source of primary
inoculum by successive discharges in the follow-
ing crop at the end of winter and during spring.
Trapero-Casas et al. (1996) and Peck et al.
(2001) found that ascospores were trapped
mostly during winter and spring, thus confirming
that this is the period of pseudothecial
maturation.
For ascochyta blight on chickpea, Trapero-
Casas and Kaiser (1992a) pointed out the impor-
tant role of ascospores in the disease cycle in the
Palouse region of eastern Washington and north-
ern Idaho, USA and stressed the necessity to
consider ascospores on chickpea straw. To con-
serve moisture and reduce soil erosion in those
regions, infested chickpea debris remains on the
soil surface, thus favouring the development of
pseudothecia of D. rabiei during the fall and
winter months. The first vegetative period of crop
development was shown to overlap with the
second half of ascospore release. Kaiser (1997)
described the life cycle of ascochyta blight of
chickpea where both pycnidia and pseudothecia
may develop on overwintered chickpea debris.
muluconi yramirP sdeeS -
)sreetnuloV( -
lasrepsid hsalpS ecnatsid trohS
lavivrus lagnuFcimedipe esaesiD
noitaitini esaesiD
Pycnidiospores
Pycnidiospores
Fig. 1 Disease cycle ofascochyta blight(Ascochyta fabae) on fababean
muluconi yramirP selbbuts detcefnI lavivrus lagnuF
lasrepsid hsalpS ecnatsid trohS
noitaitini esaesiD
cimedipe esaesiD
Pycnidiospores
Pycnidiospores
Fig. 2 Disease cycle ofascochyta blight(Didymella rabiei) onchickpea
Eur J Plant Pathol (2007) 119:59–76 67
123
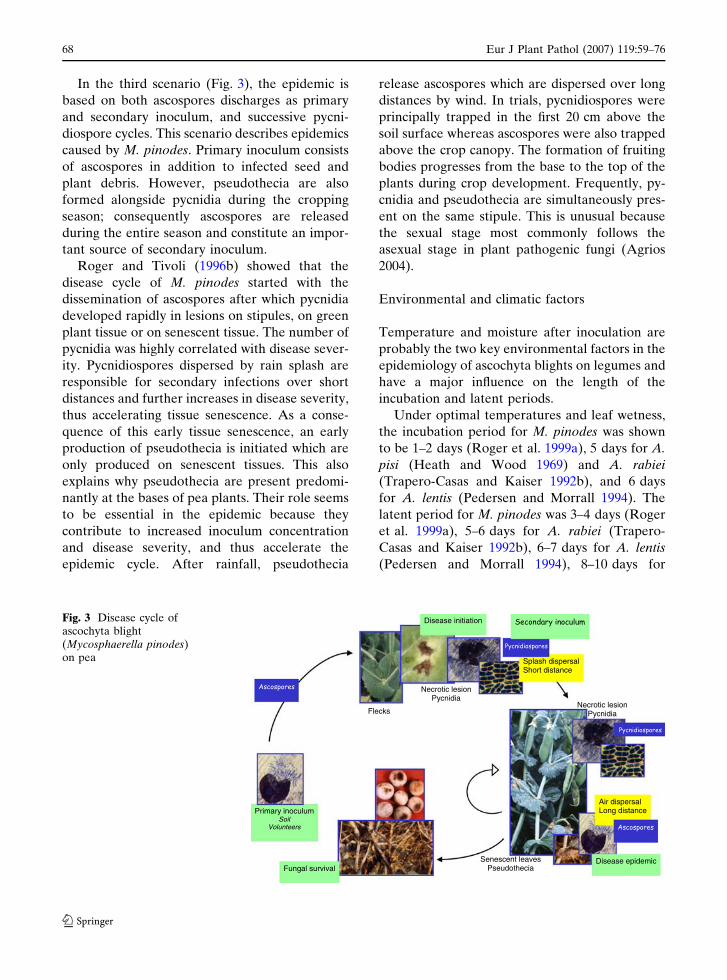
In the third scenario (Fig. 3), the epidemic is
based on both ascospores discharges as primary
and secondary inoculum, and successive pycni-
diospore cycles. This scenario describes epidemics
caused by M. pinodes. Primary inoculum consists
of ascospores in addition to infected seed and
plant debris. However, pseudothecia are also
formed alongside pycnidia during the cropping
season; consequently ascospores are released
during the entire season and constitute an impor-
tant source of secondary inoculum.
Roger and Tivoli (1996b) showed that the
disease cycle of M. pinodes started with the
dissemination of ascospores after which pycnidia
developed rapidly in lesions on stipules, on green
plant tissue or on senescent tissue. The number of
pycnidia was highly correlated with disease sever-
ity. Pycnidiospores dispersed by rain splash are
responsible for secondary infections over short
distances and further increases in disease severity,
thus accelerating tissue senescence. As a conse-
quence of this early tissue senescence, an early
production of pseudothecia is initiated which are
only produced on senescent tissues. This also
explains why pseudothecia are present predomi-
nantly at the bases of pea plants. Their role seems
to be essential in the epidemic because they
contribute to increased inoculum concentration
and disease severity, and thus accelerate the
epidemic cycle. After rainfall, pseudothecia
release ascospores which are dispersed over long
distances by wind. In trials, pycnidiospores were
principally trapped in the first 20 cm above the
soil surface whereas ascospores were also trapped
above the crop canopy. The formation of fruiting
bodies progresses from the base to the top of the
plants during crop development. Frequently, py-
cnidia and pseudothecia are simultaneously pres-
ent on the same stipule. This is unusual because
the sexual stage most commonly follows the
asexual stage in plant pathogenic fungi (Agrios
2004).
Environmental and climatic factors
Temperature and moisture after inoculation are
probably the two key environmental factors in the
epidemiology of ascochyta blights on legumes and
have a major influence on the length of the
incubation and latent periods.
Under optimal temperatures and leaf wetness,
the incubation period for M. pinodes was shown
to be 1–2 days (Roger et al. 1999a), 5 days for A.
pisi (Heath and Wood 1969) and A. rabiei
(Trapero-Casas and Kaiser 1992b), and 6 days
for A. lentis (Pedersen and Morrall 1994). The
latent period for M. pinodes was 3–4 days (Roger
et al. 1999a), 5–6 days for A. rabiei (Trapero-
Casas and Kaiser 1992b), 6–7 days for A. lentis
(Pedersen and Morrall 1994), 8–10 days for
muluconi yramirPlioS
sreetnuloV
noisel citorceN aidincyP
skcelF
sevael tnecseneS aicehtoduesP
noisel citorceN aidincyP
lavivrus lagnuF
lasrepsid riAecnatsid gnoL
lasrepsid hsalpS ecnatsid trohS
cimedipe esaesiD
noitaitini esaesiD
Pycnidiospores
Pycnidiospores
Fig. 3 Disease cycle ofascochyta blight(Mycosphaerella pinodes)on pea
68 Eur J Plant Pathol (2007) 119:59–76
123
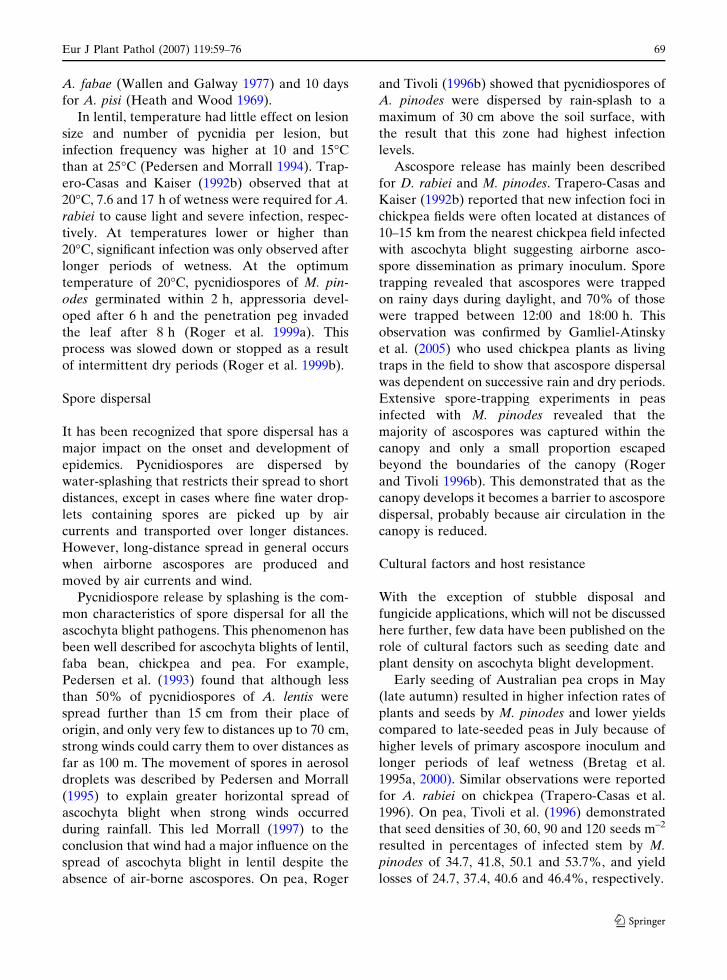
A. fabae (Wallen and Galway 1977) and 10 days
for A. pisi (Heath and Wood 1969).
In lentil, temperature had little effect on lesion
size and number of pycnidia per lesion, but
infection frequency was higher at 10 and 15�C
than at 25�C (Pedersen and Morrall 1994). Trap-
ero-Casas and Kaiser (1992b) observed that at
20�C, 7.6 and 17 h of wetness were required for A.
rabiei to cause light and severe infection, respec-
tively. At temperatures lower or higher than
20�C, significant infection was only observed after
longer periods of wetness. At the optimum
temperature of 20�C, pycnidiospores of M. pin-
odes germinated within 2 h, appressoria devel-
oped after 6 h and the penetration peg invaded
the leaf after 8 h (Roger et al. 1999a). This
process was slowed down or stopped as a result
of intermittent dry periods (Roger et al. 1999b).
Spore dispersal
It has been recognized that spore dispersal has a
major impact on the onset and development of
epidemics. Pycnidiospores are dispersed by
water-splashing that restricts their spread to short
distances, except in cases where fine water drop-
lets containing spores are picked up by air
currents and transported over longer distances.
However, long-distance spread in general occurs
when airborne ascospores are produced and
moved by air currents and wind.
Pycnidiospore release by splashing is the com-
mon characteristics of spore dispersal for all the
ascochyta blight pathogens. This phenomenon has
been well described for ascochyta blights of lentil,
faba bean, chickpea and pea. For example,
Pedersen et al. (1993) found that although less
than 50% of pycnidiospores of A. lentis were
spread further than 15 cm from their place of
origin, and only very few to distances up to 70 cm,
strong winds could carry them to over distances as
far as 100 m. The movement of spores in aerosol
droplets was described by Pedersen and Morrall
(1995) to explain greater horizontal spread of
ascochyta blight when strong winds occurred
during rainfall. This led Morrall (1997) to the
conclusion that wind had a major influence on the
spread of ascochyta blight in lentil despite the
absence of air-borne ascospores. On pea, Roger
and Tivoli (1996b) showed that pycnidiospores of
A. pinodes were dispersed by rain-splash to a
maximum of 30 cm above the soil surface, with
the result that this zone had highest infection
levels.
Ascospore release has mainly been described
for D. rabiei and M. pinodes. Trapero-Casas and
Kaiser (1992b) reported that new infection foci in
chickpea fields were often located at distances of
10–15 km from the nearest chickpea field infected
with ascochyta blight suggesting airborne asco-
spore dissemination as primary inoculum. Spore
trapping revealed that ascospores were trapped
on rainy days during daylight, and 70% of those
were trapped between 12:00 and 18:00 h. This
observation was confirmed by Gamliel-Atinsky
et al. (2005) who used chickpea plants as living
traps in the field to show that ascospore dispersal
was dependent on successive rain and dry periods.
Extensive spore-trapping experiments in peas
infected with M. pinodes revealed that the
majority of ascospores was captured within the
canopy and only a small proportion escaped
beyond the boundaries of the canopy (Roger
and Tivoli 1996b). This demonstrated that as the
canopy develops it becomes a barrier to ascospore
dispersal, probably because air circulation in the
canopy is reduced.
Cultural factors and host resistance
With the exception of stubble disposal and
fungicide applications, which will not be discussed
here further, few data have been published on the
role of cultural factors such as seeding date and
plant density on ascochyta blight development.
Early seeding of Australian pea crops in May
(late autumn) resulted in higher infection rates of
plants and seeds by M. pinodes and lower yields
compared to late-seeded peas in July because of
higher levels of primary ascospore inoculum and
longer periods of leaf wetness (Bretag et al.
1995a, 2000). Similar observations were reported
for A. rabiei on chickpea (Trapero-Casas et al.
1996). On pea, Tivoli et al. (1996) demonstrated
that seed densities of 30, 60, 90 and 120 seeds m–2
resulted in percentages of infected stem by M.
pinodes of 34.7, 41.8, 50.1 and 53.7%, and yield
losses of 24.7, 37.4, 40.6 and 46.4%, respectively.
Eur J Plant Pathol (2007) 119:59–76 69
123
Host resistance is considered to have the
greatest effect on ascochyta blight epidemics.
Although poorly understood, pulse crops appear
to become more susceptible to infection by
Ascochyta spp. with increasing plant age. For
example, M. pinodes was shown to be more
aggressive on old tissues which was correlated
with decreasing phytoalexin concentrations in the
tissue (Heath and Wood 1971b). Similarly, par-
tially resistant chickpea cultivars were shown to
lose resistance to A. rabiei with increasing plant
age (e.g., Trapero-Casas and Kaiser 1992b; Singh
and Reddy 1993; Chongo and Gossen 2001), but it
was also suggested that newly developed plant
tissue on these plants showed higher resistance
than older tissue (Chongo and Gossen 2001). In
lentil, in contrast, Pedersen and Morrall (1994)
observed that tissues below the top four or five
nodes on the main stem and secondary branches
were almost completely resistant suggesting that
resistance increased as tissue matured.
Studying the effect of resistance in lentil on the
infection process of A. lentis, Pedersen and
Morrall (1994) and Ahmed and Morrall (1996)
found that although the incubation periods were
similar among lentil cultivars, AUDPC, the
number of lesions, lesion length and width and
the number of pycnidia per lesion were negatively
correlated with the level of resistance in the
cultivars. Similar observations have been made on
pea and faba bean (Maurin and Tivoli 1992;
Prioul et al. 2003).
Differences in plant architecture have also
been implicated in influencing ascochyta blight
epidemics by modifying the microclimate in the
canopy. For example, faba bean stem length was
found to be negatively correlated with pod
infection by A. fabae and moisture levels of the
soil surface, and pods higher up on taller stems
escaped infection more readily than pods on short
stems (Jellis et al. 1985). Resistance to M. pinodes
was found to be positively correlated with lodging
resistance, and both lodging and mycosphaerella
blight were negatively correlated with the pro-
portion of xylem, lignin and fibre content of pea
stems (Banniza et al. 2005). Le May et al. (2005)
developed a simulation model for the growth of
pea infected with mycosphaerella blight by incor-
porating architectural features such as stem
height, branching ability and lodging resistance
into the model.
Modelling
Modelling has the objective to formalize by
means of mathematical equations the knowledge
on disease epidemiology. This leads either to a
description of all or some segments of an
epidemic with the objective to understand its
mechanisms, or to forecast the risk of appearance
or development of the disease in relation to
factors like temperature, rainfall, and crop rota-
tions. Models can therefore become an important
and integral part of Integrated Disease Manage-
ment (IDM). As a first step, disease epidemics
have often been described in terms of temporal
and spatial models to describe disease progress.
More complex models have been separated into
two groups, mechanistic models and empirical
models. Mechanistic models are based on a
concept or hypothesis about the mechanism of
the interaction and therefore require prior knowl-
edge of the variables involved. Empirical models,
in contrast, do not require prior knowledge about
the variables and look at the best mathematical fit
of the model to the data, e.g., temperature,
rainfall, and crop rotation. Both types of models
have been used to describe diseases of grain
legumes.
Quantitative descriptions of temporal and spa-
tial developments of ascochyta blights are few. A
comprehensive study of temporal and spatial
dynamics of mycosphaerella blight in Canada
was published by Zhang et al. (2004). Disease
progress in space and time was well described by
logistic models. Steepest disease gradients were
identified upwind at the end of the growing
season. Geostatistical analysis of spatial patterns
revealed differences in disease severity depending
upon geographic directions attributed to different
wind speed and direction.
For ascochyta blight on lentil, Pedersen and
Morrall (1994) established regression equations
which predict incubation and latent periods at
different temperatures. Using a mechanistic
approach, ascochyta blight severity of chickpea
was described as a function of temperature and of
70 Eur J Plant Pathol (2007) 119:59–76
123
the natural logarithm of the length of the wetness
period, predicting that approximately 20�C was
the optimum temperature requiring the shortest
wetness period (Trapero-Casas and Kaiser
1992b). For severe infection, a minimum of 7.6–
10.3 h of wetness was required at a temperature
range of 15–25�C based on this model. Similarly,
polynomial equations were used to predict incu-
bation period, latency of M. pinodes and asco-
chyta blight severity on pea based on temperature
and wetness period (Roger et al. 1999a).
Using and building upon a disease-coupled
crop growth model published by Beasse et al.
(2000), Le May et al. (2005) developed an
improved model to predict the impact of asco-
chyta blight in pea on yield components by
incorporating a combination of disease progres-
sion in the canopy (number of nodes affected by
the disease) and the structure of the canopy (leaf
area index profile). For doing so, they first
estimated the contribution of each node to
radiation absorption, then calculated the reduc-
tion in contribution of each node due to disease
and finally combined the individual contributions
which allowed them to estimate crop growth.
Using data from six varieties they showed a good
fit between estimated and observed values.
It is surprising to observe the low number of
forecasting models for ascochyta blights on grain
legumes. The few forecasting models that have
been described only permit prediction of one or
two phases of the epidemic, such as disease
appearance, disease development, fungal repro-
duction or spore release. For M. pinodes on pea,
Salam et al. (2006) established a model using
historical weather data to forecast disease devel-
opment under different weather scenarios. The
prediction of ascospore release proved to be
critical in determining seeding dates in order to
avoid spore deposition on the newly establishing
crop. Using data from fifteen pea cultivars, Bretag
et al. (1995b) developed empirical crop loss
models that allowed yield loss to be estimated
based on disease severity.
Gamliel-Atinsky et al. (2005) confirmed that
pseudothesial formation and maturation of D.
rabiei required low temperature and moisture
periods, based on which in combination with
other published data Shtienberg et al. (2005)
developed an empirical model to forecast pseu-
dothecial maturation.
Conclusion
This review on the epidemiology of the various
Ascochyta spp. in pulse crops highlights common
and specific features of the different ascochyta
blights. The common features can be summarized
as (1) all species produce pycnidia, (2) except for
A. pisi, the teleomorph is present, (3) the role of
infected seed as primary inoculum is significant,
(4) they form the same types of symptoms except
for M. pinodes and P. medicaginis var. pinodella,
(5) plant compounds like phytoalexins and path-
ogen toxins appear to be involved in the host-
pathogen interactions, (6) ascochyta blights are
polycyclic diseases and epidemics develop on
leaves, stems, pods and finally seeds, (7) temper-
ature and moisture are the two primary environ-
mental factors affecting disease development, (8)
pseudothecia generally are formed at the end of
the cropping cycle (except for M. pinodes) and
are implied in inoculum survival. Species-specific
features are (1) the type of symptoms caused by
M. pinodes, (2) the length of incubation and
latency periods which are different among the
different ascochyta blights, (3) the role of infected
stubble as primary inoculum in some parts of the
world, (4) the involvement of pseudothecia of M.
pinodes as secondary inoculum.
Reviewing the literature revealed several areas
where there is a clear lack of data:
(1) The exact involvement of the soil as primary
inoculum is unclear, but we can expect that
molecular detection tools for pathogens
from soil will improve our knowledge.
(2) The timing of primary inoculum deposition
on the crop is difficult to assess and tech-
niques other than trap plants and spore traps
are lacking to easily estimate inoculum
quantities above the plant canopy.
(3) There is a general lack of understanding of
the host-pathogen interactions, at the micro-
scopic level to some degree, but more so at
the biochemical and molecular levels. With
the exception of A. rabiei, the majority of
papers, in particular, on biochemical aspects
Eur J Plant Pathol (2007) 119:59–76 71
123
of the systems are 20–40 years old, and it can
be expected that modern tools of molecular
biology and biochemistry could have a
significant impact on our ability to investi-
gate these host-pathogen systems.
(4) Information on the role of cultural factors
on ascochyta blight epidemics is sparse in
the published literature. Surprisingly little
information has been published that could
improve integrated disease management of
these diseases.
(5) Mechanistic modelling for life-cycles of all
the pathogens and for the epidemics during
the cropping period is missing.
(6) More forecasting models are required that
establish simple relationships between cli-
matic and epidemic events and that are easy
to implement.
When comparing the well-researched areas in
ascochyta blight epidemiologies with those where
there are obvious gaps in our knowledge, it
becomes obvious that the latter are of equal
importance, but appear to have been neglected
because of lack of research concepts, tools or
resources. Clearly, several of these areas would
benefit greatly from the use of molecular tools
and the application of modern statistical method-
ology. It is also apparent that some aspects of
ascochyta blight research was conducted decades
ago, and although still of considerable impor-
tance, would benefit from reassessments using
modern tools and techniques. On the other hand,
some more traditional research areas seem to
have been neglected almost completely in favour
of molecular research. For example, it seems
surprising that to date there is insufficient data to
answer the fundamental question of whether
Ascochyta spp. are hemiobiotrophs or necro-
trophs. There seems to be an urgent need to
boost new research initiatives in the area of
epidemiology of ascochyta blights which combine
traditional epidemiological strategies with new
tools provided by molecular biology and bio-
chemistry to elucidate the mechanisms of these
host–pathogen interactions. Knowledge and data
of that nature are essential to make progress in
the development of quantitative mechanistic
models, but will also assist in resistance breeding
by providing an understanding of the complexity
of the interaction. Beyond that, there is an
obvious gap in applied research which investi-
gates the role and sources of primary inoculum
and cultural factors to develop and improve
current integrated disease management strate-
gies.
Research on the epidemiology of A. rabiei and
M. pinodes is most comprehensive and advanced,
and may serve as an example and an inspiration
for the other species as well as for each other. In
M. pinodes the most detailed information has
been gathered on disease development, the initi-
ation, location and dispersal of various dispersal
structures, and the effect of disease development
on the plant in terms of photosynthetic activity as
well as yield formation. A comprehensive review
specifically on the epidemiology and control of
ascochyta blight on field pea was recently pub-
lished by Bretag et al. (2006). Research on this
species has greatly benefited from concentrated
long-term studies primarily in France and Aus-
tralia whereas research efforts on other species
has been either more limited in scope due to
limitations in resources (e.g., A. lentis), or has
been scattered across various countries, diverse
climates and cropping systems which has ham-
pered the transfer and application of research
results in a more comprehensive manner (e.g., A.
rabiei). However, research on the advance of M.
pinodes in, and its interaction with the host at the
microscopic, biochemical and molecular level is
sketchy. Ascochyta blight of chickpea, in com-
parison, is much better understood in those areas
whereas comprehensive field epidemiological
studies comparable to those conducted for M.
pinodes are lacking. It can be speculated that
filling those gaps for both of these pathogens may
lead to major advances in disease management: a
better understanding of the host-pathogen inter-
action of M. pinodes on pea may give fresh
impetus to the breeding of resistant pea cultivars
which appears to have stagnated, but which could
significantly simplify asochyta blight control in
this crop. On the other hand, a more comprehen-
sive understanding of the epidemiology of A.
rabiei could result in better disease management
strategies that are urgently needed in countries
like Canada and Australia. The elegant disease
72 Eur J Plant Pathol (2007) 119:59–76
123
forecasting system developed and utilized in
Israel (Shtienberg et al. 2005) could be a starting
point for studies in other countries to clarify
whether, to what degree and under which condi-
tions ascospores induce ascochyta blight on
chickpea. This would then determine whether
the underlying model could be adapted and
adopted elsewhere to prevent primary infection
of the chickpea crop by targeted fungicide sprays
to kill the ascospores early in the season. It is
obvious that in systems where infected seed,
stubble, pycnidia and potentially ascospores can
initiate ascochyta blight, disease forecasting is
bound to become more complex as exemplified
by the models developed for M. pinodes in France
(Beasse et al. 2000; Le May et al. 2005). It is
probably safe to say that for those systems we
may not know enough about the relative impor-
tance of each of these sources, which may be
highly variable depending upon the location and
year. It is unlikely that the prevention of primary
infection can be achieved in such systems; hence
models are required which describe the entire
life-cycle of these pathogens in response to
environmental factors. Also, some of the species
are thought to occur and cause damage in the
anamorphic phase only, but experiences with A.
rabiei and A. lentis in various parts of the world
have shown that a focused attempt has to be
made to truly determine whether ascospores can
be excluded from the life-cycle of these organ-
isms.
Among world crops, grain legumes play a
minor role and consequently research on these
crops and their pathogens is bound to be
restricted by fewer resources and researchers.
This, in combination with the diversity of skills
and knowledge required to tackle those gaps in
ascochyta blight epidemiology outlined here,
should present a strong incentive for future
international collaborations.
References
Agrios, G. N. (2004). Plant pathology (5th Ed.). ElsevierAcademic Press.
Ahmed, S., & Morrall, R. A. A. (1996). Field reactions oflentil lines cultivars to isolates of Ascochyta fabae f.sp. lentis. Canadian Journal of Plant Pathology, 18,362–369.
Bailey, J. A. (1969). Phytoalexin production by leaves ofPisum sativum in relation to senescence. Annals ofApplied Biology, 64, 315–324.
Banniza, S., Hashemi, P., Warkentin, T. D., Vandenberg, A.,& Davis, A. R. (2005). The relationships among lod-ging, stem anatomy, degree of lignification, and resis-tance to mycosphaerella blight in field pea (Pisumsativum). Canadian Journal of Botany, 83, 954–967.
Barve, M. P., Arie, T., Slimath, S. S., Muehlbauer, F. J., &Peever, T. L. (2003). Cloning and characterization ofthe mating type (MAT) locus from Ascochyta rabiei(teleomorph: Didymella rabiei) and a MAT phylogenyof legume-associated Ascochyta spp. Fungal Geneticsand Biology, 39, 151–167.
Barz, W., & Welle, R. (1992). Biosynthesis and metabo-lism of isoflavones and pterocarpan phytoalexins inchickpea, soybean and phytopathogenic fungi. In: H.A. Stafford, & R. K. Abrahim (Eds.), Phenolicmetabolism in plants (pp. 139–164). New York: Ple-num Press.
Beasse, C., Ney, B., & Tivoli, B. (2000). A simple model ofpea growth affected by Mycosphaerella pinodes. PlantPathology, 49, 187–200.
Beed, F. D., Strange, R. N., Onfroy, C., & Tivoli, B. (1994).Virulence for faba bean and production of ascochy-tine by Ascochyta fabae. Plant Pathology, 43, 987–997.
Bond, A., & Pope, M. (1980). Ascochyta fabae on winterbeans (Vicia faba): Pathogen spread and variation inhost resistance. Plant Pathology, 29, 59–65.
Bowen, J. K., Lewis, B. G., & Matthews, P. (1997). Dis-covery of the teleomorph of Phoma medicaginis var.pinodella in culture. Mycological Research, 101, 80–84.
Bretag, T. W. (1991). Epidemiology and control of asco-chyta blight of field peas, PhD Thesis. La TrobeUniversity, Australia.
Bretag, T. W., Price, T. V., & Keane, P. J. (1995a).Importance of seed-borne inoculum in the etiology ofthe ascochyta blight complex of field peas (Pisumsativum L.) grown in Victoria. Australian Journal ofExperimental Agriculture, 35, 525–530.
Bretag, T. W., Keane, P. J., & Price, T. V. (1995b). Effectof ascochyta blight on the grain yield of field peas(Pisum sativum L.) grown in southern Australia.Australian Journal of Experimental Agriculture, 35,531–536.
Bretag, T. W., Keane, P. J., & Price, T. V. (2000). Effect ofsowing date on the severity of ascochyta blight in fieldpeas (Pisum sativum L.) grown in Wimmera region ofVictoria. Australian Journal of Experimental Agri-culture, 40, 1113–1119.
Bretag, T. W., Keane, P. J., & Price, T. V. (2006). Theepidemiology of ascochyta blight in field peas: A re-view. Australian Journal of Agricultural Research, 57,883–902.
Brewer, D., & MacNeill, B. H. (1953). Preliminary studiesin Ascochyta pisi Lib. Canadian Journal of Botany, 31,739–744.
Chongo, G., & Gossen, B. D. (2001). Effect of plant age onresistance of Ascochyta rabiei in chickpea. CanadianJournal of Plant Pathology, 23, 358–363.
Eur J Plant Pathol (2007) 119:59–76 73
123
Chongo, G., Gossen, B. D., Buchwaldt, L., Adhikari, T., &Rimmer, S. R. (2004). Genetic diversity of Ascochytarabiei in Canada. Plant Disease, 88, 4–10.
Clulow, S. A., Lewis, B. G., Parker, M. L., & Matthews, P.(1991). Infection of pea epicotyls by Mycosphaerellapinodes. Mycological Research, 95, 817–820.
Clulow, S. A., Lewis, B. G., & Matthews, P. (1992).Expression of resistance to Mycosphaerella pinodes inPisum sativum. Plant Pathology, 41, 362–369.
Corbiere, R, Gelie, B., Molinero, V., Spire, D., & Agarwal,V. K. (1994). Investigations on seedborne nature ofMycosphaerella pinodes in pea seeds. Seed Research,22, 26–30.
Daniel, S., Tiemann, K., Wittkampf, U., Bless, W., Hin-derer, W., & Barz, W. (1990). Elicitor-induced meta-bolic changes in cell cultures of chickpea (Cicerarietinum L.) cultivars resistant and susceptible toAscochyta rabiei. I- Investigations of enzyme activitiesinvolved in isoflavone and pterocarpan phytoalexinbiosynthesis. Planta, 182, 270–278.
Dey, S. K., & Singh, G. (1994). Seedborne infection ofAscochyta rabiei in chickpea and its transmission toaerial plant parts. Phytoparasitica, 22, 31–37.
Galloway, J., MacLeod, W. J., & Lindbeck, K. D. (2004).Formation of Didymella lentis, the teleomorph ofAscochyta lentis, on lentil stubble in the field in Vic-toria and Western Australia. Australasian PlantPathology, 33, 449–450.
Gamliel-Atinsky, E., Shienberg, D., Vintal, H., Nitzni, Y.,& Dinoor, A. (2005). Production of Didymella rabieipseudothecia and dispersal of ascospores in a Medi-terranean climate. Phytopathology, 95, 1279–1286.
Gaunt, R. E. (1983). Shoot diseases caused by fungalpathogens. In P. D. Hebblethwaite (Ed.), The FabaBean (pp. 463–492). London: Butterworths.
Gaunt, R. E., & Liew, R. S. S. (1981). Control strategiesfor Ascochyta fabae in New Zealand field and broadbean crops. Seed Science Technology, 9, 707–715.
Gossen, B. D., & Morrall, R. A. A. (1986). Transmission ofAscochyta lentis from infected lentil seed and plantresidue. Canadian Journal of Plant Pathology, 8, 28–32.
Halila, H., Dahmane, A. B. K., & Seklani, H., (1990). Therole of legumes in the farming systems of the Medi-terranean areas. In: A. E. Osman et al. (Eds.), (pp.115–129). ICARDA.
Hargreaves, J. A., Mansfield, J. W., & Rossal, S. (1977).Changes of phytoalexin concentrations in tissues ofthe broad bean plant (Vicia faba L.) following inoc-ulation with species of Botrytis. Physiological PlantPathology, 11, 227–242.
Hare, W. W., & Walker, J. C. (1944). Ascochyta diseasesof canning pea. Wisconsin Research Bulletin, 150, 1–31.
Heath, M. C., & Wood, R. K. S. (1969). Leaf spots inducedby Ascochyta pisi and Mycosphaerella pinodes. Annalsof Botany, 33, 657–670.
Heath, M. C., & Wood, R. K. S. (1971a). Role of cell-wall-degrading enzymes in the development of leaf spotscaused by Ascochyta pisi and Mycosphaerella pinodes.Annals of Botany, 35, 451–474.
Heath, M. C., & Wood, R. K. S. (1971b). Role of inhibitorsof fungal growth in the limitation of leaf spots causedby Ascochyta pisi and Mycosphaerella pinodes. Annalsof Botany NS, 35, 475–491.
Hohl, B., Weidemann, C., Holh, U., & Barz, W. (1991).Isolation of solanopyrones A, B and C from culturefiltrates and spore germination fluids of Ascochytarabiei and aspects of phytotoxin action. Journal ofPhytopathology, 132, 193–206.
Jayakakumar, P., Gossen, B. D., Gan, Y. T., Warkentin, T.D., & Banniza, S. (2005). Ascochyta blight of chick-pea: Infection and host resistance mechanisms.Canadian Journal of Plant Pathology, 27, 499–509.
Jellis, G. J., & Punithalingam, P. (1991). Discovery of Di-dymella fabae sp. nov., the teleomorph of Ascochytafabae, on faba bean straw. Plant Pathology, 40, 150–157.
Jellis, G. J., Lockwood, G., & Aubury, R. G. (1985).Phenotypic influences on the incidence of infection byAscochyta fabae in spring varieties of faba bean (Viciafaba). Plant Pathology, 34, 347–352.
Jones, L. K. (1927). Studies of the nature and control ofblight, leaf and pod spot and footrot of peas caused byspecies of Ascochyta. New York State AgriculturalExperimental Station Bulletin, 547, 1–45.
Kaiser, W. J. (1973). Factors affecting growth, sporulation,pathogenicity, and survival of Ascochyta rabiei. Myc-ologia, 65, 444–457.
Kaiser, W. J. (1997). Inter- and intranational spread ofascochyta pathogens of chickpea, faba bean and lentil.Canadian Journal of Plant Pathology, 19, 215–224.
Kaiser, W. J., & Hellier, B. C. (1993). Didymella sp. , theteleomorph of Ascochyta lentis on lentil straw. Phy-topathology, 83, 692 (Abstract).
Kaiser, W. J., & Hannan, R. M. (1986). Incidence ofseedborne Ascochyta lentis in lentil germ plasm.Phytopathology, 76, 355–360.
Kaiser, W. J., Okhovat, M., & Mossahebi, G. H. (1973).Effect of seed-treatment fungicides on control of As-cochyta rabiei in chickpea seed infected with thepathogen. Disease Reporter, 57, 742–746.
Kaiser, W. J., Wang, B. C., & Rogers, J. D. (1997). Asco-chyta fabae and A. lentis: Host specificity, teleomorphs(Didymella), hybrid analysis, and taxonomic status.Plant Disease, 81, 809–816.
Kaur, S. (1995). Phytotoxicity of solanapyrons produced bythe fungus Ascochyta rabiei and their possible role inblight of chickpea (Cicer arietinum). Plant Science,109, 23–29.
Kelley, T. G., Parthasarathy Rao, P., & Grisko-Kelley, H.(1997). The pulse economy in the mid-1990s: A reviewof global and regional developments. In: R. Knight(Ed.), Proceedings IFLRC-III: Linking research andmarketing opportunities for the 21st century (pp. 1–29). Dordrecht: Kluwer Academic Publishers.
Le May, C., Schoeny, A., Tivoli, B., & Ney, B. (2005).Improvement and validation of a pea crop growthmodel to simulate the growth of cultivars infectedwith ascochyta blight (Mycosphaerella pinodes).European Journal of Plant Pathology, 112, 1–12.
Lockwood, G., Jellis, J. G., & Aubury, R. G. (1985).Genotypic influences on the incidence of infection by
74 Eur J Plant Pathol (2007) 119:59–76
123
Ascochyta fabae in winter-hardy faba beans (Viciafaba). Plant Pathology, 34, 341–346.
Marcinkowska, J., Klos, B., & Shcherbakova, A. (1991).Ascochytine production by fungi responsible for As-cochyta diseases of pea. Journal of Phytopathology,131, 253–258.
Maude, R. B. (1966). Pea seed infection by Mycosphaerellapinodes and Ascochyta pisi and its control by seedsoaks in thiram and captan suspension. Annals ofApplied Biology, 57, 193–200.
Maurin, N., & Tivoli, B. (1992). Variation in the resistanceof Vicia faba to Ascochyta fabae in relation to diseasedevelopment in field trials. Plant Pathology, 41, 737–744.
Maurin, N., Gourret, J. P., & Tivoli, B. (1993). Histopa-thology of the interaction between Ascochyta fabaeand Vicia faba: Comparison of susceptible and resis-tant reactions. Agronomie, 13, 921–927.
Michail, S. H., Farhan, M. A., & Husain, S. S. (1983).Sources of broad bean infection by Ascochyta fabae inNinevah province of Iraq. Seed Science Technology,11, 393–402.
Milgroom, M. G., & Peever, T. L. (2003). Populationbiology of plant pathogens: The synthesis of plantdisease epidemiology and population genetics. PlantDisease, 87, 608–617.
Morrall, R. A. A., & Beauchamp, C. J. (1988). Detectionof Ascochyta fabae f.sp. lentis in lentil seed. SeedScience and Technology, 16, 383–390.
Morrall, R. A. A. (1997). Evolution of lentil diseases over25 years in Western Canada. Canadian Journal ofPlant Pathology, 19, 197–207.
Moussart, A., Tivoli, B., Lemarchand, E., Deneufbourg, F.,Roi, S., & Sicard, G. (1998). Role of seed infection bythe ascochyta blight pathogen of dried pea (Mycosp-haerella pinodes) in seedling emergence, early diseasedevelopment and transmission of the disease to aerialplant parts. European Journal of Plant Pathology, 104,93–102.
Navas-Cortes, J. A., Trapero-Casas, A. & Jimenez-Diaz,R. M. (1995). Survival of Didymella rabiei in chickpeastraw debris in Spain. Plant Pathology, 44, 332–339.
Navas-Cortes, J. A., Trapero-Casas, A., Jimenez-Diaz, R.M. (1998). Influence of relative humidity and tem-perature on development of Didymella rabiei onchickpea debris. Plant Pathology, 47, 57–66.
Nene, Y. L. (1981). A review of ascochyta blight ofchickpea (Cicer arietinum L.). In: Saxena, M. C., &Singh, K. B. (Eds.), Proceedings of the Workshop onascochyta blight and winter sowing of chickpea,ICARDA, 4–7 May 1981, Aleppo, Syria. KluwerAcademic Publishers Group: The Hague, Boston,Lancaster.
Onfroy, C., Tivoli, B., Corbiere R., Bouznad, Z. (1999).Cultural, molecular and pathogenic variability ofMycosphaerella pinodes and Phoma medicaginis var.pinodella isolates from dried pea (Pisum sativum) inFrance. Plant Pathology, 48, 218–229.
Pande, S., Siddique, K. H. M., Kishore, G. K., Bayaa, B.,Gaur, P. M., Gowda, C. L. L., Bretag, R. W., &Crouch, J. H. (2005). Ascochyta blight of chickpea
(Cicer arietinum L.): A review of biology, pathoge-nicity, and disease management. Australian Journal ofAgricultural Research, 56, 317–332.
Peck, D. M., McDonald, G. K., & Davidson, J. A. (2001).Blackspot survival in soil and stubble and aerial dis-semination through the Season. In: Proceedings of the10th Australian Agronomy Conference, January 2001,Hobart, Australia.
Pedersen, E. A., Bedi, S., & Morrall, R. A. A. (1993).Gradient of ascochyta blight in Saskatchewan lentilcrops. Plant Disease, 77, 143–149.
Pedersen, E. A., & Morrall, R. A. A. (1994). Effects ofcultivar, leaf wetness duration, temperature, andgrowth stage on infection and development of asco-chyta blight on lentil. Phytopathology, 84, 1024–1030.
Pedersen, E. A., & Morrall, R. A. A. (1995). Effects ofwind-speed and wind direction on horizontal spreadof ascochyta blight on lentil. Canadian Journal ofPlant Pathology, 17, 223–232.
Peever, T. L., Salimath, S. S., Su, G., Kaiser, W. J., & Mu-ehlbauer, F. J. (2004). Historical and contemporarymultilocus population structure of Ascochyta rabiei (te-leomorph: Didymella rabiei) in the Pacific Northwest ofthe United States. Molecular Ecology, 13, 291–309.
Porta-Puglia, A. (1990). Status of Ascochyta rabiei ofchickpea in the Mediterranean basin. Options Medit-erraneennes, Serie seminaries, 9, 51–54.
Prioul, S., Onfroy, C., Tivoli, B., & Baranger, A. (2003)Controlled environment assessment of partial resis-tance to Mycosphaerella pinodes on pea (Pisum sati-vum L.) seedlings. Euphytica, 131, 121–130.
Roger, C., & Tivoli, B. (1996a). Effect of culture medium,light and temperature on sexual and asexual repro-duction of four strains of Mycosphaerella pinodes.Mycological Research, 100, 304–306.
Roger, C., & Tivoli, B. (1996b). Spatio-temporal devel-opment of pycnidia and pseudothecia and dissemina-tion of spores of Mycosphaerella pinodes on pea(Pisum sativum). Plant Pathology, 45, 518–528.
Roger, C., Tivoli, B., & Huber, L. (1999a). Effects oftemperature and moisture on disease and fruit bodydevelopment of Mycosphaerella pinodes on pea (Pi-sum sativum). Plant Pathology, 48, 1–9.
Roger, C., Tivoli, B., & Huber, L. (1999b). Effects ofinterrupted wet periods and different temperatures onthe development of ascochyta blight caused by My-cosphaerella pinodes on pea (Pisum sativum) seed-lings. Plant Pathology, 48, 10–18.
Salam, M. U., Galloway, J., Payne, P., MacLeod, W. J., &Diggle, A. J. (2006). Field pea blackspot disease in2005: Predicting versus reality. In 2006 Lupin andpulses updates. Agribusiness crop updates 2006. (pp.91–93)., Department of Agriculture, Western Aus-tralia, South Perth. Australia.
Shiraishi, T., Yamada, T., Saitoh, K., Kato, T., Toyoda, K.,Yoshioka, H., Kim, H. M., Ichinose, Y., Tahara, M., &Oku, H. (1994). Suppressors: determinants of speci-ficity produced by plant pathogens. Plant Cell Physi-ology, 35, 1107–1119.
Shtienberg, D., Gamliel-Atinsky, E., Retig, B. S., Brener,A., & Dinoor, A. (2005). Significance of preventing
Eur J Plant Pathol (2007) 119:59–76 75
123
primary infection by Didymella rabiei and develop-ment of a model to estimate the maturity of pseudo-thecia. Plant Disease, 89, 1027–1034.
Singh, K. B., & Reddy, M. V. (1993). Susceptibility of thechickpea plant to ascochyta blight at different growthstages of crop growth. Phytopathology Mediterranean,32, 153–155.
Skolko, A. J., Groves, J. W., & Wallen, V. R. (1954). As-cochyta diseases of peas in Canada with special ref-erence to seed transmission. Candian Journal ofAgricultural Science, 34, 417–428.
Tivoli, B., Beasse C, Lemarchand, E., & Masson, E.(1996). Effect of ascochyta blight (Mycosphaerellapinodes) on yield components of single pea (Pisumsativum) plants under field conditions. Annals of Ap-plied Biology, 129, 207–216.
Toyoda, K., Miki, K., Ichinose, Y., Yamada, T., & Shi-raishi, T. (1995). Plant lectins induce the production ofa phytoalexin in Pisum sativum. Plant Cell Physiology,36, 799–807.
Trapero-Casas, A., & Kaiser, W. A. (1992a). Developmentof Didymella rabiei, the teleomorph of Ascochyta ra-biei, on chickpea straw. Phytopathology, 82, 1261–1266.
Trapero-Casas, A., & Kaiser, W. A. (1992b). Influence oftemperature, wetness period, plant age, and inoculumconcentration on infection and development of asco-chyta blight of chickpea. Phytopathology, 82, 589–596.
Trapero-Casas, A., Navas-Cortes, J. A., & Jimenez-Diaz,R. M. (1996). Airborne ascospores of Didymella rabieias a major primary inoculum for ascochyta blightepidemics in chickpea crops in southern Spain.European Journal of Plant Pathology, 102, 237–245.
Wallen, V. R. (1965). Field evaluation and the importanceof the Ascochyta complex on peas. Canadian Journalof Plant Science, 45, 27–33.
Wallen, V. R., & Jeun, J. (1968). Factors limiting thesurvival of Ascochyta spp. of pea in soil. CanadianJournal of Botany, 46, 1279–1286.
Wallen, V. R., & Galway, D. A. (1977). Studies on thebiology and control of Ascochyta fabae on faba bean.Canadian Plant Disease Survey, 57, 31–35.
Wallen, V. R., Wong, S. I., & Jeun, J. (1967). Isolation,incidence and virulence of Ascochyta spp. of peasfrom the soil. Canadian Journal of Botany, 45, 2243–2247.
Weigand, F., Koster, J., Weltzien, H. C., & Barz, W.(1986). Accumulation of phytoalexins and isoflavoneglucosides in a resistant and a susceptible cultivar ofCicer arietinum during infection with Ascochyta ra-biei. Journal of Phytopathology, 115, 214–221.
Weltzien, H. C., & Kaack, H. J. (1984). Epidemiologicalaspects of chickpea ascochyta blight. In: Saxena, M.C., & Singh, K. B. (Eds.), Proceedings of the Work-shop on ascochyta blight and winter sowing of chick-pea, ICARDA, 4–7 May 1981, Aleppo, Syria. KluwerAcademic Publishers Group: The Hague, Boston,Lancaster.
Wilson, A. D., & Kaiser, W. J. (1995). Cytology andgenetics of sexual incompatibility in Didymella rabiei.Mycologia, 87, 795–804.
Xue, A. G., Warkentin, T. D., & Kenaschuk, E. O. (1997).Effect of timings of inoculation with Mycosphaerellapinodes on yield and seed infection of field pea.Canadian Journal of Plant Science, 77, 685–689.
Zhang, J. X., Fernando, W. G. D., & Xue, A. G. (2004).Temporal and spatial dynamics of mycosphaerellablight [Mycosphaerella pinodes] in field pea. CanadianJournal of Plant Pathology, 26, 522–532.
76 Eur J Plant Pathol (2007) 119:59–76
123
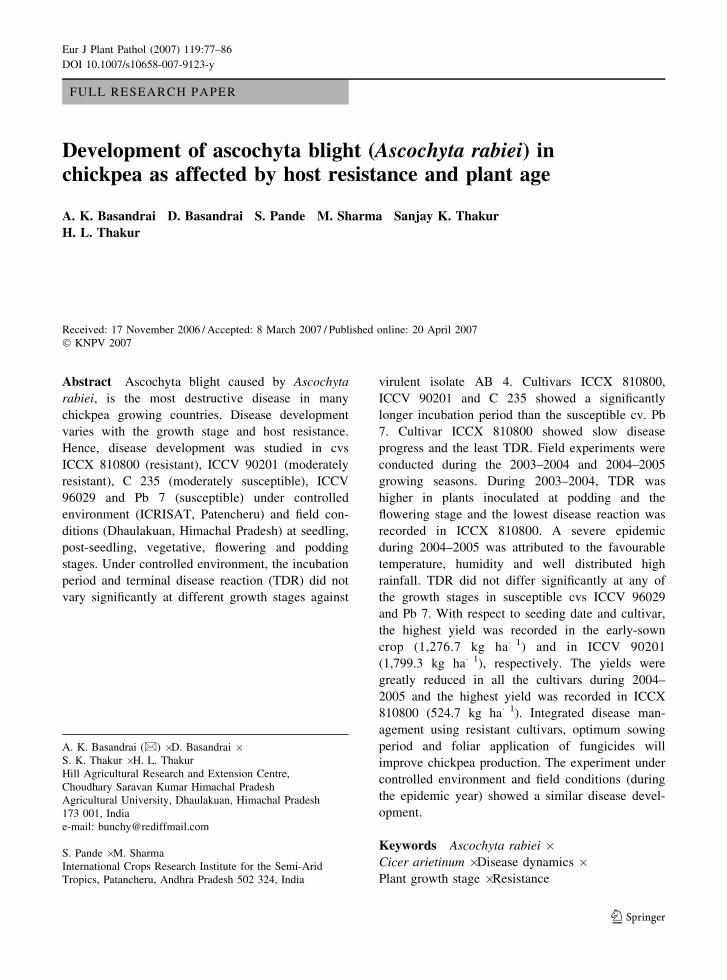
FULL RESEARCH PAPER
Development of ascochyta blight (Ascochyta rabiei) inchickpea as affected by host resistance and plant age
A. K. Basandrai Æ D. Basandrai Æ S. Pande Æ M. Sharma Æ Sanjay K. Thakur ÆH. L. Thakur
Received: 17 November 2006 / Accepted: 8 March 2007 / Published online: 20 April 2007
� KNPV 2007
Abstract Ascochyta blight caused by Ascochyta
rabiei, is the most destructive disease in many
chickpea growing countries. Disease development
varies with the growth stage and host resistance.
Hence, disease development was studied in cvs
ICCX 810800 (resistant), ICCV 90201 (moderately
resistant), C 235 (moderately susceptible), ICCV
96029 and Pb 7 (susceptible) under controlled
environment (ICRISAT, Patencheru) and field con-
ditions (Dhaulakuan, Himachal Pradesh) at seedling,
post-seedling, vegetative, flowering and podding
stages. Under controlled environment, the incubation
period and terminal disease reaction (TDR) did not
vary significantly at different growth stages against
virulent isolate AB 4. Cultivars ICCX 810800,
ICCV 90201 and C 235 showed a significantly
longer incubation period than the susceptible cv. Pb
7. Cultivar ICCX 810800 showed slow disease
progress and the least TDR. Field experiments were
conducted during the 2003–2004 and 2004–2005
growing seasons. During 2003–2004, TDR was
higher in plants inoculated at podding and the
flowering stage and the lowest disease reaction was
recorded in ICCX 810800. A severe epidemic
during 2004–2005 was attributed to the favourable
temperature, humidity and well distributed high
rainfall. TDR did not differ significantly at any of
the growth stages in susceptible cvs ICCV 96029
and Pb 7. With respect to seeding date and cultivar,
the highest yield was recorded in the early-sown
crop (1,276.7 kg ha�1) and in ICCV 90201
(1,799.3 kg ha�1), respectively. The yields were
greatly reduced in all the cultivars during 2004–
2005 and the highest yield was recorded in ICCX
810800 (524.7 kg ha�1). Integrated disease man-
agement using resistant cultivars, optimum sowing
period and foliar application of fungicides will
improve chickpea production. The experiment under
controlled environment and field conditions (during
the epidemic year) showed a similar disease devel-
opment.
Keywords Ascochyta rabiei �Cicer arietinum � Disease dynamics �Plant growth stage � Resistance
A. K. Basandrai (&) � D. Basandrai �S. K. Thakur � H. L. Thakur
Hill Agricultural Research and Extension Centre,
Choudhary Saravan Kumar Himachal Pradesh
Agricultural University, Dhaulakuan, Himachal Pradesh
173 001, India
e-mail: [email protected]
S. Pande � M. Sharma
International Crops Research Institute for the Semi-Arid
Tropics, Patancheru, Andhra Pradesh 502 324, India
123
Eur J Plant Pathol (2007) 119:77–86
DOI 10.1007/s10658-007-9123-y
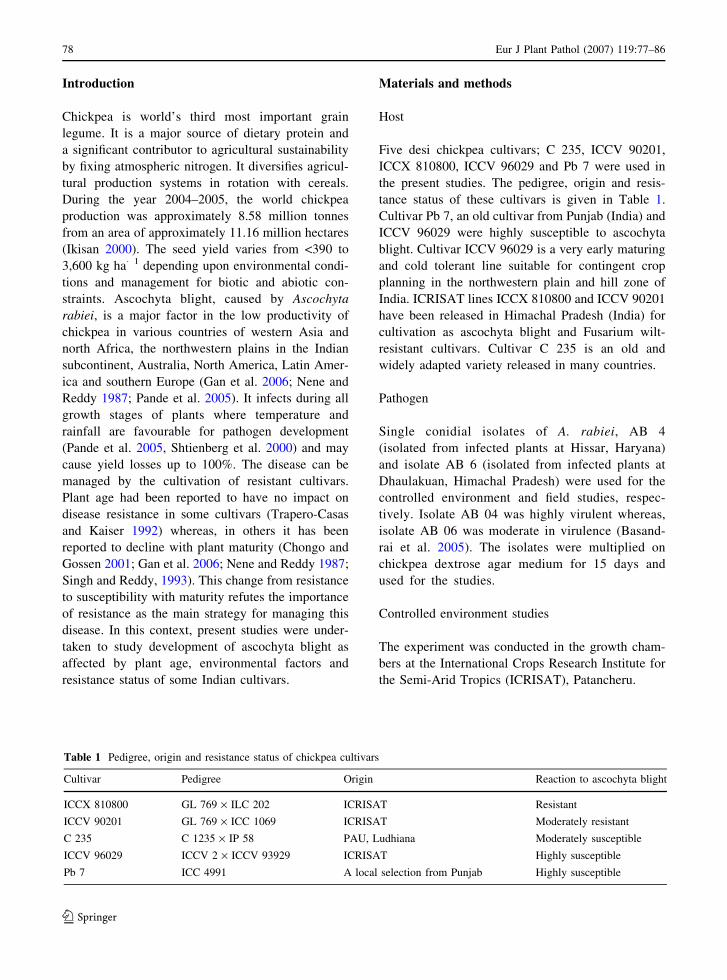
Introduction
Chickpea is world’s third most important grain
legume. It is a major source of dietary protein and
a significant contributor to agricultural sustainability
by fixing atmospheric nitrogen. It diversifies agricul-
tural production systems in rotation with cereals.
During the year 2004–2005, the world chickpea
production was approximately 8.58 million tonnes
from an area of approximately 11.16 million hectares
(Ikisan 2000). The seed yield varies from <390 to
3,600 kg ha�1 depending upon environmental condi-
tions and management for biotic and abiotic con-
straints. Ascochyta blight, caused by Ascochyta
rabiei, is a major factor in the low productivity of
chickpea in various countries of western Asia and
north Africa, the northwestern plains in the Indian
subcontinent, Australia, North America, Latin Amer-
ica and southern Europe (Gan et al. 2006; Nene and
Reddy 1987; Pande et al. 2005). It infects during all
growth stages of plants where temperature and
rainfall are favourable for pathogen development
(Pande et al. 2005, Shtienberg et al. 2000) and may
cause yield losses up to 100%. The disease can be
managed by the cultivation of resistant cultivars.
Plant age had been reported to have no impact on
disease resistance in some cultivars (Trapero-Casas
and Kaiser 1992) whereas, in others it has been
reported to decline with plant maturity (Chongo and
Gossen 2001; Gan et al. 2006; Nene and Reddy 1987;
Singh and Reddy, 1993). This change from resistance
to susceptibility with maturity refutes the importance
of resistance as the main strategy for managing this
disease. In this context, present studies were under-
taken to study development of ascochyta blight as
affected by plant age, environmental factors and
resistance status of some Indian cultivars.
Materials and methods
Host
Five desi chickpea cultivars; C 235, ICCV 90201,
ICCX 810800, ICCV 96029 and Pb 7 were used in
the present studies. The pedigree, origin and resis-
tance status of these cultivars is given in Table 1.
Cultivar Pb 7, an old cultivar from Punjab (India) and
ICCV 96029 were highly susceptible to ascochyta
blight. Cultivar ICCV 96029 is a very early maturing
and cold tolerant line suitable for contingent crop
planning in the northwestern plain and hill zone of
India. ICRISAT lines ICCX 810800 and ICCV 90201
have been released in Himachal Pradesh (India) for
cultivation as ascochyta blight and Fusarium wilt-
resistant cultivars. Cultivar C 235 is an old and
widely adapted variety released in many countries.
Pathogen
Single conidial isolates of A. rabiei, AB 4
(isolated from infected plants at Hissar, Haryana)
and isolate AB 6 (isolated from infected plants at
Dhaulakuan, Himachal Pradesh) were used for the
controlled environment and field studies, respec-
tively. Isolate AB 04 was highly virulent whereas,
isolate AB 06 was moderate in virulence (Basand-
rai et al. 2005). The isolates were multiplied on
chickpea dextrose agar medium for 15 days and
used for the studies.
Controlled environment studies
The experiment was conducted in the growth cham-
bers at the International Crops Research Institute for
the Semi-Arid Tropics (ICRISAT), Patancheru.
Table 1 Pedigree, origin and resistance status of chickpea cultivars
Cultivar Pedigree Origin Reaction to ascochyta blight
ICCX 810800 GL 769 · ILC 202 ICRISAT Resistant
ICCV 90201 GL 769 · ICC 1069 ICRISAT Moderately resistant
C 235 C 1235 · IP 58 PAU, Ludhiana Moderately susceptible
ICCV 96029 ICCV 2 · ICCV 93929 ICRISAT Highly susceptible
Pb 7 ICC 4991 A local selection from Punjab Highly susceptible
78 Eur J Plant Pathol (2007) 119:77–86
123
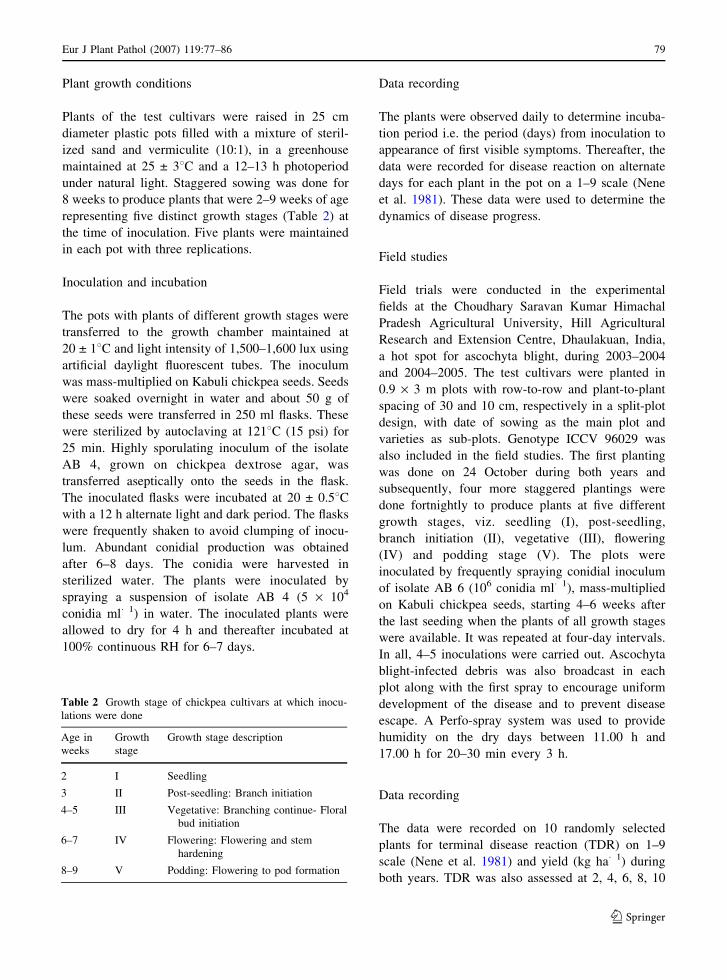
Plant growth conditions
Plants of the test cultivars were raised in 25 cm
diameter plastic pots filled with a mixture of steril-
ized sand and vermiculite (10:1), in a greenhouse
maintained at 25 ± 38C and a 12–13 h photoperiod
under natural light. Staggered sowing was done for
8 weeks to produce plants that were 2–9 weeks of age
representing five distinct growth stages (Table 2) at
the time of inoculation. Five plants were maintained
in each pot with three replications.
Inoculation and incubation
The pots with plants of different growth stages were
transferred to the growth chamber maintained at
20 ± 18C and light intensity of 1,500–1,600 lux using
artificial daylight fluorescent tubes. The inoculum
was mass-multiplied on Kabuli chickpea seeds. Seeds
were soaked overnight in water and about 50 g of
these seeds were transferred in 250 ml flasks. These
were sterilized by autoclaving at 1218C (15 psi) for
25 min. Highly sporulating inoculum of the isolate
AB 4, grown on chickpea dextrose agar, was
transferred aseptically onto the seeds in the flask.
The inoculated flasks were incubated at 20 ± 0.58Cwith a 12 h alternate light and dark period. The flasks
were frequently shaken to avoid clumping of inocu-
lum. Abundant conidial production was obtained
after 6–8 days. The conidia were harvested in
sterilized water. The plants were inoculated by
spraying a suspension of isolate AB 4 (5 · 104
conidia ml�1) in water. The inoculated plants were
allowed to dry for 4 h and thereafter incubated at
100% continuous RH for 6–7 days.
Data recording
The plants were observed daily to determine incuba-
tion period i.e. the period (days) from inoculation to
appearance of first visible symptoms. Thereafter, the
data were recorded for disease reaction on alternate
days for each plant in the pot on a 1–9 scale (Nene
et al. 1981). These data were used to determine the
dynamics of disease progress.
Field studies
Field trials were conducted in the experimental
fields at the Choudhary Saravan Kumar Himachal
Pradesh Agricultural University, Hill Agricultural
Research and Extension Centre, Dhaulakuan, India,
a hot spot for ascochyta blight, during 2003–2004
and 2004–2005. The test cultivars were planted in
0.9 · 3 m plots with row-to-row and plant-to-plant
spacing of 30 and 10 cm, respectively in a split-plot
design, with date of sowing as the main plot and
varieties as sub-plots. Genotype ICCV 96029 was
also included in the field studies. The first planting
was done on 24 October during both years and
subsequently, four more staggered plantings were
done fortnightly to produce plants at five different
growth stages, viz. seedling (I), post-seedling,
branch initiation (II), vegetative (III), flowering
(IV) and podding stage (V). The plots were
inoculated by frequently spraying conidial inoculum
of isolate AB 6 (106 conidia ml�1), mass-multiplied
on Kabuli chickpea seeds, starting 4–6 weeks after
the last seeding when the plants of all growth stages
were available. It was repeated at four-day intervals.
In all, 4–5 inoculations were carried out. Ascochyta
blight-infected debris was also broadcast in each
plot along with the first spray to encourage uniform
development of the disease and to prevent disease
escape. A Perfo-spray system was used to provide
humidity on the dry days between 11.00 h and
17.00 h for 20–30 min every 3 h.
Data recording
The data were recorded on 10 randomly selected
plants for terminal disease reaction (TDR) on 1–9
scale (Nene et al. 1981) and yield (kg ha�1) during
both years. TDR was also assessed at 2, 4, 6, 8, 10
Table 2 Growth stage of chickpea cultivars at which inocu-
lations were done
Age in
weeks
Growth
stage
Growth stage description
2 I Seedling
3 II Post-seedling: Branch initiation
4–5 III Vegetative: Branching continue- Floral
bud initiation
6–7 IV Flowering: Flowering and stem
hardening
8–9 V Podding: Flowering to pod formation
Eur J Plant Pathol (2007) 119:77–86 79
123
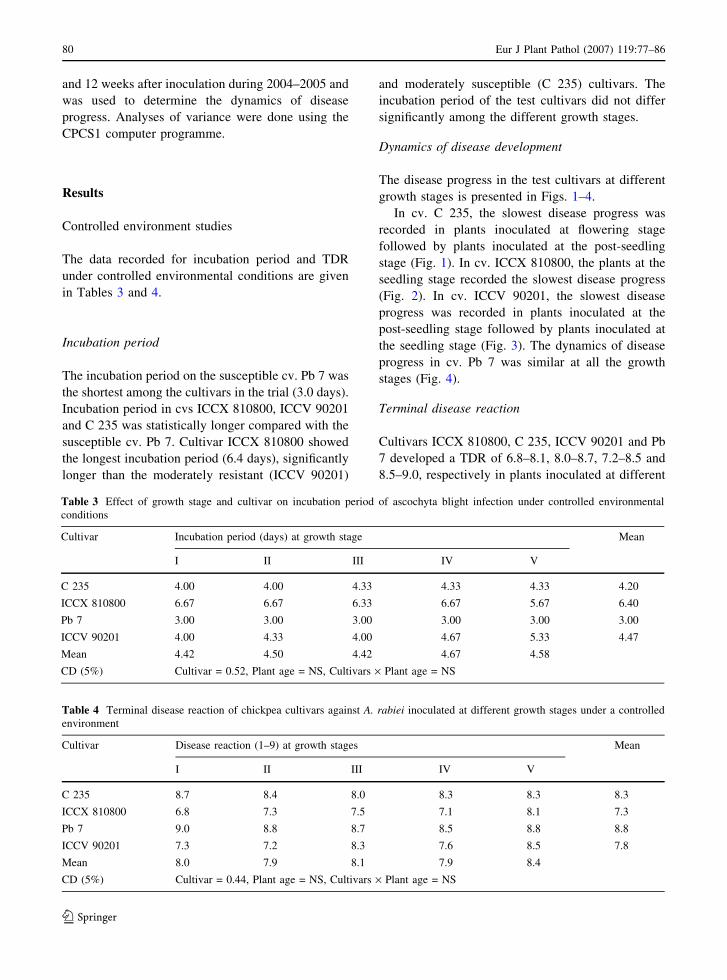
and 12 weeks after inoculation during 2004–2005 and
was used to determine the dynamics of disease
progress. Analyses of variance were done using the
CPCS1 computer programme.
Results
Controlled environment studies
The data recorded for incubation period and TDR
under controlled environmental conditions are given
in Tables 3 and 4.
Incubation period
The incubation period on the susceptible cv. Pb 7 was
the shortest among the cultivars in the trial (3.0 days).
Incubation period in cvs ICCX 810800, ICCV 90201
and C 235 was statistically longer compared with the
susceptible cv. Pb 7. Cultivar ICCX 810800 showed
the longest incubation period (6.4 days), significantly
longer than the moderately resistant (ICCV 90201)
and moderately susceptible (C 235) cultivars. The
incubation period of the test cultivars did not differ
significantly among the different growth stages.
Dynamics of disease development
The disease progress in the test cultivars at different
growth stages is presented in Figs. 1–4.
In cv. C 235, the slowest disease progress was
recorded in plants inoculated at flowering stage
followed by plants inoculated at the post-seedling
stage (Fig. 1). In cv. ICCX 810800, the plants at the
seedling stage recorded the slowest disease progress
(Fig. 2). In cv. ICCV 90201, the slowest disease
progress was recorded in plants inoculated at the
post-seedling stage followed by plants inoculated at
the seedling stage (Fig. 3). The dynamics of disease
progress in cv. Pb 7 was similar at all the growth
stages (Fig. 4).
Terminal disease reaction
Cultivars ICCX 810800, C 235, ICCV 90201 and Pb
7 developed a TDR of 6.8–8.1, 8.0–8.7, 7.2–8.5 and
8.5–9.0, respectively in plants inoculated at different
Table 3 Effect of growth stage and cultivar on incubation period of ascochyta blight infection under controlled environmental
conditions
Cultivar Incubation period (days) at growth stage Mean
I II III IV V
C 235 4.00 4.00 4.33 4.33 4.33 4.20
ICCX 810800 6.67 6.67 6.33 6.67 5.67 6.40
Pb 7 3.00 3.00 3.00 3.00 3.00 3.00
ICCV 90201 4.00 4.33 4.00 4.67 5.33 4.47
Mean 4.42 4.50 4.42 4.67 4.58
CD (5%) Cultivar = 0.52, Plant age = NS, Cultivars · Plant age = NS
Table 4 Terminal disease reaction of chickpea cultivars against A. rabiei inoculated at different growth stages under a controlled
environment
Cultivar Disease reaction (1–9) at growth stages Mean
I II III IV V
C 235 8.7 8.4 8.0 8.3 8.3 8.3
ICCX 810800 6.8 7.3 7.5 7.1 8.1 7.3
Pb 7 9.0 8.8 8.7 8.5 8.8 8.8
ICCV 90201 7.3 7.2 8.3 7.6 8.5 7.8
Mean 8.0 7.9 8.1 7.9 8.4
CD (5%) Cultivar = 0.44, Plant age = NS, Cultivars · Plant age = NS
80 Eur J Plant Pathol (2007) 119:77–86
123
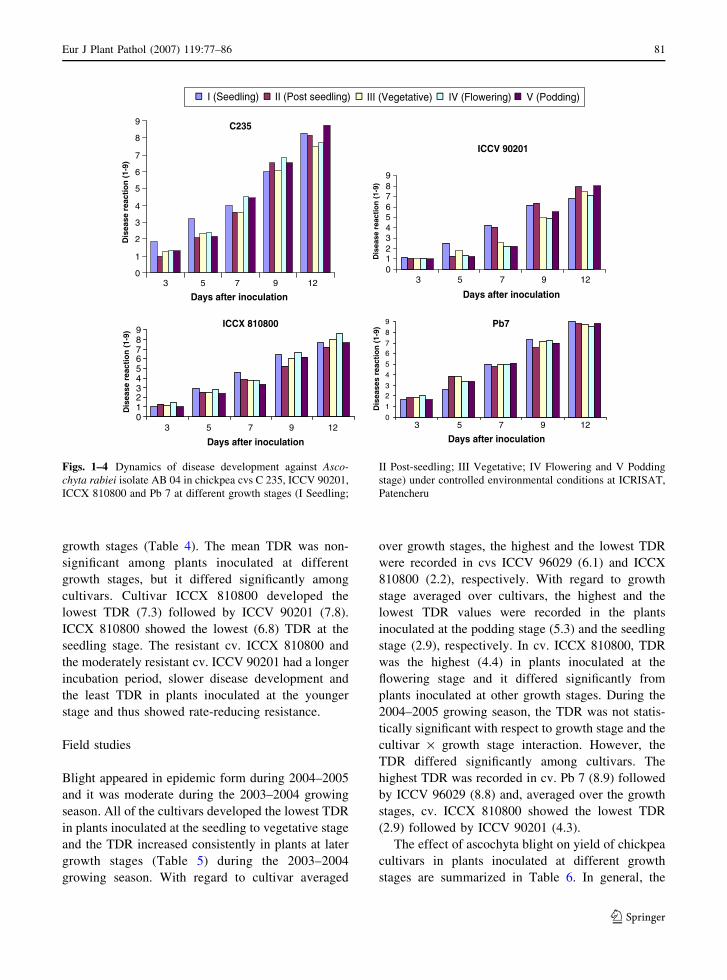
growth stages (Table 4). The mean TDR was non-
significant among plants inoculated at different
growth stages, but it differed significantly among
cultivars. Cultivar ICCX 810800 developed the
lowest TDR (7.3) followed by ICCV 90201 (7.8).
ICCX 810800 showed the lowest (6.8) TDR at the
seedling stage. The resistant cv. ICCX 810800 and
the moderately resistant cv. ICCV 90201 had a longer
incubation period, slower disease development and
the least TDR in plants inoculated at the younger
stage and thus showed rate-reducing resistance.
Field studies
Blight appeared in epidemic form during 2004–2005
and it was moderate during the 2003–2004 growing
season. All of the cultivars developed the lowest TDR
in plants inoculated at the seedling to vegetative stage
and the TDR increased consistently in plants at later
growth stages (Table 5) during the 2003–2004
growing season. With regard to cultivar averaged
over growth stages, the highest and the lowest TDR
were recorded in cvs ICCV 96029 (6.1) and ICCX
810800 (2.2), respectively. With regard to growth
stage averaged over cultivars, the highest and the
lowest TDR values were recorded in the plants
inoculated at the podding stage (5.3) and the seedling
stage (2.9), respectively. In cv. ICCX 810800, TDR
was the highest (4.4) in plants inoculated at the
flowering stage and it differed significantly from
plants inoculated at other growth stages. During the
2004–2005 growing season, the TDR was not statis-
tically significant with respect to growth stage and the
cultivar · growth stage interaction. However, the
TDR differed significantly among cultivars. The
highest TDR was recorded in cv. Pb 7 (8.9) followed
by ICCV 96029 (8.8) and, averaged over the growth
stages, cv. ICCX 810800 showed the lowest TDR
(2.9) followed by ICCV 90201 (4.3).
The effect of ascochyta blight on yield of chickpea
cultivars in plants inoculated at different growth
stages are summarized in Table 6. In general, the
0
1
2
3
4
5
6
7
8
9
3 5 7 9 12
Days after inoculation
C235
ICCV 90201
ICCX 810800 Pb7
Dis
ease
rea
ctio
n (
1-9)
0123456789
3 5 7 9 12
Days after inoculation
Dis
ease
rea
ctio
n (
1-9)
0123456789
3 5 7 9 12
Days after inoculation
Dis
ease
rea
ctio
n (
1-9)
0
1
23
4
5
67
8
9
3 5 7 9 12
Days after inoculation
Dis
ease
s re
acti
on
(1-
9)
I (Seedling) II (Post seedling) III (Vegetative) IV (Flowering) V (Podding)
Figs. 1–4 Dynamics of disease development against Asco-chyta rabiei isolate AB 04 in chickpea cvs C 235, ICCV 90201,
ICCX 810800 and Pb 7 at different growth stages (I Seedling;
II Post-seedling; III Vegetative; IV Flowering and V Podding
stage) under controlled environmental conditions at ICRISAT,
Patencheru
Eur J Plant Pathol (2007) 119:77–86 81
123
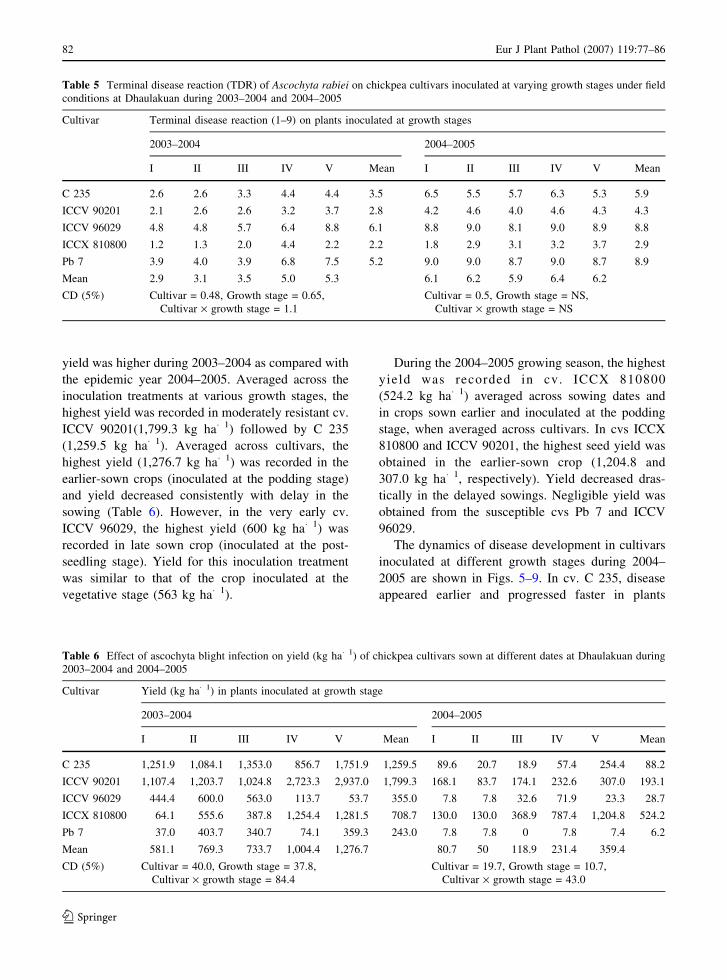
yield was higher during 2003–2004 as compared with
the epidemic year 2004–2005. Averaged across the
inoculation treatments at various growth stages, the
highest yield was recorded in moderately resistant cv.
ICCV 90201(1,799.3 kg ha�1) followed by C 235
(1,259.5 kg ha�1). Averaged across cultivars, the
highest yield (1,276.7 kg ha�1) was recorded in the
earlier-sown crops (inoculated at the podding stage)
and yield decreased consistently with delay in the
sowing (Table 6). However, in the very early cv.
ICCV 96029, the highest yield (600 kg ha�1) was
recorded in late sown crop (inoculated at the post-
seedling stage). Yield for this inoculation treatment
was similar to that of the crop inoculated at the
vegetative stage (563 kg ha�1).
During the 2004–2005 growing season, the highest
yield was recorded in cv. ICCX 810800
(524.2 kg ha�1) averaged across sowing dates and
in crops sown earlier and inoculated at the podding
stage, when averaged across cultivars. In cvs ICCX
810800 and ICCV 90201, the highest seed yield was
obtained in the earlier-sown crop (1,204.8 and
307.0 kg ha�1, respectively). Yield decreased dras-
tically in the delayed sowings. Negligible yield was
obtained from the susceptible cvs Pb 7 and ICCV
96029.
The dynamics of disease development in cultivars
inoculated at different growth stages during 2004–
2005 are shown in Figs. 5–9. In cv. C 235, disease
appeared earlier and progressed faster in plants
Table 5 Terminal disease reaction (TDR) of Ascochyta rabiei on chickpea cultivars inoculated at varying growth stages under field
conditions at Dhaulakuan during 2003–2004 and 2004–2005
Cultivar Terminal disease reaction (1–9) on plants inoculated at growth stages
2003–2004 2004–2005
I II III IV V Mean I II III IV V Mean
C 235 2.6 2.6 3.3 4.4 4.4 3.5 6.5 5.5 5.7 6.3 5.3 5.9
ICCV 90201 2.1 2.6 2.6 3.2 3.7 2.8 4.2 4.6 4.0 4.6 4.3 4.3
ICCV 96029 4.8 4.8 5.7 6.4 8.8 6.1 8.8 9.0 8.1 9.0 8.9 8.8
ICCX 810800 1.2 1.3 2.0 4.4 2.2 2.2 1.8 2.9 3.1 3.2 3.7 2.9
Pb 7 3.9 4.0 3.9 6.8 7.5 5.2 9.0 9.0 8.7 9.0 8.7 8.9
Mean 2.9 3.1 3.5 5.0 5.3 6.1 6.2 5.9 6.4 6.2
CD (5%) Cultivar = 0.48, Growth stage = 0.65,
Cultivar · growth stage = 1.1
Cultivar = 0.5, Growth stage = NS,
Cultivar · growth stage = NS
Table 6 Effect of ascochyta blight infection on yield (kg ha�1) of chickpea cultivars sown at different dates at Dhaulakuan during
2003–2004 and 2004–2005
Cultivar Yield (kg ha�1) in plants inoculated at growth stage
2003–2004 2004–2005
I II III IV V Mean I II III IV V Mean
C 235 1,251.9 1,084.1 1,353.0 856.7 1,751.9 1,259.5 89.6 20.7 18.9 57.4 254.4 88.2
ICCV 90201 1,107.4 1,203.7 1,024.8 2,723.3 2,937.0 1,799.3 168.1 83.7 174.1 232.6 307.0 193.1
ICCV 96029 444.4 600.0 563.0 113.7 53.7 355.0 7.8 7.8 32.6 71.9 23.3 28.7
ICCX 810800 64.1 555.6 387.8 1,254.4 1,281.5 708.7 130.0 130.0 368.9 787.4 1,204.8 524.2
Pb 7 37.0 403.7 340.7 74.1 359.3 243.0 7.8 7.8 0 7.8 7.4 6.2
Mean 581.1 769.3 733.7 1,004.4 1,276.7 80.7 50 118.9 231.4 359.4
CD (5%) Cultivar = 40.0, Growth stage = 37.8,
Cultivar · growth stage = 84.4
Cultivar = 19.7, Growth stage = 10.7,
Cultivar · growth stage = 43.0
82 Eur J Plant Pathol (2007) 119:77–86
123
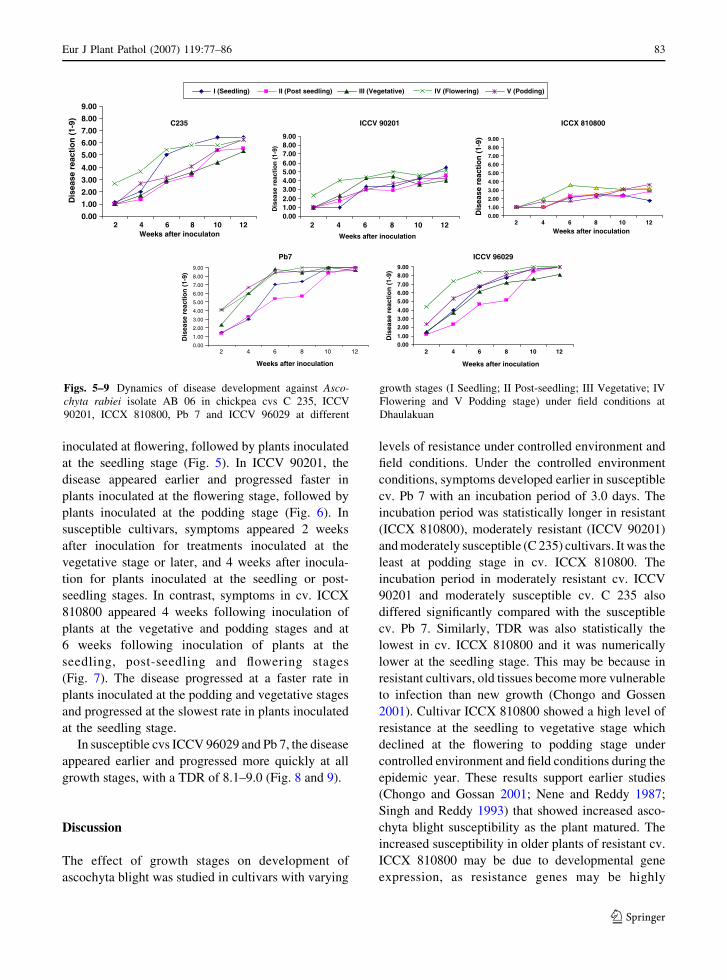
inoculated at flowering, followed by plants inoculated
at the seedling stage (Fig. 5). In ICCV 90201, the
disease appeared earlier and progressed faster in
plants inoculated at the flowering stage, followed by
plants inoculated at the podding stage (Fig. 6). In
susceptible cultivars, symptoms appeared 2 weeks
after inoculation for treatments inoculated at the
vegetative stage or later, and 4 weeks after inocula-
tion for plants inoculated at the seedling or post-
seedling stages. In contrast, symptoms in cv. ICCX
810800 appeared 4 weeks following inoculation of
plants at the vegetative and podding stages and at
6 weeks following inoculation of plants at the
seedling, post-seedling and flowering stages
(Fig. 7). The disease progressed at a faster rate in
plants inoculated at the podding and vegetative stages
and progressed at the slowest rate in plants inoculated
at the seedling stage.
In susceptible cvs ICCV 96029 and Pb 7, the disease
appeared earlier and progressed more quickly at all
growth stages, with a TDR of 8.1–9.0 (Fig. 8 and 9).
Discussion
The effect of growth stages on development of
ascochyta blight was studied in cultivars with varying
levels of resistance under controlled environment and
field conditions. Under the controlled environment
conditions, symptoms developed earlier in susceptible
cv. Pb 7 with an incubation period of 3.0 days. The
incubation period was statistically longer in resistant
(ICCX 810800), moderately resistant (ICCV 90201)
and moderately susceptible (C 235) cultivars. It was the
least at podding stage in cv. ICCX 810800. The
incubation period in moderately resistant cv. ICCV
90201 and moderately susceptible cv. C 235 also
differed significantly compared with the susceptible
cv. Pb 7. Similarly, TDR was also statistically the
lowest in cv. ICCX 810800 and it was numerically
lower at the seedling stage. This may be because in
resistant cultivars, old tissues become more vulnerable
to infection than new growth (Chongo and Gossen
2001). Cultivar ICCX 810800 showed a high level of
resistance at the seedling to vegetative stage which
declined at the flowering to podding stage under
controlled environment and field conditions during the
epidemic year. These results support earlier studies
(Chongo and Gossan 2001; Nene and Reddy 1987;
Singh and Reddy 1993) that showed increased asco-
chyta blight susceptibility as the plant matured. The
increased susceptibility in older plants of resistant cv.
ICCX 810800 may be due to developmental gene
expression, as resistance genes may be highly
0.00
1.00
2.00
3.00
4.00
5.00
6.00
7.00
8.00
9.00
2 4 6 8 10 12Weeks after inoculaton
C235
Pb7 ICCV 96029
ICCV 90201 ICCX 810800
Dis
ease
rea
ctio
n (
1-9)
I (Seedling) II (Post seedling) III (Vegetative) IV (Flowering) V (Podding)
0.001.002.003.004.005.006.007.008.009.00
2 4 6 8 10 12
Weeks after inoculation
Dis
ease
rea
ctio
n (
1-9)
0.00
1.00
2.00
3.00
4.00
5.00
6.00
7.00
8.00
9.00
2 4 6 8 10 12
Weeks after inoculation
Dis
ease
rea
ctio
n (
1-9)
0.00
1.00
2.00
3.00
4.00
5.00
6.00
7.00
8.00
9.00
2 4 6 8 10 12
Weeks after inoculation
Dis
ease
rea
ctio
n (
1-9)
0.001.00
2.003.004.00
5.006.007.00
8.009.00
2 4 6 8 10 12
Weeks after inoculation
Dis
ease
rea
ctio
n (
1-9)
Figs. 5–9 Dynamics of disease development against Asco-chyta rabiei isolate AB 06 in chickpea cvs C 235, ICCV
90201, ICCX 810800, Pb 7 and ICCV 96029 at different
growth stages (I Seedling; II Post-seedling; III Vegetative; IV
Flowering and V Podding stage) under field conditions at
Dhaulakuan
Eur J Plant Pathol (2007) 119:77–86 83
123
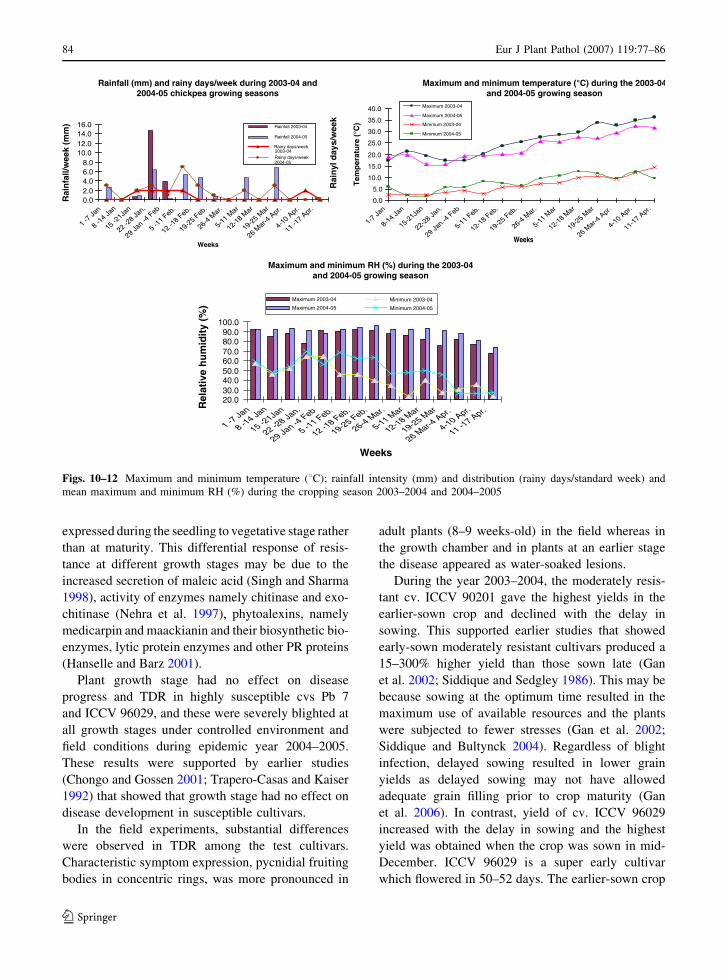
expressed during the seedling to vegetative stage rather
than at maturity. This differential response of resis-
tance at different growth stages may be due to the
increased secretion of maleic acid (Singh and Sharma
1998), activity of enzymes namely chitinase and exo-
chitinase (Nehra et al. 1997), phytoalexins, namely
medicarpin and maackianin and their biosynthetic bio-
enzymes, lytic protein enzymes and other PR proteins
(Hanselle and Barz 2001).
Plant growth stage had no effect on disease
progress and TDR in highly susceptible cvs Pb 7
and ICCV 96029, and these were severely blighted at
all growth stages under controlled environment and
field conditions during epidemic year 2004–2005.
These results were supported by earlier studies
(Chongo and Gossen 2001; Trapero-Casas and Kaiser
1992) that showed that growth stage had no effect on
disease development in susceptible cultivars.
In the field experiments, substantial differences
were observed in TDR among the test cultivars.
Characteristic symptom expression, pycnidial fruiting
bodies in concentric rings, was more pronounced in
adult plants (8–9 weeks-old) in the field whereas in
the growth chamber and in plants at an earlier stage
the disease appeared as water-soaked lesions.
During the year 2003–2004, the moderately resis-
tant cv. ICCV 90201 gave the highest yields in the
earlier-sown crop and declined with the delay in
sowing. This supported earlier studies that showed
early-sown moderately resistant cultivars produced a
15–300% higher yield than those sown late (Gan
et al. 2002; Siddique and Sedgley 1986). This may be
because sowing at the optimum time resulted in the
maximum use of available resources and the plants
were subjected to fewer stresses (Gan et al. 2002;
Siddique and Bultynck 2004). Regardless of blight
infection, delayed sowing resulted in lower grain
yields as delayed sowing may not have allowed
adequate grain filling prior to crop maturity (Gan
et al. 2006). In contrast, yield of cv. ICCV 96029
increased with the delay in sowing and the highest
yield was obtained when the crop was sown in mid-
December. ICCV 96029 is a super early cultivar
which flowered in 50–52 days. The earlier-sown crop
0.02.04.06.08.0
10.012.014.016.0
1 -7 J
an
8 -14
Jan
15 -2
1Jan
22 -2
8 Jan
.
29 Ja
n -4 F
eb
5 -11
Feb
.
12 -1
8 Feb
.
19-2
5 Feb
.
26-4
Mar
.
5-11
Mar
12-1
8 Mar
19-2
5 Mar
26 M
ar-4
Apr
.
4-10
Apr
.
11 -1
7 Apr
.
Weeks
Rai
nfa
ll/w
eek
(mm
)
Rai
nyl
day
s/w
eek
Rainfall 2003-04
Rainfall 2004-05
Rainy days/week2003-04Rainy days/week2004-05
0.0
5.0
10.0
15.0
20.0
25.0
30.0
35.0
40.0
1-7 Ja
n
8-14 Ja
n
15-21Ja
n
22-28 Ja
n.
29 Jan.-4
Feb
5-11 F
eb.
12-18 F
eb.
19-25 F
eb.
26-4 M
ar.
5-11 M
ar
12-18 M
ar
19-25 M
ar
26 Mar-4
Apr.
4-10 A
pr.
11-17 A
pr.
Weeks
Tem
per
atu
re (
°C)
Maximum 2003-04
Maximum 2004-05
Minimum 2003-04
Minimum 2004-05
20.030.040.050.060.070.080.090.0
100.0
1 -7 Ja
n
8 -14 Ja
n
15 -21Ja
n
22 -28 Ja
n.
29 Jan -4
Feb
5 -11 Feb.
12 -18 Feb.
19-25 Feb.
26-4 Mar.
5-11 Mar
12-18 Mar
19-25 Mar
26 Mar-4
Apr.
4-10 Apr.
11 -17 Apr.
Weeks
Rel
ativ
e h
um
idit
y (%
)
Maximum 2003-04
Maximum 2004-05
Minimum 2003-04
Minimum 2004-05
Rainfall (mm) and rainy days/week during 2003-04 and2004-05 chickpea growing seasons
Maximum and minimum temperature (°C) during the 2003-04 and 2004-05 growing season
Maximum and minimum RH (%) during the 2003-04and 2004-05 growing season
Figs. 10–12 Maximum and minimum temperature (8C); rainfall intensity (mm) and distribution (rainy days/standard week) and
mean maximum and minimum RH (%) during the cropping season 2003–2004 and 2004–2005
84 Eur J Plant Pathol (2007) 119:77–86
123
(sown 24 October 2003) flowered by mid-December,
when the minimum temperature was <58C, which
resulted in lower pollen viability and embryo abor-
tion, leading to poor pod setting (Basandrai et al.
2005), whereas the late-sown crop flowered by mid-
February and thus escaped low temperature stress
resulting in optimum flowering and pod setting.
During the epidemic year 2004–2005, resistant
ICCX 810800, moderately resistant (ICCV 90201)
and moderately susceptible (C 235) cultivars pro-
duced much lower yields compared with that
obtained in 2003–2004. Though the yield level was
comparatively lower in the resistant cv. ICCX
810800, i t s t i l l gave the h ighes t y ie ld
(1,204.8 kg ha�1) in the early-sown crop, and then
declined with the delay in sowing. No grain yield was
obtained in highly susceptible cvs Pb 7 and ICCV
96029. This supports earlier results (Chongo et al.
2000a, b; Gan et al. 2006; Shtienberg et al. 2000) that
showed under cool and wet conditions, application of
foliar fungicides is required to realize optimum yield
and quality even in resistant cultivars.
The low TDR during the year 2003–2004 may be
attributed to the low weekly mean rainfall (0.7–
>15 mm over 3 weeks) against 0.17–6.74 mm over
9 weeks during the season (Fig. 10).
During 2003–2004 growing season, the average
minimum and maximum temperature remained below
58C and 21.58C, respectively until 11 February.
Subsequently, minimum and maximum temperature
varied from 6 to >108C and 23.8 to >308C and 9.4 to
14.4 and 32.3 to 36.98C from 12 February to 18
March and 19 March to 17 April, respectively. The
maximum temperature varied from 15.8 to >218Cfrom 1 January to 25 February, 21 to >288C from 26
February to 25 March and was below 338C from 17
March to 17 April 2005. The minimum temperature
varied from <58C to >138C during the growing
season except during the period 8–21 January, when
it was around 28C (Fig. 11). It is evident that during
the 2004–2005 growing season, maximum tempera-
tures were favourable for disease development, and
even the minimum temperature was higher and more
favourable compared with the 2003–2004 growing
season. During the 2004–2005 growing season mean
maximum RH was <90% during 11 out of 15 weeks
of active disease development, in contrast to only
5 weeks during 2003–2004 growing season (Fig. 12).
Furthermore, the mean weekly minimum RH, 45.5–
68.4% during the period 5 February–25 March, 2005
was higher compared with 22.6–45.7% during the
same period in the 2003–2004 growing season
(Fig. 12). Temperatures of 20 ± 18C, RH of >90%
and leaf wetness of 17 h are optimum for the
infection, development and spread of ascochyta
blight (Pande et al. 2005, Trapero-Casas and Kaiser
1992). In addition, leaf wetness periods greater than
8-days results in the production of higher numbers of
pycnidia and conidia on infected leaves (Jhorar et al.
1997). Such favourable conditions were prevalent in
the controlled environment at ICRISAT and during
the year 2004–2005 at Dhaulakuan, which led to
severe disease development. Jhorar et al. (1997)
observed that increased dry periods immediately after
inoculation resulted in reduced disease severity and
low disease development. Hence, low disease levels
during the 2003–2004 growing season may be
attributed to the continuous dry spell.
Blight severity in the controlled environment was
higher and more consistent than under field condi-
tions; this was because isolate AB 04 was more
virulent than AB 06 (Basandrai et al. 2005) and
environmental conditions were highly favourable and
less variable than under field conditions.
The resistant and moderately resistant cultivars
showed rate-reducing residual resistance against the
virulent isolate AB 4, expressed as longer incubation
periods, slower disease development and lower TDR.
The highly resistant cv. ICCX 810800 and highly
susceptible cvs Pb 7 and ICCV 96029 showed the
same trend for ascochyta blight development at
different growth stages under controlled environment
and field conditions during the epidemic year. Hence,
growth chamber and field screening under epidemic
conditions at hot spots like Dhaulakuan are equally
effective and may compliment each other.
All the cultivars used in the present study were
developed in India, where A. rabiei is highly variable
in virulence (Basandrai et al. 2005; Nene and Reddy
1987; Pande et al. 2005; Singh and Sharma 1998).
Under such conditions, growing susceptible cultivars,
namely Pb 7 and ICCV 96029, can result in total crop
loss and even resistant cultivars such as ICCX
810800 can suffer heavy losses (Chongo and Gossen
2001; Chongo et al. 2000b; Pande et al. 2005). Efforts
are being made to popularise chickpea cultivation in
north western India. It will result in a substantial
increase in the area grown to the crop. High levels of
Eur J Plant Pathol (2007) 119:77–86 85
123
resistance are not available against all pathotypes of
A. rabiei in cultivated chickpea (Basandrai et al.
2005; Nene and Reddy 1987; Pande et al. 2005;
Singh and Sharma 1998). Resistant cultivars such as
ICCX 810800 still show reduced resistance at the
flowering stage. Hence, for the successful cultivation
of chickpea, integrated management of ascochyta
blight using available resistant cultivars, disease-free
seed and need-based foliar application of fungicides
will be the practical option.
Acknowledgements Asian Development Bank is greatly
acknowledged for providing financial support to Dr. Ashwani
K. Basandrai for undertaking part of this study at ICRISAT,
Patencheru, as a visiting scientist.
References
Basandrai A. K., Pande, S., Kishore, G. K., Crouch, J. H., &
Basandrai, D. (2005). Cultural, morphological and path-
ological variation in Indian isolates of Ascochyta rabiei,the chickpea blight pathogen. Plant Pathology Journal,21, 207–213.
Chongo, G., & Gossen, B. D. (2001). Effect of plant age on
resistance to Ascochyta rabiei in chickpea. CanadianJournal of Plant Pathology, 23, 358–363.
Chongo, G., Buchwaldt, L., Anderson, K., & Gossen, B. D.
(2000a). Saskatchewan chickpea disease survey-1999. In
1999 pesticide management research reports (pp. 275–
276). Agriculture and Agri- Food Canada, Ottawa, On-
tario. Report No. 99.
Chongo, G., Gossen, B. D., & Buchwaldt, L. (2000b). Fungi-
cidal control of Ascochyta blight in chickpea in 1999. In
1999 pesticide management research reports (pp 275–
276). Agriculture and Agri Foods Canada, Ottawa On-
tario. Report No. 99.
Gan, Y. T., Siddique, K. H. M., MacLeod, W. J., & Jayakumar,
P. (2006). Management options for minimizing the dam-
age by Ascochyta blight (Ascochyta rabiei ) in chickpea
(Cicer arietinum L. ). Field Crops Research, 97, 121–134.
Gan, Y. T., Miller, P. R., Liu, P. H., Stevenson, F. C., &
McDonald, C. L. (2002). Seedling emergence, pod
development and seed yield of chickpea and dry pea in a
semi arid environment. Canadian Journal of Plant Sci-ences, 82, 531–537.
Hanselle, T., & Barz, W. (2001). Purification and characteri-
sation of the extracellular PR-2b beta -1,3-glucanase
accumulating in different Ascochyta rabiei-infected
chickpea (Cicer arietinum L.) cultivars. Plant Science,
161, 773–781.
Ikisan (2000). Area, production and productivity of chickpea in
the world during 2004 (FAO, STAT). Retrieved January
3, 2007 from http://www.ikisan.com/links/ap_ben-
galgramHistory.shtml].
Jhorar, O. P., Mathauda, S. S., Singh, G., Butler, D. R., &
Mavi, H. S. (1997). Relationship between climatic vari-
ables and Ascochyta blight of chickpea in Punjab, India.
Agricultural and Forest Meteorology, 87, 171–177.
Nehra, K. S., Sindhu, A., Singh, R., Batra, P., Dhillon, S., &
Sindhu, A. (1997). Induction and characterization of ex-
ochitinase from chickpea (Cicer arietinum L.) infected
with Ascochyta rabiei. Annals of Biology, 13, 305–308.
Nene, Y. L., & Reddy, M. V. (1987). Chickpea diseases and
their control. In M. C. Saxena, & K. B. Singh (Eds.), TheChickpea (pp. 233–270). Oxford, UK: CAB International.
Nene, Y. L., Haware, M. P., & Reddy, M. V. (1981). Chickpea
diseases: Resistance screening techniques. Information
Bulletin no. 10. (12 pp.) International Crops Research
Institute for Semi Arid Tropics (ICRISAT), Patencheru.
Pande, S., Siddique, K. H. M., Kishore, G. K., Bayaa, B., Gaur,
P. M., Gowda, C. L. L., Bretag, T., & Crouch, J. H.
(2005). Ascochyta blight of chickpea biology, pathoge-
nicity and disease management. Australian Journal ofAgricultural Research, 56, 317–332.
Shtienberg, D., Vintal, H., Brener, S., & Retig, B. (2000).
Rational management of Didymella rabiei in chickpea
integration of genotype resistance and post infection
application of fungicides. Phytopathology, 90, 834–842.
Siddique, K. H. M., & Bultynck, L. (2004). Agronomy. In C.
Wrigley, H. Corke, & C. Walker (Eds.), Encyclopedia ofgrain science (pp. 287–295). UK: Academic Publishers.
Siddique, K. H. M., & Sedgley, R. H. (1986). Chickpea a
potential grain legume for southwest Australia: Seasonal
growth and yield. Australian Journal of Agricultural Re-search, 37, 245–261.
Singh, G., & Sharma, Y. R. (1998). Ascochyta blight of
chickpea. In R. K. Upadhyay, K. G. Mukherji, & R. L.
Rajak (Eds.), IPM System in Agriculture: Pulses (pp. 163–
195). New Delhi, India: Aditya Books Pvt. Ltd.
Singh, K. B., & Reddy, M. V. (1993). Susceptibility of
chickpea plant to Ascochyta blight at different stages of
growth. Phytopathol. Mediterranean, 33, 153–155.
Trapero-Casas, A., & Kaiser W. J. (1992). Influence of tem-
perature, wetness period, plant age and inoculum con-
centration on infection and development of Ascochyta
blight of chickpea. Phytopathology, 82, 589–596.
86 Eur J Plant Pathol (2007) 119:77–86
123
FULL RESEARCH PAPER
Assessment of airborne primary inoculum availabilityand modelling of disease onset of ascochyta blightin field peas
Alexandra Schoeny Æ Stephane Jumel ÆFrancois Rouault Æ Christophe Le May ÆBernard Tivoli
Received: 7 November 2006 / Accepted: 3 May 2007 / Published online: 5 June 2007
� KNPV 2007
Abstract Ascochyta blight is a serious disease
affecting field peas. In France, disease management
relies mainly on scheduled chemical applications
without taking into account the actual disease risk. A
better understanding of the factors affecting disease
onset would therefore help in the timing of the first
application. Field experiments involving eight sowing
dates between mid-September and mid-December
were conducted for two consecutive years. The
seasonal dynamics of airborne inoculum were inves-
tigated through trap plants. The weekly availability of
airborne primary inoculum was extremely low during
autumn and winter and was partially influenced by
mesoclimatic conditions. Disease onset occurred
between mid-October and early March depending on
the sowing date. Generally, the later the sowing date,
the longer the period between sowing and disease
onset. This was due to an increase in the period
between sowing and emergence. Disease onset was
observed 14–35 days after emergence. A disease onset
model based on the calculation of weather-dependent
daily infection values (DIVs) was established, assum-
ing that disease onset occurs once the temperature and
moisture requirements for incubation are met. Cumu-
lative daily infection values (cDIVs) were determined
by sowing date and experiment through addition of
consecutive DIVs between emergence and disease
onset. A frequency analysis of cDIVs was performed
to determine the 10th and 90th percentiles of the
distribution. An analysis of the observed and pre-
dicted values showed that observed disease onset
dates were almost always included in the forecast
window defined by these two percentiles. This study is
the first attempt to predict ascochyta blight onset in
field peas and should contribute to development of a
more rational fungicide application strategy.
Keywords Ascospores � Disease forecast model �Mesoclimate � Relative humidity � Temperature �Trap plants
Introduction
Ascochyta blight is a serious disease affecting field
peas in most pea-growing regions of the world,
particularly in the temperate areas of Europe, North
America, Australia, and New Zealand (Bretag and
Ramsey 2001). The disease, mainly caused by
A. Schoeny (&) � S. Jumel � F. Rouault � B. Tivoli
UMR1099 Biologie des Organismes et des Populations
appliquee a la Protection des Plantes, INRA, Domaine de
la Motte, BP 35327, 35653 Le Rheu Cedex, France
e-mail: [email protected]
A. Schoeny
UR407 Pathologie Vegetale, INRA, Domaine St Maurice,
BP 94, 84143 Montfavet Cedex, France
C. Le May
Laboratoire Ecologie et Sciences Phytosanitaires,
Agrocampus Rennes, 35000 Rennes, France
123
Eur J Plant Pathol (2007) 119:87–97
DOI 10.1007/s10658-007-9163-3
Mycosphaerella pinodes, infects all aerial organs of
the plant (leaves, stems, flowers, pods) and can cause
yield losses of up to 75% when conditions are
favourable for an epidemic (Lawyer 1984). The
disease affects yield either indirectly through reduc-
tion of biomass production (Beasse et al. 2000; Garry
et al. 1998; Le May et al. 2005), or directly through
pod infection (Beasse et al. 1999). The relative
importance of these two effects depends on the
location of the symptoms on the plant and therefore
on the precocity and intensity of the epidemic. In a
context of poor plant resistance, as is the case for the
ascochyta blight/pea pathosystem, epidemic precoc-
ity depends mainly on inoculum availability and
weather conditions.
As a polycyclic disease, ascochyta blight is initi-
ated by primary inocula and develops by means of
secondary inocula. Primary inoculum sources are
numerous: infected seeds, soil, infected pea stubble,
volunteer plants or legume weeds. Airborne inoculum
is the most important source of primary inoculum in
established pea-growing areas (Bretag and Ramsey
2001). It is mainly constituted by ascospores of M.
pinodes, produced in pseudothecia on infected pea
stubble left on the soil surface after harvest, and
dispersed by wind for over 1.6 km (Lawyer 1984).
Salam and Galloway (2005) developed a weather-
based model to predict the seasonal release of
ascospores of M. pinodes in Western Australia to
help farmers decide when is the best time to sow their
pea crops in order to avoid periods of ascospore
release peaks. However, this model is limited to areas
where infected pea stubble is left on the soil surface
and where this primary inoculum source is obvious. In
France, where pea stubble is usually removed before
ploughing, little is known about the availability of
airborne primary inoculum and it is therefore difficult
to predict disease onset. As a consequence, disease
management relies mainly on scheduled chemical
applications without taking into account disease risks.
For spring peas (sown between mid-February and
mid-April), this fungicide application strategy is
based on a first application at the beginning of
flowering (BF), followed by a second application at
BF + 15 days, and possibly by a third application at
BF + 25 days. For winter peas (sown from mid-
October to mid-January), extension services can
provide little information to farmers and recommend
an ‘‘early’’ application ‘‘in case of early first symp-
toms’’ without further precision (ARVALIS 2003). A
better understanding of primary inoculum availability
and a prediction of disease onset would therefore be
particularly useful to position the first application.
The objectives of this study were (i) to characterise
the pattern of airborne inoculum availability, (ii) to
investigate the relationship between airborne primary
inoculum availability and mesoclimate, (iii) to study
the impact of sowing dates on disease onset, and (iv)
to propose a predictive model of disease onset.
Materials and methods
Field experiments
Experiments were conducted during the 2003–2004
and 2004–2005 cropping seasons in Le Rheu
(4880600000N, 184800000W, 30 m above mean sea
level), western France. The two adjacent fields
chosen for these trials were: (i) similar in pedocli-
matic environments and (ii) void of soilborne inoc-
ulum due to a rotation without pea crops during the
previous five years. The experimental design con-
sisted of eight 30 m2 (3 m wide · 10 m long) plots
sown with winter field peas (cv. Cheyenne,
80 seeds m�2) at two-week intervals from mid-
September to mid-December (Table 1 and Fig. 1).
Cheyenne is susceptible to ascochyta blight and is
currently the most cultivated winter field pea cultivar
in France. Plots were sown perpendicularly to the
prevailing wind direction (N-NW), the first plot being
sown in the downwind. A 3 m wide buffer strip of
bare soil was maintained between each plot to
prevent cross-contamination of plots due to rain
splash dispersal of inoculum.
Trap plants
Inoculum availability was assessed indirectly through
trap plants. Each week from mid-September to mid-
March (2003–2004) or mid-May (2004–2005), trays
containing 20 trap plants (5-leaf Cheyenne pea
seedlings) were placed at 1 m from the four corners
of the trial (Fig. 1). After seven days of exposure, trap
plants were incubated in a dew chamber (12 h-
photoperiod, 208C night/day, 100% relative humidity
(RH)) for four days. The amount of viable spores
deposited on trap plants was estimated as the number
88 Eur J Plant Pathol (2007) 119:87–97
123
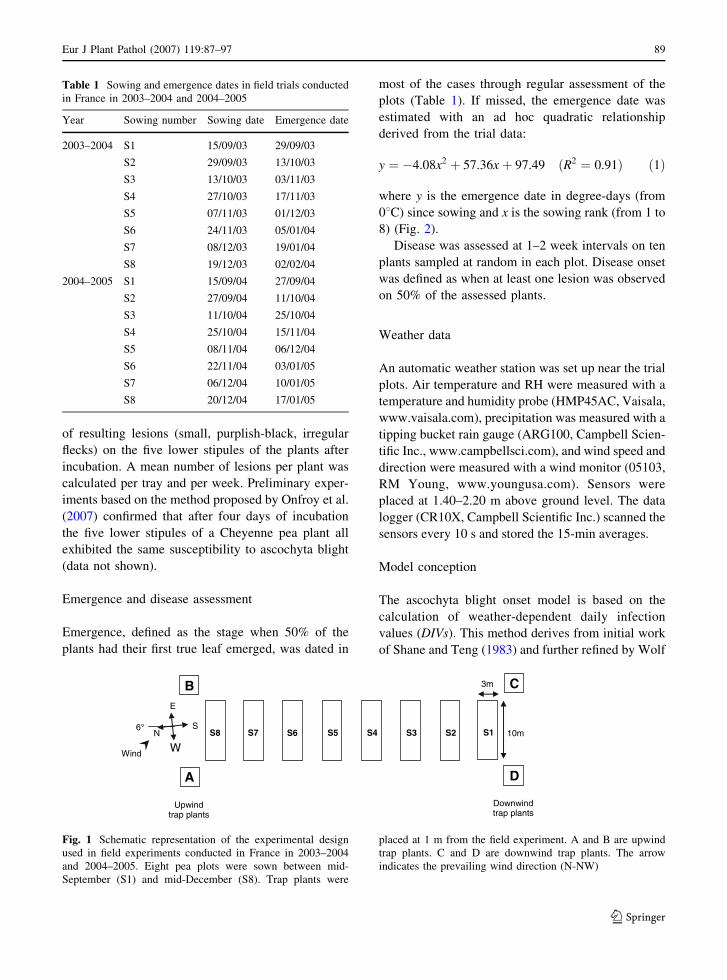
of resulting lesions (small, purplish-black, irregular
flecks) on the five lower stipules of the plants after
incubation. A mean number of lesions per plant was
calculated per tray and per week. Preliminary exper-
iments based on the method proposed by Onfroy et al.
(2007) confirmed that after four days of incubation
the five lower stipules of a Cheyenne pea plant all
exhibited the same susceptibility to ascochyta blight
(data not shown).
Emergence and disease assessment
Emergence, defined as the stage when 50% of the
plants had their first true leaf emerged, was dated in
most of the cases through regular assessment of the
plots (Table 1). If missed, the emergence date was
estimated with an ad hoc quadratic relationship
derived from the trial data:
y ¼ �4.08x2 þ 57.36xþ 97.49 ðR2 ¼ 0.91Þ ð1Þ
where y is the emergence date in degree-days (from
08C) since sowing and x is the sowing rank (from 1 to
8) (Fig. 2).
Disease was assessed at 1–2 week intervals on ten
plants sampled at random in each plot. Disease onset
was defined as when at least one lesion was observed
on 50% of the assessed plants.
Weather data
An automatic weather station was set up near the trial
plots. Air temperature and RH were measured with a
temperature and humidity probe (HMP45AC, Vaisala,
www.vaisala.com), precipitation was measured with a
tipping bucket rain gauge (ARG100, Campbell Scien-
tific Inc., www.campbellsci.com), and wind speed and
direction were measured with a wind monitor (05103,
RM Young, www.youngusa.com). Sensors were
placed at 1.40–2.20 m above ground level. The data
logger (CR10X, Campbell Scientific Inc.) scanned the
sensors every 10 s and stored the 15-min averages.
Model conception
The ascochyta blight onset model is based on the
calculation of weather-dependent daily infection
values (DIVs). This method derives from initial work
of Shane and Teng (1983) and further refined by Wolf
Table 1 Sowing and emergence dates in field trials conducted
in France in 2003–2004 and 2004–2005
Year Sowing number Sowing date Emergence date
2003–2004 S1 15/09/03 29/09/03
S2 29/09/03 13/10/03
S3 13/10/03 03/11/03
S4 27/10/03 17/11/03
S5 07/11/03 01/12/03
S6 24/11/03 05/01/04
S7 08/12/03 19/01/04
S8 19/12/03 02/02/04
2004–2005 S1 15/09/04 27/09/04
S2 27/09/04 11/10/04
S3 11/10/04 25/10/04
S4 25/10/04 15/11/04
S5 08/11/04 06/12/04
S6 22/11/04 03/01/05
S7 06/12/04 10/01/05
S8 20/12/04 17/01/05
S2 S8 S3S4S5S7 10mS1
3m
NS
E
W
6°
Upwind trap plants
Downwind trap plants
S6
CB
A D
Wind
Fig. 1 Schematic representation of the experimental design
used in field experiments conducted in France in 2003–2004
and 2004–2005. Eight pea plots were sown between mid-
September (S1) and mid-December (S8). Trap plants were
placed at 1 m from the field experiment. A and B are upwind
trap plants. C and D are downwind trap plants. The arrow
indicates the prevailing wind direction (N-NW)
Eur J Plant Pathol (2007) 119:87–97 89
123
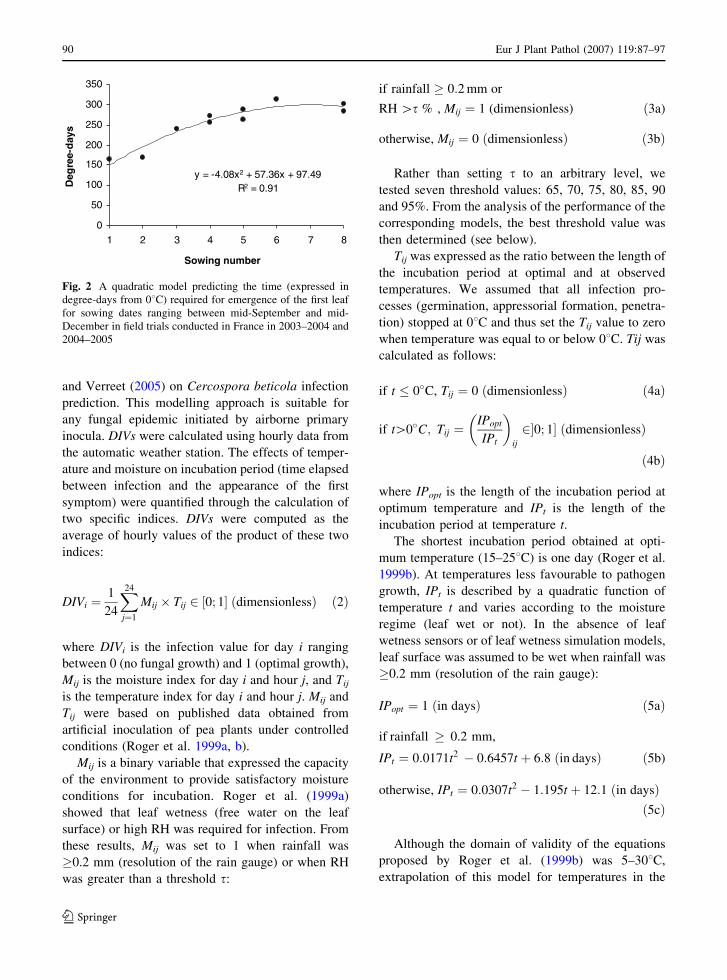
and Verreet (2005) on Cercospora beticola infection
prediction. This modelling approach is suitable for
any fungal epidemic initiated by airborne primary
inocula. DIVs were calculated using hourly data from
the automatic weather station. The effects of temper-
ature and moisture on incubation period (time elapsed
between infection and the appearance of the first
symptom) were quantified through the calculation of
two specific indices. DIVs were computed as the
average of hourly values of the product of these two
indices:
DIVi ¼1
24
X24
j¼1
Mij � Tij 2 ½0; 1� ðdimensionlessÞ ð2Þ
where DIVi is the infection value for day i ranging
between 0 (no fungal growth) and 1 (optimal growth),
Mij is the moisture index for day i and hour j, and Tij
is the temperature index for day i and hour j. Mij and
Tij were based on published data obtained from
artificial inoculation of pea plants under controlled
conditions (Roger et al. 1999a, b).
Mij is a binary variable that expressed the capacity
of the environment to provide satisfactory moisture
conditions for incubation. Roger et al. (1999a)
showed that leaf wetness (free water on the leaf
surface) or high RH was required for infection. From
these results, Mij was set to 1 when rainfall was
�0.2 mm (resolution of the rain gauge) or when RH
was greater than a threshold s:
if rainfall � 0:2 mm or
RH [s % , Mij ¼ 1 (dimensionless) ð3a)
otherwise, Mij ¼ 0 ðdimensionlessÞ ð3bÞ
Rather than setting s to an arbitrary level, we
tested seven threshold values: 65, 70, 75, 80, 85, 90
and 95%. From the analysis of the performance of the
corresponding models, the best threshold value was
then determined (see below).
Tij was expressed as the ratio between the length of
the incubation period at optimal and at observed
temperatures. We assumed that all infection pro-
cesses (germination, appressorial formation, penetra-
tion) stopped at 08C and thus set the Tij value to zero
when temperature was equal to or below 08C. Tij was
calculated as follows:
if t � 0�C, Tij ¼ 0 ðdimensionlessÞ ð4aÞ
if t[0�C; Tij ¼IPopt
IPt
� �
ij
2�0; 1� ðdimensionlessÞ
ð4bÞ
where IPopt is the length of the incubation period at
optimum temperature and IPt is the length of the
incubation period at temperature t.
The shortest incubation period obtained at opti-
mum temperature (15–258C) is one day (Roger et al.
1999b). At temperatures less favourable to pathogen
growth, IPt is described by a quadratic function of
temperature t and varies according to the moisture
regime (leaf wet or not). In the absence of leaf
wetness sensors or of leaf wetness simulation models,
leaf surface was assumed to be wet when rainfall was
�0.2 mm (resolution of the rain gauge):
IPopt ¼ 1 ðin daysÞ ð5aÞ
if rainfall � 0.2 mm,
IPt ¼ 0:0171t2 � 0:6457t þ 6:8 ðin daysÞ ð5b)
otherwise, IPt ¼ 0:0307t2 � 1:195t þ 12:1 ðin daysÞð5cÞ
Although the domain of validity of the equations
proposed by Roger et al. (1999b) was 5–308C,
extrapolation of this model for temperatures in the
y = -4.08x2 + 57.36x + 97.49R2 = 0.91
0
50
100
150
200
250
300
350
1 2 3 4 5 6 7 8
Sowing number
syad-eer
geD
Fig. 2 A quadratic model predicting the time (expressed in
degree-days from 08C) required for emergence of the first leaf
for sowing dates ranging between mid-September and mid-
December in field trials conducted in France in 2003–2004 and
2004–2005
90 Eur J Plant Pathol (2007) 119:87–97
123
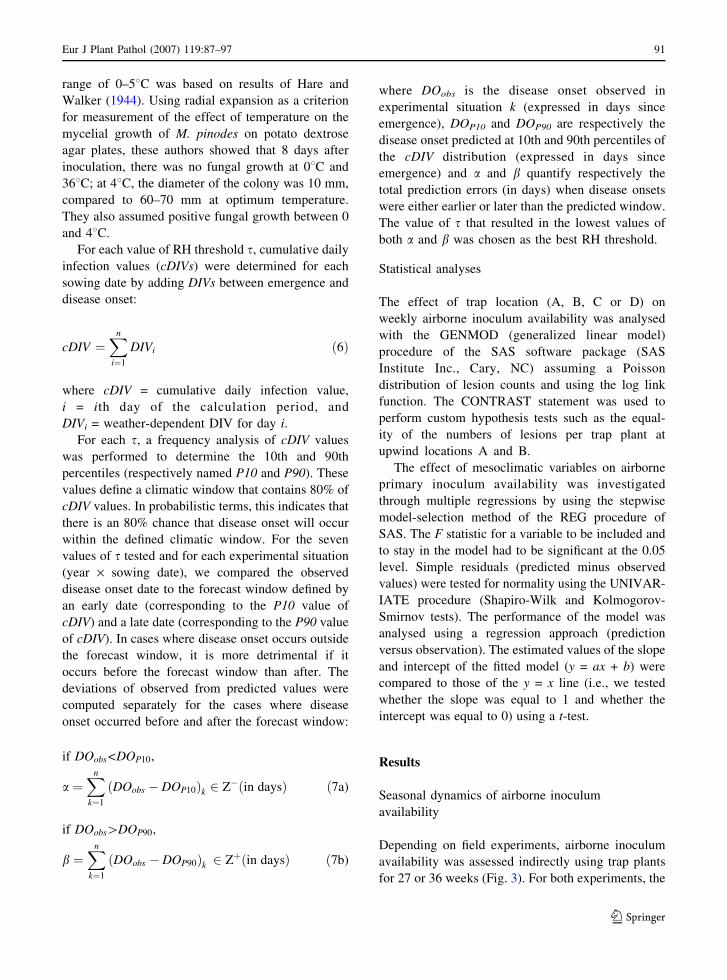
range of 0–58C was based on results of Hare and
Walker (1944). Using radial expansion as a criterion
for measurement of the effect of temperature on the
mycelial growth of M. pinodes on potato dextrose
agar plates, these authors showed that 8 days after
inoculation, there was no fungal growth at 08C and
368C; at 48C, the diameter of the colony was 10 mm,
compared to 60–70 mm at optimum temperature.
They also assumed positive fungal growth between 0
and 48C.
For each value of RH threshold s, cumulative daily
infection values (cDIVs) were determined for each
sowing date by adding DIVs between emergence and
disease onset:
cDIV ¼Xn
i¼1
DIVi ð6Þ
where cDIV = cumulative daily infection value,
i = ith day of the calculation period, and
DIVi = weather-dependent DIV for day i.
For each s, a frequency analysis of cDIV values
was performed to determine the 10th and 90th
percentiles (respectively named P10 and P90). These
values define a climatic window that contains 80% of
cDIV values. In probabilistic terms, this indicates that
there is an 80% chance that disease onset will occur
within the defined climatic window. For the seven
values of s tested and for each experimental situation
(year · sowing date), we compared the observed
disease onset date to the forecast window defined by
an early date (corresponding to the P10 value of
cDIV) and a late date (corresponding to the P90 value
of cDIV). In cases where disease onset occurs outside
the forecast window, it is more detrimental if it
occurs before the forecast window than after. The
deviations of observed from predicted values were
computed separately for the cases where disease
onset occurred before and after the forecast window:
if DOobs<DOP10,
a ¼Xn
k¼1
DOobs � DOP10ð Þk 2 Z�ðin daysÞ ð7a)
if DOobs[DOP90,
b ¼Xn
k¼1
DOobs � DOP90ð Þk 2 Zþðin daysÞ ð7b)
where DOobs is the disease onset observed in
experimental situation k (expressed in days since
emergence), DOP10 and DOP90 are respectively the
disease onset predicted at 10th and 90th percentiles of
the cDIV distribution (expressed in days since
emergence) and a and b quantify respectively the
total prediction errors (in days) when disease onsets
were either earlier or later than the predicted window.
The value of s that resulted in the lowest values of
both a and b was chosen as the best RH threshold.
Statistical analyses
The effect of trap location (A, B, C or D) on
weekly airborne inoculum availability was analysed
with the GENMOD (generalized linear model)
procedure of the SAS software package (SAS
Institute Inc., Cary, NC) assuming a Poisson
distribution of lesion counts and using the log link
function. The CONTRAST statement was used to
perform custom hypothesis tests such as the equal-
ity of the numbers of lesions per trap plant at
upwind locations A and B.
The effect of mesoclimatic variables on airborne
primary inoculum availability was investigated
through multiple regressions by using the stepwise
model-selection method of the REG procedure of
SAS. The F statistic for a variable to be included and
to stay in the model had to be significant at the 0.05
level. Simple residuals (predicted minus observed
values) were tested for normality using the UNIVAR-
IATE procedure (Shapiro-Wilk and Kolmogorov-
Smirnov tests). The performance of the model was
analysed using a regression approach (prediction
versus observation). The estimated values of the slope
and intercept of the fitted model (y = ax + b) were
compared to those of the y = x line (i.e., we tested
whether the slope was equal to 1 and whether the
intercept was equal to 0) using a t-test.
Results
Seasonal dynamics of airborne inoculum
availability
Depending on field experiments, airborne inoculum
availability was assessed indirectly using trap plants
for 27 or 36 weeks (Fig. 3). For both experiments, the
Eur J Plant Pathol (2007) 119:87–97 91
123
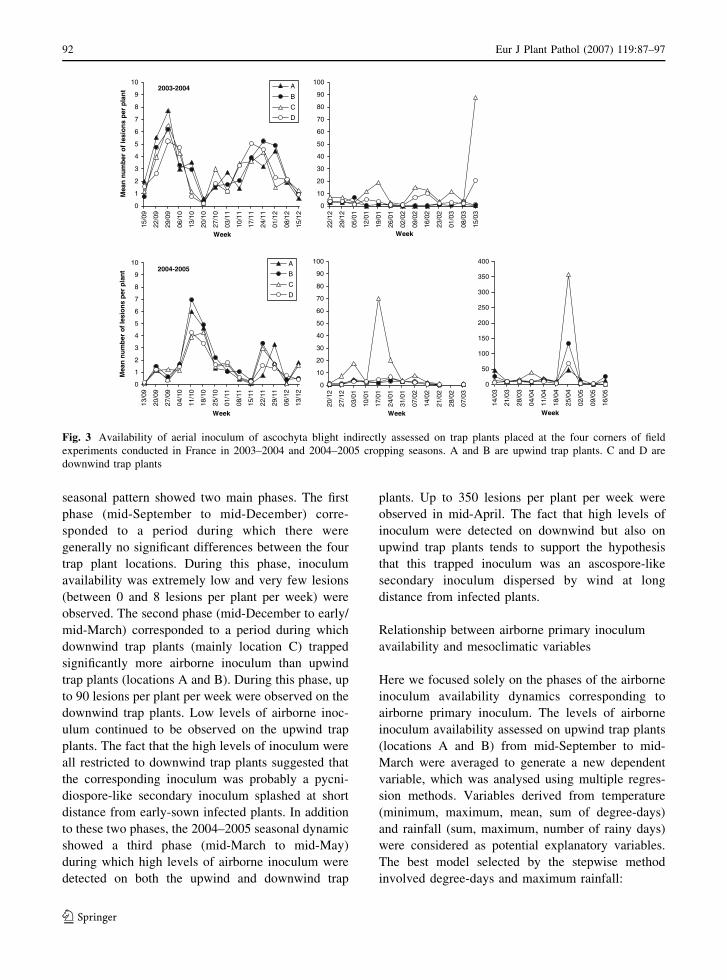
seasonal pattern showed two main phases. The first
phase (mid-September to mid-December) corre-
sponded to a period during which there were
generally no significant differences between the four
trap plant locations. During this phase, inoculum
availability was extremely low and very few lesions
(between 0 and 8 lesions per plant per week) were
observed. The second phase (mid-December to early/
mid-March) corresponded to a period during which
downwind trap plants (mainly location C) trapped
significantly more airborne inoculum than upwind
trap plants (locations A and B). During this phase, up
to 90 lesions per plant per week were observed on the
downwind trap plants. Low levels of airborne inoc-
ulum continued to be observed on the upwind trap
plants. The fact that the high levels of inoculum were
all restricted to downwind trap plants suggested that
the corresponding inoculum was probably a pycni-
diospore-like secondary inoculum splashed at short
distance from early-sown infected plants. In addition
to these two phases, the 2004–2005 seasonal dynamic
showed a third phase (mid-March to mid-May)
during which high levels of airborne inoculum were
detected on both the upwind and downwind trap
plants. Up to 350 lesions per plant per week were
observed in mid-April. The fact that high levels of
inoculum were detected on downwind but also on
upwind trap plants tends to support the hypothesis
that this trapped inoculum was an ascospore-like
secondary inoculum dispersed by wind at long
distance from infected plants.
Relationship between airborne primary inoculum
availability and mesoclimatic variables
Here we focused solely on the phases of the airborne
inoculum availability dynamics corresponding to
airborne primary inoculum. The levels of airborne
inoculum availability assessed on upwind trap plants
(locations A and B) from mid-September to mid-
March were averaged to generate a new dependent
variable, which was analysed using multiple regres-
sion methods. Variables derived from temperature
(minimum, maximum, mean, sum of degree-days)
and rainfall (sum, maximum, number of rainy days)
were considered as potential explanatory variables.
The best model selected by the stepwise method
involved degree-days and maximum rainfall:
2003-2004
0
1
2
3
4
5
6
7
8
9
10
90/51
90/22
90/92
01/60
01/3 1
01/02
01/72
11/30
11/01
11 /71
11/42
21/10
2 1/80
21/51
Week
tnal
pre
ps
noisel
fo
reb
mu
nnae
M
A
B
C
D
0
10
20
30
40
50
60
70
80
90
100
21/22
21/92
10/50
10/21
10/91
1 0/62
20/2 0
20/90
20/61
20/32
3 0/10
3 0/8 0
30/51
Week
2004-2005
0
1
2
3
4
5
6
7
8
9
10
90/31
90/02
90/72
01/40
01/11
01/81
01/52
11/10
11/80
11/51
11/22
11/92
21/60
21/31
Week
tnal
pre
ps
noisel
fo
reb
mu
nnae
M
A
B
C
D
0
10
20
30
40
50
60
70
80
90
100
21/02
21/72
10/30
10/01
10/71
10/42
1 0/13
2 0/70
2 0/41
20/12
20/82
3 0/70
Week
0
50
100
150
200
250
300
350
400
30/41
30/12
30/82
40/40
40/11
40/81
40/52
50/ 20
50/90
50/61
Week
Fig. 3 Availability of aerial inoculum of ascochyta blight indirectly assessed on trap plants placed at the four corners of field
experiments conducted in France in 2003–2004 and 2004–2005 cropping seasons. A and B are upwind trap plants. C and D are
downwind trap plants
92 Eur J Plant Pathol (2007) 119:87–97
123
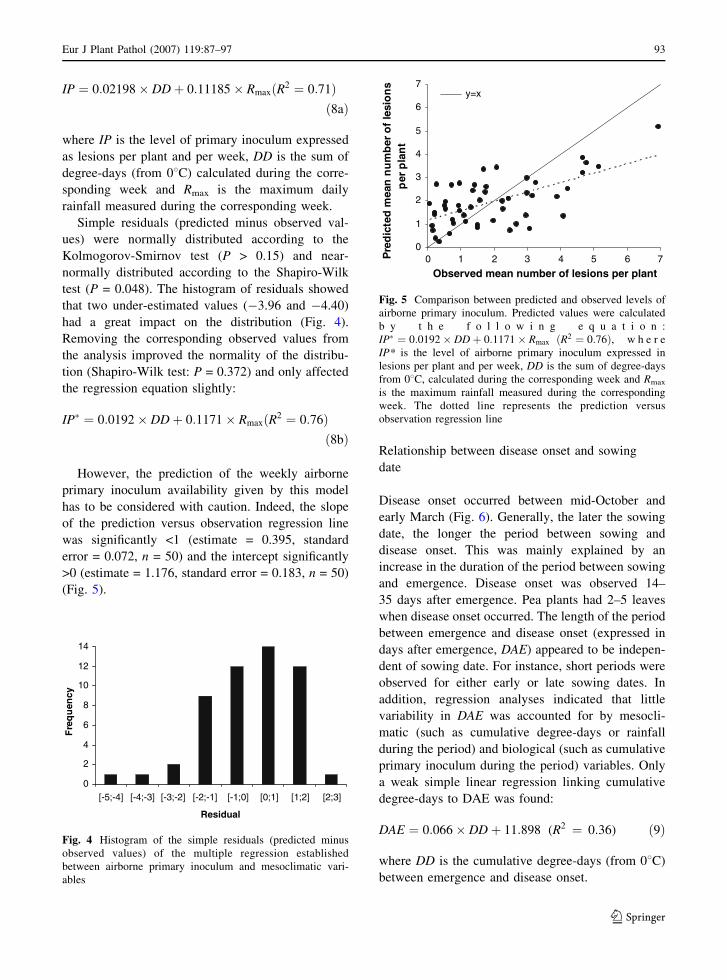
IP ¼ 0:02198� DDþ 0:11185� RmaxðR2 ¼ 0:71Þð8aÞ
where IP is the level of primary inoculum expressed
as lesions per plant and per week, DD is the sum of
degree-days (from 08C) calculated during the corre-
sponding week and Rmax is the maximum daily
rainfall measured during the corresponding week.
Simple residuals (predicted minus observed val-
ues) were normally distributed according to the
Kolmogorov-Smirnov test (P > 0.15) and near-
normally distributed according to the Shapiro-Wilk
test (P = 0.048). The histogram of residuals showed
that two under-estimated values (�3.96 and �4.40)
had a great impact on the distribution (Fig. 4).
Removing the corresponding observed values from
the analysis improved the normality of the distribu-
tion (Shapiro-Wilk test: P = 0.372) and only affected
the regression equation slightly:
IP� ¼ 0:0192� DDþ 0:1171� RmaxðR2 ¼ 0:76Þð8bÞ
However, the prediction of the weekly airborne
primary inoculum availability given by this model
has to be considered with caution. Indeed, the slope
of the prediction versus observation regression line
was significantly <1 (estimate = 0.395, standard
error = 0.072, n = 50) and the intercept significantly
>0 (estimate = 1.176, standard error = 0.183, n = 50)
(Fig. 5).
Relationship between disease onset and sowing
date
Disease onset occurred between mid-October and
early March (Fig. 6). Generally, the later the sowing
date, the longer the period between sowing and
disease onset. This was mainly explained by an
increase in the duration of the period between sowing
and emergence. Disease onset was observed 14–
35 days after emergence. Pea plants had 2–5 leaves
when disease onset occurred. The length of the period
between emergence and disease onset (expressed in
days after emergence, DAE) appeared to be indepen-
dent of sowing date. For instance, short periods were
observed for either early or late sowing dates. In
addition, regression analyses indicated that little
variability in DAE was accounted for by mesocli-
matic (such as cumulative degree-days or rainfall
during the period) and biological (such as cumulative
primary inoculum during the period) variables. Only
a weak simple linear regression linking cumulative
degree-days to DAE was found:
DAE ¼ 0:066� DD þ 11:898 (R2 ¼ 0:36) ð9Þ
where DD is the cumulative degree-days (from 08C)
between emergence and disease onset.
0
2
4
6
8
10
12
14
Residual
ycne
uqer
F
[2;3][1;2][0;1][-1;0][-2;-1][-3;-2][-4;-3][-5;-4]
Fig. 4 Histogram of the simple residuals (predicted minus
observed values) of the multiple regression established
between airborne primary inoculum and mesoclimatic vari-
ables
0
1
2
3
4
5
6
7
0 1 2 3 4 5 6 7
Observed mean number of lesions per plant
sn
oisel fo re
bm
un
naem
detcider
Pt
nalp re
p
y=x
Fig. 5 Comparison between predicted and observed levels of
airborne primary inoculum. Predicted values were calculated
b y t h e f o l l o w i n g e q u a t i o n :
IP� ¼ 0:0192� DDþ 0:1171� Rmax ðR2 ¼ 0:76Þ, w h e r e
IP* is the level of airborne primary inoculum expressed in
lesions per plant and per week, DD is the sum of degree-days
from 08C, calculated during the corresponding week and Rmax
is the maximum rainfall measured during the corresponding
week. The dotted line represents the prediction versus
observation regression line
Eur J Plant Pathol (2007) 119:87–97 93
123
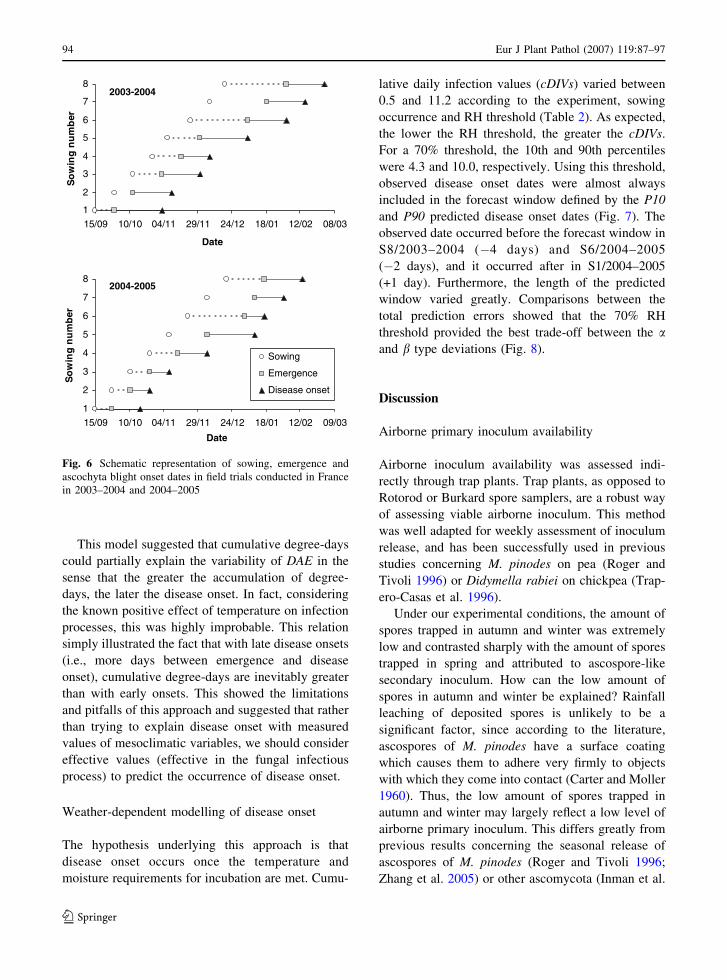
This model suggested that cumulative degree-days
could partially explain the variability of DAE in the
sense that the greater the accumulation of degree-
days, the later the disease onset. In fact, considering
the known positive effect of temperature on infection
processes, this was highly improbable. This relation
simply illustrated the fact that with late disease onsets
(i.e., more days between emergence and disease
onset), cumulative degree-days are inevitably greater
than with early onsets. This showed the limitations
and pitfalls of this approach and suggested that rather
than trying to explain disease onset with measured
values of mesoclimatic variables, we should consider
effective values (effective in the fungal infectious
process) to predict the occurrence of disease onset.
Weather-dependent modelling of disease onset
The hypothesis underlying this approach is that
disease onset occurs once the temperature and
moisture requirements for incubation are met. Cumu-
lative daily infection values (cDIVs) varied between
0.5 and 11.2 according to the experiment, sowing
occurrence and RH threshold (Table 2). As expected,
the lower the RH threshold, the greater the cDIVs.
For a 70% threshold, the 10th and 90th percentiles
were 4.3 and 10.0, respectively. Using this threshold,
observed disease onset dates were almost always
included in the forecast window defined by the P10
and P90 predicted disease onset dates (Fig. 7). The
observed date occurred before the forecast window in
S8/2003–2004 (�4 days) and S6/2004–2005
(�2 days), and it occurred after in S1/2004–2005
(+1 day). Furthermore, the length of the predicted
window varied greatly. Comparisons between the
total prediction errors showed that the 70% RH
threshold provided the best trade-off between the aand b type deviations (Fig. 8).
Discussion
Airborne primary inoculum availability
Airborne inoculum availability was assessed indi-
rectly through trap plants. Trap plants, as opposed to
Rotorod or Burkard spore samplers, are a robust way
of assessing viable airborne inoculum. This method
was well adapted for weekly assessment of inoculum
release, and has been successfully used in previous
studies concerning M. pinodes on pea (Roger and
Tivoli 1996) or Didymella rabiei on chickpea (Trap-
ero-Casas et al. 1996).
Under our experimental conditions, the amount of
spores trapped in autumn and winter was extremely
low and contrasted sharply with the amount of spores
trapped in spring and attributed to ascospore-like
secondary inoculum. How can the low amount of
spores in autumn and winter be explained? Rainfall
leaching of deposited spores is unlikely to be a
significant factor, since according to the literature,
ascospores of M. pinodes have a surface coating
which causes them to adhere very firmly to objects
with which they come into contact (Carter and Moller
1960). Thus, the low amount of spores trapped in
autumn and winter may largely reflect a low level of
airborne primary inoculum. This differs greatly from
previous results concerning the seasonal release of
ascospores of M. pinodes (Roger and Tivoli 1996;
Zhang et al. 2005) or other ascomycota (Inman et al.
2003-2004
1
2
3
4
5
6
7
8
15/09 10/10 04/11 29/11 24/12 18/01 12/02 08/03
Date
reb
mu
ng
niw
oS
2004-2005
1
2
3
4
5
6
7
8
15/09 10/10 04/11 29/11 24/12 18/01 12/02 09/03
Date
reb
mu
ng
niw
oS
Sowing
Emergence
Disease onset
Fig. 6 Schematic representation of sowing, emergence and
ascochyta blight onset dates in field trials conducted in France
in 2003–2004 and 2004–2005
94 Eur J Plant Pathol (2007) 119:87–97
123
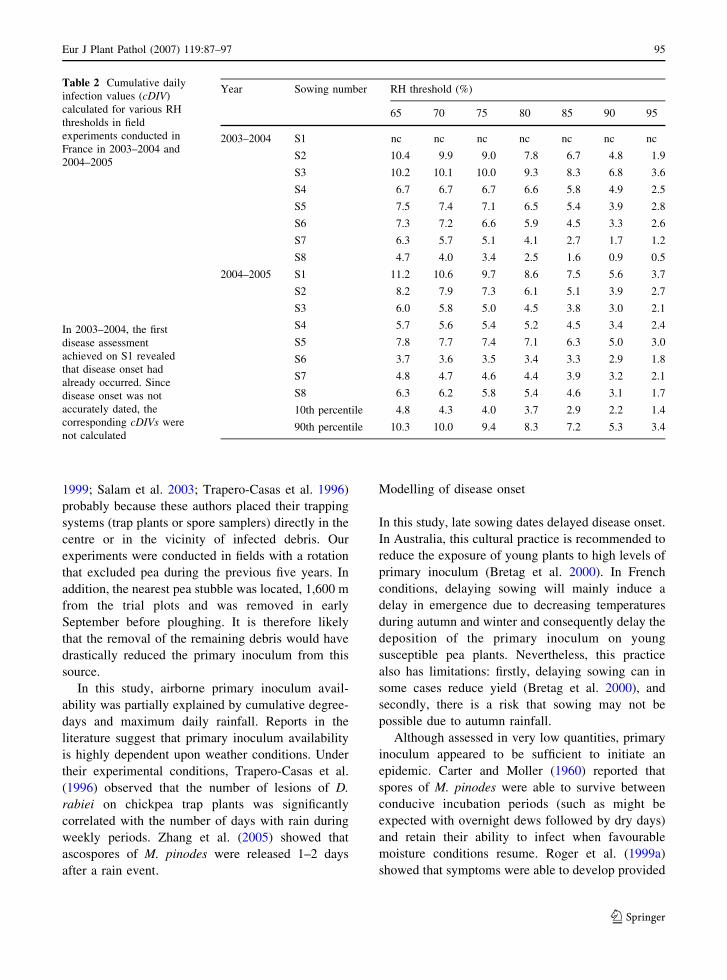
1999; Salam et al. 2003; Trapero-Casas et al. 1996)
probably because these authors placed their trapping
systems (trap plants or spore samplers) directly in the
centre or in the vicinity of infected debris. Our
experiments were conducted in fields with a rotation
that excluded pea during the previous five years. In
addition, the nearest pea stubble was located, 1,600 m
from the trial plots and was removed in early
September before ploughing. It is therefore likely
that the removal of the remaining debris would have
drastically reduced the primary inoculum from this
source.
In this study, airborne primary inoculum avail-
ability was partially explained by cumulative degree-
days and maximum daily rainfall. Reports in the
literature suggest that primary inoculum availability
is highly dependent upon weather conditions. Under
their experimental conditions, Trapero-Casas et al.
(1996) observed that the number of lesions of D.
rabiei on chickpea trap plants was significantly
correlated with the number of days with rain during
weekly periods. Zhang et al. (2005) showed that
ascospores of M. pinodes were released 1–2 days
after a rain event.
Modelling of disease onset
In this study, late sowing dates delayed disease onset.
In Australia, this cultural practice is recommended to
reduce the exposure of young plants to high levels of
primary inoculum (Bretag et al. 2000). In French
conditions, delaying sowing will mainly induce a
delay in emergence due to decreasing temperatures
during autumn and winter and consequently delay the
deposition of the primary inoculum on young
susceptible pea plants. Nevertheless, this practice
also has limitations: firstly, delaying sowing can in
some cases reduce yield (Bretag et al. 2000), and
secondly, there is a risk that sowing may not be
possible due to autumn rainfall.
Although assessed in very low quantities, primary
inoculum appeared to be sufficient to initiate an
epidemic. Carter and Moller (1960) reported that
spores of M. pinodes were able to survive between
conducive incubation periods (such as might be
expected with overnight dews followed by dry days)
and retain their ability to infect when favourable
moisture conditions resume. Roger et al. (1999a)
showed that symptoms were able to develop provided
Table 2 Cumulative daily
infection values (cDIV)
calculated for various RH
thresholds in field
experiments conducted in
France in 2003–2004 and
2004–2005
In 2003–2004, the first
disease assessment
achieved on S1 revealed
that disease onset had
already occurred. Since
disease onset was not
accurately dated, the
corresponding cDIVs were
not calculated
Year Sowing number RH threshold (%)
65 70 75 80 85 90 95
2003–2004 S1 nc nc nc nc nc nc nc
S2 10.4 9.9 9.0 7.8 6.7 4.8 1.9
S3 10.2 10.1 10.0 9.3 8.3 6.8 3.6
S4 6.7 6.7 6.7 6.6 5.8 4.9 2.5
S5 7.5 7.4 7.1 6.5 5.4 3.9 2.8
S6 7.3 7.2 6.6 5.9 4.5 3.3 2.6
S7 6.3 5.7 5.1 4.1 2.7 1.7 1.2
S8 4.7 4.0 3.4 2.5 1.6 0.9 0.5
2004–2005 S1 11.2 10.6 9.7 8.6 7.5 5.6 3.7
S2 8.2 7.9 7.3 6.1 5.1 3.9 2.7
S3 6.0 5.8 5.0 4.5 3.8 3.0 2.1
S4 5.7 5.6 5.4 5.2 4.5 3.4 2.4
S5 7.8 7.7 7.4 7.1 6.3 5.0 3.0
S6 3.7 3.6 3.5 3.4 3.3 2.9 1.8
S7 4.8 4.7 4.6 4.4 3.9 3.2 2.1
S8 6.3 6.2 5.8 5.4 4.6 3.1 1.7
10th percentile 4.8 4.3 4.0 3.7 2.9 2.2 1.4
90th percentile 10.3 10.0 9.4 8.3 7.2 5.3 3.4
Eur J Plant Pathol (2007) 119:87–97 95
123
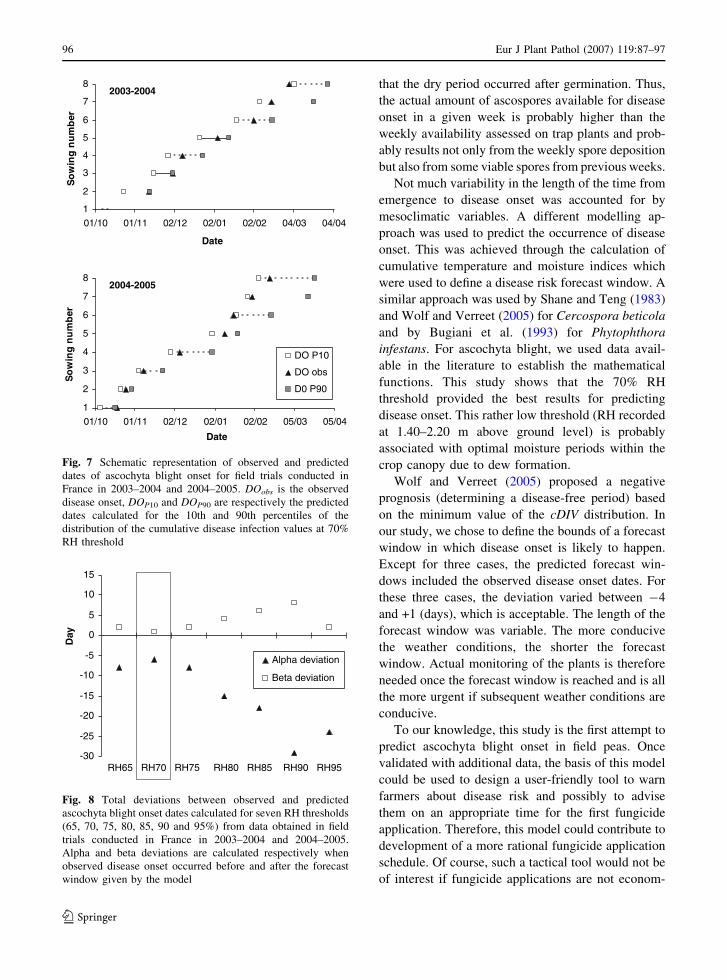
that the dry period occurred after germination. Thus,
the actual amount of ascospores available for disease
onset in a given week is probably higher than the
weekly availability assessed on trap plants and prob-
ably results not only from the weekly spore deposition
but also from some viable spores from previous weeks.
Not much variability in the length of the time from
emergence to disease onset was accounted for by
mesoclimatic variables. A different modelling ap-
proach was used to predict the occurrence of disease
onset. This was achieved through the calculation of
cumulative temperature and moisture indices which
were used to define a disease risk forecast window. A
similar approach was used by Shane and Teng (1983)
and Wolf and Verreet (2005) for Cercospora beticola
and by Bugiani et al. (1993) for Phytophthora
infestans. For ascochyta blight, we used data avail-
able in the literature to establish the mathematical
functions. This study shows that the 70% RH
threshold provided the best results for predicting
disease onset. This rather low threshold (RH recorded
at 1.40–2.20 m above ground level) is probably
associated with optimal moisture periods within the
crop canopy due to dew formation.
Wolf and Verreet (2005) proposed a negative
prognosis (determining a disease-free period) based
on the minimum value of the cDIV distribution. In
our study, we chose to define the bounds of a forecast
window in which disease onset is likely to happen.
Except for three cases, the predicted forecast win-
dows included the observed disease onset dates. For
these three cases, the deviation varied between �4
and +1 (days), which is acceptable. The length of the
forecast window was variable. The more conducive
the weather conditions, the shorter the forecast
window. Actual monitoring of the plants is therefore
needed once the forecast window is reached and is all
the more urgent if subsequent weather conditions are
conducive.
To our knowledge, this study is the first attempt to
predict ascochyta blight onset in field peas. Once
validated with additional data, the basis of this model
could be used to design a user-friendly tool to warn
farmers about disease risk and possibly to advise
them on an appropriate time for the first fungicide
application. Therefore, this model could contribute to
development of a more rational fungicide application
schedule. Of course, such a tactical tool would not be
of interest if fungicide applications are not econom-
2003-2004
1
2
3
4
5
6
7
8
01/10 01/11 02/12 02/01 02/02 04/03 04/04
Date
reb
mu
ng
niw
oS
2004-2005
1
2
3
4
5
6
7
8
01/10 01/11 02/12 02/01 02/02 05/03 05/04
Date
reb
mu
ng
niw
oS
DO P10
DO obs
D0 P90
Fig. 7 Schematic representation of observed and predicted
dates of ascochyta blight onset for field trials conducted in
France in 2003–2004 and 2004–2005. DOobs is the observed
disease onset, DOP10 and DOP90 are respectively the predicted
dates calculated for the 10th and 90th percentiles of the
distribution of the cumulative disease infection values at 70%
RH threshold
-30
-25
-20
-15
-10
-5
0
5
10
15
RH65 RH70 RH75 RH80 RH85 RH90 RH95
aD
y
Alpha deviation
Beta deviation
Fig. 8 Total deviations between observed and predicted
ascochyta blight onset dates calculated for seven RH thresholds
(65, 70, 75, 80, 85, 90 and 95%) from data obtained in field
trials conducted in France in 2003–2004 and 2004–2005.
Alpha and beta deviations are calculated respectively when
observed disease onset occurred before and after the forecast
window given by the model
96 Eur J Plant Pathol (2007) 119:87–97
123
ically beneficial. Finally, this model needs to be
coupled to a disease progress model to predict the
subsequent development of ascochyta blight and
associated pea yield losses.
Acknowledgements This work was partially funded by the
European Union through the Grain Legumes Integrated Project
(FOOD-CT-2004-506223). We thank Gabriel Nedelec and
Emile Lemarchand (INRA Rennes) for organizing the seeding,
Aurelie Leclerc (INRA Rennes) for occasional technical help,
and Joel Chadoeuf (INRA Avignon) for statistical advice. We
also thank Cindy Morris (INRA Avignon) and Randy Kutcher
(Agriculture and Agri-Food Canada) for kindly reviewing this
manuscript for English language.
References
ARVALIS (Ed.) (2003). Pois, feveroles et lupins. Quoi de
neuf? Paris, France: ARVALIS - Institut du vegetal.
Beasse, C., Ney, B., & Tivoli, B. (1999). Effects of pod
infection by Mycosphaerella pinodes on yield components
of pea (Pisum sativum). Annals of Applied Biology, 135,
359–367.
Beasse, C., Ney, B., & Tivoli, B. (2000). A simple model of
pea (Pisum sativum) growth affected by Mycosphaerellapinodes. Plant Pathology, 49, 187–200.
Bretag, T. W., Keane, P. J., & Price, T. V. (2000). Effect of
sowing date on the severity of ascochyta blight in field
peas (Pisum sativum L.) grown in the Wimmera region of
Victoria. Australian Journal of Experimental Agriculture,40, 1113–1119.
Bretag, T. W., & Ramsey, M. (2001). Foliar diseases caused by
fungi. Ascochyta spp. In J. M. Kraft, & F. L. Pfleger
(Eds.), Compendium of pea diseases and pests. Secondedition (pp. 24–28). St Paul, Minnesota, USA: APS Press,
The American Phytopathological Society.
Bugiani, R., Cavanni, P., & Ponti, I. (1993). An advisory service
for the occurrence of Phytophthora infestans on tomato in
Emilia-Romagna region. EPPO Bulletin, 23, 607–613.
Carter, M. V., & Moller, W. J. (1960). Black spot of peas.
Journal of Agriculture, 63, 353–363.
Garry, G., Jeuffroy, M.-H., Ney, B., & Tivoli, B. (1998). Ef-
fects of Ascochyta blight (Mycosphaerella pinodes) on the
photosynthesizing leaf area and the photosynthetic effi-
ciency of the green leaf area of dried-pea (Pisum sativum).
Plant Pathology, 47, 473–479.
Hare, W. W., & Walker, J. C. (1944). Ascochyta disease of
canning pea. Wisconsin Research Bulletin, 150, 1–31.
Inman, A. J., Fitt, B. D. L., Todd, A. D., & Evans, R. L. (1999).
Ascospores as primary inoculum for epidemics of white
leaf spot in winter oilseed rape in the UK. Plant Pathol-ogy, 48, 308–319.
Lawyer, A. S. (1984). Foliar diseases caused by fungi. Diseases
caused by Ascochyta spp. In D. J. Hagedorn (Ed.), Com-pendium of pea diseases. First edition (pp. 11–15). St
Paul, Minnesota, USA: APS Press, The American Phy-
topathological Society.
Le May, C., Schoeny, A., Tivoli, B., & Ney, B. (2005).
Improvement and validation of a pea crop growth model
to simulate the growth of cultivars infected with Asco-
chyta blight (Mycosphaerella pinodes). European Journalof Plant Pathology, 112, 1–12.
Onfroy, C., Baranger, A., & Tivoli, B. (2007). A detached leaf
assay to assess pea partial resistance to Ascochyta blight.
European Journal of Plant Pathology (accepted).
Roger, C., & Tivoli, B. (1996). Spatio-temporal development
of pycnidia and perithecia and dissemination of spores of
Mycosphaerella pinodes on pea (Pisum sativum). PlantPathology, 45, 518–528.
Roger, C., Tivoli, B., & Huber, L. (1999a). Effects of inter-
rupted wet periods and different temperatures on the
development of ascochyta blight caused by Mycosphae-rella pinodes on pea (Pisum sativum) seedlings. PlantPathology, 48, 10–18.
Roger, C., Tivoli, B., & Huber, L. (1999b). Effects of tem-
perature and moisture on disease and fruit body devel-
opment of Mycosphaerella pinodes on pea (Pisumsativum). Plant Pathology, 48, 1–9.
Salam, M. U., & Galloway, J. (2005). ‘‘Blackspot Manager’’
for understanding blackspot of peas and ascochyta blight
management In 2005 Lupins and pulses updates. Agri-business crop updates 2005 (pp. 67–69). Western Aus-
tralia: Department of Agriculture.
Salam, M. U., Khangura, R. K., Diggle, A. J., & Barbetti, M. J.
(2003). Blackleg Sporacle: a model for predicting onset of
pseudothecia maturity and seasonal ascospore showers in
relation to blackleg of canola. Phytopathology, 93, 1073–
1081.
Shane, W. W., & Teng, P. S. (1983). Cercospora beticolainfection prediction model. Sugar Beet Research andExtension Report, 15, 129–138.
Trapero-Casas, A., Navas-Cortes, J. A., & Jimenez-Diaz, R. M.
(1996). Airborne ascospores of Didymella rabiei as a
major primary inoculum for Ascochyta blight epidemics
in chickpea crops in southern Spain. European Journal ofPlant Pathology, 102, 237–245.
Wolf, P. F. J., & Verreet, J. A. (2005). Factors affecting the
onset of Cercospora leaf spot epidemics in sugar beet and
establishment of disease-monitoring thresholds. Phytopa-thology, 95, 269–274.
Zhang, J. X., Fernando, W. G. D., & Xue, A. G. (2005). Daily
and seasonal spore dispersal by Mycosphaerella pinodesand development of mycosphaerella blight of field pea.
Canadian Journal of Botany, 83, 302–310.
Eur J Plant Pathol (2007) 119:87–97 97
123
REVIEW
Integrated disease management of ascochyta blight in pulsecrops
Jennifer Anne Davidson Æ Rohan B. E. Kimber
Received: 27 October 2006 / Accepted: 29 March 2007 / Published online: 27 April 2007
� KNPV 2007
Abstract Ascochyta blight causes significant yield
loss in pulse crops worldwide. Integrated disease
management is essential to take advantage of culti-
vars with partial resistance to this disease. The most
effective practices, established by decades of
research, use a combination of disease-free seed,
destruction or avoidance of inoculum sources, manip-
ulation of sowing dates, seed and foliar fungicides,
and cultivars with improved resistance. An under-
standing of the pathosystems and the inter-relation-
ship between host, pathogen and the environment is
essential to be able to make correct decisions for
disease control without compromising the agronomic
or economic ideal. For individual pathosystems, some
components of the integrated management principles
may need to be given greater consideration than
others. For instance, destruction of infested residue
may be incompatible with no or minimum tillage
practices, or rotation intervals may need to be
extended in environments that slow the speed of
residue decomposition. For ascochyta-susceptible
chickpeas the use of disease-free seed, or seed
treatments, is crucial as seed-borne infection is highly
effective as primary inoculum and epidemics develop
rapidly from foci in favourable conditions.
Implemented fungicide strategies differ according to
cultivar resistance and the control efficacy of fungi-
cides, and the effectiveness of genetic resistance
varies according to seasonal conditions. Studies are
being undertaken to develop advanced decision
support tools to assist growers in making more
informed decisions regarding fungicide and agro-
nomic practices for disease control.
Keywords Chickpea � Faba bean � Fungicide � Field
pea � Infected seed � Lentil � Infested residue �Resistance � Rotation � Seed dressing
Introduction
Ascochyta blight is the most severe foliar disease of
cool season pulses, the major crops being chickpea,
faba bean, lentil and field pea, and severe epidemics
may result in total crop failure. Pathogens that cause
ascochyta blight belong to Ascomycota; they have
worldwide distribution and are predominantly host-
specific. Ascochyta rabiei (teleomorph: Didymella
rabiei), Ascochyta lentis (syn. A. fabae sp. lentis) and
Ascochyta fabae (teleomorph: Didymella fabae)
infect chickpea, lentil and faba bean, respectively.
Ascochyta blight of field pea is caused by a complex
of three fungal species; Ascochyta pinodes (teleo-
morph: Mycosphaerella pinodes), Ascochyta pisi and
Phoma medicaginis var. pinodella, formerly known
as Ascochyta pinodella. This highly efficient group of
pathogens undergo heterothallic sexual reproduction
J. A. Davidson (&) � R. B. E. Kimber
South Australian Research and Development Institute
(SARDI), GPO Box 397, Adelaide, SA 5001, Australia
e-mail: [email protected]
123
Eur J Plant Pathol (2007) 119:99–110
DOI 10.1007/s10658-007-9132-x
on infested residue, resulting in air-borne ascospores,
which are capable of spread over long distances.
Rapid polycyclic spread within crops occurs over
short distances through splash-borne asexual conidia
(pycnidiospores). The disease affects all above
ground parts of the plant and is characterised by
necrotic lesions, which on susceptible cultivars in
favourable conditions, can girdle stems leading to
breakage and severe yield reduction. Seed quality
may also be reduced through seed discolouration or
retardation of seed development.
Significant improvements in host resistance are
being realised in breeding programmes and a greater
understanding of integrated disease management
options can reduce the incidence, severity or persis-
tence of ascochyta blight. Nevertheless, control of
this aggressive disease continues to challenge pulse
industries and researchers worldwide, and ascochyta
blight epidemics continue to depress yields.
This review summarises the current knowledge of
the management of ascochyta blight in the pulse crop.
Managing ascochyta blight firstly relies on minimising
the onset of disease epidemics by reducing or avoiding
primary inoculum, and secondly by suppressing the
subsequent epidemic increase using resistance or
foliar fungicides. Methods of control include destroy-
ing or avoiding inoculum sources, crop rotations,
manipulating sowing times, sowing disease-free seed,
applying seed and foliar fungicides and adopting
cultivars with improved resistance. The combination
of strategies is determined by economics, availability
of cultivar resistance and disease epidemiology.
Avoiding infested residue and in situ inoculum
Ascochyta fungi survive on infested crop residue
lying on the soil surface and for a reduced period of
time on buried residue. Asexual reproduction on
residue gives rise to pycnidia, which exude pycni-
diospores, spread via rain splash, whereas sexual
reproduction forms pseudothecia, which discharge
ascospores capable of spread over long distances
by wind and rain. Mycosphaerella pinodes and
P. medicaginis var. pinodella can also produce
chlamydospores, long-term soil-borne survival struc-
tures that may persist for at least 5 years (Wallen and
Jeun 1968), and pea crops become infected if they are
planted in soils containing this soil-borne inoculum.
The management of infested residue and soils is an
important component of controlling ascochyta blight.
Where ascospores are the major source of infection,
crop rotation is less effective, and crop isolation and
residue burial will be more beneficial.
Proximity to infested residues
Isolation from infested residue is an important
strategy in all cool-season pulse crops to avoid
ascochyta diseases. Ascospores are wind-dispersed
and may spread long distances: at least 400 m in the
case of M. pinodes (Davidson et al. 2006; Galloway
and MacLeod 2003) and 100 m in the case of
A. rabiei (Trapero-Casas et al. 1996) though the
distances may be greater if spores are blown in air
currents (Kaiser 1992). In addition to ascospores,
infested residue may be blown into neighbouring
crops. In Australia, crop residues are considered the
most important source of ascochyta inoculum for faba
bean (Hawthorne et al. 2004) and field pea crops
(Bretag et al. 2006; Carter and Moller 1961). Disease
gradients across crops clearly indicated that wind-
blown spores or infested debris from neighbouring
crop residue acted as primary inoculum in lentil crops
in Canada (Morrall 1997) and bean crops in the UK
(Bond and Pope 1980). In the latter study, a
decreasing frequency of ascochyta blight on beans,
from the border to the centre of the field, for a
distance of 120–200 m, suggested that spread from
adjacent fields was more important than seed infec-
tion, whereas previously most outbreaks in the UK
and Canada had been attributed to seed infection
(Hewett 1973).
Burial of infested residue
Burial of debris hastens residue and pathogen
decomposition thereby reducing the inoculum loads.
Ascochyta rabiei inoculum on buried chickpea resi-
due is no longer viable after 2–5 months. In contrast,
inoculum is still viable on residue on the soil surface
after 2 years (Gossen 2001; Kaiser 1973; Navas-
Cortes et al. 1995; Nene and Reddy 1987). Zhang
et al. (2005) found that M. pinodes spore production
from buried pea residues rarely continued after
11 months regardless of depth of burial, but higher
numbers were produced on residues on the soil
surface. Similar results were found in Australia
100 Eur J Plant Pathol (2007) 119:99–110
123
(Davidson et al. 1999). Decomposition is aided by
environments of high temperatures and adequate
moisture but in extreme environments of less than
�408C or more than +408C, such as in Canada,
residue breakdown is inhibited. In studies examining
survival of A. rabiei (Gossen and Miller 2004) and
A. lentis (Gossen 2001) on infested residues, the
pathogens were able to survive when buried within
the soil profile for more than 4 years, albeit at a low
level of pathogen recovery. Hence two or even three
non-host crops are needed between successive chick-
pea or lentil crops to reduce the risk of an epidemic
developing (Gossen and Derksen 2003; Gossen and
Miller 2004). However, in the Pacific Northwest of
USA the pathogens survive for a shorter period of
3 years on buried residue (Kaiser and Hannan 1986).
These differences indicate that regional environments
influence the speed of residue decomposition, rather
than directly impacting on pathogen survival.
Nevertheless, burying residue reduces the spread of
pycnidiospores and ascospores by preventing
exposure for splash or wind dispersal.
Burying residue may reduce spore production and
hasten decomposition but it is incompatible with no
or minimum tillage practices. In addition, even after
several passes with tillage equipment, some residue
remains on the soil surface (Gossen and Miller 2004).
Burning residue is another tool to effectively destroy
inoculum but has also become less popular in many
regions due to environmental concerns. The increas-
ing amount of plant residue left on the soil surface
with minimum tillage is thought to be a potential
hazard for increasing the severity of epidemics, and
alternative means of suppressing the pathogens are
required. Studies are underway to investigate the
potential of using biological control to suppress
A. rabiei on chickpea residue, concentrating on
fungal colonisers such as Aureobasidium pullulans
and Clononstachys rosea (Dugan et al. 2005).
Soil borne inoculum and crop rotation
The recommended interval between like pulse crops
to minimise ascochyta infection is governed by the
speed of residue breakdown. Crop rotation between 3
and 6 years is recommended in most regions to avoid
in situ inoculum, while in warm, moist areas of the
world, rotations of 1 or 2 years with a non-host is
sufficient (Kaiser et al. 2000). The pathogens may
survive directly on the residue of previous crops,
which in many environments will decompose much
quicker if buried.
However, the causal pathogens of ascochyta blight
on field pea (M. pinodes and Phoma medicaginis var.
pinodella) can survive in soil as mycelium or
chlamydospores (Hare and Walker 1944; Wallen
and Jeun 1968) and M. pinodes is a moderately
successful saprophyte (Dickinson and Sheridan
1968). The longevity of these structures influences
the period that is required between pea crops. In
Australian farming systems, rotation interval between
pea crops has recently increased from 3 to 5 years, to
avoid infection from in situ inoculum. Disease
severity was greater in crops sown on shorter
rotations compared to those on longer rotations and
yield, based on grower data, was consistently lower in
the shorter rotation crops (Davidson and Ramsey
2000). Bretag et al. (2001) monitored changes in
populations of soil-borne ascochyta blight fungi,
following different cropping sequences of field pea
and barley. Inoculum levels were twelve times higher
following 3 years of field pea compared to 3 years of
barley. Yield losses of field pea sown in the fourth
year were highly correlated to the level of soil borne
fungi. Similar studies in the USA found that
P. medicaginis var. pinodella could be isolated from
soil that had not been sown to pea for up to 5 years,
while M. pinodes was isolated from soils that had not
grown pea for over 20 years (Wallen and Jeun 1968).
These results bring into question the effectiveness of
a three-year rotation between pea crops to reduce
ascochyta blight. Davidson et al. (2001) investigated
survival of ascochyta blight pathogens in soils of
commercial pea-cropping paddocks. While soil pop-
ulations were found to degrade over time, the
pathogen population levels varied widely between
paddocks with the same paddock history. Hence
relying on a simple paddock rotation may not be
sufficient since crops could be planted in soils with
potentially damaging levels of pathogens. It is likely
that the level of pathogen populations in the soil is
related to the severity of the epidemic in the last pea
crop grown.
Studies on the survival of A. fabae, from soil
samples taken to a depth of 5 cm, concluded that this
pathogen does not survive for even a few months
directly in field soil (Wallen and Galway 1977). This
is probably due to the inability of the pathogen to
Eur J Plant Pathol (2007) 119:99–110 101
123
form chlamydospores, making it dependent upon the
presence of infested residue for survival. While
viable inoculum remains on infested residue in the
field, rotations are still a primary means of disease
control in faba bean and a three-year rotation is
recommended in Australian conditions (Hawthorne
et al. 2004). Residue is also regarded as an important
source of inoculum for A. fabae in Iraq (Michail et al.
1983).
Sowing date
Ascospores are released into the air from infested
residue at certain times of the year, depending on
environmental conditions, and sowing date of crops
can be manipulated to avoid the maximum risk period
when airborne ascospore are at their highest numbers.
In Australia, pea crops are sown two to three
weeks after the agronomic optimum to avoid the peak
period of ascospore release which occurs at the
beginning of the growing season (Bretag 1991).
Earlier sown crops have the most ascochyta and the
highest percentage of infected grain at harvest
(Bretag et al. 2000) particularly in the most intense
pea cropping areas (Davidson and Ramsey 2000). In
higher rainfall areas later planting has less impact on
yield (Davidson and Ramsey 2000), but this practice
risks yield loss in short growing seasons and regions
where spring rain is limiting, with losses as high as
40% in some later-sown crops (Bretag et al. 2000).
This situation also occurs in chickpea where the
maximum ascospore numbers may coincide with
emergence of chickpea crops (Trapero-Casas et al.
1996). In southern Spain a delay in sowing date
reduces the disease risk to emerging crops from
airborne ascospores. However, as with field pea,
delayed sowing can adversely affect yield if it
compromises the optimum agronomic sowing date
(Gan et al. 2005).
Where ascospores are not the primary source of
inoculum, or ascospore release does not coincide with
sowing date, delayed sowing of susceptible cultivars
of chickpea and lentil is still often recommended to
reduce the window of protection required by fungi-
cides to keep ascochyta under control (Gan et al.
2005; Materne et al. 2001). Due to the polycyclic
nature of ascochyta, later sowing lowers the epidemic
intensity by limiting the number of pycnidiospore
cycles.
In some situations, the main source of inoculum
may be produced on early-sown crops, providing
inoculum for later-sown crops, which can then
become severely affected. Late-sown pea crops in
some regions of the Northern Hemisphere suffer
more ascochyta for this reason (Hare and Walker
1944).
Diseased seed and fungicide seed treatment
Diseased seed
Infected seed is a means of introducing ascochyta
blight to new areas and there are numerous reports of
ascochyta blight pathogens being introduced via
infected seed (Ali et al. 1982; Bretag et al. 1995;
Cother 1977a, b; Galdames and Mera 2003; Gossen
and Morrall 1986; Kaiser 1997; Kaiser and Hannan
1986; Kaiser and Muehlbauer 1984; Morrall and
McKenzie 1974). The proportion of seeds infected
with A. rabiei in tested chickpea samples has been
recorded as high as 70% in Turkey (Maden et al.
1975), while in the Pacific Northwest, USA, infection
of commercial seed lots varied from 0.5 to 31%
(Kaiser 1992). High levels of A. lentis infection have
also been recorded in lentil seed lots, with 20%
infection detected in Ethiopian seed lots (Ahmed and
Beniwal 1991). Seed testing is a major component of
A. lentis control in Canada (Morrall 1997) and
Australia (Lindbeck et al. 2002). The importance of
this was particularly demonstrated in the latter
country where 33% of seed lots tested across the
nation were infected, with higher incidence on seed
harvested from earliest sown crops (Nasir and Bretag
1997). The importance of seed infection as an
inoculum source is dependent on several factors; %
of seed infection, the rate of seed to seedling
transmission, the developmental rate of an epidemic
from seedling foci, and the comparative influence of
alternative sources of inoculum.
Seed to seedling transmission
Seed transmission rates for A. rabiei have been
reported as 5% in field conditions (Kimber et al.
2007) to 20–30% in glasshouse conditions (Kimber
et al. 2006; Maden 1983). The production of disease-
free seed is seen as an important strategy in Pakistan,
102 Eur J Plant Pathol (2007) 119:99–110
123
in areas free from A. rabiei infection (Mitsueda et al.
1997). The use of disease-free seed is crucial for
susceptible chickpea cultivars as seedling foci rapidly
develop into epidemics in conditions conducive to
disease development (Kimber et al. 2007). The rapid
spread of ascochyta blight from primary infections in
susceptible chickpea cultivars led to the development
of a more rigorous PCR-based seed test in Australia.
The original seed test (400 seeds on culture medium)
was based on a procedure recommended by the
International Seed Testing Association (ISTA 1996)
and was able to detect as low as 0.25% infection
levels. However, even lower levels of infected seed
(0.01–0.1%) are sufficient to initiate epidemics when
weather conditions are favourable (Kaiser 1992;
Kimber et al. 2007). The PCR test uses DNA primers
specific to A. rabiei, based on sequencing of the
internal transcribed spacer region of the ribosomal
gene complex. This test can detect DNA from 10
spores in a PCR reaction (Ophel-Keller et al. 1999).
Comparisons between the PCR test, which uses 1,000
seed samples, and the plating test, were conducted on
50 seed lots. The PCR test was positive in all 13 cases
where the plating test was positive, but it also
detected a further 10 cases of A. rabiei infection in
samples not detected by the plating technique. Some
of these 10 cases were associated with severe
ascochyta epidemics, where PCR testing was
conducted post-sowing (Ophel-Keller et al. 1999),
emphasising the need for the more sensitive proce-
dure. Testing revealed that the majority of seed lots in
Australia were infected and, in the absence of locally
adapted resistant cultivars, the industry rapidly
declined in regions conducive to ascochyta
epidemics.
The majority of research on ascochyta control in
lentil has concentrated on seed treatments and
resistant cultivars. In Canada and Australia, strin-
gent seed standards are recommended for lentil.
Seed transmission rates in this crop appear to be
low (Ahmed and Beniwal 1998) especially in dry
soils of more than 158C, but higher in wet soils at
88C (Gossen and Morrall 1986). Western Canadian
farmers plant ascochyta-infected lentils but levels
below 5% seldom cause epidemics (Morrall 1992;
Morrall and Sheppard 1981); however in areas
of higher rainfall that promote epidemics, patho-
gen-free seed should be used (Morrall and Bedi
1990).
Infected seed is considered a major source of
inoculum for A. fabae in the UK (Hewett 1973), Iraq
(Michail et al. 1983) and New Zealand (Gaunt and
Liew 1981). Transmission rate was estimated at 1–
3% in Canada (Wallen and Galway 1977), and 4–8%
in the UK (Hewett 1973). In the latter country, seed
with more than 3% infection is discarded, and 1–3%
infection is treated with a seed dressing (Jellis et al.
1998). There are varying reports on the importance of
A. fabae seed infection in western Canada. Wallen
and Galway (1977) found that after sowing seed with
13% infection, only 1% of harvested seed was
infected. However, other studies in western Canada
found that 1–5% seed infection could result in 27–
35% infection on harvested seed (Bernier 1980;
Kharbanda and Bernier 1979). Differences are likely
to be due to environmental seasonal effects. In New
Zealand, a significant yield reduction of 44% was
observed due to disease that developed from seed
with 12% initial infection. Infected seed affects plant
establishment and disease incidence (Gaunt and Liew
1981). Control strategies were recommended for seed
production crops including seed testing, a seed
treatment of benomyl and captan, followed by a
foliar spray of chlorothalonil during podding to
prevent seed infection (Gaunt and Liew 1981;
Hampton 1980).
Several studies have found no correlation between
the level of M. pinodes seed infection in field pea and
the severity of ascochyta on subsequent foliage
(Bretag et al. 1995; Moussart et al. 1998; Xue et al.
1996; Xue 2000). Moussart et al. (1998) concluded
that while M. pinodes seed infection resulted in
disease at the basal parts of the plant as a foot rot
symptom, no aerial symptoms were seen and so seed
was not regarded as a source of contamination in the
epidemiology of the disease. Xue (2000) found a high
seed to seedling transmission of M. pinodes (70–
100%), also leading to foot rot as well as reduced
emergence, yield and seed weight. Seed to seedling
transmission rate varies depending on environmental
conditions (Bretag et al. 1995; Xue 2000) in that in
drier regions transmission is of minor concern
(Bretag et al. 1995). Seed infection levels >10%
significantly reduce emergence (Bretag et al. 1995;
Wallen et al. 1967; Xue 2000) but a higher seeding
rate can compensate for this loss (Bretag et al. 1995).
However, seed infection is important in areas where
pea is seldom grown since it introduces the disease to
Eur J Plant Pathol (2007) 119:99–110 103
123
new areas. Seed infection can be reduced by avoiding
seed lots produced from crops with high levels of
ascochyta blight, such as early-sown crops, and
avoiding late-harvested crops in which the disease
has had more time to develop and infect seeds
(Bretag et al. 1995).
Fungicidal seed treatments
Seed treatments reduce but do not completely inhibit
the transfer of the pathogen to seedlings (Bernier
1980; Kaiser and Hannan 1987, 1988; Demirci et al.
2003). Nevertheless these treatments play an impor-
tant role in reducing disease, particularly when
combined with seed testing to minimise early estab-
lishment of the pathogens. Benomyl, carbendazim,
chlorothalonil, thiabendazole, thiram and mixtures of
these were effective in reducing seed to seedling
transmission in pulse crops (Ahmed and Beniwal
1998; Grewal 1982; Kaiser et al. 1973; Kaiser and
Hannan 1988; Kimber and Ramsey 2001; Reddy and
Kababeh 1984; Rahat et al. 1993). Seed treatments
are particularly beneficial for ascochyta control on
chickpea and lentil.
Gan et al. (2005) summarised the physical and
chemical methods that have been used to treat
chickpea seed for A. rabiei infection. Excellent
control, whereby the fungus was eradicated in
laboratory tests and reduced infection to a minimum
in field trials, was achieved using benomyl plus
thiram, maneb, thiabendazole, or tridemorph plus
maneb. Kaiser and Hannan (1988) and Maden (1983)
found that benomyl and thiabendazole were the most
effective of the fungicides tested and reduced seed
infection on A. rabiei from 45% incidence to 0%. In
laboratory conditions, thiram plus thiabendazole and
carboxim plus thiabendazole reduced seed infection
from an initial 80% to less than 5% (Kimber and
Ramsey 2001).
Thiabendazole and carbendazim or benomyl have
proven to be effective seed treatments on lentil
(Bretag 1989; Kaiser and Hannan 1987). Iqbal et al.
(1992) found that a range of tested fungicides reduced
the recovery of seedborne A. lentis but most effica-
cious were Calixin-M, Benlate and Topsin-M. Lentil
seeds with 81% infection had greater emergence
when treated with thiabendazole or benomyl and
yield was highest in thiabendazole-treated seeds
(Kaiser and Hannan 1987).
A number of studies found that the benefits of
using seed treatments to control ascochyta infection
on faba bean and field pea are inconclusive, possibly
because airborne inoculum has a greater influence on
the ascochyta diseases on these crops, than does seed-
borne inoculum. While a range of fungicides are
effective at reducing seed-borne inoculum in labora-
tory assays on both field pea and faba bean (Karbanda
and Bernier 1979; Wallen et al. 1967) the treatments
have not shown a consistent reduction in plant
infection (Karbanda and Bernier 1979; Michail
et al. 1983; Thomas et al. 1989; Wallen et al. 1967)
or any difference in emergence, disease severity or
yield (Walsh et al. 1989). Thiram can increase
emergence of infected field pea (Xue 2000) and a
mixture of thiram and thiabendazole reduced asco-
chyta levels in pea at early growth stages (Davidson,
unpublished data), but by flowering there was no
effective disease control or yield gain at harvest
(Davidson, unpublished data; Xue 2000). Conversely,
Bretag (1985) demonstrated a small yield gain
associated with thiabendazole seed treatment on field
pea brought about by reducing the severity of
ascochyta blight. Thiabendazole seed treatment is
recommended on faba beans but alone does not
provide sufficient protection (Jellis et al. 1998).
Foliar fungicides
A range of broad-spectrum foliar fungicides has been
tested against ascochyta blight with varying results
e.g. Bordeaux mixture, captan, captafol, chlorothalo-
nil, folpet, mancozeb, maneb, metiram, wettable
sulphur, zineb (Nene 1982; Sadkovskaya 1970;
Warkentin et al. 1996, 2000). These are used as
preventative sprays, and need to be applied before
disease becomes established, or before rain events
during which new infections occur. Chlorothalonil is
the most widely used fungicide in ascochyta control
and is the most consistent performer in reducing
ascochyta blight on pulses (Ahmed and Beniwal
1991; Chongo et al. 2003; Gan et al. 2005; Kimber
and Ramsey 2001; McMurray et al. 2006; Shtienberg
et al. 2006). For faba bean, lentil and partially-
resistant chickpea cultivars, foliar sprays of chlorot-
halonil are generally effective when applied at early
flowering to early pod set (Kharbanda and Bernier
1979; Beauchamp et al. 1986a, b; McGrane et al.
104 Eur J Plant Pathol (2007) 119:99–110
123
1989; Ahmed and Beniwal 1991). At lower rainfall
sites, a single spray during podding may be sufficient
to protect against yield loss, reflecting the importance
of the environment on epidemiology and disease
spread (Beauchamp et al. 1986b). In Australian lentil
crops, chlorothalonil or mancozeb are recommended
during podding only if the disease is present and
conditions are conducive to infection (Lindbeck et al.
2002). Chlorothalonil is applied to faba bean six
weeks after sowing in Australia (Hawthorne et al.
2004) to protect against ascospore showers released
from neighbouring infested residue (Galloway and
MacLeod 2003). Follow-up sprays are applied during
flowering and podding if disease is evident and
conditions are conducive to disease (Hawthorne et al.
2004). The poor economics of foliar fungicides on
field pea usually excludes this practice from com-
mercial cropping.
Some systemic fungicides are also effective e.g.
azoxystrobin, benomyl, carbendazim, thiabendazole
and tebuconazole (Chongo et al. 2003; Demirci et al.
2003; Shtienberg et al. 2000; Thomas and Sweet
1989; Warkentin et al. 1996). These have the added
advantage that they may be applied post-infection, or
post rain event, though such applications may have
the added complexity of conditions being unsuitable
for ground-rig equipment. These fungicides penetrate
the host tissue and possess post-infection properties,
which enable them to be applied in the three days
after infection has occurred (Shtienberg et al. 2000).
Application of systemic fungicides post-infection
allows for flexibility in management and reduces
fungicide applications to real infection events rather
than forecast events as with protective fungicides.
The disease pressure, environmental conditions
and coverage achieved by the application, influence
the efficacy of foliar fungicides. Foliar fungicides
used on susceptible chickpea cultivars in many parts
of the world (summarised in Gan et al. 2005) show
that even with multiple applications, ascochyta might
not be controlled under epidemic situations (Reddy
and Singh 1992; Shtienberg et al. 2000). In Canada
and Australia, in the presence of A. rabiei, the
production of chickpea is rarely successful when
highly susceptible cultivars are grown, despite multi-
ple fungicide applications (Bretag et al. 2003;
Chongo et al. 2003; Kimber and Ramsey 2001).
Even under moderate disease pressure, four to six
sprays became necessary to significantly reduce
disease. Only under dry conditions could fungicide
applications be reduced (Chongo et al. 2003). In
susceptible chickpea cultivars fungicides are gener-
ally uneconomic and impractical (Nene and Reddy
1987) and the rate of disease spread makes it difficult
to follow an application schedule.
Preventative sprays are more effective when
applied ahead of rain events during which infection
occurs. The efficacy of chlorothalonil and mancozeb
in Australian chickpea fungicide trials was reduced
when the fungicide was not applied in time to protect
crops from a rain event (Shtienberg et al. 2006).
Analysis of the time of spraying in relation to rain
events identified that disease was suppressed when
fungicides were applied in time to protect plants from
infection, but if plants were not protected during rain
events, then control efficacy was low. The coinci-
dence between control efficacy and uncontrolled rain
was high i.e. P < 0.01, R2 = 0.937 (Shtienberg et al.
2006). Management practices take this into account
by encouraging continuous sprays of chlorothalonil
every three weeks during the growing season. Sim-
ulated analysis of the trial data indicated that rain
forecasting, to time fungicide sprays with rain fronts,
could reduce the number of applications needed to
control the epidemic. Initiating sprays after the
presence of disease was confirmed, further reduced
the number of sprays required for effective disease
control.
Foliar fungicides on field pea have generally been
uneconomic despite the reduction in disease and
associated yield increases. Highly susceptible
cultivars responded more to the fungicides than
moderately susceptible cultivars (Warkentin et al.
2000), but even in these crops little spraying of field
pea is conducted since multiple applications may be
required to achieve significant disease suppression.
Multiple sprays, initiated at early to mid-flowering
provided some disease control and yield gains
(Warkentin et al. 1996; Warkentin et al. 2000). A
single application of mancozeb or chlorothalonil at
early flowering also increased yields while a single
late flowering application generally had no impact
(Warkentin et al. 2000). Fungicide trials were con-
ducted in Australia (Davidson, unpublished data)
using mancozeb at 6, 9 and 12 weeks after sowing.
Neither mancozeb nor chlorothalonil effectively
controlled the disease and there were no yield gains
in these trials. As breeding programmes develop
Eur J Plant Pathol (2007) 119:99–110 105
123
higher yielding cultivars, or the economic returns for
pea increase, the financial benefit of applying foliar
fungicides to field pea may also improve.
Strategic application of fungicides taking into
account host resistance
Ascochyta resistance is a major priority in pulse
breeding programmes around the world. No cultivars
from these programmes have complete resistance, or
immunity, to ascochyta due to the complexity of the
host–pathogen relationship, but a number of cultivars
exhibit partial resistance.
Ascochyta-susceptible pulse cultivars have been
reliant on foliar fungicides but integrating enhanced
resistance combined with clean seed and wide
rotations has reduced foliar sprays and enabled the
use of earlier sowing dates to maximise yield.
Furthermore the lower input costs associated with
reduced fungicide usage has greatly improved the
economics of growing these crops. In Australia, foliar
fungicides for ascochyta control in lentil crops are
applied only at the podding stage since most Austra-
lian cultivars have foliar resistance to this disease
(Lindbeck et al. 2002).
Partial resistance in chickpea is essential for the
success of this crop in many parts of the world though
the resistance can still be overcome in regions that
have moderate to high inoculum pressure and weather
conditions favourable to epidemics (Chongo et al.
2003). Two to four applications of chlorothalonil or
azoxystrobin at early and mid-flowering are required
under high disease pressure on partially resistant
cultivars (Bernier 1980, Chongo et al. 2003; Khar-
banda and Bernier 1979; Reddy and Singh 1992). In
dry seasons a single spray on a moderately resistant
cultivar may be sufficient (Pande et al. 2005). In
some cases fungicide applications during podding are
maintained to prevent pod infection, seed abortion or
seed infection (Hawthorne et al. 2004) since resis-
tance in chickpea is not as effective at flowering and
podding (Chongo and Gossen 2001; Singh and Reddy
1993). Fungicide strategies differ according to culti-
var resistance (Shtienberg et al. 2000) and the control
efficacy of fungicides and effectiveness of genetic
resistance vary according to seasonal conditions.
When environmental conditions support severe epi-
demics, foliar fungicides may provide <20% control
efficacy on susceptible and moderately susceptible
cultivars, but as much as 70% control efficacy on
moderately resistant cultivars. In mild epidemics
>80% control efficacy is achieved on susceptible
cultivars, and >95% on moderately susceptible and
moderately resistant cultivars (Shtienberg et al.
2000).
Decision support systems
An understanding of the pathosystems and the inter-
relationship between host, pathogen and the environ-
ment is essential to be able to make correct fungicide
and agronomic decisions for disease control. Some
studies have been undertaken to develop decision
support tools to assist growers in making these
decisions.
Jhorar et al. (1997) studied weather data over a
27-year period in association with ascochyta blight of
chickpea. Weekly averages of temperature, relative
humidity (RH), sunshine duration, and total weekly
rainfall and raindays were calculated for the period of
vegetative growth to maturity. Disease at time of
maturity was correlated with each of these
parameters. A ratio of afternoon RH and maximum
temperature was calculated to produce a parameter
termed the humid thermal ratio and this was highly
correlated with disease, R2 = 0.90. This parameter
was suggested as a useful model for disease predic-
tion for fungicide applications.
In Israel, a predictive model determined that
pseudothecial maturation and ascospore discharge
of A. rabiei occurs after six rain events of equal to or
>10 mm (Shtienberg et al. 2005). Fungicide applica-
tions at this time target the primary inoculum of
ascospores and should prevent the infection of new
crops and possibly the necessity of further fungicide
applications in the crop. Subsequent sprays are
initiated by monitoring, beginning when ascochyta
is first observed in the crop, and are linked to
forecasted rain thresholds for different cultivar resis-
tances i.e. 5 mm for highly susceptible cultivars,
10 mm for moderately susceptible, 20 mm for
moderately resistant, and 50 mm for resistant culti-
vars (Shtienberg et al. 2000).
A modelling system for ascochyta in field pea was
developed by Salam et al. (2006) to predict time of
onset, and progression of ascospore maturity and
106 Eur J Plant Pathol (2007) 119:99–110
123
spread of spores from the source of infection of M.
pinodes. This model incorporates effects of rain,
temperature and wind on fungal maturation, spore
release and spore dispersal. The model Blackspot
Manager helps growers to make decisions on when to
sow their crop, by using year to date weather data and
forward projection of historical data, to predict the
likely ascospore load at a particular time of the year.
The model also assists growers to select the best
fields for field pea location to minimise the risk of
ascochyta blight for several years in advance.
In the absence of effective resistance or economic
fungicides, agronomic measures must be used to
make decisions for ascochyta control in field pea.
Multiple regression analysis of disease severity,
cropping practices (i.e. sowing date, pea rotation
history, proximity to infested residue) and environ-
mental data, including cumulative rainfall and mean
temperature, were used to predict ascochyta blight
severity in field pea in South Australian cropping
systems (Schoeny et al. 2003). The model is aimed at
assisting growers to make informed decisions regard-
ing rotations of pea crops and sowing date to
minimise ascochyta.
Conclusion
Management of ascochyta is an essential component
of successfully growing pulse crops. Where possible,
moderately resistant cultivars should be grown but
growers will select cultivars depending on yield, seed
quality and marketability, not just on ascochyta
resistance. Hence cultivars with different levels of
ascochyta resistance will be grown and must be
managed accordingly.
Integrated disease management includes a combi-
nation of cultivar resistance, seed and crop hygiene,
seed and foliar fungicides and appropriate sowing
dates. Selecting the most effective strategies can be
difficult due to the complexity of the pathosystems
and the inter-relationship with resistance and the
environment. Decision support tools are in their
infancy and rely on a good understanding of the
epidemiology of the pathogens and the influence of
the environment on the development and spread of
the disease. As more research is conducted these tools
will become more specific to crops, diseases and
regions, enabling a good understanding of the forces
that drive an epidemic. The challenge will then be to
translate this information into a form that is under-
standable and useable by the grower to make
agronomic and disease management decisions that
are cost-effective and beneficial to yield and finances.
References
Ahmed, S., & Beniwal, S. P. S. (1991). Ascochyta blight of
lentil and its control in Ethiopia. Tropical Pest Manage-ment, 37, 368–373.
Ahmed, S., & Beniwal, S. P. S. (1998). Survival of Ascohytafabae f.sp. lentis on infected lentil seeds. LENS Newslet-ter, 25, 71–74.
Ali, S. M., Paterson, J., & Crosy, J. (1982). A standard
technique for detecting seed-borne pathogens in peas,
chemical control and testing commercial seed in South
Australia. Australian Journal of Agricultural Research,29, 841–849.
Beauchamp, C. J., Morrall, R. A. A., & Slinkard, A. E. (1986a).
The potential for control of ascochyta blight of lentil with
foliar applied fungicides. Canadian Journal of PlantPathology, 8, 254–259.
Beauchamp, C. J., Morrall, R. A. A., & Slinkard, A. E.
(1986b). Effects of scheduling applications of benomyl,
captafol and chlorothalonil on ascochyta blight of lentil.
Canadian Journal of Plant Pathology, 8, 260–268.
Bernier, C. C. (1980). Fungicidal control of Ascochyta blight
of faba beans. FABIS Newsletter, 2, 43.
Bond, D. A., & Pope, M. (1980). Ascochyta fabae on winter
beans (Vicia faba): pathogen spread and variation in host
resistance. Plant Pathology, 29, 59–65.
Bretag, T. W. (1985). Chemical control of Ascochyta blight of
field peas. Australasian Plant Pathology, 14, 42–43.
Bretag, T. W. (1989). Evaluation of fungicides for the control
of Ascochyta blight in lentils. Annals of Applied Biology114 (Suppl). Tests of Agrochemicals and Cultivars, 10,
44–45.
Bretag, T. W. (1991). Epidemiology and control of ascochyta
blight of field peas. PhD. Thesis, La Trobe University.
Bretag, T. W., Keane, P. J., & Price, T. V. (2000). Effect of
sowing date on the severity of ascochyta blight in field
peas (Pisum sativum L.). grown in the Wimmera region of
Victoria. Australian Journal of Experimental Agriculture,40, 1113–1119.
Bretag, T. W., Keane, P. J., & Price, T. V. (2006). The epi-
demiology and control of ascochyta blight in field peas: A
review. Australian Journal of Agricultural Research, 57,
883–902.
Bretag, T. W., Price, T. V., & Keane, P. J. (1995). Importance
of seed-borne inoculum in the etiology of the ascochyta
blight complex of field peas (Pisum sativum). grown in
Victoria. Australian Journal of Experimental Agriculture,35, 525–530.
Bretag, T. W., Meredith, K. A., Knights, E., & Materne, M. A.,
(2003). Control of ascochyta blight in chickpeas using
disease resistance and foliar fungicides. In: Proceedingsof the 8th International Congress of Plant Pathology(p. 291) 2–7 February, Christchurch, New Zealand.
Eur J Plant Pathol (2007) 119:99–110 107
123
Bretag, T. W., Smith, L. M., & Ward, D. J. (2001). Effect of
soil-borne ascochyta blight fungi on the grain yield of
field peas. Tenth Australian Agronomy Conference, 29
January–1st February, Hobart, Tasmania (http://www.re-
gional.org.au/au/asa/2001/).
Carter, M. V., & Moller, W. J. (1961). Factors affecting the
survival and dissemination of Mycosphaerella pinodes(Berk. & Blox.). Vestrgr. in South Australian irrigated pea
fields. Australian Journal of Agricultural Research, 12,
879–888.
Chongo, G., Buchwaldt, L., Gossen, B. D., Lafond, G. P., May,
M. E., Johnson, E. N., & Hogg, T (2003). Foliar fungi-
cides to manage ascochyta blight (Ascochyta rabiei) of
chickpea in Canada. Canadian Journal of Plant Pathol-ogy, 25, 135–142.
Chongo, G., & Gossen, B. D. (2001). Effects of plant age on
resistance to Ascochyta rabiei in chickpea. CanadianJournal of Plant Pathology, 23, 358–363.
Cother, E. J. (1977a). Isolation of important pathogenic fungi
from seeds of Cicer arietinum. Seed Science and Tech-nology, 5, 593–597.
Cother, E. J. (1977b). Identification and control of root-rot
fungi in Cicer arietinum (chickpea). Plant DiseaseReporter, 61, 736–740.
Davidson, J. A., Kimber, R. B. E., & Wilmshurst, C. W.
(2006). Aerial dispersal of ascochyta spores from infested
pea stubble. 1st International Ascochyta Workshop
(p. C-10). 2–6, July, Le Tronchet.
Davidson, J. A., Ophel-Keller, K., Hartley, D., Krysinska-Ka-
czmarek, M., Curran, J., & Ramsey, M. D. (2001).
Monitoring blackspot pathogens in pea cropping soils. In
2nd Australian Soil-borne Disease Symposium (pp. 33–
34) 5–8 March, Lorne, Victoria, Australia.
Davidson, J. A., & Ramsey, M. D. (2000). Pea yield decline
syndrome in South Australia: the role of diseases and the
impact of agronomic practices. Australian Journal ofAgricultural Research, 51, 347–354.
Davidson, J. A., Ramsey, M. D., & Sosnowski, M. R. (1999).
Survival of blackspot pathogens, Mycosphaerella pinodesand Phoma medicaginis var. pinodella, on pea stubble. In
12th Biennial Conference (p. 260), Australasian Plant
Pathology Society, 27–30 September, Canberra, Australia.
Demirci, F., Bayraktar, H., Baballogullu, I., Dolar, F. S., &
Maden, S. (2003). In vitro and in vivo effects of some
fungicides against the chickpea blight pathogen Ascochytarabiei. Journal of Phytopathology, 151, 519–524.
Dickinson, C. H., & Sheridan, J. J. (1968). Studies on the
survival of Mycosphaerella pinodes and Ascochyta pisi.Annals of Applied Biology, 62, 473–483.
Dugan, F. M., Lupien, S. L., Hernandez-Bello, M., Peever, T.
L., & Chen, W. (2005). Fungi resident in chickpea debris
and their suppression of growth and reproduction of
Didymella rabiei under laboratory conditions. Journal ofPhytopathology, 153, 431–439.
Galdames, R., & Mera, M. (2003). First report of Ascochyta
blight of Chickpea caused by Ascochyta rabiei in Chile.
Plant Disease, 87, 603.
Galloway, J., & MacLeod, W. J. (2003). Initiation of ascospore
disease from pulse stubble in the Mediterranean climate
of Western Australia. In: Proceedings of the 8th
International Congress of Plant Pathology (p. 102), 2–7
February, Christchurch, New Zealand.
Gan, Y. T., Siddique, K. H. M., MacLeod, W. J., & Jayakumar,
P. (2005). Management options for minimizing the dam-
age by ascochyta blight (Ascochyta rabiei) in chickpea
(Cicer arietinum L.). Field Crops Research, 97, 121–134.
Gaunt, R. E., & Liew, R. S. S. (1981). Control strategies for
Ascochyta fabae in New Zealand field and broad bean
crops. Seed Science and Technology, 9, 707–715.
Gossen, B. D. (2001). Impact of burial on survival of Asco-chyta lentils in lentil residue. Canadian Journal of PlantPathology, 23, 146–148.
Gossen, B. D., & Derksen, D. A. (2003). Impact of tillage and
crop rotation on ascochyta blight (Ascochtya lentis) of
lentil. Canadian Journal of Plant Science, 83, 411–415.
Gossen, B. D., & Miller, P. R. (2004). Survival of Ascochytarabiei in chickpea residue on the Canadian prairies.
Canadian Journal of Plant Pathology, 26, 142–147.
Gossen, B. D., & Morrall, R. A. A. (1986). Transmission of
Ascochyta lentis from infected lentil seed and plant resi-
due. Canadian Journal of Plant Pathology, 8, 28–32.
Grewal, J. S. (1982). Control of important seed-borne patho-
gens of chickpea. Indian Journal Genetics, 42, 393–398.
Hampton, J. G. (1980). The significance of Ascochyta fabae in
broad beans in Manawatu, and methods for its control.
New Zealand Journal of Experimental Agriculture, 8,
305–308.
Hawthorne, W., Bretag, T. W., Raynes, M., Davidson, J. A.,
Kimber, R. B. E., Nikandrow, A., Matthews, P., & Paull,
J. (2004). Faba bean disease management strategy forsouthern region GRDC. Pulse Australia, Sydney, Austra-
lia: Disease Management Guide Series.
Hare, W. W., & Walker, J. C. (1944). Ascochyta diseases of
canning pea. Agricultural Experiment Station Universityof Wisconsin Research Bulletin, 150, 1–31.
Hewett, P. D. (1973). The field behaviour of seed-borne
Ascochyta fabae and disease control in field beans. Annalsof Applied Biology, 74, 287–295.
Iqbal, S. M., Hussian, S., Tahir, M., & Malik, B. A. (1992).
Effects of fungicidal seed treatment on lentil germination
and recovery of seedborne Ascochyta fabae f.sp. Lentis.
Lens Newsletter, 19, 53–55.
International Seed Testing Association (1996). International
rules for seed testing. Seed Science and Technology, 24,
249.
Jellis G. J., Bond, D. A., & Boulton, R. E. (1998). Diseases of
faba bean. In: D. J. Allen & J. M. Lenne (Eds.), Thepathology of food and pasture legumes (pp. 371–422)
Wallingford, UK: CAB International and ICRISAT.
Jhorar, O. P., Mathauda, S. S., Singh, G., Butler, D. R., &
Mavi, H. S. (1997). Relationships between climatic vari-
ables and Ascochyta blight of chickpea in Punjab, India.
Agricultural and Forest Meterology, 87, 171–177.
Kaiser, W. J. (1973). Factors affecting growth, sporulation,
pathogenicity and survival of Ascochyta rabiei. Mycolo-gia, 65, 444–457.
Kaiser, W. J. (1992). Epidemiology of Ascochyta rabiei. In: K.
B. Singh & M. V. Saxena (Eds.), Disease resistancebreeding in chickpea (pp. 117–134). Syria: ICARDA,
Aleppo.
108 Eur J Plant Pathol (2007) 119:99–110
123
Kaiser, W. J. (1997). Inter- and intranational spread of asco-
chyta pathogens of chickpea, faba bean and lentil.
Canadian Journal of Plant Pathology, 19, 215–224.
Kaiser, W. J., & Hannan, R. M. (1986). Incidence of seedborne
Ascochyta lentis in lentil germplasm. Phytopathology, 76,
355–360.
Kaiser, W. J., & Hannan, R. M. (1987). Seed-treatment fun-
gicides for control of seed-borne Ascochyta lentis on
lentil. Plant Disease, 71, 58–62.
Kaiser, W. J., & Hannan, R. M. (1988). Seed transmission of
Ascochyta rabiei in chickpea and its control by seed-
treatment fungicides. Seed Science and Technology, 16,
625–637.
Kaiser, W. J., & Muehlbauer, F. G. (1984). Occurrence of
Ascochyta rabiei on imported chickpeas in eastern
Washington. Phytopathology, 74, 1139 (Abstract).
Kaiser, W. J., Okhovat, M., & Mossahebi, G. H. (1973). Effect
of seed-treatment fungicides on control of Ascochytarabiei in chickpea seed infected with the pathogen. PlantDisease Reporter, 57, 742–746.
Kaiser, W. J., Ramsey, M. D., Makkouk, K. M., Bretag, T. W.,
Acikgoz, N., Kumar, J., & Nutter, F. W. (2000). Foliar
diseases of cool season food legumes and their control. In:
R. Knight (ed.), Linking research and marketing oppor-tunities for pulses in the 21st century (pp. 437–455).
Proceedings of the Third International Food Legumes
Research Conference. The Netherlands: Kluwer Aca-
demic Publishers.
Kharbanda, P. D., & Bernier, C. C. (1979). Effectiveness of
seed and foliar applications of fungicides to control
ascochyta blight of faba beans. Canadian Journal of PlantScience, 59, 661–666.
Kimber, R. B. E., & Ramsey, M. D. (2001). Using fungicides
to control ascochyta blight of chickpea. In: Proceedings ofthe 13th Biennial Conference of the Australasian PlantPathology Society (p. 199), 24–27 September. Australia:
Cairns.
Kimber, R. B. E., Ramsey, M.. D., & Scott, E. S. (2006).
Factors influencing transmission of Didymella rabiei(ascochyta blight) from inoculated seed of chickpea under
controlled conditions. European Journal of PlantPathology, 114, 175–184.
Kimber, R. B. E., Shtienberg, D., Ramsey, M. D., & Scott, E.
S. (2007). The role of seedling infection in epiphytotics of
ascochyta blight on chickpea. European Journal of PlantPathology, 117, 141–152.
Lindbeck, K. D., Materne, M. A., Davidson, J. A., McMurray,
L., & Panagiotopoulos, K. (2002). Lentil diseasemanagement strategy for southern region GRDC. Pulse
Australia, Sydney, Australia: Disease Management Guide
Series.
Maden, S., Singh, D., Mathur, S. B., & Neergaard, P. (1975).
Detection and locations of seed-borne inoculum of As-cochyta rabiei and its transmission in chickpea (Cicerarietinum). Seed Science and Technology, 3, 667–681.
Maden, S. (1983). Transmission of seed-borne infections of
Ascochyta rabiei (Pass.) Lab. to seedlings and its control.
Journal of Turkish Phytopathology, 12, 77–82.
Materne, M., Bretag, T. W., Nguyen, T., Ford, R., Mah-
mood, N., Brouwer, J. B., & Hamblin, J. (2001) An
integrated strategy for controlling Ascochyta lentis in
lentils in Australia. In Proceedings of 4th EuropeanConference on Grain Legumes (pp. 66–67), 8–12 July.
Poland: Cracow.
McGrane, M., Walsh, E. J., & Bannon, E. (1989). Control of
leaf and pod spot in faba beans. In: Faculty of AgricultureResearch Report 1986–87 (pp. 109–110). Dublin, Ireland:
University College.
McMurray, L., Brand, J., Davidson, J., Hobson, K., & Materne,
M. (2006). Economic chickpea production for southern
Australia through improved cultivars and strategic man-
agement to control ascochyta blight. In: Proceedings of13th Australian Agronomy Conference (p. 65), 10–15
September, Perth, Western Australia.
Michail, S. H., Farhan, M. A., & Husain, S. S. (1983). Sources
of broad bean infection by Ascochyta fabae in Ninevah
province of Iraq. Seed Science and Technology, 11, 393–
402.
Mitsueda, T., Hussain, S., Bashir, M., & Ahmad, Z. (1997).
Introduction to chickpea blight and its control. Islamabad,
Pakistan: Plant Genetic Resources Institute, National
Agricultural Research Centre.
Morrall, R. A. A. (1992). Significance of seed-borne inoculum
of lentil pathogens in western Canada. In: Proceedings of1st European Conference on Grain Legumes (p. 313).
France: Angers.
Morrall, R. A. A. (1997). Evolution of lentil diseases over
25 years in western Canada. Canadian Journal of PlantPathology, 19, 197–207.
Morrall, R. A. A., & Bedi, S. (1990). Effects of planting
infected seed on epidemics of Ascochyta blight of lentil.
Canadian Journal of Plant Pathology, 12, 337
(Abstracts).
Morrall, R. A. A., & McKenzie, D. L. (1974). A note on the
inadvertent introduction to North America of Ascochytarabiei, a destructive pathogen of chickpea. Plant DiseaseReporter, 58, 342–345.
Morrall, R. A. A., & Sheppard, J. W. (1981). Ascochyta blight
of lentils in western Canada: 1978–1980. Canadian PlantDisease Survey, 61, 7–12.
Moussart, A., Tivoli, B., Lemarchand, E., Deneufbourg, F.,
Roi, S., & Sicard, G. (1998). Role of seed infection by the
ascochyta blight pathogen of dried pea (Mycosphaerellapinodes) in seedling emergence, early disease develop-
ment and transmission of the disease to aerial parts.
European Journal of Plant Pathology, 104, 93–102.
Nasir, M., & Bretag, T. W. (1997). Prevalence of Ascochytafabae f. sp. Lentis on lentil seed from Victoria, Australia.
Australasian Plant Pathology, 26, 117–120.
Navas-Cortes, J. A., Trapero-Casas, A., & Jimenez-Diaz, R. M.
(1995). Survival of Didymella rabiei in chickpea straw
debris in Spain. Plant Pathology, 44, 332–339.
Nene, Y. L. (1982). A review of Ascochyta blight of chickpea.
Tropical Pest Management, 28, 61–70.
Nene Y. L., & Reddy M. V. (1987). Chickpea diseases and
their control. In: M. C. Saxena & K. B. Singh (Eds.), TheChickpea (pp. 233–270). Oxford, UK: CAB International.
Ophel-Keller, K., Driver, F., Hartley, D., Dillon, N., Curran, J.,
McKay, A., & Ramsey, M. D. (1999). The use of PCR
systems to detect Ascochyta rabiei in chickpea seed. In: J.
W. Sheppard (Ed.), 3rd ISTA PDC Seed Health Sympo-sium (pp. 16–19). USA: August, Ames, Iowa.
Eur J Plant Pathol (2007) 119:99–110 109
123
Pande, S., Siddique, K. H. M., Kishore, G. K., Bayaa, B., Gaur,
P. M., Gowda, C. L. L., Bretag, T. W., & Crouch, J. H.
(2005). Ascochyta blight of chickpea (Cicer arietinumL.): a review of biology, pathogenicity and disease man-
agement. Australian Journal of Agricultural Research, 56,
317–332.
Rahat, S., Iqbal, S. M., Rauf, C. A., & Hussain, S. (1993).
Efficacy of fungicides against Ascochyta fabae. FABISNewsletter, 33, 20–22.
Reddy, M. V., & Kababeh, S. (1984). Eradication of Ascochytarabiei from chickpea seed with thiabendazole. Interna-tional Chickpea Newsletter, 3, 12.
Reddy, M. V., & Singh, K. B. (1992). Management of Asco-
chyta blight of chickpea through integration of host plant
tolerance and foliar spraying of chlorothalonil. IndianJournal of Plant Protection, 18, 65–69.
Sadkovskaya, L. A. (1970). Use of fungicides with immunizing
action against Ascochyta disease of pea. Khimiya Sel Sko
Khozyaistvo 8, 29–31. (Abstract No. 376 in Review ofApplied Mycology (1971), 50, 69.
Salam, M., Galloway, J., MacLeod, W. J., & Diggle, A. (2006).
Development and use of computer models for managingascochyta diseases in pulses in Western Australia. 1st
International Ascochyta Workshop (p. C-6). July 2–6, Le
Tronchet, France.
Schoeny, A., Truscott, M., McMurray, L., & Davidson, J. A.
(2003). Towards a disease forecast model for the man-
agement of blackspot in field peas in South Australia. In:
Proceedings of the 8th International Congress of PlantPathology (p. 136), 2–7 February 2003, Christchurch,
New Zealand.
Shtienberg, D., Kimber, R. B. E., McMurray, L., & Davidson,
J. A. (2006). Optimisation of the chemical control of as-
cochyta blight in chickpea. Australasian Plant Pathology,35, 715–724.
Shtienberg, D., Vintal, H., Brener, S., & Retig, B. (2000).
Rational management of Didymella rabiei in chickpea by
integration of genotype resistance and post infection
application of fungicides. Phytopathology, 90, 834–842.
Shtienberg, D., Gamliel-Atinksy, E., Retig, B., Brener, S., &
Dinoor, A. (2005). Significance of preventing primary
infections by Didymella rabiei and development of a
model to estimate the maturity of pseudothecia. PlantDisease, 89, 1027–1034.
Singh, K. B., & Reddy, M. V. (1993). Susceptibility of the
chickpea plant to Ascochyta blight at different stages of
crop growth. Phytopathologia Mediterrania, 32, 153–155.
Thomas, J. E., & Sweet, J. B. (1989). Resistance of pea cul-
tivars to soil-borne fungal diseases. Aspects of AppliedBiology, 22, 427–429.
Thomas, J. E., Sweet, J. B., Handley, W. E., & Dodgson, A. J.
(1989). Effects of three fungicides on foliar and seed
infections of peas. Tests of Agrochemicals and Cultivars10: Annals of Applied Biology, 114, 58–59 (Supplement).
Trapero-Casas, A., Navas-Cortes, J. A., & Jimenez-Diaz, R. M.
(1996). Airborne ascospores of Didymella rabiei as a
major primary inoculum for ascochyta blight epidemics in
chickpea crops in southern Spain. European Journal ofPlant Pathology, 102, 237–245.
Wallen, V. R., Cuddy, T. F., & Grainger, P. N. (1967). Epi-
demiology and control of Ascochyta pinodes on field peas
in Canada. Canadian Journal of Plant Science, 47, 395–
403.
Wallen, V. R., & Galway, D. A. (1977). Studies on the biology
and control of Ascochyta fabae on faba bean. CanadianPlant Disease Survey, 57, 31–35.
Wallen, V. R., & Jeun, J. (1968). Factors limiting the survival
of Ascochyta spp. of peas in soil. Canadian Journal ofBotany, 46, 1279–1286.
Walsh, E. J., Bannon, E., & McGrane, M. (1989). Seed
dressings for ascochyta control in faba beans. Faculty of
Agriculture Research Report 1986–87 (p. 110). Dublin,
Ireland: University College.
Warkentin, T. D., Rashid, K. Y., & Xue, A. G. (1996). Fun-
gicidal control of Ascochyta blight of field pea. CanadianJournal of Plant Science, 76, 67–71.
Warkentin, T. D., Xue, A. G., & McAndrew, D. W. (2000).
Effect of mancozeb on the control of Mycosphaerella
blight of field pea. Canadian Journal of Plant Science, 80,
403–406.
Xue, A. G., Warkentin, T. D., Greeniaus, M. T., & Zimmer, R.
C. (1996). Genotypic variability in seedborne infection of
field pea by Mycosphaerella pinodes and its relation to
foliar disease severity. Canadian Journal of PlantPathology, 18, 370–374.
Xue, A. G. (2000). Effect of seed-borne Mycosphaerella pin-odes and seed treatments on emergence, foot rot severity,
and yield of field pea. Canadian Journal of PlantPathology, 22, 248–253.
Zhang, J. X., Xue, A. G., & Fernando, W. G. D. (2005). Effect
of residue type and burial depth on survival of Mycosp-haerella pinodes in Manitoba. Canadian Journal of PlantPathology, 27, 132–136.
110 Eur J Plant Pathol (2007) 119:99–110
123
REVIEW
The sympatric Ascochyta pathosystems of Near Easternlegumes, a key for better understanding of pathogenbiology
S. Abbo Æ O. Frenkel Æ A. Sherman ÆD. Shtienberg
Received: 16 October 2006 / Accepted: 23 February 2007 / Published online: 22 March 2007� KNPV 2007
Abstract The primary and secondary centres of
origin of domesticated plants are often also the
places of origin of their pathogens. Therefore, the
Near Eastern cradle of agriculture, where crop
plants, their wild progenitors, and other con-
generic taxa grow sympatrically, may hold some
clues on the biology of the pathogens of the
respective crops. Unlike the situation in the well-
studied Near Eastern cereals and their important
diseases, hardly any data are available on basic
questions regarding grain legumes. What is the
role of genetic diversity at resistance loci of
the wild hosts and is it greater compared with the
cultigens? Are populations of Ascochyta patho-
gens infecting wild legumes genetically distinct
from populations infecting their domesticated
counterparts, and if so, is this differentiation
related to differences in host specialization or to
adaptation to different ecological conditions? Do
isolates originating from wild taxa exhibit a
similar level of aggressiveness and have different
aggressiveness alleles compared with those orig-
inating from domesticated grain legumes? In this
review we propose an experimental framework
aimed at gaining answers to some of the above
questions. The proposed approach includes com-
parative epidemiology of wild vs. domesticated
plant communities, co-evolutionary study of
pathogens and their hosts, phenotypic and genetic
characterization of fungal isolates from wild and
domesticated origins, and genetic analyses of
pathogenicity and parasitic fitness among progeny
derived from crosses between isolates from wild
and domesticated hosts.
Keywords Ascochyta pathogens � Grain
legumes � Wild hosts
Introduction
Plant pathogens are a major evolutionary force
operating in natural ecosystems and in domesti-
cated plant communities (Burdon 1987). In nat-
ural ecosystems, both hosts and their pathogens
survive but the situation hardly takes the form of
an epidemic. Hence, it has long been recognized
that the severe epidemics that devastate crop
S. Abbo (&) � O. FrenkelThe Levi Eshkol School of Agriculture, The HebrewUniversity of Jerusalem, Rehovot 76100, Israele-mail: [email protected]
O. Frenkel � A. ShermanGenomics Department, the Volcani Center,Agricultural Research Organization, Bet Dagan50250, Israel
D. ShtienbergDepartment of Plant Pathology and Weed Research,the Volcani Center, Agricultural ResearchOrganization, Bet Dagan 50250, Israel
123
Eur J Plant Pathol (2007) 119:111–118
DOI 10.1007/s10658-007-9116-x
plants are largely artefacts of cultivation and a
result of co-evolution under domestication (Har-
lan 1976; Burdon 1987). Therefore, gaining better
understanding of host–pathogen interaction in its
natural state may improve our understanding of
the situation in man-made habitats.
The primary and secondary centres of origin of
cultivated plants are often also the places of
origin of their pathogens (Leppik 1970).
Therefore, the Near Eastern cradle of agriculture
(Lev-Yadun et al. 2000), where the wild progen-
itors of the Near Eastern crops and their
con-generic taxa co-exist in natural plant forma-
tions, may hold some clues on the biology of the
pathogens of the respective crops. Near Eastern
farming began with the adoption of a small
number of crop plants (Zohary and Hopf 2000).
This ‘Founder Crops’ package included einkorn
wheat, emmer wheat, barley, lentil, pea, chickpea,
bitter vetch, and flax (Zohary and Hopf 2000). At
a later stage, additional plants were added to this
package including clovers, vetches, medics, fruit
trees and vegetables. The farming-based economy
spread from the Near East into Europe, Central
and East Asia, North and East Africa, and in
recent times also into the New World (Diamond
1997). Naturally, wherever the ecological condi-
tions allow, the pathogens of the respective crop
plants followed suit. For example, Ascochyta
blight pathogens were detected both in the USA
and Australia a few years after large scale
production of chickpea and lentils was established
in these countries and are now considered a major
agronomic problem (e.g., Kaiser 1997).
Unlike the situation described above for the
USA or Australia, domesticated crop plants grow
sympatrically with their wild relatives in the east
Mediterranean, (Harlan and Zohary 1966; Zoh-
ary 1973). Whenever crop plants grow adjacent to
natural ecosystems harbouring stands of wild
forms, gene flow between the cultigens and their
wild relatives is possible. Indeed, many such
examples were described, e.g., for beans in
Mexico (Zizumbo-Villarreal et al. 2005), sor-
ghum in Israel and rice in India (Abbo and
Rubin 2000). In theory, similar processes can
occur between the pathogen populations that
exist in such sympatric cropping systems. How-
ever, to the best of our knowledge, despite old
reports that Ascochyta pathogens occur on wild
legumes in Israel (e.g., Barash 1960), the genetic
affinities between the Ascochyta pathogens of the
Near Eastern legumes and their relatives infect-
ing the wild forms were hardly studied. In this
review we address the Cicer/Ascochyta blight
system in wild and in man-made ecosystems
(cultivation) as a test case for other Ascochyta
pathosystems and flag knowledge gaps relevant
for better understanding of the underlying host–
pathogen interaction.
Evolutionary, agronomic and ecological
considerations
Wheat, barley, pea, lentil and flax spread in pre-
historic times around the Mediterranean and into
the temperate regions of Europe (Zohary and
Hopf 2000). Chickpea, however, took a different
pattern compared with the spread of the other
Founder Crops and spread across the Mediterra-
nean, but mainly to the south and south-east.
Chickpea became a major crop in East Africa and
India, mainly as a post-rainy season crop (Ladi-
zinsky 1995) but not in the wheat-based temper-
ate systems of Europe (Ladizinsky 1995; Kumar
and Abbo 2001). All Founder Crops species
except chickpea have retained their autumnal
germination—summer maturation cycle, while
across the Near East, traditionally, chickpea is a
spring-sown crop (Kumar and Abbo 2001). It was
suggested that this crop cycle change from
autumn to spring sowing was driven by the
extreme vulnerability of chickpea to Ascochyta
blight during the rainy season (Abbo et al. 2003).
Ascochyta blight is a fungal disease caused by
Didymella rabiei (anamorph: Ascochyta rabiei). It
is one of the most important diseases of chickpea
worldwide (Nene 1982; Nene and Reddy 1987;
Akem 1999) affecting all above ground parts of
the plants. Under environmental conditions that
favour development of the pathogen, the disease
is devastating. Crops are destroyed and yield
losses reach 100% (Nene 1984; Akem 1999). Like
many other pycnidial fungi, the pathogen spreads
during the growing season mainly by rain-splash
of pycnidiospores (Nene 1984; Fitt et al. 1989).
Although temperature and wind influence disease
112 Eur J Plant Pathol (2007) 119:111–118
123
development and spread, rainfall is the environ-
mental parameter governing Ascochyta blight
epidemics and the disease develops whenever
there are rains during the cropping season (Nene
and Reddy 1987; Reddy et al. 1990; Diekmann
1992; Akem 1999).
Lentil and pea, two other grain legumes of Near
Eastern origin, are also infected by Ascochyta
blights. In lentil, the causal agent is A. lentis
(Kaiser et al. 1997). In pea, the disease is incited by
a complex of three pathogens: A. pisi, which causes
leaf and pod spots; A. pinodes, the conidial state of
Mycosphaerella pinodes, which causes blight; and
Phoma pinodella (Syn. Ascochyta pinodella),
which causes foot rot (Ali et al. 1994). Interest-
ingly, Ascochyta blight did not preclude winter
sowing of pea or lentil. One possible explanation is
the difference in the influence of the disease on
these crops. Whereas severe Ascochyta blight
epidemics in chickpea are devastating, effects of
the disease in lentil and pea are less conspicuous.
Although substantial yield losses may occur in pea
and lentil, complete destruction of the plants is
uncommon even under severe epidemics (Gossen
and Morrall 1983; Bayaa et al. 1992; Ali et al.
1994; Tivoli et al. 1996; Morrall 1997).
Is the difference between the aggressiveness/
virulence of the chickpea Ascochyta pathogen
and those of lentil and pea related to the different
cropping practices? Study of the wild barley/
powdery mildew system in Israel demonstrated
that higher aggressiveness and wider virulence
range are common in sites where the climatic
conditions are unfavourable for the pathogen
(Dinoor and Eshed 1987). Likewise, the summer
cropping system of chickpea is less favourable to
the Ascochyta pathogen than the winter cropping
of lentil and pea or the autumn–winter develop-
ment of wild Cicer to their respective Ascochyta
pathogens. Could this be the reason for the
extreme aggressiveness of Ascochyta in domesti-
cated chickpea fields? Will lower aggressiveness
be found in wild populations similar to the above?
Contrary to the well-documented situation in the
cereals and many of their pathogens (e.g., Dinoor
1974; Dinoor and Eshed 1984; Dinoor et al. 1991),
hardly any information is available on the role of
fungal pathogens in populations of wild relatives
of Near Eastern legumes. Specifically, regarding
chickpea, up to date, the only published report of
D. rabiei from wild Cicer was from the perennial
C. montbretti in Bulgaria (Kaiser et al. 1998).
Recently however, Frenkel et al. (2007) de-
scribed the isolation of two Ascochyta pathogens
from C. judaicum, an annual wild relative of
domesticated chickpea native to Israel, Jordan
and neighbouring countries. The pathogens,
D. rabiei and P. pinodella, were identified mor-
phologically and the DNA sequences of the
rDNA intergenic regions were used to verify the
morphological identification according to their
similarity with published sequence information
(Frenkel et al. 2007). The infectivity of the
isolates obtained from the wild was verified by
following Koch’s postulates. Didymella rabiei
isolates from wild C. judaicum were capable of
infecting a number of annual Cicer species
including domesticated chickpea, its wild progen-
itor C. reticulatum, and C. bijugum from Turkey.
Disease severity caused by isolates from C. juda-
icum was greater on the wild hosts compared with
the domesticated host. Similarly, using isolates
originating from domesticated fields resulted in
higher disease severity on domesticated cultivars
compared with wild C. judaicum accessions
(Frenkel et al. 2007). Although P. pinodella is
not the focus of this review, it is interesting to
note that this pathogen, which is one of the fungi
that compose the Ascochyta complex of pea, also
attacks C. judaicum. Phoma pinodella isolates
from C. judaicum were able to infect both wild
and domesticated peas (Pisum sativum and
P. fulvum, respectively). In the studied ecosys-
tems, wild chickpea grow side by side with wild
pea species, and both are within meters from
farmland where archaeological remains testify for
millennia of cultivation (Frenkel et al. 2007).
Such sympatric cropping (and patho-systems)
may provide better understanding of the biology
of the pathogens and their interaction with wild
and domesticated hosts.
Important knowledge gaps
A number of questions emerge from the above
description. What is the role of genetic diversity
at resistance loci of the wild hosts and is it greater
Eur J Plant Pathol (2007) 119:111–118 113
123
compared with the cultigen? Do natural and
agricultural ecosystems function as independent
pathosystems? Specifically, are populations of
D. rabiei infecting wild Cicer genetically distinct
from populations infecting domesticated chick-
pea, and if so, is this differentiation related to
differences in host specialization or to adaptation
to different ecological conditions? Do isolates
sampled from wild Cicer exhibit a similar level of
aggressiveness and have different aggressiveness
alleles compared with those sampled from domes-
ticated chickpea? And last but not least, can we
use gene diversity measures of the pathogen to
infer about its origin and past and recent
migration patterns?
Proposed framework for progress and bearing for
resistance breeding
Clarifying the unresolved issues above, and
answering the relevant research questions, require
extensive multi disciplinary experimental work.
Comparative epidemiology
Modelling approaches are often used to elucidate
the influence of environmental parameters on
epidemic outbreaks. This was done in domesti-
cated chickpea (e.g., Jhorar et al. 1997), but not in
wild Cicer populations. Wild Cicer populations
differ from domesticated plant communities in
terms of their physical structure and genetic
constitution. Therefore, disease prevalence,
spread and development in time and space in
the wild are likely to be different from those
occurring in farmers’ fields. Application of mod-
elling approaches will enable quantification of the
association between climatic parameters and
disease development characteristics in wild pop-
ulations. This in turn will point to the differences,
if such occur, between the selection pressures
operating on the pathogens and their hosts, in
natural vs. man-made agro-systems.
Phenotypic and genetic characterization of
hosts and pathogens
The different seasonality of wild vs. domesticated
chickpea may suggest that pathogen populations
parasitizing wild chickpea have different ecolog-
ical requirements than those infecting domesti-
cated crops. For example, the optimal
temperature for spore germination, penetration,
establishment and formation of pycnidia and
pycnidiospores may differ between pathogen
populations from wild and domesticated origins.
Comparing the effect of temperature on the
components of the disease cycle of isolates
originating from wild and domesticated plants
will clarify if such differences do exist and what is
their magnitude. Similarly, effects of other envi-
ronmental parameters (such as relative humidity,
wetness duration, etc.) can be studied. Analyzing
the segregation of the respective phenotype
among cross progeny between wild and domesti-
cated isolates will enable the study of the genetic
control of the respective traits. Challenging wild
Cicer accessions and domesticated chickpea with
D. rabiei isolates from both hosts under con-
trolled conditions may clarify the role of genetic
resistance in natural Cicer populations. Compar-
ing population structure of the pathogens isolated
from wild and domesticated hosts using neutral
DNA markers will allow estimation of gene flow
among populations on different hosts and be-
tween geographic regions. Such analyses will
determine if wild Cicer populations provide a
significant source of inoculum for Ascochyta
blight epidemics of domesticated chickpea.
Host–pathogen specialization in the Cicer/
D. rabiei system is another unresolved issue.
Some authors refrain from using the term ‘race’
for D. rabiei isolates thereby implying incomplete
specialization of the fungus (Lichtenzveig et al.
2005), while others use a race classification of this
pathogen (Santra et al. 2000). Several groups
have reported significant cultivar-by-isolate inter-
action (Chen et al. 2003; Chongo et al. 2004; Phan
et al. 2003; Cho et al. 2004). Another approach
was to define pathotype groups in D. rabiei to
describe shifts in the pathogen populations that
caused breakdown of resistant cultivars (e.g.,
Reddy and Kebbabeh 1985; Udupa et al. 1998).
This yet unresolved debate regarding host–path-
ogen specialization in the Cicer/D. rabiei system
has important implications for resistance breeding
and may benefit from re-evaluation of current
breeding strategies as well as disease assessment
114 Eur J Plant Pathol (2007) 119:111–118
123
methodologies (e.g., use of parametric scales to
evaluate disease severity). If host specialization of
the pathogen is the rule, it implies that breeders
will have to frequently recruit new alleles and
maybe even new resistance genes to combat new
emerging virulent pathogen genotypes. If, how-
ever, host specialization is not a major feature of
the pathogen, it may be possible to use existing
resistance sources for a longer period like the
Israeli cv. Bulgarit (Lichtenzveig et al. 2005). As
some collections of Ascochyta isolates are heavily
biased towards isolates originating from culti-
vated fields (e.g., WJ Kaiser collection in Pullman
WA, USA), assessment of host specialization
among D. rabiei requires larger sampling of
isolates from the wild and challenging a larger
representative collection of wild and cultivated
hosts with both domesticated and wild isolates.
Host–pathogen coevolution
Molecular study of Ascochyta pathogens isolated
from a number of legume species (wild and
domesticated) enabled the assessment of the
phylogenetic relationships among the sampled
group (Barve et al. 2003; Peever et al. 2006). Like
the host plants that undergo speciation processes
on an evolutionary time scale, the pathogens are
adjusting themselves to the evolutionary trends of
their hosts as expected from the intimate inter-
actions that occur through most of the life cycle of
the pathogen. The study of such co-evolutionary
trajectories taken by different members of the
legume family and their Ascochyta pathogens
may enable the reconstruction of the evolution of
the pathogens. For instance, phylogenetic analy-
ses among Ascochyta taxa from different legume
species may help answer the question whether the
pathogens parasitizing any given legume taxon
are monophyletic or polyphyletic, and if the
evolution of the pathogens actually reflects the
evolutionary history of their hosts.
Phylogenetic analyses using DNA markers
may expose spatial and temporal patterns of
population dynamics across large geographical
scales (Stukenbrock et al. 2006). Indeed, using
DNA markers and hierarchical analyses enabled
Zaffarano et al. (2006) to excluded both the Near
Eastern cradle of agriculture and the Ethiopian
barley diversity centre as the origin of the barley
scald pathogen Rhynchosporium secalis, due to
higher gene diversity found in central Europe.
Similarly, study of a world collection of D. rabiei
enabled Peever et al. (2004) to draw both a recent
and a historical picture of population structure of
this pathogen in the USA Pacific Northwest.
However, due to the extremely small number of
isolates from wild chickpea it is impossible at the
present time, to hypothesize on the geographical
origin of D. rabiei infecting domesticated chick-
pea. Study of Ascochyta isolates with special
emphasis on isolates from wild Cicer both within
the Near Eastern cradle of agriculture as well as
in areas outside the natural distribution of the
hosts, may expose the historical trends of
the spread of the pathogen, and may enable the
detection of the centre of origin of current
pathogens or sources of recent epidemic episodes
(e.g., epidemic outbreak in Australia in the late
1990s). Such analysis will also enable the refuta-
tion or corroboration of the hypothesis of Abbo
et al. (2003) regarding Bulgaria and perennial C.
montbretii as a possible origin of D. rabiei
infecting domesticated chickpea. Such informa-
tion is important since areas of maximum gene
diversity of the pathogen are also likely to be
important sources of host resistance genes, both
wild and domesticated. In addition, identification
of migration patterns and direction of gene flow
in the pathogen may help in devising better
quarantine measures within as well as between
continents for the benefit of farmers worldwide.
Genetic analysis of pathogenicity
The quantitative nature of the Cicer/D. rabiei
interaction suggests polygenic control of resis-
tance/aggressiveness. Evidence for quantitative
resistance in the host was published (e.g., Santra
et al. 2000; Tekeoglu et al. 2000; Lichtenzveig
et al. 2002; Flandez-Galvez et al. 2003; Lichtenz-
veig et al. 2006) but we currently lack data
concerning the genetic control of aggressiveness
in the pathogen. Such information could be
obtained from the genetic analysis of progeny
derived from crosses between isolates with dif-
ferent aggressiveness phenotypes on wild and
domesticated hosts. Application of quantitative
Eur J Plant Pathol (2007) 119:111–118 115
123
genetic tools, in conjunction with DNA markers
(e.g., Lichtenzveig et al. 2002, 2006) and pheno-
typic assessment (e.g., above) will enable the
determination of whether aggressiveness genes
are genetically linked to loci governing ecological
adaptation (e.g., temperature- or wetness-re-
sponse loci). This may help in answering the
question: what is the role of environmental
determinants in the co-evolution of resistance/
aggressiveness in the Cicer/D. rabiei pathosystem.
Concluding remarks
A combination of factors determines that host/
pathogen co-evolution under domestication is
likely to follow a different trajectory compared
with the situation in natural ecosystems. Among
the factors relevant to the Cicer/D. rabiei patho-
system are: plant density (dense vs. thin), the
genetic structure of host populations (uniform vs.
variable), seasonal profile (warmer and drier vs.
colder and wetter) under cultivation and in
natural ecosystems, respectively. Therefore, study
of (domesticated) biased collections of fungal
isolates and their interaction with domesticated
cultivars is unlikely to expose the full spectrum of
the host–pathogen interaction in the respective
pathosystem (Harlan 1976). This, in turn, might
limit our ability to develop effective management
strategies or efficient breeding methodology (see
above). To complement the partial picture
obtained from the study of domesticated host–
pathogen interactions, the above experimental
approach is proposed. It is anticipated that recent
initiatives taken by the present authors and other
groups to study the ecology and the genetics of
the respective legume sympatric pathosystems
will provide plant breeders, agronomists and
pathologists with better tools for more effective
disease management.
References
Abbo, S., & Rubin, B. (2000). Transgenic crops: A cau-tionary tale. Science, 287, 1927–1928.
Abbo, S., Shtienberg, D., Lichtenzveig, J., Lev-Yadun, S.,& Gopher, A. (2003). Chickpea, summer cropping,and a new model for pulse domestication in the
ancient Near-East. The Quarterly Review of Biology,78, 435–448.
Akem, C. (1999). Ascochyta blight of chickpea: Presentstatus and future priorities. International Journal ofPest Management, 45, 131–137.
Ali, S. M., Sharma, B., & Ambrose, M. J. (1994). Currentstatus and future strategy in breeding pea to improveresistance to biotic and abiotic stresses. Euphytica, 73,115–126.
Barash I. (1960). The causal organisms of Ascochyta dis-eases on pea in Israel. M.Sc. Thesis. The HebrewUniversity of Jerusalem, Rehovot, Israel. 65 pp.(Hebrew, English summary).
Barve, M. P., Arie, T., Salimath, S. S., Muehlbauer, F. J., &Peever, T. L. (2003). Cloning and characterization ofthe mating type (MAT) locus from Ascochyta rabiei(teleomorph: Didymella rabiei) and a MAT phylogenyof legume-associated Ascochyta sp. Fungal Geneticsand Biology, 39, 151–167.
Bayaa, B., Erskine, W., & Hamdi, A. (1992). Response ofwild lentil to Ascochyta fabae f.sp. lentis from Syria.Genetic Resources and Crop Evolution, 41, 61–65.
Burdon, J. J. (1987). Disease and plant population biology.Cambridge, UK: Cambridge University Press.
Chen, W., Coyne, C., Peever, T. L., & Nuehlbauer, F. J.(2003). Characterization of chickpea differentials forAscochyta rabiei using an improved virulence assay.Phytopathology, 93(Suppl.), S16 (Abstract).
Cho, S., Chen, W., & Muehlbauer, F. J. (2004). Pathotype-specific genetic factors in chickpea (Cicer arietinumL.) for quantitative resistance to ascochyta blight.Theoretical and Applied Genetics, 109, 733–739.
Chongo, G., Gossen, B. D., Buchwaldt, L., Adhikari, T., &Rimmer, S. R. (2004). Genetic diversity of Ascochytarabiei in Canada. Plant Disease, 88, 4–10.
Diamond, J. (1997). Guns, germs, and steel. The fates ofhuman societies. New York, USA: Norton WW andCompany.
Diekmann, M. (1992). Use of climatic parameters to pre-dict the global distribution of Ascochyta blight onchickpea. Plant Disease, 76, 409–412.
Dinoor, A. (1974). Role of wild and cultivated plants in theepidemiology of plant diseases in Israel. Annual Re-view of Phytopathology, 12, 413–436.
Dinoor, A., & Eshed, N. (1984). The role and importanceof pathogens in natural plant communities. AnnualReview of Phytopathology, 22, 443–466.
Dinoor, A., & Eshed, N. (1987). The analysis of host andpathogens populations in natural ecosystems. In: M. S.Wolfe & C. E. Caten (Eds.), Populations of PlantPathogens: Their Dynamics and Genetics (pp. 75–88).Oxford, UK: Blackwell Scientific Publications.
Dinoor, A., Eshed, N., Ecker, R., Gerechter-Amitai, Z.,Solel, Z., Manistersky, J., & Anikster, Y. (1991). Fungaldiseases of wild tetraploid wheat in a natural stand innorthern Israel. Israel Journal of Botany, 40, 481–500.
Fitt, B. D. L., McCartney, H. A., & Walklate, P. J. (1989).The role of rain in dispersal of pathogen inoculum.Annual Review of Phytopathology, 27, 241–270.
Flandez-Galvez, H., Ades, P. K., Ford, R., Pang, E. C. K.,& Taylor, P. W. J. (2003). QTL analysis for Ascochyta
116 Eur J Plant Pathol (2007) 119:111–118
123
blight resistance in an intraspecific population ofchickpea (Cicer arietinum L.). Theoretical and Ap-plied Genetics, 107, 1257–1265.
Frenkel, O., Shtienberg, D., Abbo, S., & Sherman, A.(2007). The sympatric Ascochyta complex of wildCicer judaicum and domesticated chickpea. PlantPathology (in press).
Gossen, B. D., & Morrall, R. A. A. (1983). Effect of as-cochyta blight on seed yield and quality of lentils.Canadian Journal Plant Pathology, 5, 168–173.
Harlan, J. R. (1976). Diseases as a factor in plant evolu-tion. Annual Review of Phytopathology, 14, 35–51.
Harlan, J. R., & Zohary, D. (1966). Distribution of wildwheat and barley. Science, 153, 1074–1080.
Jhorar, O. P., Mathauda, S. S., Singh, G., Butler, D. R., &Mavi, H. S. (1997). Relationship between climaticvariables and Ascochyta blight of chickpea in Punjab,India. Agricultural and Forest Meteorology, 87, 171–177.
Kaiser, W. J. (1997). Inter- and intranational spread ofascochyta pathogens of chickpea, faba bean and lentil.Canadian Journal of Plant Pathology, 19, 215–224.
Kaiser, W. J., Wang, B. C., & Rogers, J. D. (1997).Ascochyta fabae and Ascochyta lentis: Host specificity,teleomorphs (Didymella), hybrid analysis and taxo-nomic status. Plant Disease, 81, 809–816.
Kaiser, W. J., Hannan, R. M., & Muehlbauer, F. J. (1998).First report of Ascochyta blight of Cicer montbretii, awild perennial chickpea in Bulgaria. Plant Disease, 82,830.
Kumar, J., & Abbo, S. (2001). Genetics of flowering timein chickpea and its bearing on productivity in semiarid environments. Advances in Agronomy, 72,107–138.
Ladizinsky, G. (1995). Chickpea. In: J. Smartt & N. W.Simmonds (Eds.), Evolution of crop plants (pp. 258–261). Harlow, UK: Longman Scientific & Technical.
Leppik, E. E. (1970). Gene centers of plants as sources ofdisease resistance. Annual Review of Phytopathology,8, 323–344.
Lev-Yadun, S., Gopher, A., & Abbo, S. (2000). The cradleof agriculture. Science, 288, 1602–1603.
Lichtenzveig, J., Shtienberg, D., Zhang, H. B., Bonfil, D.J., & Abbo, S. (2002). Biometric analyses of theinheritance of resistance to Didymella rabiei inchickpea. Phytopathology, 92, 417–423.
Lichtenzveig, J., Gamliel, E., Frenkel, O., Michaelido, S.,Abbo, S., Sherman, A., & Shtienberg, D. (2005).Distribution of mating types and diversity in virulenceof Didymella rabiei in Israel. European Journal ofPlant Pathology, 113, 15–24.
Lichtenzveig, J., Bonfil, D. J., Zhang, H. B., Shtienberg,D., Abbo, S. (2006). Mapping quantitative trait lociaffecting time to flowering and response to Ascochytablight in chickpea. Theoretical and Applied Genetics,113, 1357–1369.
Morrall, R. A. A. (1997). Evolution of lentil diseases over25 years in western Canada. Canadian Journal ofPlant Pathology, 19, 197–207.
Nene, Y. L. (1982). A review of Ascochyta blight ofchickpea. Tropical Pest Management, 28, 61–70.
Nene, Y. L. (1984). A review of Ascochyta blight ofchickpea (Cicer arientum L.). In: M. C. Saxena & K.B. Singh (Eds.), Ascochyta blight and winter sowing ofchickpea (pp. 17–33). The Hague, Netherlands:Martinus Nijhoff/Dr W Junk Publishers.
Nene, Y. L., & Reddy, M. V. (1987). Chickpea diseasesand their control. In: M. C. Saxena & K. B. Singh(Eds.), The chickpea (pp. 233–270). Wallingford, UK:CAB International.
Peever, T. L., Salimath, S. S., Su, G., Kaiser, W. J., &Muehlbauer, F. J. (2004). Historical and contempo-rary multilocus population structure of Ascochyta ra-biei (teleomorph: Didymella rabiei) in the PacificNorthwest of the United States. Molecular Ecology,13, 291–309.
Peever, T. L., Barve, M. P., Stone, L. J., & Kaiser, W. J.(2006). Evolutionary relationship among Ascochytaspecies infecting wild and cultivated hosts in thelegume tribes Cicereae and Vicieae. Mycologia (inpress).
Phan, H. T. T., Ford, R., & Taylor, P. W. J. (2003). Pop-ulation structure of Ascochyta rabiei in Australiabased on STMS fingerprints. Fungal Diversity, 13,111–129.
Reddy, M. V., & Kabbabeh, S. (1985). Pathogenic vari-ability in Ascochyta rabiei (Pass.) Lab. in Syria andLebanon. Phytopathologia mediterranea, 24, 265–266.
Reddy, M. V., Nene, Y. L., Singh, G., & Bashir, M. (1990).Strategies for management of foliar diseases ofchickpea. In: H. A. van Rheenen & M. C. Saxena(Eds.), Chickpea in the winter (pp. 117–127). Patan-cheru, India: ICRISAT.
Santra, D. K., Tekeoglu, M., Ratnaparkhe, M. L., Kaiser,W. J., & Muehlbauer, F. J. (2000). Identification andmapping of QTLs conferring resistance to Ascochytablight in chickpea. Crop Science, 40, 1606–1612.
Stukenbrock, E. H., Banke, S., & McDonald, B. (2006).Global migration patterns in the fungal wheat path-ogen Phaeosphaeria nodorum. Molecular Ecology, 15,2895–2904.
Tekeoglu, M., Santra, D. K., Kaiser, W. J., & Muehlbauer,F. J. (2000). Ascochyta blight resistance inheritance inthree chickpea recombinant inbred line populations.Crop Science, 40, 1251–1256.
Tivoli, B., Beasse, C., Lemarchand, E., & Masson, E.(1996). Effect of ascochyta blight (Mycosphaerellapinodes) on yield components of single pea (Pisumsativum) plants under field conditions. Annals of Ap-plied Biology, 29, 207–216.
Udupa, S. M., Weigand, F., Saxena, M. C., & Kahl, G.(1998). Genotyping with RAPD and microsatellitemarkers resolves pathotype diversity in the ascochtablight pathogen of chickpea. Theoretical and AppliedGenetics, 97, 299–307.
Zaffarano, P. L., McDonald, B., Zala, M., & Linde, C. C.(2006). Global hierarchical diversity analysis suggeststhe fertile crescent is not the center of origin of thebarley scald pathogen Rhynchosporium secalis.Phytopathology, 96, 941–950.
Zizumbo-Villarreal, D., Colunga-GarcıaMarın, P., Payrode la Cruz, E., Delgado-Valerio, P., Gepts, P. (2005).
Eur J Plant Pathol (2007) 119:111–118 117
123
Population structure and evolutionary dynamics ofwild–weedy–domesticated complexes of commonbean in a Mesoamerican region. Crop Science, 45,1073–1083.
Zohary, M. (1973). Geobotanical foundations of the middleeast. Stuttgart, Germany: Gustav Fischer Verlag.
Zohary, D., & Hopf, M. (2000). Domestication of plants inthe old world. Oxford, UK: Clarendon Press.
118 Eur J Plant Pathol (2007) 119:111–118
123
REVIEW PAPER
Role of host specificity in the speciation of Ascochytapathogens of cool season food legumes
Tobin L. Peever
Received: 6 November 2006 / Accepted: 19 April 2007 / Published online: 17 May 2007
� KNPV 2007
Abstract Ascochyta/legume interactions are attrac-
tive systems for addressing evolutionary questions
about the role of host specificity in fungal speciation
because many wild and cultivated cool season food
legumes are infected by Ascochyta spp. and most of
these fungi have described teleomorphs (Didymella
spp.) that can be induced in the laboratory. Recent
multilocus phylogenetic analyses of a worldwide
sample of Ascochyta fungi causing ascochyta blights
of chickpea (Cicer arietinum), faba bean (Vicia faba),
lentil (Lens culinaris), and pea (Pisum sativum) have
revealed that fungi causing disease on each host
formed a monophyletic group. Host inoculations of
these fungi demonstrated that they were host-specific,
causing disease only on the host species from which
they were isolated. In contrast to the strict association
between monophyletic group and host observed for
pathogens of cultivated legumes, Ascochyta fungi
causing disease on wild bigflower vetch (Vicia
grandiflora) were polyphyletic. Genetic crosses
between several pairs of closely related, host-specific,
and phylogenetically distinct Ascochyta fungi were
fully sexually compatible. Progeny from these
crosses had normal cultural morphology and segre-
gation of molecular markers indicating a lack of
intrinsic, post-zygotic mating barriers between the
parental taxa. However, when progeny from a cross
between a faba bean-adapted isolate (A. fabae) and a
pea-adapted isolate (A. pisi) were assessed for their
pathogenicity to the parental hosts, almost all prog-
eny were non-pathogenic to either faba bean or pea.
These results suggest that although these fungi have
retained the ability to mate and produce progeny with
normal saprophytic fitness, progeny are severely
compromised in parasitic fitness. The host specificity
of these fungi, coupled with the inability of hybrid
progeny to colonize and reproduce on a host, may
constitute strong extrinsic, pre-zygotic and post-
zygotic mating barriers in these fungi and promote
the genetic isolation and speciation of host-specific
taxa. A phylogeny of the host plants is also being
developed, and with more extensive sampling of
pathogens and hosts from sympatric populations in
the centre of origin, the hypothesis of cospeciation of
pathogens and hosts will be tested. The objectives of
this review are: (1) to summarize recent phylogenetic,
host specificity and speciation studies of Ascochyta
fungi, and (2) to suggest how current and future
research using these pathosystems may lead to a
better understanding of the role of host specificity in
the speciation of plant-pathogenic fungi and the
cospeciation of pathogens and their hosts.
Keywords Gram blight � Temperate legumes � Host
specificity � Speciation � Phylogeny � Hybridization �Evolution
T. L. Peever (&)
Department of Plant Pathology, Washington State
University, Pullman, WA 99164-6430, USA
e-mail: [email protected]
123
Eur J Plant Pathol (2007) 119:119–126
DOI 10.1007/s10658-007-9148-2
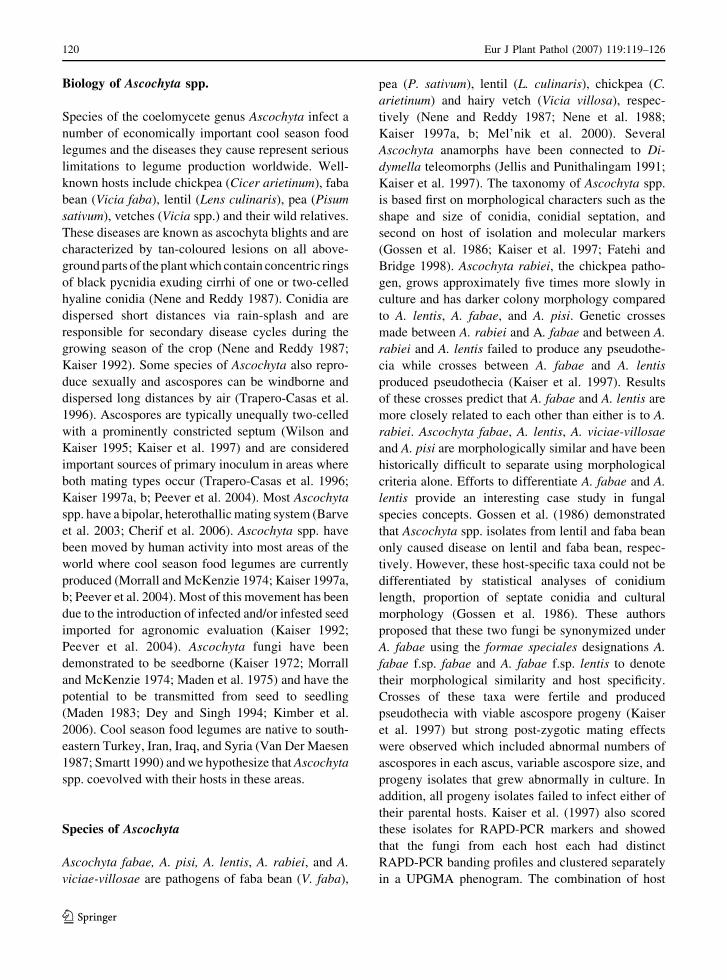
Biology of Ascochyta spp.
Species of the coelomycete genus Ascochyta infect a
number of economically important cool season food
legumes and the diseases they cause represent serious
limitations to legume production worldwide. Well-
known hosts include chickpea (Cicer arietinum), faba
bean (Vicia faba), lentil (Lens culinaris), pea (Pisum
sativum), vetches (Vicia spp.) and their wild relatives.
These diseases are known as ascochyta blights and are
characterized by tan-coloured lesions on all above-
ground parts of the plant which contain concentric rings
of black pycnidia exuding cirrhi of one or two-celled
hyaline conidia (Nene and Reddy 1987). Conidia are
dispersed short distances via rain-splash and are
responsible for secondary disease cycles during the
growing season of the crop (Nene and Reddy 1987;
Kaiser 1992). Some species of Ascochyta also repro-
duce sexually and ascospores can be windborne and
dispersed long distances by air (Trapero-Casas et al.
1996). Ascospores are typically unequally two-celled
with a prominently constricted septum (Wilson and
Kaiser 1995; Kaiser et al. 1997) and are considered
important sources of primary inoculum in areas where
both mating types occur (Trapero-Casas et al. 1996;
Kaiser 1997a, b; Peever et al. 2004). Most Ascochyta
spp. have a bipolar, heterothallic mating system (Barve
et al. 2003; Cherif et al. 2006). Ascochyta spp. have
been moved by human activity into most areas of the
world where cool season food legumes are currently
produced (Morrall and McKenzie 1974; Kaiser 1997a,
b; Peever et al. 2004). Most of this movement has been
due to the introduction of infected and/or infested seed
imported for agronomic evaluation (Kaiser 1992;
Peever et al. 2004). Ascochyta fungi have been
demonstrated to be seedborne (Kaiser 1972; Morrall
and McKenzie 1974; Maden et al. 1975) and have the
potential to be transmitted from seed to seedling
(Maden 1983; Dey and Singh 1994; Kimber et al.
2006). Cool season food legumes are native to south-
eastern Turkey, Iran, Iraq, and Syria (Van Der Maesen
1987; Smartt 1990) and we hypothesize that Ascochyta
spp. coevolved with their hosts in these areas.
Species of Ascochyta
Ascochyta fabae, A. pisi, A. lentis, A. rabiei, and A.
viciae-villosae are pathogens of faba bean (V. faba),
pea (P. sativum), lentil (L. culinaris), chickpea (C.
arietinum) and hairy vetch (Vicia villosa), respec-
tively (Nene and Reddy 1987; Nene et al. 1988;
Kaiser 1997a, b; Mel’nik et al. 2000). Several
Ascochyta anamorphs have been connected to Di-
dymella teleomorphs (Jellis and Punithalingam 1991;
Kaiser et al. 1997). The taxonomy of Ascochyta spp.
is based first on morphological characters such as the
shape and size of conidia, conidial septation, and
second on host of isolation and molecular markers
(Gossen et al. 1986; Kaiser et al. 1997; Fatehi and
Bridge 1998). Ascochyta rabiei, the chickpea patho-
gen, grows approximately five times more slowly in
culture and has darker colony morphology compared
to A. lentis, A. fabae, and A. pisi. Genetic crosses
made between A. rabiei and A. fabae and between A.
rabiei and A. lentis failed to produce any pseudothe-
cia while crosses between A. fabae and A. lentis
produced pseudothecia (Kaiser et al. 1997). Results
of these crosses predict that A. fabae and A. lentis are
more closely related to each other than either is to A.
rabiei. Ascochyta fabae, A. lentis, A. viciae-villosae
and A. pisi are morphologically similar and have been
historically difficult to separate using morphological
criteria alone. Efforts to differentiate A. fabae and A.
lentis provide an interesting case study in fungal
species concepts. Gossen et al. (1986) demonstrated
that Ascochyta spp. isolates from lentil and faba bean
only caused disease on lentil and faba bean, respec-
tively. However, these host-specific taxa could not be
differentiated by statistical analyses of conidium
length, proportion of septate conidia and cultural
morphology (Gossen et al. 1986). These authors
proposed that these two fungi be synonymized under
A. fabae using the formae speciales designations A.
fabae f.sp. fabae and A. fabae f.sp. lentis to denote
their morphological similarity and host specificity.
Crosses of these taxa were fertile and produced
pseudothecia with viable ascospore progeny (Kaiser
et al. 1997) but strong post-zygotic mating effects
were observed which included abnormal numbers of
ascospores in each ascus, variable ascospore size, and
progeny isolates that grew abnormally in culture. In
addition, all progeny isolates failed to infect either of
their parental hosts. Kaiser et al. (1997) also scored
these isolates for RAPD-PCR markers and showed
that the fungi from each host each had distinct
RAPD-PCR banding profiles and clustered separately
in a UPGMA phenogram. The combination of host
120 Eur J Plant Pathol (2007) 119:119–126
123

specificity, strong genetic differentiation in molecular
markers (i.e., lack of gene flow) and post-zygotic
mating effects observed in this study were used to
justify the elevation of A. fabae f.sp. lentis to A. lentis
Vassilevsky (Kaiser et al. 1997), and represents a rare
example of application of the biological species
concept to plant-pathogenic fungi. Currently, we
consider A. rabiei, A. fabae and A. lentis to be well-
supported biological and/or morphological species.
Evolutionary relationships among Ascochyta spp.
Despite the economic importance of the cool food
season legumes and the Ascochyta spp. that cause
devastating losses of these plants, little is known
about the evolutionary history of either the hosts or
the pathogens. Peever et al. (2007) recently estimated
phylogenies among the Ascochyta spp. pathogens of
the cool season legumes using DNA sequence data
from several regions of the genome including a
glyceraldehyde-3-phosphate dehydrogenase gene
(G3PD), a chitin synthase 1 gene (CHS) and trans-
lation elongation factor 1 alpha gene (EF). The
analysis employed an extensive collection of Asco-
chyta spp. from cool season food legumes established
by W. J. Kaiser, USDA-ARS and maintained at
Washington State University. This collection con-
tains isolates from chickpea, pea, lentil, hairy vetch
and faba bean sampled on a worldwide scale.
Currently, the collection is biased heavily towards
fungi from cultivated legumes, but has been aug-
mented in recent years with isolates sampled from
wild legume species including some of the closest
known relatives of cultivated crops. Isolates from
wild legumes have been obtained during collecting
trips to Armenia, the Republic of Georgia and Spain.
Phylogenetic analyses of the combined G3PD, CHS
and EF datasets using maximum likelihood methods
revealed that A. rabiei, the pathogen of chickpea (C.
arietinum), was distinct from the Ascochyta patho-
gens of pea, faba bean, wild vetches and lentil which
were found in two differentiable but closely related
clades (Fig. 1, Peever et al. 2007). The differenti-
ation observed between A. rabiei and A. lentis/A.
fabae in the combined phylogeny correlates well
with the results of genetic crosses among these same
taxa made previously (Kaiser et al. 1997). The
combined phylogeny also revealed that isolates
sampled from wild Cicer spp. (C. montbretii and
C. ervoides) had sequences that were identical or
nearly identical to isolates from cultivated chickpea
(C. arietinum). Cicer arietinum is an annual species
which is genetically distinct from the perennial
species, C. montbretii and C. ervoides (Javadi and
Yamaguchi 2004; Sudupak et al. 2004). The genetic
similarity of fungi colonizing distantly related
annual and perennial Cicer hosts suggests that the
source of the ascochyta blight fungus for epidemics
on cultivated chickpea may be wild, perennial
chickpea relatives.
Two major clades were apparent in the combined
phylogeny, one corresponding to isolates from culti-
vated lentil (L. culinaris), hairy vetch (V. villosa) and
wild Vicia spp. (the A. lentis/A. viciae-villosae clade)
and one corresponding to isolates from cultivated pea
(P. sativum) and faba bean (V. fabae), wild pea (P.
elatius) and wild Vicia spp. (the A. fabae/A. pisi
clade) (Fig. 1). Isolates sampled from wild legume
hosts displayed more sequence variation for all
genomic regions compared to isolates from cultivated
hosts (Fig. 1) consistent with the hypothesis that
Ascochyta spp. pathogens of cultivated legumes
represent a subset of the variation present in pathogen
populations on wild hosts. More intensive sampling
of Ascochyta spp. from sympatric legume hosts in the
centre of origin will be required to definitively test
this hypothesis. Isolates sampled from the cultivated
hosts lentil, pea, faba bean, and chickpea were each
monophyletic with strict correlation between phylo-
genetic clade and host of origin. In contrast, isolates
from the wild hosts V. villosa and V. lathyroides
formed a well-supported sub-clade within the A.
lentis clade and isolates from V. grandiflora and V.
cordata and from V. grandiflora and V. sepium also
formed well-supported sub-clades within the A.
fabae/A. pisi subclade (Fig. 1). Perhaps the most
interesting result of the phylogenetic analysis was
that isolates sampled from wild V. grandiflora were
polyphyletic, distributed in three clades (Fig. 1).
There are at least two hypotheses that may explain
the polyphyly of the fungi sampled from this host.
The first is that V. grandiflora may be colonized by
different evolutionary lineages of Ascochyta patho-
gens. This would imply that the apparent tight
correlation between pathogen clade and host of origin
seen with isolates from cultivated hosts is the result
of a founder event or strong selection by each
Eur J Plant Pathol (2007) 119:119–126 121
123
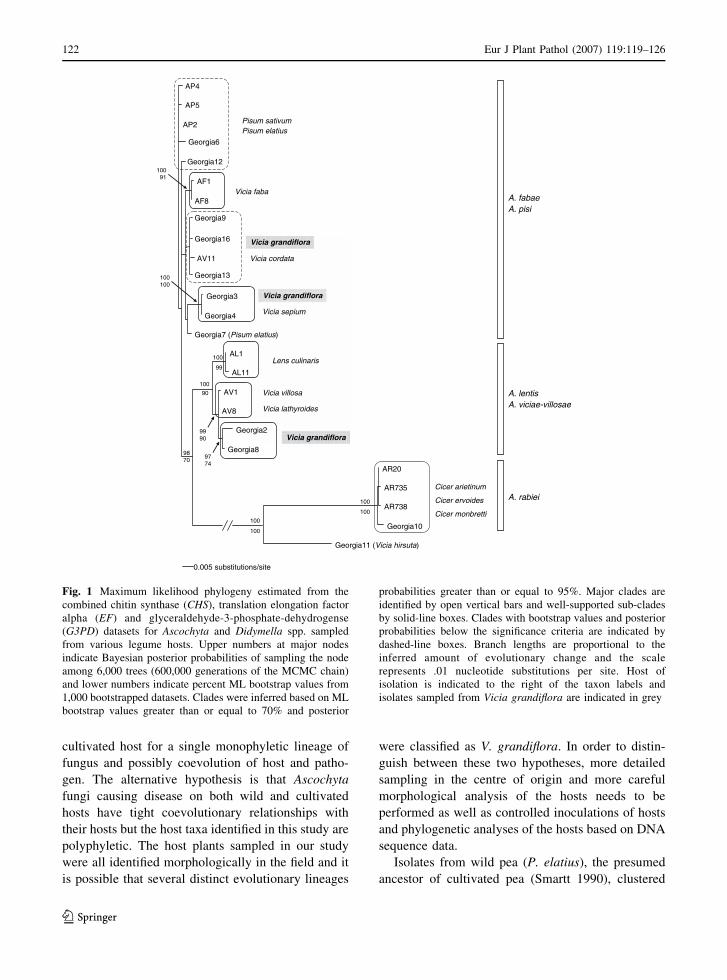
cultivated host for a single monophyletic lineage of
fungus and possibly coevolution of host and patho-
gen. The alternative hypothesis is that Ascochyta
fungi causing disease on both wild and cultivated
hosts have tight coevolutionary relationships with
their hosts but the host taxa identified in this study are
polyphyletic. The host plants sampled in our study
were all identified morphologically in the field and it
is possible that several distinct evolutionary lineages
were classified as V. grandiflora. In order to distin-
guish between these two hypotheses, more detailed
sampling in the centre of origin and more careful
morphological analysis of the hosts needs to be
performed as well as controlled inoculations of hosts
and phylogenetic analyses of the hosts based on DNA
sequence data.
Isolates from wild pea (P. elatius), the presumed
ancestor of cultivated pea (Smartt 1990), clustered
Georgia12
AF1
AF8
Georgia9
Georgia16
AV11
Georgia13
Georgia3
Georgia4
Georgia7 (Pisum elatius)
AL1
AL11
AV1
AV8
Georgia2
Georgia8
100
100
9990
10091
100100
9774
Vicia villosa
Vicia lathyroides
Lens culinaris
Vicia faba
9870
90
99
AR20
AR735
AR738
Georgia10
Georgia11 (Vicia hirsuta)
100
100
100
100
Vicia grandiflora
Vicia grandiflora
Vicia cordata
Vicia sepium
AP4
AP5
AP2
Georgia6
Pisum sativumPisum elatius
A. fabaeA. pisi
A. lentisA. viciae-villosae
Vicia grandiflora
Cicer arietinum
Cicer ervoides
Cicer monbretti
A. rabiei
0.005 substitutions/site
Fig. 1 Maximum likelihood phylogeny estimated from the
combined chitin synthase (CHS), translation elongation factor
alpha (EF) and glyceraldehyde-3-phosphate-dehydrogense
(G3PD) datasets for Ascochyta and Didymella spp. sampled
from various legume hosts. Upper numbers at major nodes
indicate Bayesian posterior probabilities of sampling the node
among 6,000 trees (600,000 generations of the MCMC chain)
and lower numbers indicate percent ML bootstrap values from
1,000 bootstrapped datasets. Clades were inferred based on ML
bootstrap values greater than or equal to 70% and posterior
probabilities greater than or equal to 95%. Major clades are
identified by open vertical bars and well-supported sub-clades
by solid-line boxes. Clades with bootstrap values and posterior
probabilities below the significance criteria are indicated by
dashed-line boxes. Branch lengths are proportional to the
inferred amount of evolutionary change and the scale
represents .01 nucleotide substitutions per site. Host of
isolation is indicated to the right of the taxon labels and
isolates sampled from Vicia grandiflora are indicated in grey
122 Eur J Plant Pathol (2007) 119:119–126
123
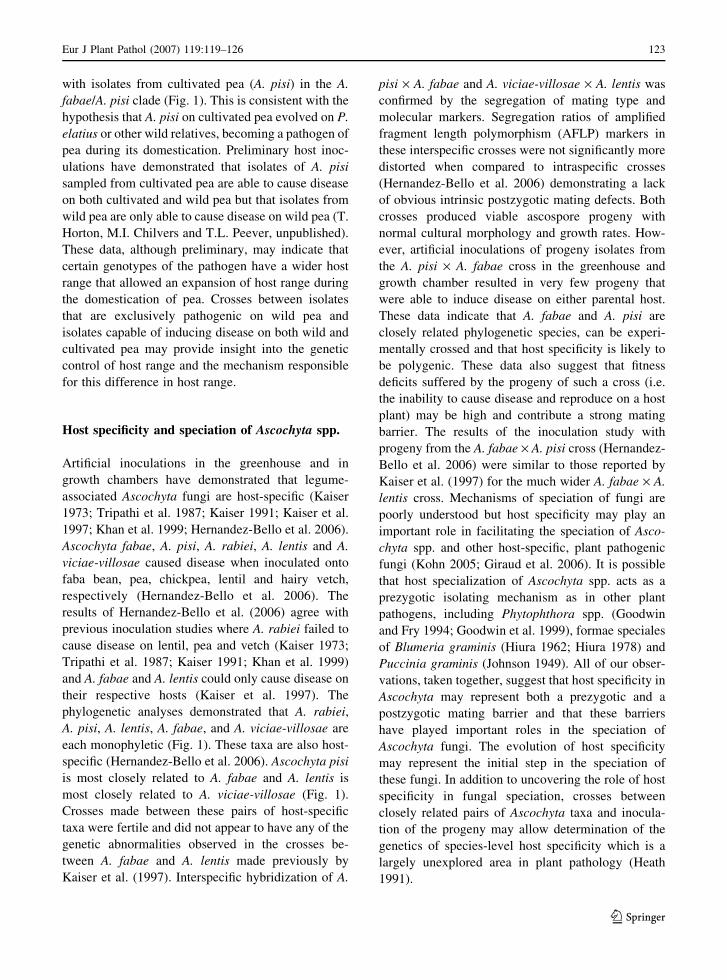
with isolates from cultivated pea (A. pisi) in the A.
fabae/A. pisi clade (Fig. 1). This is consistent with the
hypothesis that A. pisi on cultivated pea evolved on P.
elatius or other wild relatives, becoming a pathogen of
pea during its domestication. Preliminary host inoc-
ulations have demonstrated that isolates of A. pisi
sampled from cultivated pea are able to cause disease
on both cultivated and wild pea but that isolates from
wild pea are only able to cause disease on wild pea (T.
Horton, M.I. Chilvers and T.L. Peever, unpublished).
These data, although preliminary, may indicate that
certain genotypes of the pathogen have a wider host
range that allowed an expansion of host range during
the domestication of pea. Crosses between isolates
that are exclusively pathogenic on wild pea and
isolates capable of inducing disease on both wild and
cultivated pea may provide insight into the genetic
control of host range and the mechanism responsible
for this difference in host range.
Host specificity and speciation of Ascochyta spp.
Artificial inoculations in the greenhouse and in
growth chambers have demonstrated that legume-
associated Ascochyta fungi are host-specific (Kaiser
1973; Tripathi et al. 1987; Kaiser 1991; Kaiser et al.
1997; Khan et al. 1999; Hernandez-Bello et al. 2006).
Ascochyta fabae, A. pisi, A. rabiei, A. lentis and A.
viciae-villosae caused disease when inoculated onto
faba bean, pea, chickpea, lentil and hairy vetch,
respectively (Hernandez-Bello et al. 2006). The
results of Hernandez-Bello et al. (2006) agree with
previous inoculation studies where A. rabiei failed to
cause disease on lentil, pea and vetch (Kaiser 1973;
Tripathi et al. 1987; Kaiser 1991; Khan et al. 1999)
and A. fabae and A. lentis could only cause disease on
their respective hosts (Kaiser et al. 1997). The
phylogenetic analyses demonstrated that A. rabiei,
A. pisi, A. lentis, A. fabae, and A. viciae-villosae are
each monophyletic (Fig. 1). These taxa are also host-
specific (Hernandez-Bello et al. 2006). Ascochyta pisi
is most closely related to A. fabae and A. lentis is
most closely related to A. viciae-villosae (Fig. 1).
Crosses made between these pairs of host-specific
taxa were fertile and did not appear to have any of the
genetic abnormalities observed in the crosses be-
tween A. fabae and A. lentis made previously by
Kaiser et al. (1997). Interspecific hybridization of A.
pisi · A. fabae and A. viciae-villosae · A. lentis was
confirmed by the segregation of mating type and
molecular markers. Segregation ratios of amplified
fragment length polymorphism (AFLP) markers in
these interspecific crosses were not significantly more
distorted when compared to intraspecific crosses
(Hernandez-Bello et al. 2006) demonstrating a lack
of obvious intrinsic postzygotic mating defects. Both
crosses produced viable ascospore progeny with
normal cultural morphology and growth rates. How-
ever, artificial inoculations of progeny isolates from
the A. pisi · A. fabae cross in the greenhouse and
growth chamber resulted in very few progeny that
were able to induce disease on either parental host.
These data indicate that A. fabae and A. pisi are
closely related phylogenetic species, can be experi-
mentally crossed and that host specificity is likely to
be polygenic. These data also suggest that fitness
deficits suffered by the progeny of such a cross (i.e.
the inability to cause disease and reproduce on a host
plant) may be high and contribute a strong mating
barrier. The results of the inoculation study with
progeny from the A. fabae · A. pisi cross (Hernandez-
Bello et al. 2006) were similar to those reported by
Kaiser et al. (1997) for the much wider A. fabae · A.
lentis cross. Mechanisms of speciation of fungi are
poorly understood but host specificity may play an
important role in facilitating the speciation of Asco-
chyta spp. and other host-specific, plant pathogenic
fungi (Kohn 2005; Giraud et al. 2006). It is possible
that host specialization of Ascochyta spp. acts as a
prezygotic isolating mechanism as in other plant
pathogens, including Phytophthora spp. (Goodwin
and Fry 1994; Goodwin et al. 1999), formae speciales
of Blumeria graminis (Hiura 1962; Hiura 1978) and
Puccinia graminis (Johnson 1949). All of our obser-
vations, taken together, suggest that host specificity in
Ascochyta may represent both a prezygotic and a
postzygotic mating barrier and that these barriers
have played important roles in the speciation of
Ascochyta fungi. The evolution of host specificity
may represent the initial step in the speciation of
these fungi. In addition to uncovering the role of host
specificity in fungal speciation, crosses between
closely related pairs of Ascochyta taxa and inocula-
tion of the progeny may allow determination of the
genetics of species-level host specificity which is a
largely unexplored area in plant pathology (Heath
1991).
Eur J Plant Pathol (2007) 119:119–126 123
123
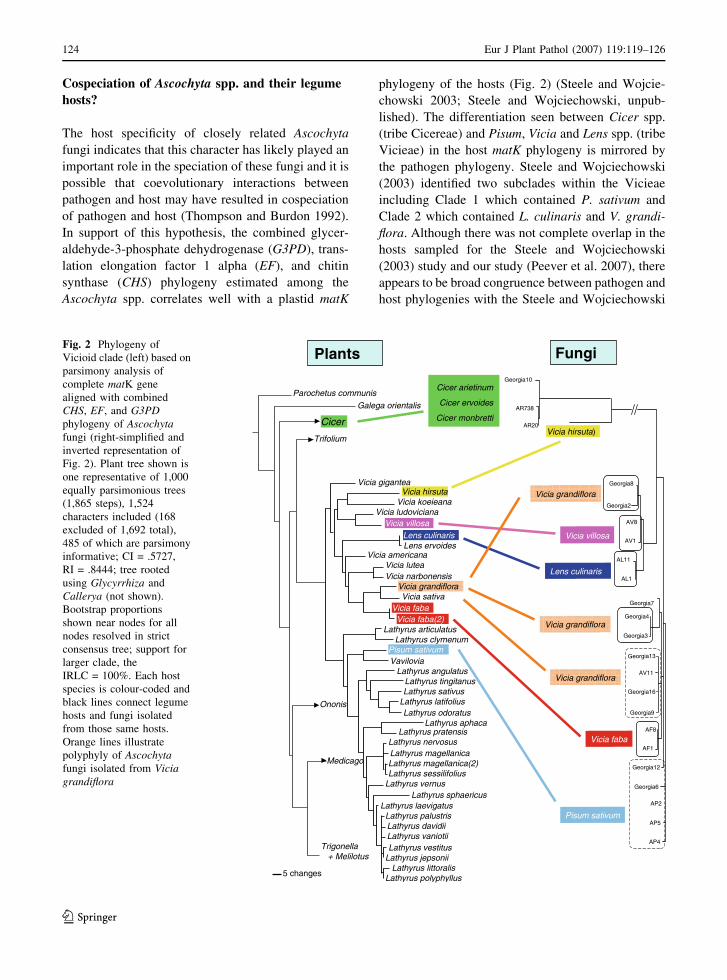
Cospeciation of Ascochyta spp. and their legume
hosts?
The host specificity of closely related Ascochyta
fungi indicates that this character has likely played an
important role in the speciation of these fungi and it is
possible that coevolutionary interactions between
pathogen and host may have resulted in cospeciation
of pathogen and host (Thompson and Burdon 1992).
In support of this hypothesis, the combined glycer-
aldehyde-3-phosphate dehydrogenase (G3PD), trans-
lation elongation factor 1 alpha (EF), and chitin
synthase (CHS) phylogeny estimated among the
Ascochyta spp. correlates well with a plastid matK
phylogeny of the hosts (Fig. 2) (Steele and Wojcie-
chowski 2003; Steele and Wojciechowski, unpub-
lished). The differentiation seen between Cicer spp.
(tribe Cicereae) and Pisum, Vicia and Lens spp. (tribe
Vicieae) in the host matK phylogeny is mirrored by
the pathogen phylogeny. Steele and Wojciechowski
(2003) identified two subclades within the Vicieae
including Clade 1 which contained P. sativum and
Clade 2 which contained L. culinaris and V. grandi-
flora. Although there was not complete overlap in the
hosts sampled for the Steele and Wojciechowski
(2003) study and our study (Peever et al. 2007), there
appears to be broad congruence between pathogen and
host phylogenies with the Steele and Wojciechowski
FungiPlants
Parochetus communis
Galega orientalis
5 changes
Vicia giganteaVicia hirsuta
Vicia koeieanaVicia ludoviciana
Vicia villosaLens culinarisLens ervoides
Vicia americanaVicia luteaVicia narbonensis
Vicia fabaVicia faba(2)
Lathyrus articulatusLathyrus clymenum
Pisum sativumVavilovia
Lathyrus angulatusLathyrus tingitanusLathyrus sativus
Lathyrus latifoliusLathyrus odoratus
Lathyrus aphacaLathyrus pratensis
Lathyrus nervosusLathyrus magellanicaLathyrus magellanica(2)Lathyrus sessilifolius
Lathyrus vernusLathyrus sphaericus
Lathyrus laevigatusLathyrus palustrisLathyrus davidiiLathyrus vaniotiiLathyrus vestitus
Lathyrus jepsoniiLathyrus littoralis
Lathyrus polyphyllus
Cicer
Ononis
Trigonella+ Melilotus
Medicago
Trifolium
Vicia grandiflora
AP4
AP5
AP2
Georgia6
Georgia12
AF1
AF8
Georgia9
Georgia16
AV11
Georgia13
Georgia3
Georgia4
Georgia7
AL1
AL11
AV1
AV8
Georgia2
Georgia8
Vicia villosa
Lens culinaris
Vicia faba
AR20
AR738
Pisum sativum
Vicia grandiflora
Vicia grandiflora
Vicia grandiflora
Georgia10
Cicer arietinum
Cicer ervoides
Cicer monbretti
Vicia hirsuta)
Vicia sativa
Fig. 2 Phylogeny of
Vicioid clade (left) based on
parsimony analysis of
complete matK gene
aligned with combined
CHS, EF, and G3PDphylogeny of Ascochytafungi (right-simplified and
inverted representation of
Fig. 2). Plant tree shown is
one representative of 1,000
equally parsimonious trees
(1,865 steps), 1,524
characters included (168
excluded of 1,692 total),
485 of which are parsimony
informative; CI = .5727,
RI = .8444; tree rooted
using Glycyrrhiza and
Callerya (not shown).
Bootstrap proportions
shown near nodes for all
nodes resolved in strict
consensus tree; support for
larger clade, the
IRLC = 100%. Each host
species is colour-coded and
black lines connect legume
hosts and fungi isolated
from those same hosts.
Orange lines illustrate
polyphyly of Ascochytafungi isolated from Viciagrandiflora
124 Eur J Plant Pathol (2007) 119:119–126
123
(2003) Clade 1 corresponding to the A. pisi/A. fabae
clade in the combined analysis reported here and the
Steele and Wojciechowski (2003) Clade 2 correspond-
ing to the A. lentis clade reported here (Fig. 2). In order
to rigorously test the cospeciation hypothesis, more
extensive sampling of pathogen and host from sym-
patric host populations in the centre of origin are
required. Cospeciation analyses will also require
lower-level phylogenetic and phylogeographic analy-
ses of the host using faster-evolving regions of the
genome. Statistical tests of congruence between robust
pathogen and host phylogenies will allow critical tests
of cospeciation (Paterson and Banks 2001). Additional
fast-evolving regions of the legume genome have been
identified and are currently being used to resolve the
evolutionary relationships within the Vicieae and
Cicereae tribes (Steele and Wojciechowski 2003)
and these regions will be useful for resolving phylo-
genetic relationships among closely related hosts.
Sampling of Ascochyta fungi from sympatric hosts in
these tribes in their centre of origin coupled with
estimation of robust lower-level phylogenies for both
hosts and pathogens will provide interesting insights
into the coevolution of these pathosystems.
Acknowledgements The author would like to thank Kelly
Steele and Martin Wojciechowski, Arizona State University,
for providing unpublished data presented in Fig. 2. The author
would also like to thank Martin Chilvers, Washington State
University, and an anonymous referee for greatly improving
the manuscript.
References
Barve, M. P., Arie, T., Salimath, S., Muehlbauer, F. J., & Pe-
ever, T. L. (2003). Cloning and characterization of the
mating type (MAT) locus from Ascochyta rabiei (teleo-
morph: Didymella rabiei) and a MAT phylogeny of le-
gume-associated Ascochyta spp. Fungal Genetics andBiology, 39, 151–167.
Cherif, M., Chilvers, M. I., Akamatsu, H., Peever, T. L., &
Kaiser, W. J. (2006). Cloning of the mating type locus
from Ascochyta lentis (teleomorph: Didymella lentis) and
development of a multiplex PCR mating assay for Asco-
chyta species. Current Genetics, 50, 203–215.
Dey, S. K., & Singh, G. (1994). Seedborne infection of As-cochyta rabiei in chickpea and its transmission to aerial
plant parts. Phytoparasitica, 22, 31–37.
Fatehi, J., & Bridge, P. (1998) Detection of multiple rRNA-ITS
regions in isolates of Ascochyta. Mycological Research,102, 762–766.
Giraud, T., Villareal, L. M. M. A., Austerlitz, F., Le Gac, M., &
Lavigne, C. (2006). Importance of the life cycle in sym-
patric host race formation and speciation of pathogens.
Phytopathology, 96, 280–287.
Goodwin, S. B., & Fry, W. (1994). Genetic analyses of inter-
specific hybrids between Phytophthora infestans and
Phytophthora mirabilis. Experimental Mycology, 18, 20–
32.
Goodwin, S. B., Legard, D. E., Smart, C. D., Morris, L., & Fry,
W. (1999). Gene flow analysis of molecular markers
confirms that Phytophthora mirabilis and P. infestans are
separate species. Mycologia, 91, 796–810.
Gossen, B. D., Sheard, J. W., Beauchamp, C. J., & Morrall, R. A.
A. (1986). Ascochyta lentis renamed Ascochyta fabae f. sp.
lentis. Canadian Journal of Plant Pathology, 8, 154–160.
Heath, M. C. (1991). The role of gene-for-gene interactions in
the determination of host species specificity. Phytopa-thology, 81, 127–130.
Hernandez-Bello, M. A., Chilvers, M. I., Akamatsu, H., &
Peever, T. L. (2006). Host specificity of Ascochyta spp.
infecting legumes of the Vicieae and Cicereae tribes and
pathogenicity of an interspecific hybrid. Phytopathology,96, 1148–1156.
Hiura, U. (1962). Hybridization between varieties of Erysiphegraminis. Phytopathology, 52, 664–666.
Hiura, U. (1978). Genetic basis of formae speciales of Erysiphegraminis. In D. M. Spence (Ed.), The powdery mildews.
London: Academic Press.
Javadi, F., & Yamaguchi, H. (2004). Interspecific relationships
of the genus Cicer L. (Fabaceae) based on trnT-F se-
quences. Theoretical and Applied Genetics, 109, 317–
322.
Jellis, G. J., & Punithalingam, E. (1991). Discovery of Di-dymella fabae sp. nov., the teleomorph of Ascochyta fa-bae, on faba bean straw. Plant Pathology, 40, 150–157.
Johnson, T. (1949). Intervarietal crosses in Puccinia graminis.
Canadian Journal of Research, 227, 45–65.
Kaiser, W. J. (1972). Occurrence of three fungal diseases of
chickpea in Iran. FAO Plant Protection Bulletin, 20, 73–
78.
Kaiser, W. J. (1973). Factors affecting growth, sporulation,
pathogenicity and survival of Ascochyta rabiei. Mycolo-gia, 65, 444–457.
Kaiser, W. J. (1991). Host range studies with the Ascochyta
blight pathogen of chickpea. International ChickpeaNewsletter, 25, 25–27.
Kaiser, W. J. (1992). Epidemiology of Ascochyta rabiei. In K.
B. Singh, & M. C. Saxena (Eds.), Disease resistancebreeding in chickpea (pp. 117–134). Aleppo, Syria:
ICARDA.
Kaiser, W. J. (1997a). Inter- and intranational spread of asco-
chyta pathogens of chickpea, faba bean and lentil.
Canadian Journal of Plant Pathology, 19, 215–224.
Kaiser, W. J. (1997b). The teleomorph of Ascochyta rabiei and
its significance in breeding chickpea. In S. M. Udupa & F.
Weigand (Eds.), Application of DNA fingerprinting forcrop improvement: Marker-assisted selection of chickpeafor sustainable agriculture in the dry areas (pp. 3–21).
Aleppo: ICARDA.
Kaiser, W. J., Wang, B.-C., & Rogers, J. D. (1997). Ascochytafabae and A. lentis: Host specificity, teleomorphs (Di-dymella), hybrid analysis and taxonomic status. PlantDisease, 81, 809–816.
Eur J Plant Pathol (2007) 119:119–126 125
123
Khan, M. S. A., Ramsey, M. D., & Scott, E. S. (1999) Host
range studies with an Australian isolate of Ascochyta ra-biei. Australasian Plant Pathology, 28, 170–173.
Kimber, R. B. E., Scott, E. S., & Ramsey, M. D. (2006).
Factors influencing transmission of Didymella rabiei (as-
cochyta blight) from inoculated seed of chickpea under
controlled conditions. European Journal of PlantPathology, 114, 175–184.
Kohn, L. M. (2005). Mechanisms of fungal speciation. AnnualReview of Phytopathology, 43, 279–308.
Maden, S. (1983). Transmission of seed-borne infections of
Ascochyta rabiei (Pass.) Lab. to seedlings and its control.
Journal of Turkish Phytopathology, 12, 77–82.
Maden, S., Singh, D., Mathur, S. B., & Neergaard, P. (1975).
Detection and location of seed-borne inoculum of Asco-chyta rabiei and its transmission in chickpea (Cicer ari-etinum). Seed Science and Technology, 3, 667–681.
Mel’nik, V. A., Braun, U., & Hagedorn, G. (2000). Key to the
fungi of genus Ascochyta Lib. (Coelomycetes). Kurfu-
stendamm, Berlin, Arno Brynda, Berlin.
Morrall, R. A. A., & McKenzie, D. L. (1974). A note on the
inadvertant introduction to North America of Ascochytarabiei, a destructive pathogen of chickpea. Plant DiseaseReporter, 58, 342–345.
Nene, Y. L., Hanounik, S. B., Qureshi, S. H., & Sen, B. (1988).
Fungal and bacterial foliar diseases of pea, lentil, faba
bean and chickpea. In R. J. Summerfield (Ed.), Worldcrops: Cool season food legumes (pp. 577–589). Dordr-
echt, Netherlands: Kluwer Academic Publishers.
Nene, Y. L., & Reddy, M. V. (1987). Chickpea diseases and
their control. In M. C. Saxena & R. S. Singh (Eds.), Thechickpea (pp. 233–270). Wallingford, Oxfordshire, UK:
CAB International.
Paterson, A. M., & Banks, J. (2001). Analytical approaches to
measuring cospeciation of host and parasites: through a
looking glass, darkly. International Journal for Parasi-tology, 31, 1012–1022.
Peever, T. L., Barve, M. P., Stone, L. J., & Kaiser, W. J.
(2007). Evolutionary relationships among Ascochyta
species infecting wild and cultivated hosts in the legume
tribes Cicereae and Vicieae. Mycologia, 99, 59–77.
Peever, T. L., Salimath, S. S., Su, G., Kaiser, W. J., & Mu-
ehlbauer, F. J. (2004). Historical and contemporary mul-
tilocus population structure of Ascochyta rabiei(teleomorph: Didymella rabiei) in the Pacific Northwest
of the United States. Molecular Ecology, 13, 291–309.
Smartt, J. (1990). Grain legumes: Evolution and genetic re-sources. Cambridge UK: Cambridge University Press.
Steele, K. P., & Wojciechowski, M. F. (2003). Phylogenetic
analyses of tribes Trifolieae and Vicieae based on se-
quences of the plastid gene, matK (Papilonoideae:
Leguminosae). In B. B. Klitgaard & A. Bruneau (Eds.),
Advances in legume systematics, Part 10: Higher levelsystemtics (pp. 355–370). Kew: Royal Botanic Gar-
dens.
Sudupak, M. A., Akkaya, M. S., & Kence, A. (2004).
Genetic relationships among perennial and annual
Cicer species growing in Turkey assessed by AFLP
fingerprinting. Theoretical and Applied Genetics, 108,
937–944.
Thompson, J. N., & Burdon, J. J. (1992). Gene-for-gene
coevolution between plants and parasites. Nature, 360,
121–125.
Trapero-Casas, A., Navas-Cortes, J. A., & Jimenez-Diaz, R. M.
(1996). Airborne ascospores of Didymella rabiei as a
major source of primary inoculum for Ascochyta blight
epidemics in chickpea crops in southern Spain. EuropeanJournal of Plant Pathology, 102, 237–245.
Tripathi, H. S., Singh, R. S., & Chaube, H. S. (1987). Host-
range of Ascochyta rabiei (Pass.) Labr., the causal agent
of Ascochyta blight in chickpea. International ChickpeaNewsletter, 16, 11.
Van Der Maesen, L. J. G. (1987). Origin, history and taxonomy
of chickpea. In M. C. Saxena & K. B. Singh (Eds.), TheChickpea (p. 409). Oxford, UK: C.A.B. International.
Wilson, A. D., & Kaiser, W. J. (1995). Cytology and genetics
of sexual compatibility in Didymella rabiei. Mycologia,87, 795–804.
126 Eur J Plant Pathol (2007) 119:119–126
123
REVIEW PAPER
Diagnostics, genetic diversity and pathogenic variationof ascochyta blight of cool season food and feed legumes
Paul W. J. Taylor Æ Rebecca Ford
Received: 2 November 2006 / Accepted: 21 May 2007 / Published online: 30 June 2007
� KNPV 2007
Abstract Molecular diagnostic techniques have
been developed to differentiate the Ascochyta patho-
gens that infect cool season food and feed legumes, as
well as to improve the sensitivity of detecting latent
infection in plant tissues. A seed sampling technique
was developed to detect a 1% level of infection by
Ascochyta rabiei in commercial chickpea seed. The
Ascochyta pathogens were shown to be genetically
diverse in countries where the pathogen and host have
coexisted for a long time. However, where the
pathogen was recently introduced, such as A. rabiei
to Australia, the level of diversity remained relatively
low, even as the pathogen spread to all chickpea-
growing areas. Pathogenic variability of A. rabiei and
Ascochyta pinodes pathogens in chickpea and field
pea respectively, appears to be quantitative, where
measures of disease severity were based on aggres-
siveness (quantitative level of infection) rather than
on true qualitative virulence. In contrast, qualitative
differences in pathogenicity in lentil and faba bean
genotypes indicated the existence of pathotypes of
Ascochyta lentis and Ascochyta fabae. Therefore,
reports of pathotype discrimination based on quanti-
tative differences in pathogenicity in a set of specific
genotypes is questionable for several of the asco-
chyta-legume pathosystems such as A. rabiei and
A. pinodes. This is not surprising since host resistance
to these pathogens has been reported to be mainly
quantitative, making it difficult for the pathogen to
overcome specific resistance genes and form patho-
types. For robust pathogenicity assessment, there
needs to be consistency in selection of differential
host genotypes, screening conditions and disease
evaluation techniques for each of the Ascochyta sp. in
legume-growing countries throughout the world.
Nevertheless, knowledge of pathotype diversity and
aggressiveness within populations is important in the
selection of resistant genotypes.
Keywords Diagnostics � Genetic diversity �Pathotypes � Ascochyta � Cicer � Lens � Pisum � Vicia
Introduction
Ascochyta blight is considered to be one of the most
damaging necrotrophic diseases of cool season food
and feed legumes worldwide. The disease in chickpea
is caused by Ascochyta rabiei (teleomorph: Didym-
ella rabiei); in lentil by Ascochyta lentis (Didymella
lentis); in faba beans by Ascochyta fabae (Didymella
fabae); and in field pea by Ascochyta pinodes
(teleomorph: Mycosphaerella pinodes), Ascochyta
pisi and Phoma medicaginis var pinodella, formerly
known as Ascochyta pinodella. The pathogens attack
P. W. J. Taylor (&) � R. Ford
Centre for Plant Health/BioMarka, School of Agriculture
and Food Systems, Faculty of Land and Food Resources,
The University of Melbourne, Parkville, Melbourne, VIC
3010, Australia
e-mail: [email protected]
123
Eur J Plant Pathol (2007) 119:127–133
DOI 10.1007/s10658-007-9177-x
above ground parts of plants and may produce
phytotoxins that lead to necrosis (Tivoli et al.
2006). Knowledge of the biology of ascochyta blight
of cool season food and feed legumes will lead to the
development and implementation of better control
methods for these pathogens. This review will focus
on progress that has been made on developing
diagnostic techniques to identify the Ascochyta
species, studying the genetic diversity of the patho-
gens, and identifying pathogenic variation.
Diagnostics for detection and identification
Spread and development of ascochyta blight diseases
can occur through splash and airborne conidia and/or
ascospores as well as by commercial distribution of
plant material or seeds (Tivoli et al. 2006). Therefore,
development of effective disease management
depends among others on the rapid detection and
precise identification of the pathogen. Traditionally,
identification and characterization of fungal species
has been based on morphological characters such as
size and shape of conidia and appressoria, teleomorph
state and cultural characters such as colony colour,
growth rate and texture. These criteria alone have not
always been adequate due to overlap in morphological
characters; and phenotypic variation among related
species and under different environmental conditions.
To overcome the inadequacies of these traditional
techniques, PCR amplification of specific gene
sequences has been employed to characterise and
analyse the taxonomic complexity of various genera
(Faris-Mokaiesh et al. 1996; Phan et al. 2002; Ford
et al. 2004). As well, PCR amplification of diagnostic
sequences was shown to be highly sensitive to detect
small amounts of the organism within the plant tissue,
and specific enough to detect only the targeted species
(Phan et al. 2002). PCR-based techniques efficiently
detect pathogens, especially those that remain latent in
the plant tissue and seeds.
PCR techniques based on amplification of the
ribosomal DNA (rDNA) internal transcribed spacer
(ITS) region have been used widely for the differen-
tiation and detection of closely related fungal species
(Nazar et al. 1991; Levesque et al. 1994; Tisserat
et al. 1994; Faris-Mokaiesh et al. 1996). Ribosomal
genes are suitable for use as molecular probes
because of their high copy number. Despite the high
conservation between functional rDNA coding se-
quences, the nontranscribed and ITS regions are
usually less conserved and are thus suitable as target
sequences for the detection of recent evolutionary
divergence.
Using restriction enzyme digestion of PCR-ampli-
fied ITS regions of the 18–25S ribosomal genes, Phan
et al. (2002) differentiated A. rabiei, A. pinodes,
A. lentis and A. fabae. However, A. lentis and
A. fabae were identical in this genomic region
indicating that they may have diverged more recently
than other Ascochyta species. Using a similar PCR-
RFLP technique, Faris-Mokaiesh et al. (1996) distin-
guished A. pisi from A. pinodes and P. medicaginis
var. pinodella but could not differentiate A. pinodes
from P. medicaginis var. pinodella. However, Bouz-
nad et al. (1995) was able to separate A. pisi from the
other two fungi using RAPD analysis. To elucidate
the taxonomy further and for a more specific
diagnostic tool, less conserved genes such as b-
tubulin and the translation elongation factor (TEF)
(O’Donnell et al. 1998) should be sequenced for each
Ascochyta species.
The PCR test that Phan et al. (2002) developed
was able to detect ascochyta blight of chickpea with
sensitivity to 0.1 pg of A. rabiei genomic DNA.
Nevertheless, a diagnostic technique is only as good
as the procedure used to sample the population.
Strategies need to be developed to increase the
likelihood of detecting a low level of infection
especially in seed that will be distributed for planting.
Phan et al. (2002) developed an efficient method for
detecting A. rabiei infection in chickpea seed that
could be used to assess samples of seed prior to
distribution and planting. Samples of chickpea seed
(100 per batch) were incubated in a liquid fungal
growth medium (Czapek-Dox) for 12–18 h prior to
analysis with PCR. The test was successful in
detecting a 1% level of infection in commercial
chickpea seed samples (Phan et al. 2002). Develop-
ment of efficient diagnostic techniques to detect
latent infection of ascochyta blight pathogens in plant
tissue, such as seed, will restrict the importation of
more aggressive isolates into countries where cool
season food legumes are grown. The development of
PCR-based diagnostic tests for the other legume
Ascochyta species would also be useful for detecting
latent infection in seed and help minimize the spread
and outbreak of diseases.
128 Eur J Plant Pathol (2007) 119:127–133
123
Genetic diversity
Knowledge of the genetic diversity of a pathogen
population will lead to an understanding of how the
pathogen is likely to adapt or evolve to changes in the
environment, such as exposure to fungicides and
resistant plant genotypes (McDonald and Linde
2002). Genetic diversity can be measured using
dominant molecular markers that randomly amplify
genomic sequences but provide limited information
on diversity between and within populations, or with
co-dominant molecular markers that can measure
gene flow through allelic variation between popula-
tions. Measuring allelic variation can provide an
indication of the level of genetic diversity and genetic
differentiation that has resulted from evolutionary
forces acting on the genes (McDonald and Linde
2002). Breeding programmes can therefore be opti-
mized to screen germplasm for resistance with
pathogen isolates that are both representative of the
overall genomic variation and the pathogenic varia-
tion of the pathogen population.
Ascochyta pathogens are heterothallic since they
possess a single mating type locus (MAT) with two
alternate forms (MAT1-1 and MAT1-2) that must be
different for two isolates to mate (Trapero-Casas and
Kaiser 1992; Wilson and Kaiser 1995). Sexual
recombination within these species may be a poten-
tially significant major factor in determining popula-
tion structure, as it results in the generation of new
and potentially stable genotypes and thus contributes
to genetic diversity and adaptive potential (Milgroom
1996; McDonald and Linde 2002).
The Ascochyta pathogens have been shown to be
genetically quite diverse in many countries where the
host and pathogen have co-existed for a long time
(Wilson and Kaiser 1995). The level of genetic
diversity was found to be quite high in populations of
A. rabiei isolated from chickpea plants from a broad
range of countries (Syria and Lebanon–Udupa et al.
1998; Spain–Navas-Cortes et al. 1998; Pakistan–
Jamil et al. 2000; Canada–Chongo et al. 2004).
However, the use of dominant molecular markers
used in these analyses and in most cases the small
sample sizes resulted in a lack of knowledge on the
population structures.
Barve et al. (2004) used a specific microsatellite
locus to identify a high level of genetic diversity in
A. rabiei isolates from 16 countries. Analysis of
isolates of A. rabiei from the USA using AFLP, SSR
markers and the mating type locus (MAT1-1) indi-
cated that most of the diversity of A. rabiei originated
from the introduction of a large number of isolates
into the USA between 1983 and 1984 (Peever et al.
2004). In a recent study, Rhaiem et al. (2006) found a
high level of allelic diversity of SSR loci in A. rabiei
isolates obtained from five chickpea-growing regions
in Tunisia that formed two main sub-populations.
Analysis of the MAT loci in these populations
indicated that MAT1-2 may have been most recently
introduced through two independent introductions.
In contrast, Phan et al. (2003a) and Pradhan (2006)
found that in Australia, the genetic diversity among
A. rabiei isolates collected between 1995 and 2003
was very low when measured using SSR markers
compared to the diversity detected among isolates
from Tunisia, Syria, Canada and USA. Also, only one
mating type (MAT1-2) has been detected in Australia
despite the discovery of the teleomorph in the field
(Galloway and Macleod 2003). Mating type was
studied using PCR-based primers specific to the MAT
genes (Phan et al. 2003b, Barve et al. 2003). The lack
of diversity detected in Australia may reflect a founder
effect whereby the pathogen was recently introduced
into Australia and then subsequently quickly spread to
all chickpea-growing areas, most likely by infected
seed. Given that most Australian-grown chickpea
genotypes are moderately to highly susceptible to the
pathogen, it is reasonable to expect that the pathogen
would not have been subjected to selection pressure
caused by host resistance. However, the recent release
of moderately resistant genotypes may cause greater
selection pressure on the pathogen and potentially
lead to an increase in variation. Accordingly, the
Australian A. rabiei population will be monitored
closely over the coming seasons for potential changes
in genetic diversity, particularly in areas where new
resistance sources are sown.
A high amount of genetic diversity was detected
with RAPD analysis among Australian A. lentis
isolates of both mating types (Ford et al. 2000). The
isolates most geographically close were most genet-
ically related and a similar level in diversity was
detected within Australia as in other lentil-growing
regions of the world. In contrast, Onfroy et al. (1999)
found very little intraspecific diversity using RAPD
analysis among 50 isolates of A. pinodes collected
from infected field peas grown in France.
Eur J Plant Pathol (2007) 119:127–133 129
123
Pathogenic variation
Knowledge of pathogenic diversity is important when
choosing appropriate isolates to screen for resistance
in plant breeding programmes. Many studies have
shown pathogenic diversity among isolates within a
particular Ascochyta species via screening on a set of
differential genotypes or cultivars. However, there is
concern as to whether true pathotype differences exist
or if the differences observed in disease severity are a
measure of the natural distribution of aggressiveness
within a population, ranging from low to high. A
pathotype can be defined as a subclass or group of
isolates distinguished from others of the same species
by its virulence on a specific host (genotype) i.e., a
qualitative difference in disease severity. In contrast,
aggressiveness reflects the natural variation in viru-
lence or level of disease (measured quantitatively)
within the pathogen population. Often the terminol-
ogy for pathotypes is interchanged with races,
however, an isolate of a pathogen can only be defined
as a race when a qualitative difference in virulence
occurs where host resistance genes are defined in a
set of differential genotypes.
While Wroth (1998) and Onfroy et al. (1999)
found no evidence for A. pinodes pathotypes among
Australian and French isolates based on virulence,
Ali et al. (1978) reported that in Australia, 15
pathotypes existed for A. pinodes. Onfroy et al.
(1999) screened 10 A. pinodes isolates on six field
pea genotypes, and scored severity of infection on the
first four leaves and internodes of inoculated plants
grown under controlled conditions in a glasshouse.
Ali et al. (1978) determined pathotypes based on the
degree of lesion development on leaves and stems of
38 field pea genotypes grown in field trials. In
Canada, Xue et al. (1998) differentiated 22 patho-
types of A. pinodes by their differential reaction on 21
field pea genotypes; pathotypes specific for leaf (16)
and stem (9) infection have also been reported
(Clulow et al. 1991). Ali et al. (1978) also reported
the existence of 13 pathotypes for A. pisi using a
similar assessment to that used for identifying
pathotypes of A. pinodes. Differences in host or
organ infection by different isolates may be related to
differences in methodologies used in the studies and
in the interpretation of the scoring for disease severity
or aggressiveness. Qualitative differences in infection
of genotypes by different isolates would give a
clearer indication of the existence of pathotypes
whereas quantitative differences could be interpreted
as variation in aggressiveness within the population.
For A. rabiei, the classification of isolates from
Syria into three pathogenicity groups (I, II, III) has
been widely accepted (Udupa et al. 1998; Chen et al.
2004; Jayakumar et al. 2005). Udupa et al. (1998)
found quantitative levels of infection (aggressive-
ness) among 53 isolates on three host genotypes. In
Australia (Pradhan 2006), USA (Chen et al. 2004)
and Canada (Jayakumar et al. 2005), pathotypes I and
II have been recorded, while in India there were
reports of up to 13 pathotypes (Vir and Grewal 1974),
and 3 in Pakistan (Jamil et al. 2000). However, these
reports of pathotypes were based on severity of
infection on a small range of genotypes and were
simply a measure of aggressiveness or virulence
within the population of A. rabiei in each country. In
Canada, Chongo et al. (2004) reported the presence of
14 pathotypes of A. rabiei based on quantitative
differences in infection of stem and leaves of eight
chickpea genotypes. Although a range of quantitative
levels of infection were shown, only two isolates
showed a qualitative difference in infection where
they were unable to infect the resistant genotype
ILC4421 compared to all the other isolates that
infected this genotype. Thus these were the only two
isolates that represented a second pathotype. The
range of virulence or qualitative infection in ILC4421
for the other 38 isolates of pathotype 1 was from 0.4
to 2.4 on a 0–9 scale. The most aggressive isolate was
able to infect all genotypes with the least level of
infection occurring on the resistant genotypes
FLIP83-48 and ILC4421.
Interestingly, in Israel Lichtenzveig et al. (2005)
could not identify pathotypes although both mating
types of the pathogen were detected in all chickpea-
growing areas of the country. Israel is geographically
close to the centre of origin of chickpeas and thus it
may be assumed that co-evolution of A. rabiei and
chickpea had occurred; however, none of the isolates
screened belonged to the more aggressive pathogenic
types II and III reported in Syria Udupa et al. (1998).
For A. lentis, six pathotypes were identified in
Australia (Nasir and Bretag 1997). Although several
of these pathotypes were associated with specific
resistance genes in different lentil genotypes, the
assessments were based on quantitative differences in
pathogenicity. Since resistance to A. lentis was found
130 Eur J Plant Pathol (2007) 119:127–133
123
to be controlled by specific resistance genes (Ford
et al. 1999; Nguyen et al. 2001), there is the
likelihood that pathotypes of A. lentis evolved that
had qualitative differences on lentil genotypes. In
contrast, Banniza and Vandenberg (2006) reported
that the host reaction of 16 lentil genotypes to 65
isolates of A. lentis collected in Canada resulted in a
continuum of severity of infection. These results
indicated natural variation of aggressiveness in the
population without any distinct pathotypes. For
A. fabae, physiological specialisation between host
genotype and pathogen isolate has been proposed
with identification of up to seven pathotypes (Rashid
et al. 1991).
In order to better determine and compare the
pathogenic diversity among isolates from different
growing regions around the world, the adoption of an
accepted set of host genotypes that are differential in
their disease reaction to each of the particular
Ascochyta species and a standard screening method
for scoring disease severity are required.
Although there is debate on the existence of
specific pathotypes of each of the Ascochyta spp.
pathogens on their respective hosts there is no doubt
that the level of aggressiveness of isolates is an
important consideration in resistance breeding pro-
grammes. Genotypes with partial resistance, that
result in lower levels of infection will ultimately
reduce the inoculum potential in the field and limit or
slow down an epidemic potential. Resistance to
ascochyta blight in temperate legumes such as
chickpea and field peas has been shown to be
quantitative (Timmerman et al. 2002; Flandez-Galvez
et al. 2003) thus making it difficult for pathotypes to
evolve where the pathogen has specific avirulence
genes. Nevertheless, there is a need to standardise the
screening and evaluation methods used in bioassays
for identifying both the level of resistance in the
germplasm and the level of aggressiveness of the
pathogen. The severity of infection on a range of
genotypes is usually measured using a 0–9 non-
parametric scale where 0 represents complete resis-
tance and 9 a high level of susceptibility. However, a
parametric scoring system or quantitative measure of
severity and incidence of infection has also been used
to measure the level of infection eg % leaf area
infected and size of lesion relative to stem size
(Flandez-Galvez et al. 2003; Lichtenzveig et al. 2002;
Chongo et al. 2004; Tivoli et al. 2006). In assessing
resistance to A. rabiei in chickpea, Flandez-Galvez
et al. (2003) adapted the linear stem index scale of
Riahi et al. (1990) to measure the number of lesions
and lesion length in relation to stem length, and
identified maturity resistance in adult chickpea plants.
Lichtenzveig et al. (2002) evaluated disease response
in chickpeas using an assessment based on the
transformed ‘area under the disease progress curve’
(AUDPC) and found that resistance to ascochyta
blight was conditioned by a single quantitative trait
locus with other minor loci contributing to resistance.
In conclusion, the development of efficient diag-
nostic techniques to detect latent infection of asco-
chyta blight pathogens in seeds and plant tissue, the
understanding of population diversity, and identifica-
tion of pathogenic variation will assist in the man-
agement of ascochyta blight diseases. The detection
of latent infection will restrict the importation of
more aggressive isolates into countries where cool
season food legumes are grown or prevent the spread
into areas where the pathogen does not exist. Efficient
sampling and PCR-based techniques are currently
only available for detecting ascochyta blight of
chickpea in seed, and need to be developed for the
other ascochyta blight diseases. Further studies are
required into the population genetics of the ascochyta
blight pathogens as this will lead to an understanding
of how the pathogen is likely to adapt or evolve to
changes in the environment, such as exposure to
fungicides and resistant plant genotypes. In studying
pathogenic variation there needs to be consistency in
selection of differential host genotypes, screening
conditions and disease evaluation techniques for each
of the Ascochyta species. Knowledge of pathogen
genomic variation, pathotype diversity and aggres-
siveness within populations of each of the ascochyta
blight pathogens is critical to the success of breeding
programmes to select for resistant genotypes.
References
Ali, S. M., Nitschke, L. F., Dube, A. J., Krause, M. R., &
Cameron, B. (1978). Selection of pea lines for resistance
to pathotypes of Ascochyta pinodes, A. pisi and Phomamedicaginis var. pinodella. Australian Journal of Agri-cultural Research, 29, 841–849.
Banniza, S., & Vandenberg, A. (2006). Investigations into the
population structure of Ascochyta lentis in western Can-
ada. Proceedings of the 1st International Ascochyta
workshop on grain legumes. Le Tronchet, France.
Eur J Plant Pathol (2007) 119:127–133 131
123
Barve, M. P., Arie, T., Salimath, S., Muehlbauer, F. J., & Pe-
ever, T. L. (2003). Cloning and characterization of the
mating type (MAT) locus from Ascochyta rabiei (teleo-
morph: Didymella rabiei) and a MAT phylogeny of le-
gume-associated Ascochyta spp. Fungal Genetics andBiology, 39, 151–167.
Barve, M. P., Santra, D. K., Ranjekar, P. K., & Gupta, V. S.
(2004). Genetic diversity analysis of a world-wide col-
lection of Ascochyta rabiei isolates using sequence tagged
microsatellite markers. World Journal of Microbiology &Biotechnology, 20, 735–741.
Bouznad, Z., Corbiere, R., Elbiari, A., & Spire, D. (1995).
Identification of Ascochyta species of legumes by random
amplified polymorphic DNA. Proceedings of the 2nd
European Conference on Grain legumes. Copenhagen,
Denmark.
Chen, W., Coyne, C. J., Peever, T. L., & Muehlbauer, F. J.
(2004). Characterisation of chickpea differentials for
pathogenicity assay of ascochyta blight and identification
of chickpea accessions resistant to Didymella rabiei. PlantPathology, 53, 759-769.
Chongo, G., Gossen, B. D., Buckwaldt, L., Adhikari, T., &
Rimmer, S. R. (2004). Genetic diversity of Asochyta ra-biei in Canada. Plant Disease, 88, 4–10.
Clulow, S. A., Lewis, B. G., & Mathews, P. (1991). A patho-
type classification for Mycosphaerella pinodes. Journal ofPhytopathology, 131, 322–332.
Faris-Mokaiesh, S., Boccara, M., Denis, J. B., Derrien, A., &
Spire, D. (1996). Differentiation of the ‘Ascochyta com-
plex’ fungi of pea by biochemical and molecular markers.
Current Genetics, 29, 182–190.
Flandez-Galvez, H., Ford, R., Pang, E. C. K., Ades, P. K., &
Taylor, P. W. J. (2003). QTL analysis for ascochyta blight
resistance in an intraspecific population of chickpea
(Cicer arietinum). Theoretical and Applied Genetics, 107,
1257–1265.
Ford, R., Pang, E. C. K., & Taylor, P. W. J. (1999). Genetics of
resistance to ascochyta blight (Ascochyta lentis) of lentil
and identification of closely linked molecular markers.
Theoretical and Applied Genetics, 98, 93–98.
Ford, R., Garnier-Gere, P., Nasir, M., & Taylor, P. W. J.
(2000). The structure of Ascochyta lentis in Australia re-
vealed with RAPD markers. Australasian Plant Pathol-ogy, 29, 36–45.
Ford, R., Banniza, S., Photitia, W., & Taylor, P. W. J. (2004).
Identification of anthracnose (Colletotrichum truncatum)
from Canadian lentil. Australasian Plant Pathology, 33,
1–11.
Galloway, J., & Macleod, W. J. (2003). Didymella rabiei, the
teleomorph of Ascochyta rabiei, found on chickpea stub-
ble in Western Australia. Australasian Plant Pathology,32, 127–128.
Jamil, F. F., Sarwar, N., & Sarwar, M. (2000). Genetic and
pathogenic diversity within Ascochyta rabiei (Pass.)
Laboratory populations in Pakistan causing blight of
chickpea (Cicer arietinum L). Physiological and Molec-ular Plant Pathology, 57, 243–254.
Jayakumar, P., Gossen, B. D., Gan, Y. T., Warkentin, T. D., &
Banniza, S. (2005). Ascochyta blight of chickpea: Infec-
tion and host resistance mechanisms. Canadian Journal ofPlant Pathology, 27, 499–509.
Levesque, A. C., Vrain, T. C., & Deboer, S. H. (1994). Pro-
duction of species-specific probes for different Pythiumspecies using PCR and ribosomal DNA. Phytopathology,84, 474–478.
Lichtenzveig, J., Shtienberg, D., Zhang, H. B., Bonfil, D. J., &
Abbo, S. (2002). Biometric analyses of the inheritance of
resistance to Didymella rabiei in chickpea. Phytopathol-ogy, 92, 417–423.
Lichtenzveig, J., Gamliel, E., Frenkel, O., Michaelido, S.,
Abbo, S., Sherman, A., & Shtienberg, D. (2005). Distri-
bution of mating types and diversity in virulence of Di-dymella rabiei in Israel. European Journal of PlantPathology, 113, 15–24.
Milgroom, M. G. (1996). Recombination and the multilocus
structure of fungal populations. Annual Review of Phyto-pathology, 34, 457–477.
McDonald, B. A., & Linde, C. (2002). Pathogen population
genetics, evolutionary potential, and durable resistance.
Annual Review of Phytopathology, 40, 349–379.
Nasir, M, & Bretag, T. W. (1997). Pathogenic variability in
Australian isolates of Ascochyta lentis. Australasian PlantPathology, 26, 217–220.
Navas-Cortes, J. A., Perez-Artes, E., Jimenez-Diaz, R. N.,
Llobell, A., Bainbridge, B. W., & Heale, J. B. (1998).
Mating type, pathotype and RAPDs analysis in Didymellarabiei, the agent of Ascochyta blight of chickpea. Phy-toparasitica, 26, 199–212.
Nazar, R. N., Hu, X., Schmidt, J., Culham, D., & Robb, J.
(1991). Potential use of PCR-amplified ribosomal inter-
genic sequences in the detection and differentiation of
Verticillium wilt pathogens. Physiological MolecularPlant Pathology, 39, 1–11.
Nguyen, T. T., Taylor, P. W. J., Brouwer, J. B., Pang, E. C. K.,
& Ford, R. (2001). A novel source of resistance in lentil
(Lens culinaris ssp. culinaris) to ascochyta blight caused
by Ascochyta lentis. Australasian Plant Pathology, 30,
211–215.
O’Donnell, K., Cigilink, E., & Nirenberg, H. I. (1998).
Molecular systematics and pylogeography of the Gibe-rella fujikuroi species complex. Mycologia, 90, 465–493.
Onfroy, C., Tivoli, B., Corbiere, R., & Bouznad, Z. (1999).
Cultural, molecular and pathogenic variability of My-cosphaerella pinodes and Phoma medicaginis var. pi-nodella isolates from dried pea (Pisum sativum) in France.
Plant Pathology, 48, 218–229.
Peever, T. L., Salimath, S. S., Su, G., Kaiser, J., & Muehlbauer,
F. J. (2004). Historical and contemporary multilocus
population structure of Ascochyta rabiei (teleomorph:
Didymella rabiei) in the Pacific Northwest of the United
States. Molecular Ecology, 13, 291–309.
Phan, H. T. T., Ford, R., Bretag, T., & Taylor, P. W. J. (2002).
A rapid and sensitive PCR assay for detection of Asco-chyta rabiei, the cause of ascochyta blight of chickpea.
Australasian Plant Pathology, 31, 31–39.
Phan, H. T. T., Ford, R., & Taylor, P. W. J. (2003a). Population
structure of Ascochyta rabiei in Australia based on STMS
fingerprints. Fungal Diversity, 13, 111–129.
Phan, H. T. T., Ford, R., & Taylor, P. W. J. (2003b). Mapping
the mating type locus of Ascochyta rabiei, the causal
agent of ascochyta blight of chickpea. Molecular PlantPathology, 4, 373–381.
132 Eur J Plant Pathol (2007) 119:127–133
123
Pradhan, P. (2006). Studies of Ascochyta rabiei in Australia. M
Agr Sci thesis, University of Melbourne.
Riahi, H., Harrabi, M. M., Halila, M. H., & Strange, R. N.
(1990). A quantitative scale for assessing chickpea reac-
tion to Ascochyta rabiei. Canadian Journal of Botany, 68,
2736–2738.
Rashid, K. Y., Bernier, C. C., & Conner, R. L. (1991). Eval-
uation of faba bean for resistance to Ascochyta fabae and
development of host differentials for race identification.
Plant Disease, 75, 852–855.
Rhaiem, A., Cherif, M., Peever, T. L., Dyer, P. S., & Strange,
R. N. (2006). Population structure and mating system of
Didymella rabiei in Tunisia. Proceedings of the 1st
International Ascochyta workshop on grain legumes. Le
Tronchet, France.
Trapero-Casas, A., & Kaiser, W. J. (1992). Development of
Didymella rabiei, the teleomorph of Ascochyta rabiei, on
chickpea straw. Phytopathology, 82, 1261–1266.
Timmerman, G. M., Frew, T. J., Russell, A. C., Khan, T.,
Butler, R., Gilpin, M., Murray, S., & Falloon, K. (2002).
Mapping of partial resistance to field epidemics of asco-
chyta blight of pea. Crop Science, 42, 2100–2111.
Tisserat, N. A., Hulbert, S. H., & Sauer, K. M. (1994).
Selective amplification of rDNA internal transcribed
spacer regions to detect Ophiosphaerella korrae and
O. herpotricha. Phytopathology, 84, 478–482.
Tivoli, B., Baranger, A., Avila, C. M., Banniza, S., Barbetti,
M., Chen, W., Davidson, J., Lindeck, K., Kharrat, M.,
Rubiales, D., Sadiki, M., Sillero, J. C., Sweetingham, M.,
& Muehlbauer, F. J. (2006). Screening techniques and
sources of resistance to foliar diseases caused by major
necrotrophic fungi in grain legumes. Euphytica, 147, 223–
253.
Udupa, S. M., Weigand, F., Saxena, M. C., & Kahl, G. (1998).
Genotyping with RAPD and microsatellite markers re-
solves pathotype diversity in the ascochyta blight of
chickpea. Theoretical and Applied Genetics, 97, 299–307.
Vir, S., & Grewal, J. S. (1974). Physiologic specialization in
Ascochyta rabiei, the causal organism of gram blight.
Indian Phytopathology, 27, 355–360.
Wilson, A. D., & Kaiser, W. J. (1995). Cytology and genetics
of sexual incompatibility in Didymella rabiei. Mycologia,87, 795–804.
Wroth, J. M. (1998). Variation in pathogenicity among and
within Mycosphaerella pinodes populations collected
from field pea in Australia. Canadian Journal of Botany,76, 1955–1966.
Xue, A. G., Warkentin, T. D., Gossen, B. D., Burnett, P. A.,
Vandenberg, A., & Rashid, K. Y. (1998). Pathogenic
variation of western Canadian isolates of Mycosphaerellapinodes on selected Pisum genotypes. Canadian Journalof Plant Pathology, 20, 189–193.
Eur J Plant Pathol (2007) 119:127–133 133
123
REVIEW PAPER
Resistance to ascochyta blights of cool season food legumes
Fred J. Muehlbauer Æ Weidong Chen
Received: 5 December 2006 / Accepted: 24 May 2007 / Published online: 3 July 2007
� KNPV 2007
Abstract Ascochyta blights are the most important
diseases of cool season food legumes (peas, lentils,
chickpeas, and faba beans) and are found in nearly all
production regions. Despite having the same common
disease name, the pathogen species differ for each of
the crops. These diseases cause serious yield losses
under favourable cool and humid conditions. Planting
resistant cultivars is often the first choice and most
economical means in managing the diseases. There-
fore breeding for resistance to ascochyta blights has
been an important objective of many cool season
food legume research programmes. Systematic
screening of germplasm collections at international
research centres and other national research pro-
grammes have identified useful resistance sources
that have been used successfully to breed resistant or
tolerant cultivars. Genetic studies have revealed
inheritance patterns of the resistance genes. Genetic
linkage analyses and QTL mapping have identified
molecular markers that could be useful for marker-
assisted selection and gene pyramiding. In general,
research towards developing resistance to ascochyta
blights in cool season food legume faces mainly two
limitations: the lack of availability of efficient
resistance sources and the lack of a good understand-
ing of the variability of the pathogen populations.
Research efforts to alleviate these limitations should
be pursued. Given that modern technologies of
marker development and genomics are available,
further advances in deploying resistance to manage
ascochyta blights in this group of legume crops will
depend on concerted efforts in developing accurate
screening procedures with adequate knowledge of
pathogen variability and identification of additional
sources of resistance.
Keywords Disease resistance � Quantitative trait
loci � Marker assisted selection � Disease screening �Inheritance � Breeding for disease resistance � Pisum
sativum � Peas � Lens culinaris � Lentil � Cicer
arietinum � Chickpea � Vicia faba � Faba bean
Introduction
Peas (Pisum sativum), lentil (Lens culinaris), chick-
pea (Cicer arietinum) and faba bean (Vicia faba) are
important food crops throughout the world and are
produced on nearly 25 million hectares with annual
production approaching 40 million metric tons
(FAOSTAT 2004). Total production ranges from
over 20 million metric tons for pea to about 4 million
metric tons for lentil (FAOSTAT 2004). These cool
season food legumes are affected by a number of
foliar and root diseases that cause wide spread
damage and in severe cases cause complete crop
F. J. Muehlbauer (&) � W. Chen
U.S. Department of Agriculture, Agricultural Research
Service, Washington State University, 303 Johnson Hall,
Pullman, WA 99164-6434, USA
e-mail: [email protected]
123
Eur J Plant Pathol (2007) 119:135–141
DOI 10.1007/s10658-007-9180-2
loss. The most important foliar diseases worldwide are
ascochyta blights. Although the diseases are collec-
tively referred to as ascochyta blights due to similar
symptoms, the pathogen species differ for each of the
crops (Hernandez-Bello et al. 2006) and host specificity
is necessary for disease development. The ascochyta
blight complex of pea involves three pathogens,
Ascochyta pisi, Mycosphaerella pinodes, and Phoma
medicaginis var. pinodella (formerly Ascochyta pinod-
ella). The disease is a complex because the three
pathogens cause more or less similar symptoms and
they frequently occur together. In the case of lentil, the
crop is affected by Ascochyta lentis that causes leaf and
stem spotting, leaf drop, stem lesions and seed lesions
that result in serious reductions of yield and crop
quality. Ascochyta blight of chickpea is caused by
Ascochyta rabiei (Didymella rabiei) that causes severe
symptoms on the leaves, stem breakage and die back,
and often is cited as causing complete crop loss (Nene
and Reddy 1987). Similar symptoms on faba bean
incited by Ascochyta fabae cause yield losses and
reduce seed quality.
Resistance to ascochyta blight in the cool season
food legumes has been sought through germplasm
exploration, collection, and systematic evaluation.
Sources of partial resistance have been identified in
all of the cool season food legumes and the currently
available resistance is being used in breeding pro-
grammes designed to develop cultivars with im-
proved resistance. Since there are some recent
reviews on breeding methods, screening procedures,
the ascochyta diseases and biology of the pathogens
(Bretag et al. 2006; Pande et al. 2005; Tivoli et al.
2006; Torres et al. 2006; Ye et al. 2002), we will in
this review mainly focus on the recent developments
in understanding the genetics of host resistance for
each of the major cool season food legumes and point
out immediate needs in research that in our opinion
will further advance deployment of resistance in
managing ascochyta blight in cool season food
legumes.
Peas
Ascochyta blight of pea is a disease complex caused
by three pathogens: Ascochyta pisi which causes
well-defined lesions (spots) on leaves, stems and
pods; Phoma medicaginis var. pinodella, previously
Ascochyta pinodella, which causes lesions on leaves
and stems, and foot rot; and Mycosphaerella pinodes
which causes blight starting with small purple to
black spots, enlarging and turning brown to black.
The disease complex, its epidemiology, screening
techniques and management were recently reviewed
(Tivoli et al. 2006). Methods of screening for
resistance have relied on field nurseries and natural
infection by the pathogen through dispersal of
airborne ascospores from debris of previously
infected pea crops. In general no complete resistance
to the ascochyta blight complex has been identified in
peas; however good sources of partial resistance have
been identified and are being used in breeding
programmes (Tivoli et al. 2006). Screening of the
USDA-ARS collection of pea germplasm was suc-
cessful in identifying sources of partial resistance to
M. pinodes in five accessions (PI 142441, PI 142442,
PI 381132, PI 404221 and PI 413691); however, none
of the accessions were more resistant than the
cv. Radley. Other sources of resistance have been
identified and include cv. Carneval (Tar’an et al.
2003) and accessions JI 97 and JI 1089 from the John
Innes Institute Collection. Accessions of the wild pea
species, P. fulvum have also shown some resistance to
ascochyta blight.
A relationship between lodging traits and resis-
tance to ascochyta blight was found (Banniza et al.
2005) indicating that stem structural components may
have a role in resistance. Thus, upright plant habit
with resistance to lodging appears to be an important
factor in reducing disease severity.
Most of the genetic studies on pea resistance
focused on resistance to M. pinodes possibly because
it is the most destructive pathogen of the three
involved. The genetics of resistance to ascochyta
blight in peas indicate a multiple gene system with
some dominance and additive genetic effects (Wroth
1999). Estimates of quantitative trait loci (QTL) for
resistance to ascochyta blight have ranged from three
(Tar’an et al. 2003) to 13 (Timmerman-Vaughan
et al. 2004) (Table 1). The complex nature of
resistance, as indicated by the number of QTL that
have been estimated, presents a challenge to breeders
and the prospect of making use of marker assisted
selection for ascochyta blight resistance in peas.
Development of cultivars with improved resistance
to the disease will depend on the use of germplasm
with partial resistance to ascochyta blight with
136 Eur J Plant Pathol (2007) 119:135–141
123
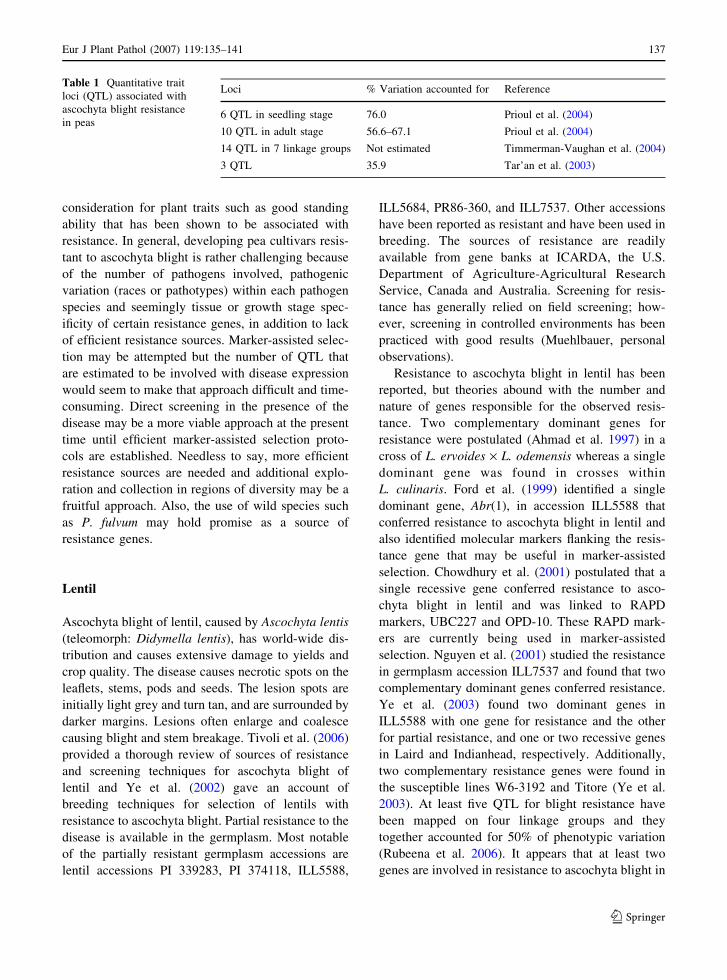
consideration for plant traits such as good standing
ability that has been shown to be associated with
resistance. In general, developing pea cultivars resis-
tant to ascochyta blight is rather challenging because
of the number of pathogens involved, pathogenic
variation (races or pathotypes) within each pathogen
species and seemingly tissue or growth stage spec-
ificity of certain resistance genes, in addition to lack
of efficient resistance sources. Marker-assisted selec-
tion may be attempted but the number of QTL that
are estimated to be involved with disease expression
would seem to make that approach difficult and time-
consuming. Direct screening in the presence of the
disease may be a more viable approach at the present
time until efficient marker-assisted selection proto-
cols are established. Needless to say, more efficient
resistance sources are needed and additional explo-
ration and collection in regions of diversity may be a
fruitful approach. Also, the use of wild species such
as P. fulvum may hold promise as a source of
resistance genes.
Lentil
Ascochyta blight of lentil, caused by Ascochyta lentis
(teleomorph: Didymella lentis), has world-wide dis-
tribution and causes extensive damage to yields and
crop quality. The disease causes necrotic spots on the
leaflets, stems, pods and seeds. The lesion spots are
initially light grey and turn tan, and are surrounded by
darker margins. Lesions often enlarge and coalesce
causing blight and stem breakage. Tivoli et al. (2006)
provided a thorough review of sources of resistance
and screening techniques for ascochyta blight of
lentil and Ye et al. (2002) gave an account of
breeding techniques for selection of lentils with
resistance to ascochyta blight. Partial resistance to the
disease is available in the germplasm. Most notable
of the partially resistant germplasm accessions are
lentil accessions PI 339283, PI 374118, ILL5588,
ILL5684, PR86-360, and ILL7537. Other accessions
have been reported as resistant and have been used in
breeding. The sources of resistance are readily
available from gene banks at ICARDA, the U.S.
Department of Agriculture-Agricultural Research
Service, Canada and Australia. Screening for resis-
tance has generally relied on field screening; how-
ever, screening in controlled environments has been
practiced with good results (Muehlbauer, personal
observations).
Resistance to ascochyta blight in lentil has been
reported, but theories abound with the number and
nature of genes responsible for the observed resis-
tance. Two complementary dominant genes for
resistance were postulated (Ahmad et al. 1997) in a
cross of L. ervoides · L. odemensis whereas a single
dominant gene was found in crosses within
L. culinaris. Ford et al. (1999) identified a single
dominant gene, Abr(1), in accession ILL5588 that
conferred resistance to ascochyta blight in lentil and
also identified molecular markers flanking the resis-
tance gene that may be useful in marker-assisted
selection. Chowdhury et al. (2001) postulated that a
single recessive gene conferred resistance to asco-
chyta blight in lentil and was linked to RAPD
markers, UBC227 and OPD-10. These RAPD mark-
ers are currently being used in marker-assisted
selection. Nguyen et al. (2001) studied the resistance
in germplasm accession ILL7537 and found that two
complementary dominant genes conferred resistance.
Ye et al. (2003) found two dominant genes in
ILL5588 with one gene for resistance and the other
for partial resistance, and one or two recessive genes
in Laird and Indianhead, respectively. Additionally,
two complementary resistance genes were found in
the susceptible lines W6-3192 and Titore (Ye et al.
2003). At least five QTL for blight resistance have
been mapped on four linkage groups and they
together accounted for 50% of phenotypic variation
(Rubeena et al. 2006). It appears that at least two
genes are involved in resistance to ascochyta blight in
Table 1 Quantitative trait
loci (QTL) associated with
ascochyta blight resistance
in peas
Loci % Variation accounted for Reference
6 QTL in seedling stage 76.0 Prioul et al. (2004)
10 QTL in adult stage 56.6–67.1 Prioul et al. (2004)
14 QTL in 7 linkage groups Not estimated Timmerman-Vaughan et al. (2004)
3 QTL 35.9 Tar’an et al. (2003)
Eur J Plant Pathol (2007) 119:135–141 137
123
lentil, and the nature of the genes (whether dominant
or recessive) depends on the sources. Based on
current information it is not possible to make
comparisons of the genes that have been identified
or to draw conclusions on the number of genes
involved. Appropriate allelism tests need to be
conducted using common parents followed by uni-
form and systematic screening of the progenies. It is
clear that the expression of those genes may be
altered by variable environmental conditions which
can alter the interpretation of the mode of action of
the genes. Nevertheless, their use in breeding has led
to the development of resistant cultivars such as
Milestone (Vandenberg et al. 2001) and other candi-
date breeding lines with resistance.
Variation in virulence patterns of Ascochyta lentis
has been reported (Ahmed et al. 1996; Ahmed and
Morrall 1996; Nasir and Bretag 1997) and six
pathotypes have been classified in Australia (Nasir
and Bretag 1997). The cultivar Laird, released in
Canada, was initially described as resistant to asco-
chyta blight but is now classified as susceptible. The
reduced resistance of cv. Laird was reported to be due
to the appearance of more virulent pathotypes
(Ahmed et al. 1996). The pathogenic variation has
undoubtedly contributed to the confusion about the
genetics of resistance in lentil to ascochyta blight.
Needless to say, these findings have important
implications for lentil breeding and point out the
need to consider pathogen variation during evaluation
and selection for improved resistance.
Chickpea
Ascochyta blight, caused by Ascochyta rabiei [tele-
omorph: Didymella rabiei var. Arx], is responsible
for widespread damage to chickpea crops worldwide.
The disease causes necrotic lesions on the leaflets,
stems, pods and seeds. Symptoms initially appear as
water-soaked lesions on stems and leaves and turn to
sunken, dark brown lesions with concentric black
speckles of pycnidia. Lesions enlarge and coalesce
under conditions favourable to the disease, causing
leaf blight, stem girdling, stem breakage and plant
death. Pande et al. (2005) provided a review of
pathogen biology and the disease management of
ascochyta blight. A thorough review of ascochyta
blight of chickpea and available sources of resistant
germplasm was recently completed (Tivoli et al.
2006). Most notable of the partially resistant germ-
plasm include accessions from ICARDA such as
ILC-72, ILC-3279, ILC-3868, ILC-3870, ILC-3996
and numerous FLIP lines that have shown resistance
at multiple locations (Reddy and Singh 1984).
Breeding lines from ICARDA such as FLIP90-98C,
FLIP91-22C, FLIP91-46C, FLIP91-2C, FLIP91-24C,
FLIP91-50C, FLIP91-54C, and FLIP91-18C, devel-
oped from resistance sources ILC-72 and ILC-3279,
have also shown a degree of resistance in the field
and in controlled environments (Singh and Reddy
1994). These accessions and others developed at
ICARDA have been used in breeding programmes
worldwide to develop resistant cultivars. Progress
continues to be made in the development of breeding
lines with improved resistance to the disease.
Studies of the genetics of resistance to ascochyta
blight have relied on the use of recombinant inbred
lines (RILs) from crosses between resistant and
susceptible parents and QTL analyses. Santra et al.
(2000) used a set of RILs from the cross of FLIP84-
92C · C. reticulatum (PI 599072) to identify two
QTL (QTL-1 and QTL-2) that in combination
accounted for 50.3 and 45.0% of the variation in
blight scores, respectively, over two years of evalu-
ation. Other studies (Flandez-Galvez et al. 2003;
Collard et al. 2003; Iruela et al. 2006) have identified
QTL for blight resistance in comparable regions of
the genome as those found by Santra et al. (2000)
providing confidence in the presumed locations of the
resistance genes and prospects for marker-assisted
selection and eventual map-based cloning. Likewise,
Lichtenzveig et al. (2006) found three QTL for
resistance that were located on comparable linkage
groups, and a significant epistatic interaction of the
resistance QTL on linkage group 8 with flowering
time.
Marker density in the QTL-1 region of the
chickpea genome was increased by Rakshit et al.
(2003) who used bulked segregant analysis and DNA
amplified fingerprinting (DAF) to identify a marker
directly at the peak of QTL-1 of Santra et al. (2000).
Millan et al. (2003) also identified additional markers
linked to resistance and showed their potential use in
selection. Efforts are currently underway towards fine
mapping of QTL-1 using Bacterial Artificial Chro-
mosome (BAC) libraries (Rajesh et al. 2004). The
BACs of interest are being identified through the use
138 Eur J Plant Pathol (2007) 119:135–141
123
of markers associated with QTL-1 followed by BAC
end sequencing to identify single nucleotide poly-
morphisms for conversion to CAPs and dCAPs
markers. Those markers are then being used to
increase marker density within QTL-1. The increased
marker density provides additional markers for
possible use in marker-assisted selection and should
facilitate cloning and characterization of the resis-
tance genes.
The existence of pathotypes of Didymella rabiei
must be considered in breeding programmes designed
to develop resistant cultivars. There has been a
plethora of classification schemes for pathogenic
variation in D. rabiei, ranging from an initial
description of six races of the pathogen (Singh and
Reddy 1993) to 14 virulence forms or pathotypes
(Chen et al. 2004). The current trend is a more
workable classification into either two or three
pathotypes (Udupa et al. 1998; Chen et al. 2004).
Using a mini-dome technique, Chen et al. (2004) was
able to assign isolates of A. rabiei from the U.S.
Pacific Northwest into two pathotypes (I&II). Isolates
from the two-pathotype system were used to map
pathotype-specific QTL conferring resistance and to
study the mechanisms of resistance in the host (Chen
et al. 2005; Cho et al. 2004; Cho et al. 2005). The
two-pathotype system explains the evolution of US
chickpea cultivars (Chen et al. 2004). The initial
chickpea cultivars (such as Spanish White and UC-5)
introduced into the US Pacific Northwest were shown
to be highly susceptible to both pathotypes I and II;
cultivars developed through breeding for resistance
(such as Sanford and Dwelley) released in the early
1990s had only resistance to pathotype I, while more
recently released cultivars (such as Sierra) were
shown to have resistance to pathotype I and a high
level of tolerance to pathotype II (Chen et al. 2005).
Our current chickpea breeding efforts are to incor-
porate more efficient resistance genes to improve
resistance against pathotype II and to avoid the
potential emergence in the US of a new pathotype
that is highly virulent on chickpea ICC 12004
reported in Syria (Bayaa et al. 2004).
Faba bean
Ascochyta blight of faba bean is caused by Ascochyta
fabae, (teleomorph Didymella fabae) which is highly
specific for faba bean. Lesions with definite margins
are more or less circular or oval, slightly sunken on
leaves, and more sunken on stems and pods. The
disease, screening procedures and procedures for
breeding disease-resistant faba bean cultivars were
the subjects of a recent review (Tivoli et al. 2006).
Screening for resistance has relied on the use of field
nurseries and natural infection by the pathogen which
may be supplemented by artificial inoculation with
the pathogen or by the spreading of infected crop
debris in the nursery area. Races of the pathogen have
been suggested; however, classification into races has
been controversial. Numerous sources of resistance
listed by Tivoli et al. (2006) are being used in
breeding programmes to develop improved cultivars.
A major dominant gene for resistance to ascochyta
blight of faba bean was reportedly found in ILB752
and two complementary recessive genes for resis-
tance were found in NEB463 (Kohpina et al. 2000). A
detailed analysis of resistance using an F2 population
from the cross of 29H (resistant) · VF136 (suscep-
tible) was used to identify six QTL (Avila et al.
2004). The F2 population was evaluated for resistance
to two isolates differing in their pathogenicity. Four
of the QTL were effective against both pathotypes
while the effectiveness of the two other QTL varied.
Some QTL appeared to be tissue (either leaf or stem)
specific (Avila et al. 2004), complicating selection
protocols in breeding.
Variability of isolates of the ascochyta blight
pathogen like those observed in Australia (Kohpina
et al. 1999) is problematic for breeding and it is
necessary to evaluate segregating breeding material
against a range of isolates to ensure success.
Summary and conclusions
Ascochyta blights are an important yield constraint of
all cool season food legumes, and using host resis-
tance is the most economical means in managing the
diseases. Resistance to ascochyta blights is present in
the germplasm of all cool season food legumes;
however, in most cases no complete resistance is
found in the cultivated germplasm and the resistance
is considered to be partial. Nevertheless, the available
resistance has been demonstrated capable of reducing
losses of yield and quality of these grain legumes.
There is a pressing need for increased understanding
Eur J Plant Pathol (2007) 119:135–141 139
123
of pathogen variability, and for the standardization of
screening procedures including the methods of inoc-
ulation and disease-scoring procedures, since the
isolates being used for inoculation will be location-
specific and disease progression will vary. Neverthe-
less, standardization of scoring procedures and the
use of common host differentials and isolates as
controls will enable comparisons of the data and
results of evaluations across research locations.
The inheritance of resistance to ascochyta blights
in cool season food legumes appears to be quantita-
tive and controlled in most cases by multiple QTL. It
is interesting to note that the number of QTL
estimated using early generation populations such
as F2 is greater than the number of QTL estimated
using nearly-homozygous recombinant inbred line
populations, indicating that the latter may be a more
realistic estimate of the inheritance of resistance and
the location of the important genes. The use of
marker-assisted selection for resistance to ascochyta
blights is being developed in all of the cool season
food legumes. However, it is still limited in scope,
and its practical application requires further experi-
mentation and confirmation. Selection under natural
conditions in the field using a mixture of isolates
remains the primary means of selection for resistance.
The mini-dome procedure (Chen et al. 2005) has
greatly improved the efficiency of evaluation of
selections for resistance to multiple pathotypes in
chickpea. Improved cultivars with resistance to
ascochyta blights have been the result of breeding
programmes worldwide. Seeking new resistance
sources of additional germplasm lines or wild rela-
tives will make it possible to continue to improve on
that resistance. The prospect of pyramiding of genes,
once identified, from various sources with the aid of
modern molecular techniques has been discussed, and
remains a possible fruitful approach for further
improving resistance to ascochyta blights in cool
season food legumes.
References
Ahmed, S., & Morrall, R. A. A. (1996). Field reactions of lentil
lines and cultivars to isolates of Ascochyta fabae f. sp.
lentis. Canadian Journal of Plant Pathology, 18, 362–369.
Ahmed, S., Morrall, R. A. A., & Sheard, J. W. (1996). Viru-
lence of Ascochyta fabae f. sp. lentis on lentil. CanadianJournal of Plant Pathology, 18, 354–361.
Ahmad, M., Russell, A. C., & McNeill, D. L. (1997). Identifi-
cation and genetic characterization of different resistance
sources to Ascochyta blight within the genus Lens.
Euphytica, 97, 311–315.
Avila, C. M., Satovic, Z., Sillero, J. C., Rubiales, D., Moreno, M.
T., & Torres, A. M. (2004). Isolate and organ-specific QTLs
for Ascochyta blight resistance in faba bean (Vicia faba L).
Theoretical and Applied Genetics, 108, 1071–1078.
Banniza, S., Hashemi, P., Warkentin, T. D., Vandenberg, A., &
Davis, A. R. (2005). The relationships among lodging,
stem anatomy, degree of lignification, and resistance to
Mycosphaerella blight in field pea (Pisum sativum).
Canadian Journal of Botany, 83, 954–967.
Bayaa, B., Udupa, S. M., Baum, M., Malhotra, R. S., &
Kabbabeh, S. (2004). Pathogenic variability in Syrian
isolates of Ascochyta rabiei. In Proceedings of the 5thEuropean Conference on Grain Legumes (p. 306,
Abstract). Dijon France, 7–11 June 2004.
Bretag, T. W., Keane, P. J., & Price, T. V. (2006). The epi-
demiology and control of Ascochyta blight in field peas:
A review. Australian Journal of Agricultural Research,57, 883–902.
Chen, W., Coyne, C., Peever, T., & Muehbauer, F. J. (2004).
Characterization of chickpea differentials for Ascochyta
blight and identification of resistance sources for Asco-chyta rabiei. Plant Pathology, 53, 759–769.
Chen, W., Mcphee, K. E., & Muehlbauer, F. J. (2005). Use of a
mini-dome bioassay and grafting to study resistance of
chickpea to Ascochyta blight. Journal of Phytopathology,153, 579–587.
Cho, S., Chen, W., & Muehlbauer, F. J. (2004). Pathotype-
specific genetic factors in chickpea (Cicer arietinum L.)
for quantitative resistance to Ascochyta blight. Theoreti-cal and Applied Genetics, 109, 733–739.
Cho, S., Chen, W., & Muehlbauer, F. J. (2005). Constitutive
expression of the Flavanone 3-hydroxylase gene related to
pathotype-specific Ascochyta blight resistance in Cicerarietinum L. Physiological and Molecular Plant Pathology,67, 100–107.
Chowdhury, M. A., Andrahennadi, C. P., Slinkard, A. E., &
Vandenberg, A. (2001). RAPD and SCAR markers for
resistance to Ascochyta blight in lentil. Euphytica, 118,
331–337.
Collard, B. C. Y., Pang, E. C. K., Ades, P. K., & Taylor, P. W.
J. (2003). Preliminary investigation of QTLs associated
with seedling resistance to Ascochyta blight from Cicerechinospermum, a wild relative of chickpea. Theoreticaland Applied Genetics, 107, 719–729.
FAOSTAT. (2004). Source of statistical data on production.
http://faostat.fao.org.
Flandez-Galvez, H., Ades, P. K., Ford, R., Pang, E. C. K., &
Taylor, P. W. J. (2003). QTL analysis for Ascochyta
blight resistance in an intraspecific population of chickpea
(Cicer arietinum L.). Theoretical and Applied Genetics,107, 1257–1265.
Ford, R., Pang, E. C. K., & Taylor, P. W. J. (1999). Genetics of
resistance to Ascochyta blight (Ascochyta lentis) of lentil
and the identification of closely linked RAPD markers.
Theoretical and Applied Genetics, 98, 93–98.
Hernandez-Bello, M. A., Chilvers, M. I., Akamatsu, H., &
Peever, T. L. (2006). Host specificity of Ascochyta spp.
140 Eur J Plant Pathol (2007) 119:135–141
123
infecting legumes of the Viciae and Cicereae tribes and
pathogenicity of the interspecific hybrid. Phytopathology,96, 1148–1156.
Iruela, M., Rubio, J., Barro, F., Cubero, J. I., Millan, T., & Gil, J.
(2006). Detection of two quantitative trait loci for resis-
tance to Ascochyta blight in an intra-specific cross of
chickpea (Cicer arietinum L.): Development of SCAR
markers associated with resistance. Theoretical andApplied Genetics, 112, 278–287.
Kohpina, S., Knight, R., & Stoddard, F. L. (1999). Variability
of Ascochyta fabae in South Australia. Australian Journalof Agricultural Research, 50, 1475–1481.
Kohpina, S., Knight, R., & Stoddard, F. L. (2000). Genetics of
resistance to Ascochyta blight in two populations of faba
bean. Euphytica, 112, 101–107.
Lichtenzveig, J., Bonfil, D. J., Zhang, H. B., Shtienberg, D.,
&Abbo, S. (2006). Mapping quantitative trait loci in
chickpea associated with time to flower and resistance to
Didymella rabiei the causal agent of Ascochyta blight.
Theoretical and Applied Genetics, 113, 1357–1369.
Millan, T., Rubio, J., Iruela, M., Daly, K., Cubero, J. I., & Gil, J.
(2003). Markers associated with Ascochyta blight resis-
tance in chickpea and their potential in marker-assisted
selection. Field Crops Research, 84, 373–384.
Nasir, M., & Bretag, T. W. (1997). Pathogenic variability in
Australian isolates of Ascochyta lentis. Australasian PlantPathology, 26, 217–220.
Nene, Y. L., & Reddy, M. V. (1987). Chickpea diseases and
their control. In M. C. Saxena & K. B. Singh (Eds.), Thechickpea (pp. 233–270). Oxon, UK: CAB Wallingford.
Nguyen, T. T., Taylor, P. W. J., Brouwer, J. B., Pang, E. C. K.,
& Ford, R. (2001). A novel source of resistance in lentil
(Lens culinaris ssp culinaris) to Ascochyta blight caused
by Ascochyta lentis. Australasian Plant Pathology, 30,
211–215.
Pande, S., Siddique, K. H. M., Kishore, G. K., Bayaa, B., Gaur,
P. M., Gowda, C. L. L., Bretag, T. W., & Crouch, J. H.
(2005). Ascochyta blight of chickpea (Cicer arietinumL.): A review of biology, pathogenicity, and disease
management. Australian Journal of AgriculturalResearch, 56, 317–332.
Prioul, S., Frankewitz, A., Deniot, G., Morin, G., & Baranger,
A. (2004). Mapping of quantitative trait loci for partial
resistance to Mycosphaerella pinodes in pea (Pisum sat-ivum L.) at the seedling and adult plant stages. Theoreticaland Applied Genetics, 108, 1322–1334.
Rajesh, P. N., Coyne, C., Meksem, K., Sharma, K. D., Gupta,
V., & Muehlbauer, F. J. (2004). Construction of a HindIII
bacterial artificial chromosome library and its use in
identification of clones associated with disease resistance
in chickpea. Theoretical and Applied Genetics, 108, 663–
669.
Rakshit, S., Winter, P., Tekeoglu, M., Munoz, J. J., Pfaff, T.,
Ko-Iseppon, A. M., Muehlbauer, F. J., & Kahl, G. (2003).
DAF marker tightly linked to a major locus for Ascochyta
blight resistance in chickpea (Cicer arietinum L.).
Euphytica, 132, 23–30.
Reddy, M. V., & Singh, K. B. (1984). Evaluation of a world
collection of chickpea germplasm accessions for resis-
tance to Ascochyta blight. Plant Disease, 68, 900–1001.
Rubeena, T., Taylor, P. W. J., Ades, P. K., & Ford, R. (2006).
QTL mapping of resistance in lentil (Lens culinaris ssp.
culinaris) to Ascochyta blight (Ascochyta lentis). PlantBreeding, 125, 506–512.
Santra, D. K., Tekeoglu, M., Ratnaparkhe, M., Kaiser, W. J., &
Muehlbauer, F. J. (2000). Identification and mapping of
QTLs conferring resistance to Ascochyta blight in
chickpea. Crop Science, 40, 1606–1612.
Singh, K. B., & Reddy, M. V. (1993). Resistance to 6 races of
Ascochyta rabiei in the world germplasm collection of
chickpea. Crop Science, 33, 186–189.
Singh, K. B., & Reddy, M. V. (1994). Registration of 8
Ascochyta blight-resistant, early-maturing, large-seeded
chickpea germplasms. Crop Science, 34, 1416–1417.
Tar’an, B., Warkentin, T., Somers, D. J., Miranda, D.,
Vandenburg, A., Blade, S., Woods, S., Bing, D., Xue, A.,
DeKoeyer, D., & Penner, G. (2003). Quantitative trait loci
for lodging resistance, plant height and partial resistance
to Mycosphaerella blight in field pea (Pisum sativum L.).
Theoretical and Applied Genetics, 107, 1482–1491.
Tivoli, B., Baranger, A., Avila, C. M., Banniza, S., Barbetti,
M., Chen, W., Davidson, J., Lindeck, K., Kharrat, M.,
Rubiales, D., Sadiki, M., Sillero, J. C., Sweetingham, M.,
& Muehlbauer, F. J. (2006). Screening techniques and
sources of resistance to foliar diseases caused by major
necrotrophic fungi in grain legumes. Euphytica SpecialIssue: Resistance to Biotic and Abiotic Stresses inLegumes, 147, 223–253.
Timmerman-Vaughan, G. M., Frew, T. J., Butler, R., Murray,
S., Gilpin, M., Falloon, K., Johnston, P., Lakeman, M. B.,
Russell, A., & Khan, T. (2004). Validation of quantitative
trait loci for Ascochyta blight resistance in pea (Pisumsativum L.), using populations from two crosses. Theo-retical and Applied Genetics, 109, 1620–1631.
Torres, A. M., Roman, B., Avila, C. M., Satovic, Z., Rubiales,
D., Sillero, J. C., Cubero, J. I., & Moreno, M. T. (2006).
Faba bean breeding for resistance against biotic stresses:
Towards application of marker technology. Euphytica,147, 67–80.
Udupa, S. M., Weigand, F., Saxena, M. C., & Kahl, G. (1998).
Genotyping with RAPD and microsatellite markers
resolves pathotype diversity in the Ascochyta blight
pathogen of chickpea. Theoretical and Applied Genetics,97, 299–307.
Vandenberg, A., Kiehn, F. A., Vera, C., Gaudiel, R., Buchwaldt,
L., Kirkland, K. J., Morrall, R. A. A., Wahab, J., & Slin-
kard, A. E. (2001). CDC Milestone lentil. CanadianJournal of Plant Science, 81, 113–114.
Wroth, J. M. (1999). Evidence suggests that Mycosphaerellapinodes infection of Pisum sativum is inherited as a
quantitative trait. Euphytica, 107, 193–204.
Ye, G., McNeil, D. L., & Hill, G. D. (2002). Breeding for
resistance to lentil Ascochyta blight. Plant Breeding, 121,
185–191.
Ye, G., McNeil, D. L., & Hill, G. D. (2003). Inheritance of
foliar resistance to Ascochyta blight in lentil (Lensculinaris). New Zealand Journal of Crop and Horticul-tural Science, 31, 77–83.
Eur J Plant Pathol (2007) 119:135–141 141
123
Related Documents