., DOT/FAA/AM-97/7 ,,)!! Office of Aviation Medicine Washington, D.C. 20591 Effects of Simulated General Aviation Altitude Hypoxia on Smokers and Nonsmokers Thomas E. Nesthus Robert P. Garner Scott H. Mills Civil Aeromedical Institute Federal Aviation Administration Oklahoma City, Oklahoma 73125 Robert A. Wise OMNI Corporation Oklahoma City, Oklahoma 73125 March 1997 Final Report This document is available to the public through the National Technical Information Service, Springfield, Virginia 22161. U.S. Department of Transportation Federal Aviation Administration 19970422 140

Welcome message from author
This document is posted to help you gain knowledge. Please leave a comment to let me know what you think about it! Share it to your friends and learn new things together.
Transcript
.,
DOT/FAA/AM-97/7 ,,)!!
Office of Aviation Medicine Washington, D.C. 20591
Effects of Simulated General Aviation Altitude Hypoxia on Smokers and Nonsmokers
Thomas E. Nesthus Robert P. Garner Scott H. Mills
Civil Aeromedical Institute Federal Aviation Administration Oklahoma City, Oklahoma 73125
Robert A. Wise
OMNI Corporation Oklahoma City, Oklahoma 73125
March 1997
Final Report
This document is available to the public through the National Technical Information Service, Springfield, Virginia 22161.
U.S. Department of Transportation Federal Aviation Administration
19970422 140
NOTICE
This document is disseminated under the sponsorship of
the U.S. Department of Transportation in the interest of
information exchange. The United States Government
assumes no liability for the contents or use thereof.
Technical Report Dccumentation Page
1. Report No. 2. Government Accession No. 3. Recipient's Catalog No.
DOT /FAA/AM-97/7 4. Title and Subtitle 5. Report Date
Effects of Simulated General Aviation Altitudes Hypoxia on Smokers March 1997 and Nonsmokers 6. Performing Organization Code
7. Author(s) 8. Performing Organization Report No.
Nesthus, Thomas E., Garner, Robert P., Mills, Scott H., and Wise, Robert A. 9. Performing Organization Name and Address 10. Work Unit No. (TRAIS)
Civil.Aeromedical Institute Human Factors Research Laboratory Oklahoma City, OK 73125
11. Contract or Grant No.
12. Sponsoring Agency name and Address 13. Type of Report and Period Covered
Office of Aviation Medicine Final Report Federal Aviation Administration 14. Sponsoring Agency Code
800 Independence Ave., S.W. Washington DC 20591 15. Supplemental Notes
16. Abstract
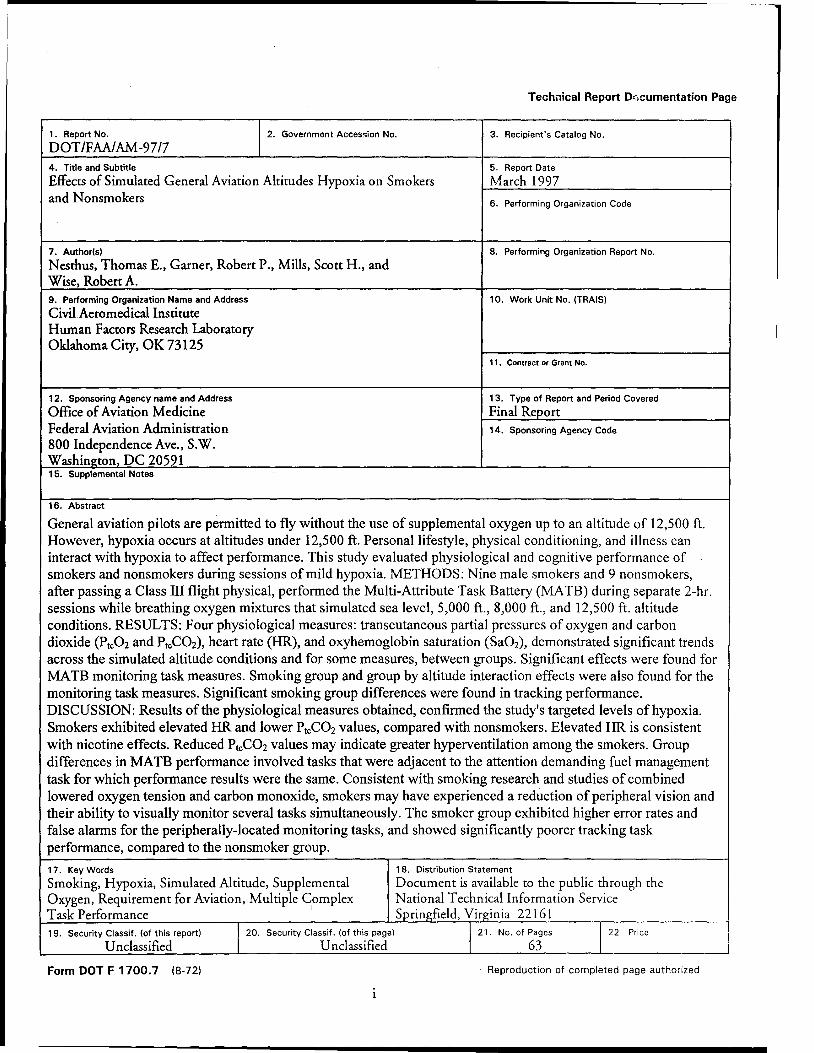
General aviation pilots are permitted to fly without the use of supplemental oxygen up to an altitude of 12,500 ft. However, hypoxia occurs at altitudes under 12,500 ft. Personal lifestyle, physical conditioning, and illness can interact with hypoxia to affect performance. This study evaluated physiological and cognitive performance of smokers and nonsmokers during sessions of mild hypoxia. METHODS: Nine male smokers and 9 nonsmokers, after passing a Class III flight physical, performed the Multi-Attribute Task Battery (MATB) during separate 2-hr. sessions while breathing oxygen mixtures that simulated sea level, 5,000 ft., 8,000 ft., and 12,500 ft. altitude conditions. RESULTS: Four physiological measures: transcutaneous partial pressures of oxygen and carbon dioxide (P1c02 and P1cCOz), heart rate (HR), and oxyhemoglobin saturation (SaOz), demonstrated significant trends across the simulated altitude conditions and for some measures, between groups. Significant effects were found for MA TB monitoring task measures. Smoking group and group by altitude interaction effects were also found for the monitoring task measures. Significant smoking group differences were found in tracking performance. DISCUSSION: Results of the physiological measures obtained, confirmed the study's targeted levels of hypoxia. Smokers exhibited elevated HR and lower P1cC02 values, compared with nonsmokers. Elevated HR is consistent with nicotine effects. Reduced P1cC02 values may indicate greater hyperventilation among the smokers. Group differences in MATB performance involved tasks that were adjacent to the attention demanding fuel management task for which performance results were the same. Consistent with smoking research and studies of combined lowered oxygen tension and carbon monoxide, smokers may have experienced a reduction of peripheral vision and their ability to visually monitor several tasks simultaneously. The smoker group exhibited higher error rates and false alarms for the peripherally-located monitoring tasks, and showed significantly poorer tracking task performance, compared to the nonsmoker group.
1 7. Key Words 18. Distribution Statement
Smoking, Hypoxia, Simulated Altitude, Supplemental Document is available to the public through the Oxygen, Requirement for Aviation, Multiple Complex National Technical Information Service Task Performance
1
Springfield, Virginia 22161 19. Security Classif. (of this report) 120. Security Classif. (of this page) 121. No. of Pages
122 Price
Unclassified Unclassified 63
Form DOT F 1700.7 (8-72) · Reproduction of completed page authorized
FOREWORD
This study is one of a series conducted as a part of the CAMI general aviation (GA) human factors research program. The following mission statement guides the overall effort:
Conduct applied human factors research in the labora
tory and in the field on carefully selected GA problems, to
obtain objective, scientifically derived data which will aid in
identifying affordable options for reducing the risk expo
sure, and number of incident and accidents in the general
aviation communiry, and which will serve to enhance GA
pilot performance under non-routine flying conditions.
The CAMI general aviation human factors research program is consistent with the FAA policy statement on general aviation, promulgated by the Administrator in 1993, and the goals of the Flight Standards General Aviation Action Plan, distributed in 1992. Development of the program was coordinated with AFS-800, AFS-200, AIR-3, ACE-100 and with guidance by the General Aviation Coalition, accident prevention, and pilot training working groups. FAA human factors program management coordination was provided by AAR-100.
iii
CAMI's GA human factors research program incorporates b~th near-term and far-term objectives. The primary near-term focus of the program, stressed by the General Aviation Coalition, is to develop approaches to current general aviation problems so that payoffs in reduced risk exposure, accidents and incidents can be realized relatively soon. The long-term focus of the program is directed toward future problem solutions utilizing advanced technologies that require longer development times and more substantial funding commitments. These two program approaches are non-redundant, mutually supportive, and provide for timely human factors research on general aviation safety and pilot performance issues with payoffs distributed over time.
This report resulted from a project effort considering the issue of hypoxia during flights in unpressurized general aviation aircraft below the altitude requiring use of supplemental oxygen (i.e., 12,500 ft. and under}. Sponsorship for the study was provided by the Office of Aviation Medicine, Dr. Jon Jordan, Federal Air Surgeon, AAM-1.
TABLE OF CONTENTS
Page INTRODUCTION ......................................................................................................................................... 1
Hypoxia Background Summary .......................................................................................................... 1
Previous Research ................................................................................................................................ 1
Physiological Background ................................................................................................................... 2
Effects of Hypoxia on Other Mental Functions ................................................................................ 3
Hypoxia and Smoking ......................................................................................................................... 3
Research Objectives ............................................................................................................................. 4
METHODS ...................................................................................................................................................... 4
Subjects ................................................................................................................................................ 4
Materials and Apparatus ..................................................................................................................... 4
Simulated Altitude .............................................................................................................................. 4
Physiological Measures ···························································u··························································· 4 Performance Task Measures ................................................................................................................ 5
Subjective State MeasureS •••••••••••••••·••••••••••••••••••••••u .. uuu••••u••••u•uuu•••uuuu•••u ................................ 5
Procedure •u•••u•.,uuuuu•u•u• .. uu"""u"""'u'u"""'u""uuu•""uu .... u,uuu .. •••u;,.,,,.,,,,, ............ uu•••""''u' 5
RESULTS ••••••••••••••••••••••u••••UooUoouuu•••uuouuuuuouuu .. uouuuuuuuuuuou'"'"'"U""'""U"'''"u""""'''uuu••.,.,uuo 5
Physiological Variables ·······•u····••u••••u•••••··············••••u•······································································ 5
Oxygen partial pressure ········•·u····u••u····••u···············u•••····················u··············································· 5
Carbon dioxide partial pressure ··················································u·············u••·······u···························· 7
Heart Rate •u•••••••••••••••.,•••••••••••••••••••u••u••u••.,••u•••••••••••u••uu••••••••••••••••••••••••••••••••••••••••••••••••••••••••••••••• 7
Oxyhemoglobin saturation oUUuuUUOUoOUUoU .. ouuuuuuuuu .. uuuuu ..... uuuuuuuouuouuuuuuuuuu ........ 11
Pulmonary funCtiOn teSting u•uuuuu•uuuuu.,uuuuuuu .. uu.,uuuou"u"u•uuuuu.,•uuuuu .. ouuuuu .... uu 11
Multi-Attribute Task Battery ""'uuu .. ouu•u"""uuu•.,•uuu.,.,uuu .. uuuuu•u .. uuuu•.,•uu•u•"'"""uuuu• .. 13
Monitoring Lights uuu .. ouuou'""uuuuuuuuu.,uuuou .... uuuuu.,uuu•""""uuu•:u•uu ....... uuu•u"u""uu• 19
Monitoring DialS uuu.,.,uuuuo.,uuuuuuuuuu.,uuuu"u•uuuuuu"u""uu•u .. uuuu•uuuouuuuuu•••u••••••••• 19
Tracking Tasku.,.,uuu .. .,u,u .. .,uuuuu.,uu••u•.,uuuu"u"uu••••u•u••••"""'''"'""'"u•••••u•••••••••••uuuu""''''' 19
Communications Task uu .... u .. uu ....... uu .. uuuuuu .... u ..... u .. u ...... u .. u ........... u .......... u .. u ................... 19
Resource Management·Task uuouu .... uuuuu .. uu ............... u···················u··············u·························· 19
Subjective Measures ............. uuu ..... u ........ u .... u ................... u .......... u ............................................... 19
NASA TLX ........................................................................................................................................ 19
Environmental Symptoms Questionnaire ..... uuuu"u••··················· .. ···u······················u··················· 23
Mood II ooooouuu.,ouuuu.,•uu .. u.,uu .... uuuuuu•••u••.,,u,uu .... uu••••oou•uuu .. oo•••••u•o"'"'"'''uo••••••u"'"'"''u''' 23
Stanford Sleepiness Scale ouuuuo .. uuuu .. UUUOououu•• .. u .. uuu .. uuuu ....... uu•ou•••••"''''uu ......... uuuoo ....... 23
v
TABLE OF CONTENTS (Continued)
DISCUSSION·····································································································································~·········· 24 ·
Physiological Measures ......................................................................................... ,. ............................ 24
Multi-Attribute Task Battery ................................ , ............................................................................ 25
REFERENCES··········································································································································~····· 29
APPENDICES
A Descriptions of Subjective Measures ................................................................................................ A1
B NASA TLX Workload Scale ............................................................................................................. B 1
C Environmental Symptoms Questionnaire ....................................................................................... C 1
D Mood II Scale ................................................................................................................................... D 1
E Stanford Sleepiness Scale .................................................................................................................. E1
LIST OF FIGURES
Figure Page
1. Experimental Protocol ...................................................... ; .................................................... ; ........... :. 6
2. Altitude Effect: Transcutaneous Oxygen Partial Pressure ................................................................. 8
3. Trial Effect: Transcutaneous Oxygen Partial Pressure ........ : .................................................... : ....... :. 8
4. Trial Effect: Transcutaneous Carbon Dioxide Partial Pressure ............................................... : ......... 8
5. Altitude Effect: Transcutaneous Carbon Dioxide Partial Pressure .................................................. :. 9
6. Trial Effect: Transcutaneous Carbon Dioxide Partial Pressure ......................................................... 9
7. Altitude Effect: Heart Rate ................................................................................................................. 9
8. Trial Effect: Heart Rate .................................................................................................................... 10
9. Group by Trial Interaction Effect: Heart Rate ................................................................................ 10
10. Trial by Altitude Interaction Effect: Heart Rate .................................................................. ~ ........... 10
11. Group by Altitude by Trial Interaction Effect: Heart Rate .................................... : .......... : ............. 11
12. Altitude Effect: Oxyhemoglobin Saturation ......................................................... : ........................... 12
13. Trial Effect: Oxyhemoglobin Saturation .......................................................................................... 12
14. Forced Expiratory Volume in 1 Second (FEV1) ••••••••••••••••••••••••••••••••••••••••••••••••••••••••••••••••••••••••••••••• 12
15. Maximal Mid-Expiratory Flow Rate (MMFR) ................................................................................ 13
16. Response Time, Lights Task ............................................................................................................. 17
17. Total Errors, Lights Task ...................... : ........................................................................................... 17
vi
TABLE OF CONTENTS (Continued)
18. Response Time, Dials Task ............................................................................................................... 17
19. Total Errors, Dials Task .................................................................................................................... 17
20. Time Out Errors, Dials Task ............................................................................................................ 17
21. False Alarm Errors, Dials Task ......................................................................................................... 17
22. RMS Error, Tracking Task ............................................................................................................... 17
23. Communications Response Time ..................................................................................................... 17
24. Communications Errors ......................................... : .......................................................................... 18
25. Mean Absolute Tank Deviation, Resource Management Task ....................................................... 18
26. Altitude Effect: Total Errors, Lights Task ........................................................................................ 18
27. Altitude by Trial Effect: Response Time, Dials Task ...................................................................... 18
28. Group Effect: Total Errors, Dials Task ............................................................................................ 20
29. Altitude Effect: Total Errors, Dials Task ......................................................................................... 20
30. Group by Altitude Interaction Effect: Total Errors, Dials Task ..................................................... 20
31. Group by Trial Interaction Effect: Total Errors, Dials Task ........................................................... 21
32. Altitude by Trial Interaction Effect: Total Errors, Dials Task ........................................................ 21
33. Group by Altitude Interaction Effect: False Alarms, Dials Task ..................................................... 21
34. Group Effect: RMS Error, Tracking Task ........................................................................................ 22
35. Group by Trial Interaction Effect: RMS Error, Tracking Task ...................................................... 22
36. Altitude by Trial Interaction Effect: Communications Response Time ......................................... 22
LIST OF TABLES
Table Page
1. Means and Standard Deviations of the 4 Physiologic Measures ....................................................... 7
2. Group Means and Standard Deviations for MA TB Measures ......................................................... 14
3. Altitude by Group Means and Standard Deviations for MATB Measures ..................................... 15
4. Trial Means and Standard Deviations for MATB Measures ........................................................... 16
5. Mixed Model ANOVA Results for MATB Standardized Composite and Overall Composite Scores .......................................................................................................... 23
vii
EFFECTS OF SIMULATED GENERAL AVIATION ALTITUDE HYPOXIA
ON SMOKERS AND NONSMOKERS
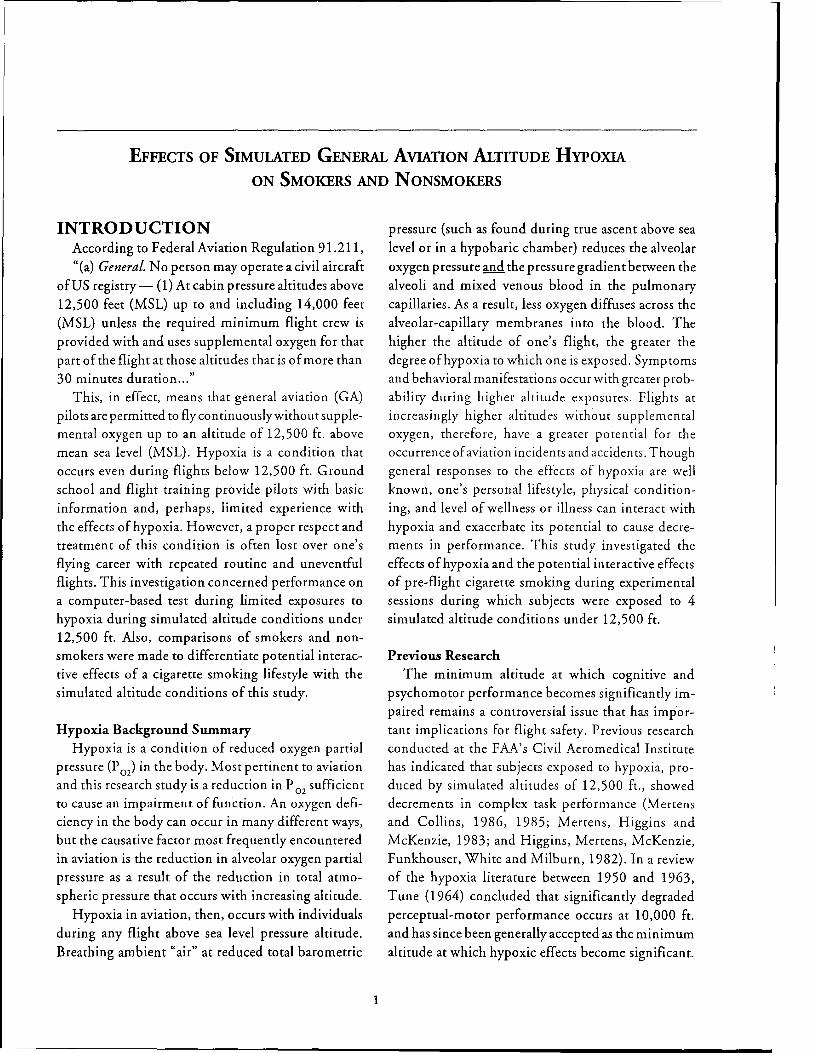
INTRODUCTION According to Federal Aviation Regulation 91.211, "(a) General. No person may operate a civil aircraft
ofUS registry- (1) At cabin pressure altitudes above 12,500 feet (MSL) up to and including 14,000 feet (MSL) unless the required minimum flight crew is provided with and uses supplemental oxygen for that part of the flight at those altitudes that is of more than 30 minutes duration ... "
This, in effect, means that general aviation (GA) pilots are permitted to fly continuouslywithout supplemental oxygen up to an altitude of 12,500 ft. above mean sea level (MSL). Hypoxia is a condition that occurs even during flights below 12,500 ft. Ground school and flight training provide pilots with basic information and, perhaps, limited experience with the effects of hypoxia. However, a proper respect and treatment of this condition is often lost over one's flying career with repeated routine and uneventful flights. This investigation concerned performance on a computer-based test during limited exposures to hypoxia during simulated altitude conditions under 12,500 ft. Also, comparisons of smokers and nonsmokers were made to differentiate potential interactive effects of a cigarette smoking lifestyle with the simulated altitude conditions of this study.
Hypoxia Background Summary Hypoxia is a condition of reduced oxygen partial
pressure (P 02
) in the body. Most pertinent to aviation and this research study is a reduction in P
02 sufficient
to cause an impairment of function. An oxygen deficiency in the body can occur in many different ways, but the causative factor most frequently encountered in aviation is the reduction in alveolar oxygen partial pressure as a result of the reduction in total atmospheric pressure that occurs with increasing altitude.
Hypoxia in aviation, then, occurs with individuals during any flight above sea level pressure altitude. Breathing ambient "air" at reduced total barometric
pressure {such as found during true ascent above sea level or in a hypobaric chamber) reduces the alveolar oxygen pressure and the pressure gradient between the alveoli and mixed venous blood in the pulmonary capillaries. As a result, less oxygen diffuses across the alveolar-capillary membranes into the blood. The higher the altitude of one's flight, the greater the degree of hypoxia to which one is exposed. Symptoms and behavioral manifestations occur with greater probability during higher altitude exposures. Flights at increasingly higher altitudes without supplemental oxygen, therefore, have a greater potential for the occurrence of aviation incidents and accidents. Though general responses to the effects of hypoxia are well known, one's personal lifestyle, physical conditioning, and level of wellness or illness can interact with hypoxia and exacerbate its potential to cause decrements in performance. This study investigated the effects of hypoxia and the potential interactive effects of pre-flight cigarette smoking during experimental sessions during which subjects were exposed to 4 simulated altitude conditions under 12,500 ft.
Previous Research The minimum altitude at which cognitive and
psychomotor performance becomes significantly impaired remains a controversial issue that has important implications for flight safety. Previous research conducted at the FAA's Civil Aeromedical Institute has indicated that subjects exposed to hypoxia, produced by simulated altitudes of 12,500 ft., showed decrements in complex task performance (Mertens and Collins, 1986, 1985; Mertens, Higgins and McKenzie, 1983; and Higgins, Mertens, McKenzie, Funkhouser, White and Milburn, 1982). In a review of the hypoxia literature between 1950 and 1963, Tune (1964) concluded that significantly degraded perceptual-motor performance occurs at 10,000 ft. and has since been generally accepted as the minimum
altitude at which hypoxic effects become significant.
Other research concerning the effects of mild hypoxia are somewhat equivocal in identifying cognitive task impairment at lower GA altitudes. Some studies showed task impairment at altitudes as low as 8,000 ft. (Denison, Ledwith and Poulton, 1966; Ledwith and Denison, 1964), and other studies have been unable to demonstrate similar effects at similar altitudes (Fowler, Paul, Porlier, Elcombe and Taylor,' 1985; Crow and Kelman, 1971, 1973; Kelman and Crow, 1969; Kelman, Crow, and Bursil, 1969).
Ernsting (1978) reviewed the earlier studies and " ... concluded that the mild hypoxia produced by breathing air at an altitude of 8,000 ft. should not be
accepted for aircrew engaged in air operations because of the very significant impairment of ability to re
spond to a novel complex situation ... " as one might
experience in an unpracticed emergency (p.498). In this article, Ernsting recommended that cabin pressurization of civil transport aircraft should be equivalent to an altitude no higher than 6,000 ft. However, at the time the aviation industry concluded that an 8,000 ft. equivalent cabin pressurization schedule would be acceptable for routine flight considering the tradeoffs of current aircraft design characteristics (i.e., increased weight with structural tolerances for higher cabin pressurization). Cabin pressurization schedules remain the same today for civilian air transport aircraft. The level of hypoxia protection afforded GA pilots flying unpressurized aircraft between 8,000 and 12,500 ft. inspires an interesting question- Is pilot performance during flights between 8,000 ft. and 12,500 ft. sufficiently degraded to recommend the use of supplemental oxygen?
Physiological Background The physiological response (compensation) to hy
poxia is autonomically regulated and essentially begins as one ascends beyond sea level atmospheric pressures. Depending on the maximum altitude attained, the rate of ascent and the duration at that altitude, human physiological compensation to reduced ambient pressures is often quite effective in optimizing the availability of oxygen to the tissues of the body. As one ascends to higher altitudes, the body's ability to compensate is exceeded and physiological functioning is compromised. Ernsting, Sharp,
2
and Harding (1988) indicated that above 8,000-10,000 ft., two conflicting factors compromise the body's ability to compensate; the increased pulmonaryventilation produced by the lower arterial oxygen tension " ... is opposed by the respiratory depressant effect of the concomitant reduction in the carbon dioxide tension" (and hence, maintenance of the normal acid-base balance of the blood) (p.47).
Neural tissue is particularly sensitive to reduced oxygen tension. Normal functioning requires a relatively constant and high supply of oxygen. The brain consumes almost one-fifth of the total oxygen uptake of the body at rest, even though it comprises only 2%
of the body's weight (Ernsting, 1988). Lipton and Whittingham (1982) emphatically state "Low oxygen
tension profoundly disturbs cerebral function" (p.14).
Their chapter concentrates on cerebral neuronal transmission and the results of studies evaluating neurotransmitter metabolism andATP production/levels during hypoxic stimulation. Evidence of significant changes in neurological functioning was reported as a result of reduced oxygen tension.
The rods and cones of the retina are particularly sensitive to hypoxia. Various researchers have shown that hypoxia produces significant reductions in brightness sensitivity (Hecht, Hendley, Frank, and Haig, 1946), color detection (Kobrick, 1970), night vision (McFarland and Evans, 1939), ocular muscle coordination (McFarland, 1937), flicker detection (Birren, Fisher, Vollmer, and King, 1946) and peripheral vision (Kobrick, 1971).
The light sensitivity of a dark adapted eye (scotopic or rod vision) has been ~ound to be affected by a simulated altitude of 5,000 ft. The FAA recommends using supplemental oxygen during flights at night at altitudes above 5, 000 ft. (F AAAC 61-1 07). McFarland (1970) demonstrated marked reductions in both visual acuity and light sensitivity of subjects in an experiment of differential brightness sensitivity with dark adaptation and hypoxia as experimental factors. In an earlier study, McFarland (1937) found changes in eye movements while reading text as a function of hypoxia. Generally, increased time for eye movements was found along with more frequent fixations. Also, less precision was found in eye movements with an inability to maintain fixations during reduced oxygen

exposures equivalent to 13,500 and 18,000 ft. Kobrick (1971) demonstrated that observers were progressively slower and more variable in their responses to flashing signals as signal locations became more peripheral. These changes were particularly " ... heightened by hypoxia, in direct relation to severity and duration of exposure" (p.327).
Effects of Hypoxia on Other Mental Functions Hypoxia disrupts neuronal functioning and is mani
fested in symptomatology and behavioral changes. The onset of degeneration in mental and physical ability often goes unnoticed because its effect is subtle and works against one's ability to think and respond appropriately. Often, an erroneous feeling of wellbeing and an exaggerated sense of one's abilities masks the underlying condition of hypoxia that could become problematic for the individual. Therein lies a hypoxic deception. Though hypoxic symptom recognition can be accomplished by personally knowing what to expect when it occurs (via hypoxia training in hypobaric chambers), if it is not recognized early during the mild
stimulus levels, the progressive and confounded feeling of"well being" may be the only symptom present (USAF Physiological Training Pamphlet, 1976).
A recent Society of Automotive Engineers report on hypoxia and performance stated " ... early onset of these altered mental functions, which are not recognized by the individual, represents serious hazards to the air crew and may be the direct or indirect cause of many accidents" (in Patiky, Aviation Safety, August 1, 1993). A preliminary query of the FAA's Consolidated Data Base found that incapacitation due to hypoxia was cited in only 4 accidents between 1982-1993; impairment due to hypoxia was cited in only 8 accident cases during the same time frame. Cohen (1994) believes that hypoxia has contributed to many more accidents than are reported by the NTSB. Of the cases presented in his recent book, Cohen described how he believed that hypoxia had contributed to the accidents reviewed. In a recent report of an inflight breakup of a Danish-registered aircraft during a flight from Sondrestrom, Greenland to Goose Bay, Newfoundland, an extensive investigation involving Danish, US, UK and Canadian accident investigators could not conclusively determine its cause (Aviation
3
Safety Letter, Canada, 1995). However, hypoxia was suspected as a prime factor in the accident.
Recommendations for the use of supplemental oxygen at altitude are found in many flight training pamphlets and programs, but some pilots are still uncertain as to the minimum altitude at which performance degradation becomes serious enough to generate life-threateni~g circumstances. Anecdotal evidence of this confusion accumulates and is frequently discussed in various aviation periodicals, suggesting that hypoxic related problems may be involved at a higher rate than is generally believed and are simply unreported as incidents to the FAA or NASA's Aviation Safety Reporting System. A substantial interest in hypoxia continues today and is shown by the high number of journal articles and paper presentations concerning both clinical and operational issues. Our research interest concerns the potential inte.ractive effects of one's personal life-style and that of altitude hypoxia on pilot performance.
Hypoxia and Smoking Cigarette smoking is a common personal life-style
activity that can produce another type of hypoxia called hypemic hypoxia. Defined as a reduction in the oxygen carrying capacity of the blood, this type of hypoxia can occur as a result of inhalation of tobacco smoke. Carbon monoxide (CO) is one of many byproducts of the combustion of tobacco, and hemoglobin in our blood has a particularly high affinity for it: 200 to 300 times as great as that for oxygen. When a high percentage of hemoglobin is bound by CO, the oxygen carrying capacity of the blood is greatly reduced. Though altitude hypoxia is routinely ,experienced by aviators, combining its effects with another type of hypoxia, such as hypemic hypoxia, might be dangerous. Smokers typically smoke prior to a period of known deprivation, such as before a flight. Smoking prior to flight elevates carboxyhemoglobin to levels that might promote interactive results at altitude (McFarland, 1970).
During flight at GA altitudes, the diminished oxygen carrying capacity of a smoker may translate into a potential reduction in altitude tolerance. One source (Patiky, Aviation Safety, 1993) suggested that smokers may be considered, physiologically, to be at an alti-
tude of 2,000 to 3,000 feet above non-smokers. Others have suggested a 3,000 to 7,000 foot differential (Benenson, 1993; Ritter and Putnam, 1993). If either suggestion is true, as a pilot smoker ascends to GA altitudes, the onset of hypoxia may occur earlier and may manifest itself in greater subjective and performance impairment, compared to non-smokers. Clearly, any type of oxygen deficiency or interactive effect should be considered potentially dangerous and should be minimized during flight operations.
In a study that combined low doses of carbon monoxide (such as from cigarette smoking) with reduced oxygen (simulated altitudes), McFarland (1970)
described the effects as significantly additive. He
found that after absorption of CO (equivalent to that
of inhaling smoke from 3 cigarettes) and exposing the
subject~ to an altitude equivalent to that of7,500 ft., the additive effects produced a " .. .loss of [visual] sensitivity equal to that at 10,000 to 11,000 feet" (p.309). The combined effects of smoking while in flight over mountainous terrain in an unpressurized GA aircraft for one pilot resulted in unconsciousness and miraculous recovery to talk about it (FAA Publication AM-400-91/1).
Research Objectives This study was conceived after considering numer
ous issues surrounding the condition of hypoxia and the GA pilot, such as: 1) differences in "hypoxia protection" afforded civil transport aircraft (cabin pressurization 7 8,000 ft.) and unpressurized GA aircraft during flights above 8,000 ft. but below 12,500 ft.; 2) the ambivalence of previous research demonstrating impairment of cognitive and psychomotor task performance at altitudes below 12,500 ft.; 3) the likelihood of unreported hypoxic-related events in the GA environment; and 4) the dangerous potential of combining one life-style activity, smoking, prior to flight at GA equivalent altitudes. The objectives of this research were primarily to evaluate cognitive, psychomotor, and physiological performance of a sample of subjects representative of the GA population to define more clearly the interaction of mild hypoxia, smoking prior to simulated altitude exposures, and residual fatigue as might be encountered by GA pilots during routine 2 hr. flights under 12,500 ft.
4
METHOD
Subjects Eighteen male subjects were recruited as paid vol
unteers. The subjects varied in age from 22 to 57 (M= 32, SD = 9.8) and were representative ofGA pilots in that all subjects were required to pass a Class III airmen's flight physical and a pulmonary function test (PFT). Nine subjects comprised the smoker group. These subjects were prescreened and classified as "regular smokers." Regular smokers were those who currently smoke at least 15 cigarettes per day but less
than 2 packs per day for at least the previous year
(Parrott, Craig, Haines, and Winder, 1990; Stevens,
197 6). Nine nonsmokers were prescreened and classified
as those who had never met the "regular smoker" criteria.
Materials and apparatus Simulated Altitude: Various reduced oxygen breath
ing mixtures were used to simulate the following altitudes: Grade E compressed air, 20% oxygen balance nitrogen=ground level ( GL) and smoking baseline (SB), 17.3% oxygen balance nitrogen=5,000 ft. (1524 m), 15.3% oxygen balance nitrogen=8,000 ft. (2438 m), and 13.5% oxygen balance nitrogen=12,500 ft. (381 0 m). Use of premixed breathing oxygen has been found to be an acceptable simulation of the reduced partial pressures of oxygen found at altitude (Baumgardner, Ernsting, Holden, and Storm, 1980; Baumgardner and Storm, 1980). The smoking baseline condition was included to control for potential performance impairment from the effects of smoking deprivation over the 2 hr. sessions. Each breathing gas was administered from premixed (Primary Standard purity) high pressure cylinders. Regulator valves (Matheson Model 8-320) reduced cylinder pressures to the inlet 60-100 psi required of the USAF CRU-68/A demand, oxygen breathing regulator (ARO, Corp.) set to deliver all of the feed source gas (nondilution mode) through a 3-ft. 2.5 in. diameter corrugated hose to an oral-nasal mask.
Physiological Measures: The physiological measures acquired during this study were displayed for nearreal time monitoring of each subject session and stored on a 25 mHz personal computer (PC) containing an Intel 80386 microprocessor. These data were
stored as ASCII files for post study analysis. The 4 measures included: transcutaneous oxygen (P ,c02)
and carbon dioxide (P,cC02) partial pressures mea
sured with the Radiometer TCM-3 (electrode placement was the right forearm), heart rate (beats per minute), and blood oxygen saturation (SaO
2) mea
sured with the Nelcor Pulse Oximeter Model 200 (electrode placement was on the forehead). Pulmonary Function Testing (PFT) was conducted during each subject's Class III flight physical prior to acceptance and training for the study. This testing was conducted with a spirometer (Sensormedics Model 922). The data were reviewed by CAMI Clinic staff and a licensed respiratory therapist. Subjects with abnormal PFT results were considered at risk with our experimental treatment conditions and were not allowed to J>articipate in this study. Subjects with acceptable flight physical and normal range PFT results then completed 3 training and 5 experimental sessions.
Performance Task Measures: A modified version of the Multi-Attribute Task Battery (MATB) was employed during this study (Comstock and Arnegard,
1992; Mills and Gilliland, 1994). The MATB is structured to approximate a GA flight operations environment. The battery required the concurrent performance of 5 component tasks including: monitoring 2 lights and a set of 4 dials, a 2 dimensional compensatory tracking task, a resource management task representing fuel tank management, and an auditory communications task. Combined, the various tasks are purported to measure aspects of performance relevant to the control of complex aviation-related systems. Each subject was trained to perform the MATB during 3 sessions (7.5 hrs. total) prior to their first experimental session.
Subjective State Measures: Several standardized mood and subjective state questionnaires were utilized to identify changes perceived by the subject over the course of each session. These measures included: automated Mood II scale, the Stanford Sleepiness Scale (SSS), and the Environmental Symptoms Questionnaire (ESQ-III). The automated NASA TLX survey measured perceived mental workload and was integrated with performance of the MATB. Brief descriptions of these measures are provided in Appendix A.
5
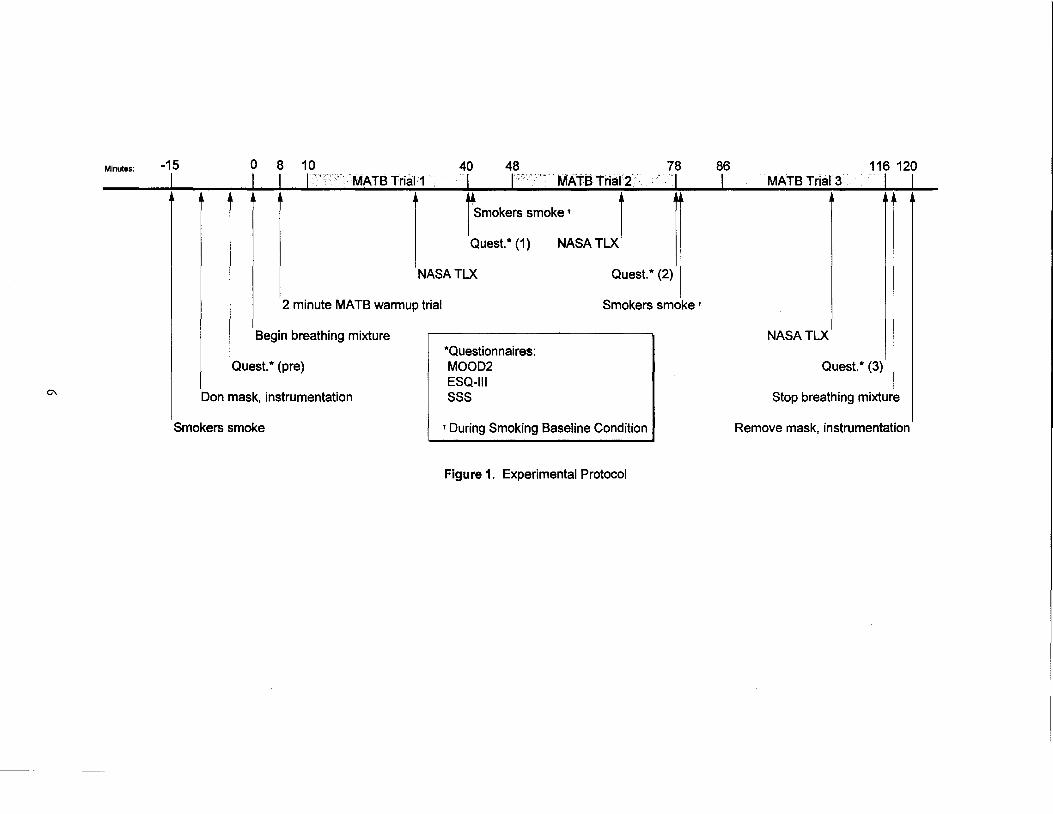
Procedure Figure 1 presents a time line depicting various
scheduled events over the course of each experimental session. Each session involved 2 hrs. of continuous oral-nasal mask breathing of a specified oxygen mixture, except during the smoking baseline condition when smokers doffed the mask and smoked a single cigarette prior to each 30 min MATB trial (nonsmokers doffed the mask and relaxed for 6 min. during each SB condition break). Subjects were assigned different altitude/condition orders and completed each 2-hr session on 5 separate occasions within a 2-week period. The MATB trials, however, were presented in a fixed order of workload: trial1 =moderate workload to emulate a take-off condition, trial2=low workload to emulate straight-and-level flight, and trial 3=high workload to emulate approach and landing.
Workload was manipulated by varying the number of events per minute for each subtask (e.g. 3 out-ofrange dials per min. vs. 1 per min.).
RESULTS
A repeated measures Analysis ofV ariancc; (AN 0 VA) procedure with smoking status nested within subjects was conducted with the physiological and MATB performance data. The mixed model analysis included 2 levels of smoking status (smokers and nonsmokers) repeated over 5 altitude sessions (GL, SB, 5K, 8K, and 12.5K), and 3 trials within each altitude session.
Physiological Variables The following four physiologic measures were in
cluded in the analysis: transcutaneous measurement of oxygen and carbon dioxide partial pressures (P ,c0
2
and P,cC0 2), heart rate (beats per minute, BPM), and oxyhemoglobin saturation (Sa0
2). For each 30-minute
MATB trial, these data were parceled into 1 0-three minute epochs, and the epoch means were analyzed by AN OVA. Table 1 provides means and standard deviations of the 4 physiologic measures.
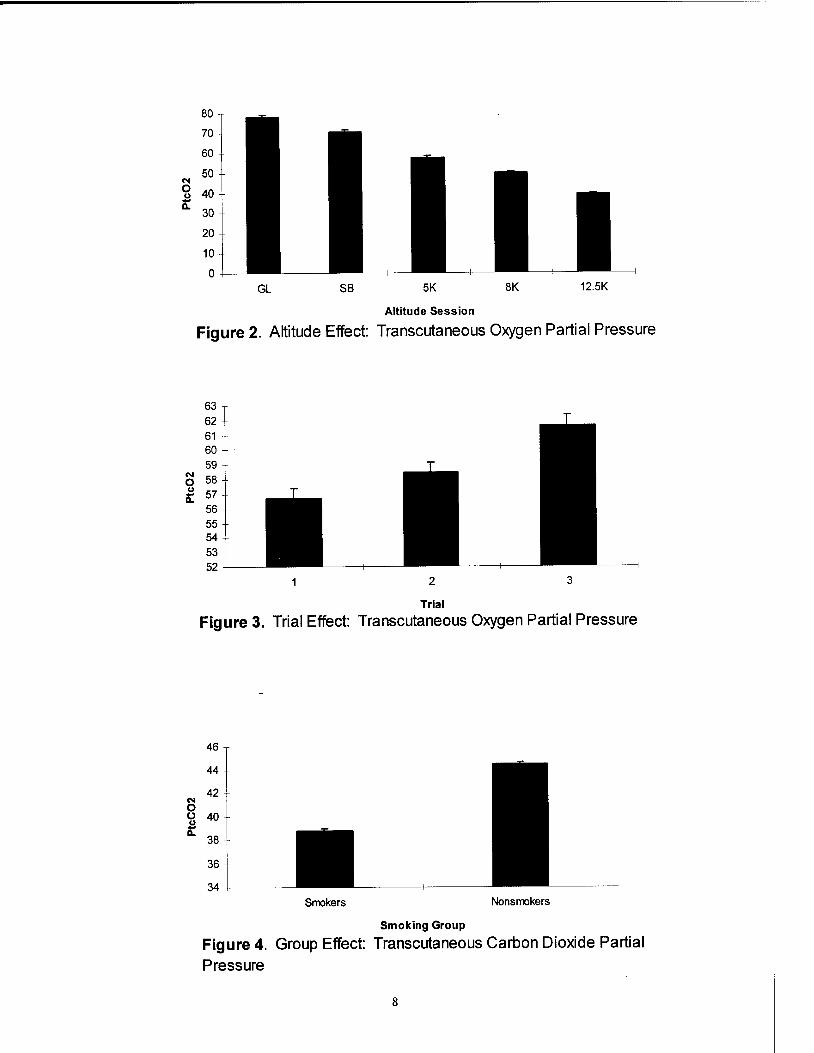
Oxygen Partial Pressure (PuO): Altitude (F( 4,58)=27 .0 1, 1!<0.000 1) and trial (F (2,33)= 18.41, 1!<0.0001) effects were found for the oxygen partial pressure measure. Post hoc Ryan-Einot-Gabriel-
Minutes:
0\
-15 0 8 10 40 48 78 86 116 120 L I I I MATB Trial1 I I ' MATB Trial2 I I MATB Trial3 I I
r Smokers smoke • 1 Quest.* (1) NASA TLX l
NASATLX Quest.* (2)
2 minute MATB warmup trial
Begin breathing mixture
Quest.* (pre)
Don mask, instrumentation
Smokers smoke
*Questionnaires: MOOD2 ESQ-111 sss
Smokers smoke t
t During Smoking Baseline Condition
Figure 1. Experimental Protocol
+
NASATLX
Quest.* (3)
Stop breathing mixture
Remove mask, instrumentation

Welsch (REGWQ) Multiple Range tests were
conducted and revealed anticipated results of signifi
cantly reduced transcutaneous oxygen partial pressure with our simulated altitude conditions, i.e., the high
est levels were found for the 2 ground level sessions
(compressed air, fraction of inspired oxygen=
FP2=0.21) and significantly lower levels were found
for the 5,000 ft. (Fp2=0.173), 8,000 ft. (F10 2=0.153),
and 12,500 ft. (F10
2=0.135) sessions, respectively.
This effect is presented in Figure 2. Figure 3 shows
that P,p2
was lowest for triall, significantly higher
for trial2, and highest for trial3, suggesting that some
physiological compensation or equilibration had oc
curred over the course of the 2-hr. session. Carbon Dioxide Partial Pressure (P rc CO): Smoking
status (F (1, 16)=8.26, p_<O.O 1), altitude (F( 4,58)=3.60, p_<0.01) and trial (F(2,33)=13.28, p_<0.0001) effects were found for transcutaneous carbon dioxide partial
pressure. Post hoc REGWQ tests showed that non
smokers had higher P,cC02 levels than did smokers. This effect is shown in Figure 4. The P,cC0
2 altitude
effect displayed a pattern similar to that found for
oxygen, i.e., PI& C02
was highest for the 2 ground level sessions and significantly lower for the 5,000 ft., 8,000 ft., and 12,500 ft. sessions, respectively. This
effect is shown in Figure 5. The P,cC0 2 measure showed an inverse pattern across trial, compared to
the oxygen trial effect. That is, the highest P rc CO 2
level was found for trial 1, and significantly lower
levels were found for trials 2 and 3, respectively and
provided further evidence that physiological compen
sation or equilibration had occurred over the 2-hr.
session. This significant trend is displayed in Figure 6.
The normal initial response to the hypoxic conditions
of this study, as produced by a reduction in F p2
, is
hyperventilation, which eliminates ("off gases") CO2
to some extent, and hence reduces the levels mea
sured. Smokers had significantly lower P rcCO 2
levels, compared to those of nonsmokers, and will be dis
cussed below.
Heart Rate (BPM): Altitude (F(4,58)=3.59, p_<0.01)
and trial (F(2,33)=23.89, p_<0.0001) effects were found for the heart rate measure. Two 2-way interactions were also found for heart rate: smoking status by trial (F(2,33)=10.19, p_<0.0004) and altitude by trial (F(8,116)=5.38, p_<O.OOOl). A 3-way smoking status
by altitude by trial interaction was also found (F(8,116)=5.68, p_<O.OOOl). Post hoc analysis of the altitude effect revealed elevated heart rates for the
smoking baseline session (SB); the 8,000 and 12,500
ft. sessions, with significantly lower rates for the 5,000 ft. and the ground level (GL) sessions, respectively.
Elevated heart rates are generally consistent with both a hypoxic stimulus and with the effects of nicotine.
Table 1. Means and Standard Deviations of the 4 Physiologic Measures.
GROUP* AL TITUDEt
Physiologic Smoker Nonsmoker Ground Smoking 5, 000 ft. 8,000 ft. 12,500 ft. Measure Level Baseline
Ptc02 60.0 57.9 78.1 70.5 57.6 50.0 39.2 18.3 22.0 18.6 15.6 15.8 10.5 11.9
PtcC02 38.8 44.5 42.5 43.4 41.7 41.2 39.4 6.8 3.3 7.2 4.8 5.0 6.2 6.0
Heart Rate 79.7 69.6 70.8 76.5 73.8 76.1 76.0 CBPM) 11.1 11.0 10.8 13.2 11.5 12.5 11.8
Sao 2 96.6 95.7 97.8 98.4 96.7 95.5 92.3 3.0 3.5 1.7 1.5 1.8 2.7 3.7
PtcC02: p < .01 t All variables: p < .01 tt All variables: p < .01
Numbers in italics are standard deviations.
7
80
70
60
50 N 0 40 ~ 11.
30
20
10
0 GL SB 5K 8K 12.5K
Altitude Session
Figure 2. Altitude Effect: Transcutaneous Oxygen Partial Pressure
63 62 61 60 59
N 58 0 C.) 57 0:
56 55 54 53 52
2 3
Trial
Figure 3. Trial Effect: Transcutaneous Oxygen Partial Pressure
46
44
42 N 0 0 40 ~ 11.
38
36
34 Smokers Nonsmokers
Smoking Group
Figure 4. Group Effect: Transcutaneous Carbon Dioxide Partial
Pressure
8

44
43
42
N 41 0 0 40 ~ a.. 39
38
37
36 GL SB 5K 8K 12.5K
Altitude Session
Figure 5. Altitude Effect: Transcutaneous Carbon Dioxide Partial
N 0 0 u it
42.5
42
41.5
41
40.5
40
39.5 2 3
Trial
Figure 6. Trial Effect: Transcutaneous Carbon Dioxide Partial
78
76
:i a.. 74 ~ .s 72 Ill 0::: t:: 70 Ill Gl :I:
68
66 GL SB 5K
Altitude Session
Figure 7. Altitude Effect: Heart Rate
9
8K 12.5K

78 77
i' 76 Q. 75 ~ 74 .s ns 73 a:: t:: 72 ns Cll J: 71
70
69 2 3
Trial
Figure 8. Trial Effect: Heart Rate
Trial
Figure 9. Group by Trial Interaction Effect: Heart Rate
82
80
78
:i 76 Q.
~ 74 •rrial1 .s 72 ns a:: m!Trial 2 t:: 70 ns Cll 68 J:
•rrial3
66
64
62 GL SB 5K 8K 12.5K
Altitude Session
Figure 10. Trial by Altitude Interaction Effect: Heart Rate
10
90
85
i' 80 c. e. ~ 75 0::: t: m J: 70
65
Smokers
60+-----------~----------~-----------
Trial1 Trial2 Trial3
NonSmokers
Trial1 Trial2 Trial3
Trial
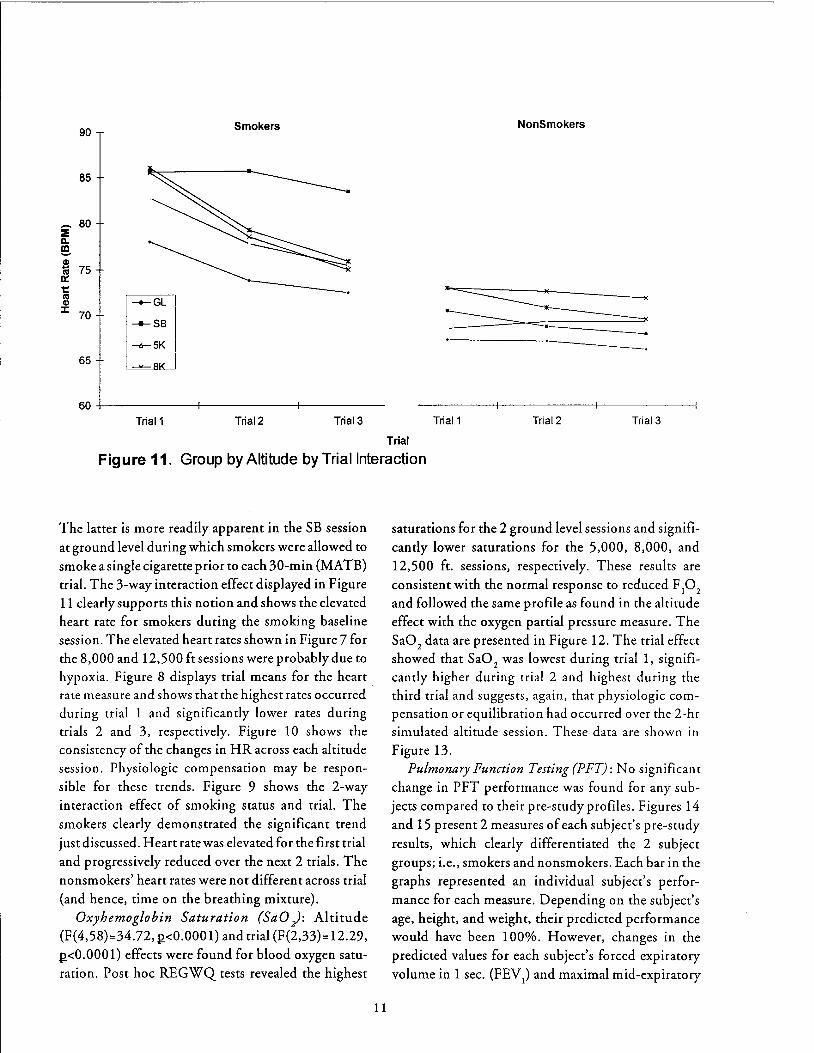
Figure 11. Group by Altitude by Trial Interaction
The latter is more readily apparent in the SB session
at ground level during which smokers were allowed to smoke a single cigarette prior to each 30-min (MATB) trial. The 3-way interaction effect displayed in Figure 11 clearly supports this notion and shows the elevated heart rate for smokers during the smoking baseline session. The elevated heart rates shown in Figure 7 for the 8,000 and 12,500 ft sessions were probably due to hypoxia. Figure 8 displays trial means for the heart rate measure and shows that the highest rates occurred during trial 1 and significantly lower rates during trials 2 and 3, respectively. Figure 10 shows the consistency of the changes in HR across each altitude session. Physiologic compensation may be responsible for these trends. Figure 9 shows the 2-way interaction effect of smoking status and trial. The smokers clearly demonstrated the significant trend
just discussed. Heart rate was elevated for the first trial and progressively reduced over the next 2 trials. The nonsmokers' heart rates were not different across trial (and hence, time on the breathing mixture).
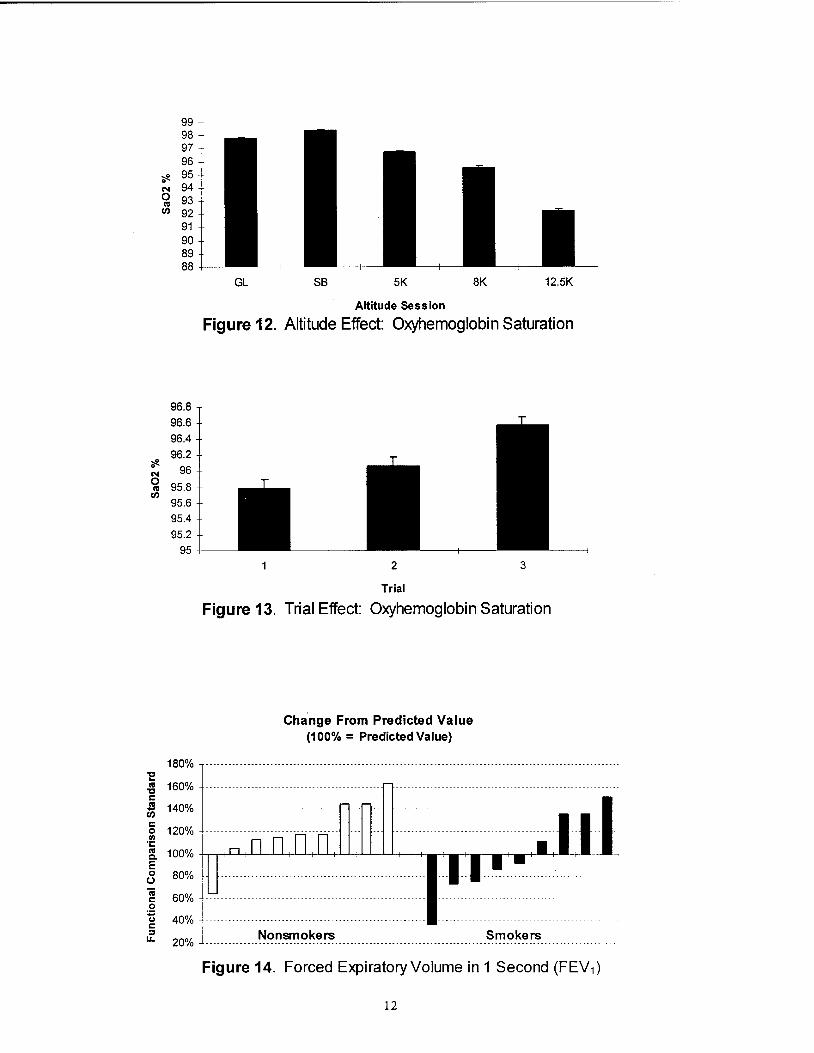
Oxyhemoglobin Saturation (SaO): Altitude (F(4,58)=34.72, J.!<0.0001) and trial (F(2,33)= 12.29, J.!<0.0001) effects were found for blood oxygen saturation. Post hoc REGWQ tests revealed the highest
11
saturations for the 2 ground level sessions and significantly lower saturations for the 5,000, 8,000, and
12,500 ft. sessions, respectively. These results are consistent with the normal response to reduced F
10
2
and followed the same profile as found in the altitude effect with the oxygen partial pressure measure. The Sa0
2 data are presented in Figure 12. The trial effect
showed that SaO 2
was lowest during trial 1, significantly higher during trial 2 and highest during the third trial and suggests, again, that physiologic compensation or equilibration had occurred over the 2-hr simulated altitude session. These data are shown in Figure 13.
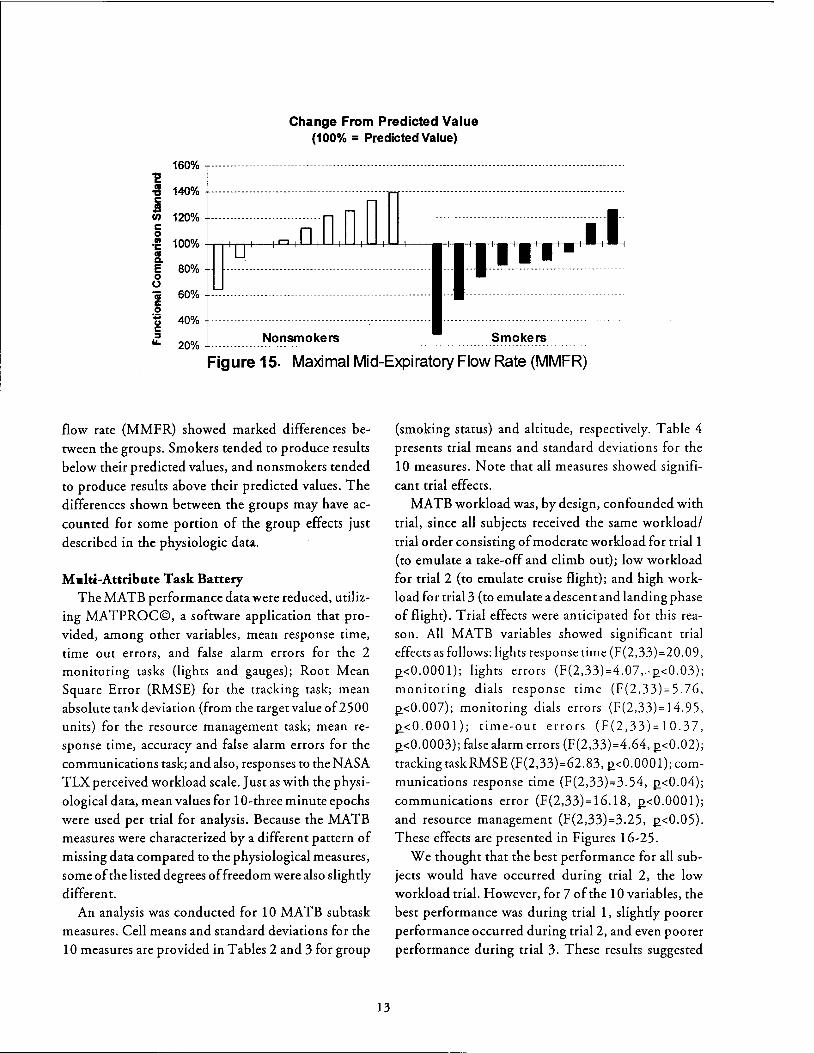
Pulmonary Function Testing (PFT): No significant change in PFT performance was found for any sub
jects compared to their pre-study profiles. Figures 14 and 15 present 2 measures of each subject's pre-study
results, which clearly differentiated the 2 subject groups; i.e., smokers and nonsmokers. Each bar in the graphs represented an individual subject's performance for each measure. Depending on the subject's age, height, and weight, their predicted performance would have been 100%. However, changes in the predicted values for each subject's forced expiratory
volume in 1 sec. (FEV1) and maximal mid-expiratory
?fe. N 0 ftl
U)
99 98 97 96
?fe. 95 N 94 ~ 93 U) 92
91 90 89 88
96.8 96.6 96.4 96.2
96
95.8 95.6 95.4 95.2
95
180%
80%
60%
GL SB 5K 8K 12.5K
Altitude Session
Figure 12. Altitude Effect: Oxyhemoglobin Saturation
2 3
Trial
Figure 13. Trial Effect: Oxyhemoglobin Saturation
Change From Predicted Value (100% = Predicted Value)
40% -----------------------------------------------------
20% L ____________ ~C?-~~1:?~~~---------------------- Smokers
Figure 14. Forced Expiratory Volume in 1 Second (FEV1)
12
Change From Predicted Value (100% = PredictedValue)
160% '2 ~ 140% j rn 120%
60%
40%
20% Nonsmokers Smokers
Figure 15. Maximal Mid-Expiratory Flow Rate (MMFR)
flow rate (MMFR) showed marked differences be
tween the groups. Smokers tended to produce results
below their predicted values, and nonsmokers tended
to produce results above their predicted values. The differences shown between the groups may have ac
counted for some portion of the group effects just
described in the physiologic data.
Malti-Attribute Task Battery The MATB performance data were reduced, utiliz
ing MATPROC©, a software application that pro
vided, among other variables, mean response time, time out errors, and false alarm errors for the 2 monitoring tasks (lights and gauges); Root Mean Square Error (RMSE) for the tracking task; mean
absolute tank deviation (from the target value of2500 units) for the resource management task; mean response time, accuracy and false alarm errors for the
communications task; and also, responses to the NASA
TLX perceived workload scale. Just as with the physi
ological data, mean values for 1 0-three minute epochs
were used per trial for analysis. Because the MATB measures were characterized by a different pattern of
missing data compared to the physiological measures, some of the listed degrees of freedom were also slightly
different.
An analysis was conducted for 1 0 MA TB sub task measures. Cell means and standard deviations for the
10 measures are provided in Tables 2 and 3 for group
13
(smoking status) and altitude, respectively. Table 4
presents trial means and standard deviations for the
10 measures. Note that all measures showed signifi
cant trial effects. MATB workload was, by design, confounded with
trial, since all subjects received the same workload/
trial order consisting of moderate workload for trial1 (to emulate a take-off and climb out); low workload for trial 2 (to emulate cruise flight); and high work
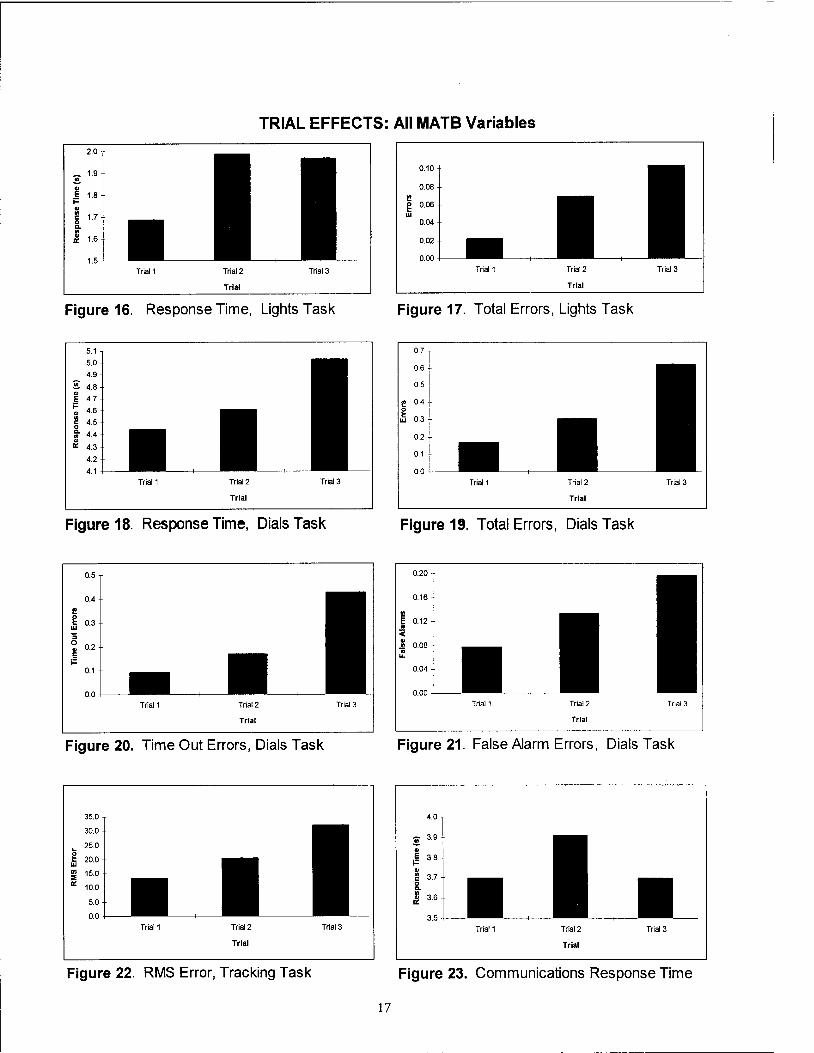
load for trial3 (to emulate a descent and landing phase of flight). Trial effects were anticipated for this reason. All MATB variables showed significant trial effects as follows: lights response time (F(2,33)=20.09, ~<0.0001); lights errors (F(2,33)=4.07,.-~<0.03);
monitoring dials response time (F(2,33)=5.76,
~<0.007); monitoring dials errors (F(2,33)= 14. 95,
I!,<O.OOOl); time-out errors (F(2,33)=10.37,
~<0.0003); false alarm errors (F(2,33)=4.64, ~<0.02);
trackingtaskRMSE (F(2,33)=62.83, ~<0.0001); com
munications response time (F(2,33)=3.54, ~<0.04);
communications error (F(2,33)=16.18, ~<0.0001);
and resource management (F(2,33)=3.25, ~<0.05). These effects are presented in Figures 16-25.
We thought that the best performance for all sub
jects would have occurred during trial 2, the low
workload trial. However, for 7 of the 10 variables, the
best performance was during trial 1, slightly poorer
performance occurred during trial2, and even poorer
performance during trial 3. These results suggested
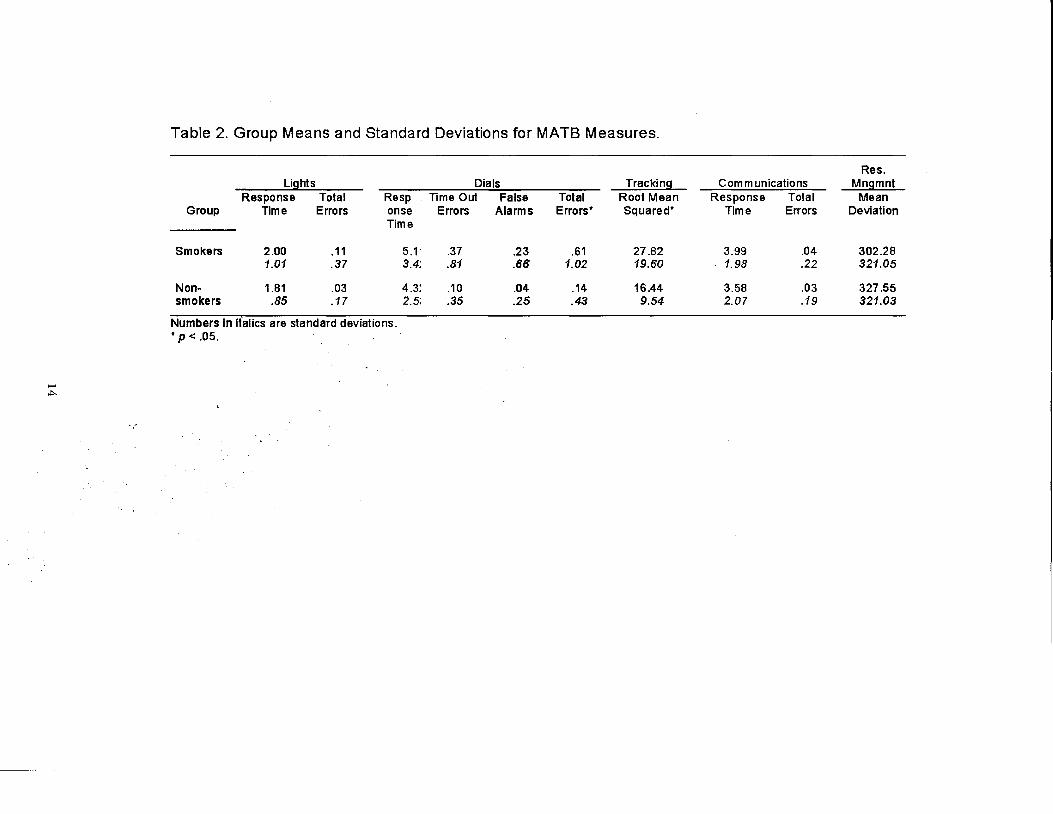
Table 2. Group Means and Standard Deviations for MATB Measures.
Res. Lights Dials Tracking Communications Mngmnt
Response Total Resp Time Out False Total Root Mean Response Total Mean Group Time Errors onse Errors Alarms Errors• Squared* Time Errors Deviation
Time
Smokers 2.00 .11 5.1· .37 .23 .61 27.82 3.99 .04 302.28 1.01 .37 3.4; .81 .66 1.02 19.60 1.98 .22 321.05
Non- 1.81 .03 4.3: .10 .04 .14 16.44 3.58 .03 327.55 smokers .85 .17 2.5; .35 .25 .43 9.54 2.07 .19 321.03
Numbers In italics are standard deviations . • p < .05 .
..,..

Table 3. Altitude by Group Means and Standard Deviations for MATB Measures.
Res. umts Dial! Tracking Communications Mngmnt
Response Total RespCirtse Time Out False Total Root Mean Response Total Mean ,AJtitude Groue Time Errors Time Errors At.rns ErrorsT Squared Time Errors Deviation
Ground Smokers 2.01 0.18 5.82 0.59 0.31 0.90 29.11 4.49 0.06 243.45 Level 1.12 0.50 4.04 1.03 0.80 1.22 21.26 2.39 0.25 201.17
Non- 1.80 0.04 4.49 0.10 0.07 0.17 15.91 3.64 0.03 305.52 smokers 0.75 0.22 2.50 0.36 0.32 0.51 7. 13 2.12 0.20 292.55
Smoking Smokers 1.91 0.08 5.09 ·o.35 0.10 0.45 25.67 3.84 0.03 280.32 Baseline 0.91 0.32 3.14 0.75 0.45 0.86 18.45 1.92 0.20 240.45
Non- 1.78 0.01 4.48 0.09 0.08 0.17 16.91 3.63 0.01 340.73 Smokers 0.73 0.12 2.62 0.38 0.37 0.53 9.52 2.08 0.12 314.54
- 5000 feet Smokers 1.99 0.06 5.17 0.28 0.16 0.44 28.06 3.82 0.04 318.97 VI 0.98 0.23 3.09 0.63 0.48 0.79 17.86 1.72 0.27 315.98
Non- 1.71 0.03 4.11 0.1 0.02 0.12 15.83 3.47 O.Q1 333.25 Smokers 0.73 0.17 2.58 0.33 0.15 0.36 8.17 2.00 0.12 372.53
8000 feet Smokers 2.05 0.16 4.88 0.38 0.33 0.70 28.01 4.03 0.02 369.21 1.04 0.43 3.3~ 0.88 0.78 1.13 2214 1.81 0.13 495.14
Non- 1.86 0.03 4.3 0.11 0.02 0.13 16.29 3.72 0.05 331.80 Smokers 0.9~ 0.16 2.~9 0.37 0.15 0.39 10.15 2.10 0.25 322.27
12,500 Smokers 1.93 0.09 4.85 0.31 0.29 0.60 28.48 3.83 0.04 298.29 feet
1.00 0.31 2.92 0.71 0.70 1.01 18.43 1.96 0.22 268.20
Non- 1.88 0.02 4.23 0.09 0.02 0.11 17.26 3.46 0.04 326.75 Smokers 1.05 0.14 2.36 0.32 0.15 0.37 1200 2.05 0.22 299.79
Numbers in italics are standard deviations. • p< .05. tp< .01.
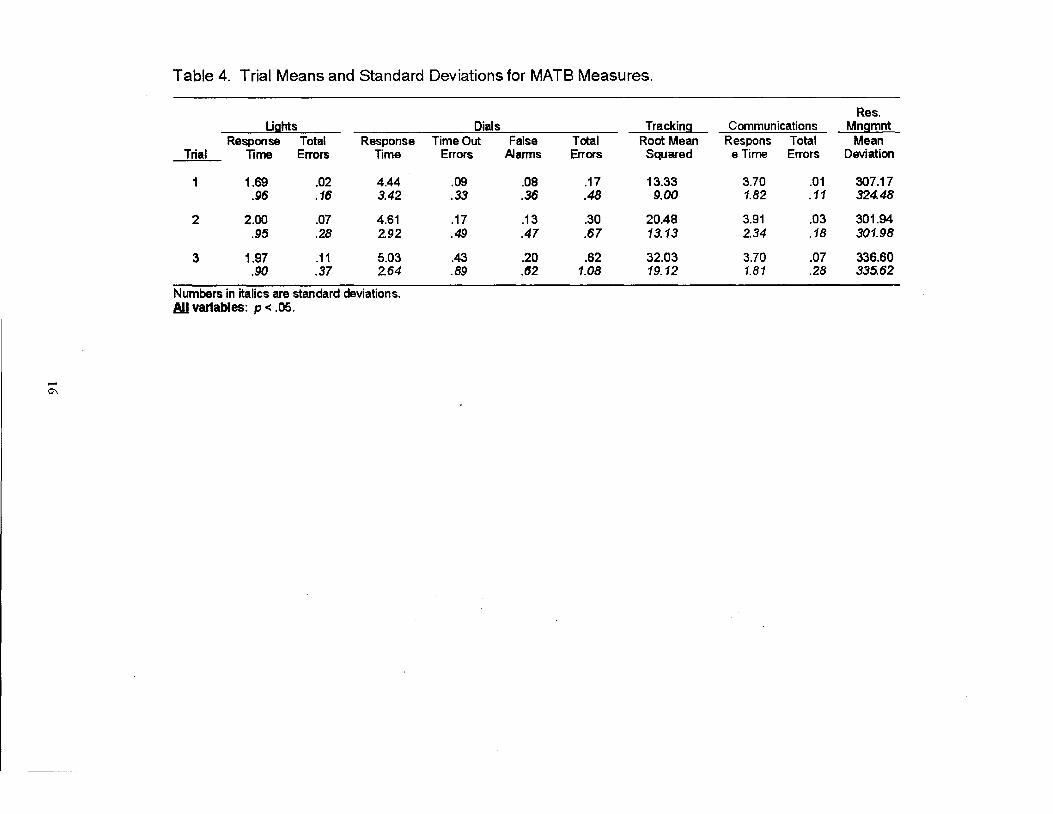
Table 4. Trial Means and Standard Deviations for MATB Measures.
Res. Ughts Dials Tracking Communications Mngmnt
Response Total Response TimeOut False Total Root Mean Respons Total Mean Trial Time Errors Time Errors Alarms Errors Squared eTime Errors Deviation
1.69 .02 4.44 .09 .08 .17 13.33 3.70 .01 307.17 .96 .16 3.42 .33 .36 .48 9.00 1.82 .11 324.48
2 2.00 .07 4.61 .17 .13 .30 20.48 3.91 .03 301.94 .95 .28 2.92 .49 .47 .67 13.13 2.34 .18 301.98
3 1.97 .11 5.03 .43 .20 .62 32.03 3.70 .07 336.60 .90 .37 2.64 .89 .62 1.08 19.12 1.81 .28 335.62
Numbers in italics are standard deviations. All variables: p < .05.
0\
TRIAL EFFECTS: All MATB Variables
2.0
- 1.9 .!!!. .. ~ 1.8 .. ~ 1.7 ... ~ 1.6
1.5 Trial1 Trial2
Trial
Trial3
Figure 16. Response Time, Lights Task
5.1
5.0
4.9
~ 4.8 .. E 4.7
~ 4.6
g 4.5
i 44 4.3
4.2
4.1 Trial1 Trial2
Trial
Trial3
Figure 18. Response Time, Dials Task
0.5
0.4
r! ~ 0.3 IJJ
'S 0 0.2 .. E I=
0.1
0.0 Trial1 Trial2 Trial3
Trial
Figure 20. Time Out Errors, Dials Task
35.0
30.0
~ IJJ
25.0
20.0
ttl 15.0 ::1! a: 10.0
5.0
0.0 Trial1 Trial2 Trial3
Trial
Figure 22. RMS Error, Tracking Task
17
0.10
0.08
e ~ 0.06
IJJ 0.04
0.02
0.00 Trial1 Trial2 Trial3
Trial
Figure 17. Total Errors, Lights Task
0.7
0.6
0.5
e 04
~ 0.3 IJJ
0.2
0.1
0.0 Trial1 Trial2 Trial3
Trial
Figure 19. Total Errors, Dials Task
0.20
0.16
.. i 0.12
:;;: .. 0.08 ..
'i ... 0.04
0.00 Trial1 Trial2 Tnal3
Trial
Figure 21. False Alarm Errors, Dials Task
4.0
~ 3.9
i 3.8 .. ~ 3.7 &. ~ 3.6
3.5 Trial1 Trial2
Trial
Trial3
Figure 23. Communications Response Time
0.07
0.06
0.05
!! O.o4
~ w 0.03
0.02
0.01
0.00 Trial1
TRIAL EFFECTS: All MATB Variables
Trial2 Trial3
Trial
340
~ 330 0
~ 320 li c $ 310 " 0 ~ 300 c .. :al 290
280
Trial1 Trial2 Trial3
Trial
Figure 24. Communications Errors Figure 25. Mean Absolute Tank Deviation, Resource Management Task
0.12
0.10
0.08
f e 0.06 .. w
0.04
0.02
0.00 GL SB 5K 8K 12.5K
Altitude
Figure 26. Altitude Effect: Total Errors, Lights Task
6 - 5 1/) -C1l 4 E • Trial1 i= 3 C1l • Trial2 1/)
c 2 0 oTrial3 Q. 1/) 1 C1l ~
0 GL SB SK 8K 12.5K
Altitude
Figure 27. Altitude by Trial Effect: Response Time, Dials Task
18
that both time in the session (i.e., time on the breath
ing mixtures) and workload combined to produce the linear decline in task performance across the 3 trials.
The results that follow describe each MATB mea
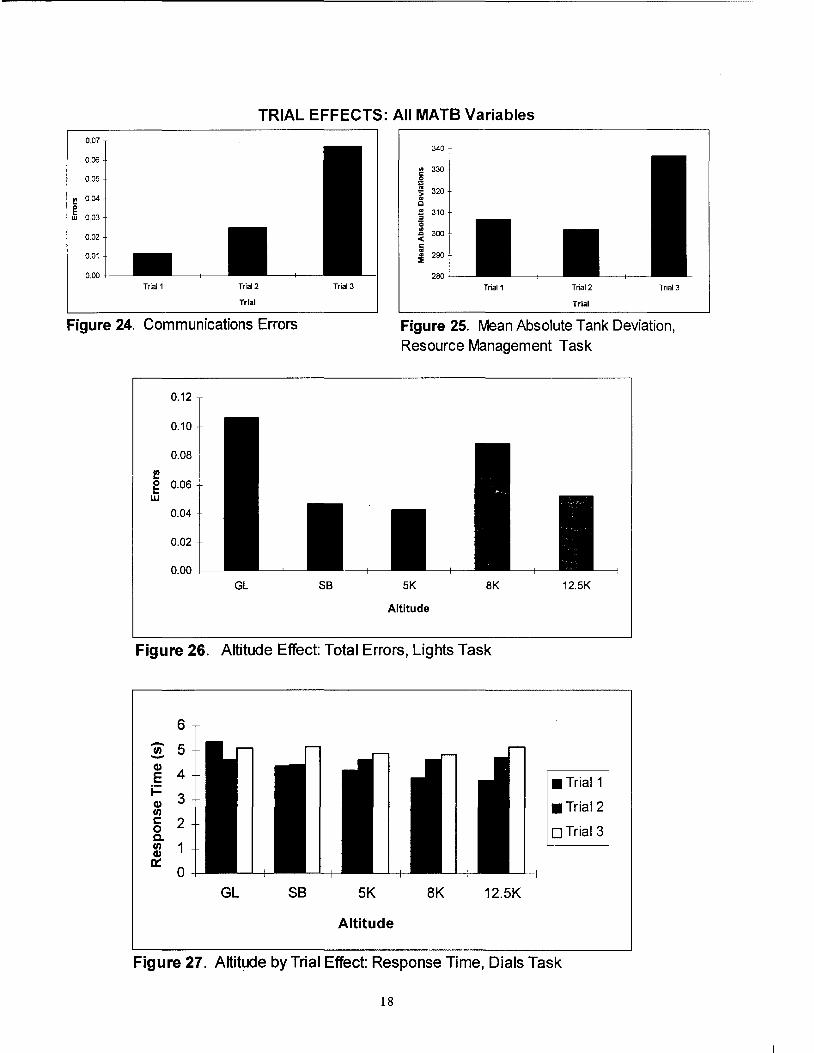
sure separately. Monitoring Lights: RT and Error. Altitude effects
were found for the lights error measure (F(4,63)=2.87, ~<0.03). Post hoc tests showed that the highest number of errors occurred during the ground level and 8,000 ft. sessions, significantly fewer errors occurred during the 12,500 ft. and smoking baseline sessions,
with fewest errors during the 5,000 ft. session, as
presented in Figure 26. Monitoring Dials: RT, Total Errors, Time-out and
False Alarm Errors. An altitude by trial interaction
effect (F(8,133)=2.71, ~<0.009) was found for the monitoring dials response time measure. This effect is presented in Figure 27. The error measure showed significant effects across all factors, including their interactions as follow: smoking group (F(l, 16)= 7.13, ~<0.02), altitude (F(4,63)=4.60, ~<0.03), smoking group by altitude (F(4,63)=4.47, ~<0.003), smoking
group by trial (F(2,33)=3.86, ~<0.03), and altitude by trial (F(8,133)=2.85, ~<0.006). These effects are presented in Figures 28-32. The total error measure was composed of both time-out errors (failure to respond in a timely manner) and false alarm errors (responses to dials with no positive stimulus). We therefore, analyzed time-out and false alarm errors and found that the latter measure showed a smoking group by altitude interaction effect (F(4,63)=2.97, ~<0.03),
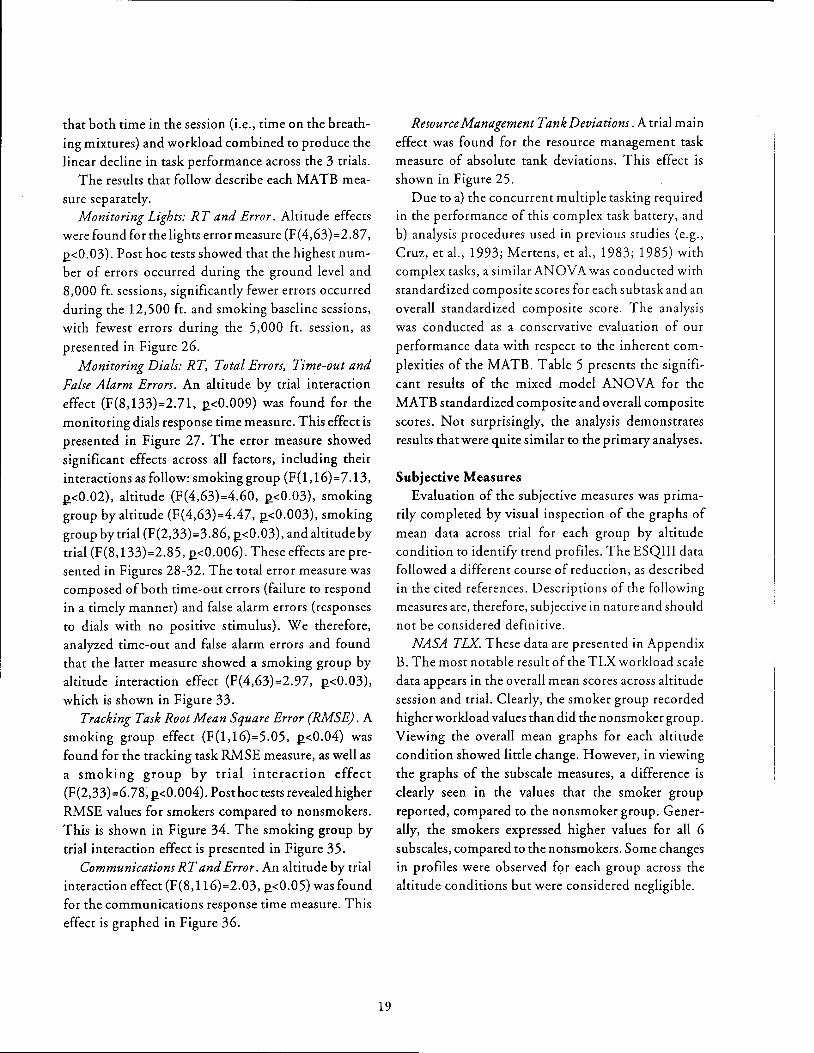
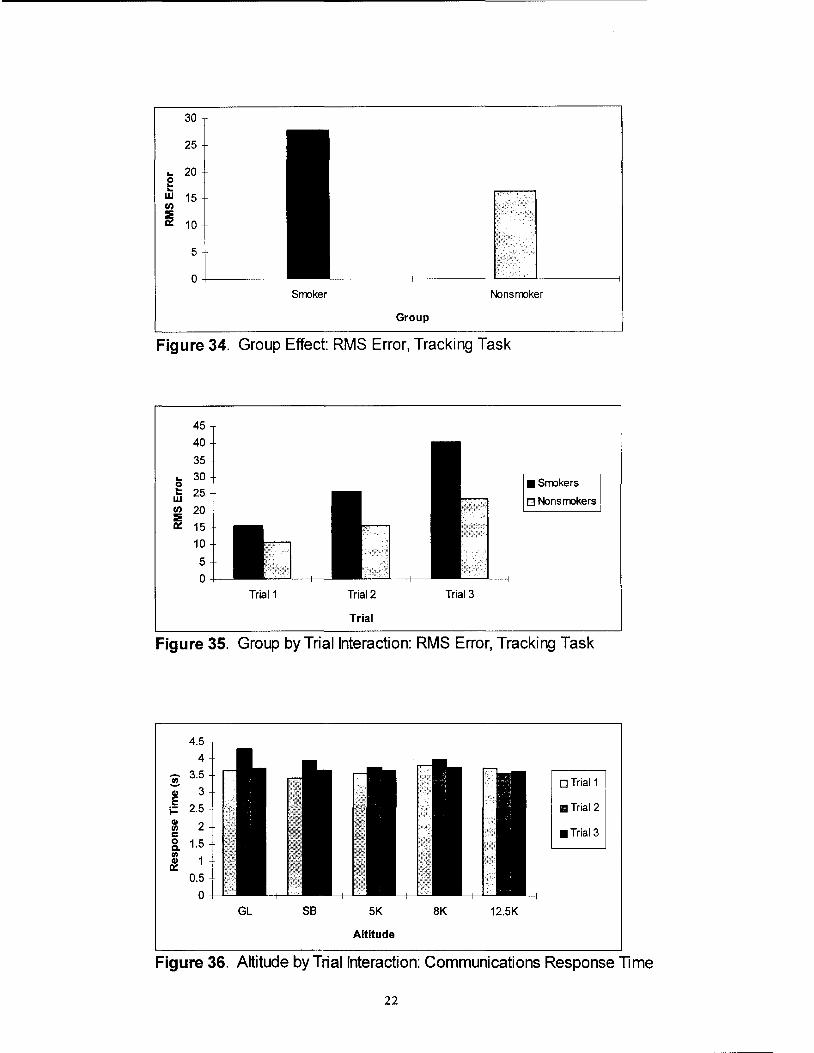
which is shown in Figure 33. Tracking Task Root Mean Square Error (RMSE). A
smoking group effect (F(1,16)=5.05, ~<0.04) was found for the tracking task RMSE measure, as well as a smoking group by trial interaction effect (F(2,33)=6.78, ~<0.004). Post hoc tests revealed higher RMSE values for smokers compared to nonsmokers. This is shown in Figure 34. The smoking group by
trial interaction effect is presented in Figure 35. Communications RT and Error. An altitude by trial
interaction effect (F(8, 116)=2.03, ~<0.05) was found for the communications response time measure. This effect is graphed in Figure 36.
19
Resource Management Tank Deviations. A trial main effect was found for the resource management task measure of absolute tank deviations. This effect is
shown in Figure 25. Due to a) the concurrent multiple tasking required
in the performance of this complex task battery, and b) analysis procedures used in previous studies (e.g., Cruz, et al., 1993; Mertens, et al., 1983; 1985) with complex tasks, a similar AN OVA was conducted with standardized composite scores for each sub task and an overall standardized composite score. The analysis was conducted as a conservative evaluation of our
performance data with respect to the inherent com
plexities of the MATB. Table 5 presents the significant results of the mixed model ANOVA for the MATB standardized composite and overall composite
scores. Not surprisingly, the analysis demonstrates results that were quite similar to the primary analyses.
Subjective Measures Evaluation of the subjective measures was prima
rily completed by visual inspection of the graphs of
mean data across trial for each group by altitude condition to identify trend profiles. The ESQIII data followed a different course of reduction, as described in the cited references. Descriptions of the following measures are, therefore, subjective in nature and should
not be considered definitive. NASA TLX. These data are presented in Appendix
B. The most notable result of the TLX workload scale data appears in the overall mean scores across altitude session and trial. Clearly, the smoker group recorded higher workload values than did the nonsmoker group. Viewing the overall mean graphs for each altitude
condition showed little change. However, in viewing the graphs of the subscale measures, a difference is
clearly seen in the values that the smoker group reported, compared to the nonsmoker group. Generally, the smokers expressed higher values for all 6
subscales, compared to the nonsmokers. Some changes in profiles were observed for each group across the altitude conditions but were considered negligible.

0.7
0.6
0.5
r! 0.4 0 .. .. 0.3 w
0.2
0.1
0.0 Srroker Nonsrroker
Group
Figure 28. Group Effect: Total Errors, Dials Task
0.6
0.5
0.4
I!! 0 0.3 .. .. w
0.2
0.1
0.0 GL SB 5K 8K 12.5K
Altitude
Figure 29. Altitude Effect: Total Errors, Dials Task
0.9
0.8
0.7
0.6 • Srrokers
I!! 0.5 e 0.4 .. w
o Nonsmokers
0.3
0.2
0.1
0 GL SB 5K 8K 12.5K
Altitude
Figure 30. Group by Altitude Interaction: Total Errors, Dials Task
20

0.9
0.8
0.7
~ 0.6
e 0.5 w 0.4
0.3
0.2
0.1
0
Trial1 Trial2
Trial
Trial3
•Smokers 1
o Nonsmokers !
Figure 31. Group by Trial Interaction: Total Errors, Dials Task
0.9
0.8
0.7
0.6 oTrial1
I! 0.5 g 0.4 w
0.3
oTrial2
111 Trial3
0.2
0.1
0
GL SB 5K 8K 12.5K
Altitude
Figure 32. Altitude by Trial Interaction: Total Errors, Dials Task
0.35
0.3
II) 0.25
E •Smokers .. 0.2 ca :;( Q Nonsmokers Cll 0.15
!!J. ca u.. 0.1
0.05
0
GL SB 5K 8K 12.5K
Altitude
Figure 33. Group by Altitude Interaction: False Alarms, Dials Task
21
30
25
g 20
w 15 t/)
~ 10
5
0+------Srmker Nonsrmker
Group
Figure 34. Group Effect: RMS Error, Tracking Task
45
40
35
... 30 0 t: 25 w t/) 20
~ 15
111Srmkers
o Nonsrmkers
10
5
0
Trial1 Trial2 Trial3
Trial
Figure 35. Group by Trial Interaction: RMS Error, Tracking Task
4.5
4
~ 3.5
0 Trial1 Cll 3 E
2.5 111Trial2 i= Gl 2 II)
J11Trial3 c 0 1.5 c. II)
1 ~ 0.5
0
GL SB 5K 8K 12.5K
Altitude
Figure 36. Altitude by Trial Interaction: Communications Response Time
22
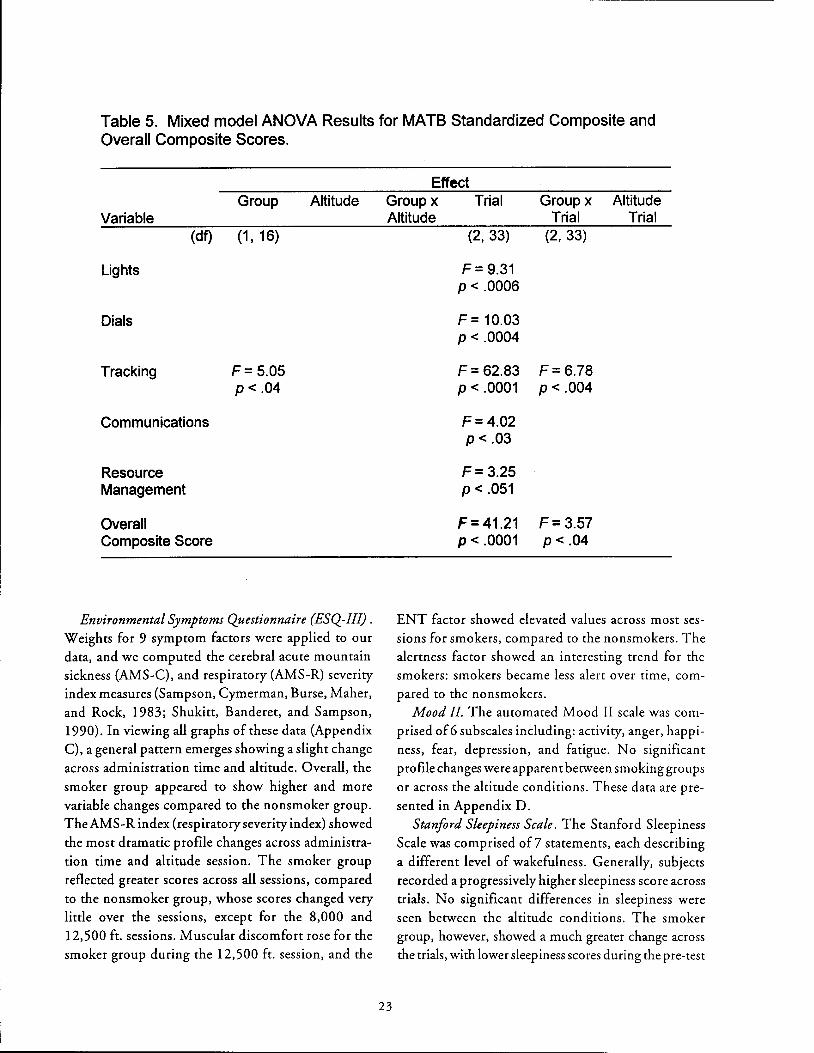
Table 5. Mixed model ANOVA Results for MATB Standardized Composite and Overall Composite Scores.
Group Altitude Variable
(df) (1' 16)
Lights
Dials
Tracking F= 5.05 p< .04
Communications
Resource Management
Overall Composite Score
Environmental Symptoms Questionnaire (ESQ-III) . Weights for 9 symptom factors were applied to our data, and we computed the cerebral acute mountain sickness (AMS-C), and respiratory (AMS-R) severity index measures {Sampson, Cymerman, Burse, Maher, and Rock, 1983; Shukitt, Banderet, and Sampson, 1990). In viewing all graphs of these data (Appendix C), a general pattern emerges showing a slight change across administration time and altitude. Overall, the
smoker group appeared to show higher and more variable changes compared to the nonsmoker group. The AMS-R index {respiratory severity index) showed the most dramatic profile changes across administration time and altitude session. The smoker group
reflected greater scores across all sessions, compared to the nonsmoker group, whose scores changed very little over the sessions, except for the 8,000 and 12,500 ft. sessions. Muscular discomfort rose for the smoker group during the 12,500 ft. session, and the
Effect Group x Trial Group x Altitude Altitude Trial Trial
23
(2, 33) (2, 33)
F= 9.31 p < .0006
F = 10.03 p < .0004
F= 62.83 F= 6.78 p < .0001 p < .004
F= 4.02 p < .03
F= 3.25 p < .051
F= 41.21 F= 3.57 p < .0001 p< .04
ENT factor showed elevated values across most sessions for smokers, compared to the nonsmokers. The alertness factor showed an interesting trend for the smokers: smokers became less alert over time, compared to the nonsmokers.
Mood II. The automated Mood II scale was comprised of6 subscales including: activity, anger, happi
ness, fear, depression, and fatigue. No significant profile changes were apparent between smoking groups or across the altitude conditions. These data are pre
sented in Appendix D. Stanford Sleepiness Scale. The Stanford Sleepiness
Scale was comprised of? statements, each describing a different level of wakefulness. Generally, subjects recorded a progressively higher sleepiness score across trials. No significant differences in sleepiness were seen between the altitude conditions. The smoker group, however, showed a much greater change across the trials, with lower sleepiness scores during the pre-test

baseline and greater sleepiness scores during the final administration compared to the nonsmoker group.
These results are presented in Appendix E.
DISCUSSION
Though general responses to the effects of hypoxia are well known, individual tolerance to hypoxia is variable and derived from the efficiency and adequacy of physiological compensatory mechanisms of the body {especially the respiration/ventilation components of compensation, Slonim & Hamilton, 1981).
Cigarette smoking was a particular interest and focus
in this study because it is one life-style characteristic
that was believed to compromise the efficiency and
adequacy of the body's evoked compensation to hy
poxia at general aviation altitudes. We began the study with 2 research objectives in
mind. One was to identify potential decrements of complex cognitive and psychomotor task performance caused by mild hypoxia; the other, to identify the potential interactive effects on performance of smokers who have just smoked 2 cigarettes and the mild hypoxia produced when breathing the reduced oxygen mixtures of this study. We believed the smoker group would demonstrate a difference in altitude tolerance, compared to the nonsmoker group, and that this difference would be manifested as cognitive
or behavioral changes at lower altitudes, compared
with nonsmokers. Hence, we anticipated a differen
tial response from our subjects across the simulated
altitude conditions, with performance decrements occurring at lower altitudes for the smoker group, compared to the nonsmoker group.
Physiological Measures First, we conducted an evaluation of the physi
ological measures to provide evidence that the altitude conditions, i.e., 2 ground level and 3 simulated alti
tudes, were accurately represented using Grade E compressed air and 3 reduced oxygen mixtures (Primary Standard Quality, accuracy to 0.05%). The results of these preliminary analyses confirmed that our independent variable conditions were, indeed, accurately simulated.
24
One's physiologic response to altitude hypoxia depends, in part, on the ascent rate, the maximum altitude attained, and the duration of exposure to that
altitude condition {Harding & Mills, 1983). For our acute 2 hr. exposures to the simulated altitudes of 5,000, 8,000, 12,500 ft. and 2 ground level {compressed air) conditions, both blood oxygen saturation percentage (SaO
2) and transcutaneous oxygen partial
pressure (P rc 0 2) followed similar and consistent trends,
as documented in the altitude main effects for those measures. These measures decreased in value monotoni
cally with the reduction of oxygen in the inspired air.
Carbon dioxide partial pressure (P rcCO) and heart
rate were also monitored and found to follow antici
pated trends. Initial responses to a reduction in the
oxygen content of one's inspired air are increased
ventilation and heart rate (Sloan & Hamilton, 1981). This is the body's attempt to compensate for the reduced oxygen tension and increase the availability of oxygen for the cells. The immediate result of a higher rate of respiration is a reduction in carbon dioxide, which was readily apparent in our data. A significant decrease of P,cC0
2 was found across our
altitude conditions. Often, this change in CO2
results in an increased oxygen-carrying capacity of the blood by changing its alkalinity. This, in turn, favors the uptake of oxygen by the hemoglobin (Sloan & Hamilton, 1981).
Cardiovascular responses to reduced oxygen ten
sion are regulated autonomically with feedback from
central and peripheral chemoreceptors. Peripheral
chemoreceptors are also responsive to changes in the
partial pressures of CO2
and the pH of arterial blood (Ernsting, 1988). The aortic and carotid bodies sense
the reduced oxygen tension of the blood and signal the cardiovascular and respiratory mechanisms to compensate. An elevated heart rate primarily leads to an increased distribution of blood for oxygen transfer to the tissues. Our data exhibited a progressive rise in
heart rate across the 2.ltitude conditions, as was demonstrated by a significant altitude effect.
Evidence of physiological adaptation may also have been demonstrated in our results. All 4 physiological measures demonstrated trial effects over the course of each 2-hr. breathing gas session and followed a pattern hypothesized to be physiological adaptation. The
P,c02
and S3:0 2 measures increased in mean value across the 3 trials, with the P C0
2 and heart rate
tC
measures decreasing over the same time frame (2 hrs.). Group differences between smokers and nonsmok
ers were also found with some of the physiological measures. We had initially indicated some distinction
between groups in their pulmonary function test (PFT) results. The spirometer used for the PFT mea
sures the capacity for dynamic changes of lung vol
ume, i.e., the volumetric flow of gas into and out of
the lung. The forced expiratory spirogram output of the testing is often useful as a clinical tool for the evaluation of pulmonary function and disease. Two of the spirogram measures, forced expiratory volume in 1 second (FEV
1) and maximal midexpiratory flow rate
(MMFR) are shown in Figures 14 and 15 and graphically represent each individual subject's responses, relative to their predicted levels of performance. The figures show that most of the smoker group did not meet their predicted levels of performance for either measure. Although these data were within normal ranges, our respiratory clinician suggested that the
patterns were consistent with those he had previously viewed that distinguished smokers from nonsmokers.
The extent that these pulmonary functioning differences between our groups contributed to our experimental effects is not clear. One measure derived from the ESQ-111 symptom questionnaire showed a very significant trend between groups and across altitude sessions (refer to Appendix C). Elevated values of
the respiratory severity index were apparent for the
smoker group during each altitude session, compared to the nonsmoker group, whose index values rose only during the 8,000 and 12,500 ft. sessions. We believe this difference may have been attributable to a heightened sensitivity of the smoker group to the breathing resistance of our oxygen delivery system. The pressure demand breathing regulator, hoses, and oral-nasal mask produced a measure of inspiratory resistance that may have been perceived by the smoker group during all sessions. Breathing deeply with our system effectively increased an awareness of the breathing resistance. We hypothesized that, since we found some evidence of diminished pulmonary functioning
in our group of smokers, as the PFT data suggested, different breathing patterns may have resulted in an
25
increased awareness of breathing resistance. The re
duced P,cC02
values of the smoker group suggested different breathing patterns, perhaps in the form of hyperventilation across each trial. Finally, the respiratory severity index scores for the nonsmoker group rose significantly, but only during the hypoxic stimulus conditions found with the 8,000 and 12,500 ft.
exposures. These 2 altitudes produced mild hypoxic
stimulus conditions during which different breathing
patterns would be expected.
Other group distinguishing patterns were found in the 2-way and 3-way interactions for the heart rate measure. The significant group by trial interaction (refer to Figure 9) showed that nonsmokers' heart rates varied little across trial and hence, time, and that the smoker group varied considerably. Average heart rate for the smoker group over trial! was highest at 84 bpm, followed by significant reductions to 79 bpm during trial2 and 76 bpm for trial3. It's clearly seen in the group by altitude by trial interaction (refer to Figure 11) that heart rate was significantly elevated
during the smoking baseline session. During this
session and prior to each trial, the smokers were instructed to smoke 1 cigarette. The elevated heart rate may well have been due to the introduction of nicotine, which has been associated with elevated heart rates.
The overall evaluation of the physiological data supported the conclusion that the simulated altitude conditions and resultant levels of hypoxia targeted in this study were consistently met. We, therefore, pro
ceeded to analyze all other measures for corroborative evidence of the effects of the mild hypoxia produced in this study.
Multi-Attribute Task Battery Complex cognitive and psychomotor tasking, such
as encountered with the MATB, presented each subject with a difficult scenario in an unfamiliar experimental environment. Instructions to each subject
were consistent and repetitive in expressing that they were to perform all subtasks to the best of their ability
and that all tasks were equally important. Our procedural approach to evaluating the effects
of mild hypoxia on complex task performance was such that we wanted to manipulate task workload
within each 2-hr. sessiOn. Each 2-hr session com
prised three 30-min. trials with the same varying
workload order emulating takeoff and dim bout flight
during the first 30-min. trial (rated moderate work
load); cruise flight was emulated during the second
30-min. trial (rated low workload); descent, approach,
and landing were emulated during the third 30-min.
trial (rated high workload). Trial effects were anticipated for these reasons and were expected to follow
performance trends commensurate with the level of workload for each trial. That is, performance during
trial 1 was expected to have been slightly poorer than
trial 2, which was expected to show the best level of
performance, and trial 3 was expected to have shown
the poorest performance.
The expected workload pattern of performance was
not found in our data. Seven of 10 measures with
significant trial effects (refer to Figures 17-22 and 24)
showed performance during trial2 to be progressively
poorer than during trial 1, yet not as poor as trial 3. This trend may have demonstrated that time in ses
sion had combined with workload to contribute to the
effect. In addition to these trial effect measures, the altitude by trial interaction for the dials error measure (Fig. 32), and the smoking group by trial interaction effects for both dials error and tracking task RMS error measures (Figs. 31 and 35) also portrayed this trend pattern. Interestingly, the overall mean NASA TLX workload measures showed the same pattern, in that the smokers recorded progressively higher workload scores over trials across the altitude sessions (refer
to Appendix B).
All 4 physiological measures demonstrated trial
effects. However, the changes in these measures were
believed to be compensatory in nature, as the body's
physiology adapted in some degree to the conditions
of the study. Subjects showed an improvement in
physiological status across the 3 trials. With the highest level of MATB workload set during trial 3 and
confounded with time in session, it is not known whether performance was affected by the improvement in physiological status. Subjective questionnaire results in this study reflect a reversal in symptom severity for the last administration time, indicating a perceived improvement in these measures. This trend
26
is sometimes seen, however, for subjects who know a
session is soon to be over and know that cessation of
the experimental condition is imminent.
Altitude effects were found with 2 measures, total
monitoring lights errors and dials errors (Figs. 26 and
29). Both showed a slight rise in the number of errors
during the 8,000 ft. session and a prominent rise in
errors during the ground level session. The former session may reflect an hypoxic related effect, though it
does not show up during the much greater hypoxic stimulus condition of 12,500 ft. The ground level
session effect may have been influenced by an unbal
anced ordering of sessions across subjects. Post hoc
assessment of the quasi-random ordering of sessions
found that some subjects mistakenly received the GL
condition earlier in their ordering of sessions than
other conditions as a result of subject "no-shows,"
"missed" appointments, and subsequent scheduling
confusion.
Variables that interacted with altitude were of
particular interest in this study. Our results showed 3
altitude by trial interaction effects for dials response
time (Fig. 27), total dials error (Fig. 32), and for communications response time (Fig. 36). The first measure showed some evidence reflecting changes similar to those found for the trial effects measures. The total dials error measure showed even more evidence of the trial effect pattern. Changes in errors across trials increased progressively with the greatest number of errors occurring during the third trial of both the ground level and 12,500 ft. exposures. The
communications RT measure showed little discern
ible evidence of variability, with a possible exception
in the ground level session. Hypoxia related trends
were not clearly apparent in these effects.
There were 2 smoking group by altitude interac
tion effects for dials total error and dials false alarms
(Figs. 30 and 33). Both measures displayed similar
patterns. Clearly, the smoker group committed more
errors and false alarms than the nonsmoker group.
This trend may support the hypothesis of a differential effect across our altitude conditions. The non
smoker group showed little change across altitude conditions, whereas the smoker group showed significant changes. The elevated errors that occurred during
the GL session, seen in these figures, probably re
flected the unbalanced ordering of sessions mentioned above.
Additional evidence differentiating smokers from nonsmokers was found for the MATB measures, including: RMS error of the tracking task (Fig. 34)
and total errors of the dials task (Fig. 28), both
showing increased error for the smoker group, compared to the nonsmoker group. Also mentioned above,
were the smoking group by trial interaction effects for total error of the dials task and tracking RMS error measures (Figs. 31 and 35), which showed significantly poorer performance for the smoker group across trials. Previous smoking research has suggested that performance of certain types of complex tasks is actually improved in smokers, as a result of the nicotine in cigarette smoke (Wesnes & Parrott, 1992). Our study's design and methodological approach probably accounted for results different from the nicotine enhanced performance studies just mentioned. Our study assumed that the smokers entered the experi
mental session with some level of carbon monoxide
based hypemic hypoxia already affecting them as a group. Our subjects were restricted/instructed to smoke 2 cigarettes of their choosing just prior to
entering the experimental session. McFarland's (1970, 1944, 1939) research showed that such low levels of CO could contribute to performance decrements, particularly when combined with reduced oxygen tension, such as encountered at altitude.
Ernsting, et al. {1988) stated that tasks requiring complex eye-hand coordination are affected at altitudes above 10,000 ft., and further, that a 1 Oo/o decrement in al:Jility to maintain a given air speed, heading, or vertical velocity can occur at 12,000 ft. (p.54). In a study with instrument rated pilots breathing reduced oxygen mixtures while flying ILS instrument approaches in a simulator, results showed some measure of significant impairment during the 12,300
ft. session (Gold and Kulak, 1972). Fowler, Taylor,
and Parlier {1987b), in a study to differentiate the reaction time and movement time components of a serial choice reaction time task, found increases in both reaction time and movement time at a perceptual-motor task
27
under hypoxic conditions. McFarland (1944, 1970) conducted studies of the combined effects of small quantities of carbon monoxide (via cigarette smoking)
and hypoxia on vision, and found marked reductions in
visual thresholds, compared to each factor alone. Performing the MATB required systematic scan
ning of the various subtasks located across the large (19 in.) color display monitor used in this study. We
found that after practice, the tracking task could be accurately performed without constant foveal accom
modation; that is, as a parafoveal or peripheral task. The light monitoring task was also one that could be performed as a peripheral task. Changes in the status of the 2 lights were easily detected without looking directly at them. The dials monitoring task, however, required systematic observation, as did the communications task when responding to requested frequency changes. The resource management task required foveal accommodation and focused attention with strategic manipulation of the pumps to maintain appropriate fuel tank levels. In a preliminary review of the data, we found that the resource management task
was performed to essentially the same level of proficiency by both groups during all experimental sessions. Yet, other tasks did not appear to have been
performed as well by both groups and, in fact, appeared to clearly differentiate smokers from nonsmokers by their performance outcomes.
Some emphasis is placed on the demands of vision, eye movements, scanning behavior, and the fovealperipheral aspects of subtask location to introduce a potential explanation of our results. If vision or higher visual processing were affected by hypoxia, one could make the case that responses might suffer to stimuli peripherally adjacent to a primary task that demands the greatest attention. Hypoxia has been shown to
produce changes in visual brightness perception, visual acuity, dark adaptation, and eye movement coordination (Evans and McFarland, 1938; McFarland,
1963, 1969; McFarland, et al., 1937). The effects of
moderate hypoxia have also been shown to produce significant restrictions of the visual field with a progressive loss of peripheral vision, often called visual
tunneling (Ernsting and King, 1988; Halstead, 1945).

Disruption of vision by hypoxia can theoretically
change the processing efficiency of visual information
at various stages from sensation to perception, and on,
to the higher levels associated with cognition (Cahoon, 1972; Ernest and Krill, 1971; Frisby, Barrett, and Thornton, 1973; Heath and Williams, 1981; Van Liere and Stickney, 1963). Fowler, Banner, and Pogue (1993) have recently shown evidence of a slowing of visual processing caused by hypoxia, and that specific effects were found at the preprocessing stage, rather than the identification or response-choice stages. At a much higher stage of processing, Frisby, et al. (1973)
showed hypoxia related impairment of decision
making ability.
Eye movements, such as those found in reading
text, were found to be affected by breathing reduced
oxygen (McFarland, Knehr, and Berens, 1937). In their study, they found an increase in time and fre
quency of fixations and a reduction in the adequacy of ocular adjustments during each fixation and a degradation in the precision of ocular movements, in general. Halsead (1945), in a study that evaluated the effects of chronic intermittent anoxia on peripheral vision, found that "65% of subjects exposed ... to altitude pressures as low as 10,000 ft. developed a marked impairment of peripheral vision." (p. 616).
If the hypoxic stimuli of this study were sufficient and the only factor affecting scanning behavior in our subjects, both groups would have been equally affected. Yet, only the smokers showed differences in
performance for the significant measures found in this
study. If one accepts the assumption that smokers entered the experimental session with some degree of
hypoxia (hypemic hypoxia) already affecting them, the additional insult of our reduced oxygen conditions could have produced the changes that we found for this group.
The effects of smoking have been shown to reduce the size of visual fields and reduce peripheral visual acuity and peripheral movement detection a ohnston, 1965b; Krippner and Heimstra, 1969; Scoughton and Heimstra, 1973). By combining the effects of
reduced oxygen and the effects of recent cigarette smoking, the impact on the visual system should, therefore, be reflected additively, as suggested by the McFarland research.
28
We believe our results reflect an additive outcome
of combining the effects of smoking and hypoxia, since the nonsmoker group showed little performance
change when compared to the smoker group. Our
data suggest that smokers performed some of the MATB sub-tasks less accurately and required more time for responses than was shown by the nonsmokers. The group by altitude interactions provide minimal support for the differential effects that were initially predicted for this study. Although, the results were not definitive, sufficient evidence exists for a continuation of research into these factors to better
determine the altitudes for which recommendations
should be made for smokers to use supplemental
oxygen for better hypoxia protection.
In summary, the physiological parameters affirmed
a consistent simulation of the altitude hypoxia at
tempted in this study. The levels of hypoxia experienced by our subjects were all quite mild and were not expected to produce much cognitive or psychomotor performance impairment. Cognitive performance impairment at these levels of hypoxia is often difficult to demonstrate due, in part, to individual subject tolerances, lack of measurement sensitivity, and behavioral compensation. No previous data were available for the Multi-Attribute Task Battery to establish its sensitivity to our stressor conditions, although the complexity of the battery and its surface validity for flight task operations were aspects that we believed would contribute to demonstrating some level of
hypoxic performance impairment.
Differences were found in our physiological measures distinguishing the 2 groups of subjects in this
study. Additional data distinguishing the groups were
found with the MATB performance measures and some of the subjective measures. Differential group responses to our experimental altitude conditions were scarce, though sufficient, to suggest further experimentation. Strong evidence suggesting an altitude for which supplemental oxygen should be required
was not found in this study. However, in view of the highly variable tolerances and responses to hypoxia
and the need to safely protect all flight crew (including the least tolerant individuals), a conservative approach to the use of supplemental oxygen is recommended.

REFERENCES
Baumgardner, F .W., Ernsting, J ., Holden, R. and Storm, W.F. 1980. Responses to hypoxia imposed by two methods. Paper presented at the Annual Scientific Meeting of the Aerospace Medical Association, Anaheim, CA.
Baumgardner, F.W. and Storm, W.F. 1980. Comparative Hypoxia/Physiologic Refresher TrainingStatistical Report.ln-house report, Crew T echnology Division (USAF SAMNN), Brooks AFB, TX. September 1980.
Benenson, T. 1993. Hypoxia! How to recognize and defeat it.FLYING, May 1993 p. 95-9.
Birren, J.E., Fisher, M.B. Vollmer, E. and King, B.G. 1946. Effects of anoxia on performance at several simulated altitudes. journal of Experimental Psychology, 36, 35-49.
Cahoon, R.L. 1972. Simple decision-making at high altitude. Ergonomics, 15, 157-164.
Cohen, R.L. 1994. They call it pilot error: True stories behind general aviation accidents. New York: Tab Books, Division of McGraw-Hill.
Comstock, R.J.Jr. and Arnegard, R.J. 1992. The MultiAttribute Task Battery for Human Operator Workload and Strategic Behavior Research. NASA Technical Memorandum, TM-104174.
Crow, T .J. and Kelman, G .R. 1971. Effect of mild acute hypoxia on human short-term memory. British journal of Anesthesiology, 43, 548-52
Crow, T.J. and Kelman, G.R. 1973. Psychological effects of mild acute hypoxia. British journal of Anesthesiology, 45, 335-7.
Denison, D.M., Ledwith, F. and Poulton, E.C. 1966. Complex reaction times at simulated cabin altitudes of 5000 feet and 8000 feet. Aerospace Medicine, 37, 1010-13.
Ernest,J.T. and Krill,A.E. 1971. The effects ofhypoxia on visual function: psychophysical studies. Investigative Opthalmology, 10, 323-328.
Ernsting, J. 1988. Respiratory physiology. In: Aviation Medicine, Ernsting,J. and King, P., Eds. London: Butterworths p.27 -44.
29
Ernsting,J. 1978. The 10th Annual Harry G. Armstrong Lecture: Prevention ofHypoxia- Acceptable compromises. Aviation, Space and Environmental M edicine. 49, 495-502.
Ernsting, J., Sharp, G.R. and Harding, R.M. 1988. Hypoxia and hyperventilation. In: Aviation Medicine, Ernsting, J. and King, P., Eds. London: Butterworths. p.45-59.
Evans, J.N. and McFarland, R.A. 1938. Effects of oxygen deprivation on the central visual field. American journal ofOphthalmology, 21, 968-980.
Federal Aviation Administration Advisory Circular AC 61-107/High Altitude 1: Training, ?/Physiological Training.
Frisby, J.P., Barrett, R.F. and Thornton, J.A. 1973. Effect of mild acute hypoxia on a decision-making task. Aerospace Medicine, 44, 523-6.
Fowler, B., Paul, M., Porlier, G., Elcombe, D.O. and Taylor, M. 1985. A re-evaluation of the minimum altitude at which hypoxic performance decrements can be detected. Ergonomics, 28, 781-91.
Fowler, B., Banner, J. and Pogue,]. 1993. The slowing of visual processing by hypoxia. Ergonomics, 36, 727-35.
Fowler, B., Taylor, M. and Porlier, G. 1987b. The effects of hypoxia on reaction time and movement time components of a perceptual-motor task. Ergonomics, 30, 1475-85.
Gold, R.E. and Kulak, L.L. 1972. Effect of hypoxia on aircraft pilot performance. Aerospace Medicine, 43, 180-3.
Halstead, W.C. 1945. Chronic intermittent anoxia and impairment of peripheral vision. Science, I OJ, 615-6.
Hart, S.G. and Staveland, L.E. 1988. Development of a NASA-TLX(TaskLoadlndex): Results of empirical and theoretical research. In: P.A. Hancock and N. Meshkati, Eds., Human Mental Workload (pp. 139-83). Amsterdam: North-Holland.
Heath, D. and Williams, D.R. 1981. Man at High Altitude, 2nd Ed. Edinburgh: Churchill Livingstone.
Hecht, S., Hendley, C.D., Frank, S.R. and Haig, C. 1946. Anoxia and brightness discrimination. Journal of General Physiology, 29, 3 3 5-51.
Higgins, A.E., Mertens, H.W., McKinzie, J.M., Funkhouser, G.E., White, M.A., and Milburn, N.J. The Effects of Physical Fatigue and Altitude on Physiological, Biochemical, and Performance Reponses. Washington, DC: 1982; FAA publication no.DOT IF AAI AM-82-10. NTIS no. ADA122796/6.
Hoddes, E., Zarcone, V., Smythe, H., Phillips, R. and Dement, W.C. 1973. Quanitfication of Sleepiness: A New Approach. Psychophysiology, 10, 431-6.
Johnston, D.M. 1965b. A preliminary report of the effect of smoking on size of visual fields. Life Sciences, 4, 2215-21.
Kelman, G.R. and Crow, T.J. 1969. Impairment of mental performance at a simulated altitude of 8000 feet. Aerospace Medicine, 40, 981-2.
Kelman, G.R., Crow, T.J. andBursill,A.E.1969. Effect of mild hypoxia on mental performance assessed by a test of selective attention. Aerospace Medicine, 40, 301-3.
Kobrick, J.L. 1970. Effects of hypoxia and acetazolamide on color sensitivity zones in the visual field. Journal of Applied Physiology, 28, 741-7.
Kobrick, J .L. 1971. Effects of hypoxia on response time to peripheral visual signals. Reprinted from The Perception and Application of Flashing Lights, Proceedings of an International Symposium, Imperial College. Adam Hilger, Ltd. London. p.323-5.
Kobrick, J.L. and Sampson, J.B. 1979. New inventory for the assessment of symptom occurrence and severity at high altitude. Aviation, Space and Environmental Medicine. 50, 925-9.
Krippner, R.A. and Heimstra, N.W. 1969. Effects of smoking on peripheral visual acuity. Council for Tobacco Research, U.S .A. Technical Report. H uman Factors Laboratory, University of South Dakota.
Ledwith, F. and Denison, D.M. 1964. Complex reaction times at a simulated cabin altitude of 8000 feet. lAM Report No. 284, RAP Institute of Aviation Medicine, Farnborough, Hants.
Lipton, P. and Whittingham, T.S. 1982. Cerebral nueronal transmision. In Hypoxia: Man atAtltitude. Eds. Sutton, J.R., Jones, N.L. and Houston, C.S. New York: Thieme-Stratton, Inc.
Parrott, A.C., Craig, D., Haines, M., and Winder, G. 1990. Nicotine Polarcrilex Gum and Sustained Attention. Cited in Handbook of Human Performance, 2, 154. Academic Press, Ltd. 1992.
30
McFarland, R.A. 1963. Experimental evidence of the relationship between aging and oxygen want: in search of a theory of aging. Ergonomics, 6, 338-66.
McFarland, R.A. 1969. The effects of altitude on pilot performance. B. Hannisdahl and C.W. SemJacobsen, Eds. Aviation and Space Medicine (Universitetsforlaget, Oslo), 96-108.
McFarland, R.A. 1970. The effects of exposure to small quantities of carbon monoxide on vision. Annals New York Academy of Sciences, Biological Effects of CarbonMonoxide, R.F. Coburn. Ed. 174,301-12.
McFarland, R.A. and Evans, J.N. 1939. Alterations in dark adaptation under reduced oxygen tensions. American journal ofPhysiology, 127,37-50.
McFarland, R.A., Knehr, C.A. and Berens, C. 1937. The effects of oxygen deprivation on eye movements in reading. Journal of Experimental Psychology, 21, 1-25.
McFarland, R.A., Roughton, F.J., Halperin, M.H., and Niven, J .I. 1944. The effects of carbon monoxide and altitude on visual thresholds. journal of Aviation Medicine, 15, 381-400.
Mertens, H. W. and Collins, W.E. 1986. The Effects of Age, Sleep Deprivation, and Altitude on Complex Performance. Human Factors, 28, 541-55.
Mertens, H. W. and Collins, W.E. The Effects of Age, Sleep Deprivation, and Altitude on Complex Performance. Washington, DC: 1985; FAA publication no. DOT/FAA/AM-85-3. NTIS no.ADA156987.
Mertens, H.W., Higgins, E.A., and McKenzie, J.M. Age, Altitude, and Workload Effects on Complex Performance. Washington, DC: 1983; FAA publication no. DOT/FAA/AM-83-15. NTIS no. ADA133594/2.
Mills, S.H. and Gilliland, K. 1994. An improved version of theM ulti-Attribute Task Battery (MATB) and data reduction program (MATPROC). Proceedings of the Human Factors and Ergonomics Society 38th Anuual Meeting. 2:945.
Patiky, M. 1993. Hypoxia: An Insidious Killer. Flight Environment, Aviation Safety. August 1, 1993.
Ritter, D.S. and Putnam, L., 1993. High-flying fitness: The FAR requirements are specific, but are they appropriate for smokers? Aviation Safety, April 1, 1993.
Ryman, D.H., Biersner, R.J., and LaRocco, J.M. 1974. Reliabilities and validities of the mood questionnaire. Psychological Reports, 35, 479-84.
Sampson,J.B, Cymerman,A., Burse, R.L., Maher,J.T., and Rock, P.B. 1983. Procedures for the Measurement of Acute Mountain Sickness. Aviation, Space and Environmental Medicine. 54, 1063-73.
Sampson, J.B. and Kobrick, J.L. 1980. The Environmental Symptoms Questionnaire: Revisions and new field data. Aviation, Space and Environmental Medicine. 51, 872-7.
Scoughton, C.R. andHeimstra, N.W. 1973. The effects of smoking on peripheral movement detection. Final Report, U.S. Army Medical Research and Development Command. CN. DADA 17-73-C-3037. Human Factors Laboratory, University of South Dakota.
Shukitt, B.L., Banderet, L.E., and Sampson, J .B. 1990. The Environmental Symptoms Questionnaire: Corrected Computational Procedures for the Alertness Factor. Aviation, Space and Environmental Medicine. 61, 77-8.
31
Slonim, N.B. and Hamilton, L.H. 1981. Respiratory Physiology. The C.V. St. Louis: Mosby Company.
Stevens, H. A. 1976. Evidence that suggests a negative association between cigarette smoking and learning performance. Cited in Handbook of Human Performance, 2, 147. Academic Press, Ltd. 1992.
Thorne, D.R., Genser, S.G., Sing, H.C., and Hegge, F.W. 1985. The Walter Reed Performance Assessment Battery. Neurobehavior, Toxicology and Teratology, 7, 415-8.
Tune, G.S. 1964. Psychological effects of hypoxia; review of certain literature from the period 1950 to 1963, PerceptualandMotorSkills, 19,551-62.
U.S. Department of the Air Force. 1976. Physiological Training Pamplet, AFP-160-5.
VanLiere, B.J. and Stickney, J.C. 1963. Hypoxia. Chicago: University of Chicago Press.
APPENDIX A
DESCRIPTIONS OF SUBJECTIVE MEASURES
Al
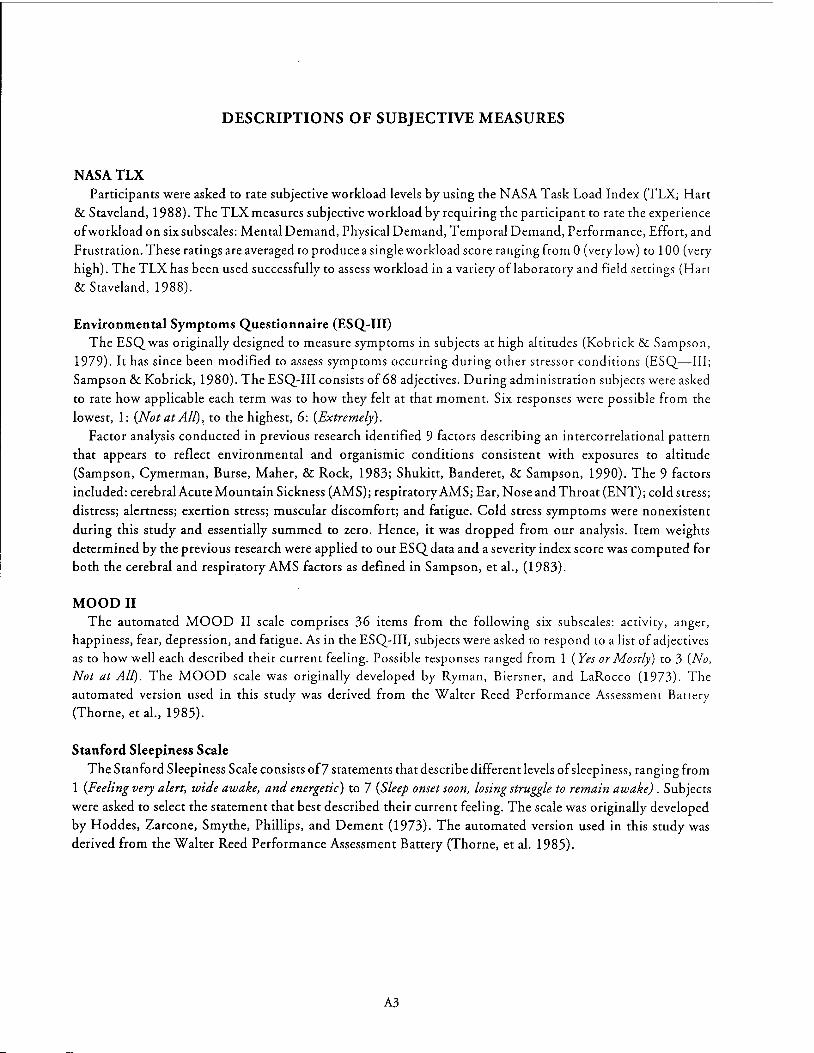
DESCRIPTIONS OF SUBJECTIVE MEASURES
NASATLX Participants were asked to rate subjective workload levels by using the NASA Task Load Index (TLX; Hart
& Staveland, 1988). The TLX measures subjective workload by requiring the participant to rate the experience
of workload on six subscales: Mental Demand, Physical Demand, Temporal Demand, Performance, Effort, and
Frustration. These ratings are averaged to produce a single workload score ranging from 0 (very low) to 100 (very high). The TLX has been used successfully to assess workload in a variety of laboratory and field settings (Hart
& Staveland, 1988).
Environmental Symptoms Questionnaire (ESQ-111) The ESQ was originally designed to measure symptoms in subjects at high altitudes (Kobrick & Sampson,
1979). It has since been modified to assess symptoms occurring during other stressor conditions (ESQ-Ill;
Sampson & Kobrick, 1980). The ESQ-III consists of 68 adjectives. During administration subjects were asked
to rate how applicable each term was to how they felt at that moment. Six responses were possible from the
lowest, 1: (Not at AI[), to the highest, 6: (Extremely).
Factor analysis conducted in previous research identified 9 factors describing an intercorrelational pattern
that appears to reflect environmental and organismic conditions consistent with exposures to altitude
(Sampson, Cymerman, Burse, Maher, & Rock, 1983; Shukitt, Banderet, & Sampson, 1990). The 9 factors
included: cerebral Acute Mountain Sickness (AMS); respiratory AMS; Ear, Nose and Throat (ENT); cold stress;
distress; alertness; exertion stress; muscular discomfort; and fatigue. Cold stress symptoms were nonexistent
during this study and essentially summed to zero. Hence, it was dropped from our analysis. Item weights
determined by the previous research were applied to our ESQ data and a severity index score was computed for both the cerebral and respiratory AMS factors as defined in Sampson, et al., (1983).
MOOD II The automated MOOD II scale comprises 36 items from the following six subscales: actlVlty, anger,
happiness, fear, depression, and fatigue. As in the ESQ-III, subjects were asked to respond to a list of adjectives as to how well each described their current feeling. Possible responses ranged from 1 (Yes or Mostly) to 3 (No,
Not at AI[). The MOOD scale was originally developed by Ryman, Biersner, and LaRocco (1973). The automated version used in this study was derived from the Walter Reed Performance Assessment Battery (Thorne, et al., 1985).
Stanford Sleepiness Scale The Stanford Sleepiness Scale consists of7 statements that describe different levels of sleepiness, ranging from
1 (Feeling very alert, wide awake, and energetic) to 7 (Sleep onset soon, losing struggle to remain awake). Subjects
were asked to select the statement that best described their current feeling. The scale was originally developed
by Hoddes, Zarcone, Smythe, Phillips, and Dement (1973). The automated version used in this study was derived from the Walter Reed Performance Assessment Battery (Thorne, et al. 1985).
A3
APPENDIX B
NASA TLX: SUBJECTIVE WORKLOAD SCALE
FIGURES
Bl
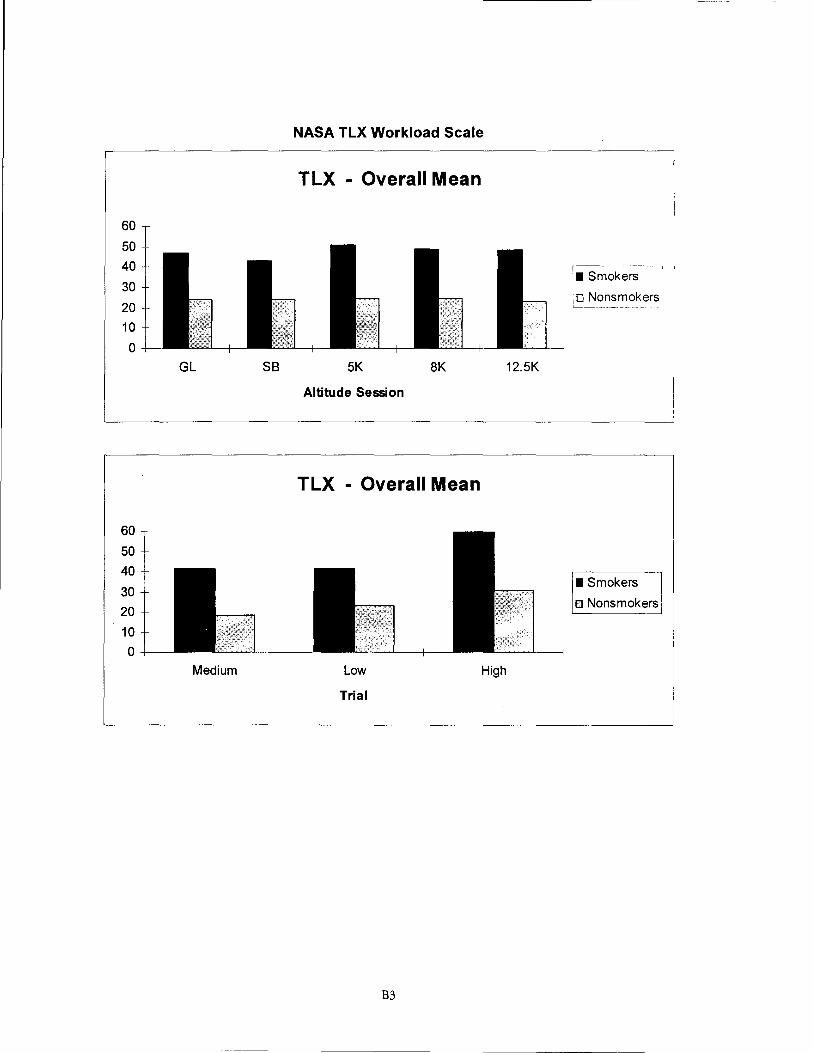
60
50 40
30
20 10
0
60
50 40
30 20
10 0
GL SB
Medium
NASA TLX Workload Scale
TLX - Overall Mean
~----------,I
mokers
~-~~~okers;
5K 8K 12.5K
Altitude Session
TLX - Overall Mean
I Smokers
o Nonsmokers
Low High
Trial
B3
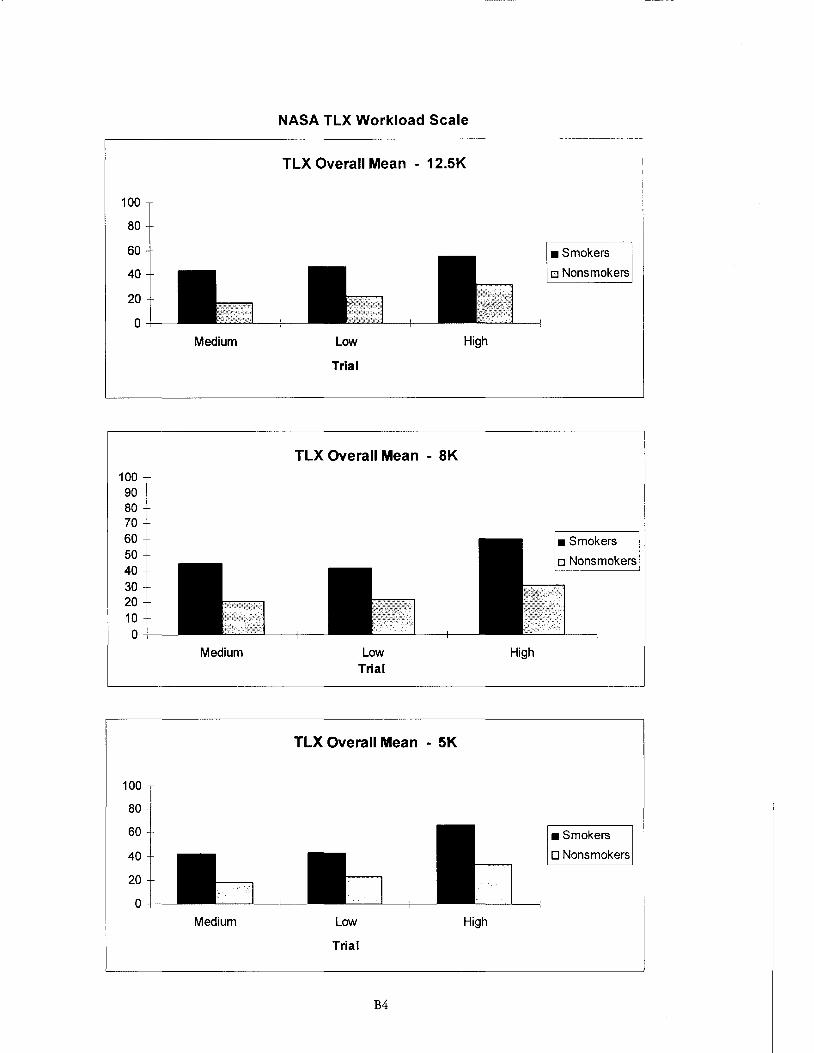
NASA TLX Workload Scale ,----------------------------------------
100
80
60
40
20
0
100 90 80 70 60 50 40 30 20 10 0
100
80
60
40
20
0
Medium
Medium
Medium
TLX Overall Mean - 12.5K
Low
Trial
TLX Overall Mean - 8K
Low Trial
TLX Overall Mean - 5K
Low
Trial
B4
High
High
• Smokers
o Nonsmokers
• Smokers
o Nonsmokers
High
• Smokers
D Nonsmokers
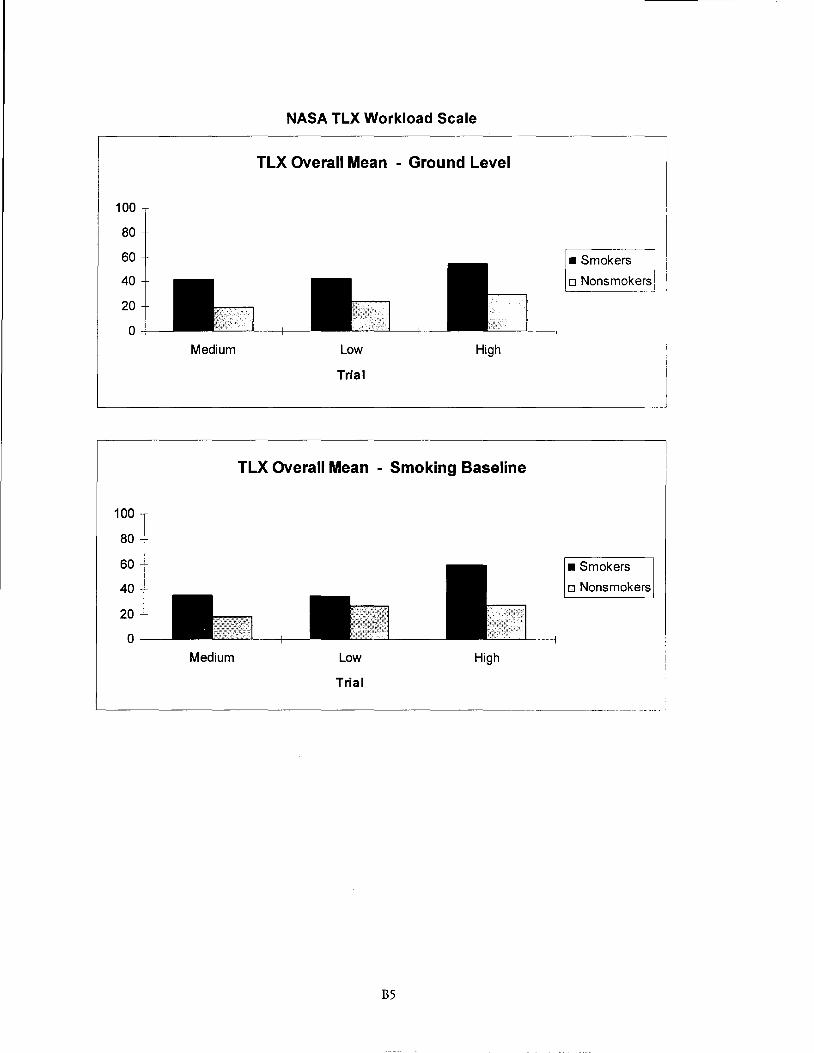
100
80
60
40
20
0
100
80
60
40
20
0
Medium
Medium
NASA TLX Workload Scale
TLX Overall Mean - Ground Level
Low High
Trial
TLX Overall Mean - Smoking Baseline
Low
Trial
High
• Smokers
o Nonsmokers] 1
• Smokers
o Nonsmokers
'---------------------------~------------------I
B5
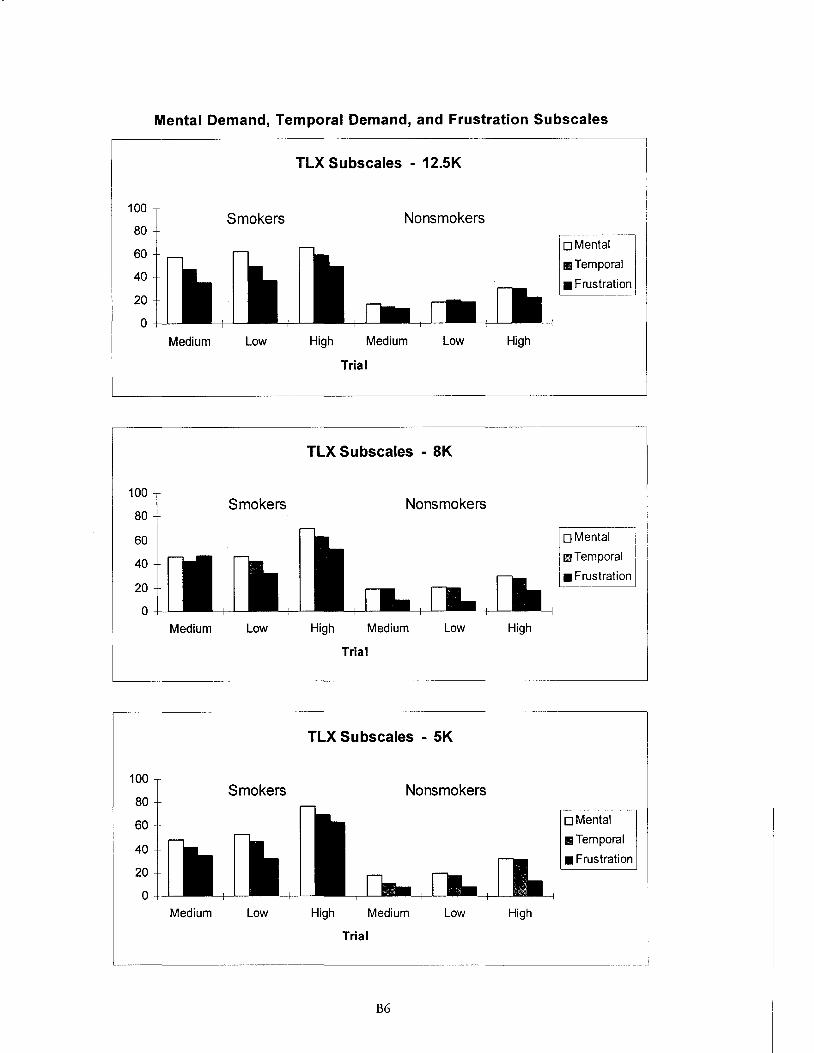
100
80
60
40
20
0
100
80
60
40
20
0
100
80
60
40
20
0
Mental Demand, Temporal Demand, and Frustration Subscales
Smokers
Medium Low
Smokers
Medium Low
Smokers
Medium Low
TLX Subscales - 12.5K
Nonsmokers
High Medium Low
Trial
TLX Subscales - 8K
Nonsmokers
High Medium Low
Trial
TLX Subscales - 5K
Nonsmokers
High Medium Low
Trial
B6
High
High
High
oMental
1111Temporal
• Frustration
oMental I
m~Temporal I
• Frustratid
oMental
11Temporal
• Frustration
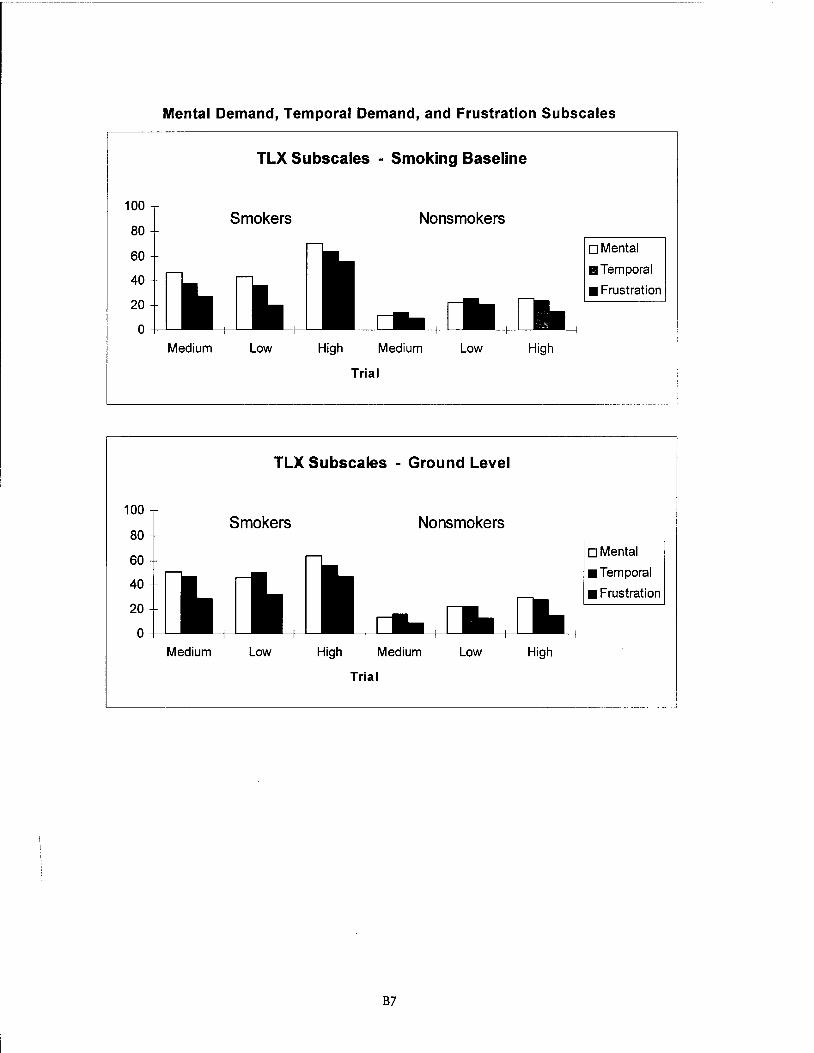
100
80
60
40
20
0
Mental Demand, Temporal Demand, and Frustration Subscales
TLX Subscales - Smoking Baseline
Smokers Nonsmokers
Medium Low High Medium Low
Trial
High
oMental
II Temporal
11 Frustration
L__------------------------------·--·--- -·-
100
80
60
40
20
0
Medium
TLX Subscales - Ground Level
Smokers Nonsmokers
Low High Medium Low
Trial
High
oMental
II Temporal
11 Frustration
L__----------------------------···----·-·--·-· -- .J
B7

Physical Demand, Performance, and Effort Subscales
TLX Subscales - 12.5K
100
80 Smokers Nonsmokers
60
40
20 oPhysical
0 • Performance
Medium Low High Medium Low High •Effort
Trial
TLX Subscales - 8K
100 Smokers Nonsmokers
80
60
40
20 D Physical
0 li3 Performance i
Medium Low High Medium Low High • Effort
Trial
TLX Subscales - 5K
100 Smokers Nonsmokers
80
60
40
20 D Physical
1!iJ Performance 0
Medium Low High Medium Low High • Effort
Trial
B8
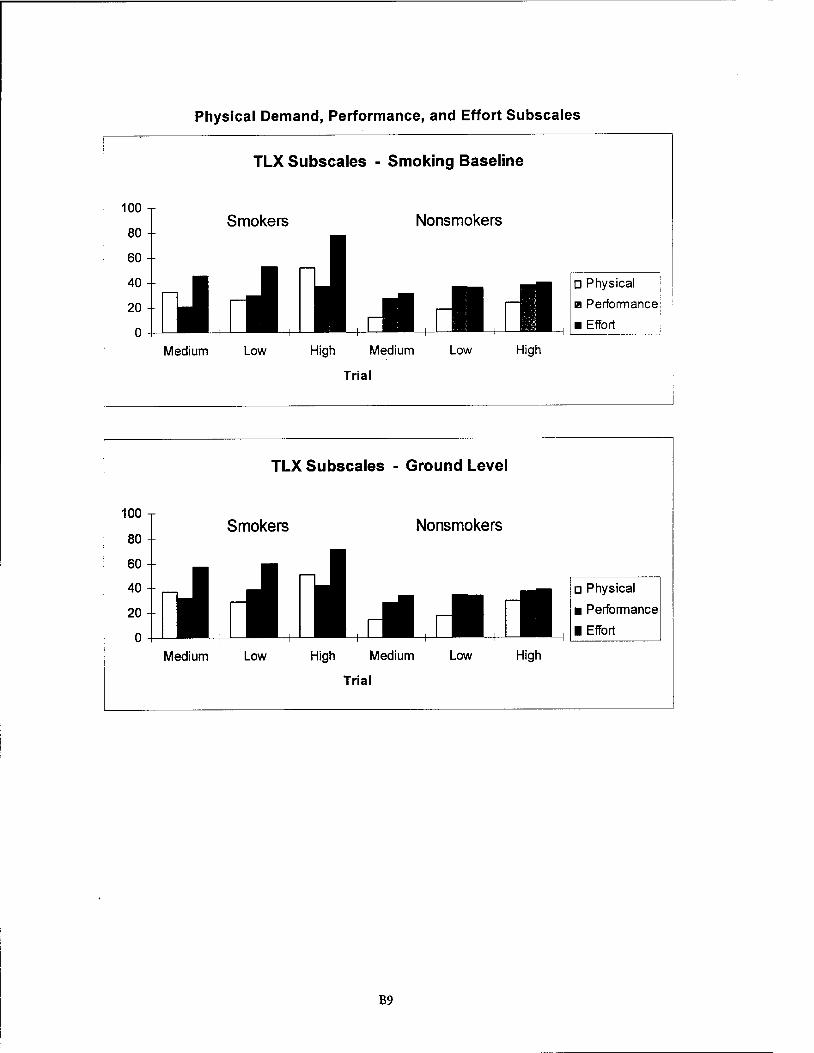
Physical Demand, Performance, and Effort Subscales
TLX Subscales - Smoking Baseline
TLX Subscales - Ground Level
B9
APPENDIX C
ENVIRONMENTAL SYMPTOMS QUESTIONNAIRE (ESQ-III)
FIGURES
Cl
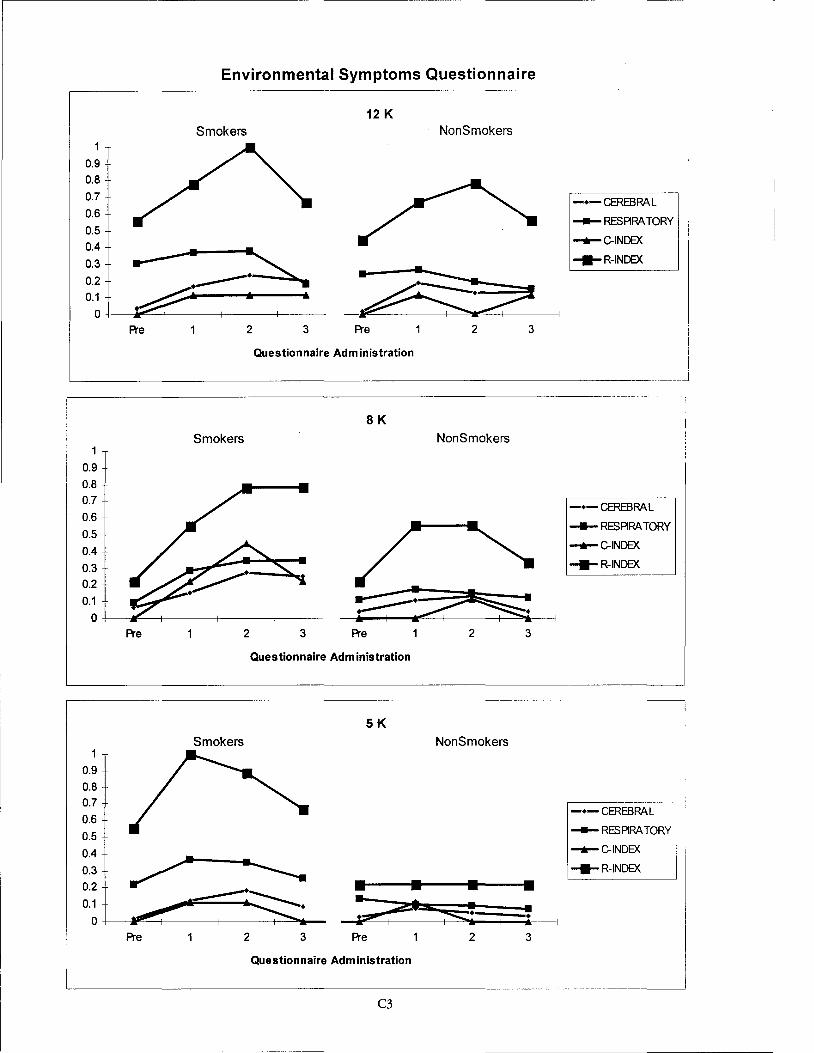
Environmental Symptoms Questionnaire ,-------------------------------~------ ---
12 K Smokers NonSmokers
0.9 0.8
0.7 -•-CEREBRAL 0.6
- RESARA TORY 0.5 0.4 • 0.3
-+-C-INDEX
....R-INDEX
0.2 0.1
0 Pre 2 3 Pre 2 3
Questionnaire Administration
SK Smokers NonSmokers
1
0.9
0.8 0.7
-•-CEREBRAL 0.6
0.5 -RESPIRATORY
0.4 -+-C-INDEX
0.3 ---R-INDEX
0.2
0.1
0 Pre 2 3 Pre 2 3
Questionnaire Administration
5K Smokers NonSmokers
0.9
0.8 0.7
0.6
0.5
--------
1-•-CEREBRAL .
- RESARA TORY ,
0.4 -+-C-INDEX I
0.3 ---R-INDEX
0.2 • • • 0.1
0 at s::;
A"e 2 3 Pre 2 3
Questionnaire Administration
C3
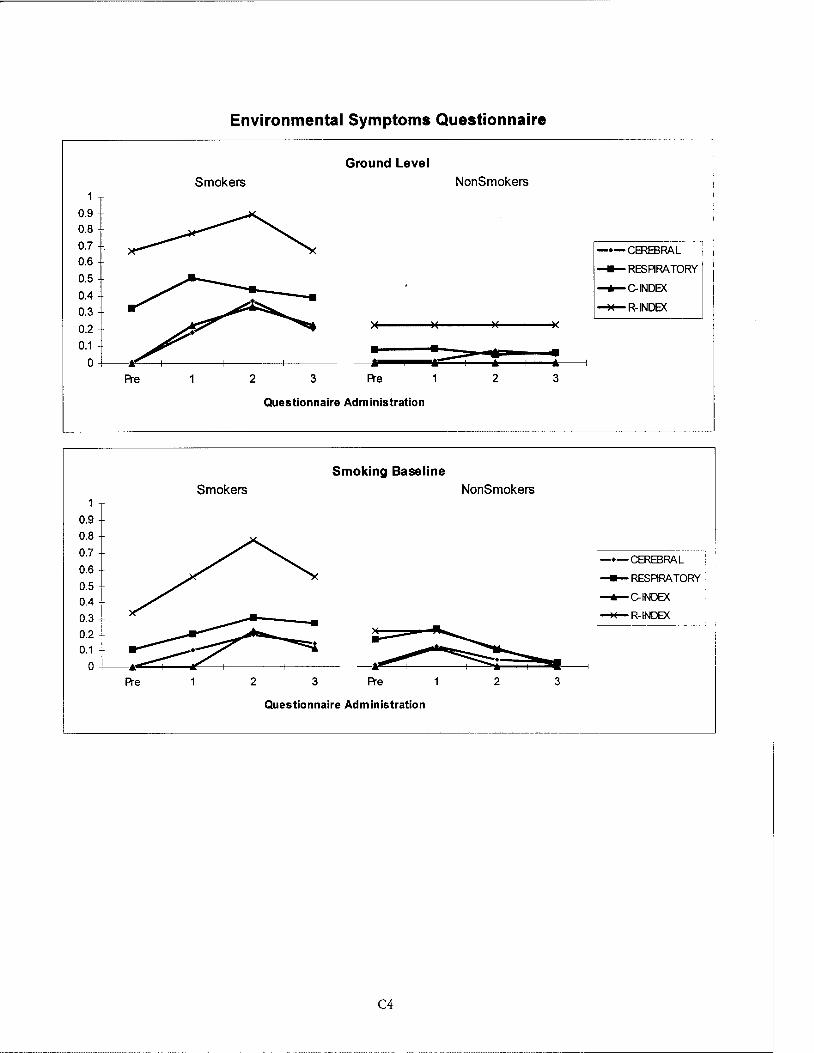
0.9 0.8
0.7 0.6
0.5
0.4
0.3
0.9
0.8
0.7
0.6
0.5 0.4
0.3
0.2 0.1
0
Pre
Pre
Environmental Symptoms Questionnaire
Smokers
2
Smokers
2
3
Ground Level
• .. Pre
Questionnaire Administration
NonSmokers
• ll""'" I
1 • * 2
Smoking Baseline NonSmokers
3 Pre 2
Questionnaire Administration
C4
• .. 3
... _____, 3
-•-CEREBRAL . ~ I
_._ RESARA TORY 1
-.-C-INDEX
~R-INDEX
---······-
RAL RATORY I_._ C-INDEX
~R-INDEX

0.9
0.8
0.7
0.6 0.5
0.4
0.3
0.2
0.1
0 Pre
0.9
0.8 0.7
0.6
0.5
0.4
0.3 0.2
0.1
0 Pre
0.9
0.8
0.7
0.6 0.5
0.4
0.3
0.2
0.1
0 Pre
Environmental Symptoms Questionnaire
12 K Smokers
• •
2 3 Pre
Questionnaire Administration
8K Smokers
2 3 Pre
Questionnaire Administration
5K Smokers
2 3 Pre
Questionnaire Administration
C5
NonSmokers
• : •
2
NonSmokers
2
NonSmokers
2
-•-MUSCDISC
....,._FA TIGUE
....,_EXERTION
~ 3
-----····-
3
3
-•-MUSCDISC
....,._FA TIGUE
....,_EXERTION
-•-MUSCDISC
....,._FA TIGUE
....,_EXERTION
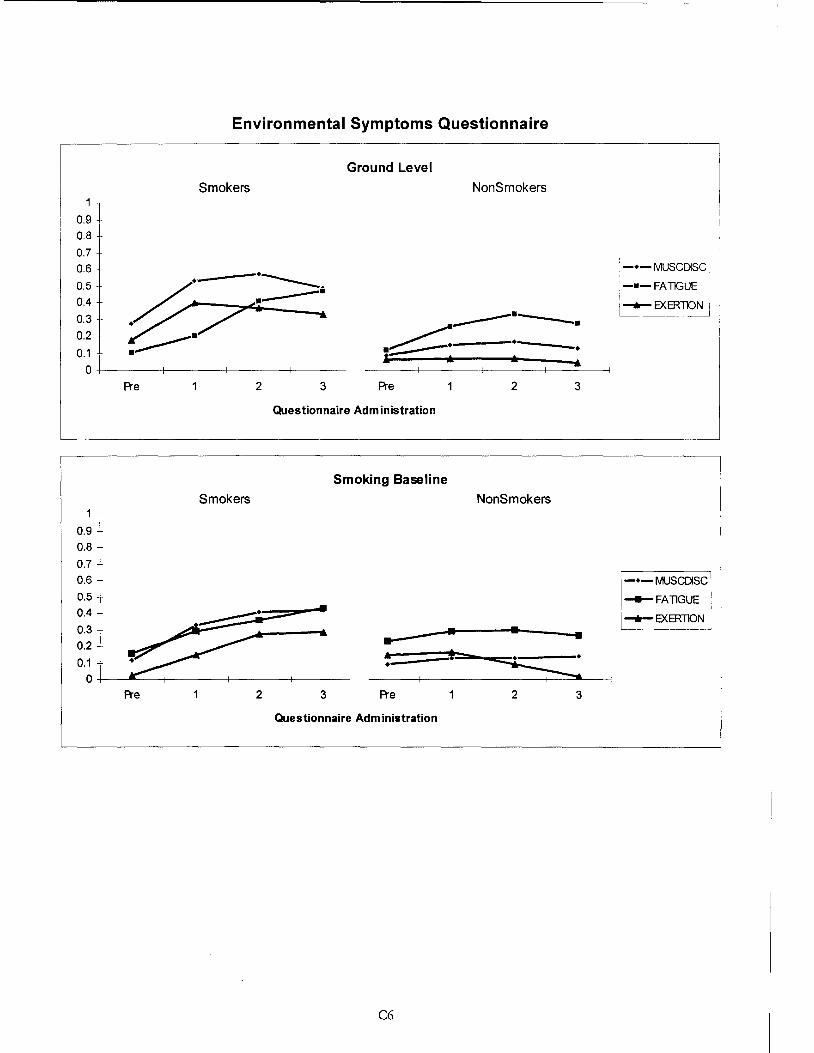
1
o.9 I o.al 0.7 0.6
0.5 0.4
0.3
0.2
0.1
Environmental Symptoms Questionnaire
Ground Level
Smokers NonSmokers
0+-------+-------+-------+-------
Pre 2 3 Pre 2
Questionnaire Administration
Smoking Baseline
Smokers NonSmokers
0.9 0.8
0.7 0.6
0.5 0.4
0.3 • • 0.2
0.1
... .. * • 0
Pre 2 3 Pre 2
Questionnaire Administration
C6
3
•
3
-•-MUSCDISC
-•-FATIGUE
I ......... EXERTION !
-•-MUSCDISC
__._FA llGUE
......,_.EXERTION
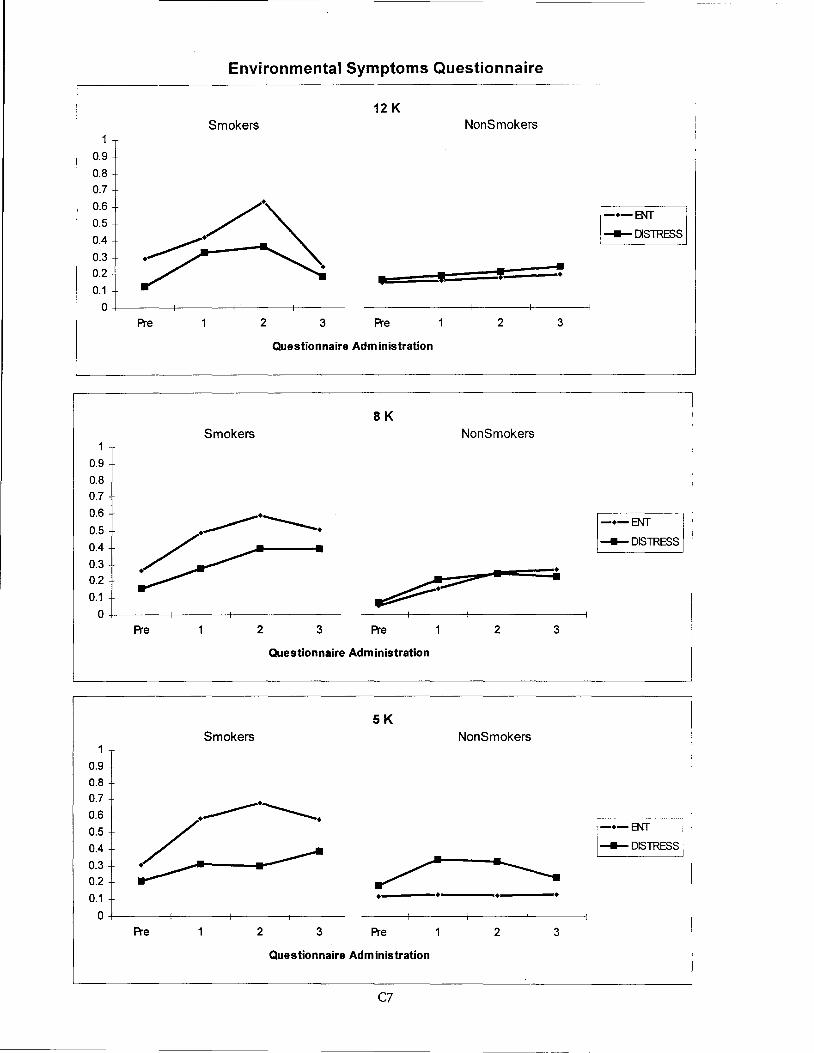
Environmental Symptoms Questionnaire
12 K Smokers NonSmokers
1
0.9
0.8 0.7
0.6
0.5
0.4
0.3 0.2
' • • ' ' 0.1
0 Pre 2 3 Pre 2 3
Questionnaire Administration
SK Smokers NonSmokers
0.9
0.8 0.7
0.6
0.5
0.4 ----DISTRESS
0.3 • 0.2
0.1
0 Pre 2 3 Pre 2 3
Questionnaire Administration
5K Smokers NonSmokers
0.9
0.8 0.7
0.6
0.5 -•-ENT 0.4 ----DISTRESS 1
0.3 0.2
0.1
0 Pre 2 3 Pre 2 3
Questionnaire Administration
C7
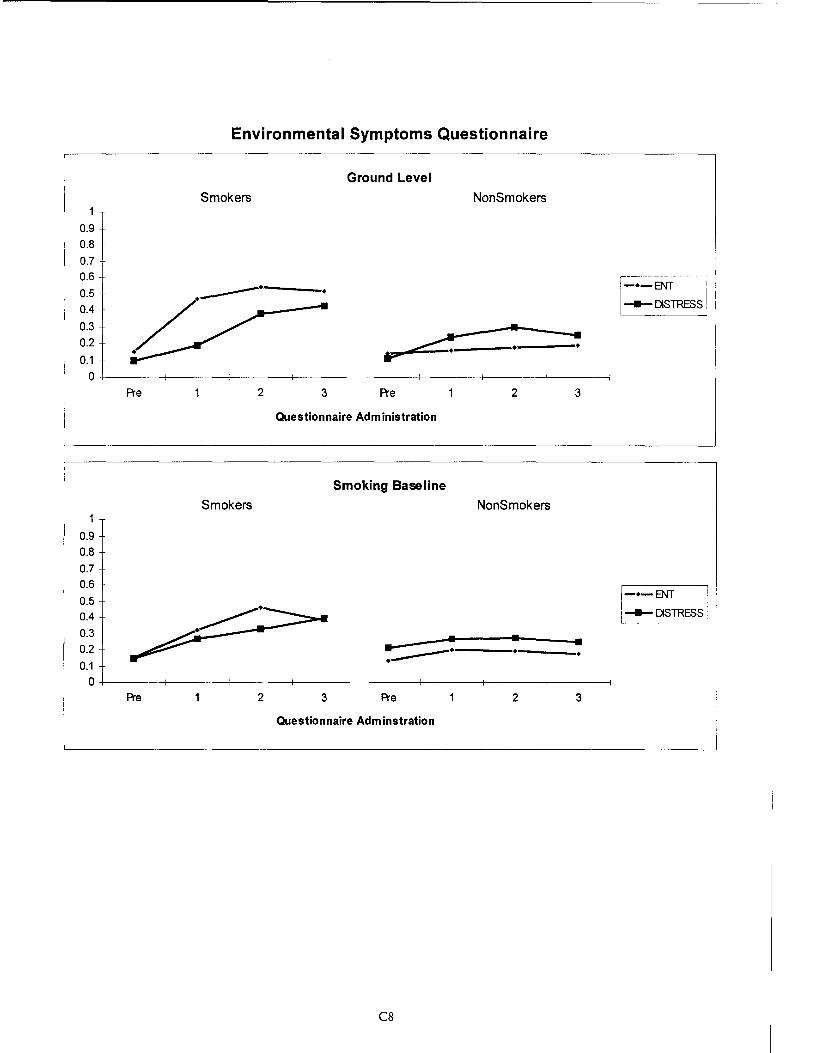
0.9 0.8
0.7 0.6
0.5
0.4
0.3
0.2
0.1
Environmental Symptoms Questionnaire
Smokers
----·
Ground Level
NonSmokers
• ~-------·-------~ IP'
0+-------+-------+-------+-------Pre 2 3 Pre 2 3
Questionnaire Administration
Smoking Baseline
Smokers NonSmokers 1
0.9 0.8
0.7 0.6
0.5 0.4
0.3 0.2 • • ----·----· 0.1
0 Pre 2 3 Pre 2 3
Questionnaire Adminstration
CB
~.-~=oo- I
1--DISTRESS I
t-•-ENT ~--DISTRESS
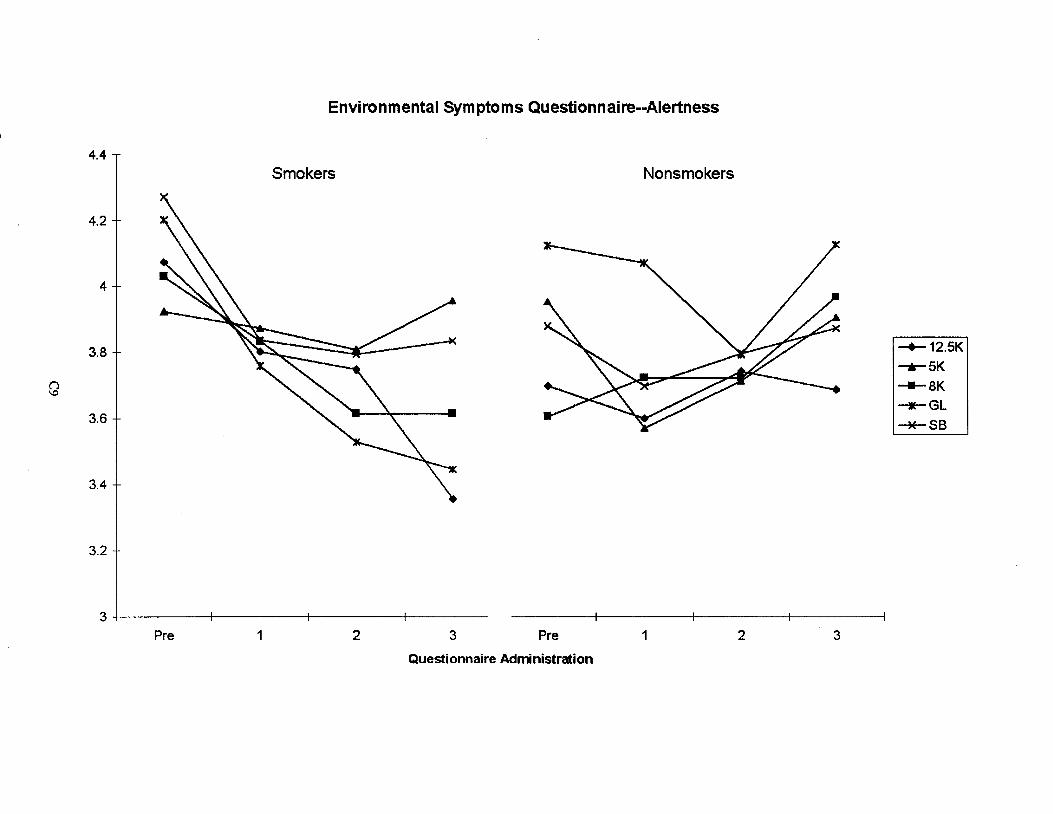
Environmental Symptoms Questionnaire--Alertness
4.4
Smokers Nonsmokers
4.2
4
3.8 + '\~ ~ ~/ I-+-12.5K -r-5K
()
3J ~~ / ------. ---aK \.0
---GL --*-SB
3.4
3.2
3+---------~------~~-------4--------
Pre 1 2 3 Pre 1 2 3
Questionnaire Administration
APPENDIX D
MOOD II: SUBJECTIVE MOOD SCALE
FIGURES
Dl
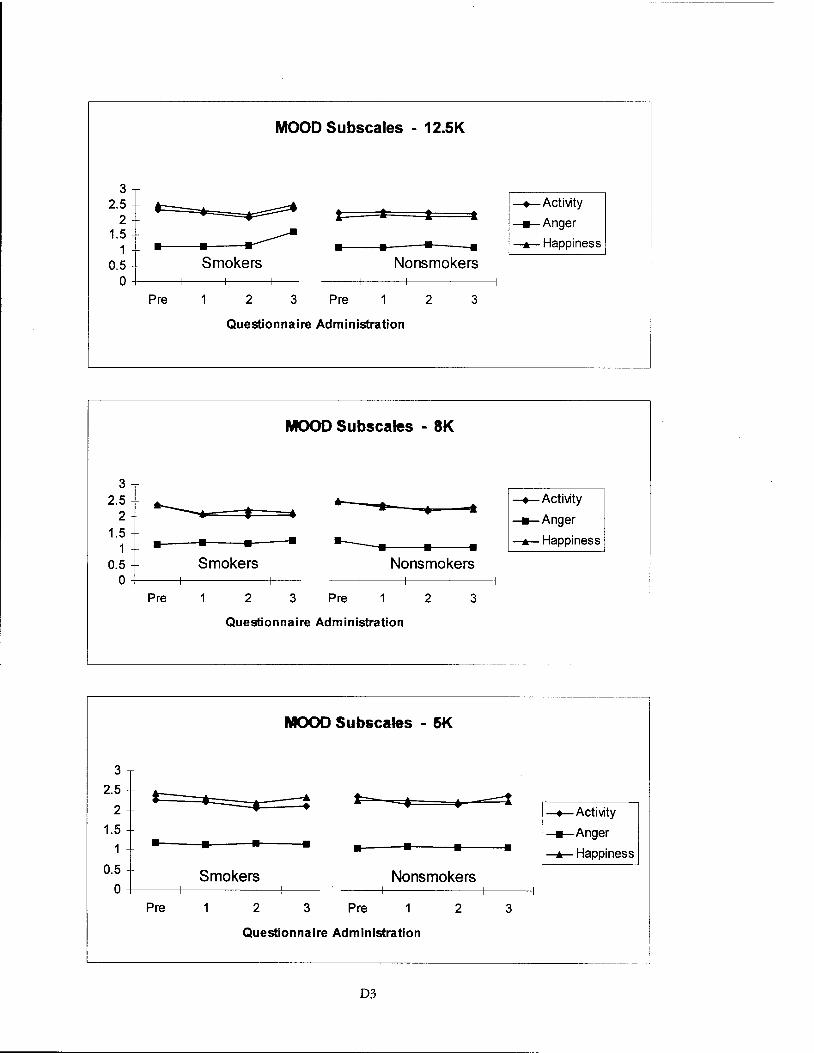
3 2.5
2 1.5
1 0.5
MOOD Subscales - 12.5K
l a 1 t
~ • • • • Smokers Nonsmokers
0 +----+---+-----+--
Pre 2 3 Pre 2 3
Questionnaire Administration
MOOD Subscales - 8K
3 2.5 ..____. ... a -t • • • 2 1.5 • .___ . 1 • • • • • 0.5 Smokers Nonsmokers
0 Pre 2 3 Pre 2 3
Questionnaire Administration
L_ ___________________________ _
MOOD Subscales - 5K
3
2.5 t: ---: l=- -==-t • • • 2 1.5
• • • • • • • • 0.5 Smokers Nonsmokers
0 Pre 2 3 Pre 2 3
Questionnaire Administration
D3
--+--Activity
---Anger
--.-Happiness
--+--Activity
---Anger
--.-Happiness
--+--Activity
---Anger
--.-Happiness

MOOD Subscales - Smoking Baseline
3
2.5 a. =:::::::::t • • t • • • • .. .. _...,a.
2 --+-Activity
1.5 --Anger
• • • • • • • • --.--Happiness
0.5 Smokers Nonsmokers 0
Pre 2 3 Pre 2 3
Questionnaire Administration
MOOD Subscales - Ground Level
3
2.5 1: 1 l .. 2 --+-Activity
1.5 --Anger
• • • • • • • • --.--Happiness
0.5 Smokers Nonsmokers 0
Pre 2 3 Pre 2 3
Questionnaire Administration
D4
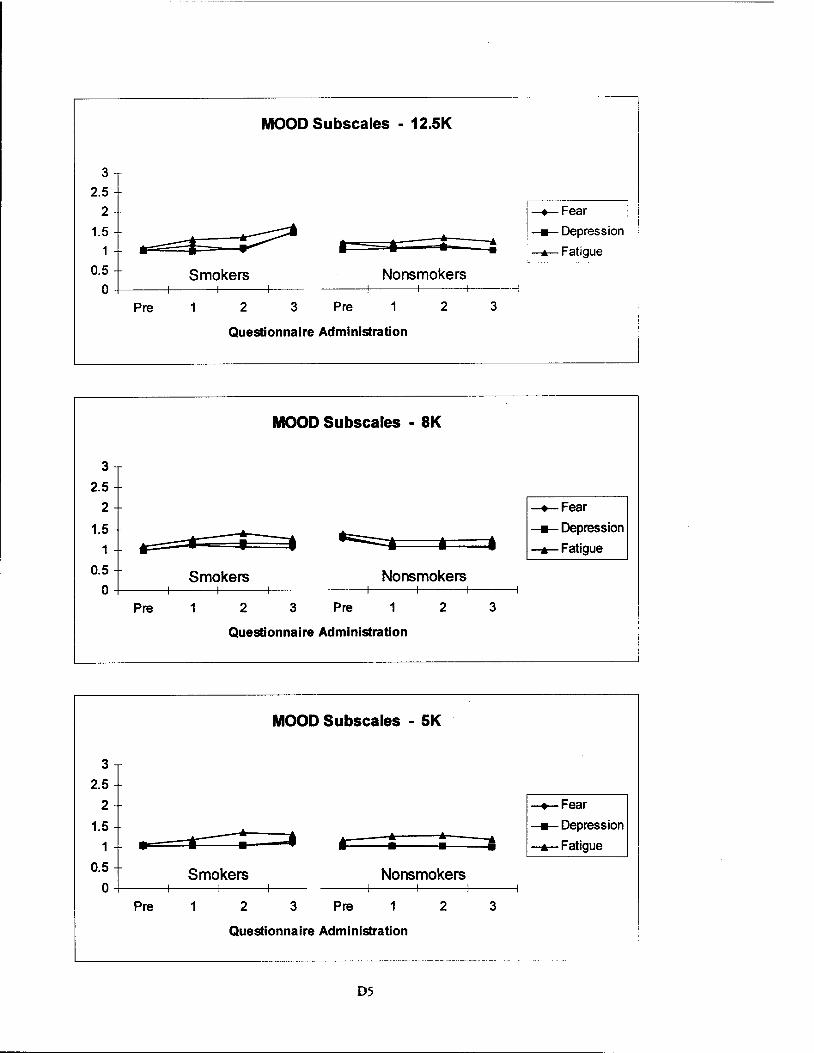
3
2.5 2
1.5 1
MOOD Subscales - 12.5K
• Smokers 0.5
0+---~----~----+---Nonsmokers
Pre 2 3 Pre 1 2
Questionnaire Administration
MOOD Subscales - 8K
3
2.5 2
1.5 1 IF • a
0.5 Smokers Nonsmokers 0
Pre 1 2 3 Pre 1 2
Questionnaire Administration
MOOD Subscales - 5K
3
2.5 2
1.5 1 • Ill t :
0.5 Smokers Nonsmokers 0
Pre 1 2 3 Pre 1 2
Questionnaire Administration
D5
3
• 3
3
-+-Fear I • I
_._Depression 1
__.__Fatigue
-+-Fear
-Depression
_._Fatigue
-+-Fear
_._Depression
_._Fatigue
I
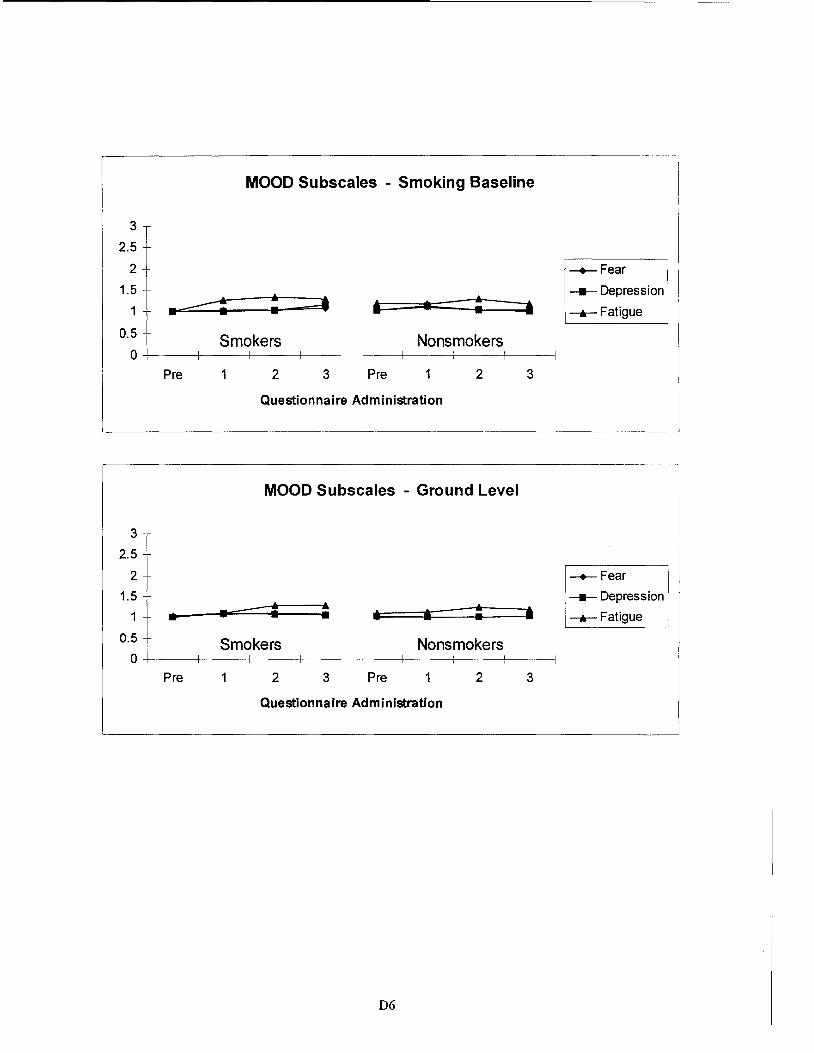
MOOD Subscales - Smoking Baseline
3
2.5
2
1.5
1 .~ : • . : Smokers
0.5
0~--t----+----+---Nonsmokers
Pre 2 3 Pre 2
Questionnaire Administration
MOOD Subscales - Ground Level
3
2.5
2
1.5
1 • . - ~ ~ • • ~ 0.5 Smokers Nonsmokers
0 Pre 2 3 Pre 2
Questionnaire Administration
06
3
• 3
-+-Fear
----Depression
--.-Fatigue
-+-Fear
----Depression
--.-Fatigue

APPENDIX E
STANFORD SLEEPINESS SCALE
FIGURE
El
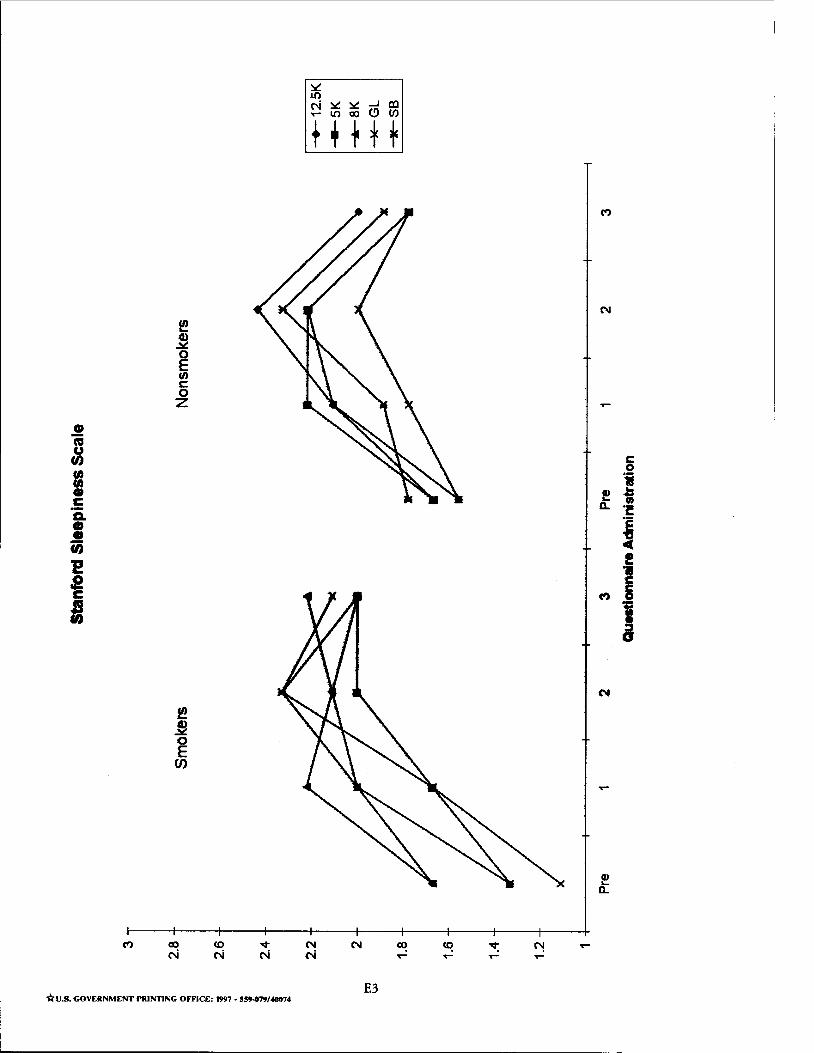
CD ia u 0 (I) (I) • c G. • • ij
E s c
I
~ ~ 0 E en c 0 z
~ ~ 0 E
(J)
ClO N
*U.S. GOVERNMENT PRINTING OFFICE: 1997 • S!9-079/40074
c 0
•• ! ... -• 0.. 1!
I ! .. c
(") &
J
E3
Related Documents


![Effects of Prolonged Exposure to Hypobaric Hypoxia on ... · conditions (chamber, high-altitude) [16]. Operation Everest II (simulated ascent of Mount Everest over 40 days in a hypobaric](https://static.cupdf.com/doc/110x72/5f6274c4768114196b61bb97/effects-of-prolonged-exposure-to-hypobaric-hypoxia-on-conditions-chamber-high-altitude.jpg)