Research Report Effects of learning on feedback-related brain potentials in a decision-making task Uta Sailer a, ⁎ , Florian Ph. S. Fischmeister a,b,c , Herbert Bauer a a Faculty of Pychology, University of Vienna, Liebiggasse 5, 1010 Vienna, Austria b MR Centre of Excellence, Medical University of Vienna, Lazarettgasse 14, 1090 Vienna, Austria c Centre for Biomedical Engineering and Physics, Medical University of Vienna, Waehringerstr. 13, A-1090 Vienna, Austria ARTICLE INFO ABSTRACT Article history: Accepted 19 April 2010 This study investigated the neural mechanisms of feedback processing during learning. While their event-related potentials were recorded, subjects learned to make a sequence of correct choices in a decision-making task. Each choice was followed by gain or loss feedback. In subjects who learned the task, both the feedback-related negativity (FRN), the P3 and the late positivity decreased in the course of the experiment. In subjects who did not learn the task, only the FRN decreased. Moreover, from all ERPs investigated, only changes in P3 amplitude were able to predict performance. These results suggest that the motivational significance of the feedback decreased in all the subjects, but attentive processing of the feedback only decreased in subjects who learned the task. These findings support the view that learning leads to economy of effort and more efficient processing. Moreover, they show that the P3 with its close relationship to learning should be included in future studies investigating the effects of learning on ERPs. © 2010 Elsevier B.V. All rights reserved. Keywords: P300 Feedback-related negativity Late positivity Error-related negativity Learning 1. Introduction Performance monitoring is a crucial prerequisite for adjusting and improving behaviour. One useful indicator of monitoring processes such as detecting response conflicts, errors and unexpected outcomes is the so-called feedback-related nega- tivity (FRN, also: feedback error-related negativity). The FRN is a frontocentral negative-going deflection in the event-related potential that occurs following negative feedback. It peaks 200–300 ms after the onset of a negative feedback stimulus (Miltner et al., 1997; Gehring and Willoughby, 2002; Yeung et al., 2005). The FRN is the feedback-locked variant of the response-locked error-related negativity (ERN) which peaks around 50–60 ms after an erroneous response (Falkenstein et al., 1991; Gehring et al., 1993). Both components have been shown to be sensitive to response or decision conflict (Yeung and Sanfey, 2004), as well as to the emotional evaluation of an outcome (Gehring et al., 1993; Hajcak et al., 2005a). As a unified account of both the ERN and FRN, the reinforcement learning theory proposed that these components occur when perceived outcomes turn out to be worse than expected (Holroyd and Coles, 2002; Nieuwenhuis et al., 2004). The negative prediction error thus generated allegedly leads to decreased activity in the mesencephalic dopamine system. This reduced dopaminergic input is believed to disinhibit the ACC which then generates the ERN/FRN. Extend- ing this theory, recent findings suggest that positive prediction errors also elicit an ERN/FRN. Thus, these components are not only produced when outcomes are worse than expected, but whenever they are different than expected (Oliveira et al., 2007). BRAIN RESEARCH XX (2010) XXX – XXX ⁎ Corresponding author. Faculty of Pychology, University of Vienna, Liebiggasse 5, A-1010 Vienna, Austria. Fax: +43 1 4277 47939. E-mail address: [email protected] (U. Sailer). BRES-40327; No. of pages: 9; 4C: 4 0006-8993/$ – see front matter © 2010 Elsevier B.V. All rights reserved. doi:10.1016/j.brainres.2010.04.051 available at www.sciencedirect.com www.elsevier.com/locate/brainres ARTICLE IN PRESS Please cite this article as: Sailer, U., et al., Effects of learning on feedback-related brain potentials in a decision-making task, Brain Res. (2010), doi:10.1016/j.brainres.2010.04.051

Welcome message from author
This document is posted to help you gain knowledge. Please leave a comment to let me know what you think about it! Share it to your friends and learn new things together.
Transcript
B R A I N R E S E A R C H X X ( 2 0 1 0 ) X X X – X X X
BRES-40327; No. of pages: 9; 4C: 4
ava i l ab l e a t www.sc i enced i r ec t . com
www.e l sev i e r . com/ loca te /b ra i n res
ARTICLE IN PRESS
Research Report
Effects of learning on feedback-related brain potentials in adecision-making task
Uta Sailera,⁎, Florian Ph. S. Fischmeistera,b,c, Herbert Bauera
aFaculty of Pychology, University of Vienna, Liebiggasse 5, 1010 Vienna, AustriabMR Centre of Excellence, Medical University of Vienna, Lazarettgasse 14, 1090 Vienna, AustriacCentre for Biomedical Engineering and Physics, Medical University of Vienna, Waehringerstr. 13, A-1090 Vienna, Austria
A R T I C L E I N F O
⁎ Corresponding author. Faculty of PychologyE-mail address: [email protected] (U
0006-8993/$ – see front matter © 2010 Elsevidoi:10.1016/j.brainres.2010.04.051
Please cite this article as: Sailer, U., et alBrain Res. (2010), doi:10.1016/j.brainres.2
A B S T R A C T
Article history:Accepted 19 April 2010
This study investigated the neural mechanisms of feedback processing during learning.While their event-related potentials were recorded, subjects learned to make a sequence ofcorrect choices in a decision-making task. Each choice was followed by gain or loss feedback.In subjects who learned the task, both the feedback-related negativity (FRN), the P3 and thelate positivity decreased in the course of the experiment. In subjects who did not learn thetask, only the FRN decreased. Moreover, from all ERPs investigated, only changes in P3amplitude were able to predict performance. These results suggest that the motivationalsignificance of the feedback decreased in all the subjects, but attentive processing of thefeedback only decreased in subjects who learned the task. These findings support the viewthat learning leads to economy of effort andmore efficient processing. Moreover, they showthat the P3 with its close relationship to learning should be included in future studiesinvestigating the effects of learning on ERPs.
© 2010 Elsevier B.V. All rights reserved.
Keywords:P300Feedback-related negativityLate positivityError-related negativityLearning
1. Introduction
Performance monitoring is a crucial prerequisite for adjustingand improving behaviour. One useful indicator of monitoringprocesses such as detecting response conflicts, errors andunexpected outcomes is the so-called feedback-related nega-tivity (FRN, also: feedback error-related negativity). The FRN isa frontocentral negative-going deflection in the event-relatedpotential that occurs following negative feedback. It peaks200–300 ms after the onset of a negative feedback stimulus(Miltner et al., 1997; Gehring and Willoughby, 2002; Yeunget al., 2005). The FRN is the feedback-locked variant of theresponse-locked error-related negativity (ERN) which peaksaround 50–60 ms after an erroneous response (Falkensteinet al., 1991; Gehring et al., 1993).
, University of Vienna, Lie. Sailer).
er B.V. All rights reserved
., Effects of learning on010.04.051
Both components have been shown to be sensitive toresponse or decision conflict (Yeung and Sanfey, 2004), as wellas to the emotional evaluation of an outcome (Gehring et al.,1993; Hajcak et al., 2005a). As a unified account of both the ERNandFRN, the reinforcement learning theoryproposed that thesecomponents occur when perceived outcomes turn out to beworse than expected (Holroyd and Coles, 2002; Nieuwenhuis etal., 2004). The negative prediction error thus generated allegedlyleads to decreased activity in the mesencephalic dopaminesystem. This reduced dopaminergic input is believed todisinhibit the ACC which then generates the ERN/FRN. Extend-ing this theory, recent findings suggest that positive predictionerrors also elicit an ERN/FRN. Thus, these components are notonly produced when outcomes are worse than expected, butwhenever they are different than expected (Oliveira et al., 2007).
biggasse 5, A-1010 Vienna, Austria. Fax: +43 1 4277 47939.
.
feedback-related brain potentials in a decision-making task,
2 B R A I N R E S E A R C H X X ( 2 0 1 0 ) X X X – X X X
ARTICLE IN PRESS
Since learning changes outcome expectations, perfor-mance increases should also change the FRN. Indeed, previousstudies on learning effects have found decreases in the FRNafter learning compared to before having learned (Nieuwenhuiset al., 2002; Pietschmann et al., 2008; Krigolson et al., 2009;Bellebaum and Daum, 2008). Decreases in the FRN have alsobeenobservedbetweensubjectswho learnedcompared to thosewho did not learn a probabilistic reward task (Santesso et al.,2008; Krigolson et al., 2009). However, the results are not alwaysunequivocal, since some studies either did not find any FRN atall (Groenetal., 2007), or found learning-related changesonly forpositive feedback, not for negative feedback (Eppinger et al.,2008, 2009).
One factor that may contribute to the inconsistencies isthat the FRN is embedded into the P3, a positive-goingcomponent with a maximum at parietal sites. Importantly,the P3 is affected by factors that also influence the FRN, inparticular target expectancy. The P3's most prominent featureis that it gets smaller when target probability increases(Duncan-Johnson and Donchin, 1977; Donchin and Coles,1988), possibly due to an increased conformity to expectations(Yeung and Sanfey, 2004; Hajcak et al., 2005b). Similar to theFRN, the P3 has been reported to decrease with learning bothwithin (e.g., Groen et al., 2007; Jongsma et al., 2006; Lindin,2004) and between subjects (Radlo et al., 2001) across varioustasks.
Despite the fact that expectancy affects both the FRN andthe P3 and that therefore, learning can be assumed to affectboth components, only very few studies have investigatedlearning-related changes in both the FRN and the P3. Oneexception is the study of Bellebaum and Daum (2008) in whicha reduction of both the FRN and the P3 was related to havinglearned. Similarly, Groen et al. (2007) reported a decrease inthe P3 from the first to the second section of a probabilisticlearning task in children. However, changes in the FRN withlearning could not be investigated in this task, since theabstract feedback stimuli failed to elicit an FRN in the firstplace.
A further component that can be expected to be sensitive tolearning is the late positivity. The late positivity has beensuggested to indicate the strength of a memory trace (formedduring encoding) (Azizian and Polich, 2007). The authors ofthis study also tentatively suggest that the late positivity isrelated to cognitive shifts which are essential for set shifting,as required, for example, in theWisconsin Card Sorting Test. Ithas been suggested that the late positivity and the P3 reflectsimilar processes (Kok, 1997). Along these lines, the latepositivity evoked by emotional pictures (e.g. Diedrich et al.,1997; Amrhein et al., 2004; Cuthbert et al., 2000) may indicate“a greater allocation of perceptual processing resources tomotivationally relevant input” (Cuthbert et al, 2000, p.97).
Since all these three components have been reported tochange with performance improvement, it is well possiblethat they interact during learning. However, to our knowledge,there are no studies that systematically investigate thechanges in all these three components at the same time.Therefore, the aim of the present study was to further analysechanges in feedback processing with learning by examininglearning-related effects on the FRN, the P3 and the latepositivity. ERPs were compared for the first half, termed
Please cite this article as: Sailer, U., et al., Effects of learning onBrain Res. (2010), doi:10.1016/j.brainres.2010.04.051
“early phase,” and the second half, termed “late phase,” of theexperiment. We expected (1) a smaller FRN in the late phase ofthe experiment, when learning should have occurred, com-pared to the early phase of the experiment. This effect shouldbe particularly pronounced for losses. We also expected (2) asmaller P3 and late positivity in the late than in the early phaseof the experiment. Since not all of the subjects learned thegiven task, we also expected (3) a smaller FRN for subjects wholearned the task (high learners) than for those who did notlearn the task (low learners), particularly for losses, as well as(4) a smaller P3 and late positivity for high learners than forlow learners.
2. Results
2.1. Behaviour
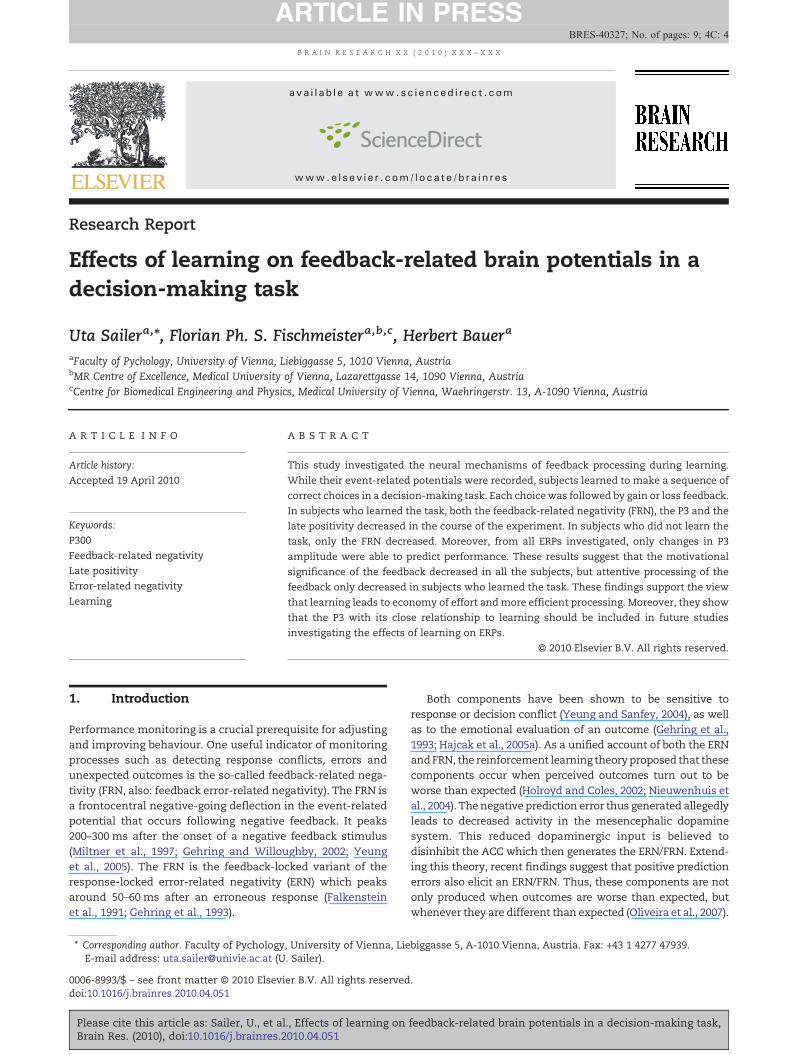
The fitted learning curves for each of the subjects are displayedin Fig. 1. Thirty-nine subjects were classified as high learners,and 23 as low learners (see Methods). High learners achieved alarger percentage of correct responses than low learners both inthe early (N=62, Z=−5.02, p<0.0001) and the late phase (N=62,Z=−6.55, p<0.0001) of the experiment. Moreover, compared tolow learners, high learners showeda larger increase in themeanpercentage of correct responses across the two phases of theexperiment, namely from 72% to 96% (N=39, Z=−5.44, p<0.001).Theperformanceof low learnersonly increased from55%to59%(N=23, Z=−2.37, p<0.05).
For both high and low learners, response latency (seeTable 1) was higher in the first than in the second phase ofthe experiment (F(1,48)=18.79, p<0.001). Latency was alsohigher for wrong than correct responses (F(1,48)=11.49,p<0.01). Moreover, an interaction between learngroup andaccuracy (F(1,48)=8.97, p<0.01) showed that this effect wasonly due to the behaviour of high learners (p<0.05). Lowlearners had similar latencies when giving correct and wronganswers.
2.2. FRN
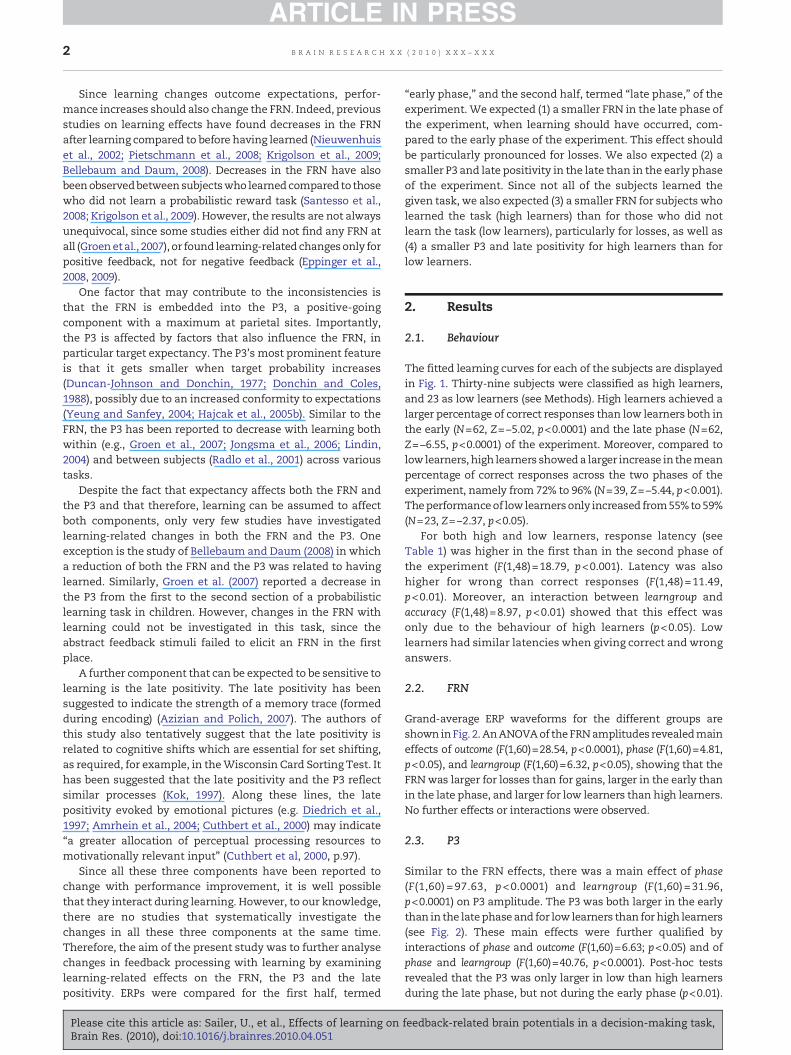
Grand-average ERP waveforms for the different groups areshown inFig. 2.AnANOVAof theFRNamplitudes revealedmaineffects of outcome (F(1,60)=28.54, p<0.0001), phase (F(1,60)=4.81,p<0.05), and learngroup (F(1,60)=6.32, p<0.05), showing that theFRNwas larger for losses than for gains, larger in the early thanin the late phase, and larger for low learners than high learners.No further effects or interactions were observed.
2.3. P3
Similar to the FRN effects, there was a main effect of phase(F(1,60) = 97.63, p<0.0001) and learngroup (F(1,60) =31.96,p<0.0001) on P3 amplitude. The P3 was both larger in the earlythan in the latephaseand for low learners than for high learners(see Fig. 2). These main effects were further qualified byinteractions of phase and outcome (F(1,60)=6.63; p<0.05) and ofphase and learngroup (F(1,60)=40.76, p<0.0001). Post-hoc testsrevealed that the P3 was only larger in low than high learnersduring the late phase, but not during the early phase (p<0.01).
feedback-related brain potentials in a decision-making task,
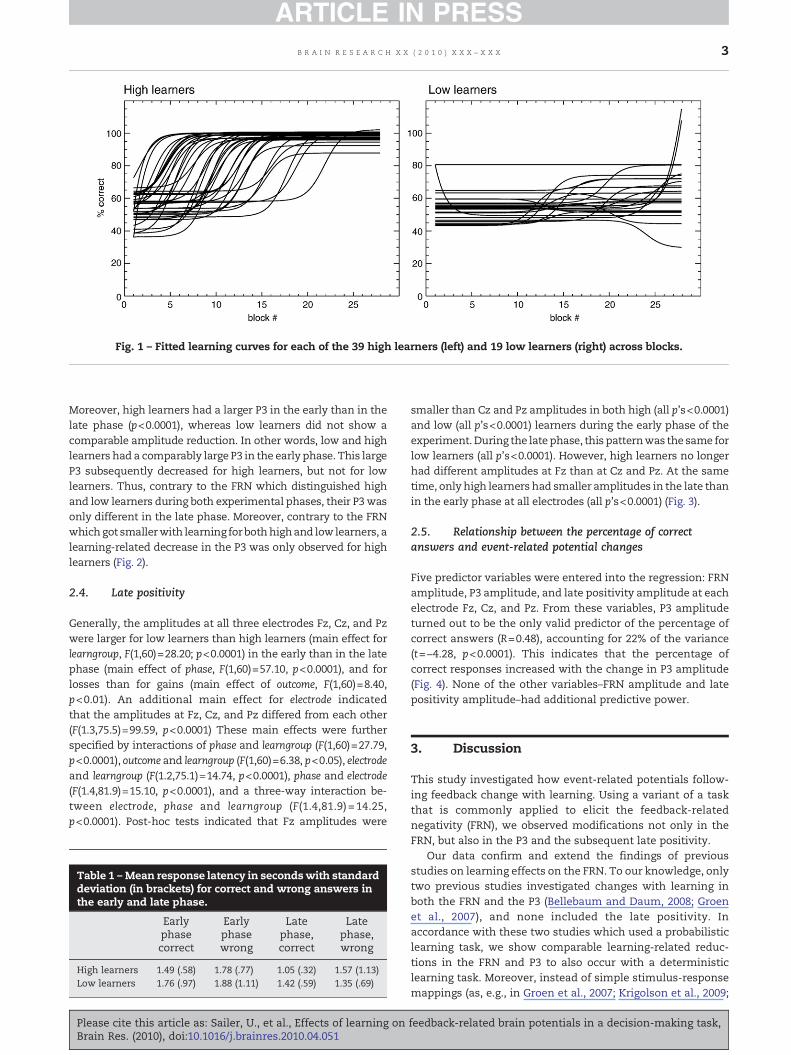
Fig. 1 – Fitted learning curves for each of the 39 high learners (left) and 19 low learners (right) across blocks.
3B R A I N R E S E A R C H X X ( 2 0 1 0 ) X X X – X X X
ARTICLE IN PRESS
Moreover, high learners had a larger P3 in the early than in thelate phase (p<0.0001), whereas low learners did not show acomparable amplitude reduction. In other words, low and highlearners had a comparably large P3 in the early phase. This largeP3 subsequently decreased for high learners, but not for lowlearners. Thus, contrary to the FRN which distinguished highand low learners during both experimental phases, their P3 wasonly different in the late phase. Moreover, contrary to the FRNwhichgot smallerwith learning forbothhighand low learners, alearning-related decrease in the P3 was only observed for highlearners (Fig. 2).
2.4. Late positivity
Generally, the amplitudes at all three electrodes Fz, Cz, and Pzwere larger for low learners than high learners (main effect forlearngroup, F(1,60)=28.20; p<0.0001) in the early than in the latephase (main effect of phase, F(1,60)=57.10, p<0.0001), and forlosses than for gains (main effect of outcome, F(1,60)=8.40,p<0.01). An additional main effect for electrode indicatedthat the amplitudes at Fz, Cz, and Pz differed from each other(F(1.3,75.5)=99.59, p<0.0001) These main effects were furtherspecified by interactions of phase and learngroup (F(1,60)=27.79,p<0.0001), outcome and learngroup (F(1,60)=6.38, p<0.05), electrodeand learngroup (F(1.2,75.1)=14.74, p<0.0001), phase and electrode(F(1.4,81.9)=15.10, p<0.0001), and a three-way interaction be-tween electrode, phase and learngroup (F(1.4,81.9) =14.25,p<0.0001). Post-hoc tests indicated that Fz amplitudes were
Table 1 –Mean response latency in secondswith standarddeviation (in brackets) for correct and wrong answers inthe early and late phase.
Earlyphasecorrect
Earlyphasewrong
Latephase,correct
Latephase,wrong
High learners 1.49 (.58) 1.78 (.77) 1.05 (.32) 1.57 (1.13)Low learners 1.76 (.97) 1.88 (1.11) 1.42 (.59) 1.35 (.69)
Please cite this article as: Sailer, U., et al., Effects of learning onBrain Res. (2010), doi:10.1016/j.brainres.2010.04.051
smaller than Cz and Pz amplitudes in both high (all p's<0.0001)and low (all p's<0.0001) learners during the early phase of theexperiment.During the latephase, this patternwas the same forlow learners (all p's<0.0001). However, high learners no longerhad different amplitudes at Fz than at Cz and Pz. At the sametime, only high learners had smaller amplitudes in the late thanin the early phase at all electrodes (all p's<0.0001) (Fig. 3).
2.5. Relationship between the percentage of correctanswers and event-related potential changes
Five predictor variables were entered into the regression: FRNamplitude, P3 amplitude, and late positivity amplitude at eachelectrode Fz, Cz, and Pz. From these variables, P3 amplitudeturned out to be the only valid predictor of the percentage ofcorrect answers (R=0.48), accounting for 22% of the variance(t=−4.28, p<0.0001). This indicates that the percentage ofcorrect responses increased with the change in P3 amplitude(Fig. 4). None of the other variables–FRN amplitude and latepositivity amplitude–had additional predictive power.
3. Discussion
This study investigated how event-related potentials follow-ing feedback change with learning. Using a variant of a taskthat is commonly applied to elicit the feedback-relatednegativity (FRN), we observed modifications not only in theFRN, but also in the P3 and the subsequent late positivity.
Our data confirm and extend the findings of previousstudies on learning effects on the FRN. To our knowledge, onlytwo previous studies investigated changes with learning inboth the FRN and the P3 (Bellebaum and Daum, 2008; Groenet al., 2007), and none included the late positivity. Inaccordance with these two studies which used a probabilisticlearning task, we show comparable learning-related reduc-tions in the FRN and P3 to also occur with a deterministiclearning task. Moreover, instead of simple stimulus-responsemappings (as, e.g., in Groen et al., 2007; Krigolson et al., 2009;
feedback-related brain potentials in a decision-making task,
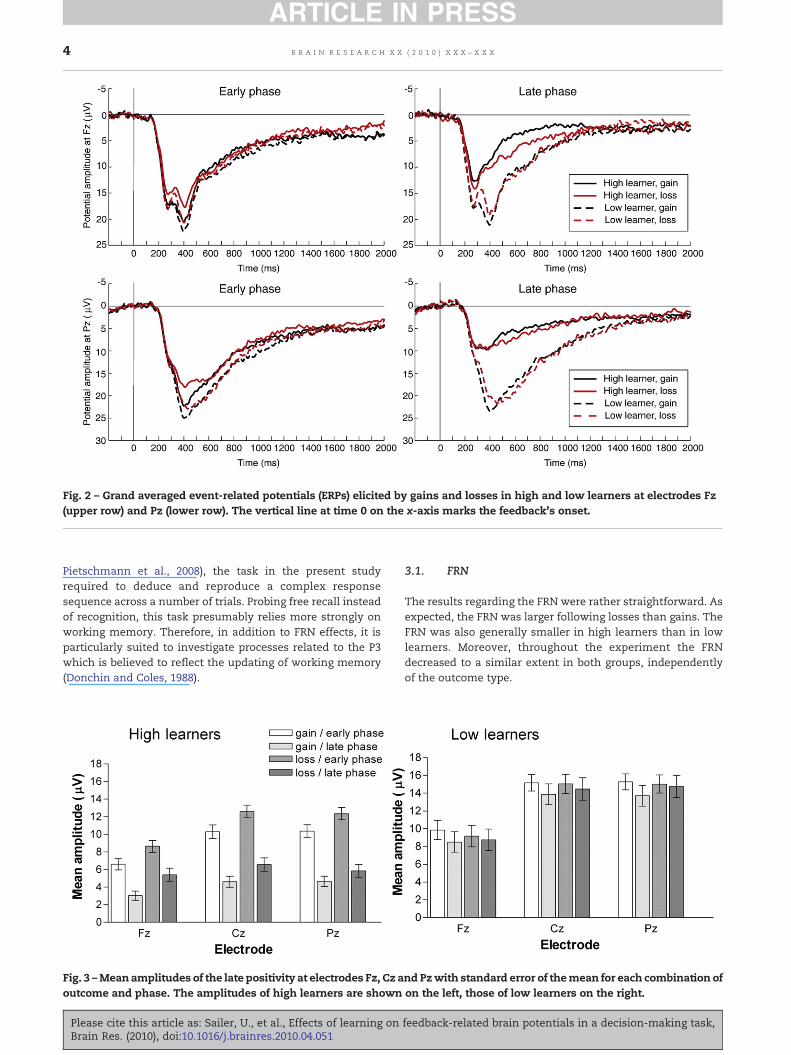
Fig. 2 – Grand averaged event-related potentials (ERPs) elicited by gains and losses in high and low learners at electrodes Fz(upper row) and Pz (lower row). The vertical line at time 0 on the x-axis marks the feedback's onset.
4 B R A I N R E S E A R C H X X ( 2 0 1 0 ) X X X – X X X
ARTICLE IN PRESS
Pietschmann et al., 2008), the task in the present studyrequired to deduce and reproduce a complex responsesequence across a number of trials. Probing free recall insteadof recognition, this task presumably relies more strongly onworking memory. Therefore, in addition to FRN effects, it isparticularly suited to investigate processes related to the P3which is believed to reflect the updating of working memory(Donchin and Coles, 1988).
Fig. 3 –Mean amplitudes of the late positivity at electrodes Fz, Cz aoutcome and phase. The amplitudes of high learners are shown
Please cite this article as: Sailer, U., et al., Effects of learning onBrain Res. (2010), doi:10.1016/j.brainres.2010.04.051
3.1. FRN
The results regarding the FRN were rather straightforward. Asexpected, the FRN was larger following losses than gains. TheFRN was also generally smaller in high learners than in lowlearners. Moreover, throughout the experiment the FRNdecreased to a similar extent in both groups, independentlyof the outcome type.
nd Pzwith standard error of themean for each combination ofon the left, those of low learners on the right.
feedback-related brain potentials in a decision-making task,
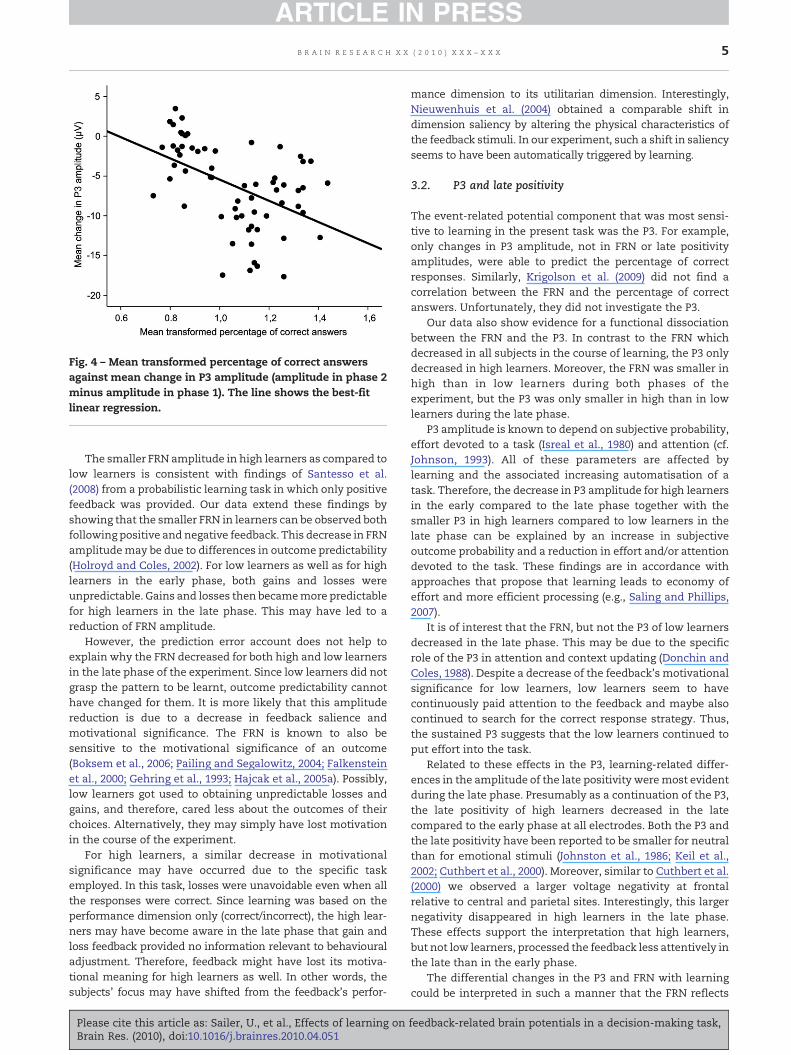
Fig. 4 – Mean transformed percentage of correct answersagainst mean change in P3 amplitude (amplitude in phase 2minus amplitude in phase 1). The line shows the best-fitlinear regression.
5B R A I N R E S E A R C H X X ( 2 0 1 0 ) X X X – X X X
ARTICLE IN PRESS
The smaller FRN amplitude in high learners as compared tolow learners is consistent with findings of Santesso et al.(2008) from a probabilistic learning task in which only positivefeedback was provided. Our data extend these findings byshowing that the smaller FRN in learners can be observed bothfollowing positive and negative feedback. This decrease in FRNamplitudemay be due to differences in outcome predictability(Holroyd and Coles, 2002). For low learners as well as for highlearners in the early phase, both gains and losses wereunpredictable. Gains and losses then becamemore predictablefor high learners in the late phase. This may have led to areduction of FRN amplitude.
However, the prediction error account does not help toexplain why the FRN decreased for both high and low learnersin the late phase of the experiment. Since low learners did notgrasp the pattern to be learnt, outcome predictability cannothave changed for them. It is more likely that this amplitudereduction is due to a decrease in feedback salience andmotivational significance. The FRN is known to also besensitive to the motivational significance of an outcome(Boksem et al., 2006; Pailing and Segalowitz, 2004; Falkensteinet al., 2000; Gehring et al., 1993; Hajcak et al., 2005a). Possibly,low learners got used to obtaining unpredictable losses andgains, and therefore, cared less about the outcomes of theirchoices. Alternatively, they may simply have lost motivationin the course of the experiment.
For high learners, a similar decrease in motivationalsignificance may have occurred due to the specific taskemployed. In this task, losses were unavoidable even when allthe responses were correct. Since learning was based on theperformance dimension only (correct/incorrect), the high lear-ners may have become aware in the late phase that gain andloss feedback provided no information relevant to behaviouraladjustment. Therefore, feedback might have lost its motiva-tional meaning for high learners as well. In other words, thesubjects' focus may have shifted from the feedback's perfor-
Please cite this article as: Sailer, U., et al., Effects of learning onBrain Res. (2010), doi:10.1016/j.brainres.2010.04.051
mance dimension to its utilitarian dimension. Interestingly,Nieuwenhuis et al. (2004) obtained a comparable shift indimension saliency by altering the physical characteristics ofthe feedback stimuli. In our experiment, such a shift in saliencyseems to have been automatically triggered by learning.
3.2. P3 and late positivity
The event-related potential component that was most sensi-tive to learning in the present task was the P3. For example,only changes in P3 amplitude, not in FRN or late positivityamplitudes, were able to predict the percentage of correctresponses. Similarly, Krigolson et al. (2009) did not find acorrelation between the FRN and the percentage of correctanswers. Unfortunately, they did not investigate the P3.
Our data also show evidence for a functional dissociationbetween the FRN and the P3. In contrast to the FRN whichdecreased in all subjects in the course of learning, the P3 onlydecreased in high learners. Moreover, the FRN was smaller inhigh than in low learners during both phases of theexperiment, but the P3 was only smaller in high than in lowlearners during the late phase.
P3 amplitude is known to depend on subjective probability,effort devoted to a task (Isreal et al., 1980) and attention (cf.Johnson, 1993). All of these parameters are affected bylearning and the associated increasing automatisation of atask. Therefore, the decrease in P3 amplitude for high learnersin the early compared to the late phase together with thesmaller P3 in high learners compared to low learners in thelate phase can be explained by an increase in subjectiveoutcome probability and a reduction in effort and/or attentiondevoted to the task. These findings are in accordance withapproaches that propose that learning leads to economy ofeffort and more efficient processing (e.g., Saling and Phillips,2007).
It is of interest that the FRN, but not the P3 of low learnersdecreased in the late phase. This may be due to the specificrole of the P3 in attention and context updating (Donchin andColes, 1988). Despite a decrease of the feedback's motivationalsignificance for low learners, low learners seem to havecontinuously paid attention to the feedback and maybe alsocontinued to search for the correct response strategy. Thus,the sustained P3 suggests that the low learners continued toput effort into the task.
Related to these effects in the P3, learning-related differ-ences in the amplitude of the late positivity weremost evidentduring the late phase. Presumably as a continuation of the P3,the late positivity of high learners decreased in the latecompared to the early phase at all electrodes. Both the P3 andthe late positivity have been reported to be smaller for neutralthan for emotional stimuli (Johnston et al., 1986; Keil et al.,2002; Cuthbert et al., 2000). Moreover, similar to Cuthbert et al.(2000) we observed a larger voltage negativity at frontalrelative to central and parietal sites. Interestingly, this largernegativity disappeared in high learners in the late phase.These effects support the interpretation that high learners,but not low learners, processed the feedback less attentively inthe late than in the early phase.
The differential changes in the P3 and FRN with learningcould be interpreted in such a manner that the FRN reflects
feedback-related brain potentials in a decision-making task,
6 B R A I N R E S E A R C H X X ( 2 0 1 0 ) X X X – X X X
ARTICLE IN PRESS
more general ability or performance differences, and the P3 ismore sensitive to changes in performance. Such an interpre-tation would fit the behavioural data which show generaldifferences in performance between high and low learnersduring both phases, but also a larger performance increase inhigh as compared to low learners. Alternatively, the P3may besensitive to performance changes that occur later on duringlearning. However, the correlation of the change in P3amplitude with the percentage of correct answers throughoutthe entire experiment rather supports the former interpreta-tion. Thus, in the present task the P3 is clearly related toincreases in performance, whereas the FRNmay rather reflectprocesses that are secondary to or even underly learning, suchas changes in motivation. Evidently, future studies arerequired to explore this issue in greater detail.
The P3 is believed to have multiple generators, the mostimportant clusters being situated in the temporoparietaljunction, i.e. supramarginal gyrus and superior temporalgyrus, and the lateral prefrontal cortex (Nieuwenhuis et al.,2005; Linden, 2005). In an fMRI-task that was identical exceptfor a smaller number of elements per block, the most evidentwithin- and between-subjects differences in learning could beobserved in the dorsolateral prefrontal cortex, the inferiorparietal cortex (precuneus and supramarginal area), and theorbitofrontal cortex (Sailer et al., 2007, 2008). Thus, thechanges in the P3 observed in the present ERP study may bedue to similar changes in brain activation as captured in thefMRI studies. At the same time, these fMRI studies showed noevidence of changes in ACC activation, which would beexpected to underly a decrease in FRN amplitude (Miltner etal., 1997; Gehring and Willoughby, 2002; Holroyd and Coles,2002). However, due to the inherent delay between neuronalactivation and the BOLD signal changes (Moonen and Bandet-tini, 2000), fMRI may be more successful in measuring theslower changes of the P3 than the faster FRN fluctuations.Moreover, these data stem from different experiments withdifferent samples, and therefore, have to be compared withcaution.
The present study is limited by the fact that only womenwere investigated. Therefore, the results cannot be general-ised to men. Furthermore, although the helplessness manip-ulation did not show any significant effects, it cannot be ruledout that it may nevertheless have in some way influenced theresults. Further studies are required to verify the observedeffects in a different context.
To conclude, our data extend previous studies whichreported learning-related decreases in the FRN and the P3.Additionally, the P3 proved to be the most valuable predictorfor the subjects' successful application of the learning rule.These results clearly underline the importance of includingthe P3 in studies of learning effects on the FRN.
4. Experimental procedures
4.1. Subjects
66 women, mostly undergraduates, took part in the EEGmeasurement. For one subject, the experiment had to beterminatedmidway because of unexpectedly occurring health
Please cite this article as: Sailer, U., et al., Effects of learning onBrain Res. (2010), doi:10.1016/j.brainres.2010.04.051
problems. Two further subjects did not complete the entireexperimental session due to technical problems, and the dataof one subject was not usable because it contained too manyartefacts. The remaining 62 subjects were aged between 20and 46 years (mean=24). All the subjects were right-handed,as assessed by the Edinburgh Handedness Questionnaire(Oldfield, 1971), had normal or corrected-to-normal visualacuity and no history of neurological or mental diseases.
Prior to the experiment, written informed consent wasobtained from each participant according to the guidelines ofthe local ethics committee of theMedical University of Vienna.All the subjects received a fixed payment of € 20 for theirparticipation.
A part of the subjects first underwent a procedure intendedto induce learned helplessness, which is also why only femaleparticipants had been selected (a previous study, Fretska et al.,1999, had revealed a larger percentage of emotionally highlyreactive individuals in females than in men). However, sincethe groups of helpless and control subjects did not differ onany measure investigated in this manuscript, their data werepooled.
4.2. Experimental setup
Subjects were seated in a sound-attenuated and dimly litchamber. They rested their arms on the table with the indexand middle finger of the right hand on a response box. Thestimuli were presented on an 18-inch (Samsung SyncMaster181 T) LCD-monitor with a spatial resolution of 1024x768. Themonitor was placed on the table at a distance of about 70 cmfrom the observer's eyes.
Since the data were intended to be comparable to those ofan fMRI study with the same task (Sailer et al., 2007), all thesubjects were submitted to a recording of MR scanner noiseduring the entire duration of the decision-making task.
The task was adapted from Nieuwenhuis et al. (2004;experiment 2) and Gehring andWilloughby (2002). The stimuliand their size in visual angle were largely oriented at thevalues reported by Nieuwenhuis et al. (2004). At the beginningof each trial, two rectangles with a central fixation spot inbetween appeared on the screen. After 3 s, the number 5 or 25appeared in each of the rectangles. Each number could eitherappear in the right or the left rectangle, according to a non-predictable pattern. These numbers indicated points that thesubjects couldwin or loose. One of these alternatives had to beselected by pressing the corresponding button on the responsebox. The choice was marked by a thickening of the blackoutline of the respective rectangle. If the response did notoccurwithin 30 s, awarningwas displayed on the screen. Afterthe response occurred or another 30 s passed withoutresponse, the trial ended. One second after the button waspressed, a + or − sign was added to both the chosen and thenon-chosen value which indicated whether the chosen valuewas gained or lost. At the same time, the thick black outline ofthe chosen outcome turned to red or green which indicatedwhether the choice was correct or incorrect. A correct choicewas defined as one where the subject had chosen the largergain or the smaller loss, an incorrect choicewas defined as onewhere the subject had chosen the smaller gain or the greaterloss (see Table 2).
feedback-related brain potentials in a decision-making task,
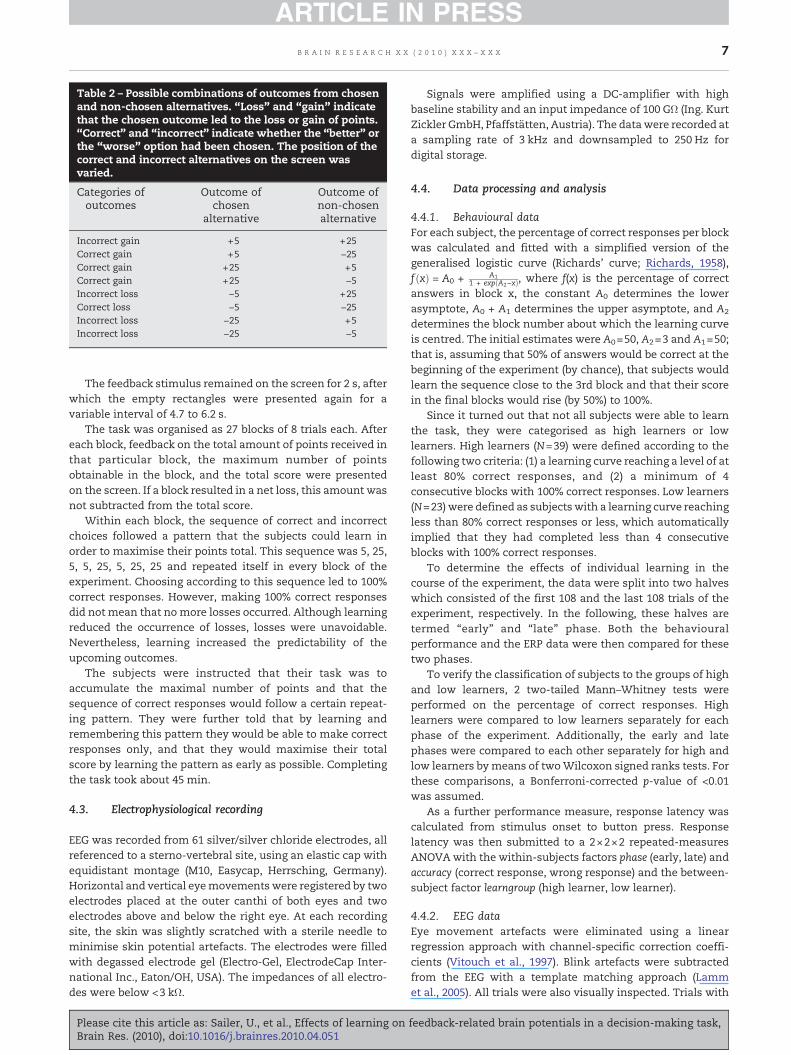
Table 2 – Possible combinations of outcomes from chosenand non-chosen alternatives. “Loss” and “gain” indicatethat the chosen outcome led to the loss or gain of points.“Correct” and “incorrect” indicate whether the “better” orthe “worse” option had been chosen. The position of thecorrect and incorrect alternatives on the screen wasvaried.
Categories ofoutcomes
Outcome ofchosen
alternative
Outcome ofnon-chosenalternative
Incorrect gain +5 +25Correct gain +5 −25Correct gain +25 +5Correct gain +25 −5Incorrect loss −5 +25Correct loss −5 −25Incorrect loss −25 +5Incorrect loss −25 −5
7B R A I N R E S E A R C H X X ( 2 0 1 0 ) X X X – X X X
ARTICLE IN PRESS
The feedback stimulus remained on the screen for 2 s, afterwhich the empty rectangles were presented again for avariable interval of 4.7 to 6.2 s.
The task was organised as 27 blocks of 8 trials each. Aftereach block, feedback on the total amount of points received inthat particular block, the maximum number of pointsobtainable in the block, and the total score were presentedon the screen. If a block resulted in a net loss, this amount wasnot subtracted from the total score.
Within each block, the sequence of correct and incorrectchoices followed a pattern that the subjects could learn inorder to maximise their points total. This sequence was 5, 25,5, 5, 25, 5, 25, 25 and repeated itself in every block of theexperiment. Choosing according to this sequence led to 100%correct responses. However, making 100% correct responsesdid not mean that nomore losses occurred. Although learningreduced the occurrence of losses, losses were unavoidable.Nevertheless, learning increased the predictability of theupcoming outcomes.
The subjects were instructed that their task was toaccumulate the maximal number of points and that thesequence of correct responses would follow a certain repeat-ing pattern. They were further told that by learning andremembering this pattern they would be able to make correctresponses only, and that they would maximise their totalscore by learning the pattern as early as possible. Completingthe task took about 45 min.
4.3. Electrophysiological recording
EEG was recorded from 61 silver/silver chloride electrodes, allreferenced to a sterno-vertebral site, using an elastic cap withequidistant montage (M10, Easycap, Herrsching, Germany).Horizontal and vertical eyemovementswere registered by twoelectrodes placed at the outer canthi of both eyes and twoelectrodes above and below the right eye. At each recordingsite, the skin was slightly scratched with a sterile needle tominimise skin potential artefacts. The electrodes were filledwith degassed electrode gel (Electro-Gel, ElectrodeCap Inter-national Inc., Eaton/OH, USA). The impedances of all electro-des were below <3 kΩ.
Please cite this article as: Sailer, U., et al., Effects of learning onBrain Res. (2010), doi:10.1016/j.brainres.2010.04.051
Signals were amplified using a DC-amplifier with highbaseline stability and an input impedance of 100 GΩ (Ing. KurtZickler GmbH, Pfaffstätten, Austria). The datawere recorded ata sampling rate of 3 kHz and downsampled to 250 Hz fordigital storage.
4.4. Data processing and analysis
4.4.1. Behavioural dataFor each subject, the percentage of correct responses per blockwas calculated and fitted with a simplified version of thegeneralised logistic curve (Richards' curve; Richards, 1958),f ðxÞ = A0 + A1
1 + expðA2−xÞ, where f(x) is the percentage of correctanswers in block x, the constant A0 determines the lowerasymptote, A0 + A1 determines the upper asymptote, and A2
determines the block number about which the learning curveis centred. The initial estimates were A0=50, A2=3 and A1=50;that is, assuming that 50% of answers would be correct at thebeginning of the experiment (by chance), that subjects wouldlearn the sequence close to the 3rd block and that their scorein the final blocks would rise (by 50%) to 100%.
Since it turned out that not all subjects were able to learnthe task, they were categorised as high learners or lowlearners. High learners (N=39) were defined according to thefollowing two criteria: (1) a learning curve reaching a level of atleast 80% correct responses, and (2) a minimum of 4consecutive blocks with 100% correct responses. Low learners(N=23) were defined as subjectswith a learning curve reachingless than 80% correct responses or less, which automaticallyimplied that they had completed less than 4 consecutiveblocks with 100% correct responses.
To determine the effects of individual learning in thecourse of the experiment, the data were split into two halveswhich consisted of the first 108 and the last 108 trials of theexperiment, respectively. In the following, these halves aretermed “early” and “late” phase. Both the behaviouralperformance and the ERP data were then compared for thesetwo phases.
To verify the classification of subjects to the groups of highand low learners, 2 two-tailed Mann–Whitney tests wereperformed on the percentage of correct responses. Highlearners were compared to low learners separately for eachphase of the experiment. Additionally, the early and latephases were compared to each other separately for high andlow learners bymeans of twoWilcoxon signed ranks tests. Forthese comparisons, a Bonferroni-corrected p-value of <0.01was assumed.
As a further performance measure, response latency wascalculated from stimulus onset to button press. Responselatency was then submitted to a 2×2×2 repeated-measuresANOVAwith the within-subjects factors phase (early, late) andaccuracy (correct response, wrong response) and the between-subject factor learngroup (high learner, low learner).
4.4.2. EEG dataEye movement artefacts were eliminated using a linearregression approach with channel-specific correction coeffi-cients (Vitouch et al., 1997). Blink artefacts were subtractedfrom the EEG with a template matching approach (Lammet al., 2005). All trials were also visually inspected. Trials with
feedback-related brain potentials in a decision-making task,
8 B R A I N R E S E A R C H X X ( 2 0 1 0 ) X X X – X X X
ARTICLE IN PRESS
remaining eye or other artefacts were excluded from furtheranalysis. Subsequently, the EEG was filtered with a low-frequency half-amplitude cutoff at 30 Hz (6dB/octave slope) forcalculating mean amplitudes and generating graphs, and at16 Hz (6dB/octave slope) for peak-picking.
Feedback-locked epochs were averaged for gain and losstrials in each phase of the experiment and separately for eachsubject. A baseline of 100 ms before onset of the feedbackstimulus was subtracted. The FRN had a typical distributionwith a maximum around 250 ms and was most pronouncedfor midline central scalp areas. It was quantified in theaveraged ERP of each subject as the base-to-peak-to-peakvoltage difference between the most negative peak and theaverage of the immediately preceding and following positivepeaks (according to Yeung and Sanfey, 2004) at electrode Fz, allof which had to occur in the interval of 100–600 ms afterfeedback onset. Fz was chosen because the FRN was found tobe most prominent at this recording site. For conditions withan absent FRN, a mean FRN amplitude of 0 (difference of 0between positive and negative peaks) was employed.
The peak amplitude of the P3 was determined as the base-to-peak amplitude in the interval of 200–600 ms after feedbackonset at electrode Pz. To analyse the late positivity, a slowpotential change with no distinct peak, mean ERP amplitudesat the three midline electrodes Fz, Cz and Pz were extracted inthe interval of 450 to 950 ms following feedback onset. Thisinterval and the respective electrodes were chosen based onvisual assessment of the grand means and on existing ERPstudies (e.g., Azizian and Polich, 2007; Curran and Friedman,2004; Cuthbert et al., 2000).
The amplitudes of the FRN and P3 were submitted toseparate repeated-measures ANOVA with the two within-subjects factors phase (levels: early, late) and outcome (levels:gain, loss), and the between-subject factor learngroup (levels:high learner, low learner).
The amplitudes of the late positivity were submitted to arepeated-measures ANOVA with electrode (levels: Fz, Cz, Pz),outcome (levels: gain, loss), and phase (levels: early, late) aswithin-subject factors, and learngroup (levels: high learner, lowlearner) as between-subjects factor.
For all ANOVAs, the degrees of freedom were Greenhouse–Geisser-corrected when appropriate. Interaction effects wereanalysed with post-hoc Scheffé tests. Only post-hoc differ-ences for comparisons of interest are reported, for example,ERP amplitudes for gains in the early versus the late phase (notfor any other differences such as between gains in the earlyphase and losses in the late phase). A significance level ofp<0.05 was assumed.
4.4.3. Relationship between the percentage of correct answersand event-related potential changesTo further investigate the relationship between FRN, P3, latepositivity and behaviour, a stepwise linear regression analysiswas performed. Following Krigolson et al. (2009), the changesin amplitude (ERP component amplitude in the late phaseminus ERP component amplitude in the early phase) werecalculated for the P3, the FRN, and the mean late positivityamplitudes at each electrode Fz, Cz and Pz. These changeswere entered as predictors into a regression analysis wherethe percentage of correct responses, following its arc sine
Please cite this article as: Sailer, U., et al., Effects of learning onBrain Res. (2010), doi:10.1016/j.brainres.2010.04.051
square root transformation, was the criterion. Regressiondiagnostics did not show evidence formulticollinearity amongthe predictors (all tolerances >0.4).
Acknowledgments
This study was supported by the German Research Foundation(DFG), the Austrian National Bank (OeNB) and the AustrianScience Fund (FWF). We thank Dorothea König and ClaudiaOppenauer for help with subject acquisition, and our subjectsfor participating in the study.
R E F E R E N C E S
Amrhein, C., Mühlberger, A., Pauli, P., Wiedemann, G., 2004.Modulation of event-related brain potentials duringaffective picture processing: a complement to startle reflexand skin conductance response? Int. J. Psychophysiol. 54,231–240.
Azizian, A., Polich, J., 2007. Evidence for attentional gradient in theserial position memory curve from event-related potentials.J. Cogn. Neurosci. 19, 2071–2081.
Bellebaum, C., Daum, I., 2008. Learning-related changes in rewardexpectancy are reflected in the feedback-related negativity.Eur. J. Neurosci. 27, 1823–1835.
Boksem, M.A., Tops, M., Wester, A.E., Meijman, T.F., Lorist, M.M.,2006. Error-related ERP components and individualdifferences in punishment and reward sensitivity. Brain Res.1101, 92–101.
Curran, T., Friedman, W.J., 2004. ERP old/new effects at differentretention intervals in recency discrimination tasks. Brain Res.Cogn. Brain Res. 18, 107–120.
Cuthbert, B.N., Schupp, H.T., Bradley, M.M., Birbaumer, N., Lang, P.J.,2000. Brain potentials in affective picture processing: covariationwith autonomic arousal and affective report. Biol. Psychol. 52,95–111.
Diedrich, O., Naumann, E., Maier, S., Becker, G., 1997. A frontalpositive slowwave in the ERP associated with emotional slides.J. Psychophyiol. 11, 71–84.
Donchin, E., Coles, M.G.H., 1988. Is the P300 component amanifestation of context updating? Behav. Brain Sci. 11,357–374.
Duncan-Johnson, C.C., Donchin, E., 1977. On quantifying surprise:The variation of event-related potentials with subjectiveprobability. Psychophysiology 14, 456–467.
Eppinger, B., Kray, J., Mock, B., Mecklinger, A., 2008. Better or worsethan expected? Aging, learning, and the ERN. Neuropsychologia46, 521–539.
Eppinger, B., Mock, B., Kray, J., 2009. Developmental differencesin learning and error processing: evidence from ERPs.Psychophysiology 46, 1043–1053.
Falkenstein, M., Hohnsbein, J., Hoormann, J., Blanke, L., 1991. Effectsof crossmodal divided attentionon late ERP components. II. Errorprocessing in choice reaction tasks. Electroencephalogr. Clin.Neurophysiol. 78, 447–455.
Falkenstein, M., Hoormann, J., Christ, S., Hohnsbein, J., 2000. ERPcomponents on reaction errors and their functional significance:a tutorial. Biol. Psychol. 51, 87–107.
Fretska, E., Bauer, H., Leodolter, M., Leodolter, U., 1999. Loss ofcontrol and negative emotions: a cortical slow potentialtopography study. Int. J. Psychophysiol. 33, 127–141.
Gehring, W.J., Willoughby, A.R., 2002. The medial frontal cortexand the rapid processing of monetary gains and losses. Science295, 2279–2282.
feedback-related brain potentials in a decision-making task,
9B R A I N R E S E A R C H X X ( 2 0 1 0 ) X X X – X X X
ARTICLE IN PRESS
Gehring, W.J., Goss, B., Coles, M.G.H., Meyer, D.E., Donchin, E.A.,1993. Neural system for error-detection and compensation.Psychol. Sci. 4, 385–390.
Groen, Y., Wijers, A.A., Mulder, L.J., Minderaa, R.B., Althaus, M.,2007. Physiological correlates of learning by performancefeedback in children: a study of EEG event-related potentialsand evoked heart rate. Biol. Psychol. 76, 174–187.
Hajcak, G., Moser, J.S., Yeung, N., Simons, R.F., 2005a. On the ERNand the significance of errors. Psychophysiology 42, 151–160.
Hajcak, G., Holroyd, C.B., Moser, J.S., Simons, R.F., 2005b. Brainpotentials associated with expected and unexpected good andbad outcomes. Psychophysiology 42, 161–170.
Holroyd, C.B., Coles, M.G., 2002. The neural basis of human errorprocessing: reinforcement learning, dopamine, and theerror-related negativity. Psychol. Rev. 109, 679–709.
Isreal, J.B., Chesney, G.L., Wickens, C.D., Donchin, E., 1980. P300and tracking difficulty: evidence for multiple resources indual-task performance. Psychophysiology 17, 259–273.
Johnson Jr., R., 1993. On the neural generators of the P300component of the event-related potential. Psychophysiology30, 90–97.
Johnston, V.S., Miller, D.R., Burleson, M.H., 1986. Multiple P3s toemotional stimuli and their theoretical significance.Psychophysiology 23, 684–694.
Jongsma, M.L., Eichele, T., Van Rijn, C.M., Coenen, A.M., Hugdahl,K., Nordby, H., Quiroga, R.Q., 2006. Tracking pattern learningwith single-trial event-related potentials. Clin. Neurophysiol.117, 1957–1973.
Keil, A., Bradley, M.M., Hauk, O., Rockstroh, B., Elbert, T., Lang, P.J.,2002. Large-scale neural correlates of affective pictureprocessing. Psychophysiology 39, 641–649.
Kok, A., 1997. Event-related-potential (ERP) reflections of mentalresources: a review and synthesis. Biol. Psychol. 45, 19–56.
Krigolson, O.E., Pierce, L.J., Holroyd, C.B., Tanaka, J.W., 2009.Learning to become an expert: reinforcement learning and theacquisition of perceptual expertise. J. Cogn. Neurosci. 21,1834–1841.
Lamm, C., Fischmeister, F.P., Bauer, H., 2005. Individual differencesin brain activity during visuo-spatial processing assessed byslow cortical potentials and LORETA. Brain Res. Cogn. BrainRes. 25, 900–912.
Linden, D.E., 2005. The p300: where in the brain is it produced andwhat does it tell us? Neuroscientist 11, 563–576.
Lindin, M., 2004. Changes in P300 amplitude during an activestandard auditory oddball task. Biol. Psychol. 66, 153–167.
Miltner, W.H.R., Braun, C.H., Coles, M.G.H., 1997. Event-relatedbrain potentials following incorrect feedback in atime-estimation task: evidence for a “generic” neural systemfor error detection. J. Cogn. Neurosci. 9, 788–798.
Moonen, C.T.W., Bandettini, P.A. (Eds.), 2000. Functional MRI.Springer, Berlin.
Nieuwenhuis, S., Ridderinkhof, K.R., Talsma, D., Coles, M.G.,Holroyd, C.B., Kok, A., van der Molen, M.W., 2002. A
Please cite this article as: Sailer, U., et al., Effects of learning onBrain Res. (2010), doi:10.1016/j.brainres.2010.04.051
computational account of altered error processing in older age:dopamine and the error-related negativity. Cogn. Affect.Behav. Neurosci. 2, 19–36.
Nieuwenhuis, S., Yeung, N., Holroyd, C.B., Schurger, A., Cohen, J.D.,2004. Sensitivity of electrophysiological activity from medialfrontal cortex to utilitarian and performance feedback. Cereb.Cortex 14, 741–747.
Nieuwenhuis, S., Aston-Jones, G., Cohen, J.D., 2005. DecisionMaking, the P3, and the Locus Coeruleus-NorepinephrineSystem. Psych. Bull. 4, 510–532.
Oldfield, R.C., 1971. The assessment and analysis of handedness:the Edinburgh inventory. Neuropsychologia 9, 97–113.
Oliveira, F.T., McDonald, J.J., Goodman, D., 2007. Performancemonitoring in the anterior cingulate is not all error related:expectancy deviation and the representation of action-outcomeassociations. J. Cogn. Neurosci. 19, 1994–2004.
Pailing, P.E., Segalowitz, S.J., 2004. The error-related negativity as astate and trait measure: motivation, personality, and ERPs inresponse to errors. Psychophysiology 41, 84–95.
Pietschmann, M., Simon, K., Endrass, T., Kathmann, N., 2008.Changes of performance monitoring with learning in older andyounger adults. Psychophysiology 45, 559–568.
Radlo, S.J., Janelle, C.M., Barba, D.A., Frehlich, S.G., 2001. Perceptualdecision making for baseball pitch recognition: using P300latency and amplitude to index attentional processing. Res. Q.Exerc. Sport 72, 22–31.
Richards, F.J., 1958. A flexible growth function for empirical use.J. Exp. Bot. 10, 290–300.
Sailer, U., Robinson, S., Fischmeister, F.P., Moser, E., Kryspin-Exner,I., Bauer, H., 2007. Imaging the changing role of feedbackduring learning in decision-making. Neuroimage 37,1474–1486.
Sailer, U., Robinson, S., Fischmeister, F.P., König, D., Oppenauer, C.,Lueger-Schuster, B., Moser, E., Kryspin-Exner, I., Bauer, H., 2008.Altered reward processing in the nucleus accumbens andmesial prefrontal cortex of patients with posttraumatic stressdisorder. Neuropsychologia 46, 2836–2844.
Saling, L.L., Phillips, J.G., 2007. Automatic behaviour: efficient notmindless. Brain Res. Bull. 73, 1–20.
Santesso, D.L., Dillon, D.G., Birk, J.L., Holmes, A.J., Goetz, E.,Bogdan, R., Pizzagalli, D.A., 2008. Individual differences inreinforcement learning: behavioral, electrophysiological, andneuroimaging correlates. Neuroimage 42, 807–816.
Vitouch, O., Bauer, H., Gittler, G., Leodolter, M., Leodolter, U., 1997.Cortical activity of good and poor spatial test performersduring spatial and verbal processing studied with SlowPotential Topography. Int. J. Psychophysiol. 27, 183–199.
Yeung, N., Sanfey, A.G., 2004. Independent coding of rewardmagnitude and valence in the human brain. J. Neurosci. 24,6258–6264.
Yeung, N., Holroyd, C.B., Cohen, J.D., 2005. ERP correlates offeedback and reward processing in the presence and absenceof response choice. Cereb. Cortex 15, 535–544.
feedback-related brain potentials in a decision-making task,
Related Documents