Perception & Psychophysics /993, 53 (4), 443-449 Event-related brain potentials reflect traces of echoic memory in humans ISTVAN WINKLER Institute for Psychology, Hungarian Academy of Sciences, Budapest, Hungary and KALEVI REINIKAINEN and RISTO NAATANEN University of Helsinki, Helsinki, Finland In sequences of identical auditory stimuli, infrequent deviant stimuli elicit an event-related brain potential component called mismatch negativity (MMN). MMN is presumed to reflect the existence of a memory trace of the frequent stimulus at the moment of presentation of the infre- quent stimulus. This hypothesis was tested by applying the recognition-masking paradigm of cognitive psychology. In this paradigm, a masking sound presented shortly before or after a test stimulus diminishes the recognition memory of this stimulus, the more so the shorter the inter- val between the test and masking stimuli. This interval was varied in the present study. It was found that the MMN amplitude strongly correlated with the subject's ability to discriminate be- tween frequent and infrequent stimuli. This result strongly suggests that MMN provides a mea- sure for a trace of sensory memory, and further, that with MMN, this memory can be studied without performance-related distortions. Auditory stimuli presented in temporal proximity in- terfere with each other in perception. The influence of one sound on the recognition of the other is studied in the recognition-masking paradigm. In it, subjects are required to identify sounds (test sourul) preceded or followed by another sound (masking sourul) with a short silent interval (intertone interval). In forward masking, the masking stim- ulus precedes the test stimulus; in backward masking, this order is reversed. The masking paradigms have been widely used to assess features of the auditory sensory store (echoic memory; for a review, see Hawkins & Presson, 1986; see also Cowan, 1984, 1988). Increasing the in- tertone interval between the two sounds until recognition performance reaches an asymptotic level establishes the time required for the emergence of a relatively stable trace in echoic memory (for a review, see Massaro, 1976). However, the subject's discrimination task in these experi- ments might distort results by introducing performance- related processes. The mismatch negativity (MMN) is a component of the event-related brain potential (ERP) elicited by infrequent, physically deviant stimuli (e.g., a pitch or intensity change) in a sequence of auditory stimuli (standards). (For a review, see Niilitiinen, 1990.) MMN is elicited even in pas- sive paradigms-that is, when the subject's task is not re- lated to the auditory stimuli (see, e.g., Alho, Sams, Paavilainen, Reinikainen, & Niilitiinen, 1989; Alho, This research was supported by the Academy of Finland and the Na- tional Scientific Fund of Hungary (OTKA). Correspondence should be addressed to I. Winkler, Institute for Psychology, Hungarian Academy of Sciences, H-1394 Budapest, P.O.B. 398, Szondy u. 83-85, Hungary. 443 Woods, Algazi, & Niilitiinen, 1992). In order to elicit the MMN component, the deviant stimulus has to be preceded by several exemplars of the standard stimulus (Sams, Albo, & Niilitiinen, 1983); infrequent stimuli alone do not elicit the MMN (Niilitiinen, Paavilainen, Alho, Reinikainen, & Sarns, 1989). The intracranial generators of the MMN are bilaterally localized in the primary auditory cortex or in its vicinity (Hari et al., 1984), and possibly in the right frontal lobe (Giard, Perrin, Pernier, & Bouchet, 1990). These fmdings suggest that MMN reflects a neural pro- cess activated when an incoming stimulus does not cor- respond to the trace formed by the previous stimuli. Mem- ory traces involved in change detection might form the neurophysiological basis of echoic memory (Naatiinen, 1985). The MMN amplitude probably enables one to as- sess the strength of this trace. This relationship is sup- ported by the effects of the interstimulus interval (see, e.g., Miintysalo & Niiiitiinen, 1987), the deviant-stimulus probability (see, e.g., Niilitiinen, Sams, Jarvilehto, & Soininen, 1983), and variation of the standard stimulus on MMN (Winkler et al., 1990). Increasing the inter- stimulus interval in the sequence, decreasing the within- block probability of the standard stimulus (thus increasing that of the deviant stimulus), or introducing some varia- tion in the standard stimulus decreases the strength of the standard-stimulus trace encountered by deviants. Each of these manipulations also attenuates the MMN amplitude. The alternative to this memory-trace hypothesis is that MMN is due to release from refractoriness. According to the refractoriness hypothesis, the extra negativity in ERPs to infrequent stimuli is generated by such neural elements that respond to the specific feature(s) separat- ing infrequent from frequent stimuli. These neurons would Copyright 1993 Psychonomic Society, Inc.

Welcome message from author
This document is posted to help you gain knowledge. Please leave a comment to let me know what you think about it! Share it to your friends and learn new things together.
Transcript
Perception & Psychophysics/993, 53 (4), 443-449
Event-related brain potentials reflecttraces of echoic memory in humans
ISTVAN WINKLERInstitute for Psychology, Hungarian Academy of Sciences, Budapest, Hungary
and
KALEVI REINIKAINEN and RISTO NAATANENUniversity of Helsinki, Helsinki, Finland
In sequences of identical auditory stimuli, infrequent deviant stimuli elicit an event-relatedbrain potential component called mismatch negativity (MMN). MMN is presumed to reflect theexistence of a memory trace of the frequent stimulus at the moment of presentation of the infrequent stimulus. This hypothesis was tested by applying the recognition-masking paradigm ofcognitive psychology. In this paradigm, a masking sound presented shortly before or after a teststimulus diminishes the recognition memory of this stimulus, the more so the shorter the interval between the test and masking stimuli. This interval was varied in the present study. It wasfound that the MMN amplitude strongly correlated with the subject's ability to discriminate between frequent and infrequent stimuli. This result strongly suggests that MMN provides a measure for a trace of sensory memory, and further, that with MMN, this memory can be studiedwithout performance-related distortions.
Auditory stimuli presented in temporal proximity interfere with each other in perception. The influence ofone sound on the recognition of the other is studied in therecognition-masking paradigm. In it, subjects are requiredto identify sounds (test sourul) preceded or followed byanother sound (masking sourul) with a short silent interval(intertone interval). In forward masking, the masking stimulus precedes the test stimulus; in backward masking, thisorder is reversed. The masking paradigms have beenwidely used to assess features of the auditory sensory store(echoic memory; for a review, see Hawkins & Presson,1986; see also Cowan, 1984, 1988). Increasing the intertone interval between the two sounds until recognitionperformance reaches an asymptotic level establishes thetime required for the emergence of a relatively stable tracein echoic memory (for a review, see Massaro, 1976).However, the subject's discrimination task in these experiments might distort results by introducing performancerelated processes.
The mismatch negativity (MMN) is a component of theevent-related brain potential (ERP) elicited by infrequent,physically deviant stimuli (e.g., a pitch or intensity change)in a sequence of auditory stimuli (standards). (For areview, see Niilitiinen, 1990.) MMN is elicited even in passive paradigms-that is, when the subject's task is not related to the auditory stimuli (see, e.g., Alho, Sams,Paavilainen, Reinikainen, & Niilitiinen, 1989; Alho,
This research was supported by the Academy of Finland and the National Scientific Fund of Hungary (OTKA). Correspondence should beaddressed to I. Winkler, Institute for Psychology, Hungarian Academyof Sciences, H-1394 Budapest, P.O.B. 398, Szondy u. 83-85, Hungary.
443
Woods, Algazi, & Niilitiinen, 1992). In order to elicit theMMN component, the deviant stimulus has to be precededby several exemplars of the standard stimulus (Sams, Albo,& Niilitiinen, 1983); infrequent stimuli alone do not elicitthe MMN (Niilitiinen, Paavilainen, Alho, Reinikainen, &Sarns, 1989). The intracranial generators of the MMN arebilaterally localized in the primary auditory cortex or inits vicinity (Hari et al., 1984), and possibly in the rightfrontal lobe (Giard, Perrin, Pernier, & Bouchet, 1990).
These fmdings suggest that MMN reflects a neural process activated when an incoming stimulus does not correspond to the trace formed by the previous stimuli. Memory traces involved in change detection might form theneurophysiological basis of echoic memory (Naatiinen,1985). The MMN amplitude probably enables one to assess the strength of this trace. This relationship is supported by the effects of the interstimulus interval (see,e.g., Miintysalo & Niiiitiinen, 1987), the deviant-stimulusprobability (see, e.g., Niilitiinen, Sams, Jarvilehto, &Soininen, 1983), and variation of the standard stimuluson MMN (Winkler et al., 1990). Increasing the interstimulus interval in the sequence, decreasing the withinblock probability of the standard stimulus (thus increasingthat of the deviant stimulus), or introducing some variation in the standard stimulus decreases the strength of thestandard-stimulus trace encountered by deviants. Each ofthese manipulations also attenuates the MMN amplitude.
The alternative to this memory-trace hypothesis is thatMMN is due to release from refractoriness. Accordingto the refractoriness hypothesis, the extra negativity inERPs to infrequent stimuli is generated by such neuralelements that respond to the specific feature(s) separating infrequent from frequent stimuli. These neurons would
Copyright 1993 Psychonomic Society, Inc.
444 WINKLER, REINIKAINEN, AND NAATANEN
METHOD
Forward Masking
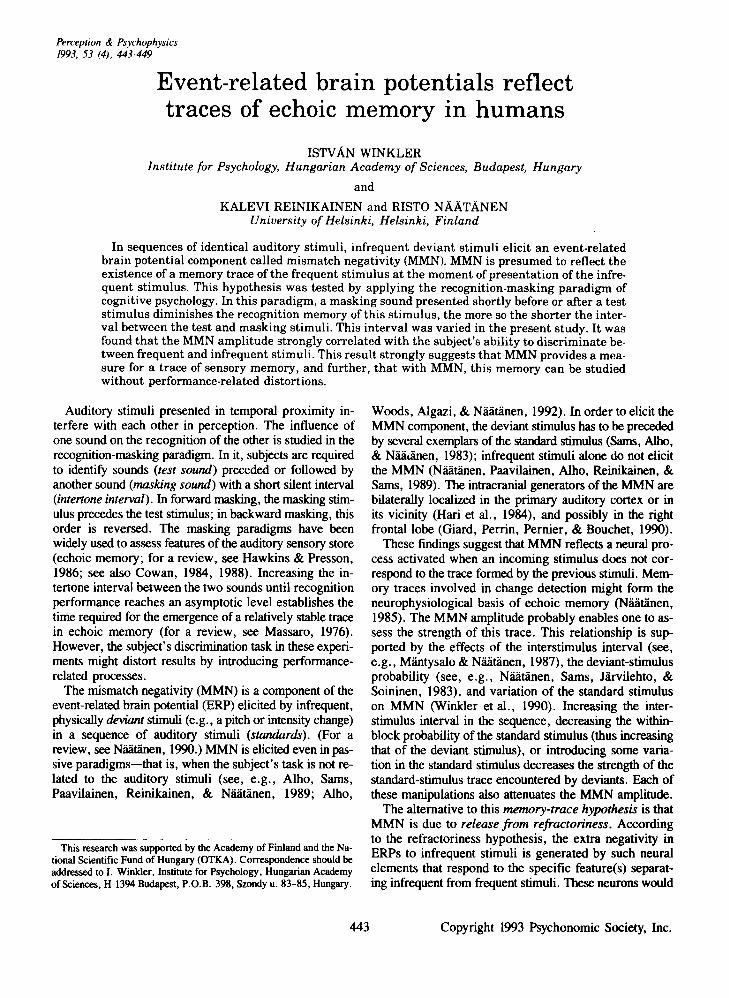
Figure 1. Order of stimuli within the stimulus pairs and timinginformation in forward and backward masking. Standards aremarked with dotted fill; deviants, with hatched pattern; maskingstimuli are left empty. ITI, intertone interval.
-{g0_ndo_'d__Jl I JLI850m. ~[
400
-0.9096.32
300-0.6195.79
150
-0.8888.42
50
-0.7095.79
20
-0.5797.37
MMN%Hits
RESULTS
Note-Data were measured from subjects detecting more than 90% ofdeviants at the 20-msec intertone interval (ceiling-effect group).
Table 1Recognition Performance (percent) and Average Frontal
Mismatch Negativity (MMN) Amplitude (in Microvolts) for theDifferent Intertone Intervals (in Milliseconds) in Backward Masking
Intertone Interval
session). The order of the blocks was balanced with respect to theintertone intervals. The intertone intervals were 20,50, 150,300,and 400 msec.
The EEG was recorded with Ag-AgCI electrodes at Fpz, Fz, Cz,Pz, F3, C3, F4, C4 (10-20 system), and both mastoids. The reference electrode was placed on the tip of the nose. The horizontalEOG was monitored with an electrode attached to the outer canthus of the right eye for artifact rejection. The EEG was amplified(bandpass limits: 0.1-100 Hz) and digitized (sampling rate, 200 Hz).The analysis period was 420 msec (including 15-msec prestimulustime). Trials with an EEG- or EOG-amplitude change exceeding150 p.Y were rejected. Digitized epochs were averaged within eachintertone interval/stimulus class and filtered below 30 Hz. TheMMN amplitude was measured from the difference between ERPsto infrequent (deviant) and frequent (standard) test stimuli in the160-200 msec interval (MMN interval); the NI amplitude, fromthe 80-120 msec interval (NI interval) of the standard-stimulus responses. Results from the electrode position (Fz), yielding the mostprominent MMN, were used for statistical testing. This choice wasencouraged by high correlations between MMN amplitudes at neighboring electrode locations (over .84 in forward, over .77 in backward masking).
The recognition-masking session was preceded by a short initialtraining period. (Blocks presented for training contained the sametest tones used throughout the experiment but without masking.)Recognition performance was calculated as the ratio of the correctbuttonpresses in response to the total number of the infrequent testtones. Low false-alarm rates (below 3% for each subject/condition)made the calculation of d' values unnecessary.
The presence of the MMN component was tested by one-factoranalyses of variance between the average amplitudes in the MMNinterval of ERPs to deviants and the corresponding standards. Theeffect of the intertone interval was tested by one-factor analysesof variance with repeated measures (Huynh-Feldt correction applied) of the MMN amplitude and of the recognition performance,followed by Scheffe-type pairwise comparisons. The relation between the MMN amplitude and recognition performance was testedby polynomial regression between recognition performance and theMMN amplitude. Statistical tests were computed with the BMDPsoftware package (Dixon, 1985).
In backward recognition masking, 5 out of 10 subjectscorrectly identified more than 90% of the deviant testtones even at the shortest intertone interval (20 msec).(Table 1 shows the recognition performance and theMMN amplitudes measured for this group.) Because ofthis recognition performance ceiling effect, only data collected from the other 5 subjects (no-ceiling-effect group)were included in the subsequent analyses. Figure 2 showsfor these subjects that, only when followed by longer in-
Deviant
LJl
Backward Masking
~L..k_e_'B-ms----M
not be exhausted by the frequent repetition of the standard stimulus; therefore, they would account for all theextra negativity elicited by deviants in relation to thatelicited by the standards (Naatanen, 1990).
The present study addressed MMN in the auditoryrecognition-masking paradigm. Good correspondence between recognition memory and MMN would (1) stronglysupport the memory interpretation of MMN, (2) providea measure for echoic memory uncontaminated by the subject's task, and (3) give an estimate for the buildup timeof the memory trace involved.
Both forward- and backward-masking experiments were carriedout in two sessions each. In the MMN session, the subject was required to read a book and to ignore auditory stimuli while the EEGwas recorded. In the recognition masking session, held on a separate day (no EEG was recorded), the same stimuli were administeredand the subject was instructed to press a button in response to thehigher (infrequent) test tones.
Ten subjects (18-32 years, 8 males) participated in the backwardmasking experiment. Five of them (19-30 years, all males), selectedon the basis of showing no ceiling effect in backward recognitionmasking (sre Results), participated later in the forward-masking study,too. These five subjects were then subsequently retested in a sessionof backward recognition masking to check whether their previousexperience with the stimuli affected their performance in forwardmasking.
The subject sat in a reclining chair in an electrically and acoustically shielded room. Pairs of sine-wave tone bursts (intensity, 80 dBSPL) were presented via earphones to the subject's right ear. Theinterval between onsets of consecutive pairs of test and masker toneswas constant at 850 msec, the durations being 25 and 55 msec,respectively (including 2.5-msec linear rise and fall times). Figure I illustrates the stimulus sequences of both masking conditions.Of the test tones, 85% had a frequency of 600 Hz (standard testtone), and 15%, a frequency of 700 Hz (deviant test tone). Themasker tone had a frequency of 1000 Hz. The order of pairs con1aining the frequent or the infrequent test tone was randomized.Stimulus pairs of different intertone intervals were presented in separate blocks (250 pairs/block, five blocks for each intertone interval in the MMN session, two blocks in the recognition-masking
ERPs REFLECT TRACES OF ECHOIC MEMORY 44S
Backward MasklngFz
'No-celllng-ettect' group
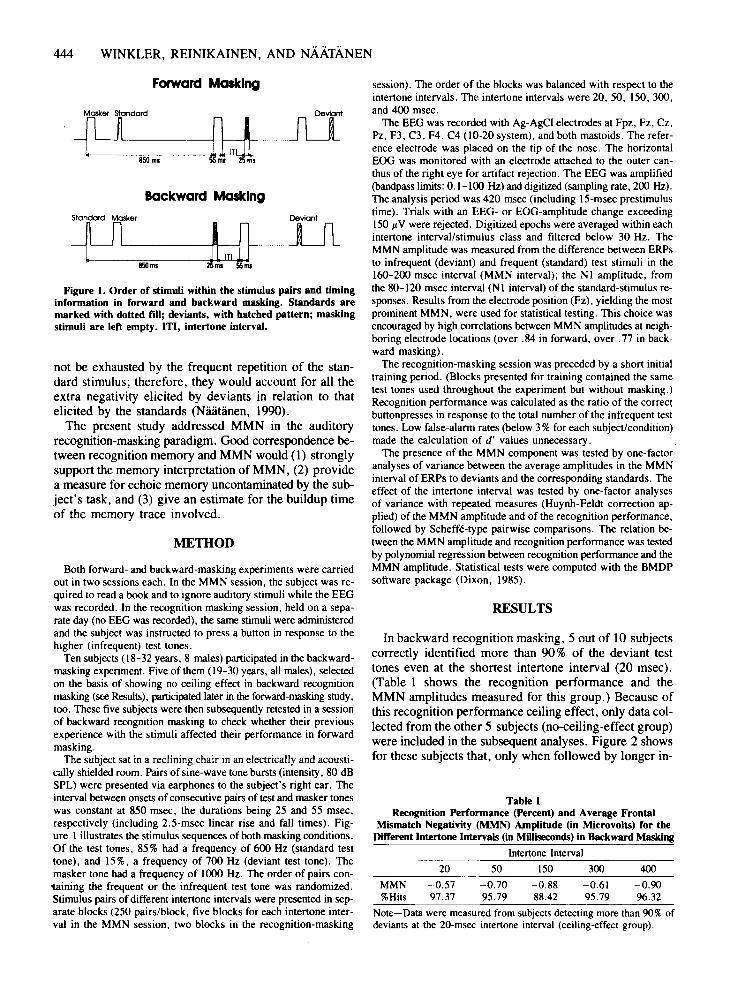
Figure 2. Left: Across-subject averaged (no-ceiling-effect group)frontal (Fz) ERPs to the frequent (thin line) and infrequent (thickline) test tones in the backward-masking condition. Right: Difference curves obtained by subtracting ERPs to frequent test stimulifrom those to infrequent test-stimuli. Different rows represent different intervals between the test-stimulus offset and the maskerstimulus onset (intertone interval): 20, 50, 150, 300, and 400 msec.
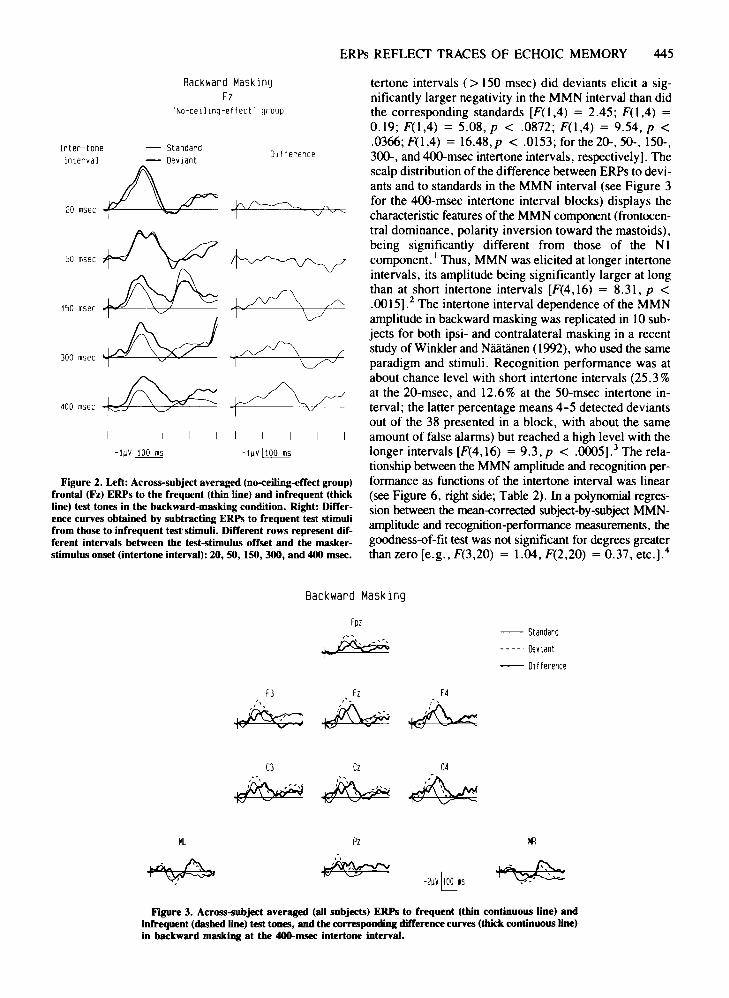
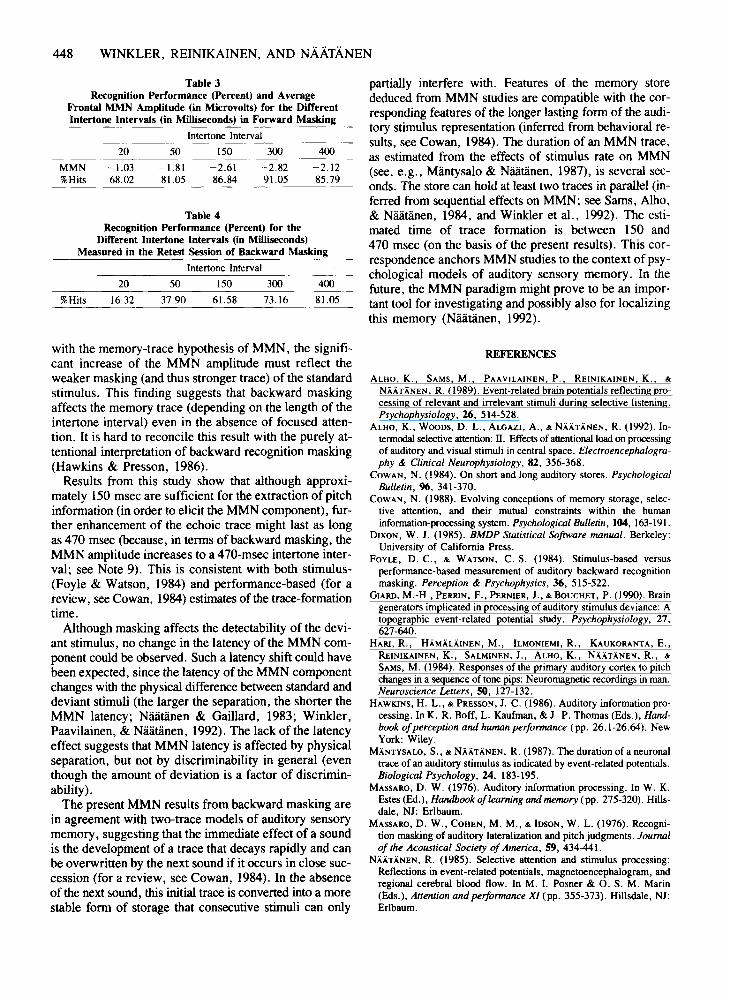
tertone intervals (> ISO msec) did deviants elicit a significantly larger negativity in the MMN interval than didthe corresponding standards [F(l,4) = 2.4S; F(l,4) =0.19; F(l,4) = S.08, p < .0872; F(l,4) = 9.S4, p <.0366; F(l,4) = 16.48, p < .OIS3; for the 20-, SO-, ISO-.300-, and400-msec intertone intervals, respectively]. Thescalp distribution of the difference between ERPs to deviants and to standards in the MMN interval (see Figure 3for the 4oo-msec intertone interval blocks) displays thecharacteristic features of the MMN component (frontocentral dominance, polarity inversion toward the mastoids),being significantly different from those of the NIcomponent. 1 Thus, MMN was elicited at longer intertoneintervals, its amplitude being significantly larger at longthan at short intertone intervals [F(4,16) = 8.31, P <.00IS].2 The intertone interval dependence of the MMNamplitude in backward masking was replicated in 10 subjects for both ipsi- and contralateral masking in a recentstudy of Winkler and Niiatiinen (1992), who used the sameparadigm and stimuli. Recognition performance was atabout chance level with short intertone intervals (2S. 3 %at the 20-msec, and 12.6% at the SO-msec intertone interval; the latter percentage means 4-S detected deviantsout of the 38 presented in a block, with about the sameamount of false alarms) but reached a high level with thelonger intervals [F(4,16) = 9.3,p < .OOOS].3 The relationship between the MMN amplitude and recognition performance as functions of the intertone interval was linear(see Figure 6, right side; Table 2). In a polynomial regression between the mean-eorrected subject-by-subject MMNamplitude and recognition-performance measurements, thegoodness-of-fit test was not significant for degrees greaterthan zero [e.g., F(3,20) = 1.04,F(2,20) =0.37,etc.].4
OJ t terence
20 msec
50 msec
150 msec
~oo msec
300 msec
Inter-tone - StandardJnterval - OevJant
I\r +~ifV'~ 1~V""="'c,~="","V~~
+Ab+~yhd~~~vC
ML
Backward Masking
FpI
L~-- Standard
- - -- DeVIant,--- Dlfterence
F3 FI F4
k: ~ ~<
C3 CI C4
~ ~ ~~
PI MA
~ ~-M~ms1 .' _
,"
Figure 3. Across-subject averaged (all subjects) ERPs to frequent (thin continuous line) andinfrequent (dashed line) test tones, and the corresponding difference curves (thick continuous line)in backward masking at the 400-msec intertone interval.
446 WINKLER, REINIKAINEN, AND NAATANEN
Table 2Recognition Performance (Percent) and Average Frontal
Mismatch Negativity (MMN) Amplitude (in Microvolts) for theDifferent IntertoDe Intervals (in Milliseconds) in Backward Masking
Intertone Interval
20 50 150 300 400
MMN -0.63 +0.16 -1.76 -1.50 -2.28%Hits 25.26 12.63 63.16 74.74 85.72
Note-Data were measured from subjects detecting less than 90% ofdeviants at the 2o-msec intertone interval (no-ceiling-effect group).
Table 4 shows results from the retest of backward recognition masking. In a two-factor analysis of variance(original vs. retest session x intertone interval), no significant difference was found between the two sessions[F(1,4) = 0.06], whereas the effect of the intertone interval was again highly significant [F(4,16) = 16.23,p <.0017]. These results suggest that the subjects' previousexperience with the stimuli did not affect their performance significantly in the forward-masking condition.
DISCUSSION
300msec~-~~
50 msec~- 1~ ./;;;z ::::
150 msec~~-~ Lv
.....
Di fference
I-2uV 1100 inS
Forward MaskingFz
- Standard- Deviant
-2uV 1100 inS
400 msec
Inter-toneinterval
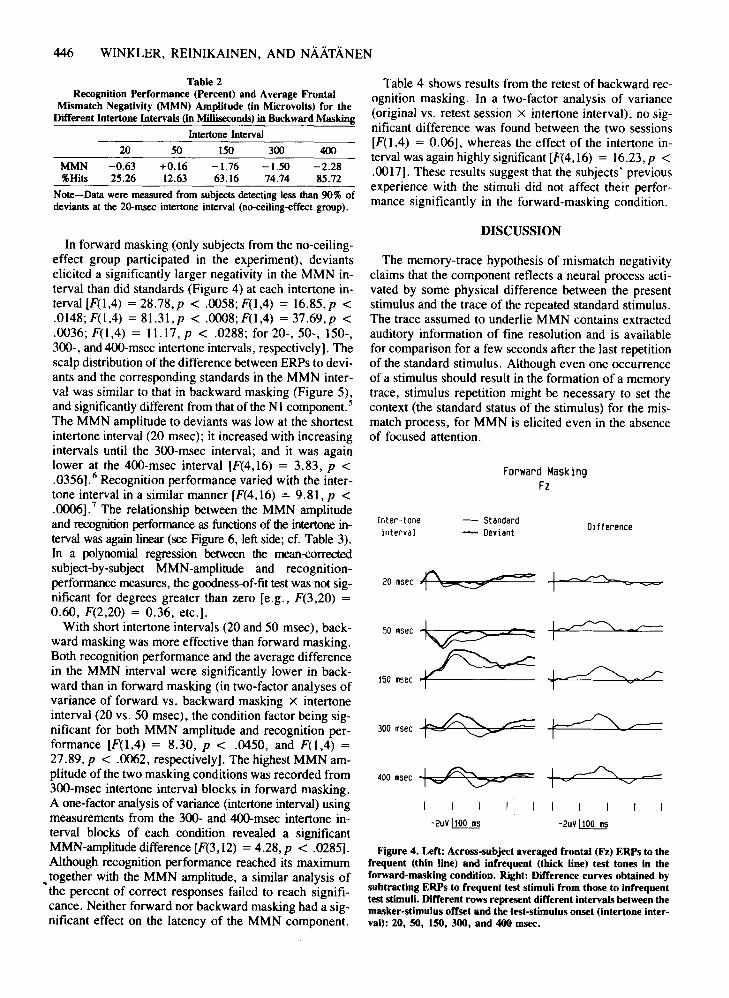
Figure 4. Left: Across-subject averaged frontal (Fz) ERPs to thefrequent (thin line) and infrequent (thick line) test tones in theforward-masking condition. Right: Difference curves obtained bysubtracting ERPs to frequent test stimuli from those to infrequenttest stimuli. Different rows represent different intervals between themasker-stimulus offset and the test-stimulus onset (intertone interval): 20, SO, ISO, 300, and 400 msec.
The memory-trace hypothesis of mismatch negativityclaims that the component reflects a neural process activated by some physical difference between the presentstimulus and the trace of the repeated standard stimulus.The trace assumed to underlie MMN contains extractedauditory information of fine resolution and is availablefor comparison for a few seconds after the last repetitionof the standard stimulus. Although even one occurrenceof a stimulus should result in the formation of a memorytrace, stimulus repetition might be necessary to set thecontext (the standard status of the stimulus) for the mismatch process, for MMN is elicited even in the absenceof focused attention.
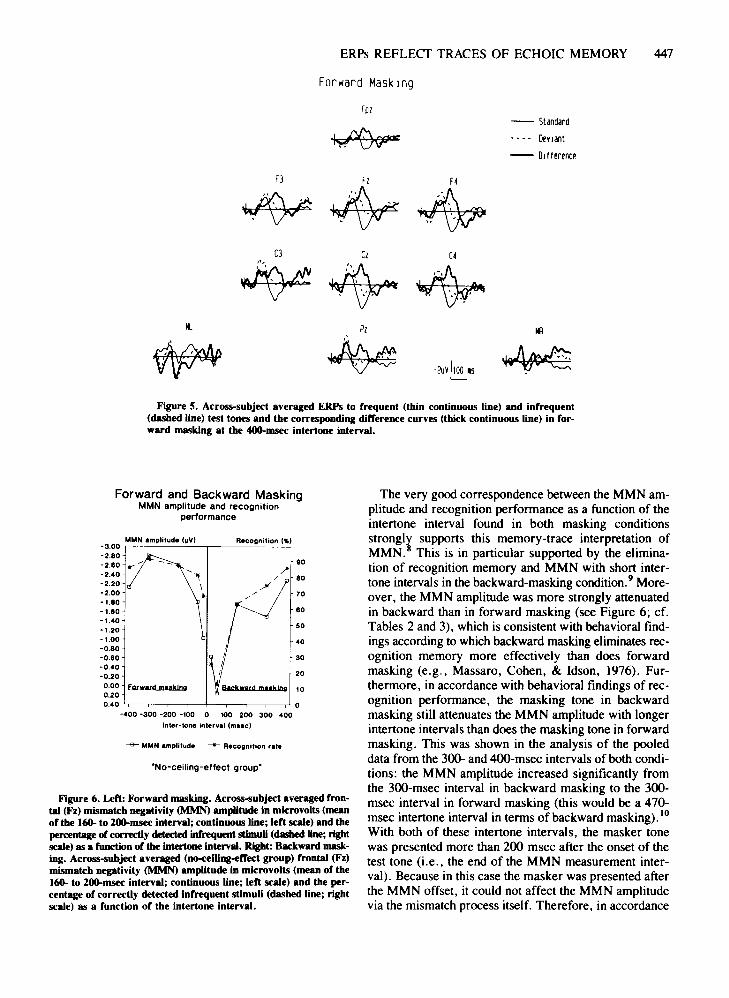
In forward masking (only subjects from the no-ceilingeffect group participated in the experiment), deviantselicited a significantly larger negativity in the MMN interval than did standards (Figure 4) at each intertone interval [F(I,4) = 28.78,p < .0058; F(1,4) = 16.85,p <.0148; F(I,4) = 81.31,p < .0008; F(I,4) = 37.69,p <.0036; F(1,4) = 11.17, p < .0288; for 20-, 50-, 150-,300-, and 4OO-msec intertone intervals, respectively]. Thescalp distribution of the difference between ERPs to deviants and the corresponding standards in the MMN interval was similar to that in backward masking (Figure 5),and significantly different from that of the N1 component. 5
The MMN amplitude to deviants was low at the shortestintertone interval (20 msec); it increased with increasingintervals until the 300-msec interval; and it was againlower at the 400-msec interval [F(4,16) = 3.83, p <.0356].6 Recognition performance varied with the intertone interval in a similar manner [F(4,16) = 9.81, p <.0006].7 The relationship between the MMN amplitudeand recognition performance as functions of the intertone interval was again linear (see Figure 6, left side; cf. Table 3).In a polynomial regression between the mean<orrectedsubject-by-subject MMN-amplitude and recognitionperformance measures, the goodness-of-fit test was not significant for degrees greater than zero [e.g., F(3,20) =0.60, F(2,20) = 0.36, etc.].
With short intertone intervals (20 and 50 msec), backward masking was more effective than forward masking.Both recognition performance and the average differencein the MMN interval were significantly lower in backward than in forward masking (in two-factor analyses ofvariance of forward vs. backward masking X intertoneinterval (20 vs. 50 msec), the condition factor being significant for both MMN amplitude and recognition performance [F(I,4) = 8.30, p < .0450, and F(1,4) =27.89, p < .0062, respectively]. The highest MMN amplitude of the two masking conditions was recorded from300-msec intertone interval blocks in forward masking.A one-factor analysis of variance (intertone interval) usingmeasurements from the 300- and 4OO-msec intertone interval blocks of each condition revealed a significantMMN-amplitude difference [F(3, 12) = 4.28, p < .0285].Although recognition performance reached its maximum
• together with the MMN amplitude, a similar analysis ofthe percent of correct responses failed to reach significance. Neither forward nor backward masking had a significant effect on the latency of the MMN component.
ERPs REFLECf TRACES OF ECHOIC MEMORY 447
Forward MaskIng
FDZ-- Standard
- - - - DevIant
-- OIfferencp
F3
~,FZ +F4, "",'" "',- ,
- "
[3
~[z [4
~~~ \1'-' ~ W
PZ
~" -2UV~IS
Figure 5. Across-subject averaged ERPs to frequent (thin continuous line) and infrequent(dashed line) test tones and the corresponding difference curves (thick continuous line) in forward masking at the 400-msec intertoDe interval.
20
40
60
The very good correspondence between the MMN amplitude and recognition performance as a function of theintertone interval found in both masking conditionsstrongli supports this memory-trace interpretation ofMMN. This is in particular supported by the elimination of recognition memory and MMN with short intertone intervals in the backward-masking condition.9 Moreover, the MMN amplitude was more strongly attenuatedin backward than in forward masking (see Figure 6; cf.Tables 2 and 3), which is consistent with behavioral findings according to which backward masking eliminates recognition memory more effectively than does forwardmasking (e.g., Massaro, Cohen, & Idson, 1976). Furthermore, in accordance with behavioral findings of recognition performance, the masking tone in backwardmasking still attenuates the MMN amplitude with longerintertone intervals than does the masking tone in forwardmasking. This was shown in the analysis of the pooleddata from the 300- and 4OO-msec intervals of both conditions: the MMN amplitude increased significantly fromthe 300-msec interval in backward masking to the 300msec interval in forward masking (this would be a 470msec intertone interval in terms of backward masking). 10
With both of these intertone intervals, the masker tonewas presented more than 200 msec after the onset of thetest tone (i.e., the end of the MMN measurement interval). Because in this case the masker was presented afterthe MMN offset, it could not affect the MMN amplitudevia the mismatch process itself. Therefore, in accordance
gO
80
30
70
50
Forward and Backward MaskingMMN amplitude and recognition
performance
"No-ceiling-effect group"
_3.00 TM_M.N__a_mp_Ii_'u_da_{_uV_I---.__R_a_co...:g:.-"i_tiO_".c{-;'l
-2.80-2.60-2.40-2.20-2.00-1.80-1.80-1.40-1.20-1.00-0.80-0.80-0.40-0.20
0.00 Forward ma.klng0.200.40 ~-r--,-----,-+-----.--.--~-,L0
-400 -300 -200 -100 0 100 200 300 400
Inter-tone interval (meec)
-e- MMN amplitude ----- Recognition rate
Figure 6. Left: Forward masking. Across-subject averaged frontal (Fz) mismatch negativity (MMN) amplitude in microvolts (meanof the 160- to 2ClO-msec interval; continuous line; left scale) and thepercentage of correctly detected infrequent stimuli (dasbed line; rightscale) as a function of the intertone interval. Right: Backward masking. Across-subject averaged (nCM:eiling-effect group) frontal (Fz)mismatch negativity (MMN) amplitude in microvolts (mean of the160- to 2ClO-msec interval; continuous line; left scale) and the percentage of correctly detected infrequent stimuli (dashed line; rightscale) as a function of the intertone interval.
448 WINKLER, REINIKAINEN, AND NAATANEN
Table 4Recognition Performance (Percent) for the
Different Intertone Intervals (in Milliseconds)Measured in the Retest Session of Backward Masking
Table 3Recognition Performance (Percent) and Average
Frontal MMN Amplitude (in Microvolts) for the DifferentIntertone Intervals (in Milliseconds) in Forward Masking
Intertone Interval
Intertone Interval
MMN%Hits
%Hits
20
-1.0368.02
20
16.32
50
-1.8181.05
50
37.90
150
-2.6186.84
150
61.58
300
-2.8291.05
300
73.16
400
-2.1285.79
400
81.05
partially interfere with. Features of the memory storededuced from MMN studies are compatible with the corresponding features of the longer lasting form of the auditory stimulus representation (inferred from behavioral results, see Cowan, 1984). The duration of an MMN trace,as estimated from the effects of stimulus rate on MMN(see, e.g., Miintysalo & Niiiitiinen, 1987), is several seconds. The store can hold at least two traces in parallel (inferred from sequential effects on MMN; see Sams, Albo,& Niiiitiinen, 1984, and Winkler et al., 1992). The estimated time of trace formation is between 150 and470 msec (on the basis of the present results). This correspondence anchors MMN studies to the context of psychological models of auditory sensory memory. In thefuture, the MMN paradigm might prove to be an important tool for investigating and possibly also for localizingthis memory (Naatiinen, 1992).
with the memory-trace hypothesis of MMN, the significant increase of the MMN amplitude must reflect theweaker masking (and thus stronger trace) of the standardstimulus. This finding suggests that backward maskingaffects the memory trace (depending on the length of theintertone interval) even in the absence of focused attention. It is hard to reconcile this result with the purely attentional interpretation of backward recognition masking(Hawkins & Presson, 1986).
Results from this study show that although approximately 150 msec are sufficient for the extraction of pitchinformation (in order to elicit the MMN component), further enhancement of the echoic trace might last as longas 470 msec (because, in terms of backward masking, theMMN amplitude increases to a 470-msec intertone interval; see Note 9). This is consistent with both stimulus(Foyle & Watson, 1984) and performance-based (for areview, see Cowan, 1984) estimates of the trace-formationtime.
Although masking affects the detectability of the deviant stimulus, no change in the latency of the MMN component could be observed. Such a latency shift could havebeen expected, since the latency of the MMN componentchanges with the physical difference between standard anddeviant stimuli (the larger the separation, the shorter theMMN latency; Niiiitiinen & Gaillard, 1983; Winkler,Paavilainen, & Niiiitiinen, 1992). The lack of the latencyeffect suggests that MMN latency is affected by physicalseparation, but not by discriminability in general (eventhough the amount of deviation is a factor of discriminability).
The present MMN results from backward masking arein agreement with two-trace models of auditory sensorymemory, suggesting that the immediate effect of a soundis the development of a trace that decays rapidly and canbe overwritten by the next sound if it occurs in close succession (for a review, see Cowan, 1984). In the absenceof the next sound, this initial trace is converted into a morestable form of storage that consecutive stimuli can only
REFERENCES
ALHO, K., SAMS, M., PAAVILAINEN, P., REINIKAINEN, K., &
NAATANEN, R. (1989). Event-related brain potentials reflecting processing of relevant and irrelevant stimuli during selective listening.Psychophysiology, 26, 514-528.
ALHO, K., WOODS, D. L., AWAZI, A., & NAATANEN, R. (1992). Intermodal selective attention: II. Effects of attentionalload on processingof auditory and visual stimuli in central space. Electroencephalography & Clinical Neurophysiology, 82, 356-368.
COWAN, N. (1984). On short and long auditory stores. PsychologicalBulletin, 96, 341-370.
COWAN, N. (1988). Evolving conceptions of memory storage, selective attention, and their mutual constraints within the humaninformation-processing system. Psychological Bulletin, 104, 163-191.
DIXON, W. J. (1985). BMDP Statistical Software manual. Berkeley:University of California Press.
FOYLE, D. C., & WATSON, C. S. (1984). Stimulus-based versusperformance-based measurement of auditory backward recognitionmasking. Perception & Psychophysics, 36, 515-522.
GIARD, M.-H., PERRIN, F., PERNIER, J., & BOUCHET, P. (1990). Braingenerators implicated in processing of auditory stimulus deviance: Atopographic event-related potential study. Psychophysiology, 27,627-640.
HARJ, R., HAMALAINEN, M., ILMONIEMI, R., KAUKORANTA, E.,REINIKAINEN, K., SALMINEN, J., ALHO, K., NAATANEN, R., &
SAMS, M. (1984). Responses of the primary auditory cortex to pitchchanges in a sequence of tone pips: Neuromagnetic recordings in man.Neuroscience Letters, SO, 127-132.
HAWKINS, H. L., & PRESSON, J. C. (1986). Auditory information processing. In K. R. Boff, L. Kaufman, & J. P. Thomas (Eds.), Handbook ofperception and human performaru:e (pp. 26.1-26.64). NewYork: Wiley.
MANTYSALO, S., & NAATANEN, R. (1987). The duration of a neuronaltrace of an auditory stimulus as indicated by event-related potentials.Biological Psychology, 24, 183-195.
MASSARO, D. W. (1976). Auditory information processing. In W. K.Estes (Ed.), Handbook oflearning and memary (pp. 275-320). Hillsdale, NJ: Erlbaum.
MASSARO, D. W., COHEN, M. M., & IDSON, W. L. (1976). Recognition masking of auditory lateralization and pitch judgments. Journalof the Acoustical Society of America, 59, 434-441.
NAATANEN, R. (1985). Selective attention and stimulus processing:Reflections in event-related potentials, magnetoencephalogram, andregional cerebral blood flow. In M. I. Posner & O. S. M. Marin(Eds.), Attention and performance Xl (pp. 355-373). Hillsdale, NJ:Erlbaum.
ERPs REFLECf TRACES OF ECHOIC MEMORY 449
NAATANEN, R. (1990). The role of attention in auditory informationprocessing as revealed by event-related potentials and other brain measures of cognitive function. Behavioral & Brain Sciences, 13,201-288.
NAATANEN, R. (1992). Attention and brain function. Hillsdale, Nl:Erlbaum.
NAATANEN, R., 8< GAILLARD, A. W. K. (1983). The orienting reflexand the N2 deflection of the ERP. In A. W. K. Gaillard & W. Ritter(Eds.), Tutorials in event-related potential research: EndogerUJus components (pp. 119-141). Amsterdam: Elsevier.
NAATANEN, R., PAAVILAINEN, P., ALHO, K., REINIKAINEN, K., &
SAMS, M. (1989). Do event-related potentials reveal the mechanismof the auditory sensory memory in the human brain? NeuroscienceLetters, 98, 217-221.
NAATANEN, R., SAMS, M., JARVI LEHTO, T., & SOININEN, K. (1983).Probability of deviant stimulus and event-related brain potentials. InR. Sinz & M. R. Rosenzweig (Eds.), Psychophysiology 1980(pp. 397-405). lena: VEB Gustav Fischer Verlag; Amsterdam:Elsevier Biomedical.
SAMS, M., ALHO, K., 8< NAATANEN, R. (1983). Sequential effects inthe ERP in discriminating two stimuli. Biological Psychology, 17,41-58.
SAMS, M., ALHO, K., 8< NAATANEN, R. (1984). Short-term habituation and dishabituation of the mismatch negativity of the ERP. Psychophysiology, 21, 434-441.
WINKLER, 1.,8< NAATANEN, R. (1992). Event-related potentials in auditory backward recognition masking: A new way to study the neurophysiological basis of sensory memory in humans. Neuroscience Letters, 140, 239-242.
WINKLER, I., PAAVILAINEN, P., ALHO, K., REINIKAINEN, K.,SAMS, M., & NAATANEN, R. (1990). The effect of small variationof the frequent auditory stimulus on the event-related brain potentialto the infrequent stimulus. Psychophysiology, 27, 228-235.
WINKLER, I., PAAVILAINEN, P., 8< NAATANEN, R. (l992). Can echoicmemory store two traces simultaneously? A study of event-relatedbrain potentials. Psychophysiology, 29, 337-349.
NOTES
I. In backward masking, the MMN scalp distribution was significantlymore frontal than that ofNI at the largest intertone interval (400 msec).In a two-factor analysis of variance (MMN vs. NI x Fz vs. Cz) theinteraction between the factors was significant [F(I,9) = 6.80, p <.0284], whereas none of the main effects were. Because MMN waspresent in the responses of all subjects, both subject grOllps (ceiling effectand no ceiling effect) were included in this analysis.
2. Scheffe-type pairwise comparisons showed that the differencebetween ERPs to deviants and to standards in the MMN interval wassignificantly larger for the blocks with 150-,300-, and 400-msec intertoneintervals than for the blocks with 5O-msec intertone intervals [F(3, 12) =4.62, p < .05; F(3, 12) = 4.47, p < .05; and F(3,12) = 7.39, p <.01, respectively] and for the blocks with 4OO-msec intertone intervalsthan for those with 20-msec intervals [F(3,12) = 3.61, p < .05).
3. The recognition rate of deviants followed by 150-, 300-, and 400msec intertone intervals was higher than that of deviants followed byintervals of 20 or 50 msec [e.g., Scheffe-type pairwise comparisons forthe percentage of correct responses between 50- and I50-msec blocks
and between 20- and 400-msec blocks: F(3,12) = 3.74, P < .05, andF(3,12) = 11.70, p < .01, respectively).
4. A comparison of Tables I and 2 shows that considerably largerMMN amplitudes were measured for subjects in the no<eiling-effectgroup, together with performance levels lower than those in the ceilingeffect group. This is due to the large interindividual variability of theMMN amplitude (see, e.g., Winkler & Niiiitiinen, 1992, Figure 3) causedby (at least partially) anatomical differences controlling the location anddirection of the MMN generators in the auditory cortex. Because of thisfact, the relationship between MMN amplitude and performance in recognition masking can only be studied within subjects (as is done in thisstudy) and not between small grOllp5 of subjects. Note also that the MMNamplitude level is stable within subjects (e.g., compare the MMNamplitudes of Tables 2 and 3).
5. The scalp distribution of the present MMN component was significantly anterior to that of N I at the largest intertone interval (400 msec)of forward masking. In a two-factor analysis of variance (MMN vs.N I x Fz vs. Cz) the interaction between the factors was significant[F(lA) = 27.85,p < .0062), whereas none of the main effects were.
6. Scheffe-type pairwise comparisons showed that deviants followinga 150- or 300-msec intertone interval elicited a larger MMN than didthose following a 20-msec interval [F(3,12) = 4.54, P < .05, andF(3,12) = 5.86, p < .05, respectively).
7. The recognition rate of deviants for the 20-msec intertone intervalwas lower than that for any other interval, and the recognition rate forthe 50-msec interval was lower than that for the 300-msec interval[Scheffe-type pairwise comparisons for the percentage of correct responses between, e.g., 20- and 50-msec blocks and between 50- and300-msecblocks:F(3,12) =5.79,p < .05,andF(3,12) =3.63,p <.05, respectively).
8. The similar effect of the intertone interval on the MMN amplitudeand recognition performance could also be explained by assuming thatMMN reflects the process of sensory-information extraction (and notthe resulting memory trace). However, other features of the MMN component rule out this possibility. Niiiitiinen et al. (1983) found that theMMN amplitude decreases with increasing deviant-stimulus probabilities (all other parameters held constant; only the ratio of standard vs.deviant stimulus presentation was varied). While there is no reason toassume that the sensory feature analysis of the standard becomes lesscomplete with increasing deviant probabilities, the attenuation of theMMN amplitude can be explained by weaker memory traces (due toless frequent repetition of the standard).
9. Although the intertone interval might affect the refractory effectof the masker tone on the test stimuli in general, there is no reason tobelieve that this effect shOllld be stronger for standards than for deviants.Therefore, the present results contradict the "release from refractoriness"explanation of the MMN elicitation.
10. Because of the constant 850-msec interval between the onsets ofconsecutive test-masker stimulus pairs, 400- and 300-msec intertoneintervals in forward masking can be interpreted as 370- and 470-msecintertone intervals of backward masking (test- and masking-tone durationsof 25 and 55 msec should also be taken into account).
(Manuscript received October I, 1991;revision accepted for publication September 25, 1992.)
Related Documents