Effects of high and low glycemic load meals on energy intake, satiety and hunger in obese Hispanic American youth Nazrat M. Mirza, MD, ScD 1,3 , Catherine J. Klein, PhD, RD 1 , Matilde G. Palmer 1 , Robert McCarter, ScD 1 , Jianping He, MS 1 , Cara B. Ebbeling, PhD 2 , David S. Ludwig, MD, PhD 2 , and Jack A. Yanovski, MD, PhD 3 1 Children's National Medical Center, Washington, DC 2 Children's Hospital, Boston, MA 3 Unit on Growth and Obesity, Program in Developmental Endocrinology and Genetics, Eunice Kennedy Shriver National Institute of Child Health and Human Development (NICHD), National Institutes of Health, Department of Health and Human Services, Bethesda, MD Abstract Some short-term pediatric studies have suggested beneficial effects of low glycemic load (LGL) meals on feelings of hunger and on energy intake. No systematic studies of the effects of LGL diets have been conducted in obese US Hispanic children even though Hispanic children have a particularly high prevalence of obesity and thus stand to benefit from successful interventions. Objective—To examine the effects of LGL and high-GL (HGL) meals on appetitive responses and ad libitum energy intake of obese Hispanic youth. Methods—88 obese Hispanic youth ages 7-15y were randomly assigned to consume meals designed to be either LGL (n=45) or HGL (n=43). Following the morning test meal, subjects serially reported hunger, fullness, and satiety using a visual analog scale and provided samples for analysis of serum insulin and plasma glucose. Participants were then fed another test meal and given a snack platter from which to eat ad libitum. Energy, macronutrients, and glycemic load (GL) of consumed foods were calculated for each meal. Results—Subjects in the HGL group had significantly higher insulin (p=0.0005) and glucose (p=0.0001) responses to the breakfast meal compared to the LGL group. However, there were no significant between-group differences in the total energy consumed from the snack platter (1303 vs. 1368 kcal, p=0.5), or in the subjective feelings of hunger (p=0.3), fullness (p=0.5) or satiety (p=0.3) between the two groups. Conclusions—Our study provides no evidence that, for obese Hispanic youth, changing the GL of the diet affects short-term hunger, fullness, satiety, or energy intake. Keywords obese; Hispanic youth; glycemic load; food intake; hunger; satiety; fullness Introduction The prevalence of obesity and its complications is high among Hispanic American children and adolescents. In the most recent NHANES data, 23.2% of Hispanic American children Address correspondence to: Nazrat Mirza, MD, ScD Department of Pediatrics, Children's National Medical Center Washington, DC, 20010 TEL: 202-476-2529 FAX: 202-476-3386 [email protected]. NIH Public Access Author Manuscript Int J Pediatr Obes. Author manuscript; available in PMC 2011 July 2. Published in final edited form as: Int J Pediatr Obes. 2011 June ; 6(2-2): e523–e531. doi:10.3109/17477166.2010.544740. NIH-PA Author Manuscript NIH-PA Author Manuscript NIH-PA Author Manuscript

Welcome message from author
This document is posted to help you gain knowledge. Please leave a comment to let me know what you think about it! Share it to your friends and learn new things together.
Transcript
Effects of high and low glycemic load meals on energy intake,satiety and hunger in obese Hispanic American youth
Nazrat M. Mirza, MD, ScD1,3, Catherine J. Klein, PhD, RD1, Matilde G. Palmer1, RobertMcCarter, ScD1, Jianping He, MS1, Cara B. Ebbeling, PhD2, David S. Ludwig, MD, PhD2, andJack A. Yanovski, MD, PhD3
1Children's National Medical Center, Washington, DC2Children's Hospital, Boston, MA3Unit on Growth and Obesity, Program in Developmental Endocrinology and Genetics, EuniceKennedy Shriver National Institute of Child Health and Human Development (NICHD), NationalInstitutes of Health, Department of Health and Human Services, Bethesda, MD
AbstractSome short-term pediatric studies have suggested beneficial effects of low glycemic load (LGL)meals on feelings of hunger and on energy intake. No systematic studies of the effects of LGLdiets have been conducted in obese US Hispanic children even though Hispanic children have aparticularly high prevalence of obesity and thus stand to benefit from successful interventions.
Objective—To examine the effects of LGL and high-GL (HGL) meals on appetitive responsesand ad libitum energy intake of obese Hispanic youth.
Methods—88 obese Hispanic youth ages 7-15y were randomly assigned to consume mealsdesigned to be either LGL (n=45) or HGL (n=43). Following the morning test meal, subjectsserially reported hunger, fullness, and satiety using a visual analog scale and provided samples foranalysis of serum insulin and plasma glucose. Participants were then fed another test meal andgiven a snack platter from which to eat ad libitum. Energy, macronutrients, and glycemic load(GL) of consumed foods were calculated for each meal.
Results—Subjects in the HGL group had significantly higher insulin (p=0.0005) and glucose(p=0.0001) responses to the breakfast meal compared to the LGL group. However, there were nosignificant between-group differences in the total energy consumed from the snack platter (1303vs. 1368 kcal, p=0.5), or in the subjective feelings of hunger (p=0.3), fullness (p=0.5) or satiety(p=0.3) between the two groups.
Conclusions—Our study provides no evidence that, for obese Hispanic youth, changing the GLof the diet affects short-term hunger, fullness, satiety, or energy intake.
Keywordsobese; Hispanic youth; glycemic load; food intake; hunger; satiety; fullness
IntroductionThe prevalence of obesity and its complications is high among Hispanic American childrenand adolescents. In the most recent NHANES data, 23.2% of Hispanic American children
Address correspondence to: Nazrat Mirza, MD, ScD Department of Pediatrics, Children's National Medical Center Washington, DC,20010 TEL: 202-476-2529 FAX: 202-476-3386 [email protected].
NIH Public AccessAuthor ManuscriptInt J Pediatr Obes. Author manuscript; available in PMC 2011 July 2.
Published in final edited form as:Int J Pediatr Obes. 2011 June ; 6(2-2): e523–e531. doi:10.3109/17477166.2010.544740.
NIH
-PA Author Manuscript
NIH
-PA Author Manuscript
NIH
-PA Author Manuscript
and adolescents were reported as having BMI≥95th percentile for age and sex, an 80%higher prevalence compared to non-Hispanic White children and adolescents (1). ObeseHispanic Americans have also been shown to have a high prevalence of obesity associatedco-morbidities, including hyperinsulinemia and impaired glucose tolerance (2,3).
A low glycemic index (LGI) or low glycemic load (LGL) diet has been suggested as analternate dietary intervention for the treatment of obesity that could also help prevent thedevelopment of impaired glucose homeostasis (4-6). The glycemic index (GI) of a test foodis defined as the glucose area under the curve (AUC) measured for 2 hours afterconsumption of 50 g of carbohydrate from the test food divided by the AUC afterconsumption of 50 g of carbohydrate from a standard food, either white bread or glucose (7).Glycemic load (GL) is the product of glycemic index and the carbohydrate content in thefood item. Hence GL is a measure of carbohydrate bioavailability that takes into account thequantity consumed.
Consumption of LGL foods are expected to result in a reduced postprandial rise of insulin(8), thus altering availability of metabolic fuels after a meal (4,5,9). After a high-glycemicindex (HGI) / high glycemic load (HGL) meal, blood glucose and insulin levels initially risemuch higher than after a LGI/LGL meal (5). High levels of insulin result in stimulation ofcellular nutrient uptake, inhibition of hepatic glucose production, and suppression oflipolysis (4,6). Subsequent declines in blood glucose concentration induced by the relativehyperinsulinemia of a HGI diet have been proposed to result in excessive hunger andovereating (4). HGI diets have therefore been hypothesized to promote excessive weightgain (4,5).
Some short-term pediatric studies have shown beneficial effects of LGI /LGL compared toHGI/HGL meals on hunger, satiety, and voluntary food intake (5,10). Because of its salutaryeffects on postprandial hyperinsulinemia, a LGL diet might be hypothesized to be especiallyuseful in obese Hispanic youth for whom the prevalence of hyperinsulinemia, insulinresistance and type 2 diabetes is particularly high (2,11-15). However, there are nopublished data examining the effects of LGL meals on appetitive responses in Hispanicchildren.
The objective of this study was to compare the subjective, hormonal, and metabolicresponses of obese Hispanic youth to consumption of LGL and HGL meals undercontrolled, standardized conditions. We hypothesized that compared to the group fed HGLmeals, the LGL group would have significantly lower glucose and lower insulin responses,the LGL group would report less hunger before their meals and greater satiety after theirmeals, and, as a result, the LGL group would consume less energy from a post-meal adlibitum snack platter.
MethodsSetting and Participants
Participants were enrolled in an obesity intervention study, and had completed 12-weeks ofthe comprehensive program. The intervention was a community-based multidisciplinaryweight loss program that consisted of dietary instructions, physical activity, and parentingsessions. The model of delivery included weekly individual and group counseling sessions.
Participants were recruited through advertising at community facilities in Washington, DC.Latino children ages 7 to 15 years with BMI ≥ 95th percentile for age and sex, who wereotherwise healthy were eligible. Latino ethnicity was determined by parents, who identifiedthemselves, their spouses and both sets of grandparents with the Hispanic or Latino cultural
Mirza et al. Page 2
Int J Pediatr Obes. Author manuscript; available in PMC 2011 July 2.
NIH
-PA Author Manuscript
NIH
-PA Author Manuscript
NIH
-PA Author Manuscript
group. All participants had a physical examination with assessment of pubertal developmentat recruitment. Exclusion criteria were any known medical condition or use of medicationsthat would interfere with study objectives or procedures.
The study was approved by the Children's National Medical Center (CNMC) InstitutionalReview Board. Written consent was obtained from parents of participating children andsigned assent from the children and adolescents.
Meal Study DesignA randomized parallel meal study design was adapted from Ludwig et al (5) which requiredone 24-hour admission for each participant. Participants were randomly assigned toconsume a series of three meals designed to be either LGL or HGL.
Participants were instructed not to eat after 2:00 pm on the day of admission and wereadmitted to the CNMC General Clinical Research Center (GCRC) between 5:30 and 6:00PM.
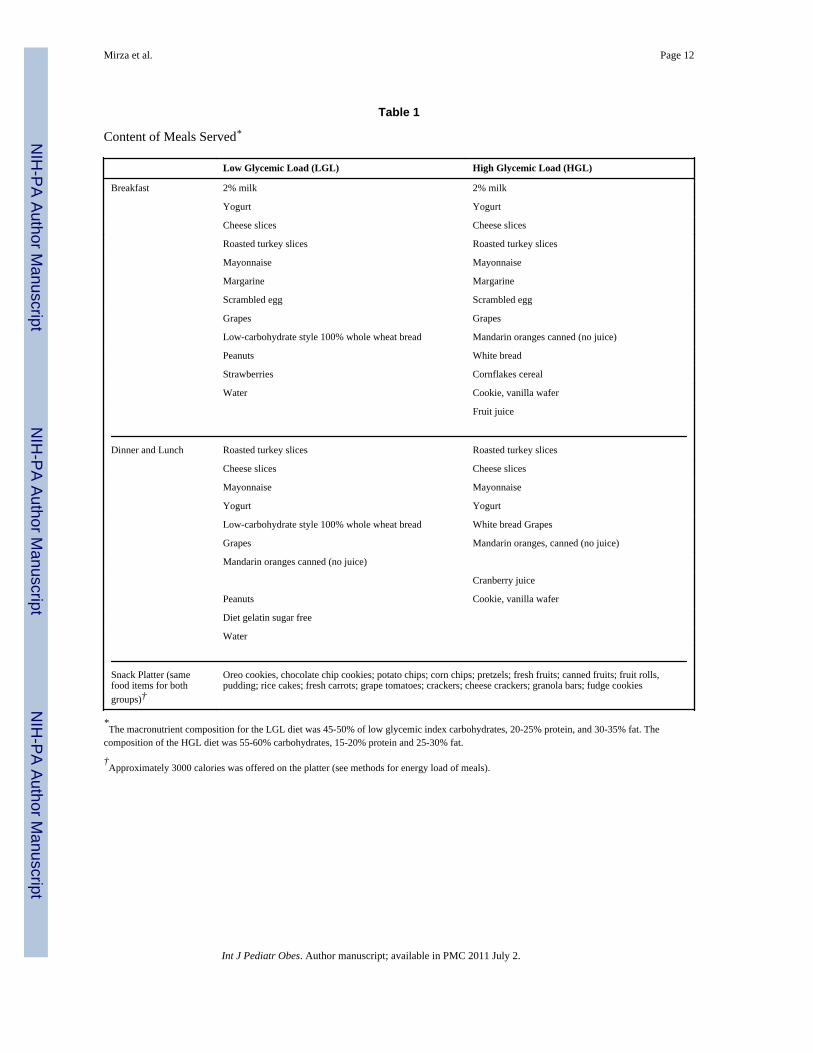
Dinner (the first randomized meal) was served at 6:15 PM and completed by 7:00 PM(Table 1). During all test meals, no distractions, television or talking was permitted. Afterdinner, the subject could drink water but no food or other beverages. Participants were thenfamiliarized with a “hunger and satiety assessment tool,” which consisted of a series ofvisual analog scales asking “how hungry do you feel right now?”, “how full do you feelright now?”, and “how much food could you eat right now?” The scales were based onpreviously used tools (16-19). Participants were required to be in bed by 9:30 PM.
Participants were awakened the following morning between 6:00 and 6:15 AM. They wereasked to void and change into a hospital gown and undergarments. Height was measuredusing a wall-mounted stadiometer (SECA 216, Hanover, MD). Weight was measured on adigital scale (Healthometer, Bridgeview, IL). Body mass index (BMI) was calculated as kg/m2. Total body fat mass was assessed by air displacement plethysmography (LifeMeasurement Inc., Concord, Ca) as previously described (20).
A peripheral indwelling venous catheter was placed at 7 AM and fasting baseline seruminsulin and plasma glucose were measured. Participants then completed the hunger andsatiety assessment tool and were given either an LGL or HGL breakfast (meal 2) between7:30 and 8:30AM depending on their random assignment. The participants were instructedto complete their breakfast within 15 minutes. The hunger and satiety assessment tool wascompleted every 30 minutes for the next 5 hours until lunch. Blood samples were drawn at30, 60, 120, and 300 minutes for serum insulin and plasma glucose. Five hours afterbreakfast, the intravenous catheter was removed, and the third test meal was given for lunch,which was either LGL or HGL depending on the assigned group. Thirty minutes after thetest lunch was consumed, a snack platter was placed in the participant's room. The decisionto have the snack platters in the participant's rooms at a set time instead of waiting for theparticipants to request the platters as in some previous pediatric studies (5,10) was based onthe younger age and ethnicity of our study subjects. Due to the relatively unassertive natureand unquestioning respect for authority, or respeto, (21) considered a core value in manyLatino families, it was felt that the subjects would be unlikely to request additional food inan unfamiliar hospital environment. Subjects were instructed to eat as much as they likedfrom the platter if they felt hungry. The platter contained identical items for both groups(Table 1). Participants could request additional servings of the food items. Five hours post-lunch, participants completed their final hunger and satiety assessment tool and weredischarged from the study.
Mirza et al. Page 3
Int J Pediatr Obes. Author manuscript; available in PMC 2011 July 2.
NIH
-PA Author Manuscript
NIH
-PA Author Manuscript
NIH
-PA Author Manuscript
Composition of Study MealsAll food and beverage items planned for each meal were weighed on a digital food scale(Tanita 1140, Arlington Heights, IL) to the nearest gram to achieve four specific andstandardized goals: (1) total energy intake, (2) distribution of energy across the test meals,(3) distribution of macronutrient energy within each meal, and (4) the randomized test GL.The total energy for the three meals was designed to provide 1.2 times each participant'sresting energy expenditure, estimated using the Harris Benedict energy equations (22). Totalenergy intake was distributed, approximately 35% at meal 1 (dinner), 30% at meal 2(breakfast), and 35% at meal 3 (lunch). For each meal served (except for the ad libitumsnack platter), the goal was to provide meal GL of less than 50 (g/1000 Kcal) for the LGLgroup and above 80 (g/1000 Kcal) for the HGL group. The macronutrient composition forthe LGL diet was 45-50% of LGI carbohydrates, 20-25% protein, and 30-35% fat. Thecomposition of the HGL diet was 55-60% carbohydrates, 15-20% protein and 25-30% fat.Participants were asked to consume all the food provided for each test meal.
The foods offered were intended to contain many similar items for the LGL and HGLgroups as well as some items that differed greatly in GI. The same menu was served fordinner and lunch (Table 1). The ad libitum snack platter consisted of commonly availablesnack foods such as fruits, vegetables, cookies and chips (Table 1). Any left-over food wasweighed. Dietary analysis was performed using Nutritionist Pro software (version 4.2,Axxya System, Stafford, TX). GI and GL were calculated using the International Table ofGlycemic Index and Load for glucose (23).
Blood AnalysisSerum insulin concentrations were measured by a solid-phase, 2-site chemiluminescentimmunometric assay (Immulite 2000 Analyzer, Diagnostic Products, Los Angeles, CA).Plasma glucose was collected in tubes containing a glycolytic inhibitor and measured by thehospital laboratory using the hexokinase-glucose-6-phosphate dehydrogenase method (DadeBehring Inc, Deerfield, IL).
Statistical MethodsA sample size of 88 children was calculated to provide 80% statistical power to detect a 200kcal (0.4 standard deviation) difference in energy consumption between the two dietarygroups with the 2-tailed type 1 error set at p=.05.
Analysis was performed using SAS (SAS 9.1 version, SAS Institute Inc, Cary, NC) andStata® (version 10, StataCorp, College Station, TX). The group difference in energyconsumption from the ad libitum snack platter was the primary outcome variable used toassess the effects of the dietary treatment modalities. The secondary outcome variables weredifferences in insulin and glucose response to the test breakfast meal and the differences insubjective feelings of hunger, satiety and fullness following the test breakfast meal. Thedifferences between treatment groups were assessed using longitudinal analysis controllingfor baseline values. Incremental areas under the glycemic and insulin response curves werecalculated using the pkcollapse method in Stata®.
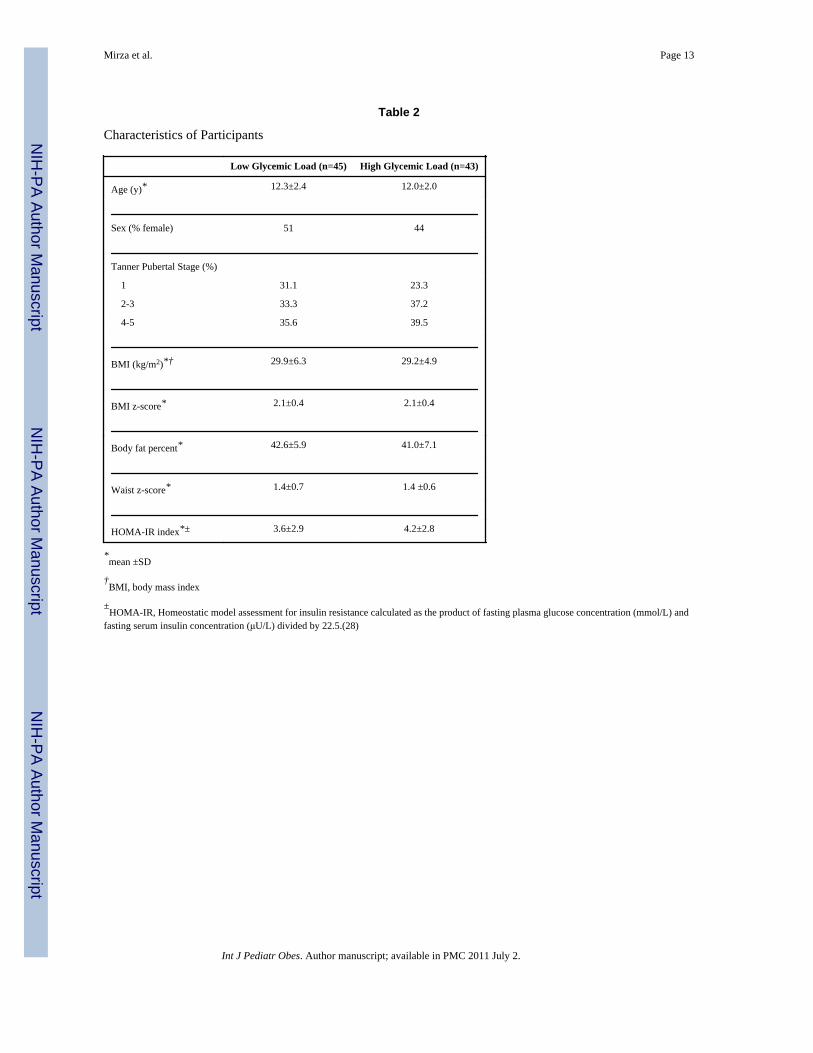
ResultsA total of 88 participants were enrolled, 45 in the LGL and 43 in the HGL group (Table 2).The groups were similar in age, sex, pubertal stage, body composition, and degree of insulinresistance. All enrolled participants completed the study.
Mirza et al. Page 4
Int J Pediatr Obes. Author manuscript; available in PMC 2011 July 2.
NIH
-PA Author Manuscript
NIH
-PA Author Manuscript
NIH
-PA Author Manuscript
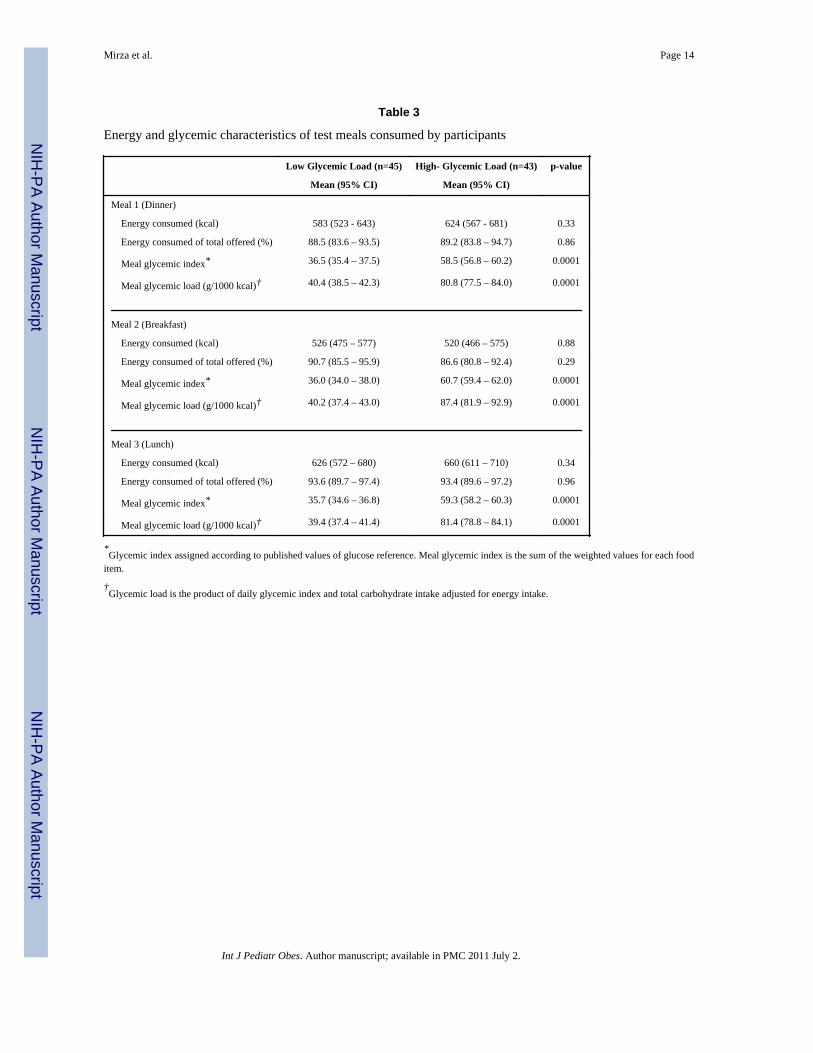
Table 3 provides the energy, the GI and GL for the test meals consumed by subjects. Therewere no significant between-group differences in the total energy consumed at any of the 3meals, either in absolute terms or as a percentage of the subject-specific energy quantitiesoffered at each meal (Table 3). As intended, the meals consumed by the LGL group, hadsignificantly lower GI and GL than the meals consumed by the HGL group.
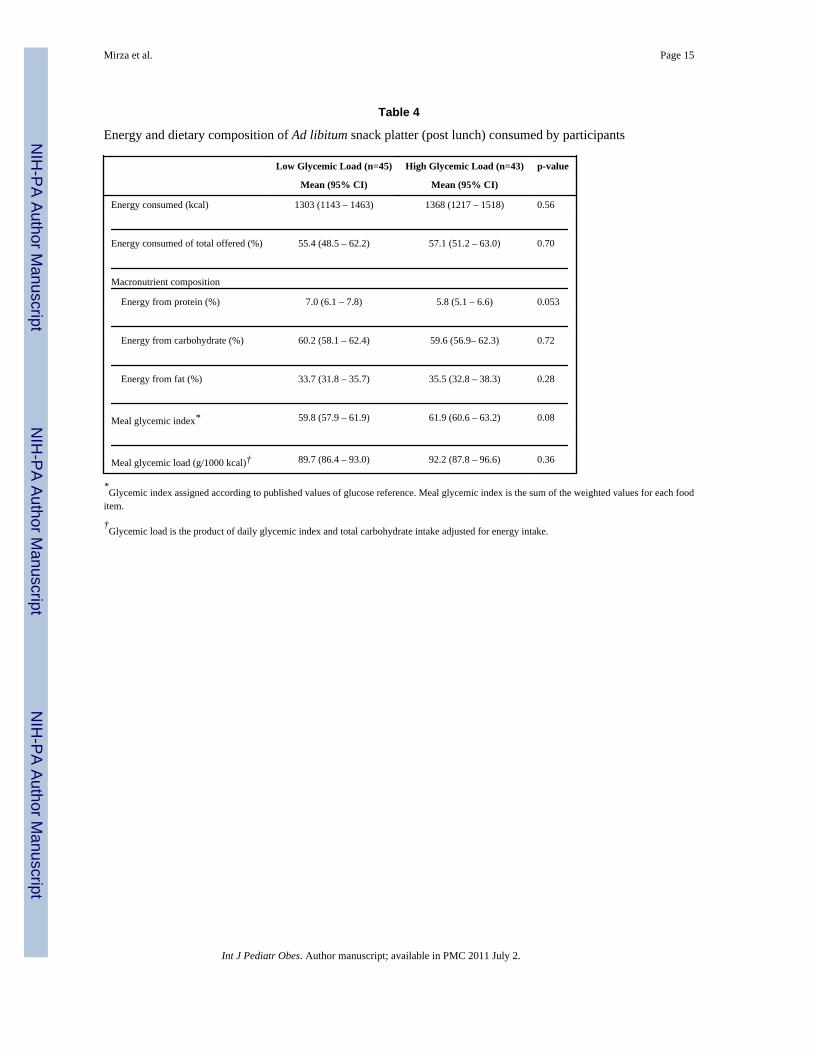
Energy consumption during the ad libitum snack platter is shown in Table 4. There were nosignificant between-group differences in the total energy consumed from the ad libitumsnack platter. A trend in higher protein consumption was observed in the LGL group (Table4).
Participant's ratings of hunger, fullness and satiety are shown in Figure 1. There were nosignificant differences in the reported hunger rating (34.2 mm, CI 30.4 to 38.1 mm for LGLvs. 31.2 mm, CI 27.3 to 35.2 mm for HGL, p=0.3), fullness rating (31.3 mm, CI 27.0 to 35.5mm for LGL vs. 29.3 mm, CI 24.9 to 33.7 mm for HGL, p=0.5), or satiety rating (36.9 mm,CI 33.1 to 40.6 mm for LGL vs. 33.9 mm, CI 30.1 to 37.8 mm for HGL, p=0.3), between thetwo dietary groups in the time interval between meal 2 (breakfast) and meal 3 (lunch).Additionally, there were no significant differences at any point in the study or after the adlibitum snack platter in the reported hunger (ß=-2.3, p=0.5), fullness (ß=-0.4, p=0.3), orsatiety (ß=-4.3, p=0.2) ratings between the two dietary groups.
Insulin and glucose responses following the breakfast meal are shown in Figure 2.Participants in the HGL group had significantly higher glucose response to their breakfasttest meal compared to the LGL group (28548 mg·min/dL, CI 27771 to 29324 mg·min/dL vs.26297 mg·min/dL, CI 25678 to 26915 mg·min/dL, p=0.0001), indicating that the intendeddifference in glycemic profile for the LGL and HGL groups was achieved. The mean plasmaglucose concentration nadirs after the HGL and LGL test meals were not significantlydifferent (6.3 mg/dL below baseline vs. 4.5 mg/dL below baseline; p=0.3). Insulin responsewas significantly higher in the HGL group than the LGL group after the breakfast test meal(17331 μIU·min/mL, CI 14198 to 20776 μIU·min/mL vs. 10021 μIU·min/mL, CI 7726 to12615 μIU·min/mL, p=0.0001).
Adverse eventsno adverse events were reported.
DiscussionTo our knowledge, the present investigation is the first to report the short-term effects ofLGL meals in obese Latino children and adolescents. The purpose of this study was toexamine the metabolic, hormonal, and appetite responses of obese Latino youth to a LGL ora HGL meal. The HGL and LGL meals in our study were carefully constructed to becomparable in palatability, and to consist of food items with which participants werefamiliar.
Contrary to our hypotheses, we found no significant differences between the LGL and HGLgroups in the energy consumed from the post-lunch ad libitum snack platter. Neither thepercentage of energy consumed from the total offered at each of the three randomized meals,nor the cumulative energy consumption over the entire study were significantly differentbetween the two groups. We also found no significant differences in the reported perceptionof hunger, fullness, or satiety between the two dietary groups. Several adult (4) and twopediatric (5,10) studies reported decreased hunger, increased satiety, and decreasedvoluntary intake in response to LGI/LGL meals. Ludwig et al (5) reported significantlyhigher ratings of hunger and greater ad libitum energy intake after a HGI meal in a
Mirza et al. Page 5
Int J Pediatr Obes. Author manuscript; available in PMC 2011 July 2.
NIH
-PA Author Manuscript
NIH
-PA Author Manuscript
NIH
-PA Author Manuscript
randomized crossover study comparing HGI and LGI meals in 12 adolescent boys. Ball et al(10) reported a 48-minute prolongation of satiety after a LGI versus a HGI supplement in asimilar crossover study of 16 adolescents, but found no differences in hunger ratings orchanges in actual energy intake. Such crossover meal studies have the advantages of awithin-subjects design that controls for many extraneous factors that may complicate humanstudies. However, because the actual characteristics of the foods or supplements consumedduring both conditions are experienced by subjects, such studies may be affected bycarryover effects. In addition, it is conceivable that subjects in the crossover studies aremore likely than in parallel designs to compare the items consumed under the two conditionsand respond to the demand characteristics of the experiment so as to seek to confirm whatthey believed were the investigator's hypotheses. The present study, which used arandomized, between-subjects design, would be anticipated to be less susceptible to suchconfounding.
Other possible explanations for the negative findings observed in the present study and thepositive findings of other pediatric investigations (5,10) include differences in studypopulation and other design considerations. All our study participants considered themselvesHispanic, whereas predominantly Caucasian youth participated in the previous studies. It isconceivable that the degree of baseline insulin resistance was greater in our cohort and couldhave blunted the impact of differences in meal GL. Diet-phenotype interactions have beenreported in some earlier studies (24,25). The participants in our study were also somewhatyounger, with a mean age of 12 years compared to a mean age of 16 years in Ludwig et al(5) and 14 years in Ball et al (10). Another distinction between the current study and the twoprevious pediatric studies lies in the presentation of the ad libitum platters to theparticipants. In the earlier studies, adolescents had to request a platter, an approach intendedto give them the opportunity to pay attention to their internal hunger cues. In the currentstudy, the platters were left in the participants’ rooms 30-minutes post-lunch withoutrequiring a request for food. It is conceivable that participants may have consumed what wasgiven to them without necessarily feeling hungry. The composition of the ad libitum snackplatter was also different from the two earlier pediatric studies. It consisted of food itemsconsidered highly palatable and familiar to the study participants. One possible explanationfor our findings is that our toxic food environment may so dominate eating behavior thataltering factors such as the GI of prior meals may have little effect for those exposed to thehighly palatable foods found in many households.
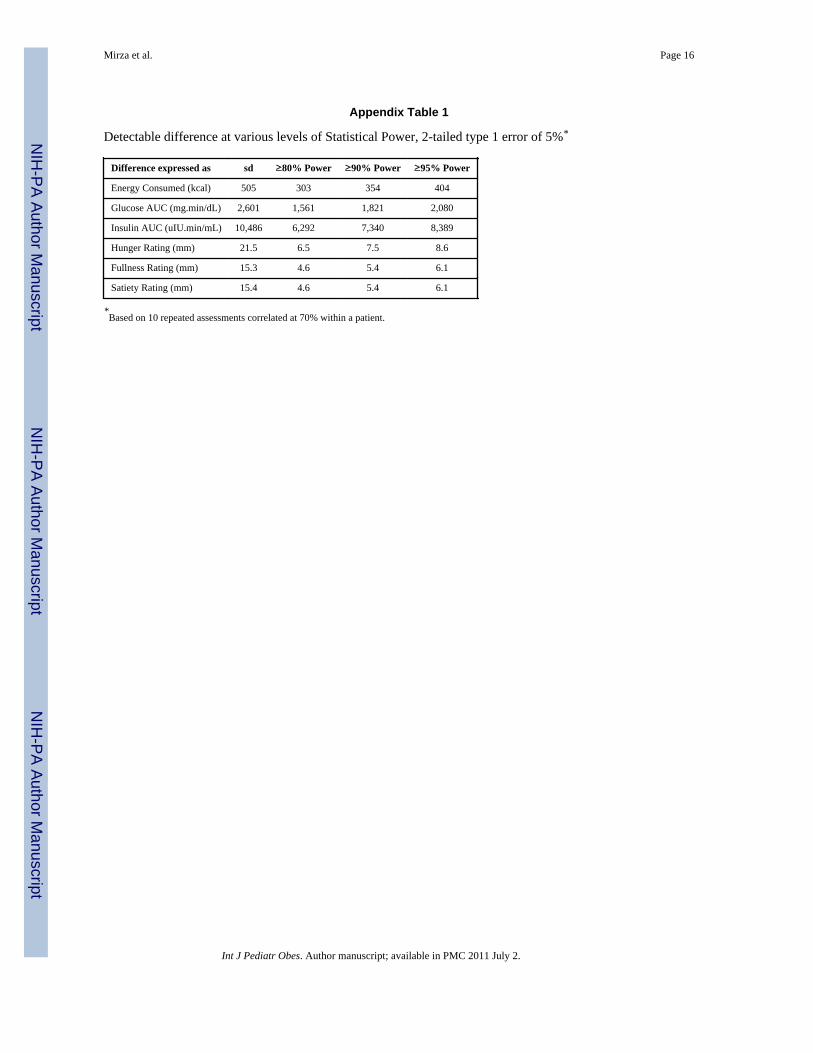
Finally, although the current study was adequately powered to find the previously reported(5) differences in energy intake, it was not powered to detect small energy differences.Appendix Table 1 shows the energy differences that would have been detectable betweenthe two groups in the present study of 88 subjects at 80%, 90%, and 95% power. The LGLgroup consumed only 5% less energy than the HGL group in contrast to the 81% greaterenergy consumption in the HGI group reported by Ludwig et al (5). Based on the largestandard deviation for energy intake from the ad libitum snack platter, a sample size of 1906participants would have been required to detect the observed 5% difference in intake with80% power (26). Large standard deviations in parallel-design studies of this nature reflectthe large inter-individuals differences in metabolic requirements and feeding behavioramong a heterogeneous population.
Consistent with findings from other laboratory studies (10,17), the obese youth in thepresent investigation consumed large quantities of food from the post-lunch snack platterdespite consuming adequate energy at lunch for metabolic needs, demonstrating thatdeficiencies in meal intake regulation are common in obese children. In addition to thephysiologic factors regulating the desire to eat, however, it is important to note that hungerand satiety may be affected by learned behaviors (27). It is possible that obese study
Mirza et al. Page 6
Int J Pediatr Obes. Author manuscript; available in PMC 2011 July 2.
NIH
-PA Author Manuscript
NIH
-PA Author Manuscript
NIH
-PA Author Manuscript
participants have also learned to override their internal hunger and satiety cues. It has beensuggested that the desire to eat is regulated more by external cues than by actual hunger,particularly in obese individuals (27).
Study strengths and limitationsThe strengths of this study include the relatively large sample size, the broad age range ofparticipants that may increase its generalizability, and the well-controlled study design.However the study was carried out only among obese Hispanic youth and was not poweredto detect smaller differences in energy consumption. The sample size however was adequateto detect differences in the appetitive responses between the two dietary groups. Table 1 inthe appendix shows the detectable differences for hunger, fullness, and satiety ratings at80%, 90%, and 95% power. This indicates that the study was capable of detecting quitesmall differences in hunger, fullness, and satiety ratings between the two dietary groups andwould not miss very modest differences in these outcomes. Therefore, it is unlikely that thestudy's failure to detect such differences was due to inadequate power.
ConclusionsIn summary, obese Hispanic youth consuming LGL meals had significantly lower glucoseand insulin responses compared to the HGL group. However, there were no significantdifferences in total energy consumed, or in reports of hunger, satiety or fullness between thetwo dietary groups. We conclude that these data do not support the hypothesis that a LGLdiet suppresses hunger or increases satiety in obese Hispanic children and adolescents. Wehypothesize that the effects of a toxic food environment with exposure to a variety of highfat, high energy palatable foods could potentially overwhelm any biological effects of aLGL diet, hence emphasizing the importance of policies advocating for healthy foodenvironments particularly among underserved minority children.
AcknowledgmentsWe thank the study participants and the staff of the GCRC at Children's National Medical Center. This study wouldnot have been possible without the tireless efforts of our research assistants Fernanda Porto Carreiro, CarolineCollins, and Ana Jaramillo. We thank the research dietitians Amy Schweitzer, MS, RD, Lauren Rhee, RD, MS, fortheir invaluable assistance during the meal studies, Rebecca Murphy, RD, MS, and Amy Trautman, RD for theirassistance with the dietary data analysis.
This research was supported by NIH Grants K23-RR022227 (to N.M.M), MO1-RR-020359 awarded by theNational Center for Research Resources (NCRR, Bethesda, MD) to support the General Clinical Research Center(GCRC) at Children's National Medical Center, and the following foundations and organizations: Consumer HealthFoundation; The Jessie Ball DuPont Foundation; and United Way of the National Capital Area. Dr. Yanovski is aCommissioned Officer in the United States Public Health Service and is supported by the Intramural ResearchProgram of the Eunice Kennedy Shriver National Institute of Child Health and Human Development and theNational Center on Minority Health and Health Disparities of the National Institutes of Health. Dr Ludwig issupported in part by career award K24DK082730 from the National Institute of Diabetes and Digestive and KidneyDiseases. The National Institute of Diabetes and Digestive and Kidney Diseases had no role in the preparation,review, or approval of the manuscript.
References1. Ogden CL, Carroll MD, Curtin LR, Lamb MM, Flegal KM. Prevalence of high body mass index in
US children and adolescents, 2007-2008. JAMA. 2010; 303:242–9. [PubMed: 20071470]2. Williams DE, Cadwell BL, Cheng YJ, et al. Prevalence of impaired fasting glucose and its
relationship with cardiovascular disease risk factors in US adolescents, 1999-2000. Pediatrics. 2005;116:1122–6. [PubMed: 16263998]
3. Goran MI, Ball GD, Cruz ML. Obesity and risk of type 2 diabetes and cardiovascular disease inchildren and adolescents. J Clin Endocrinol Metab. 2003; 88:1417–27. [PubMed: 12679416]
Mirza et al. Page 7
Int J Pediatr Obes. Author manuscript; available in PMC 2011 July 2.
NIH
-PA Author Manuscript
NIH
-PA Author Manuscript
NIH
-PA Author Manuscript
4. Ludwig DS. Dietary glycemic index and obesity. J Nutr. 2000; 130:280S–3S. [PubMed: 10721888]5. Ludwig DS, Majzoub JA, Al-Zahrani A, Dallal GE, Blanco I, Roberts S. High Glycemic Index
Foods, Overeating, and Obesity. Pediatrics. 1999; 103:e26. URL: http://www.pediatrics.org/cgi/content/full/103/3/e26. [PubMed: 10049982]
6. Spieth LE, Harnish JD, Lenders CM, et al. A low-glycemic index diet in the treatment of pediatricobesity. Arch Pediatr Adolesc Med. 2000; 154:947–51. [PubMed: 10980801]
7. Wolever TM, Jenkins DJ, Jenkins AL, Josse RG. The glycemic index: methodology and clinicalimplications. Am J Clin Nutr. 1991; 54:846–54. [PubMed: 1951155]
8. Jenkins DJ, Kendall CW, Augustin LS, et al. Glycemic index: overview of implications in healthand disease. Am J Clin Nutr. 2002; 76:266S–73S. [PubMed: 12081850]
9. Ludwig DS. The glycemic index: physiological mechanisms relating to obesity, diabetes, andcardiovascular disease. JAMA. 2002; 287:2414–23. [PubMed: 11988062]
10. Ball SD, Keller KR, Moyer-Mileur LJ, Ding YW, Donaldson D, Jackson WD. Prolongation ofsatiety after low versus moderately high glycemic index meals in obese adolescents. Pediatrics.2003; 111:488–94. [PubMed: 12612226]
11. Arya R, Blangero J, Williams K, et al. Factors of insulin resistance syndrome--related phenotypesare linked to genetic locations on chromosomes 6 and 7 in nondiabetic Mexican-Americans.Diabetes. 2002; 51:841–7. [PubMed: 11872689]
12. Li C, Ford ES, McGuire LC, Mokdad AH, Little RR, Reaven GM. Trends in hyperinsulinemiaamong nondiabetic adults in the U.S. Diabetes Care. 2006; 29:2396–402. [PubMed: 17065674]
13. Zhang Q, Wang Y, Huang ES. Changes in racial/ethnic disparities in the prevalence of Type 2diabetes by obesity level among US adults. Ethn Health. 2009; 14:439–57. [PubMed: 19360513]
14. Cowie CC, Rust KF, Ford ES, et al. Full accounting of diabetes and pre-diabetes in the U.S.population in 1988-1994 and 2005-2006. Diabetes Care. 2009; 32:287–94. [PubMed: 19017771]
15. Ioannou GN, Bryson CL, Boyko EJ. Prevalence and trends of insulin resistance, impaired fastingglucose, and diabetes. J Diabetes Complications. 2007; 21:363–70. [PubMed: 17967708]
16. Flint A, Raben A, Blundell JE, Astrup A. Reproducibility, power and validity of visual analoguescales in assessment of appetite sensations in single test meal studies. Int J Obes Relat MetabDisord. 2000; 24:38–48. [PubMed: 10702749]
17. Mirch MC, McDuffie JR, Yanovski SZ, et al. Effects of binge eating on satiation, satiety, andenergy intake of overweight children. Am J Clin Nutr. 2006; 84:732–8. [PubMed: 17023698]
18. Misra M, Tsai PM, Mendes N, Miller KK, Klibanski A. Increased carbohydrate induced ghrelinsecretion in obese vs. normal-weight adolescent girls. Obesity (Silver Spring). 2009; 17:1689–95.[PubMed: 19325538]
19. Warren JM, Henry CJ, Simonite V. Low glycemic index breakfasts and reduced food intake inpreadolescent children. Pediatrics. 2003; 112:e414. [PubMed: 14595085]
20. Nicholson JC, McDuffie JR, Bonat SH, et al. Estimation of body fatness by air displacementplethysmography in African American and white children. Pediatr Res. 2001; 50:467–73.[PubMed: 11568289]
21. Marı'n, G.; Marı'n, BV. Research with Hispanic populations. Sage; Newbury Park, CA: 1991.22. Harris, JA.; Benedict, FG. A biometric study of basal metabolism in man. Carnegie Institute;
Washington, DC: 1919.23. Foster-Powell K, Holt SH, Brand-Miller JC. International table of glycemic index and glycemic
load values: 2002. Am J Clin Nutr. 2002; 76:5–56. [PubMed: 12081815]24. Chaput JP, Tremblay A, Rimm EB, Bouchard C, Ludwig DS. A novel interaction between dietary
composition and insulin secretion: effects on weight gain in the Quebec Family Study. Am J ClinNutr. 2008; 87:303–9. [PubMed: 18258618]
25. Ebbeling CB, Leidig MM, Feldman HA, Lovesky MM, Ludwig DS. Effects of a lowglycemic loadvs low-fat diet in obese young adults: a randomized trial. JAMA. 2007; 297:2092–102. [PubMed:17507345]
26. Erdfelder E, Faul F, Buchner A. GPower: A general power analysis program. Behavior ResearchMethods, Instruments, & Computers. 1996; 28:1–11.
Mirza et al. Page 8
Int J Pediatr Obes. Author manuscript; available in PMC 2011 July 2.
NIH
-PA Author Manuscript
NIH
-PA Author Manuscript
NIH
-PA Author Manuscript
27. Tuomisto T, Tuomisto MT, Hetherington M, Lappalainen R. Reasons for initiation and cessationof eating in obese men and women and the affective consequences of eating in everyday situations.Appetite. 1998; 30:211–22. [PubMed: 9573454]
28. Matthews DR, Hosker JP, Rudenski AS, Naylor BA, Treacher DF, Turner RC. Homeostasis modelassessment: insulin resistance and beta-cell function from fasting plasma glucose and insulinconcentrations in man. Diabetologia. 1985; 28:412–9. [PubMed: 3899825]
Mirza et al. Page 9
Int J Pediatr Obes. Author manuscript; available in PMC 2011 July 2.
NIH
-PA Author Manuscript
NIH
-PA Author Manuscript
NIH
-PA Author Manuscript
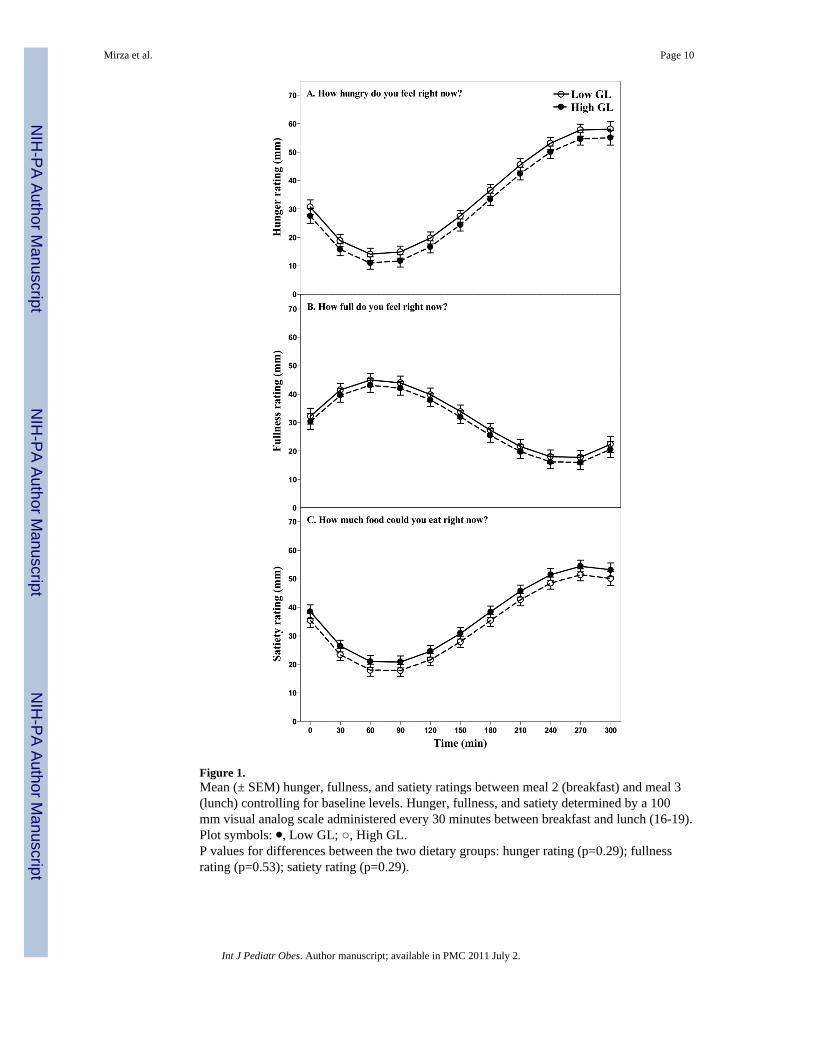
Figure 1.Mean (± SEM) hunger, fullness, and satiety ratings between meal 2 (breakfast) and meal 3(lunch) controlling for baseline levels. Hunger, fullness, and satiety determined by a 100mm visual analog scale administered every 30 minutes between breakfast and lunch (16-19).Plot symbols: ⚫, Low GL; ○, High GL.P values for differences between the two dietary groups: hunger rating (p=0.29); fullnessrating (p=0.53); satiety rating (p=0.29).
Mirza et al. Page 10
Int J Pediatr Obes. Author manuscript; available in PMC 2011 July 2.
NIH
-PA Author Manuscript
NIH
-PA Author Manuscript
NIH
-PA Author Manuscript
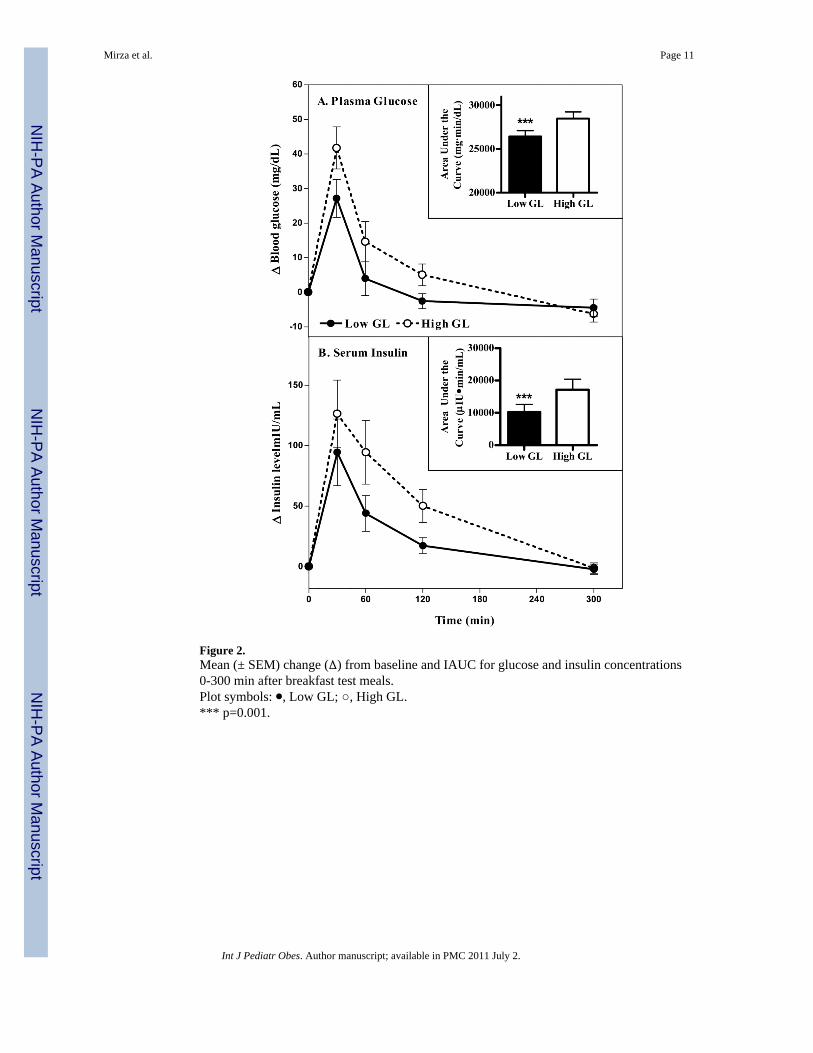
Figure 2.Mean (± SEM) change (∆) from baseline and IAUC for glucose and insulin concentrations0-300 min after breakfast test meals.Plot symbols: ⚫, Low GL; ○, High GL.*** p=0.001.
Mirza et al. Page 11
Int J Pediatr Obes. Author manuscript; available in PMC 2011 July 2.
NIH
-PA Author Manuscript
NIH
-PA Author Manuscript
NIH
-PA Author Manuscript
NIH
-PA Author Manuscript
NIH
-PA Author Manuscript
NIH
-PA Author Manuscript
Mirza et al. Page 12
Table 1
Content of Meals Served*
Low Glycemic Load (LGL) High Glycemic Load (HGL)
Breakfast 2% milk 2% milk
Yogurt Yogurt
Cheese slices Cheese slices
Roasted turkey slices Roasted turkey slices
Mayonnaise Mayonnaise
Margarine Margarine
Scrambled egg Scrambled egg
Grapes Grapes
Low-carbohydrate style 100% whole wheat bread Mandarin oranges canned (no juice)
Peanuts White bread
Strawberries Cornflakes cereal
Water Cookie, vanilla wafer
Fruit juice
Dinner and Lunch Roasted turkey slices Roasted turkey slices
Cheese slices Cheese slices
Mayonnaise Mayonnaise
Yogurt Yogurt
Low-carbohydrate style 100% whole wheat bread White bread Grapes
Grapes Mandarin oranges, canned (no juice)
Mandarin oranges canned (no juice)
Cranberry juice
Peanuts Cookie, vanilla wafer
Diet gelatin sugar free
Water
Snack Platter (samefood items for bothgroups)†
Oreo cookies, chocolate chip cookies; potato chips; corn chips; pretzels; fresh fruits; canned fruits; fruit rolls,pudding; rice cakes; fresh carrots; grape tomatoes; crackers; cheese crackers; granola bars; fudge cookies
*The macronutrient composition for the LGL diet was 45-50% of low glycemic index carbohydrates, 20-25% protein, and 30-35% fat. The
composition of the HGL diet was 55-60% carbohydrates, 15-20% protein and 25-30% fat.
†Approximately 3000 calories was offered on the platter (see methods for energy load of meals).
Int J Pediatr Obes. Author manuscript; available in PMC 2011 July 2.
NIH
-PA Author Manuscript
NIH
-PA Author Manuscript
NIH
-PA Author Manuscript
Mirza et al. Page 13
Table 2
Characteristics of Participants
Low Glycemic Load (n=45) High Glycemic Load (n=43)
Age (y)* 12.3±2.4 12.0±2.0
Sex (% female) 51 44
Tanner Pubertal Stage (%)
1 31.1 23.3
2-3 33.3 37.2
4-5 35.6 39.5
BMI (kg/m2)*† 29.9±6.3 29.2±4.9
BMI z-score* 2.1±0.4 2.1±0.4
Body fat percent* 42.6±5.9 41.0±7.1
Waist z-score* 1.4±0.7 1.4 ±0.6
HOMA-IR index*± 3.6±2.9 4.2±2.8
*mean ±SD
†BMI, body mass index
±HOMA-IR, Homeostatic model assessment for insulin resistance calculated as the product of fasting plasma glucose concentration (mmol/L) and
fasting serum insulin concentration (μU/L) divided by 22.5.(28)
Int J Pediatr Obes. Author manuscript; available in PMC 2011 July 2.
NIH
-PA Author Manuscript
NIH
-PA Author Manuscript
NIH
-PA Author Manuscript
Mirza et al. Page 14
Table 3
Energy and glycemic characteristics of test meals consumed by participants
Low Glycemic Load (n=45) High- Glycemic Load (n=43) p-value
Mean (95% CI) Mean (95% CI)
Meal 1 (Dinner)
Energy consumed (kcal) 583 (523 - 643) 624 (567 - 681) 0.33
Energy consumed of total offered (%) 88.5 (83.6 – 93.5) 89.2 (83.8 – 94.7) 0.86
Meal glycemic index* 36.5 (35.4 – 37.5) 58.5 (56.8 – 60.2) 0.0001
Meal glycemic load (g/1000 kcal)† 40.4 (38.5 – 42.3) 80.8 (77.5 – 84.0) 0.0001
Meal 2 (Breakfast)
Energy consumed (kcal) 526 (475 – 577) 520 (466 – 575) 0.88
Energy consumed of total offered (%) 90.7 (85.5 – 95.9) 86.6 (80.8 – 92.4) 0.29
Meal glycemic index* 36.0 (34.0 – 38.0) 60.7 (59.4 – 62.0) 0.0001
Meal glycemic load (g/1000 kcal)† 40.2 (37.4 – 43.0) 87.4 (81.9 – 92.9) 0.0001
Meal 3 (Lunch)
Energy consumed (kcal) 626 (572 – 680) 660 (611 – 710) 0.34
Energy consumed of total offered (%) 93.6 (89.7 – 97.4) 93.4 (89.6 – 97.2) 0.96
Meal glycemic index* 35.7 (34.6 – 36.8) 59.3 (58.2 – 60.3) 0.0001
Meal glycemic load (g/1000 kcal)† 39.4 (37.4 – 41.4) 81.4 (78.8 – 84.1) 0.0001
*Glycemic index assigned according to published values of glucose reference. Meal glycemic index is the sum of the weighted values for each food
item.
†Glycemic load is the product of daily glycemic index and total carbohydrate intake adjusted for energy intake.
Int J Pediatr Obes. Author manuscript; available in PMC 2011 July 2.
NIH
-PA Author Manuscript
NIH
-PA Author Manuscript
NIH
-PA Author Manuscript
Mirza et al. Page 15
Table 4
Energy and dietary composition of Ad libitum snack platter (post lunch) consumed by participants
Low Glycemic Load (n=45) High Glycemic Load (n=43) p-value
Mean (95% CI) Mean (95% CI)
Energy consumed (kcal) 1303 (1143 – 1463) 1368 (1217 – 1518) 0.56
Energy consumed of total offered (%) 55.4 (48.5 – 62.2) 57.1 (51.2 – 63.0) 0.70
Macronutrient composition
Energy from protein (%) 7.0 (6.1 – 7.8) 5.8 (5.1 – 6.6) 0.053
Energy from carbohydrate (%) 60.2 (58.1 – 62.4) 59.6 (56.9– 62.3) 0.72
Energy from fat (%) 33.7 (31.8 – 35.7) 35.5 (32.8 – 38.3) 0.28
Meal glycemic index* 59.8 (57.9 – 61.9) 61.9 (60.6 – 63.2) 0.08
Meal glycemic load (g/1000 kcal)† 89.7 (86.4 – 93.0) 92.2 (87.8 – 96.6) 0.36
*Glycemic index assigned according to published values of glucose reference. Meal glycemic index is the sum of the weighted values for each food
item.
†Glycemic load is the product of daily glycemic index and total carbohydrate intake adjusted for energy intake.
Int J Pediatr Obes. Author manuscript; available in PMC 2011 July 2.
NIH
-PA Author Manuscript
NIH
-PA Author Manuscript
NIH
-PA Author Manuscript
Mirza et al. Page 16
Appendix Table 1
Detectable difference at various levels of Statistical Power, 2-tailed type 1 error of 5%*
Difference expressed as sd ≥80% Power ≥90% Power ≥95% Power
Energy Consumed (kcal) 505 303 354 404
Glucose AUC (mg.min/dL) 2,601 1,561 1,821 2,080
Insulin AUC (uIU.min/mL) 10,486 6,292 7,340 8,389
Hunger Rating (mm) 21.5 6.5 7.5 8.6
Fullness Rating (mm) 15.3 4.6 5.4 6.1
Satiety Rating (mm) 15.4 4.6 5.4 6.1
*Based on 10 repeated assessments correlated at 70% within a patient.
Int J Pediatr Obes. Author manuscript; available in PMC 2011 July 2.
Related Documents