The Journal of Nutrition Nutrition and Disease A Low-Glycemic Index Diet and Exercise Intervention Reduces TNFa in Isolated Mononuclear Cells of Older, Obese Adults 1,2 Karen R. Kelly, 3,6,8 Jacob M. Haus, 3,7 Thomas P. J. Solomon, 3 Aimee J. Patrick-Melin, 3 Marc Cook, 3 Michael Rocco, 5 Hope Barkoukis, 6 and John P. Kirwan 3,4,6,7 * 3 Department of Pathobiology, Lerner Research Institute, 4 Department of Gastroenterology/Hepatology, and 5 Department of Preventive Cardiology, Cleveland Clinic, Cleveland, OH 44195; and 6 Department of Nutrition and 7 Department of Physiology, School of Medicine, Case Western Reserve University, Cleveland, OH, 44106 Abstract Low-glycemic index diets and exercise independently improve glucose tolerance and reduce diabetes risk. However, the combined effect of a low-glycemic index diet and exercise on inflammation and glucose metabolism is not known. Therefore, we randomized 28 insulin-resistant adults (age: 66 6 1 y; BMI: 34.2 6 0.7 kg×m 22 ) to a 12-wk, low (LGI = 40) or high- (HGI = 80) glycemic index diet plus aerobic exercise (5 d×wk 21 , 60 min×d 21 , 80–85% heart rate max ) intervention. All food and fluids were provided during the study. Inflammation was assessed from cytokine (TNFa and IL-6) secretion using peripheral blood mononuclear cells (MNC) stimulated overnight with LPS. Glycemic response was determined following ingestion of a 75-g glucose solution. Fasting blood samples were collected for additional cytokine [TNFa, IL-6, and monocyte chemoattractant protein 1 (MCP-1)] analysis. Both interventions decreased BMI (P , 0.001), fasting plasma glucose (P = 0.01), and insulin (P = 0.02). The glycemic response was reduced only in the LGI group (P = 0.04). Plasma and MNC-derived TNFa secretion were reduced in the LGI group (P = 0.02) but increased in the HGI group (P = 0.02). Secretion of IL-6 from MNC and plasma IL-6 and MCP-1 concentrations were reduced in the LGI group. The change in MNC-derived TNFa (r = 0.43; P = 0.04) and plasma MCP-1 (r = 0.44; P = 0.04) correlated with decreases in the glycemic response. These data highlight the importance of diet composition in the treatment and prevention of inflammation and hyperglycemia. A low-glycemic index diet has antiinflammatory and antidiabetogenic effects when combined with exercise in older, obese prediabetics. J. Nutr. 141: 1089–1094, 2011. Introduction Obesity increases the risk of type 2 diabetes and is associated with low-grade inflammation (1–3). There is now a consensus that macrophages infiltrate adipose tissue; promote the produc- tion of proinflammatory cytokines, including TNFa, IL-6, and monocyte chemoattractant protein-1 (MCP-1); 9 and contribute to the development of inflammation-induced insulin resistance and type 2 diabetes (1,4–6). Previously, we and others showed that exercise improves insulin sensitivity in obese individuals and that obese individuals secrete more TNFa from peripheral blood mononuclear cells (MNC) compared with lean individuals (4,5). Further, it has been suggested that postprandial hypergly- cemia may be a contributing factor in driving hyperinsulinemia and insulin resistance (4). Low-glycemic index diets attenuate the prevailing glucose concentrations throughout the day, which may reduce the risk of some chronic diseases and help to improve glucose tolerance (7– 9). In line with these observations, Jenkins et al. (9) reported that participants who were counseled to eat a low-glycemic index diet for 6 mo had a reduced hemoglobin A1c and greater glycemic control. Furthermore, we discovered that participants who exercised and reduced the glycemic load in their diet experienced a more marked improvement in insulin sensitivity compared with participants who exercised but maintained a normal glycemic index diet (10). Additionally, several studies have shown that modification of dietary carbohydrate intake can reduce both systemic and adipose tissue production of inflammatory cytokines (11–15). Several studies have also suggested that exercise alone can reduce inflammatory markers and improve insulin sensitivity (16–18). However, these studies evaluated leisure time activity 1 Supported by NIH grant RO1 AG12834 (J.P.K.) and in part by the NIH, National Center for Research Resources, CTSA 1UL1RR024989, Cleveland, Ohio. K.R.K. was supported by NIH grant T32 DK007319 and J.M.H. was supported by NIH grant T32 HL007887. 2 Author disclosures: K. R. Kelly, J. M. Haus, T. P. J. Solomon, A. J. Patrick-Melin, M. Cook, M. Rocco, H. Barkoukis, and J. P. Kirwan, no conflicts of interest. 8 Present address: Naval Health Research Center, Department of Warfighter Performance, 140 Sylvester Rd-Bldg. 328, San Diego, CA 92106, (619) 553-9291, [email protected]. * To whom correspondence should be addressed. E-mail: [email protected]. 9 Abbreviations used: FFM, fat-free mass; FM, fat mass; HGI, high-glycemic index diet and exercise, LGI, low-glycemic index diet and exercise; MCP-1, monocyte chemoattractant protein 1; MNC, mononuclear cell. ã 2011 American Society for Nutrition. Manuscript received February 11, 2011. Initial review completed February 24, 2011. Revision accepted March 21, 2011. 1089 First published online April 27, 2011; doi:10.3945/jn.111.139964.

Welcome message from author
This document is posted to help you gain knowledge. Please leave a comment to let me know what you think about it! Share it to your friends and learn new things together.
Transcript

The Journal of Nutrition
Nutrition and Disease
A Low-Glycemic Index Diet and ExerciseIntervention Reduces TNFa in IsolatedMononuclear Cells of Older, Obese Adults1,2
Karen R. Kelly,3,6,8 Jacob M. Haus,3,7 Thomas P. J. Solomon,3 Aimee J. Patrick-Melin,3 Marc Cook,3
Michael Rocco,5 Hope Barkoukis,6 and John P. Kirwan3,4,6,7*
3Department of Pathobiology, Lerner Research Institute, 4Department of Gastroenterology/Hepatology, and 5Department of Preventive
Cardiology, Cleveland Clinic, Cleveland, OH 44195; and 6Department of Nutrition and 7Department of Physiology, School of Medicine,
Case Western Reserve University, Cleveland, OH, 44106
Abstract
Low-glycemic index diets and exercise independently improve glucose tolerance and reduce diabetes risk. However, the
combined effect of a low-glycemic index diet and exercise on inflammation and glucose metabolism is not known.
Therefore, we randomized 28 insulin-resistant adults (age: 666 1 y; BMI: 34.26 0.7 kg×m22) to a 12-wk, low (LGI = 40) or
high- (HGI = 80) glycemic index diet plus aerobic exercise (5 d×wk21, 60 min×d21, 80–85% heart ratemax) intervention. All
food and fluids were provided during the study. Inflammation was assessed from cytokine (TNFa and IL-6) secretion using
peripheral blood mononuclear cells (MNC) stimulated overnight with LPS. Glycemic response was determined following
ingestion of a 75-g glucose solution. Fasting blood samples were collected for additional cytokine [TNFa, IL-6, and
monocyte chemoattractant protein 1 (MCP-1)] analysis. Both interventions decreased BMI (P , 0.001), fasting plasma
glucose (P = 0.01), and insulin (P = 0.02). The glycemic responsewas reduced only in the LGI group (P = 0.04). Plasma and
MNC-derived TNFa secretionwere reduced in the LGI group (P = 0.02) but increased in the HGI group (P = 0.02). Secretion
of IL-6 fromMNC and plasma IL-6 and MCP-1 concentrations were reduced in the LGI group. The change in MNC-derived
TNFa (r = 0.43; P = 0.04) and plasmaMCP-1 (r = 0.44; P = 0.04) correlatedwith decreases in the glycemic response. These
data highlight the importance of diet composition in the treatment and prevention of inflammation and hyperglycemia. A
low-glycemic index diet has antiinflammatory and antidiabetogenic effects when combined with exercise in older, obese
prediabetics. J. Nutr. 141: 1089–1094, 2011.
Introduction
Obesity increases the risk of type 2 diabetes and is associatedwith low-grade inflammation (1–3). There is now a consensusthat macrophages infiltrate adipose tissue; promote the produc-tion of proinflammatory cytokines, including TNFa, IL-6, andmonocyte chemoattractant protein-1 (MCP-1);9 and contributeto the development of inflammation-induced insulin resistanceand type 2 diabetes (1,4–6). Previously, we and others showedthat exercise improves insulin sensitivity in obese individuals
and that obese individuals secrete more TNFa from peripheralbloodmononuclear cells (MNC) compared with lean individuals(4,5). Further, it has been suggested that postprandial hypergly-cemia may be a contributing factor in driving hyperinsulinemiaand insulin resistance (4).
Low-glycemic index diets attenuate the prevailing glucoseconcentrations throughout the day, which may reduce the risk ofsome chronic diseases and help to improve glucose tolerance (7–9). In line with these observations, Jenkins et al. (9) reported thatparticipants who were counseled to eat a low-glycemic indexdiet for 6 mo had a reduced hemoglobin A1c and greaterglycemic control. Furthermore, we discovered that participantswho exercised and reduced the glycemic load in their dietexperienced a more marked improvement in insulin sensitivitycompared with participants who exercised but maintained anormal glycemic index diet (10). Additionally, several studieshave shown that modification of dietary carbohydrate intakecan reduce both systemic and adipose tissue production ofinflammatory cytokines (11–15).
Several studies have also suggested that exercise alone canreduce inflammatory markers and improve insulin sensitivity(16–18). However, these studies evaluated leisure time activity
1 Supported by NIH grant RO1 AG12834 (J.P.K.) and in part by the NIH, National
Center for Research Resources, CTSA 1UL1RR024989, Cleveland, Ohio. K.R.K.
was supported by NIH grant T32 DK007319 and J.M.H. was supported by NIH
grant T32 HL007887.2 Author disclosures: K. R. Kelly, J. M. Haus, T. P. J. Solomon, A. J. Patrick-Melin,
M. Cook, M. Rocco, H. Barkoukis, and J. P. Kirwan, no conflicts of interest.8 Present address: Naval Health Research Center, Department of Warfighter
Performance, 140 Sylvester Rd-Bldg. 328, San Diego, CA 92106, (619) 553-9291,
* To whom correspondence should be addressed. E-mail: [email protected].
9 Abbreviations used: FFM, fat-free mass; FM, fat mass; HGI, high-glycemic
index diet and exercise, LGI, low-glycemic index diet and exercise; MCP-1,
monocyte chemoattractant protein 1; MNC, mononuclear cell.
ã 2011 American Society for Nutrition.
Manuscript received February 11, 2011. Initial review completed February 24, 2011. Revision accepted March 21, 2011. 1089First published online April 27, 2011; doi:10.3945/jn.111.139964.

and did not assess changes in cytokines following a longer term,structured exercise program. Evidence from a small study inhealthy volunteers showed that a 6-mo exercise programreduced TNFa production by MNC in healthy adults (19). Atpresent, there are no data on the effects of a well-controlled,clinically relevant lifestyle intervention on proinflammatorycytokine secretion in an at-risk population such as the olderobese who are more susceptible to type 2 diabetes and cardio-vascular disease. We hypothesized that a lifestyle interventionthat included a low-glycemic index diet combined with aerobicexercise would reduce postprandial glucose excursions and thusattenuate the prevailing hyperglycemia that induces low-gradeinflammation and cytokine secretion from peripheral MNC.
Methods
Participants. Twenty-eight older, obese, previously sedentary adults
(age 66 6 1 y; BMI 34.2 6 0.7 kg/m2) were recruited from the localcommunity to undergo a 12-wk diet and exercise training intervention.
All volunteers underwent a medical history, physical exam, oral glucose
tolerance test, and complete blood profile (lipid profile and hepatic/renal/hematological function tests). Female participants were postmenopausal
and were not using hormone replacement therapy. Prior physical activity
levels were recorded using the Minnesota Leisure Time Physical Activity
questionnaire (20); volunteers were deemed sedentary if their leisuretime activity was ,300 kcal/d (1255 kJ/d). Participants were required
to be weight stable for at least the previous 6 mo. Individual energy re-
quirements were determined by indirect calorimetry (21). The Cleveland
Clinic Institutional Review Board approved the study and all partici-pants provided signed, informed, written consent in accordance with
guidelines for the protection of human participants.
Intervention. Participants were randomized to 1 of 2 groups: either alow-glycemic index diet plus exercise (LGI: n = 13; 5 male, 8 female) or
high-glycemic index diet plus exercise (HGI: n = 15; 8 male, 7 female).
All volunteers undertook 60 min of aerobic exercise 5 d/wk for 12 wk at;85% of the maximum heart rate obtained during an incremental
maximal aerobic exercise test (VO2max test). Every session was fully
supervised by an exercise physiologist. All meals for the 12-wk
intervention were provided to participants. Diets were designed by aregistered dietitian as previously described (22). The dietary macronu-
trient composition (including fiber) wasmatched between groups (Table 1);
however, the LGI participants received a diet with a mean glycemic index
of 40 units, whereas participants in the HGI group consumed foods witha mean glycemic index of 80 units. Adherence to the diet was determined
via daily food container weigh backs plus a weekly counseling session
with the study dietitian. Dietary analysis was performed using Nutri-tionist Pro software (Axxya Systems).
Inpatient control period. Pre- and postintervention assessments of
body composition, aerobic fitness, glucose tolerance, and MNC were
performed during a 3-d in-patient stay in the Clinical Research Unit.During this period, participants received a weight maintenance eucaloric
diet (total kcal/d = resting metabolic rate3 1.2; 55% carbohydrate, 28%
fat, 17% protein). Postintervention metabolic measures were performed
within 16 h after the last exercise bout and the participant’s meal thenight before testing was matched to the study diet.
Body composition. Height and body weight were measured by
standard techniques (23). Whole body adiposity [fat mass (FM) andfat-free mass (FFM)] was measured by DXA (model iDXA; Lunar).
Glycemic response. The glucose response to ingestion of a 75-gglucose solution (Azer Scientific) was assessed after an overnight fast pre-
and postintervention. Following baseline draws, the solution was in-
gested and blood samples were subsequently drawn at 30, 60, 90, 120,
and 180min. Plasma glucose was determined immediately on a YSI 2300STAT Plus analyzer (YSI Life Sciences). The samples were stored
at 2808C for cytokine and substrate analysis.
MNC isolation and culturing. MNC isolation and culture wasperformed as previously described (4,5,24). Briefly, MNC were isolated
via Histopaque-1077 density gradient centrifugation, washed, and
resuspended in RPMI (Sigma) and seeded in coated cell culture plates(5 3 106cells/well). The cells were stimulated with 1 pg/L LPS and
incubated (humidified, 5% CO2, 378C) for 24 h. Cell supernatants were
collected (10,000 3 g for 2 min) and stored at 2808C for subsequent
cytokine analysis.
Biochemical analyses. All samples were measured in duplicate and
each participant’s pre- and postintervention samples were batch
analyzed. Plasma insulin was determined via RIA (Millipore) and bothplasma and MNC-derived TNFa were determined by ELISA (Invitro-
gen). Plasma IL-6 and MCP-1 were measured via ELISA (Bio-Rad).
Statistics. Between-group (LGI vs. HGI) comparisons were analyzedusing 2-way (group3 time) repeated-measures ANOVA and Bonferroni
post hoc tests were applied to significant group 3 time interactions.
Baseline values for each variable were compared between groups usingStudent’s t tests. In the event of a significant t statistic, baseline values
were used as a covariate in the 2-way repeated-measures ANOVA.
Bivariate correlation analyses were used to identify relationships between
variables. Significancewas accepted atP, 0.05. Analyses were carried outusing StatView for Windows 5.0.1 (SAS Institute) and all data are
expressed as mean 6 SEM.
Results
Diet and exercise. Dietary analysis shows that diets for bothgroups were matched with respect to macronutrient composi-tion, including fiber, but the glycemic index was markedlydifferent (Table 1). The glycemic responses to the study dietswere confirmed and previously reported (25). Diet and exercisecompliance was high (;97%). Exercise was performed at 83.260.5% of maximal heart rate, and following the study there was anincrease in VO2 max in both groups [LGI, pre: 38.4 6 1.3, post:42.9 6 2.9; HGI, pre: 39.6 6 1.4, post: 45.7 6 1.8 mL/(kg21
FFM×min21);P, 0.001]. Baseline and postintervention VO2maxvalues did not differ between the groups.
Body composition. Groups were well matched for BMI priorto the onset of the intervention (P = 0.41). Poststudy, bothgroups significantly reduced body weight and they did not differin the amount of weight loss achieved (Table 2). There was asmall but significant decrease in FFM in both groups (Table 2).In contrast, whole body FM was markedly reduced in bothgroups (Table 2). Truncal fat was also reduced following both
TABLE 1 Composition of the study diets1
Study diet LGI HGI
GI,2 a.u. 40.3 6 0.4 80.2 6 1.0*
GL, a.u. 102 6 9 218 6 24*
EI, kJ/d 7400 6 678 7890 6 803
Carbohydrate, g/d 248 6 23 272 6 29
Carbohydrate, % energy 55.8 6 0.1 57.7 6 0.6
Fat, g/d 56 6 5 60 6 6
Fat, % kJ 31.9 6 0.3 31.8 6 0.3
Protein, g/d 77 6 7 81 6 8
Protein, % energy 17.4 6 0.4 17.0 6 0.1
Fiber, g/d 28 6 3 28 6 3
1 Data are mean 6 SEM, n = 13 (LGI) or 15 (HGI). *Different from LGI, P , 0.05.2 GI, glycemic index; GL, glycemic load; a.u., arbitrary units; EI, energy intake.
1090 Kelly et al.

interventions (Table 2). FFM, FM, and truncal fat did not differbetween the groups at the end of the interventions.
Cytokine and glycemic responses. Both lifestyle interven-tions reduced fasting plasma glucose and insulin (P , 0.05)(Table 2). However, oral glucose tolerance (AUC) was improvedonly in the LGI group. The plasma insulin concentrationdecreased in response to oral glucose (P , 0.001) (Table 2).Both MNC (P = 0.002) and plasma-derived TNFa (P = 0.001)were lower in the LGI group, whereas plasma TNFa concen-trations (P = 0.08) and secretion fromMNC (P = 0.06) tended tobe higher in the HGI group. There was also a difference in thechange in TNFa responses for the LGI and HGI groups withrespect to both MNC (P = 0.004) and plasma (P = 0.004) (Fig.1A,B). In addition, we observed a significant decrease in IL-6secretion from MNC (P = 0.02) following the LGI interventionbut no change in the HGI group; the groups did not differ (Fig.1C). However, the plasma IL-6 concentration was lower (P =0.04) in both groups after the interventions, a change that wasmore pronounced in the LGI group (P = 0.01) (Fig. 1D). Further,MCP-1 concentrations were reduced by 33% in the LGI group(21.8 6 6.3 vs. 15.2 6 3.1) following the 12-wk intervention(P = 0.02); the HGI group did not change (20.66 4.6 vs. 21.864.9 ng/L) and the changes tended to differ between the groups(P = 0.07).
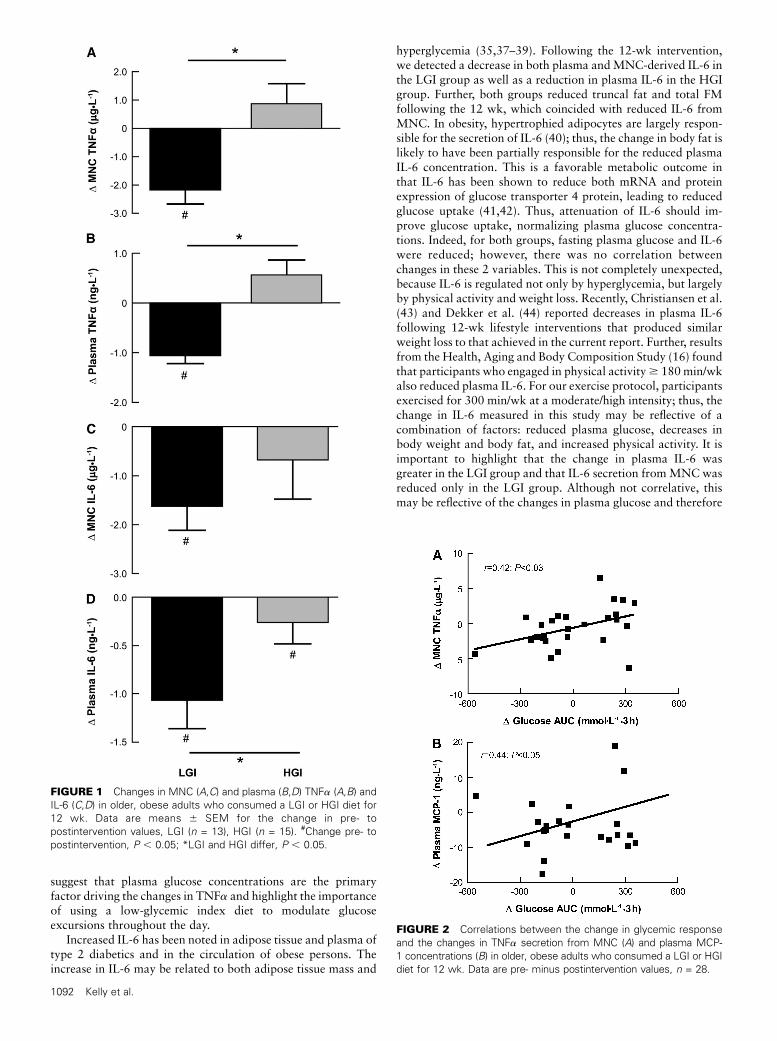
Regression analyses. Decreases in TNFa secretion fromMNC were correlated with the reduced glycemic response(Fig. 2A) and tended to be associated with the fasting glucoseconcentration (r = 0.32; P = 0.09). There was also a positivecorrelation between the change in TNFa secretion from MNCand plasma TNFa (r = 0.49; P = 0.04). There was a significantcorrelation between changes in MNC-derived IL-6 and total FM(r = 0.51; P = 0.02) as well as truncal fat (r = 0.60; P = 0.003).Further, changes in MCP-1 and IL-6 were positively associated(r = 0.48; P = 0.03) as were the changes in MCP-1 and theglycemic response following glucose ingestion (Fig. 2B).
Discussion
Our data show for the first time, to our knowledge, that alifestyle intervention that includes a low-glycemic index dietcombined with aerobic exercise attenuates cytokine production
in older, insulin-resistant adults, suggesting a reversal of theeffects of obesity on inflammation. In line with these findings, wenoted that the decrease in TNFa secretion was associated withthe improvement in glucose tolerance. Further, the low-glycemicdiet and exercise intervention decreased circulating TNFa, IL-6,and MCP-1. Collectively, these findings suggest that attenuationof glycemia via a low-glycemic index diet and exercise regulatesproinflammatory cytokine release and control of hyperglycemia.In contrast, a high-glycemic index diet attenuates improvementsin postprandial glycemia and inflammation that usually occurafter exercise interventions.
The glycemic index provides a measure of the blood glucoseresponse to individual foods in a meal. High-glycemic diets havebeen linked to disease (26,27), whereas low-glycemic diets arethought to be protective (13,14), due primarily to reduced post-prandial glucose excursions (28). Previously, we showed that12 wk of exercise improves insulin sensitivity in older, obeseindividuals (10,29) and that the magnitude of improvement wasenhanced by a low-glycemic index diet (10). One mechanismthat may contribute to this effect is related to the ability of theMNC to use glucose not only for glycolysis, but also forproduction of NADPH. NADPH is oxidized and results in thegeneration of reactive oxygen species, activating the NF-kBpathway and resulting in increased TNFa (30–32). CirculatingTNFa released from both adipose tissue and MNC bind toTNFa receptors, inducing activation of serine kinases that canstimulate transcription of inflammatory genes, leading to anincrease in inflammatory protein production within targettissues, including muscle, adipose, and the liver (33,34). Thisestablishes a positive feed-forward loop that further amplifiesinflammation and insulin resistance. In line with these observa-tions, we found a correlation between plasma glucose and TNFa,suggesting that when glycemia is normalized, the stimulus toproduce TNFa is reduced. These findings are supported by bothin vivo (35) and in vitro (36) studies that induce hyperglycemia.This is also in agreement with our data from the HGI group,where there was an increase in TNFa production with noimprovement in glucose tolerance. Further, these results areconsistent with recent work by Kallio et al. (11) that showeddifferential modulation of proinflammatory cytokine produc-tion is dependent on the type of carbohydrate consumed. Despitethe fact that both groups in the current study exercised and thatphysical activity can reduce plasma TNFa (16–18), our data
TABLE 2 Participant characteristics, body composition, glucose, and insulin responses to glucose inolder, obese adults who consumed a LGI or HGI diet for 12 wk1
Characteristics
LGI HGI ANOVA2
Pre Post Pre Post Time
Males, females, n 7/6 — 8/7 — —
Age, y 67 6 1 — 66 6 1 — —
Weight, kg 94.6 6 4.0 88.1 6 3.4 97.9 6 4.1 88.3 6 4.1 ,0.0001
BMI kg�m22 34.2 6 1.0 31.9 6 1.1 34.8 6 1.0 31.5 6 1.0 ,0.0001
FM, kg 44.8 6 2.0 38.5 6 1.9 43.5 6 2.1 35.1 6 2.6 0.001
FFM, kg 49.8 6 2.8 49.4 6 2.5 56.9 6 3.5 55.3 6 3.3 0.004
Plasma glucose, mmol�L21 6.2 6 0.2 5.3 6 0.2 5.6 6 0.1 5.2 6 0.1 ,0.001
Plasma insulin, pmol�L21 140 6 19.2 87.0 6 10.8 106 6 25.2 57.6 6 6.0 0.004
Glucose AUC, mol�L21�3 h 1.63 6 0.12 1.42 6 0.08 1.36 6 0.06 1.31 6 0.07 0.02
Insulin AUC, nmol�L21�3 h 149 6 0.4 81.1 6 0.2 102 6 0.2 51.1 6 0.1 0.0005
HbA1c, % 5.8 6 0.1 5.6 6 0.1 5.4 6 0.1 5.5 6 0.1 0.45
1 Data are mean 6 SEM, n = 13 (LGI) or 15 (HGI).2 Effects of group and time 3 group were not significant, P $ 0.05.
Low-glycemic index diet and exercise reduces inflammation 1091
suggest that plasma glucose concentrations are the primaryfactor driving the changes in TNFa and highlight the importanceof using a low-glycemic index diet to modulate glucoseexcursions throughout the day.
Increased IL-6 has been noted in adipose tissue and plasma oftype 2 diabetics and in the circulation of obese persons. Theincrease in IL-6 may be related to both adipose tissue mass and
hyperglycemia (35,37–39). Following the 12-wk intervention,we detected a decrease in both plasma andMNC-derived IL-6 inthe LGI group as well as a reduction in plasma IL-6 in the HGIgroup. Further, both groups reduced truncal fat and total FMfollowing the 12 wk, which coincided with reduced IL-6 fromMNC. In obesity, hypertrophied adipocytes are largely respon-sible for the secretion of IL-6 (40); thus, the change in body fat islikely to have been partially responsible for the reduced plasmaIL-6 concentration. This is a favorable metabolic outcome inthat IL-6 has been shown to reduce both mRNA and proteinexpression of glucose transporter 4 protein, leading to reducedglucose uptake (41,42). Thus, attenuation of IL-6 should im-prove glucose uptake, normalizing plasma glucose concentra-tions. Indeed, for both groups, fasting plasma glucose and IL-6were reduced; however, there was no correlation betweenchanges in these 2 variables. This is not completely unexpected,because IL-6 is regulated not only by hyperglycemia, but largelyby physical activity and weight loss. Recently, Christiansen et al.(43) and Dekker et al. (44) reported decreases in plasma IL-6following 12-wk lifestyle interventions that produced similarweight loss to that achieved in the current report. Further, resultsfrom the Health, Aging and Body Composition Study (16) foundthat participants who engaged in physical activity$ 180min/wkalso reduced plasma IL-6. For our exercise protocol, participantsexercised for 300 min/wk at a moderate/high intensity; thus, thechange in IL-6 measured in this study may be reflective of acombination of factors: reduced plasma glucose, decreases inbody weight and body fat, and increased physical activity. It isimportant to highlight that the change in plasma IL-6 wasgreater in the LGI group and that IL-6 secretion fromMNCwasreduced only in the LGI group. Although not correlative, thismay be reflective of the changes in plasma glucose and therefore
FIGURE 1 Changes in MNC (A,C) and plasma (B,D) TNFa (A,B) and
IL-6 (C,D) in older, obese adults who consumed a LGI or HGI diet for
12 wk. Data are means 6 SEM for the change in pre- to
postintervention values, LGI (n = 13), HGI (n = 15). #Change pre- to
postintervention, P , 0.05; *LGI and HGI differ, P , 0.05.
FIGURE 2 Correlations between the change in glycemic response
and the changes in TNFa secretion from MNC (A) and plasma MCP-
1 concentrations (B) in older, obese adults who consumed a LGI or HGI
diet for 12 wk. Data are pre- minus postintervention values, n = 28.
1092 Kelly et al.

the inflammatory stimuli on MNC to secrete IL-6. The disparitybetween the change in MNC and plasma-derived IL-6 for the2 groups (LGI and HGI) is most likely due to the complexinteraction between MNC and adipose tissue, as well as thecombined effects of weight loss, physical activity, and alteredblood glucose, and the subsequent influences on cytokineproduction.
In support of these observations, we found that MCP-1 wasreduced following the LGI intervention and observed anassociation between the change in MCP-1 and the change inplasma glucose. MCP-1 is a chemokine, which, analogous toIL-6, is secreted from hypertrophied adipocytes and plays acrucial role in the recruitment of MNC into tissues (45). MNCare the primary secretors of cytokines and infiltration/differen-tiation of MNC into macrophages in adipose tissue is presumedto have unique inflammatory properties compared with residentmacrophages (46). Thus, the decrease in MCP-1 in the LGIgroup that corresponded to changes in plasma glucose is likelythe result of a reduced stimulus to recruit MNC into adiposetissue (i.e. improved glucose tolerance) and in turn a halting ofthe cycle of cytokine production and activation of MCP-1. Thisis a favorable adaptation in that in vitro studies show thatMCP-1 treatment reduces glucose uptake in both adipocytes andmyocytes (47,48) and thus, along with IL-6 and TNFa, may alsocontribute to insulin resistance. Classically, MCP-1 exerts par-acrine or autocrine effects in adipose tissue rather than having adirect systemic pathogenic role (40). Thus, the decrease inMCP-1 inthe LGI group is suggestive of improvement in adipose tissuefunction.
A major strength of this study was the control of diet andexercise throughout the 12-wk intervention. Participants werefed all meals, snacks, and beverages and each exercise sessionwas supervised by an exercise physiologist to ensure complianceand attention to workload. However, there are some limitations,such as the lack of dietary control groups, i.e. participantsconsuming either a low-or high-glycemic index diet withoutexercise. However, other studies that have examined diet alonehave produced equivocal results (12,49). Further, our previouswork with an uncontrolled diet suggested that there weresynergist effects on reductions in diabetes risk when exercise anda low-glycemic index diet were combined (10). In addition,individuals randomized to the LGI group tended to have higherbaseline concentrations of insulin and glucose; however, theywere not significantly different compared with participants inthe HGI group. Nonetheless, this could contribute to the greaterchanges observed after the LGI intervention.
From the data provided herein, regulation of cytokine releaseis multi-factorial but largely dependent on plasma glucoseconcentrations. This study provides strong evidence that con-sumption of a low-glycemic index diet and normalization ofplasma glucose can halt the vicious cycle of hyperglycemia-insulinemia, which contributes to insulin resistance, adiposetissue dysfunction, and, ultimately, proinflammatory cytokineproduction. The present study was a highly controlled dietaryintervention and confirmed our previous observation that a low-glycemic index diet improved glucose tolerance and providesnovel evidence that a low-glycemic index diet can reduce theinflammation that is now classically associated with obesity. Thelack of change in both glucose tolerance and cytokine secretionfollowing the HGI confirms the importance of diet and, morespecifically, the contribution of a low-glycemic index diet tocontrolling glucose excursions throughout the day. Although theHGI group did show improvements in plasma insulin, thesechanges are likely related to the exercise and weight loss and not
to diet, because we have previously shown the same effect with asimilar exercise intervention without a dietary component (22).
In conclusion, adherence to a low-glycemic index diet incombination with aerobic exercise can reverse the effects ofobesity on proinflammatory cytokine production in older, obeseadults. Our data suggest that the hyperglycemia that typicallyaccompanies obesity and insulin resistance is a driving forcebehind elevated cytokine production, which can further accel-erate the positive feed-forward loop of inflammatory cytokineproduction leading to chronic diseases such as type 2 diabetes.
AcknowledgmentsWe thank Christine Marchetti for her help with the implementa-tion of the study. We also thank our clinical research coordinator,Julianne Filion, for her excellent nursing and organizationalassistance. J.P.K. and H.B. designed the research; K.R.K., J.M.H.,T.P.J.S., A.J.P.M., M.C., and J.P.K. conducted the research;K.R.K., J.M.H., T.P.J.S., M.R., H.B., and J.P.K. analyzed thedata; K.R.K. and J.P.K. wrote the manuscript; and J.P.K.obtained funding for the study and had primary responsibility forfinal content. All authors read and approved the final manuscript.
Literature Cited
1. Heilbronn LK, Campbell LV. Adipose tissue macrophages, low gradeinflammation and insulin resistance in human obesity. Curr Pharm Des.2008;14:1225–30.
2. Kohrt WM, Kirwan JP, Staten MA, Bourey RE, King DS, Holloszy JO.Insulin resistance in aging is related to abdominal obesity. Diabetes.1993;42:273–81.
3. Hubert HB, Feinleib M, McNamara PM, Castelli WP. Obesity as anindependent risk factor for cardiovascular disease: a 26-year follow-upof participants in the Framingham Heart Study. Circulation. 1983;67:968–77.
4. Gonzalez F, Minium J, Rote NS, Kirwan JP. Altered tumor necrosisfactor alpha release from mononuclear cells of obese reproductive-agewomen during hyperglycemia. Metabolism. 2006;55:271–6.
5. Gonzalez F, Minium J, Rote NS, Kirwan JP. Hyperglycemia alterstumor necrosis factor-alpha release from mononuclear cells in womenwith polycystic ovary syndrome. J Clin Endocrinol Metab. 2005;90:5336–42.
6. Hotamisligil GS, Arner P, Caro JF, Atkinson RL, Spiegelman BM.Increased adipose tissue expression of tumor necrosis factor-a in humanobesity and insulin resistance. J Clin Invest. 1995;95:2409–15.
7. Frost G, Leeds A, Trew G. Insulin sensitivity in women at risk ofcoronary heart disease and the effect of a low glycemic index diet.Metabolism. 1998;47:1245–51.
8. Jarvi AE, Karlstrom BE, Granfeldt YE, Bjorck IE, Asp NG, Vessby BO.Improved glycemic control and lipid profile and normalized fibrolyticactivity on a low-glycemic index diet in type 2 diabetic patients.Diabetes Care. 1999;22:10–8.
9. Jenkins DJ, Kendall CW, McKeown-Eyssen G, Josse RG, Silverberg J,Booth GL, Vidgen E, Josse AR, Nguyen TH, et al. Effect of a low-glycemic index or a high-cereal fiber diet on type 2 diabetes: arandomized trial. JAMA. 2008;300:2742–53.
10. Kirwan JP, Barkoukis H, Brooks LM, Marchetti CM, Stetzer BP,Gonzalez F. Exercise training and dietary glycemic load may havesynergistic effects on insulin resistance in older obese adults. Ann NutrMetab. 2009;55:326–33.
11. Kallio P, Kolehmainen M, Laaksonen DE, Pulkkinen L, Atalay M,Mykkanen H, Uusitupa M, Poutanen K, Niskanen L. Inflammationmarkers are modulated by responses to diets differing in postprandialinsulin responses in individuals with the metabolic syndrome. Am J ClinNutr. 2008;87:1497–503.
12. Qi L, van Dam RM, Liu S, Franz M, Mantzoros C, Hu FB. Whole-grain, bran, and cereal fiber intakes and markers of systemic inflam-mation in diabetic women. Diabetes Care. 2006;29:207–11.
13. Hartman TJ, Albert PS, Zhang Z, Bagshaw D, Kris-Etherton PM,Ulbrecht J, Miller CK, Bobe G, Colburn NH, et al. Consumption of a
Low-glycemic index diet and exercise reduces inflammation 1093
legume-enriched, low-glycemic index diet is associated with biomarkersof insulin resistance and inflammation among men at risk for colorectalcancer. J Nutr. 2010;140:60–7.
14. Botero D, Ebbeling CB, Blumberg JB, Ribaya-Mercado JD, CreagerMA, Swain JF, Feldman HA, Ludwig DS. Acute effects of dietaryglycemic index on antioxidant capacity in a nutrient-controlled feedingstudy. Obesity (Silver Spring). 2009;17:1664–70.
15. Wolever TM, Brand-Miller JC, Abernethy J, Astrup A, Atkinson F,Axelsen M, Bjorck I, Brighenti F, Brown R, et al. Measuring the glycemicindex of foods: interlaboratory study. Am J Clin Nutr. 2008;87:S247–57.
16. Colbert LH, Visser M, Simonsick EM, Tracy RP, Newman AB,Kritchevsky SB, Pahor M, Taaffe DR, Brach J, et al. Physical activity,exercise, and inflammatory markers in older adults: findings from theHealth, Aging and Body Composition Study. J Am Geriatr Soc.2004;52:1098–104.
17. Pischon T, Hankinson SE, Hotamisligil GS, Rifai N, Rimm EB. Leisure-time physical activity and reduced plasma levels of obesity-relatedinflammatory markers. Obes Res. 2003;11:1055–64.
18. Monzillo LU, Hamdy O, Horton ES, Ledbury S, Mullooly C, Jarema C,Porter S, Ovalle K, Moussa A, et al. Effect of lifestyle modification onadipokine levels in obese subjects with insulin resistance. Obes Res.2003;11:1048–54.
19. Smith JK, Dykes R, Douglas JE, Krishnaswamy G, Berk S. Long-termexercise and atherogenic activity of blood mononuclear cells in personsat risk of developing ischemic heart disease. JAMA. 1999;281:1722–7.
20. Taylor HL, Jacobs JDR, Schucker B, Knudsen J, Leon AS, Debacker G.A questionnaire for the assessment of leisure time physical activities.J Chronic Dis. 1978;31:741–55.
21. Weir JBV. New methods for calculating metabolic rate with specialreference to protein metabolism. J Physiol. 1949;109:1–9.
22. Solomon TP, Haus JM, Kelly KR, Cook M, Watanabe R, Barkoukis H,Kirwan JP. A low glycemic index diet combined with exercise reducesinsulin resistance and suppresses compensatory hyperinsulinemia andglucose-dependent insulinotropic polypeptide responses in obese, pre-diabetic humans. Am J Clin Nutr. 2010;92:1359–68.
23. O’Leary VB, Marchetti CM, Krishnan RK, Stetzer BP, Gonzalez F, KirwanJP. Exercise-induced reversal of insulin resistance in obese elderly isassociated with reduced visceral fat. J Appl Physiol. 2006;100:1584–9.
24. Kirwan JP, Krishnan RK, Weaver JA, del Aguila LF, Evans WJ. Humanaging is associated with altered TNF-a production during hyperglyce-mia and hyperinsulinemia. Am J Physiol Endocrinol Metab. 2001;281:E1137–43.
25. Solomon TP, Haus JM, Kelly KR, Cook MD, Riccardi M, Rocco M,Kashyap SR, Barkoukis H, Kirwan JP. Randomized trial on the effectsof a 7-d low-glycemic diet and exercise intervention on insulinresistance in older obese humans. Am J Clin Nutr. 2009;90:1222–9.
26. Beulens JW, de Bruijne LM, Stolk RP, Peeters PH, Bots ML, GrobbeeDE, van der Schouw YT. High dietary glycemic load and glycemic indexincrease risk of cardiovascular disease among middle-aged women: apopulation-based follow-up study. J Am Coll Cardiol. 2007;50:14–21.
27. Schulze MB, Liu S, Rimm EB, Manson JE, Willett WC, Hu FB.Glycemic index, glycemic load, and dietary fiber intake and incidence oftype 2 diabetes in younger and middle-aged women. Am J Clin Nutr.2004;80:348–56.
28. Riccardi G, Rivellese AA, Giacco R. Role of glycemic index andglycemic load in the healthy state, in prediabetes, and in diabetes. Am JClin Nutr. 2008;87:S269–74.
29. Kelly KR, Brooks LM, Solomon TP, Kashyap SR, O’Leary VB, KirwanJP. The glucose-dependent insulinotropic polypeptide and glucose-stimulated insulin response to exercise training and diet in obesity. Am JPhysiol Endocrinol Metab. 2009;296:E1269–74.
30. Mohanty P, Hamouda W, Garg R, Aljada A, Ghanim H, Dandona P.Glucose challenge stimulates reactive oxygen species (ROS) generationby leucocytes. J Clin Endocrinol Metab. 2000;85:2970–3.
31. Evans JL, Goldfine ID, Maddux BA, Grodsky GM. Oxidative stress andstress-activated signaling pathways: a unifying hypothesis of type 2diabetes. Endocr Rev. 2002;23:599–622.
32. Ghanim H, Aljada A, Hofmeyer D, Syed T, Mohanty P, Dandona P.Circulating mononuclear cells in the obese are in a proinflammatorystate. Circulation. 2004;110:1564–71.
33. Hotamisligil GS. Inflammatory pathways and insulin action. Int J ObesRelat Metab Disord. 2003;27 Suppl 3:S53–5.
34. Perseghin G, Petersen K, Shulman GI. Cellular mechanism of insulinresistance: potential links with inflammation. Int J Obes Relat MetabDisord. 2003;27 Suppl 3:S6–11.
35. Esposito K, Nappo F, Marfella R, Giugliano G, Giugliano F, Ciotola M,Quagliaro L, Ceriello A, Giugliano D. Inflammatory cytokine concen-trations are acutely increased by hyperglycemia in humans: role ofoxidative stress. Circulation. 2002;106:2067–72.
36. Morohoshi M, Fujisawa K, Uchimura I, Numano F. Glucose-dependentinterleukin 6 and tumor necrosis factor production by human peripheralblood monocytes in vitro. Diabetes. 1996;45:954–9.
37. Bastard JP, Maachi M, Van Nhieu JT, Jardel C, Bruckert E, Grimaldi A,Robert JJ, Capeau J, Hainque B. Adipose tissue IL-6 content correlateswith resistance to insulin activation of glucose uptake both in vivo andin vitro. J Clin Endocrinol Metab. 2002;87:2084–9.
38. Kern PA, Ranganathan S, Li C, Wood L, Ranganathan G. Adipose tissuetumor necrosis factor and interleukin-6 expression in human obesityand insulin resistance. Am J Physiol Endocrinol Metab. 2001;280:E745–51.
39. Pedersen M, Bruunsgaard H, Weis N, Hendel HW, Andreassen BU,Eldrup E, Dela F, Pedersen BK. Circulating levels of TNF-alpha andIL-6-relation to truncal fat mass and muscle mass in healthy elderlyindividuals and in patients with type-2 diabetes. Mech Ageing Dev.2003;124:495–502.
40. Karastergiou K, Mohamed-Ali V. The autocrine and paracrine roles ofadipokines. Mol Cell Endocrinol. 2010;318:69–78.
41. Rotter V, Nagaev I, Smith U. Interleukin-6 (IL-6) induces insulinresistance in 3T3–L1 adipocytes and is, like IL-8 and tumor necrosisfactor-alpha, overexpressed in human fat cells from insulin-resistantsubjects. J Biol Chem. 2003;278:45777–84.
42. Lagathu C, Bastard JP, Auclair M, Maachi M, Capeau J, Caron M.Chronic interleukin-6 (IL-6) treatment increased IL-6 secretion andinduced insulin resistance in adipocyte: prevention by rosiglitazone.Biochem Biophys Res Commun. 2003;311:372–9.
43. Christiansen T, Paulsen SK, Bruun JM, Pedersen SB, Richelsen B.Exercise-training versus diet-induced weight-loss on metabolic risk fac-tors and inflammatory markers in obese subjects. A 12-week random-ized intervention-study. Am J Physiol Endocrinol Metab. 2010;298:E824–31.
44. Dekker MJ, Lee S, Hudson R, Kilpatrick K, Graham TE, Ross R,Robinson LE. An exercise intervention without weight loss decreasescirculating interleukin-6 in lean and obese men with and without type 2diabetes mellitus. Metabolism. 2007;56:332–8.
45. Baggiolini M. Chemokines and leukocyte traffic. Nature. 1998;392:565–8.
46. Lumeng CN, Deyoung SM, Bodzin JL, Saltiel AR. Increased inflamma-tory properties of adipose tissue macrophages recruited during diet-induced obesity. Diabetes. 2007;56:16–23.
47. Sell H, Dietze-Schroeder D, Kaiser U, Eckel J. Monocyte chemotacticprotein-1 is a potential player in the negative cross-talk between adiposetissue and skeletal muscle. Endocrinology. 2006;147:2458–67.
48. Sartipy P, Loskutoff DJ. Monocyte chemoattractant protein 1 in obesityand insulin resistance. Proc Natl Acad Sci USA. 2003;100:7265–70.
49. Vrolix R, Mensink RP. Effects of glycemic load on metabolic riskmarkers in subjects at increased risk of developing metabolic syndrome.Am J Clin Nutr. 2010;92:366–74.
1094 Kelly et al.
Related Documents