Effects of Amylose, Corn Protein, and Corn Fiber Contents on Production of Ethanol from Starch-Rich Media' X. Wu, 2 R. Zhao, 2 D. Wang, 23 S. R. Bean , 4 P. A. Seib,' M. R. Tuinstra, 6 M. Campbell,' and A. O'Brien' ABSTRACT Cereal Chem. 83(5):569-575 The effects of amylose, protein, and fiber contents on ethanol yields were evaluated using artificially formulated media made from commer- cial corn starches with different contents of amylose, corn protein, and corn as well as media made from different cereal sources including corn, sorghum, and wheat with different amylose contents. Second-order response-surface regression models were used to study the effects and interactions of amylose, protein, and fiber contents on ethanol yield and conversion efficiency. The results showed that the amylose content of starches had a significant (I' < 0.001) effect on ethanol conversion effi- ciency. No signiticant effect of protein content on ethanol production was observed. Fiber did not show a significant effect on ethanol fermentation A great amount of research recently has been conducted to increase ethanol yield and conversion efficiency from starch-rich sources. For example, plant breeders have made a great effort to develop new and improved corn hybrids with higher starch content to increase ethanol yields (Bothast and Schlicher 2005). Wang et al (1997, 1998) studied the saccharification and fermen- tation characteristics of rye and triticale for ethanol production. The saccharification and fermentation efficiencies of oats, barley, wheat, and pearl millet have also been investigated (Thomas and Ingledew 1990, 1995; Thomas et al 1995; Sosulski et a! 1997; Wu et al 2006). These authors reported conversion efficiencies of starch to ethanol in the above-mentioned cereal grains were 90%. The effects of other factors such as fermentation temperatures, free amino nitrogen, nitrogen sources, bacterial contamination, and preprocessing of feedstock on ethanol fermentation have also been investigated (Thomas and Ingledew 1990; O'Connor-Cox et al 1991; Jones and Ingledew 1994a,b; Sosulski et al 1997; Naren- dranath et al 2000). But the relationships among the chemical composition of grains and ethanol production have not suffi- ciently been studied. The major components of cereal grains are starch, protein, fiber, and lipids. The bioavailability of starch may differ among grain cultivars and may affect the conversion rate and final yield of etha- nol (Moorthy 2002). Starch is a polymer of glucose, composed of various genetically determined ratios of amylose and amylopectin. Amylose is basically a linear polymer with 200 to 6,000 glucose units (MW 10-l0') linked mainly by a-.1,4 bonds (99%) and few a-1,6 bonds (<1%). Amylopectin, on the other hand, is a I Contribution No 06-173-i from the Kansas Agricultural Experiment Station, Manhattan, KS 66506. 2 Department of Biological and Agricultural Engineering, Kansas State University, Manhattan, KS 66506. 3 Corresponding author. Phone: 785-532-2919, Fax: 785-532-5825. Email: dwang@ ksu.edu USDA-ARS Grain Marketing & Production Research Center, Manhattan, KS 66502. Names are necessary to report factually on available data; however, the USDA neither guarantees nor warrants the standard of the product, and the use of the name by the USDA implies no approval of the product to the exclusion of others that may also he suitable. Department of Grain Science and Industry, Kansas State University, Manhattan, KS 66506. 5 Department of Agronomy, Kansas State University, Manhattan, KS 66506. Science Division, Truman State University, Kirksville, MO 63501. DOl: 10.1094/CC-83-0569 This article is in the public domain and not copyrightable. It may be freely re- printed with customary crediting of the source. AACC International, Inc., 2006. either. Conversion efficiencies increased as the amylose content de- creased, especially when the amylose content was >35%. The reduced quadratic model fits the conversion efficiency data better than the full quadratic model does. Fermentation tests on mashes made from corn, sorghum. and wheat samples with different amylose contents confirmed the adverse effect of amylose content on fermentation efficiency. High- temperature cooking with agitation significantly increased the conversion efficiencies on mashes made from high-amylose (35-70%) ground corn and starches. A cooking temperature of ?l60°C was needed on high- amylose corn and starches to obtain a conversion efficiency equal to that of normal corn and starch. much larger and highly branched polysaccharide with up to 3x 10' glucose units and a MW of 5x 10⁸ and linked by 95% (x- IA and 5% (x-1,6 bonds. In general, normal cereal starches contain 20-30% amylose and 70-80% amylopectin. Starches with <5% and >35% arnylose are defined as waxy and high-amylose starch, respectively (Tester et al 2004b). Cereal cultivars with various amylose contents have been developed in corn, rice, wheat, barley, and sorghum (Jacobs and Delcour 1998; Tester et al 2004a,h; Goesaert et a! 2005). Many researchers have studied the structure and physical prop- erties of high-amylose starches. High-amylose starches had higher gelatinization temperatures (Shi et al 1998) and formed stronger gels (Case et a! 1998). Starch gels with different arnylose contents had different continuous matrix structure (Leloup et al 1991). Higher cooking temperatures and branched starch molecules could retard the reassociation of starch molecules. phase separation, and network development processes during cooling (Case et al 1998; Klucinec and Thompson 1999). The resistance of high-amyldse starches to a-amylase was also investigated (Sievert and Pomeranz 1989, 1990; Richardson et al 2000; Brumovsky and Thompson 2001; Evans and Thompson 2004). They reported that the resid- ual resistant starches found after amylolytic hydrolysis of gela- tinized starches consisted mainly of retrograded amylose. Reid et al (1998) reported that the amylose-to-arnylopectin ratio of starches significantly affected its fermentation to fatty acid by Clostridiurn buryricum, especially after pancreatin digestion and retrograda- tion. But there is no information about the effects of arnylose content in starches and grains on the production of ethanol and other bioproducts. The objective of this study was to determine the effects of amylose contents of starches. protein, and fiber con- tents, as well as their interactions, on yeast fermentation of starchy materials to ethanol. MATERIALS AND METHODS Starch and Cereal Samples The starch samples used in this study were Amioca (essentially pure amylopectin), Melojel (28% amylose), Hylon-V (50% arnylose), and Hylon-VII (70% amylose), which were of corn origin. They were kindly provided by the National Starch and Chemical Co. (Bridgewater. NJ). High-arnylose (corn-70, corn- 55, and corn-35), normal, and waxy corn samples were obtained from Mark Campbell's 2004 summer breeding nursery at the Truman State University Agricultural Research Farm at Kirks- ville. MO. Corn-70 represents an S5 inbred line derived from the Vol. 83, No. 5, 2006 569

Welcome message from author
This document is posted to help you gain knowledge. Please leave a comment to let me know what you think about it! Share it to your friends and learn new things together.
Transcript
Effects of Amylose, Corn Protein, and Corn Fiber Contentson Production of Ethanol from Starch-Rich Media'
X. Wu, 2 R. Zhao, 2 D. Wang, 23 S. R. Bean ,4 P. A. Seib,' M. R. Tuinstra, 6 M. Campbell,' and A. O'Brien'
ABSTRACT Cereal Chem. 83(5):569-575
The effects of amylose, protein, and fiber contents on ethanol yieldswere evaluated using artificially formulated media made from commer-cial corn starches with different contents of amylose, corn protein, andcorn as well as media made from different cereal sources includingcorn, sorghum, and wheat with different amylose contents. Second-orderresponse-surface regression models were used to study the effects andinteractions of amylose, protein, and fiber contents on ethanol yield andconversion efficiency. The results showed that the amylose content ofstarches had a significant (I' < 0.001) effect on ethanol conversion effi-ciency. No signiticant effect of protein content on ethanol production wasobserved. Fiber did not show a significant effect on ethanol fermentation
A great amount of research recently has been conducted toincrease ethanol yield and conversion efficiency from starch-richsources. For example, plant breeders have made a great effort todevelop new and improved corn hybrids with higher starchcontent to increase ethanol yields (Bothast and Schlicher 2005).Wang et al (1997, 1998) studied the saccharification and fermen-tation characteristics of rye and triticale for ethanol production.The saccharification and fermentation efficiencies of oats, barley,wheat, and pearl millet have also been investigated (Thomas andIngledew 1990, 1995; Thomas et al 1995; Sosulski et a! 1997; Wuet al 2006). These authors reported conversion efficiencies ofstarch to ethanol in the above-mentioned cereal grains were 90%.The effects of other factors such as fermentation temperatures,free amino nitrogen, nitrogen sources, bacterial contamination,and preprocessing of feedstock on ethanol fermentation have alsobeen investigated (Thomas and Ingledew 1990; O'Connor-Cox etal 1991; Jones and Ingledew 1994a,b; Sosulski et al 1997; Naren-dranath et al 2000). But the relationships among the chemicalcomposition of grains and ethanol production have not suffi-ciently been studied.
The major components of cereal grains are starch, protein, fiber,and lipids. The bioavailability of starch may differ among graincultivars and may affect the conversion rate and final yield of etha-nol (Moorthy 2002). Starch is a polymer of glucose, composed ofvarious genetically determined ratios of amylose and amylopectin.Amylose is basically a linear polymer with 200 to 6,000 glucoseunits (MW 10-l0') linked mainly by a-.1,4 bonds (99%) andfew a-1,6 bonds (<1%). Amylopectin, on the other hand, is a
I Contribution No 06-173-i from the Kansas Agricultural Experiment Station,Manhattan, KS 66506.
2 Department of Biological and Agricultural Engineering, Kansas State University,Manhattan, KS 66506.
3 Corresponding author. Phone: 785-532-2919, Fax: 785-532-5825. Email: [email protected] Grain Marketing & Production Research Center, Manhattan, KS 66502.Names are necessary to report factually on available data; however, the USDAneither guarantees nor warrants the standard of the product, and the use of thename by the USDA implies no approval of the product to the exclusion of othersthat may also he suitable.Department of Grain Science and Industry, Kansas State University, Manhattan,KS 66506.
5 Department of Agronomy, Kansas State University, Manhattan, KS 66506.Science Division, Truman State University, Kirksville, MO 63501.
DOl: 10.1094/CC-83-0569This article is in the public domain and not copyrightable. It may be freely re-printed with customary crediting of the source. AACC International, Inc., 2006.
either. Conversion efficiencies increased as the amylose content de-creased, especially when the amylose content was >35%. The reducedquadratic model fits the conversion efficiency data better than the fullquadratic model does. Fermentation tests on mashes made from corn,sorghum. and wheat samples with different amylose contents confirmedthe adverse effect of amylose content on fermentation efficiency. High-temperature cooking with agitation significantly increased the conversionefficiencies on mashes made from high-amylose (35-70%) ground cornand starches. A cooking temperature of ?l60°C was needed on high-amylose corn and starches to obtain a conversion efficiency equal to thatof normal corn and starch.
much larger and highly branched polysaccharide with up to 3x 10'glucose units and a MW of 5x 10⁸ and linked by 95% (x- IAand 5% (x-1,6 bonds. In general, normal cereal starches contain20-30% amylose and 70-80% amylopectin. Starches with <5%and >35% arnylose are defined as waxy and high-amylose starch,respectively (Tester et al 2004b). Cereal cultivars with variousamylose contents have been developed in corn, rice, wheat, barley,and sorghum (Jacobs and Delcour 1998; Tester et al 2004a,h;Goesaert et a! 2005).
Many researchers have studied the structure and physical prop-erties of high-amylose starches. High-amylose starches had highergelatinization temperatures (Shi et al 1998) and formed strongergels (Case et a! 1998). Starch gels with different arnylose contentshad different continuous matrix structure (Leloup et al 1991).Higher cooking temperatures and branched starch molecules couldretard the reassociation of starch molecules. phase separation, andnetwork development processes during cooling (Case et al 1998;Klucinec and Thompson 1999). The resistance of high-amyldsestarches to a-amylase was also investigated (Sievert and Pomeranz1989, 1990; Richardson et al 2000; Brumovsky and Thompson2001; Evans and Thompson 2004). They reported that the resid-ual resistant starches found after amylolytic hydrolysis of gela-tinized starches consisted mainly of retrograded amylose. Reid etal (1998) reported that the amylose-to-arnylopectin ratio of starchessignificantly affected its fermentation to fatty acid by Clostridiurnburyricum, especially after pancreatin digestion and retrograda-tion. But there is no information about the effects of arnylosecontent in starches and grains on the production of ethanol andother bioproducts. The objective of this study was to determinethe effects of amylose contents of starches. protein, and fiber con-tents, as well as their interactions, on yeast fermentation of starchymaterials to ethanol.
MATERIALS AND METHODS
Starch and Cereal SamplesThe starch samples used in this study were Amioca (essentially
pure amylopectin), Melojel (28% amylose), Hylon-V (50%arnylose), and Hylon-VII (70% amylose), which were of cornorigin. They were kindly provided by the National Starch andChemical Co. (Bridgewater. NJ). High-arnylose (corn-70, corn-55, and corn-35), normal, and waxy corn samples were obtainedfrom Mark Campbell's 2004 summer breeding nursery at theTruman State University Agricultural Research Farm at Kirks-ville. MO. Corn-70 represents an S5 inbred line derived from the
Vol. 83, No. 5, 2006 569
cross GUAT209:S13 x (OH43ae x H99ae) possessing 70% starchamylose and developed cooperatively between Truman State Uni-versity and the Germplasm Enhancement of Maize program.Corn-55 and corn-35 were developed from an open-pollinatedsynthetic cultivar Hsyn-99 that was backcross-converted topossess the recessive starch-altering alleles amylose extender (ae)and dull (du) sugary-2 (su2), respectively. Both corn-55 and corn-35 were developed by David Glover at Purdue University. Normaland waxy sorghum samples were obtained from the Departmentof Agronomy, Kansas State University (Manhattan, KS). Normaland waxy wheat samples were from the USDA-ARS (Lincoln,NE). The grain samples were ground to a fine meal (99% passeda 1.19-mm sieve) using a Magic Mill III Plus grain mill (MagicMill Products & Appliances, Monsey, NY). The chemical compo-sition of the corn, wheat, and sorghum samples are listed in Table I.
Central-Composite DesignThe central-composite design approach was used to study the
effects and interactions of corn amylose, protein, and fiber con-tents on ethanol yield and conversion efficiency. The central-com-posite design is a type of response-surface methodology (RSM)that is focused on characteristics of the fit response functionwhere optimum estimated response values occur. Five concentra-tions of amylose (5.56-64.4%), corn gluten (8.5-15.5%) (Sigma,St. Louis, MO), and corn fiber (8.5-15.5%) were used in the formu-lated fermentation media. The actual contents and arrangementsof these factors are detailed in Table II. The software Design-Expert 5 (Stat-Ease Corporation, Minneapolis, MN) was used for
model development and model analysis. Starches and cereal sam-ples with different amylose contents were used to verify the resultsfrom the response-surface design tests. All experiments wereconducted in triplicate. Results were presented as averages ofreplicates.
Preparation of Fermentation Media from Starchesand Grain Samples
The liquefaction and saccharification processes were the sameas those described by Wu et al (2006). The components of theformulated media, containing 20.0 g of starch or 30.0 g of cerealsamples, were mixed with 100 mL of distilled water in 250-mLErlenmeyer flasks. The mixed slurries were digested in a waterbath shaker at 95°C for 45 min after the addition of 10 1.tL ofLiquozyme SC DS (240 KNU/g, 1.25 g/mL; Novozyme, Frank-linton, NC), an enzyme preparation containing a thermostable a-amylase as major component. During the early stage of digestion,flasks were shaken manually to prevent the formation of a gel.The digested mashes were taken out of the water bath after 45min and cooled to 80°C, and a second dose of 10 tL of Liquo-zyme was added to each flask. The liquefaction step was con-tinued in the water bath shaker at 120 rpm for an additional 30min at 80°C. Then saccharification was conducted in a 60°Cwater bath shaker at 120 rpm for 30 min after 100 ttL of Spirizyme(750 AGUIg, 1.15 g/mL; Novozyme, Franklinton, NC), anenzyme preparation containing a glucoamylase as a major com-ponent, was added to each flask. The definitions of KNU andAGU are the same as described by Wu et al (2006). The starch
TABLE IMoisture Content and Chemical Composition (%, db) of Cereal Samplesa
Samples Moisture (%)Starch Protein
Corn-70 12.1 ± 0.0362.8 ± 0.1011.3 ± 0.01Corn-55 11.1±0.1261.8±0.1011.0±0.04Corn-35 11.8 ± 0.0265.3 ± 0.068.0 ± 0.02Normal corn 13.0 ± 0.0072.6 ± 0.158.4 ± 0.0Waxy corn 11.3-12.3 65.3-72.98.8-13.7Normal sorghum11.6-12.1 71.2-77.910.6-14.8Waxy sorghum 9.6-12.7 68.4-72.49.7-12.2Normal wheat 10.7-14.3 63.4-70.513.6-17.8Waxy wheat 10.2-13.0 59.9-62.88.4-10.5
Data are either mean ± SD for the same sample or ranges of the same type samples.
Crude FatCrude Fiber Ash4.7 ± 0.10 2.1 ± 0.03
1.8 ± 0.03
6.3 ± 0.10 1.8 ± 0.03
1.6 ± 0.025.7 ± 0.03
2.0 ± 0.08
1.4 ± 0.014.0 ± 0.01 2.0 ± 0.05
1.5 ± 0.03
4.5-6.3 1.1-1.9
1.4-1.83.2-3.6
1.2-1.6 1.5-1.93.3-6.8
1.0-1.7 1.3-1.71.6-3.2 1.5-2.2 1.6-2.12.6-3.1 1.7-2.0 1.6-1.7
TABLE IICentral Composite Design Arrangement of Parameters and Response
Coded Variables Actual Variables (%)
Protein FiberAmyloseProtein
18.0
10.0
52.0
10.0
18.0 14.0
52.0
14.0
18.0
10.0
52.0
10.0
18.0
14.0
52.0 14.00
0
5.6
12.00
0
64.4 12.0-1.732
0
35.0
8.51.732
0
35.0
15.50 -1.732
35.0
12.00
1.732
35.0
12.00
0
35.0
12.00
0
35.0
12.00
0
35.0
12.00
0
35.0
12.00
0
35.0
12.00
0
35.0
12.0
Tests Amylose
23456789 -1.73210 1.73211 012 013 014 015 016 017 018 019 020 0
Fiber
10.010.010.010.014.014.014.014.012.012.012.012.08.5
15.512.012.012.012.012.012.0
ConversionEfficiency(%)
86.8280.6186.9880.6288.2583.4486.6980.2789.5774.3483.9185.0484.1084.7584.3884.5886.2584.6584.0884.24
a Percentage of amylose was based on total starch, and percentages of protein and fiber were based on total dry mass.
570 CEREAL CHEMISTRY
hydrolysates (100 mL/flask) were supplemented with 0.5 g ofyeast extract, 0.1 g of K 2HPO4 , and 20 ppm of CaC1 2 , whereas thecereal hydrolysates (100 mL/flask) were supplemented with 0.3 gof yeast extract and 0.1 g of K2HPO4.
High-temperature cooking was conducted in a reactor (ParrInstrument Co., Moline, IL) at 120, 140, and 160°C for high-amylose starch and grain samples. Samples (90.0 g of grain or60.0 g of starch) were first digested with Liquozyme (0.3 KNU/gof starch) at 95°C for 30 min in the reactor with the mixer stirringat 200 rpm. Samples were then were heated to the designatedtemperatures (120, 140, or 160°C) for 10 mm. After the tempera-ture was cooled to 80°C, a second dose of Liquozyme (0.3KNU/g of starch) was added, and the liquefaction continued foran additional 30 mm. The liquefied samples were cooled to 60°Cand divided into flasks (30 g of dry mass of grains or 20 g of drymass of starch/flask) for saccharification. Saccharification wasconducted at 60°C for 30 min in a water bath shaker at 120 rpmwith 100 iL of Spirizyme (85 AGU) added into each flask. Thesupplements were similar to those during the 95°C cookingdescribed earlier.
Insoluble particles in mashes made from high-amylose starchesand corn samples were separated by centrifugation at 4,500 rpmfor 10 min and were washed twice with 75 mL of distilled watereach time.
Fermentation ProcessesThe prepared mashes made from 20 g dry mass of starches or
30 g dry mass of ground cereals were adjusted to a value of pH4.2-4.3 with 2N HCl and inoculated with 5 mL of yeast precul-ture (strain Saccharomyces cerevisiae ATCC 24860). The yeastpreculture was prepared as described by Suresh et al (1999) andZhan et al (2003). The cell concentration of the yeast preculturewas checked by its A 600 value on a BioRite spectrophotometer andby using a counting chamber (Fisher Scientific, Fairlawn, NJ). TheA60)) values of the 48 hr precultures were 2.4 for cell concentra-tions between 2 and 2.8 x 10⁸ cells/mL, which ensured that inoc-ulated mashes had a cell concentration of zl .5 x 10 cells/mL.
The ethanol fermentation was performed in an incubator shaker(model 12400, New Brunswick Scientific, Edison, NJ) at 30°C for72 hr at 150 rpm. Because ethanol fermentation is an anaerobicprocess, the fermentation flasks were sealed with 5-bubblers filledwith 2 mL of mineral oil. The ethanol fermentation process wasmonitored by measuring the weights of the fermentation flaskswith 5-bubblers because the weight loss by CO 2 evolution isproportional to the amount of ethanol produced during ethanolfermentation (Joekes et al 1998). The final ethanol concentrationin the fermented beer was determined by the HPLC method afterdistillation as described in AOAC method 942.06 (AOAC Inter-national 1999).
Analytical MethodsCrude fat, moisture, protein, and ash contents were determined
by following AOAC official methods 920.39, 925.10, 990.03, and942.05 (AOAC International 1999). The total starch contents and
amylose and amylopectin contents were determined by using theMegazyme total starch and amylose/amylopectin kits (Bray, Ire-land) (Approved Method 76-13, AACC International 2000; Method996.11, AOAC International 1999) (available at Megazyme athttp://secure.megazyme.comldownloads/enldatalK-AMYL.pdO.Crude fiber was analyzed by the ANKOM A200 filter bag tech-nique (ANKOM Technology) (available at http://www.ankom.comI09_procedures/procedures3 .shtml).
The ethanol concentration was determined by HPLC equippedwith a Rezex RCM column (Phenomenex, Torrance, CA) and aShimadzu RID-10A detector (Columbia, MD). The temperaturesof the column and detection cell were set at 80 and 40°C, res-pectively. The flow rate of the mobile phase (water) was 0.6 mL/mm. The retention time of ethanol was z16.70 mm. Conversionefficiencies were calculated as a ratio of the experimentally deter-mined ethanol yield to the theoretical ethanol yield. The total starchcontents in the samples were used to calculate the theoreticalethanol yields, assuming 1.0 g of starch converts to 1.11 g ofglucose and that 1.0 g of glucose should generate 0.511 g ofethanol (Thomas et al 1996).
RESULTS AND DISCUSSION
Conversion Efficiencies of Formulated MashesQuadratic models are often used in describing the effects of
multiparameters on responses and the fitness of a model is asses-sed by analysis of variance. The conversion-efficiency data fromour central-composite design tests were fitted into both quadraticand reduced quadratic models, and the analyses of variance resultsof both models are shown in Table III. According to Joglekar andMay (1987), a good model should has a significance level of P <0.05, an R2 value >0.800, and a coefficient of variance (CV) value<10%. On the basis of these criteria, both the full quadratic modeland the reduced quadratic model are adequate models for pre-dicting the fermentation efficiency. The reduced quadratic modelfits the obtained data better than the full quadratic model, however,because the P value in the lack-of-fit test (0.186) and the adjustedR2 value (0.893) for the reduced quadratic model are greater thanthose of the full quadratic model (0.091 and 0.869, respectively).The P values of all the coefficients in the full quadratic model arebetween 0.18 and 0.94, except those for amylose and amylosesquared (<0.0001 and 0.0247), which suggests the necessity ofreducing the full quadratic model. The reduced quadratic modelis: Efficiency (%) = 88.70 - 0.01513 x A - 0.0028 x A 2, where Arepresents the percentage of amylose in starch.
The P values for the coefficients (amylose and amylose squared)in the reduced quadratic model are both <0.0001, which meansthat amylose content is a significant predictor of conversion effi-ciency in ethanol fermentation with media made from starchymaterials. Therefore, the reduced quadratic model is an adequatemodel in predicting conversion efficiency on media made fromstarches with different amylose contents when cooking at 95°C.
Model results showed that amylose content significantly affectsthe conversion efficiency; that is, the greater the amylose content,
Model
Quadratic model
Reduced quadratic model
TABLE IllAnalyses of Variance for Quadratic and Reduced Quadratic Models
Source of Variance DFSum of SquaresMean of Squares
Regression 9196.2 21.80Residual 10 14.51 1.451Pure error 5 3.118 0.624Lack-of-fit 511.39 2.278
R2 = 0.931, Radj 2 = 0.869, CV = 1.43%, PRESS = 80.0Regression 2190.4 95.21
Residual 1720.24 1.191Pure error 5 3.118 0.624Lack-of-fit 12 17.12 1.427
R2 = 0.904, Rd,2 = 0.893, CV = 1.30%, PRESS = 45.7
F Prob>F
15.020.0001
3.6530.091
79.96<0.0001
2.2890.1855
Vol. 83, No. 5, 2006 571
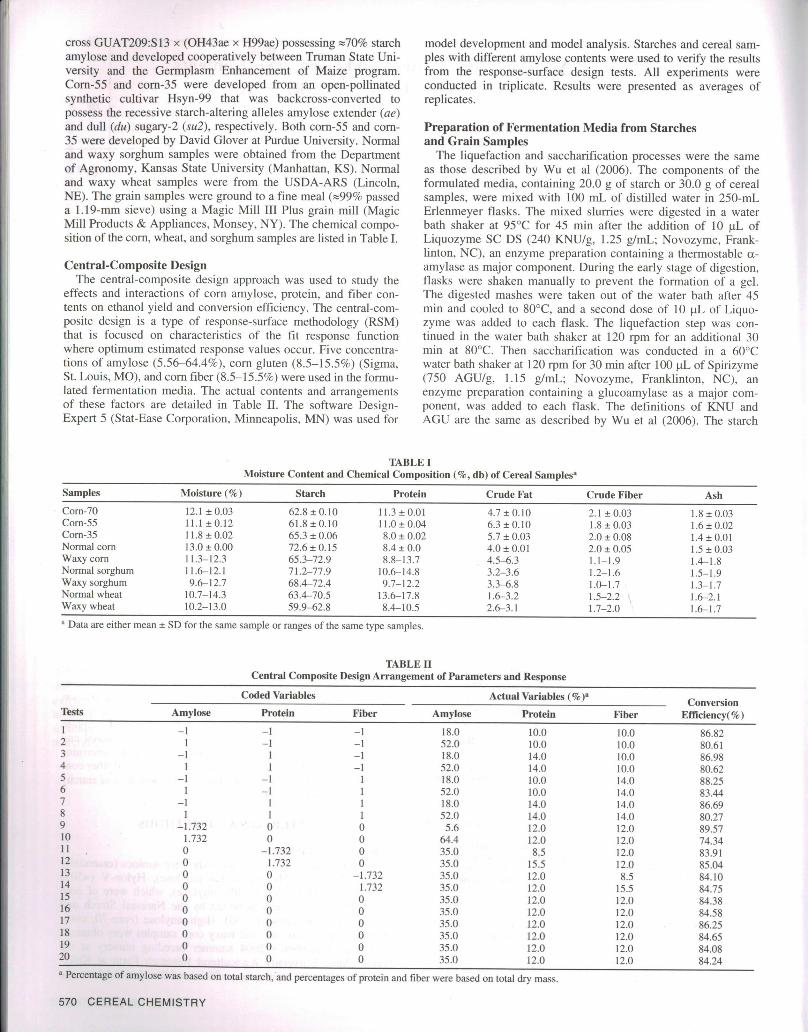
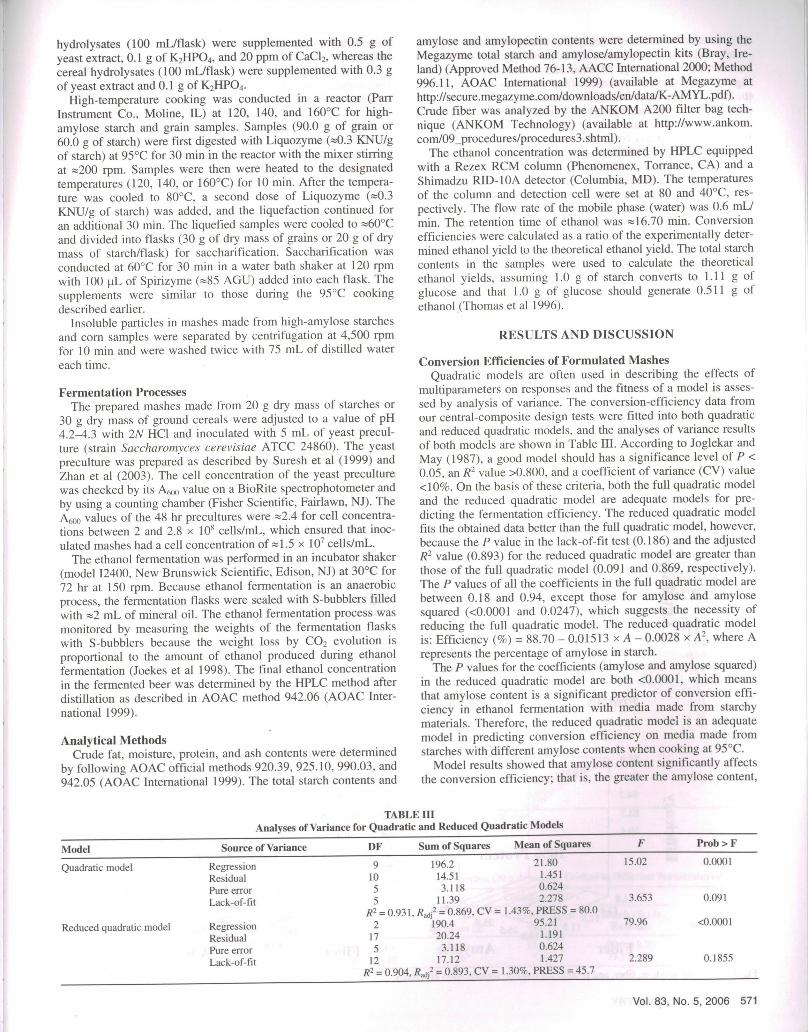
the lower the conversion efficiency. The other two parameters, cornprotein and corn fiber contents, did not have significant effects onthe conversion efficiency, which is also clearly demonstrated inFig. 1. Even though the protein or fiber contents changed from 10to 14%, the fermentation efficiencies remained essentially thesame when the amylose contents were fixed. The fermentation effi-ciencies decreased remarkably as the amylose contents increasedfrom 18 to 52% at any fixed fiber level (Fig. IA and B) or fixedprotein level (Fig. IC and D).
Saccharomyces cerevisiae can not utilize protein as its nitrogensource when proteins are present as large polymers; therefore, am-monium, urea, or amino acids have to be added to support thegrowth of yeast cells (Rose and Harrison 1987). The amount andkinds of nitrogen source not only affect the growth of the yeastcells but also influence the amounts of by-products and ethanolyield. Yeast usually produce more ethanol and less glycerol andother by-products when amino acids are used as a supplementalnitrogen source (Reed and Nagodawithana 1991). O'Connor-Coxet al (1991) reported that a high concentration of free-amino nitro-gen not only facilitated the fermentation rate but also increased theethanol yield. In this study, no effect of corn protein content onfermentation rate or efficiency was observed. This is probably so'because yeast extract (0.5 g) containing more than 50% free-amino nitrogen was added to the fermentation medium (100 mL).The supplemented yeast extract evidently provided enough freeamino acids to meet the growth and fermentation requirements ofthe yeast. Little, if any, free-amino nitrogen existed in the corngluten meal added to the artificial media. S. cerevisiae could nothydrolyze cellulose and use it as its sole carbon source. In addi-tion, the nonsignificant effects of fiber contents on fermentationefficiency suggested that there are no fiber-degrading enzymes
present in the Liquozyme SC DS and Spirizyme enzyme prepa-rations.
Fermentation Results from Grains with Different AmyloseContents
To confirm the results from the formulated corn media withdifferent amylose contents in the central-composite design tests,other starchy substrates including corn, corn starch, sorghum, andwheat samples with various amylose contents were used to pro-duce ethanol. Results from fermentation of grains and starchesalso indicated that amylose content had a significant effect onethanol fermentation efficiency (Table IV). Again, the conversionefficiency decreased as the amylose content increased. This resultis also in agreement with the findings in starch-digestibilitystudies by Okuda et al (2005). They reported that the digestibilityof rice starch was negatively correlated with the amylose contentof the starch. Tester et al (2004b) obtained similar results whenthey studied the amylolytic hydrolysis of waxy, normal, and high-amylose starches. Conversion efficiency to produce ethanol by fer-mentation is usually 90-95%. The reasons for the imperfect con-version efficiency may include incomplete hydrolyses of starches,glucose consumption (due to the growth of yeast during fermen-tation), or the inevitable production of by-products during ethanolfermentation (Rose and Harrison 1987; Kosaric and Vardar-Sukan 2001). Starch granules consist of amylose and amylopectinthat form a semicrystalline structure. These starch granules areresistant to the digestion of a-amylase and amyloglucosidase. Foramylolytic enzymes to readily hydrolyze starch, starch molecules(amylose and amylopectin) have to be changed into amorphousform and become easily accessible to the hydrolyzing enzymes bya process known as gelatinization (Jacobs and Delcour 1998;
88.0
86.1
84.2
82.3
80.4
. 0 ̂12.010.0
Protein
52.035.0
18.0 26.5
Amylose
14.013.(
10.0Protein
52.0
218.0
26.5
Amylose
88.0
A 86.1
84.2
82.3cj80.4
10% Fiber
88.0
86.1
84.2
82.3
80.4
10% Protein
14.0
13.0 52.0
10.0 18.0 26.5
Fiber AmyloseFig. 1. Effects of amylose. fiber, and protein contents on fermentation efficiency.
572 CEREAL CHEMISTRY
88.0
86.1
IE84.2
82.3
80.4
14% Protein
14.0 52.0543.5
Fiber10.0 18.0Amylose
Tester et al 2004b). Starches from different botanical sources orfrom the same source but with different amylose contents mayhave very different gelatinization temperatures and ranges, whichcan be determined by differential scanning calorimetry (DSC)thermal analysis (Shi et al 1998; Klucinec and Thompson 1999;Liu et al 2005). The gelatinization temperatures of starches fromdifferent sources can be as low as 60°C (ii et al 2004) or as highas 144-166°C for Hylon-V and 154-171°C for Hylon-VII (Nation-al Starch Food Innovation 2005). Because of the existence of starchgranules with high gelatinizing temperatures, and the formation ofamylose-lipid complex and reassociation of amylose moleculesduring gelatinization (Boltz and Thompson 1999) and enzymatichydrolysis, there is always some starch that escapes hydrolysis byamylolytic enzymes. This was observed in an earlier study by 1-leb-eda and Leach (1974), in which 2% of the starch in industrialprocesses for dextrose production remained undigested as insolu-ble particles in the hydrolysates. Evans and Thompson (2004)reported no clear relationship between the amylose content andenzyme-resistant starch contents. But, in most instances, resistant-starch contents increase as the amylose content in starch increases(Berry 1986; Sievert and Pomeranz 1989). For example, theamylose levels in starches from waxy corn, potato, wheat, normalcorn, pea, amylomaize V. and amylomaize VII are <1.0, 20, 25,26, 33, 53. and 70%, respectively, whereas their enzyme-resistantstarch contents are 2.5, 4.4, 7.8, 7.0, 10.5, 17.8, and 21.3%,respectively (Sievert and Pomeranz 1989, 1990). Results from ourstudy showed a similar trend; the insoluble particles from cornstarch with z6, 18, 52, and 64% amylose were 0.5, 7.6, 13.5, and29.4%, respectively, after cookinng at 95°C and liquefied with a-amylase and saccharified with glucoamylase.
Several researchers reported that a high-temperature treatment(Wursch and Koellreutter 1992; Ezeogu et al 2005) or stirring ofthe starch slurry during gelatinization (McCleary and Monaghan2002; Woo and Seib 2002) can significantly decrease the enzyme-
resistant starch content in starch-based samples. These observa-tions and the features of DSC thermograms of high-amylosestarches (Shi et al 1998; Klucinec and Thompson 1999; Brumov-sky and Thompson 2001) suggest that cooking high-amylosestarches at higher temperature, with shearing, may significantlyincrease the digestibility of the high-amylose starches and there-fore improve the conversion efficiency.
Improving Fermentation Efficiency by High-TemperatureCooking and Stirring
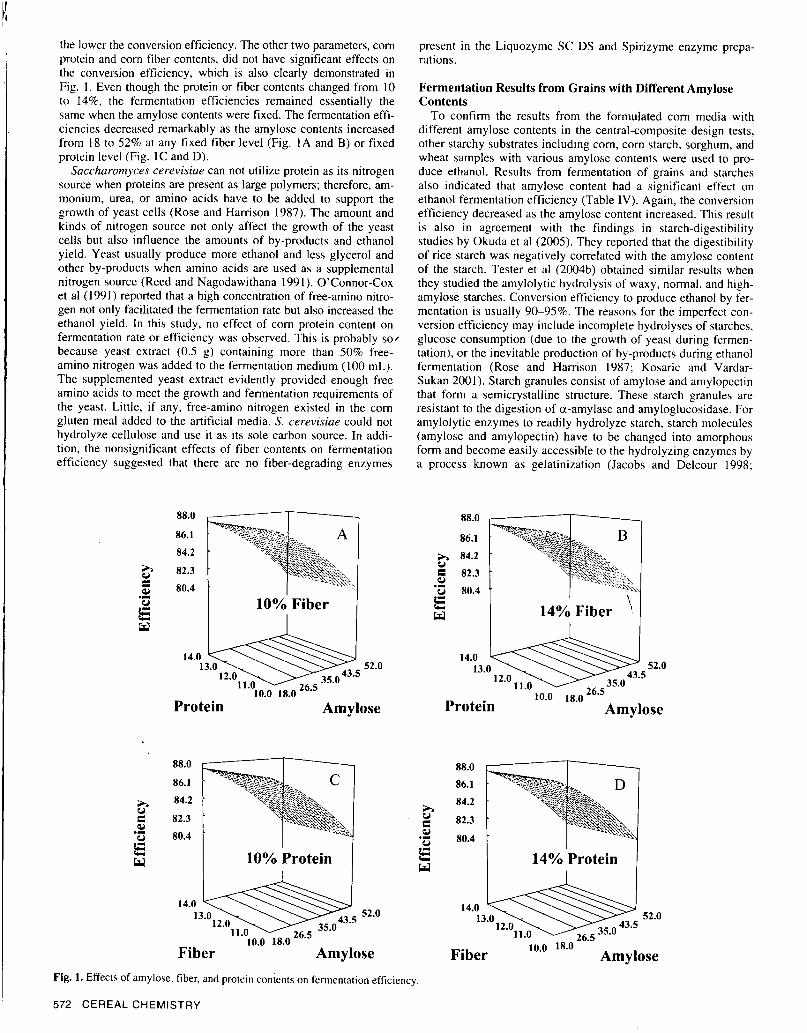
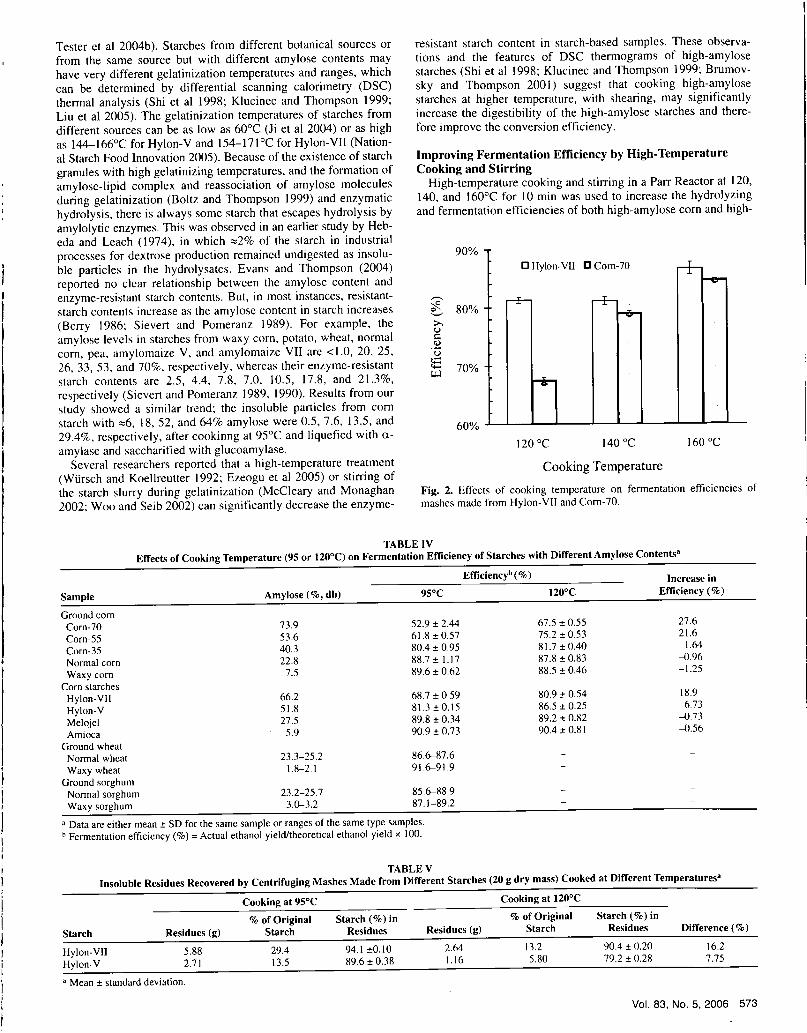
High-temperature cooking and stirring in a Parr Reactor at 120,140, and 160°C for 10 min was used to increase the hydrolyzingand fermentation efficiencies of both high-amylose corn and high-
120°C140°C160°C
Cooking Temperature
Fig. 2. Effects of cooking temperature on fermentation efficiencies ofmashes made from Hylon-VII and Corn-70.
90%
, 80%>.0
5)
70%
60%
TABLE IVEffects of Cooking Temperature (95 or 120°C) on Fermentation Efficiency of Starches with Different Amylose Contents'
Efficiencyh(%) Increase inSample Amylose (%, db) 95°C 120°C Efficiency (%)
73.953.640.322.8
7.5
66.251.827.5
5.9
23.3-25.21.8-2.1
23.2-25.73.0-3.2
Ground cornCorn-70Corn-55Corn-35Normal cornWaxy corn
Corn starchesHylon- VIIHylon-VMelojelAmioca
Ground wheatNormal wheatWaxy wheat
Ground sorghumNormal sorghumWaxy sorghum
52.9 ± 2.4461.8 ±0.5780.4 ± 0.9588.7±1.1789.6 ± 0.62
68.7 ± 0.5981.3 ± 0.1589.8 ± 0.3490.9 ± 0.73
86.6-87.691.6-91.9
85.6-88.987.1-89.2
67.5 ± 0.5575.2±0.5381.7 ± 0.4087.8 ± 0.8388.5 ± 0.46
80.9 ± 0.5486.5 ± 0.2589.2 ± 0.8290.4 ± 0.81
27.621.6
1.64-0.96-1.25
18.96.73
-0.73-0.56
a Data are either mean ± SD for the same sample or ranges of the same type samples.Fermentation efficiency (%) = Actual ethanol yield/theoretical ethanol yield x 100.
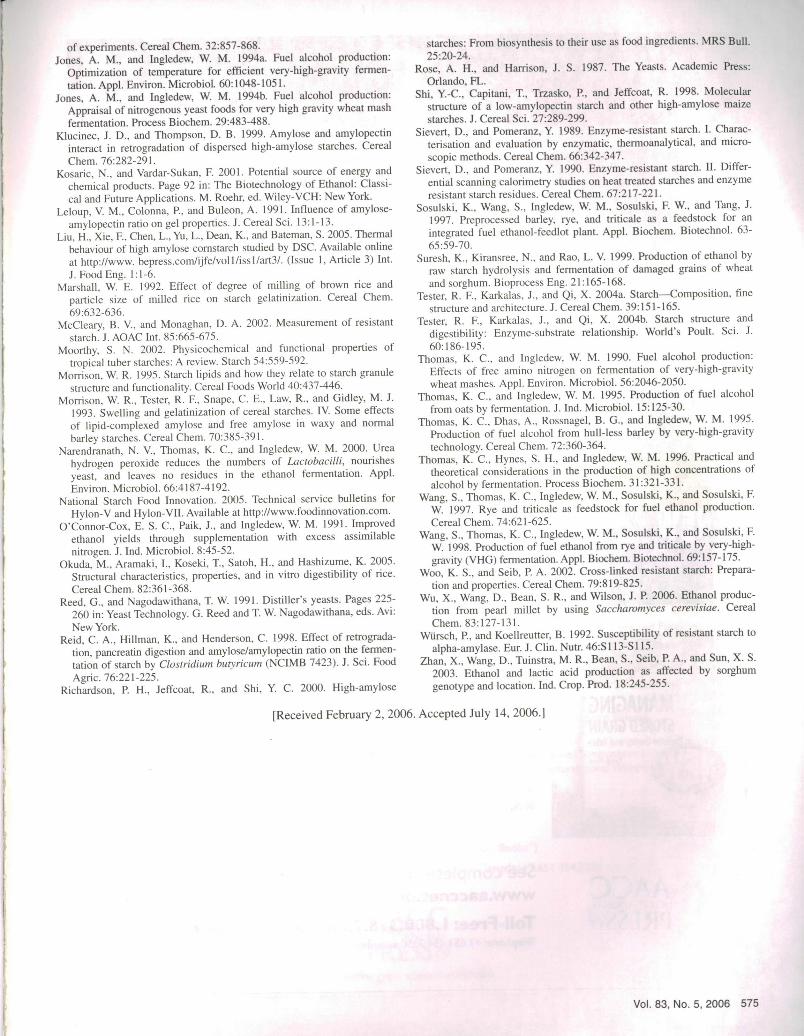
TABLE VInsoluble Residues Recovered by Centrifuging Mashes Made from Different Starches (20 g dry mass) Cooked at Different Temperatures'
Cooking at 95°C% of OriginalStarch (%) in
Starch Residues (g)StarchResidues
Hylon-VII 5.88 29.494.1 ±0.10Hylon-V 2.71 13.589.6 ± 0.38
a Mean ± standard deviation.
Cooking at 120°C% of OriginalStarch (%) in
Residues (g)StarchResiduesDifference (%)
2.6413.290.4 ± 0.2016.2
1.16 5.8079.2 ±0.287.75
Vol. 83, No. 5, 2006 573
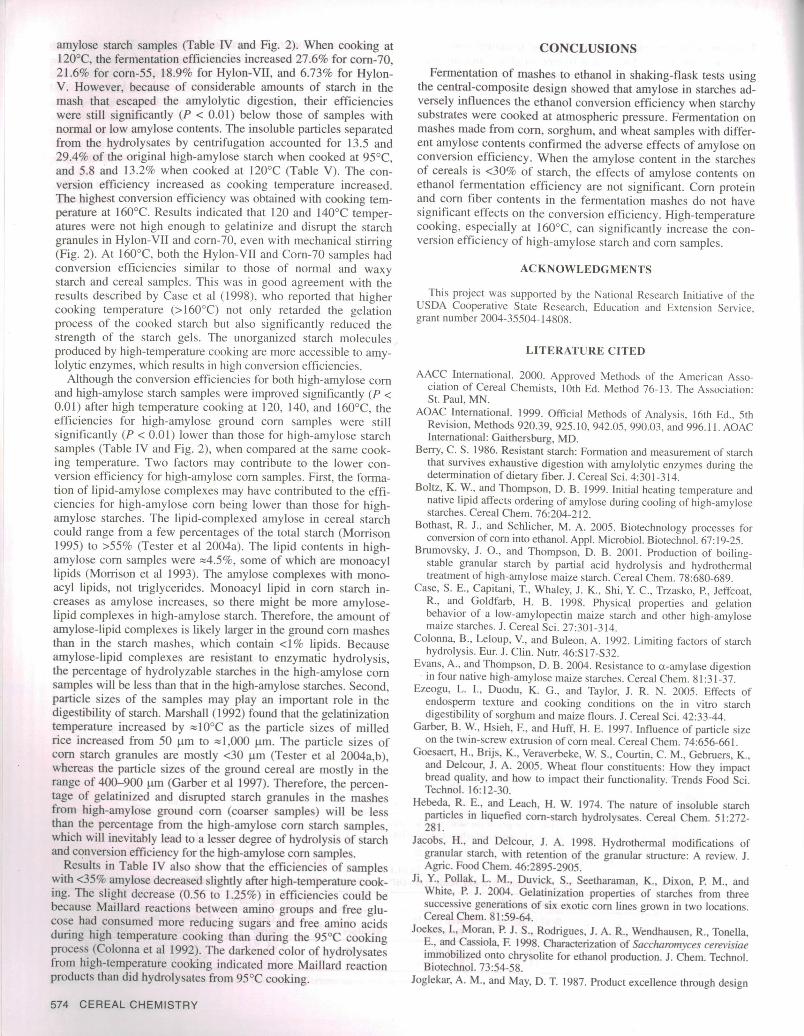
amylose starch samples (Table IV and Fig. 2). When cooking at120°C, the fermentation efficiencies increased 27.6% for corn-70,21.6% for corn-55, 18.9% for Hylon-VII, and 6.73% for Hylon-V. However, because of considerable amounts of starch in themash that escaped the amylolytic digestion, their efficiencieswere still significantly (P < 0.01) below those of samples withnormal or low amylose contents. The insoluble particles separatedfrom the hydrolysates by centrifugation accounted for 13.5 and29.4% of the original high-amylose starch when cooked at 95°C,and 5.8 and 13.2% when cooked at 120°C (Table V). The con-version efficiency increased as cooking temperature increased.The highest conversion efficiency was obtained with cooking tem-perature at 160°C. Results indicated that 120 and 140°C temper-atures were not high enough to gelatinize and disrupt the starchgranules in Hylon-VII and corn-70, even with mechanical stirring(Fig. 2). At 160°C, both the Hylon-VII and Corn-70 samples hadconversion efficiencies similar to those of normal and waxystarch and cereal samples. This was in good agreement with theresults described by Case et al (1998), who reported that highercooking temperature (>160°C) not only retarded the gelationprocess of the cooked starch but also significantly reduced thestrength of the starch gels. The unorganized starch moleculesproduced by high-temperature cooking are more accessible to amy-lolytic enzymes, which results in high conversion efficiencies.
Although the conversion efficiencies for both high-amylose cornand high-amylose starch samples were improved significantly (P <0.01) after high temperature cooking at 120, 140, and 160°C, theefficiencies for high-amylose ground corn samples were stillsignificantly (P < 0.01) lower than those for high-amylose starchsamples (Table IV and Fig. 2), when compared at the same cook-ing temperature. Two factors may contribute to the lower con-version efficiency for high-amylose corn samples. First, the forma-tion of lipid-amylose complexes may have contributed to the effi-ciencies for high-amylose corn being lower than those for high-amylose starches. The lipid-complexed amylose in cereal starchcould range from a few percentages of the total starch (Morrison1995) to >55% (Tester et a! 2004a). The lipid contents in high-amylose corn samples were 4.5%, some of which are monoacyllipids (Morrison et aI 1993). The amylose complexes with mono-acyl lipids, not triglycerides. Monoacyl lipid in corn starch in-creases as amylose increases, so there might be more amylose-lipid complexes in high-amylose starch. Therefore, the amount ofamylose-lipid complexes is likely larger in the ground corn mashesthan in the starch mashes, which contain <1% lipids. Becauseamylose-lipid complexes are resistant to enzymatic hydrolysis,the percentage of hydrolyzable starches in the high-amylose cornsamples will be less than that in the high-amylose starches. Second,particle sizes of the samples may play an important role in thedigestibility of starch. Marshall (1992) found that the gelatinizationtemperature increased by l0°C as the particle sizes of milledrice increased from 50 lim to 1,000 um. The particle sizes ofcorn starch granules are mostly <30 .tm (Tester et al 2004a,b),whereas the particle sizes of the ground cereal are mostly in therange of 400-900 I.Lni (Garber et al 1997). Therefore, the percen-tage of gelatinized and disrupted starch granules in the mashesfrom high-amylose ground corn (coarser samples) will be lessthan the percentage from the high-amylose corn starch samples,which will inevitably lead to a lesser degree of hydrolysis of starchand conversion efficiency for the high-amylose corn samples.
Results in Table IV also show that the efficiencies of sampleswith <35% amylose decreased slightly after high-temperature cook-ing. The slight decrease (0.56 to 1.25%) in efficiencies could bebecause Maillard reactions between amino groups and free glu-cose had consumed more reducing sugars and free amino acidsduring high temperature cooking than during the 95°C cookingprocess (Colonna et al 1992). The darkened color of hydrolysatesfrom high-temperature cooking indicated more Maillard reactionproducts than did hydrolysates from 95°C cooking.
574 CEREAL CHEMISTRY
CONCLUSIONS
Fermentation of mashes to ethanol in shaking-flask tests usingthe central-composite design showed that amylose in starches ad-versely influences the ethanol conversion efficiency when starchysubstrates were cooked at atmospheric pressure. Fermentation onmashes made from corn, sorghum, and wheat samples with differ-ent amylose contents confirmed the adverse effects of amylose onconversion efficiency. When the amylose content in the starchesof cereals is <30% of starch, the effects of amylose contents onethanol fermentation efficiency are not significant. Corn proteinand corn fiber contents in the fermentation mashes do not havesignificant effects on the conversion efficiency. High-temperaturecooking, especially at 160°C, can significantly increase the con-version efficiency of high-amylose starch and corn samples.
ACKNOWLEDGMENTS
This project was supported by the National Research Initiative of theUSDA Cooperative State Research, Education and Extension Service,grant number 2004-35504-14808.
LITERATURE CITED
AACC International. 2000. Approved Methods of the American Asso-ciation of Cereal Chemists, 10th Ed. Method 76-13. The Association:St. Paul, MN.
AOAC International. 1999. Official Methods of Analysis, 16th Ed., 5thRevision, Methods 920.39, 925.10, 942.05, 990.03, and 996.11. AOACInternational: Gaithersburg, MD.
Berry, C. S. 1986. Resistant starch: Formation and measurement of starchthat survives exhaustive digestion with amylolytic enzymes during thedetermination of dietary fiber. J. Cereal Sci. 4:301-314.
Boltz, K. W., and Thompson, D. B. 1999. Initial heating temperature andnative lipid affects ordering of amylose during cooling of high-amylosestarches. Cereal Chem. 76:204-212.
Bothast, R. J., and Schlicher, M. A. 2005. Biotechnology processes forconversion of corn ethanol. Appl. Microbiol. Biotechnol. 67:19-25.
Brumovsky, J. 0., and Thompson, D. B. 2001. Production of boiling-stable granular starch by partial acid hydrolysis and hydrothermaltreatment of high-amylose maize starch. Cereal Chem. 78:680-689.
Case, S. E., Capitani, T., Whaley, J. K., Shi, Y. C., Trzasko, P., Jeffcoat,R., and Goldfarb, H. B. 1998. Physical properties and gelationbehavior of a low-amylopectin maize starch and other high-amylosemaize starches. J. Cereal Sci. 27:301-314.
Colonna, B., Leloup, V., and Buleon, A. 1992. Limiting factors of starchhydrolysis. Eur. J. Clin. Nutr. 46:S 17-S32.
Evans, A., and Thompson, D. B. 2004. Resistance to cc-amylase digestionin four native high-amylose maize starches. Cereal Chem. 81:31-37.
Ezeogu, L. 1., Duodu, K. G., and Taylor, J. R. N. 2005. Effects ofendosperm texture and cooking conditions on the in vitro starchdigestibility of sorghum and maize flours. J. Cereal Sci. 42:33-44.
Garber, B. W., Hsieh, F., and Huff, H. E. 1997. Influence of particle sizeon the twin-screw extrusion of corn meal. Cereal Chem. 74:656-661.
Goesaert, H., Brijs, K., Veraverbeke, W. S., Courtin, C. M.. Gebruers, K.,and Delcour, J. A. 2005. Wheat flour constituents: How they impactbread quality, and how to impact their functionality. Trends Food Sci.Technol. 16:12-30.
Hebeda, R. E., and Leach, H. W. 1974. The nature of insoluble starchparticles in liquefied corn-starch hydrolysates. Cereal Chem. 51:272-281.
Jacobs, H., and Delcour, J. A. 1998. Hydrothermal modifications ofgranular starch, with retention of the granular structure: A review. J.Agric. Food Chem. 46:2895-2905.
Ji, Y., Pollak, L. M., Duvick, S., Seethararnan, K., Dixon, P. M., andWhite, P. J. 2004. Gelatinization properties of starches from threesuccessive generations of six exotic corn lines grown in two locations.Cereal Chem. 81:59-64.
Joekes, I., Moran, P. J. S., Rodrigues, J. A. R., Wendhausen, R., Tonella,E., and Cassiola, F 1998. Characterization of Saccharomyces cerevisiaeimmobilized Onto chrysolite for ethanol production. J. Chem. Technol.Biotechnol. 73:54-58.
Joglekar, A. M., and May, D. T. 1987. Product excellence through design
of experiments. Cereal Chem. 32:857-868.Jones, A. M., and Ingledew, W. M. 1994a. Fuel alcohol production:
Optimization of temperature for efficient very-high-gravity fermen-tation. Appi. Environ. Microbiol. 60:1048-1051.
Jones, A. M., and Ingledew, W. M. 1994b. Fuel alcohol production:Appraisal of nitrogenous yeast foods for very high gravity wheat mashfermentation. Process Biochem. 29:483-488.
Klucinec, J. D., and Thompson, D. B. 1999. Amylose and amylopectininteract in retrogradation of dispersed high-amylose starches. CerealChem. 76:282-291.
Kosaric, N., and Vardar-Sukan, F. 2001. Potential source of energy andchemical products. Page 92 in: The Biotechnology of Ethanol: Classi-cal and Future Applications. M. Roehr, ed. Wiley-VCH: New York.
Leloup, V. M., Colonna. P., and Buleon, A. 1991. Influence of amylose-amylopectin ratio on gel properties. J. Cereal Sci. 13:1-13.
Liu, H., Xie, F., Chen, L., Yu, L., Dean. K., and Bateman, S. 2005. Thermalbehaviour of high amylose cornstarch studied by DSC. Available onlineat http://www. bepress.comlijfe/voll/iss I/art3!. (Issue 1, Article 3) Int.J. Food Eng. 1:1-6.
Marshall, W. E. 1992. Effect of degree of milling of brown rice andparticle size of milled rice on starch gelatinization. Cereal Chem.69:632-636.
McCleary, B. V., and Monaghan, D. A. 2002. Measurement of resistantstarch. J. AOAC Int. 85:665-675.
Moorthy, S. N. 2002. Physicochemical and functional properties oftropical tuber starches: A review. Starch 54:559-592.
Morrison, W. R. 1995. Starch lipids and how they relate to starch granulestructure and functionality. Cereal Foods World 40:437-446.
Morrison, W. R., Tester, R. F., Snape, C. E., Law, R., and Gidley, M. J.1993. Swelling and gelatinization of cereal starches. IV. Some effectsof lipid-complexed amylose and free amylose in waxy and normalbarley starches. Cereal Chem. 70:385-391.
Narendranath, N. V., Thomas, K. C., and lngledew, W. M. 2000. Ureahydrogen peroxide reduces the numbers of Lactobacilli, nourishesyeast, and leaves no residues in the ethanol fermentation. Appl.Environ. Microbiol. 66:4187-4192.
National Starch Food Innovation. 2005. Technical service bulletins forHylon-V and Hylon-VII. Available at http://www.foodinnovation.com .
O'Connor-Cox, E. S. C., Paik, J., and Ingledew, W. M. 1991. Improvedethanol yields through supplementation with excess assimilablenitrogen. J. Ind. Microbiol. 8:45-52.
Okuda, M., Aramaki, I., Koseki, T., Satoh, H., and Hashizume, K. 2005.Structural characteristics, properties, and in vitro digestibility of rice.Cereal Chem. 82:361-368.
Reed, G., and Nagodawithana, T. W. 1991. Distiller's yeasts. Pages 225-260 in: Yeast Technology. G. Reed and T. W. Nagodawithana, eds. Avi:New York.
Reid, C. A., Hillman, K., and Henderson, C. 1998. Effect of retrograda-tion, pancreatin digestion and amylose/amylopectin ratio on the fermen-tation of starch by Clostridium butyricum (NCIMB 7423). J. Sci. FoodAgric. 76:221-225.
Richardson, P. H., Jeffcoat, R., and Shi, Y. C. 2000. High-amylose
starches: From biosynthesis to their use as food ingredients. MRS Bull.25:20-24.
Rose, A. H., and Harrison, J. S. 1987. The Yeasts. Academic Press:Orlando, FL.
Shi, Y.-C., Capitani, T., Trzasko, P., and Jeffcoat, R. 1998. Molecularstructure of a low-amylopectin starch and other high-amylose maizestarches. J. Cereal Sci. 27:289-299.
Sievert, D., and Pomeranz, Y. 1989. Enzyme-resistant starch. I. Charac-terisation and evaluation by enzymatic, thermoanalytical, and micro-scopic methods. Cereal Chem. 66:342-347.
Sievert. D., and Pomeranz, Y. 1990. Enzyme-resistant starch. II. Differ-ential scanning calorimetry studies on heat treated starches and enzymeresistant starch residues. Cereal Chem. 67:217-221.
Sosulski, K., Wang, S., Ingledew, W. M., Sosulski, F. W., and Tang, J.1997. Preprocessed barley, rye, and triticale as a feedstock for anintegrated fuel ethanol-feedlot plant. App!. Biochem. Biotechno!. 63-65 :59-70.
Suresh, K., Kiransree, N., and Rao. L. V. 1999. Production of ethanol byraw starch hydrolysis and fermentation of damaged grains of wheatand sorghum. Bioprocess Eng. 21:165-168.
Tester, R. F., Karkalas, J., and Qi, X. 2004a. Starch-Composition, finestructure and architecture. J. Cereal Chem. 39:151-165.
Tester, R. F., Karkalas, J., and Qi, X. 2004b. Starch structure anddigestibility: Enzyme-substrate relationship. World's Poult. Sci. J.60:186-195.
Thomas, K. C., and Ingledew, W. M. 1990. Fuel alcohol production:Effects of free amino nitrogen on fermentation of very-high-gravitywheat mashes. App!. Environ. Microbio!. 56:2046-2050.
Thomas, K. C., and lng!edew, W. M. 1995. Production of fuel alcoholfrom oats by fermentation. J. Ind. Microbiol. 15:125-30.
Thomas, K. C., Dhas, A., Rossnage!, B. G., and Ingledew, W. M. 1995.Production of fuel alcohol from hull-less barley by very-high-gravitytechnology. Cereal Chem. 72:360-364.
Thomas, K. C., Hynes, S. H., and lngledew, W. M. 1996. Practical andtheoretical considerations in the production of high concentrations ofalcohol by fermentation. Process Biochem. 31:321-331.
Wang, S., Thomas, K. C., Ingledew, W. M., Sosulski, K., and Sosulski, F.W. 1997. Rye and triticale as feedstock for fuel ethanol production.Cereal Chem. 74:621-625.
Wang, S., Thomas, K. C., Ingledew, W. M., Sosulski, K., and Sosulski, F.W. 1998. Production of fuel ethanol from rye and triticale by very-high-gravity (VHG) fermentation. AppI. Biochem. Biotechno!. 69:157-175.
Woo, K. S., and Seib, P. A. 2002. Cross-linked resistant starch: Prepara-tion and properties. Cereal Chem. 79:819-825.
Wu, X., Wang, D., Bean, S. R., and Wilson, J. P. 2006. Ethanol produc-tion from pearl millet by using Saccharomyces cerevisiae. CerealChem. 83:127-131.
Wursch, P., and Koellreutter. B. 1992. Susceptibility of resistant starch toalpha-amylase. Eur. J. Clin. Nutt. 46:S113-S1 15.
Zhan, X., Wang, D., Tuinstra, M. R., Bean, S., Seib, P. A., and Sun, X. S.2003. Ethanol and lactic acid production as affected by sorghumgenotype and location. Ind. Crop. Prod. 18:245-255.
[Received February 2, 2006. Accepted July 14, 2006.]
Vol. 83, No. 5, 2006 575
Related Documents