The FASEB Journal • Research Communication Effects of a high-fat, low- versus high-glycemic index diet: retardation of insulin resistance involves adipose tissue modulation Evert M. van Schothorst,* ,†,‡,1 Annelies Bunschoten,* ,†,‡ Patrick Schrauwen,* ,§ Ronald P. Mensink,* ,§ and Jaap Keijer* ,†,‡ *Top Institute of Food and Nutrition, Wageningen, The Netherlands; † RIKILT—Institute of Food Safety, Wageningen University and Research Centre, Wageningen, The Netherlands; ‡ Human and Animal Physiology, Wageningen University, Wageningen, The Netherlands; and § Department of Human Biology, Maastricht University, Maastricht, The Netherlands ABSTRACT Beneficial effects of low glycemic index (GI) diets in rodents have been studied using healthy low-fat diets, while the effects might be different on high-fat diets inducing progression of insulin resis- tance. We fed C57BL/6J male mice high-fat low/ high-GI (LGI/HGI) diets for 13 wk. Glucose and insulin tolerance and serum substrates, including adi- pokines, were measured longitudinally. The LGI group showed a significantly higher glucose tolerance from wk 2 onwards, which was supported by lower serum insulin and free fatty acids levels at 8 wk, and a tendency for lower leptin levels, while resistin levels remained simi- lar. At 11 wk, when differences in serum resistin started to increase, differences in serum insulin were dimin- ished. Although food intake was similar throughout the study, body weights and epididymal adipose tissue mass became significantly lower in the LGI group at nec- ropsy. Several serum substrates and adipose tissue leptin mRNA levels, as analyzed by Q-PCR, were, again, significantly lower, whereas adiponectin mRNA levels were higher. Taken together, an LGI high-fat diet maintains higher glucose tolerance and insulin sensitiv- ity via adipose tissue modulation solely because of a difference in the type of carbohydrate, supporting a nutritional approach in the fight against insulin resis- tance.—Van Schothorst, E. M., Bunschoten, A., Schrau- wen, P., Mensink, R. P., Keijer, J. Effects of a high-fat, low versus high glycemic index diet: retardation of insulin resistance involves adipose tissue modulation. FASEB J. 23, 1092–1101 (2009) Key Words: carbohydrate adipokines glucose tolerance The pandemic of obesity, type II diabetes, and asso- ciated cardiovascular diseases is growing worldwide, and prevention is of utmost urgency (1). Although pharmacological intervention will help in the treat- ment of these diseases, prevention might be achieved by nutritional and lifestyle interventions. Furthermore, a dietary approach might add a small but relevant cumulative effect to treatment of insulin resistance and type II diabetes. This is especially relevant in the light of recent findings that intense glucose-lowering pharma- cological therapy increased mortality and did not re- duce cardiovascular events in type II diabetes patients, independent of the class of drugs used (2). As one strategy, a reduction of the glycemic index (GI) of the diet was proposed to have beneficial health effects (3). The GI classifies carbohydrates in terms of the acute blood glucose-elevating properties compared to a stan- dard amount of glucose intake and distinguishes a low GI (LGI; a lower rise in blood glucose and insulin levels spread over a longer time) from a high GI (HGI; a high and quick rise and subsequently fall in blood glucose and insulin levels). Detailed reviews of meta-analyses in humans provide evidence for improvement of diabe- tes-, cardiovascular disease-, and obesity-related param- eters (4 – 6), with the majority of these studies reporting health benefits only for LGI diets. However, inconsis- tencies also exist, most likely because of differences in human diets, such as the proportion and types of carbohydrates and fats ingested, or the total fiber intake, which has profound effects on postprandial glucose response (7). These can be better controlled in animal studies. Animal GI studies were primarily performed using healthy or diabetic rats (8 –13), although only a few studies focused on mice: either wild-type (10, 14, 15), chemically induced obese (15), or genetically modified knockout mice (16). In wild-type mice, an LGI vs. HGI diet with a low-fat diet content resulted in less body fat (10, 15), which was confirmed and extended to obser- vations of lower plasma insulin and triglycerides levels and absence of liver steatosis (14), suggesting but not proving an increased insulin sensitivity. Dysfunctional white adipose tissue (WAT) leads to disease (17–19). WAT performs its metabolic functions 1 Correspondence: Human and Animal Physiology, Wagenin- gen University, Marijkeweg 40, 6709 PG Wageningen, P.O. Box 338, 6700 AH Wageningen, The Netherlands. E-mail: evert. [email protected] doi: 10.1096/fj.08-117119 1092 0892-6638/09/0023-1092 © FASEB

Welcome message from author
This document is posted to help you gain knowledge. Please leave a comment to let me know what you think about it! Share it to your friends and learn new things together.
Transcript

The FASEB Journal • Research Communication
Effects of a high-fat, low- versus high-glycemic indexdiet: retardation of insulin resistance involvesadipose tissue modulation
Evert M. van Schothorst,*,†,‡,1 Annelies Bunschoten,*,†,‡ Patrick Schrauwen,*,§
Ronald P. Mensink,*,§ and Jaap Keijer*,†,‡
*Top Institute of Food and Nutrition, Wageningen, The Netherlands; †RIKILT—Institute of FoodSafety, Wageningen University and Research Centre, Wageningen, The Netherlands; ‡Human andAnimal Physiology, Wageningen University, Wageningen, The Netherlands; and §Department ofHuman Biology, Maastricht University, Maastricht, The Netherlands
ABSTRACT Beneficial effects of low glycemic index(GI) diets in rodents have been studied using healthylow-fat diets, while the effects might be different onhigh-fat diets inducing progression of insulin resis-tance. We fed C57BL/6J male mice high-fat low/high-GI (LGI/HGI) diets for 13 wk. Glucose andinsulin tolerance and serum substrates, including adi-pokines, were measured longitudinally. The LGI groupshowed a significantly higher glucose tolerance from wk2 onwards, which was supported by lower serum insulinand free fatty acids levels at 8 wk, and a tendency forlower leptin levels, while resistin levels remained simi-lar. At 11 wk, when differences in serum resistin startedto increase, differences in serum insulin were dimin-ished. Although food intake was similar throughout thestudy, body weights and epididymal adipose tissue massbecame significantly lower in the LGI group at nec-ropsy. Several serum substrates and adipose tissueleptin mRNA levels, as analyzed by Q-PCR, were, again,significantly lower, whereas adiponectin mRNA levelswere higher. Taken together, an LGI high-fat dietmaintains higher glucose tolerance and insulin sensitiv-ity via adipose tissue modulation solely because of adifference in the type of carbohydrate, supporting anutritional approach in the fight against insulin resis-tance.—Van Schothorst, E. M., Bunschoten, A., Schrau-wen, P., Mensink, R. P., Keijer, J. Effects of a high-fat,low versus high glycemic index diet: retardation ofinsulin resistance involves adipose tissue modulation.FASEB J. 23, 1092–1101 (2009)
Key Words: carbohydrate � adipokines � glucose tolerance
The pandemic of obesity, type II diabetes, and asso-ciated cardiovascular diseases is growing worldwide,and prevention is of utmost urgency (1). Althoughpharmacological intervention will help in the treat-ment of these diseases, prevention might be achievedby nutritional and lifestyle interventions. Furthermore,a dietary approach might add a small but relevantcumulative effect to treatment of insulin resistance and
type II diabetes. This is especially relevant in the light ofrecent findings that intense glucose-lowering pharma-cological therapy increased mortality and did not re-duce cardiovascular events in type II diabetes patients,independent of the class of drugs used (2). As onestrategy, a reduction of the glycemic index (GI) of thediet was proposed to have beneficial health effects (3).The GI classifies carbohydrates in terms of the acuteblood glucose-elevating properties compared to a stan-dard amount of glucose intake and distinguishes a lowGI (LGI; a lower rise in blood glucose and insulin levelsspread over a longer time) from a high GI (HGI; a highand quick rise and subsequently fall in blood glucoseand insulin levels). Detailed reviews of meta-analyses inhumans provide evidence for improvement of diabe-tes-, cardiovascular disease-, and obesity-related param-eters (4–6), with the majority of these studies reportinghealth benefits only for LGI diets. However, inconsis-tencies also exist, most likely because of differences inhuman diets, such as the proportion and types ofcarbohydrates and fats ingested, or the total fiberintake, which has profound effects on postprandialglucose response (7). These can be better controlled inanimal studies.
Animal GI studies were primarily performed usinghealthy or diabetic rats (8–13), although only a fewstudies focused on mice: either wild-type (10, 14, 15),chemically induced obese (15), or genetically modifiedknockout mice (16). In wild-type mice, an LGI vs. HGIdiet with a low-fat diet content resulted in less body fat(10, 15), which was confirmed and extended to obser-vations of lower plasma insulin and triglycerides levelsand absence of liver steatosis (14), suggesting but notproving an increased insulin sensitivity.
Dysfunctional white adipose tissue (WAT) leads todisease (17–19). WAT performs its metabolic functions
1 Correspondence: Human and Animal Physiology, Wagenin-gen University, Marijkeweg 40, 6709 PG Wageningen, P.O. Box338, 6700 AH Wageningen, The Netherlands. E-mail: [email protected]
doi: 10.1096/fj.08-117119
1092 0892-6638/09/0023-1092 © FASEB
in active communication with other organs, for which itsecretes and perceives a large number of differentsignals (20). Among the secreted molecules are theadipokines leptin, adiponectin, and resistin, as well asseveral cytokines. These adipokines play an importantrole in diet-induced obesity (21–23) and insulin resistanceand/or diabetes (24–28). An LGI vs. HGI diet resulted inreduced plasma plasminogen activator-1 (PAI-1) activity(29) and lower leptin levels (15). However, WAT leptinmRNA expression was found not to be significantly differ-ent (15). Furthermore, an LGI diet significantly increasedplasma adiponectin levels in rats (10).
Detailed analysis of progression of whole-body insu-lin resistance as a consequence of the dietary GI has notextensively been performed. Furthermore, the effectsof GI in rodents may be different on a diet with a fatcontent that is more relevant to humans (30, 31) ascompared to the rodent low-fat (chow) diets. Thus far,no rodent studies on the effect of GI have beenperformed using diets that resemble the human diet infat content and composition. This is of particularrelevance because it was shown that fat, and not thecaloric intake, is the crucial stimulus for obesity- anddiabetes-related parameters in C57BL/6J wild-typemouse (32), which can be modulated by different typesof carbohydrates as explained above. We hypothesizethat, on a Western high-fat-diet background, an LGIdiet delays the progression of insulin resistance com-pared to an HGI diet. Young-adult wild-type mice werefed (moderate) high-fat diets differing in GI to investi-gate the causal role of an LGI diet in delaying thehigh-fat diet-induced insulin resistance. The outcomeof this study might contribute to improved nutritionaladvice for those who are at risk for developing obesity,impaired glucose tolerance, or even diabetes.
MATERIALS AND METHODS
Animal study and diets
Male, wild-type C57BL/6JOlaHsd mice (Harlan, Horst, TheNetherlands) 9 wk of age were individually housed in macro-lon cages. Housing was maintained constant at 21°C and 45%humidity, and lights were switched on from 6 AM to 6 PM.The experimental protocol was approved by the AnimalWelfare Committee of Wageningen University, Wageningen,The Netherlands. Food and water were supplied weekly adlibitum, and remaining food was weighed to calculate foodintake. Body weight was measured weekly.
The semisynthetic diets (Research Diet Services B.V., Wijkbij Duurstede, The Netherlands) resembled a Western hu-man diet (Table 1) and differed only in the type of starch; theLGI diet consisted of �60% amylose and 40% amylopectin(C*Amylo Gel 03003, Cerestar Benelux, Bergen op Zoom,The Netherlands), whereas the HGI diet consisted of 100%amylopectin (C*Gel 04201). Vitamin and minerals were ac-cording to the AIN93G diet. Gross energy content was deter-mined in feed using adiabatic bomb calorimetry (model IKAcalorimeter C7000; IKA Werke GmbH & Co. KG, Staufen,Germany) according to ISO Standard 9831. Analyses werecarried out in duplicate.
All 110 mice started the 3 wk acclimation period on theLGI diet. At the start of the intervention, 10 animals weresacrificed (t�0 group), and the remaining 100 mice werestratified on body weight (BW) in 2 groups. One groupcontinued on the LGI diet (mean BWt�0 25.62�0.25 g),whereas the other group was switched to an HGI diet (meanBWt�0 25.68�0.23 g) for a period of 13–14 wk. Of bothgroups, 10 animals were used for glucose tolerance tests(GTTs), 30 for insulin tolerance tests (ITTs), and 10 othersfor blood sampling only, of which the latter are furtherreferred to as nonchallenged (Fig. 1).
Single test meal
In wk 3 of the acclimation period, a single test meal (n�10)after an overnight fast was used to determine the in vivo GI of
TABLE 1. Diet composition
Component
Diet
RGI (glucose) LGI (amylose) HGI (amylopectin)
Acid casein 220.0 220.0 220.0l-Cystine 3.0 3.0 3.0Dextrose monohydrate 534.5 0.0 0.0Amylose (C*Amylo Gel 03003) 0.0 534.5 0.0Amylopectin (C*Gel 04201) 0.0 0.0 534.5Cellulose (Arbocel B800) 50.0 50.0 50.0Lard 101.5 101.5 101.5Corn oil 43.5 43.5 43.5Mineral premix AIN-93G 35.0 35.0 35.0Vitamin premix AIN-93 10.0 10.0 10.0Choline bitartrate 2.5 2.5 2.5Total (g) 1000.0 1000.0 1000.0Calculated energy density (kcal/kg) 4375 4375 4375Measured energy density (kcal/kg)a n.d. 4718 � 45 4671 � 33Carbohydrates (kcal%) 50 50 50Fat (kcal%) 30 30 30Protein (kcal%) 20 20 20
Values are g/kg diet, unless stated otherwise. Reference GI (RGI) diet was used only for a single test meal. aMeasured by bomb calorimetry;mean � sd of 2 samples. n.d. � not determined.
1093GLYCEMIC INDEX DIETS AFFECT WAT METABOLISM

these two GI diets vs. a reference (RGI) diet containingdextrose monohydrate as carbohydrate fraction. Animalsreceiving the single RGI dietary test meal were all grouped inthe t � 0 group. Blood glucose levels were measured using ablood glucose device (FreeStyle, Abbot, Amersfoort, TheNetherlands) after a tail incision (t�0 min) at 8:00 AM. Afteran additional 2 h fasting, a weighed amount of food(2.03�0.05 g) was supplied for exactly 15 min, reweighed,and food intake was calculated. Blood glucose levels weremeasured at time points 15 (end of food intake), 30, 45, 60,90, and 120 min.
GTTs and ITTs
The GTTs and ITTs were performed in wk 0, 2, 5, 8, and 11.Animals were fasted for 5 h from 8:00 AM onwards before thetest. At t � 0 min, fasting blood glucose levels were measuredafter a tail incision. A glucose (2 g/kg BW) or insulin (0.75U/kg BW; Humuline® Regular, Eli Lilly, Houten, The Neth-erlands) solution was injected into the intraperitoneal cavity,followed by blood glucose measurements at time points 15,30, 60, 90, and 120 min.
Blood sampling
In wk 1, 2, 5, 8, and 11, nonchallenged mice were fasted for5 h from 8:00 AM onwards, followed by anesthesia usingisoflurane. Blood was drawn by orbital punction and collectedin serum collection tubes (Greiner Bio-One, Frickenhausen,Germany). Fasting blood glucose levels were measured di-rectly, and serum was collected after centrifugation followingthe manufacturer’s protocol and stored in aliquots at �80°Cfor further analyses.
Necropsy
Mice were fasted for 2 h in wk 13 (GTT and ITT mice) and wk14 (nonchallenged mice) from 8:00 AM onwards and anes-thetized using isoflurane. Blood was sampled after eye extrac-
tion, glucose levels were measured, and serum was collectedas described. Mice were killed using cervical dislocation.Organs were isolated, weighted, and immediately frozen inliquid nitrogen and stored at �80°C for subsequent analyses.Throughout the manuscript we denote the time point ofnecropsy as wk 13.
Of the ITT mice, 10 mice received 30 min before necropsyan insulin injection (0.75 U/kg BW) to analyze acute insulineffects, which were compared and analyzed with ITT mice notreceiving an insulin injection.
Serum parameters
Serum free fatty acid (FFA) levels were measured using theNEFA C kit (Wako Chemicals, GmbH, Neuss, Germany), andvolumes were scaled down to analyze the samples with amicroplate reader (BioTec Synergy HT, Bad Friedrichshall,Germany). Serum samples (5 �l) were measured in duplicateand averaged, and FFA concentrations were calculated usinga standard curve of oleic acid (supplied by the kit). Hepatictriglyceride (TG) content was analyzed as described using a2% liver homogenate (33).
Serum levels of leptin, resistin, insulin, monocyte chemoat-tractant protein-1 (MCP-1), interleukin 6 (IL-6), tumor ne-crosis factor alpha (TNF-�), and PAI-1 were measured usingthe mouse serum adipokine Lincoplex Kit (Linco Research,Nuclilab, Ede, The Netherlands). Sera were diluted 5� inHPE buffer (Sanquin, Amsterdam, The Netherlands), debriswas removed by spinning the sample using SpinX columns(Corning, Schiphol-Rijk, The Netherlands), and possibleinhibition of the immunological Ig fraction in serum wascircumvented by an incubation at gentle shaking for 1 h atroom temperature in 96-well Reacti-BindTM protein L-coatedplates (Pierce, Rockford, IL, USA) before adipokine assaying.The assays were conducted according to the manufacturer’sprotocol and measured using the Luminex X100 system withStarstation software (Applied Cytometry Systems, Dinnington,Sheffield, UK). All individual samples were analyzed in dupli-cate and averaged when the difference between the 2 mea-surements was �5%.
Figure 1. Schematic representation of the study design. All mice started the 3 wk acclimation period on LGI diet (solid line).Asterisk (�) indicates single test meals. Ten mice were sacrificed at the start of the intervention (t�0 group, n�10).Simultaneously, half of the remaining mice were switched to HGI diet (dotted line). Each dietary group was subsequentlysubdivided into 3 subgroups, which underwent in a 3 wk time interval only blood collection (nonchallenged animals, n�10; B),GTTs (n�10; G), or ITTs (n�30; I). Just 30 min before necropsy, a subset of ITT mice received an insulin injection (arrow,n�10) to measure acute insulin function. Dagger (†) indicates necropsy.
1094 Vol. 23 April 2009 VAN SCHOTHORST ET AL.The FASEB Journal

RNA isolation
RNA isolation from WAT was performed as described (34).Briefly, after grinding WAT, RNA was extracted using Trizol(Invitrogen, Breda, The Netherlands) and washed, pelleted,and dissolved in RNase-free water and purified using theRNeasy MinElute Cleanup Kit (Qiagen, Venlo, The Nether-lands). RNA was quantified using the Nanodrop ND-1000spectrophotometer (Isogen Life Sciences, Maarssen, TheNetherlands) and qualified using capillary zone electrophore-sis (Experion, Bio-Rad, Veenendaal, The Netherlands).
Real-time quantitative polymerase chain reaction (Q-PCR)
Differential gene expression of resistin, leptin, and adiponec-tin was assessed using real-time Q-PCR as described (35).Briefly, PCR amplification to obtain relative levels of geneexpression using 2 reference genes (ribosomal protein S15and hypoxanthine phosphoribosyltransferase 1) was per-formed in duplicate and averaged. Primer sequences areshown in Supplemental Table 1. The expression of the genesof interest was normalized against the reference genes usingthe GeNorm normalization factor (36).
Statistical analyses
All data are expressed as means � se. Statistical analyses wereperformed using Prism software (GraphPad Software, SanDiego, CA, USA). Incremental area under the curve (iAUC)for GTTs and ITTs was analyzed using Prism software. Insulinresistance index was estimated by homeostasis model assess-ment (HOMA) using the program HOMA2-IR version 2.2(37) using fasting glucose (mM) and insulin levels. Measure-ments at single time points between 2 groups were analyzedby Student’s t test (Q-PCR results), and those between 3groups were analyzed using 1-way ANOVA (test meal, adipo-kines at section). Time course longitudinal analyses wereanalyzed by repeated-measurements (mixed model) ANOVA.Bonferroni post-tests were used in case ANOVA showedsignificance. P � 0.05 was considered statistically significant.
RESULTS
To investigate the causal role of an LGI diet in delayingthe progression of insulin resistance in comparison toan HGI diet, we fed young-adult wild-type mice moder-ate high-fat diets differing in GI (Table 1). The dietaryfat content of the diets is based on a Western diet (30kcal% fat), which induces insulin resistance in mice toa mild extent. The only difference between the diets isthe type of starch, thereby not influencing the quantityof macro- and micronutrients and the energy contentof the diet. Bomb calorimetry analysis of both diets,which overestimates the amount of energy a body canabsorb, was performed in duplicate to compare mea-sured energy density with calculated energy density.The measured energy density closely approximatedcalculated energy density (Table 1), and the latter wasused in the conversion of food intake to caloric intake.
Test meal
To analyze the difference in GI between the LGI vs.HGI diet, a subset of mice received 1 wk before the start
of the intervention a single test meal after an overnightfast, and blood glucose responses were assessed andcompared to an RGI diet with only glucose as carbohy-drate, being otherwise identical (Table 1). Food intakewas similar between the 3 groups (data not shown). TheGI was significantly lower for the LGI vs. HGI diet, thelatter resembling the RGI diet (Supplemental Fig. 1).Furthermore, the peak time point of plasma glucoselevels for each dietary group shifted from 75 min withthe LGI diet to 60 min with the HGI and 45 min withRGI diet. Altogether, the composition of the GI dietsresulted in a significant GI difference between the 2diets.
Intervention study
During the 13 wk intervention study, several measure-ments were performed periodically, in addition to theweekly assessment of body weight and food intake, asshown schematically in Fig. 1; subgroups are describedin more detail in the Animal Study and Diets section ofMaterials and Methods.
The first observable differences between the 2 GIgroups in body weight appeared at wk 9 (Fig. 2A) andbecame significantly different at wk 13: the HGI micegained on average 7.3 � 0.4 g, whereas the LGI mice
Figure 2. Body weight and food intake. A) Body weights weremeasured weekly and showed only at wk 13 a significantincrease by the HGI (triangles) vs. LGI (squares) diet. ***P �0.001; repeated measurements mixed-model ANOVA. B) Av-erage daily food intake was estimated by dividing weeklyconsumption by 7 and did not differ significantly. Arrowsindicate weeks in which GTTs, ITTs, and blood sampling insubgroups were performed. Data are shown as means � se(n�50).
1095GLYCEMIC INDEX DIETS AFFECT WAT METABOLISM

had a significantly lower weight increase of 5.8 � 0.2 g.Food intake did not differ between the 2 GI groupsthroughout the study (Fig. 2B), resulting in an averagetotal energy intake of 1350 � 20 kcal for the HGI miceand 1355 � 20 kcal for the LGI mice.
Despite the fact that the LGI mice had an equalenergy intake, their body weights were reduced, and atnecropsy absolute and relative epididymal WAT weightwas significantly decreased compared to the HGI mice;this same trend holds for visceral and subcutaneousWAT (Table 2). Other organs investigated, such asheart, and lungs as nonmetabolic tissue, were notdifferent (Table 2), as was absolute liver weight (Table2). Thus, the body composition is altered because of anutritional GI difference. Furthermore, hepatic lipidcontent was significantly increased in the HGI group(Table 2), supporting previously reported data (14).
We next investigated whether the difference in adi-pose tissue mass is reflected in secreted serum adipo-kines. Of these, the inflammation markers MCP-1,TNF-�, and IL-6 showed nondetectable levels. An insu-lin challenge (see below) changed serum adipokinelevels rapidly (data not shown), and we therefore focuson the data of the non-insulin-stimulated 40 mice/dietary group. Leptin was significantly lower in the LGIgroup, as was resistin (Fig. 3A, B), whereas PAI-1 serumlevels were not different (Fig. 3C).
Furthermore, fasting serum FFA and insulin levelswere significantly lower in the LGI group (Fig. 3D, G).Similarly, fasting blood glucose levels were lower in theLGI group, although not significantly (Fig. 3E). Hyper-insulineamia, hyperleptineamia, and higher FFA levelsare hallmarks for a physiological insulin-resistant state,which were all observed in the HGI dietary group. Theinsulin resistance index HOMA-IR showed a signifi-cantly reduced insulin resistance in the LGI group (Fig.3F). At necropsy, all changes in serum parameters (Fig.
3A–E, G) were also observed significantly in the muchsmaller subgroup of nonchallenged animals (Fig. 4).
Above, the focus is on the differences induced by the2 GI diets. Comparison of these data with those ob-tained using the t � 0 group show incremental serumlevels for all 3 adipokines (leptin, resistin, PAI-1),fasting insulin and glucose levels, and HOMA index:lowest levels in the t � 0 group, intermediate levels inthe LGI group, and highest levels in the HGI group(Fig. 3). Levels in the LGI and HGI groups weresignificantly elevated compared to t � 0, whereas in theLGI group, leptin, insulin, and HOMA index weresignificantly diminished compared to the HGI group.This suggests that both diets gradually induce insulinresistance because of their high fat content, althoughage effects cannot be completely excluded. However,the LGI diet attenuates the observed insulin-resistantphenotype compared to the HGI dietary group inde-pendent of age.
Time course of appearance of insulin resistance
To gain insight into the development and delay inprogression of insulin resistance, we performed longi-tudinal analyses in subgroups. Whole-body glucose tol-erance and insulin sensitivity were tested using GTTsand ITTs in 3 wk interval periods. The GTTs showedsignificantly increased glucose tolerance for the LGI vs.HGI group from wk 2 onwards (Fig. 5), while bodyweights were similar (Fig. 2A). When iAUC data wereadjusted for the difference at t � 0, the LGI groupglucose tolerance remained significantly increased at 5and 8 wk (data not shown). Furthermore, the ITTresults in wk 5 and 8 also showed small but significantdecreases in blood glucose levels in the LGI group(Supplemental Fig. 2).
FFA levels were lower from wk 2 onwards in the
TABLE 2. Body and tissue weight
Measure SI unit
t � 13
t � 0 LGI HGI
Body weight g 25.75 � 0.50 31.20 � 0.40*,‡ 32.93 � 0.50*WAT, epididymal mg 317 � 40 593 � 32†,‡ 878 � 55*
% 1.2 � 0.1 1.9 � 0.1†,‡ 2.6 � 0.1*WAT, visceral mg 129 � 12 271 � 29† 298 � 18†
% 0.5 � 0.0 0.8 � 0.1 0.9 � 0.0*WAT, subcutaneous mg 136 � 43 103 � 20 143 � 15
% 0.5 � 0.1 0.3 � 0.1 0.4 � 0.0Liver mg 1044 � 33 1169 � 17† 1155 � 21†
% 4.1 � 0.1 3.8 � 0.1†,‡ 3.5 � 0.0*Hepatic triglyceride contenta g/100 g tissue 2.7 � 0.4 4.3 � 0.9§ 9.7 � 2.1†
Heart mg 179 � 9 171 � 3 214 � 33% 0.7 � 0.0 0.6 � 0.0 0.7 � 0.1
Lung mg 166 � 9 150 � 4 160 � 24% 0.6 � 0.0 0.5 � 0.0 0.5 � 0.1
Data shown as means � se. Statistical significance was analyzed using 1-way ANOVA and Bonferroni post hoc tests. *P � 0.001, †P � 0.05vs. t � 0 group (n�10). ‡P � 0.001, §P � 0.05 vs. HGI (n�50). Relative weight (%) � organ weight (g)/BW (g). aDetermined in 10 mice/dietarygroup.
1096 Vol. 23 April 2009 VAN SCHOTHORST ET AL.The FASEB Journal
nonchallenged LGI group; differences became signifi-cant in wk 8, lost significance in wk 11, but reappearedsignificantly thereafter at necropsy (Fig. 4G). It isknown that a high-fat diet induces initially a reductionin FFA levels (e.g., ref. 38), and it is therefore interest-ing to note that the FFA levels in the HGI groupremained similar, whereas those in the LGI groupindeed decreased in time. Adipokine profiling showedthat leptin and resistin gradually increased less in theLGI vs. the HGI group (leptin from wk 8 onwards,resistin from wk 11 onwards), reaching significance for
both adipokines at necropsy, whereas PAI-1 levels werenot different (Fig. 4A–C). Last, fasting insulin levels andHOMA-IR index reached significantly lower levels in wk8, the difference diminished in wk 11, but at necropsysignificantly lower levels were again observed (Fig. 4D,F). At necropsy, as discussed above, all significantdifferences observed between the nonchallenged sub-groups were also observed in the GTT and ITT sub-groups (Figs. 3, 4). Taken together, this shows higherinsulin sensitivity in the LGI compared to HGI group.
The lower serum adipokine levels in the LGI group
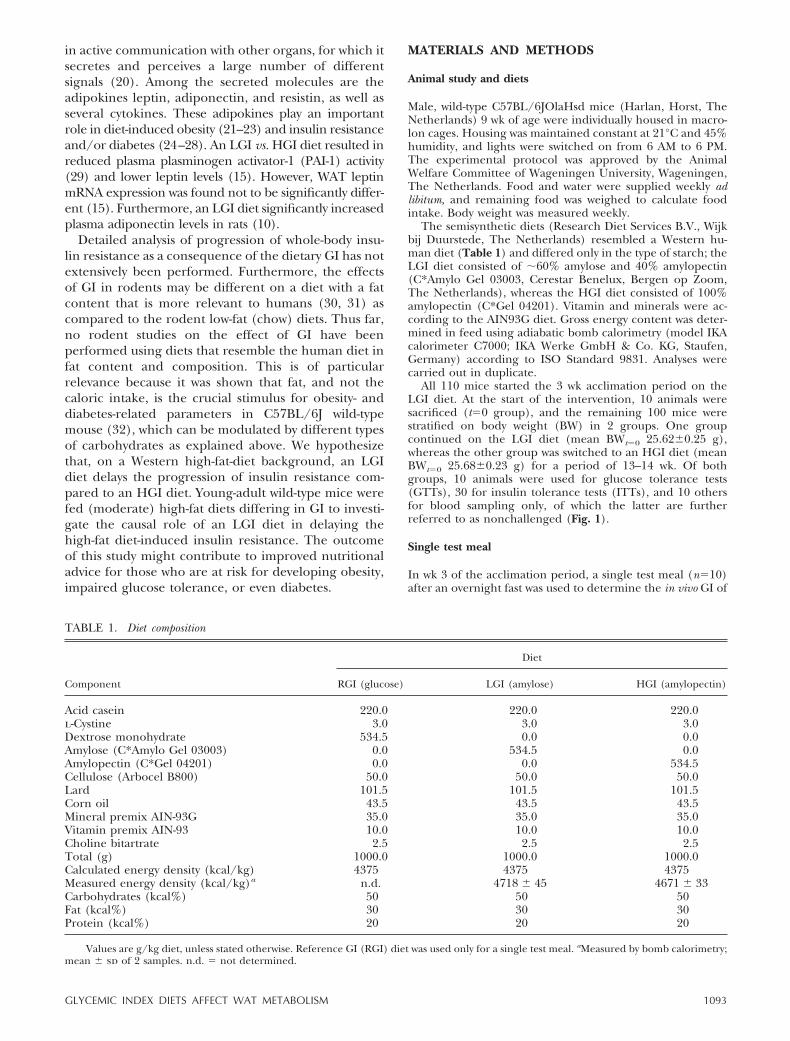
Figure 3. Adipokine,glucose, insulin, andFFA levels. A–C) Adipo-kine serum levels [lep-tin (A), resistin (B),PAI-1 (C)] observed atnecropsy at t � 0(hatched bars, n�10)and at t � 13 wk forthose mice (n�40) notreceiving an insulininjection before nec-
ropsy (LGI group, white bars; HGI group, black bars). D–G) Serum insulin (D), blood glucose (E), insulin resistanceas estimated by HOMA-IR (F), and serum FFA levels (G). For FFA levels, levels after insulin injection 30 min beforenecropsy also are shown, as indicated. *P � 0.05, ***P � 0.001; statistical analysis per analyte (1-way ANOVA,Bonferroni post hoc tests).
Figure 4. Time-dependent regu-lation in nonchallenged animals(n�10). Blood samples (n�10)were withdrawn in wk 0–11 aftera 5 h fast, and in wk 13 (nec-ropsy) after a 2 h fast in thesubset of nonchallenged HGI(triangles) vs. LGI (squares) di-etary animals (Fig. 1, symbol B).Serum leptin (A), serum resistin
(B), serum PAI-1 (C), serum insulin (D), blood glucose (E), insulin resistance as estimated by HOMA-IR (F), and serum FFA levels(G). *P � 0.05, **P � 0.01, ***P � 0.001; statistical analysis per analyte (repeated measurements mixed model ANOVA, Bonferronipost hoc tests).
1097GLYCEMIC INDEX DIETS AFFECT WAT METABOLISM
were investigated further by epididymal WAT geneexpression analysis in the nonchallenged mice; adi-ponectin gene expression analysis was included toenhance our understanding of WAT physiology and itsgene expression changes. Leptin mRNA levels weresignificantly lower in the LGI group, whereas resistinand adiponectin mRNA levels were nonsignificantly
higher (Fig. 6A–C). Gene expression and serum pro-tein level correlations were significant for leptin (Fig.6D), but not for resistin (Fig. 6E).
Finally, insulin sensitivity was also investigated in asubset of animals, using a single insulin injection 30min before necropsy. As glucose levels dropped onaverage 4.2 mM in both dietary groups, lower glucose
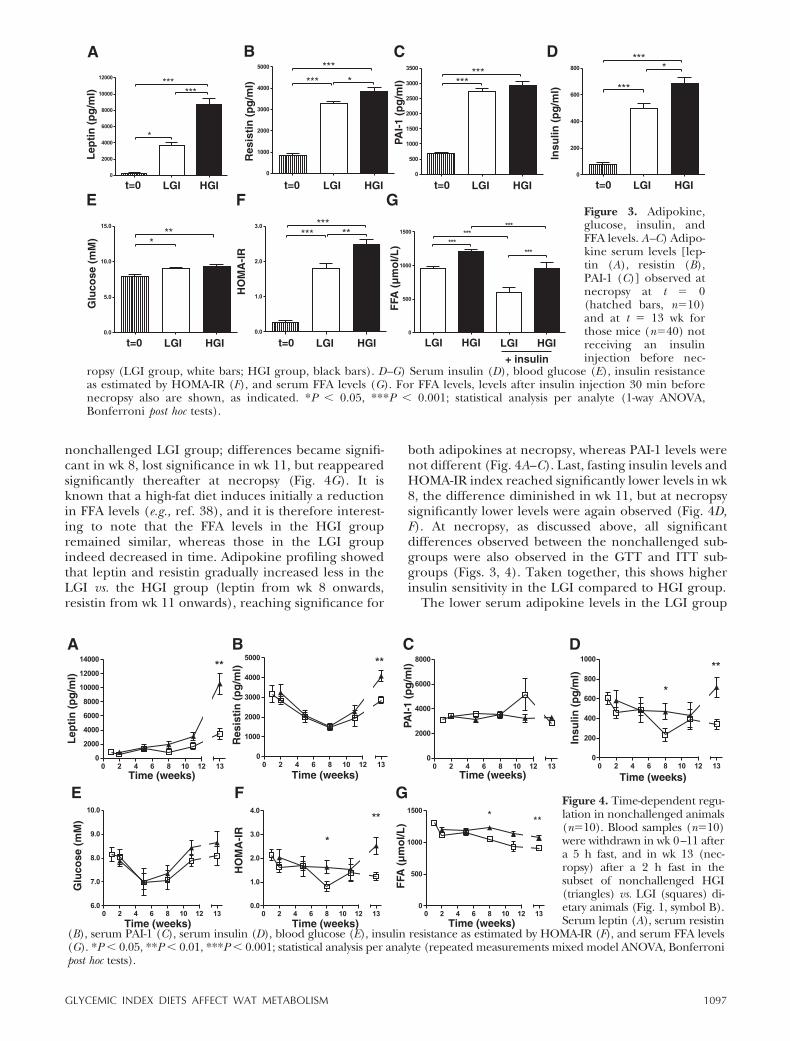
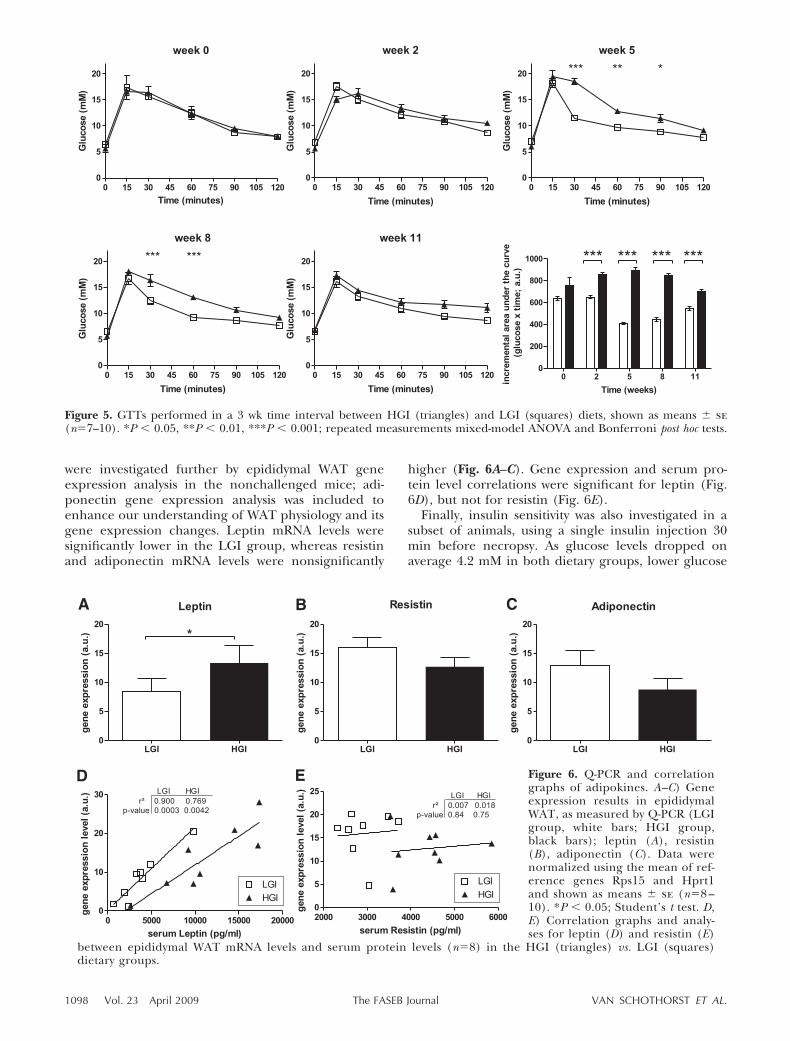
Figure 6. Q-PCR and correlationgraphs of adipokines. A–C) Geneexpression results in epididymalWAT, as measured by Q-PCR (LGIgroup, white bars; HGI group,black bars); leptin (A), resistin(B), adiponectin (C). Data werenormalized using the mean of ref-erence genes Rps15 and Hprt1and shown as means � se (n�8 –10). *P � 0.05; Student’s t test. D,E) Correlation graphs and analy-ses for leptin (D) and resistin (E)
between epididymal WAT mRNA levels and serum protein levels (n�8) in the HGI (triangles) vs. LGI (squares)dietary groups.
Figure 5. GTTs performed in a 3 wk time interval between HGI (triangles) and LGI (squares) diets, shown as means � se(n�7–10). *P � 0.05, **P � 0.01, ***P � 0.001; repeated measurements mixed-model ANOVA and Bonferroni post hoc tests.
1098 Vol. 23 April 2009 VAN SCHOTHORST ET AL.The FASEB Journal

levels in the LGI group were preserved (4.8�2.8 vs.5.5�1.2 mM in LGI and HGI groups, respectively).More important, FFA levels were significantly altered,especially in the LGI group: FFA levels dropped 39%,although this was only 25% in the HGI group (Fig. 3G).This may suggest a higher suppression of WAT lipolysisin the LGI group, implicating a better physiologicalresponse of adipose tissue to insulin.
DISCUSSION
We show that an LGI diet on a high-fat-diet backgroundretards progression of insulin resistance, compared toan HGI diet. We base this not only on serum parame-ters such as insulin, glucose, and FFAs, but also onwhole-body physiology, hepatic lipid accumulation, theacute response to insulin injection, adipose tissue geneexpression, and longitudinal adipokine profiling. Thisretardation is solely caused by a difference in the typeof carbohydrate of the diet, supporting the belief that anutritional approach based on GI might provide avaluable added tool in the fight against insulin resis-tance.
During the progression of insulin resistance develop-ment, we observed several interesting aspects. First,after 5 wk intervention, we observed no differencesbetween the 2 dietary groups, except by GTTs that showsignificantly increased glucose tolerance in the LGIgroup. It remains to be seen whether known (i.e.,visfatin or adiponectin; ref. 20) or unknown serumparameters can be used as an easily accessible serumbiomarker correlating with the observed difference inglucose sensitivity.
Second, after 8 wk, most parameters except resistinare lower in the LGI group, and another 3 wk later,resistin also shows lower levels in the LGI group, whichindicates that resistin has a slower response in time.
Third, at wk 11 these parameters are all, exceptinsulin, lower in the LGI group, while at the same timethe GTT and ITT groups suggest a reduced differencecorrelating with the fasting serum insulin levels. Re-duced differences were also observed in other GIstudies to some extent in rats (10) and clearly inhumans (39). Of note, our observations of diminisheddifferences are based on several distinct analyses insubgroups (GTTs, ITTs, and nonchallenged mice),which were treated somewhat differently, thus support-ing the biological relevance. We therefore hypothesizethat the apparent reduced differences may be the resultof the animals adopting a new metabolic set point thatmay involve differences in adipose mass and function.However, after 13 wk at necropsy, acute insulin ef-fects—improved antilipolytic effect of insulin in theLGI group—and all serum parameters analyzed suggesta higher insulin-sensitive phenotype in the LGI group,which is supported by the lower degree of insulinresistance as estimated by the HOMA index. It may bespeculated that extension of the GI intervention studymight again lead to clear differences in glucose toler-
ance and insulin sensitivity. Indeed, others showed aftera 25 wk murine GI intervention a significantly lowerpercentage body fat and nonfasted plasma insulin andTG levels in the LGI group, while body weights andblood glucose levels were similar. However, physiolog-ical GTTs or ITTs were not performed (14).
Supporting the idea of an adipose-specific set point isthe fact that at necropsy indistinguishable blood glu-cose levels between the dietary groups were observed,even after an acute insulin challenge. This suggests thatinsulin-stimulated glucose uptake primarily in muscle(40) and hepatic inhibition of gluconeogenesis appearto be metabolically unchanged. The latter is reduced byelevated FFA levels (41), as observed in the HGI group.This clearly warrants further longitudinal investigationson effects of GI on metabolic regulation of WAT,muscle, and liver tissue simultaneously.
Serum protein levels for leptin correlate with adiposetissue gene expression. However, the decreased resistinserum levels do not correlate with the observed slightincrease in WAT resistin mRNA levels in the LGI group.In agreement, others observed that murine serumresistin levels, but not WAT resistin mRNA expressionlevels, are correlated with body weight (42), whichsuggests resistin serum levels as being more physiolog-ically relevant.
Physiologically relevant reduced serum leptin levels,as observed in the LGI group, reflect lower adiposetissue weight (21), correlating with a healthier pheno-type. Likewise, the LGI group showed lower serumresistin levels, implying a healthier phenotype, al-though this seems regulated mainly outside adiposetissue and may involve the liver. Lower leptin levelswere also observed after 7 or 10 wk intervention in theLGI groups of rodents (10, 15) and after 8 d in humans(43) but disagree with findings in rats after 3 and 12 wk(44). Increased WAT adiponectin mRNA levels corre-late positively with elevated serum levels both in low-fat-and high-fat-fed mice (45), which suggests that the LGIgroup most likely will have beneficially higher adi-ponectin serum levels.
The detailed analyses of metabolic parameters in 3subgroups showed high similarity between these sub-groups for whole-body physiology, that is, FFA levels,adipokine profiling, insulin levels, and in general bloodglucose levels. Of interest, the significant lower levels ofresistin in the nonchallenged LGI group at necropsy,which was not observed in the other 2 metabolicallystressed subgroups, might indicate that metabolic testslike GTTs and ITTs performed during a nutritionalintervention may have an impact on physiological per-formance and outcome, especially in those nutritionalstudies where small physiological changes are expected.
The differences in the composition of diets, in par-ticular the content and type of macronutrient, willaffect the outcome of GI studies. Most, if not all, rodentGI studies are based on diets having a low fat content(�15 kcal% fat) resembling the fat content of chow (9,10, 14, 15, 46, 47), whereas human GI studies vary from�6 kcal% of fat (29) to a high-fat diet containing 40
1099GLYCEMIC INDEX DIETS AFFECT WAT METABOLISM

kcal% of fat (39). Clearly the fat content and hence thecaloric density of the diet has a strong influence on thedevelopment of obesity, insulin resistance, and diabe-tes, and it is difficult to imagine that this will notinfluence the modulating effect of the type of carbohy-drate used. As the amount and type of protein isgenerally kept constant, the carbohydrate fraction willvary inversely with the fat content. As a consequence,the amount of starch, besides the type of starch, and theGI of the diets will be very dissimilar, leading to possibledifferences in outcome. Furthermore, the type of fatthat is used may have important effects on the resultsobserved, as different types of fat show different effectson glucose tolerance and insulin resistance (48–51).Nutritional studies in rodent models provide the op-portunity to account for all of these parameters, even inlong-term studies.
In conclusion, our results show that LGI diets atten-uated the high-fat-diet-induced insulin resistance. Com-parative investigation of time points 8 and 11 wk willallow insight into the likely adaptations leading todiminished differences in insulin resistance, which mayresult in new leads to arrest insulin resistance develop-ment, but more importantly, the results obtained willimprove evaluation of human studies and may providethe basis for human applications.
We thank everyone from the animal facility involved in thisstudy, especially Judith Hulsman and Rene Bakker. ShohrehKeshtkar of Human Nutrition and Sven Alferink of AnimalNutrition, Wageningen University, and members of RIKILT,Food Bioactives group, especially Marjolein Reinders, arethanked for their helpful contributions.
REFERENCES
1. James, P. T. (2004) Obesity: the worldwide epidemic. Clin.Dermatol. 22, 276–280
2. Action to Control Cardiovascular Risk in Diabetes Study Group,Gerstein, H. C., Miller, M. E., Byington, R. P. Goff, D. C., Jr.,Bigger, J. T., Buse, J. B., Cushman, W. C., Genuth, S., Ismail-Beigi, F., Grimm, R. H., Jr., Probstfield, J. L., Simons-Morton, D.G., and Friedewald, W. T. (2008) Effects of intensive glucoselowering in type 2 diabetes. N. Engl. J. Med. 358, 2545–2559
3. Jenkins, D. J., Wolever, T. M., Taylor, R. H., Barker, H., Fielden,H., Baldwin, J. M., Bowling, A. C., Newman, H. C., Jenkins, A. L.,and Goff, D. V. (1981) Glycemic index of foods: a physiologicalbasis for carbohydrate exchange. Am. J. Clin. Nutr. 34, 362–366
4. Brand-Miller, J. C., Petocz, P., and Colagiuri, S. (2003) Meta-analysis of low-glycemic index diets in the management ofdiabetes: response to Franz. Diabetes Care 26, 3363–3364
5. Ludwig, D. S. (2002) The glycemic index: physiological mech-anisms relating to obesity, diabetes, and cardiovascular disease.JAMA 287, 2414–2423
6. Ludwig, D. S. (2007) Clinical update: the low-glycaemic-indexdiet. Lancet 369, 890–892
7. Jenkins, D. J., Wolever, T. M., Leeds, A. R., Gassull, M. A.,Haisman, P., Dilawari, J., Goff, D. V., Metz, G. L., and Alberti,K. G. (1978) Dietary fibres, fibre analogues, and glucose toler-ance: importance of viscosity. Br. Med. J. 1, 1392–1394
8. Kabir, M., Rizkalla, S. W., Champ, M., Luo, J., Boillot, J., Bruzzo,F., and Slama, G. (1998) Dietary amylose-amylopectin starchcontent affects glucose and lipid metabolism in adipocytes ofnormal and diabetic rats. J. Nutr. 128, 35–43
9. Pawlak, D. B., Bryson, J. M., Denyer, G. S., and Brand-Miller,J. C. (2001) High glycemic index starch promotes hypersecre-
tion of insulin and higher body fat in rats without affectinginsulin sensitivity. J. Nutr. 131, 99–104
10. Pawlak, D. B., Kushner, J. A., and Ludwig, D. S. (2004) Effects ofdietary glycaemic index on adiposity, glucose homoeostasis, andplasma lipids in animals. Lancet 364, 778–785
11. Byrnes, S. E., Miller, J. C., and Denyer, G. S. (1995) Amylopectinstarch promotes the development of insulin resistance in rats. J.Nutr. 125, 1430–1437
12. Higgins, J. A., Brand Miller, J. C., and Denyer, G. S. (1996)Development of insulin resistance in the rat is dependent on therate of glucose absorption from the diet. J. Nutr. 126, 596–602
13. Kim, J. K., Michael, M. D., Previs, S. F., Peroni, O. D., Mauvais-Jarvis, F., Neschen, S., Kahn, B. B., Kahn, C. R., and Shulman,G. I. (2000) Redistribution of substrates to adipose tissuepromotes obesity in mice with selective insulin resistance inmuscle. J. Clin. Invest. 105, 1791–1797
14. Scribner, K. B., Pawlak, D. B., and Ludwig, D. S. (2007) Hepaticsteatosis and increased adiposity in mice consuming rapidly vs.slowly absorbed carbohydrate. Obesity 15, 2190–2199
15. Walker, C. G., Bryson, J. M., Phuyal, J. L., and Caterson, I. D.(2002) Dietary modulation of circulating leptin levels: site-specific changes in fat deposition and ob mRNA expression.Horm. Metab. Res. 34, 176–181
16. Taketani, Y., Shuto, E., Arai, H., Nishida, Y., Tanaka, R.,Uebanso, T., Yamamoto, H., Yamanaka-Okumura, H., andTakeda, E. (2007) Advantage of a low glycemic index and lowphosphate diet on diabetic nephropathy and aging-relateddiseases. J. Med. Invest. 54, 359–365
17. Keijer, J., and van Schothorst, E. M. (2008) Adipose tissuefailure and mitochondria as a possible target for improvementby bioactive food components. Curr. Opin. Lipidol. 19, 4–10
18. Rosen, E. D., and Spiegelman, B. M. (2006) Adipocytes asregulators of energy balance and glucose homeostasis. Nature444, 847–853
19. Waki, H., and Tontonoz, P. (2007) Endocrine functions ofadipose tissue. Annu. Rev. Pathol. 2, 31–56
20. Wang, P., Mariman, E., Renes, J., and Keijer, J. (2008) Thesecretory function of adipocytes in the physiology of whiteadipose tissue. J. Cell. Physiol. 216, 3–13
21. Friedman, J. M., and Halaas, J. L. (1998) Leptin and theregulation of body weight in mammals. Nature 395, 763–770
22. Arita, Y., Kihara, S., Ouchi, N., Takahashi, M., Maeda, K.,Miyagawa, J., Hotta, K., Shimomura, I., Nakamura, T., Miyaoka,K., Kuriyama, H., Nishida, M., Yamashita, S., Okubo, K., Mat-subara, K., Muraguchi, M., Ohmoto, Y., Funahashi, T., andMatsuzawa, Y. (1999) Paradoxical decrease of an adipose-spe-cific protein, adiponectin, in obesity. Biochem. Biophys. Res.Commun. 257, 79–83
23. Browning, L. M., and Jebb, S. A. (2006) Nutritional influenceson inflammation and type 2 diabetes risk. Diabetes Technol. Ther.8, 45–54
24. Yamauchi, T., Kamon, J., Minokoshi, Y., Ito, Y., Waki, H.,Uchida, S., Yamashita, S., Noda, M., Kita, S., Ueki, K., Eto, K.,Akanuma, Y., Froguel, P., Foufelle, F., Ferre, P., Carling, D.,Kimura, S., Nagai, R., Kahn, B. B., and Kadowaki, T. (2002)Adiponectin stimulates glucose utilization and fatty-acid oxida-tion by activating AMP-activated protein kinase. Nat. Med. 8,1288–1295
25. Lazar, M. A. (2007) Resistin- and obesity-associated metabolicdiseases. Horm. Metab. Res. 39, 710–716
26. Trayhurn, P., and Beattie, J. H. (2001) Physiological role ofadipose tissue: white adipose tissue as an endocrine and secre-tory organ. Proc. Nutr. Soc. 60, 329–339
27. Pravenec, M., Kazdova, L., Landa, V., Zidek, V., Mlejnek, P.,Jansa, P., Wang, J., Qi, N., and Kurtz, T. W. (2003) Transgenicand recombinant resistin impair skeletal muscle glucose metab-olism in the spontaneously hypertensive rat. J. Biol. Chem. 278,45209–45215
28. Banerjee, R. R., Rangwala, S. M., Shapiro, J. S., Rich, A. S.,Rhoades, B., Qi, Y., Wang, J., Rajala, M. W., Pocai, A., Scherer,P. E., Steppan, C. M., Ahima, R. S., Obici, S., Rossetti, L., andLazar, M. A. (2004) Regulation of fasted blood glucose byresistin. Science 303, 1195–1198
29. Jensen, L., Sloth, B., Krog-Mikkelsen, I., Flint, A., Raben, A.,Tholstrup, T., Brunner, N., and Astrup, A. (2008) A low-glycemic-index diet reduces plasma plasminogen activator in-hibitor-1 activity, but not tissue inhibitor of proteinases-1 or
1100 Vol. 23 April 2009 VAN SCHOTHORST ET AL.The FASEB Journal
plasminogen activator inhibitor-1 protein, in overweightwomen. Am. J. Clin. Nutr. 87, 97–105
30. Kreijl, C. F. K., Knapp, A. G. A. C., van Raaij, J. M. A., Busch,M. C. M., Havelaar, A. H., Kramers, P. G. N., Kromhout, D., vanLeeuwen, F. X. R., van Leent-Loenen, H. M. J. A., Ocke, M. C.,and Verkley, H. (2004) Our Food, Our Health: Healthy Diet and SafeFood in the Netherlands, National Institute for Public Health andthe Environment, Bilthoven, The Netherlands
31. Wright, J. D. (2003) Dietary intake of ten key nutrients forpublic health, United States: 1999–2000. In Advance Data fromVital and Health Statistics, Vol. 334, National Center for HealthStatistics, Hyattsville, MD, USA
32. Petro, A. E., Cotter, J., Cooper, D. A., Peters, J. C., Surwit, S. J.,and Surwit, R. S. (2004) Fat, carbohydrate, and calories in thedevelopment of diabetes and obesity in the C57BL/6J mouse.Metabolism 53, 454–457
33. Stienstra, R., Mandard, S., Patsouris, D., Maass, C., Kersten, S.,and Muller, M. (2007) Peroxisome proliferator-activated recep-tor alpha protects against obesity-induced hepatic inflamma-tion. Endocrinology 148, 2753–2763
34. Van Schothorst, E. M., Franssen-van Hal, N., Schaap, M. M.,Pennings, J., Hoebee, B., and Keijer, J. (2005) Adipose geneexpression patterns of weight gain suggest counteracting steroidhormone synthesis. Obes. Res. 13, 1031–1041
35. De Boer, V. C., van Schothorst, E. M., Dihal, A. A., van derWoude, H., Arts, I. C., Rietjens, I. M., Hollman, P. C., and Keijer,J. (2006) Chronic quercetin exposure affects fatty acid catabo-lism in rat lung. Cell. Mol. Life Sci. 63, 2847–2858
36. Vandesompele, J., De Preter, K., Pattyn, F., Poppe, B., Van Roy,N., De Paepe, A., and Speleman, F. (2002) Accurate normaliza-tion of real-time quantitative RT-PCR data by geometric averag-ing of multiple internal control genes. Genome Biol. 3, re-search0034.1-0034.11
37. Wallace, T. M., Levy, J. C., and Matthews, D. R. (2004) Use andabuse of HOMA modeling. Diabetes Care 27, 1487–1495
38. Muurling, M., Mensink, R. P., Pijl, H., Romijn, J. A., Havekes, L. M.,and Voshol, P. J. (2003) A fish oil diet does not reverse insulinresistance despite decreased adipose tissue TNF-alpha proteinconcentration in ApoE-3*Leiden mice. J. Nutr. 133, 3350–3355
39. Kiens, B., and Richter, E. A. (1996) Types of carbohydrate in anordinary diet affect insulin action and muscle substrates inhumans. Am. J. Clin. Nutr. 63, 47–53
40. DeFronzo, R. A., Jacot, E., Jequier, E., Maeder, E., Wahren, J., andFelber, J. P. (1981) The effect of insulin on the disposal ofintravenous glucose. Results from indirect calorimetry and hepaticand femoral venous catheterization. Diabetes 30, 1000–1007
41. Boden, G. (1997) Role of fatty acids in the pathogenesis ofinsulin resistance and NIDDM. Diabetes 46, 3–10
42. Lee, J. H., Bullen, J. W., Jr., Stoyneva, V. L., and Mantzoros, C. S.(2005) Circulating resistin in lean, obese, and insulin-resistantmouse models: lack of association with insulinemia and glyce-mia. Am. J. Physiol. Endocrinol. Metab. 288, E625–E632
43. Herrmann, T. S., Bean, M. L., Black, T. M., Wang, P., andColeman, R. A. (2001) High glycemic index carbohydrate dietalters the diurnal rhythm of leptin but not insulin concentra-tions. Exp. Biol. Med. 226, 1037–1044
44. Kabir, M., Guerre-Millo, M., Laromiguiere, M., Slama, G., andRizkalla, S. W. (2000) Negative regulation of leptin by chronichigh-glycemic index starch diet. Metabolism 49, 764–769
45. Bullen, J. W., Jr., Bluher, S., Kelesidis, T., and Mantzoros, C. S.(2007) Regulation of adiponectin and its receptors in responseto development of diet-induced obesity in mice. Am. J. Physiol.Endocrinol. Metab. 292, E1079–E1086
46. Lerer-Metzger, M., Rizkalla, S. W., Luo, J., Champ, M., Kabir, M.,Bruzzo, F., Bornet, F., and Slama, G. (1996) Effects of long-termlow-glycaemic index starchy food on plasma glucose and lipidconcentrations and adipose tissue cellularity in normal anddiabetic rats. Br. J. Nutr. 75, 723–732
47. Kabir, M., Rizkalla, S. W., Quignard-Boulange, A., Guerre-Millo,M., Boillot, J., Ardouin, B., Luo, J., and Slama, G. (1998) A highglycemic index starch diet affects lipid storage-related enzymesin normal and to a lesser extent in diabetic rats. J. Nutr. 128,1878–1883
48. Rocca, A. S., LaGreca, J., Kalitsky, J., and Brubaker, P. L. (2001)Monounsaturated fatty acid diets improve glycemic tolerancethrough increased secretion of glucagon-like peptide-1. Endocri-nology 142, 1148–1155
49. Anderwald, C., Brunmair, B., Stadlbauer, K., Krebs, M.,Furnsinn, C., and Roden, M. (2007) Effects of free fatty acids oncarbohydrate metabolism and insulin signalling in perfused ratliver. Eur. J. Clin. Invest. 37, 774–782
50. Savage, D. B., Petersen, K. F., and Shulman, G. I. (2007)Disordered lipid metabolism and the pathogenesis of insulinresistance. Physiol. Rev. 87, 507–520
51. Lockridge, J. B., Sailors, M. L., Durgan, D. J., Egbejimi, O.,Jeong, W. J., Bray, M. S., Stanley, W. C., and Young, M. E. (2008)Bioinformatic profiling of the transcriptional response of adultrat cardiomyocytes to distinct fatty acids. J. Lipid Res. 49,1395–1408
Received for publication July 22, 2008.Accepted for publication November 6, 2008.
1101GLYCEMIC INDEX DIETS AFFECT WAT METABOLISM
Related Documents