Journal of Ekctroanaiytical Chemistry, 362 (1993) 55-69 55 JEC 02870 Effect of the supporting electrolyte and beam diameter on probe beam deflection experiments James D. Rudnicki l , Gessie M. Brisard **, Hubert A. Gasteiger, Richard E. Russo, Frank R. McLarnon and Elton J. Cairns Energy and Environment Division,Lawrence Berkeley Labomtory, and Departnaetzr of Chemical Engineering, University of Californiaat Berkeley, ~erkeky, CA 94720 WSAJ (Received 4 September 1992; in revised form 4 March 1993) Abstract The effects of the presence of supporting electrolyte and the beam diameter on probe beam deflection experiments were investigated both theoretically and experimentally. A mass-transfer limited potential step experiment with the ferricyanide/ ferrocyanide redox couple is used to illustrate these effects. Although the supporting electrolyte does not react, the transference number of the supporting electrolyte is close to unity, which results in concentration gradients forming in. the supporting electrolyte. We show here that these concentration gradients should not be neglected. Analytic solutions for a potential step and fast kinetics are developed both with and without considering the concentration gradients in the supporting electrolyte. The model agrees quantitatively with experiments performed in K,S04, KCl, and KOH. Typical probe beams are too large in diameter to be approximated as an infinitely thin ray. The models include consideration of the firiite diameter of the probe beam. The results show that a 200 pm diameter probe beam is too large to detect unique features of the potential step experiment and that a 100 pm diameter probe beam should be able to dettct these- features. The difficulties of determining diffusion coefficients from the probe beam deflection are discussed. It is concluded that it is impossible to determine the diffusion coefficients of the reactant and product from the extremum of the probe beam deflection. A non-linear regression of the model to experimental data is possible in theory, but is susceptible to error. 1. Introduction The probe beam deflection technique has been used by several groups to study electrochemical reactions; researchers at the Paul Scherrer Institute in Switzer- land [l-6], at the Ecole Sup6rieure de Physique et Chimie de Paris in France [7-101, at the Instituto de Fisisca in Brazil [$l-131, our group at Lawrence Berke- ley Laboratory in California [14-201, and others [21- 281. Probe beam deflection (also referred to as the mirage effect and optical beam deflection, OBD) mea- sures the concentration gradients of electrolyte species near an electrode interface. These gradients provide information on mass transport and reaction mecha- nisms. Other optical techniques, such as intereferome- l To whom corfespondence should be addfessed. l * Present address: Department of Chemistry, University of Sher- brooke, Quebec, JlK 2R1, Canada. OO22-0728/93/$6.00 try, see for example refs. 29-36, spatially resolved optical absorption [37-433, and diffraction [44], have also been used to measure concentration profiles with high spatial resolution. Interferometry is experimen- tally more difficult than probe beam deflection, and the absorption techniques can only detect electrolyte species with distinct optical absorption characteristics. Probe beam deflection is a relatively easy experimental technique that is applicable to most electrochemical systems. The probe beam deflection technique is based on the deflection of a laser beam as it passes parallel.to an electrode surface (see Fig. 1). The probe beam is deflected by refractive index madients formed in the electrolyte near the electrode. Very small deflections of the beam can be measured; the detection limit is on the order of 1 nrad [45]. An infinitely thin ray, parallel to the electrode, obeys the simple equation [46-481 8 = L/n, an/ax (1) Q 1993 - Elsetier Sequoia S.A. All rights reserved

Welcome message from author
This document is posted to help you gain knowledge. Please leave a comment to let me know what you think about it! Share it to your friends and learn new things together.
Transcript

Journal of Ekctroanaiytical Chemistry, 362 (1993) 55-69 55
JEC 02870
Effect of the supporting electrolyte and beam diameter on probe beam deflection experiments
James D. Rudnicki l , Gessie M. Brisard **, Hubert A. Gasteiger, Richard E. Russo, Frank R. McLarnon and Elton J. Cairns Energy and Env ironment Division, Lawrence Berkeley Labomtory, and Departnaetzr of Chemical Engineering, University of California at Berkeley, ~erkeky, CA 94720 WSAJ
(Received 4 September 1992; in revised form 4 March 1993)
Abstract
The effects of the presence of supporting electrolyte and the beam diameter on probe beam deflection experiments were investigated both theoretically and experimentally. A mass-transfer limited potential step experiment with the ferricyanide/ ferrocyanide redox couple is used to illustrate these effects. Although the supporting electrolyte does not react, the transference number of the supporting electrolyte is close to unity, which results in concentration gradients forming in. the supporting electrolyte. We show here that these concentration gradients should not be neglected. Analytic solutions for a potential step and fast kinetics are developed both with and without considering the concentration gradients in the supporting electrolyte. The model agrees quantitatively with experiments performed in K,S04, KCl, and KOH.
Typical probe beams are too large in diameter to be approximated as an infinitely thin ray. The models include consideration of the firiite diameter of the probe beam. The results show that a 200 pm diameter probe beam is too large to detect unique features of the potential step experiment and that a 100 pm diameter probe beam should be able to dettct these- features.
The difficulties of determining diffusion coefficients from the probe beam deflection are discussed. It is concluded that it is impossible to determine the diffusion coefficients of the reactant and product from the extremum of the probe beam deflection. A non-linear regression of the model to experimental data is possible in theory, but is susceptible to error.
1. Introduction
The probe beam deflection technique has been used by several groups to study electrochemical reactions; researchers at the Paul Scherrer Institute in Switzer- land [l-6], at the Ecole Sup6rieure de Physique et Chimie de Paris in France [7-101, at the Instituto de Fisisca in Brazil [$l-131, our group at Lawrence Berke- ley Laboratory in California [14-201, and others [21- 281. Probe beam deflection (also referred to as the mirage effect and optical beam deflection, OBD) mea- sures the concentration gradients of electrolyte species near an electrode interface. These gradients provide information on mass transport and reaction mecha- nisms. Other optical techniques, such as intereferome-
l To whom corfespondence should be addfessed. l * Present address: Department of Chemistry, University of Sher-
brooke, Quebec, JlK 2R1, Canada.
OO22-0728/93/$6.00
try, see for example refs. 29-36, spatially resolved optical absorption [37-433, and diffraction [44], have also been used to measure concentration profiles with high spatial resolution. Interferometry is experimen- tally more difficult than probe beam deflection, and the absorption techniques can only detect electrolyte species with distinct optical absorption characteristics. Probe beam deflection is a relatively easy experimental technique that is applicable to most electrochemical systems.
The probe beam deflection technique is based on the deflection of a laser beam as it passes parallel.to an electrode surface (see Fig. 1). The probe beam is deflected by refractive index madients formed in the electrolyte near the electrode. Very small deflections of the beam can be measured; the detection limit is on the order of 1 nrad [45]. An infinitely thin ray, parallel to the electrode, obeys the simple equation [46-481
8 = L/n, an/ax (1)
Q 1993 - Elsetier Sequoia S.A. All rights reserved

56
In this equation, L is the width of the electrode, n, is the bulk refractive index of the electrolyte, and 8 is the angle the probe beam is deflected. Equation (1) is a simplified statement of the Schlieren effect, which has been used for decades to explore refractive index gra- dients [22]. Equation (1) is accurate for small angular deflections of the probe beam. It assumes that the offset between the probe beam and electrode surface is constant. A 1 mrad beam deflection causes the probe offset to change 10 pm over a 10 mm wide electrode. Because the characteristic dimension of concentration gradients is typically much larger than 10 pm, the approximations inherent in eqn. (1) are reasonable. More complex treatments can be used for larger angu- lar deflections of the probe beam; ref. 18, 21, 46, 47, and 29 discuss general expressions for beam deflec- tions. A correction to eqn. (1) must be made for refraction of the probe beam as it exits the electro- chemical cell. Snell’s Law is used along with the small angle approximation (for 4 < 0.1, sin 4 = 4) to derive
e ext 5: CndnairJeint (2) where gint and t& ‘are the angles inside and outside the cell. Because nair is approximately unity, the effect of refraction, as the probe beam exits the cell is to cancel the effect of the bulk refractive index IZ~ in eqn. (11, i.e. we use
8 = L( an/ax) (3)
to model the probe beam deflection. The refractive index gradient, an/ax, is directly related to the concen- tration gradient by
where P is the concentrative refractivity.
Fii. 1. The basis of probe beam deflection. The beam is deflected towards the region of higher refractive index.
Fig. 2. Plan view of equipment. The laser is focused by a 160 mm focal length lens which is located 140 mm from the electrochemical cell. The position detector is about 250 mm from the cell.
A simple schematic diagram of the experimental system is shown in Fig. 2. The probe beam is a 2 mW helium-neon laser with a diameter of 630 pm (Uni- phase 1103P). The probe beam is focused with a 160 mm focal length achromat lens* (Melles Giiot O&40149) to give a beam with a l/e2 diameter of 216 pm in the electrochemical cell. The diameter was measured with a photodiode masked by a 5 pm pin- hole (Melles Griot 04PIPOOO3). The photodiode is translated across the cross-section of the probe beam to determine its diameter. The measured diameter is larger than that calculated by theoretical expressions [49,50]. The deflection of the probe beam is measured by a linear position detection (LPD, United Deteator Corp. LX/SD) located about l/4 m from the electro- chemical cell. The LPD outputs a signal proportional to the position at which the probe beam strikes the detector’s surface. This model of LPD can detect dis- placements of the probe beam as small as 1 pm. This displacement corresponds to an angular deflection of 4 krad.
The electrochemical cell is shown in Fig. 3. The cell is designed with the platinum working electrode lo- cated at the end of a 10 mm deep channel. This channel constrains mass transfer to linear diffusion, within the region sensed by the probe beam. Because the electrode extends the full 10 mm width of the cuvette, edge effects are considered to be negligible. The larger electrolyte volume to the right provides a buffer against changing the bulk concentration of the reactants during a series of experiments.
When multiple components are present in the solu- tion, the refractive index gradient can be represented as a summation of the effect of each concentration gradient:
(an/ax) = p.qacpx) (5)
The above equation is the reason that modeling is required to interpret the beam deflection 8. From a single measurement of 6 is it not possible to determine
l An achromat lens produces a smaller focus than a planoconvex lens of equal focal length. Thereby, the probe .+UII can be focused to a smaller diameter without increasing the divergence of the beam.

SIDE FRONT
Fig. 3. Cross-section of the electrochemical cell. The assembly is constructed of Kel-F and placed into a 40X40X 10 mm3 optical cuvette. The platinum working electrode is 2.6X 10 mm’. A platinum counter-electrode is in a separate compartment connected by a tube. The reference electrode” connects from the top.
the individual gradients, aci/ax, of the species in- volved. In some cases, approximations can be made that allow some of the terms in eqn. (5) to be ne- glected, either because one of the concentrative refrac- tivities dominates or because one of the concentration gradients can be neglected. With these approximations much qualitative information can be gained about the reactions being studied. However, eventually, candi- date reaction mechanisms must be tested with a model to confirm that they agree with the experimental re- sults.
Probe beam deflection experiments are interpreted by matching experimental results with model predic- tions. Various reaction mechanisms are placed in the model and predictions of the probe beam deflection are calculated. By this process some reaction mecha- nisms can be discarded, and support can be provided for others. In the literature cited above, various models of concentration gradients have been used which in- clude a variety of simplifying approximations [24]. Some of these models go to the extreme approximation of neglecting the concentration gradient of the product [251. In this work, we propose that the supporting electrolyte and the diameter of the probe beam have a significant effect on the beam deflection and must be included in the model. To illustrate this point, we will use a simple reaction where the mechanism is known, the ferricyanide/ ferrocyanide redox couple:
Fe(CN$ - Fe(CN)i- + e- (6)
This redox couple is a well known single-electron transfer reaction. We will investigate the potential step
experiment, for which analytic solutions to the trans- port equations are readily developed.
2. Models
To predict the beam deflection 8, a model must determine the concentration gradients, which are then substituted into eqns. (3) and (5). To determine the concentration gradients, the mass transport equations are solved to yield expressions for the concentration profiles c&r, t). These profiles are then differentiated to yield the concentration gradients.
Diffraction effects prevent a collimated beam from having an infinitely small diameter [49,50]. As the diameter of the beam is decreased, the divergence of the beam increases. For electrodes 10 mm wide, com- mon probe diameters (l/e’) are about 100-200 pm. The dimensions of the concentration gradients are similar to that of the probe diameter. Therefore, the probe beam samples a relatively large region of the concentration gradient. For both of the models, we will consider the effect of the probe diameter.
We will discuss a potential step experiment for the generic reaction
A*B+n e- (7)
The model will consider a potential step relative to the equilibrium potential of the reaction. Fast reversible kinetics are assumed for this work; thereby the concen- trations of A and B at the electrode surface are related by the Nemst equation [51]:
boundary condition 1
~~(0, f)/ca(O, t) = exp[ (nF/RT)( E - EO)] = B
(8)
In this expression E is the electrode potential, E” is the equilibrium potential, F is Faraday’s constant, R is the ideal gas constant, and T is the temperature. The rate constant for the ferricyanide/ ferrocyanide redox couple has been measured 1521. Using this value, we have confirmed that the kinetically rate limited current is several orders of magnitude larger than any current that would occur during a potential step experiment. Therefore, eqn. (8) is a good approximation. Two mod- els will now be developed. The first model does not consider the presence of the supporting electrolyte. The second model considers the concentration gradi- ent that forms in the supporting electrolyte.
3. Model neglecting swpportimg electrolyte
This model does not consider the effect of migration on the reactants and does not account for the concen-

58
TABLE 1. Diffusion coefficients at 25 o C for ionic species tion profiles c,(x, t) 8154 c,(x, t) *, 10s D cmz s-r z
Potassium 1.957 +1 Lithium 1.031 +1 Sulfate 1.065 -2 Chloride 2.032 -1 Hydroxide 5.260 -1 Iodide 2.044 -1 Ferricyanide 0.896 -3
ref. 52 0.89 ref. 53 0.89 ref. 54 0.763
Ferrocyanide 0.739 -4 ref. 52 0.80 ref. 55 0.74 ref. 54 0.632
Except as noted, all data are from ref. 56, p. 232.
tration gradient in the supporting electrolyte. The transport of the reactant and product, A and B, is expressed with Fick’s equation for linear diffusion in dilute solutions:
(9
Because migration is ignored in eqn. (9), we assume that A and B are dilute species in a well supported electrolyte (but we are not considering the gradient in the supporting electrolyte yet). The diffusion coeffi- cients DA and DB are the diffusivities of the ionic species. The boundary conditions and the initial condi- tions are
boundary conditions 2 and 3
CA(aJ, t) = c: cn(=J, t) =cB*
initial conditions 1 and 2
CA(X, 0) = CA* cn( x, 0) = c; (10)
where CA* and cz are the initial concentrations of the species. One additional boundary condition couples the two differential equations:
boundary condition 4
x-0 = -DBf$ I X==O
(11)
This is a statement of the reaction stoichiometry; it states that the flux of the reactant to the surface is equal to the flux of the product away from the surface. This expression implies that both species have a stoi- chiometric coefficient of unity.
The set of equations and conditions, eqns. (8)-(H), is easily solved to yield expressions for the concentra-
c,(x, f) =i$ + 1 + Z( DA/DB) 1’2
erfc
cB(x, t) = c,* - ( DA/DB)1’2( EC,* - ~2)
1 + Z( DA/DB) ‘I2
x X erfc
[ 1 (4DBt)“2 I (12)
For a mass transfer limited potential step, H + 0. Assuming the fluxes are mass transfer Iimited, these concentration profiles are differentiated to give the gradients:
ac,(x, f, 6 -x2 ax = (TDAt)1’2 exp 4D,t [ 1
(13)
acB(& q -c:( DA/DB)1’2
aX = (&lBt)1’2 (14)
These gradients are combined with eqns. (5) and (3) to yield the expression for the beam deflection:
(15)
Note in eqn. (15) that the concentrative refractivities used are those of the neutral salts, while the diffusion coefficients are those of the ionic species. Electroneu- trality guarantees that the cation will be present in a concentration equal to the concentration of the anions. Thereby, we can use the concentration gradients for the ionic species in eqn. (5). Transport properties and refractive index data are listed in Tables 1 and 2. Anodic and cathodic steps are accounted for by switch- ing the physical properties of A and B.
Equation (13) is also the correct expression ‘for reactions where the product. does not leave the ekc-
TABLE 2. Concentrative refractivities for ekctrolytes
102 cy UK’)
Potassium fenicyanide ( - 3) 5.55 (O-0.061 M) Potassium ferrocyanide ( - 4) 7.52 (O-0.055 M) Potassium hydroxide 1.03 (0.362-0.642 M) Potassium sulfate 1.83 (0.456-0.554 M) Potassium chloride 0.953 (0.409-0.620 M) Lithium chloride 0.892 (0.237-0.719 MI Potassium iodide 2.14 (0.377-0.579 M)
* The solution of a very similar problem is explained in ref. 51. Calculated by a linear regression to the data in ref. 57, over the concentration range indicated.

59
trade, for example metal deposition. For such reac- tions, the gradient in the product does not exist and setting Yr, = 0 yields the expression for the beam de- flection. The analogous simplification cannot be made for reactions where the reactant is initially on the surface, for example metal dissolution. This is because the mass transfer limitation that was applied (Z + 0) is not appIicabie to such reactions. This expression for the beam deflection will be discussed further when the effect of the probe diameter is considered.
4. Me&I amidwing supportimg ekxtmlyk
The next level of refinement is to consider the effect of the presence of the supporting electrolyte. In many electrochemical experiments an inert supporting elec- trolyte is added in a concentration which is large with respect to the reactant concentration. The supporting electrolyte increases the solution’s conductivity and minimizes the migration of reactants in the electric field. The latter effect simplifies the tmnsport equa- tions (yielding for example eqn. (911, whose solution can then be obtained analytically (for example the Cottrell equation in this paper). Although non-re- acting, the supporting electrolyte forms a concentration gradient in the vicinity of the electrode and conse- quently deflects the probe beam. In the following we will outline the analytical derivation for the concentra- tion gradient in the supporting electrolyte; we will restrict ourselves to one-dimensional diffusion without convection. The model assumes that the supporting electrolyte is present in excess, such that its transfer- ence number is close to unity. Thereby, migration of the minor species is neglected. Our derivation is based on a singular perturbation method to obtain the gov- erning transport equations and boundary conditions, first developed by Levich 1581. Applications to a rotat- ing disk geometry and a growing mercury drop have been given by Newman [56].
4.1. Binary electrolyte approximation Guided by the basic demand that the concentraiton
of the supporting electrolyte be much larger than the concentration of the reactants and products, Levich devised a perturbation, approach to the problem by starting out with a “zero approximation”, which solely considers the transport of an inert electrolyte in the electric field. For a simple salt (M,+N,_+ Y+M’++ V-N’-, where “ + ” refers to the cations and “ - ” to the anions of the supporting electrolyte) the general transpart equation is
(16)
In this equation, IX~ is the mobility and 4 is the potential. The zero rakes this equa- tion to the expression for B binary electrolyte
aC; a2c, -=D& at with an effective binary diffusion coefficient 0,:
D+D_(z+-L)
De = (D+z+- D-z_)
(17)
(18)
For a non-reacting supporting electrolyte the solution to eqn. (17) is trivial:
c+= const. c_= const. 4 = const. (19) This result is what we assumed in the previous section, namely that there is no concentration gradient in the supporting electrolyte.
4.2. First order perturbation A singular perturbation to the zefo approximation
<c$Y! c!!! #O)) above is formulated as
c+= @+ cp, (20) c_= c(o)+ c”’ (21)
(22) Here, quantities with the superscript (1) are small perturbations to those with superscript (0) and are of the same Order of magnitude as c,, and cn. Starting with the general transport eqn: (16) in uonjunetion with eqns. (1911(221, and neglecting terms which contain products of Small quantities, one finds for the support- ing electrolyte:
i=+,- w Electroneutrahty can be -written as
Z+C(:)+ Z-C?‘+ ZACA + ZgCz = 0
In the zero-order approximation case), eqn. (24) simplifies to
z+@+ z_c’o)- 0
(29 (binary electrolyte
(25) Manipulating eqns. (23) and (24) and relating transport coefficients and diffusion coefficients via the Nemst- Einstein relation, the final transport equation for the supporting electrolyte anion is
ad!) a2c’_‘) -=D,-
zA( DA -D+)D_ a2CA at ax2 + (D+z+ -D-z_) s
zB(D, - D+)D_ a2c,
+ (D +z+- D-z_) ax2 (W

Thus the potential has been decoupled from the differ; ential equation for mass transfer, leaving us with one unknown c_. The last two terms on the right of eqn. (26) are determined separately.
The derivation of the differential equation for the reacting ions A and B is analogous to that for the supporting electrol,yte: neglecting terms containing products of small quantities (perturbations) in eqn. (16) as well as considering the solution to.the zero approxi- mation, eqn. (191, we find that the differential equa- tions for the reacting ions reduce to eqn. (9) and yield the solution of eqn. (12). This result simply confirms the well known fact that migration of reacting ions is not significant in the presence of a sufficient concen- tration of supporting electrolyte. The concentration profiles, eqn. (12), are used to determine the second derivatives for use in eqn. (26).
4.3. Boundary conditions for chronoamperometry The ’ boundary conditions and initial conditions for
the supporting electrolyte ions are similar to those for the reacting ions:
boundary condition
c(:)(crJ t)=O , cyw, t) = 0 (27) initial condition
c(:)(,x, 0) =,o c(f)(x, 0) =o I (28)
The requirement of an inert supporting electrolyte stipulates the second boundary condition necessary to solve eqn. (26): ’
wo, t) Ni(O, t) =O=D,zi&ci(09 t, ax
+ D, aci(dY t, I ax
i=+ - 7 (29)
This no-flux condition can be simplified again using a singular perturbation, applying eqns. (19)-(22) to yield
()=z.L (0) a#+yo, t) -+ 3cf”(O, t’)
‘RTc’ (0, t) ax ax
i= +, - (30)
Electroneutrality (eqns. (24) and (25)) in conjunction yvith eqn. (30) for both species, c, and c_, is employed to eliminate the potential term in eqn. (30), resulting in
ac”‘(0, t) 1
ax =- z* ( ac,(O, t) ‘+= ac,(O, t)
2, -z_ ax B , ax 1 (31)
Finally, making use of the boundary condition on the reacting species, eqn. (111, we derive
a&)(0, t) 7
ax __L(“‘~*B)cAy~ (32)
Omitting the last step and reformulating eqn. (31) in terms of c, an equivalent form of the boundary condi- tion (eqn. (32)) may be developed:
a@(o, t) ad!j(o, t) =- ax ax (33)
4.4. Solution to the chronoamperometric problem The concentration profiles for .A and ,B in eqn. (12)
are used to determine the first and-second derivatives needed in eqns. (26) and (32). The problem is now reduced to a differential equation for c_ in x and t, eqn. (261, subject to the boundary conditions, eqns. (27), (28), and (32). The solution to the differential equation is obtained by a similarity transformation, using the similarity variable 7:
17 =X/(4D,ty’* (34)
The resulting second-order ordinary differential equa- tion is then solved by reduction of order. Thereby, the supporting electrolyte anion concentration gradient, ac_/ax, is solved directly. (In the previous section we solved for the concentration profile, and then differen- tiated to determine the gradient.1
where
ffi = (z+- Z_) (Oi-D,) . D,
i=A,B
(36)
The gradient does not depend on the bulk concentra- tion of the supporting electrolyte. These expressibns for the gradient in the supporting electrolyte are valid for any values of zi and’ zn. If either the product or reactant is a neutral species, the corresponding Li is set to zero. For reactions where the product does inot leave the electrode, setting zn = 0 yields the correct eirpression for the gradient in the supporting elec- trolyte. As discussed previously% an analogous simpliti- cation cannot be made to account for reactions wbere the reactant is present on the surface.
The concentration gradients of the reacting species, eqns. (13) and (14), and the gradient of the anion, eqn.
61
TABLE 3. a constants for eqns. (37) and (43) for positive and negative potential steps in various electrolytes
Electrolyte aA aB ae
Positive Potassium sulfate Potassium chloride Potassium hydroxide Lithium chloride Potassium iodide
Negative Potassium sulfate Potassium chloride Potassium hydroxide Lithium chloride Potassium iodide
1.3085 1.6052 -2.118x lo-* 1.4770 1.9779 3.833 x 1O-3 1.1856 1.6800 7.365 x 10⁻² 0.5693 1.2320 4.611 x 1O-4 1.4735 1.9745 4.430 x 10-s
1.6052 1.3085 1.747 x 10⁻² 1.9779 1.4770 -3.161~10-~ 1.6800 1.1856 -6.075x10-* 1.2320 0.5693 -3.830x 1O-4 1.9745 1.4735 -3.653x1O-3
(351, are substituted into eqns. (5) and (3) to give the expression for the beam deflection:
(w, - a,q,)( DA/&$” -x2 - (vD#' eXP 4D,t [ 1
(37)
The (Y~, transport properties, and refractive index data are listed in Tables 1, 2 and 3. If the supporting electrolyte has no effect on the beam deflection, i.e. !Pe = 0, then eqn. (37) reduces to eqn., Cl%. For reac- tions where the product does not leave the surface, setting zn = 0 and ?Pn = 0 will yield the correct expres- sion. I
5. Effbct of probe diameter
The probe beam cannot be approximated accurately by an infinitely thin ray. To account for the finite diameter, the effect of the concentration gradient must be averaged across the diameter of the beam. The linear position detector measures the intensity centroid of the probe beam on its surface. This average is complicated by the Gaussian intensity profile of a laser beam, which is used as a weighting function for the average:
1(x, Y) =I, exp I -(x-q*- (Y -Yd2
r2 I (38)
This equation describes a probe beam with its center at (x0, yO) where the beam has an intensity I, (W mm2).
The intensity decreases to l/e I, at a distance r from the center of the beam. The characteristic dimension r is called the l/e radius. This is related to the more conventional l/e2 beam diameter by
d l/e2 = 2%,, (39)
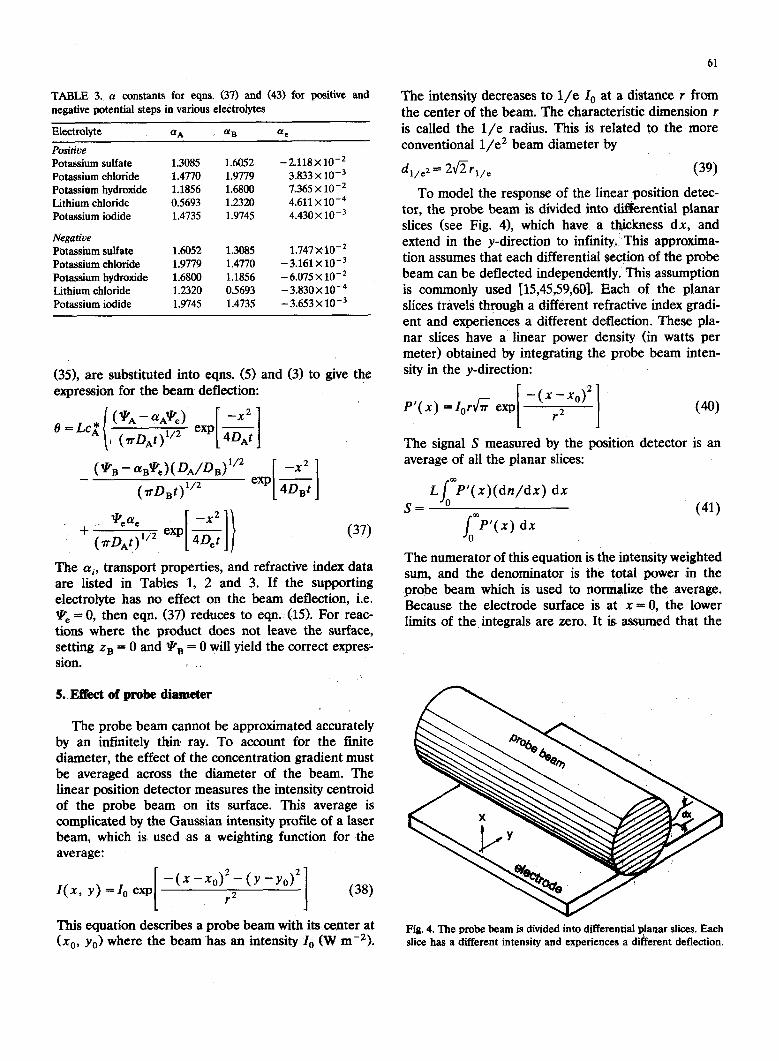
To model the response of the linear position detec- tor, the probe beam is divided into differential planar slices (see Fig. 4), which have, a thickness dx, and extend in the y-direction to infinity. This approxima- tion assumes that each differential section of the probe beam can be deflected independently. This assumption is commonly used [15,45,59&l]. Each of the planar slices travels through a different refractive index gradi- ent and experiences a different deflection. These pla- nar slices have a linear power density (in watts per meter) obtained by integrating the probe beam inten- sity in the y-direction:
P’(x) = Z,rh exp -(x-xo)2
[ I r2
The signal S measured by the position detector is an average of all the planar slices:
S= LimZ”( x)(dn/dx) dx
/ “P’(X) dx
0
(41)
The numerator of this equation is the intensity weighted sum, and the denominator is the total power in the probe beam which is used to normalize the average. Because the electrode surface is at x = 0, the lower limits of the, integrals are zero. It is assumed that the
Fig. 4. The probe beam is divided into differential planar slices. Each slice has a different intensity and experiences a different deflection.

62
O.= >
-2.51”““.,.‘.“““‘,““““‘.’ 0 5 10 15 20 25 30
time /s
Fig. 5. Theoretical beam deflections for mass transfer limited ca- thodic potential steps are shown for several probe diameters. The lines are marked with the beam diameter in micrometers. The curve marked zero is calculated from eqn. (15) and the remaining curves are calculated from eqn. (42). Downward in these figures represents a beam deflection towards the electrode and upward is away from the electrode. The physicat parameters correspond to the cathodic ferricyanide/ferrocyanide reaction, using Da = 0.896 X lo-’ and DB = 0.739 x 10e5. In each case the probe offset is 130 pm. The width of the electrode is 10 mm and the concentrations of the species are 2.5 mM.
edge of the electrode blocks any part of the probe beam that hits it.
The two solutions for the refractive index gradient, eqns. (15) and (371, are substituted into eqn. (41) (simply remove L from eqns. (15) and (37) to obtain dn/dx). When the expressions are integrated, the resulting beam deflection signals S are
without supporting electrolyte
s= 2Lc;l **
erfc[ -xc/r] (7r~_,J/2 EC Q4)
VJJ( QJ&3)1’2 I (aD,)‘/2 E(DB)J 1 (42)
with supporting electrolyte
S-
(43)
where
n
‘2
E( oil = (4~~~ + r2)1/2 exp 4,“,” r2 [ 1
for i-A, B, e
The a in this equation are described by eqn. (36). The same simplifications to the (Y and Y that were dis- cussed previously can be made to account for various reactions.
6. Model results
We begin the discussion by considering the beam deflection for an infinitely thin ray and no concentra- tion gradient in the supporting electrolyte. The curve labeled zero in Fig. 5 shows the beam deflection for a cathodic current calculated from eqn. (15). The beam deflection shows an interesting reversal at short times. When this reversal was initially observed experimen- tally, it was attributed to the P&tier heat [25]. How- ever, this feature is a characteristic of the concentrative refractivities and diffusion coefficients for ferri- cyanide/ ferrocyanide. The species with the larger dif- fusion coefficient has the smaller concentrative refrac- tivity and vice versa. At the beginning of a cathodic potential step the faster moving ferricyanide affects the probe beam first. Because the ferrieyanide is the reac- tant, its concentration is lower near the electrode (as in Fig. 1). Thereby, the ferricyanide causes a beam deflec- tion away from the electrode during the first second following the potential step. Soon after, the effect of the ferricyanide is overwhelmed by the ferrocyanide, which has the larger concentrative refractivity. The production of ferrocyanide creates a gradient opposite to that in Fig. 1 and causes a beam deflection towards the electrode.
With eqn. (421, we can predict the effect of the probe diameter. Figure 5 contains calculated beam deflections for several probe diameters. The calcula- tions indicate that the small reversal is lost as the probe diameter becomes larger than 100 pm. The diameter of the probe beam used for the experiments in this paper was measured to vary from 216 pm at the edges of the electrode to 201 pm at its center l . As the
l This measurement was made in air. There is a slight change of the focusing of the probe beam when the beam travels through the electr&te. It is ezpected that the beam waist diameter’woukl be increased a few micrometers by this effect.

63
time / s
Fig. 6. The theoretical barn deflection is shown for five supporting electrolytes. The probe diameter is 210 km and the probe offset is 130 pm. The curve marked none is for the model that does not consider the concentration gradient in the supporting electrolyte. KCl, K,S&, KOH, and LiCl all have a similar effect; the differences between these four electrolytes are inconsequential. KI was found to have a large effect on the beam deflection.
beam becomes smaller, the divergence of the beam increases. A beam with a large divergence is difftcult to align with the electrode. A large divergence would also require a significantly more complex model of the probe beam propagation [211. There are two possible routes to obtain smaller probe beams, without having the problems of a large divergence. One route is to decrease the wavelength of the probe beam. At a constant divergence, the diameter of the probe beam scales linearly with the wavelength [49,50]. Thereby, at the same divergence, an argon laser (415 nm) or an He-Cd laser (442 nm) has a diameter 30%-35% smaller than the He-Ne laser (632 run>. The second route is to decrease the width of the electrode. The beam deflections in this work are two to three orders larger than the detection limit. Because the signal magnitude is directly proportional to the electrode width, it should be possible to decrease the electrode width to 1 mm. A narrower electrode can tolerate a probe beam with a higher divergence. There are practi- cal difficulties with both these routes, for example edge effects and pointing stability, but Fig. 5 indicates that there is motivation to increase the spatial resolution of the probe beam deflection technique.
The beam deflection was calculated for four com- mon electrolytes, and potassium iodide (see Fig. 6). Four of the electrolytes &SO,, KCl, KOH and LiCl) are practical supporting electrolytes for the ferri- cyanide/ ferrocyanide system. Each of these elec-
trolytes has a similar effect on the beam deflection. The similarity of these effedts is a coincidence. The physical parameters for these three electrolytes are significantly different (see Tables 1,2 and 3). To prove that the effects of various supporting electrolytes are not all similar, we searched for other electrolytes that would give a different effect. The beam deflection for KJ demonstrates that all supporting electrolytes do not produce the same effect. Because the potential for evolution of iodine is close to the reversible potential of the ferricyanide/ferrocyanide redox couple, KJ is not a practical supporting electrolyte for use with this redox couple.
7. Experimental results
Potential step experiments were performed in three electrolytes to demonstrate the effect predicted by the model. The electrolytes were prepared from new ACS reagent grade potassium ferricyanide and potassium ferrocyanide (Aldrich). The electrolytes were kept in dark storage. The supporting electrolytes were 0.5 M reagent grade potassium sulfate, potassium chloride, and potassium hydroxide. Each electrolyte contained 2.5 mM potassium ferricyanide and 2.5 mM potassium ferrocyanide. The electrolytes were purged with nitro- gen overnight to remove trace oxygen. An Oxyclear cartridge (LabClear) was used to remove any trace oxygen from the purge gas.
-The electrochemical cell is shown in Fig. 3. The working electrode is a 2.6 X 10 mm2 platinum plate embedded in a Kel-F holder. The reference electrode is a double junction Hg/Hg,Cl,Jsaturated KCJ elec-. trode. The double junction results in a very low leak rate so that the reference electrode electrolyte does not interfere with the experiment. A platinum mesh counter-electrode is contained in a separate compart- ment connected to the cell by a glass tube. Nitrogen was bubbled through the solution between experiments and passed over the electrolyte during experiments.
The experiments were controlled by a computer and Princeton Applied Research 273 potentiostat. The sys- tem generates a potential program that consists of a pretreatment, which holds the electrode at the equilib- rium potential of the ferricyanide/ ferrocyanide redox couple for 10 s. This is followed by a f 120 mV potential step relative to the pretreatment potential, which is applied for 30 s. Just before the pretreatment, the potentiostat measures the open-circuit potential and uses that value as the pretreatment potential. This procedure assures that the pretreatment potential is corrected for any slight shift in the concentration of the reactants (which would change the equilibrium poten- tial). The pretreatment potential varied only f2 mV

64
no support B __-------______
----___
“0 5 10 15 20 25 30
time / 8 Fig. 7. Comparison of the experimental and theoretical beam deflec- tions for pcaitive and negative steps in K$SO+ The experimental beam ,de+ctions are shown as solid lines. The &shed lines are theoretical calculations for a probe diameter of 210 pm. The positive and negative curves marked support were calculated from eqn. (43) with a probe offset df 128 pm. The positive curves marked no support A and nc support B were calculated from eqn. (42) with probe offsets of 250 pm and 128 pm.
for all the experiments. Between potential step experi- ments, the electrolyte was stirred by bubbling nitrogen from the bottom of the cell. This stirring was continued until the open-circuit cell potential returned to the equilibrium potential of the ferricyanide/ ferrocyanide redox couple (typically about l-2 min). &periments performed at overpotentials of f 180 mV were com- pared with the f 120 mV ,experiments to verify that mass transfer limited currents were achieved at the smaller overpotentials.
,I’he diameter of the probe beam was measured at
216 pm (Q,~ =, P 71 m). The probe beam is aligned such that it grazes the electrode surface and so that the beam is not distorted after it exits the cell. The exact offset of the probe’beam from the surface x0 is not known, but is constrained to a reasonable range l . Because we can see that the probe beam grazes the surface, the probe offset is probably not more than
3Q,W which is where the beam intensity is 5% of the centerline intensity. Because the probe beam is not significantly distorted’ as it passes the electrode, the probe offset is definitely not less than rl,=. Therefore, we: estimate ,that the probe offset. is between 70 and 210 pm. The probe. offset is the ,only unknown parame-
* Work is under. way to deveIop techniques for determining the probe offs&.’ The practical and theoretical difficulties of determin- ing this value, have been discussed in ref. 20.
ter and will be adjusted to give the best fit between the experimental and theoretical results. Because the elec- trochemical cell was not moved, the probe offset was kept constant for all the experiments in this work.
Figure 7 shows the experimental and theoretical beam deflections for positive and negative potential steps in potassium sulfate. The theoretical beam de- flections both with and without the effect of the con- centration gradients in the supporting electrolyte are shown. The probe offset was adjusted so that the deflection model for the anodic current agreed with the experimental data. The probe offset used to obtain the fit is 128 pm, which is a reasonable value. This curve agrees to better than 10% after the first few seconds.
The two curves marked no support A and B in Fig. 7 demonstrate that without considering the effect of the supporting electrolyte, the theoretical beam deflection cannot give a good fit to the experimental data. $-WO probe offsets have been used to calculate these curves. Curve B was calculated with the probe offset of 128 pm, and overpredicts the magnitude of the beam de- flection by about 50%. Curve A was calculated with a probe offset of 250 pm, and predicts the correct mag- nitude at 30 s, but greatly distorts the shape of the beam deflection. Using intermediate values for the probe offset does not improve the fit. Only with’the effect of the supporting electrolyte included do ‘the theoretical and experimental results agree well.
The two curves for cathodic currents in Fig. 7 doinot agree as well as the two anodic curves. The discrepancy is easily explained, although not easily solved. The probe beam is grazing the electrode surface in these experiments. For a probe offset of 128 pm and a radius of 74 pm the beam intensity is 5% at ‘the electrode surface. Therefore, a non-negligible portion of the beam is immediately adjacent to the electrode surface. The negative potential steps cause the probe beam to deflect towards the electrode. A 2 mrad deflection causes the beam to move 20 pm closer to the electrode. Therefore, part of the probe beam will be deflected such that it hits the electrode surface. TWO results are possible when the probe beani is deflected into the electrode. First, the part of ~the probe beam that hits the electrode can be reflected. This is quite possible with the polished platinum elec- trode we use. If part of the beam is reflected, :the deflection for that part of the beam is reversed, #i.e. what was a deflection towards the electrode becomes a deflection away from the electrode. The position detec- tor averages the deflection of the beam. Because only part of the beam is reflected, the position detector bill indicate a smaller beam deflection, but will still indi- cate a deflection towards the electrode. The second

65
possibility is that the part of the probe beam that hits the electrode is scattered and never reaches the posi- tion detector. In this case, the signal associated with that part of the beam is lost. Because the concentration gradients are steepest at the electrode surface, the beam deflection signal would be decreased. Because the models do not account for the probe beam hitting the electrode surface, the predictions for the beam deflections for cathodic current are too large.
Figure 8 shows, the experimental beam deflection during a mass transfer limited potential step in three different electrolytes. The electrolyte was exchanged without removing the electrochemical cell from the cell holder. Thereby, the alignment of the probe beam with the electrode surface is the same for each of the three experiments. These experimental deflections are all very similar as predicted by the results in Fig. 6.
The effect of background electrochemical reactions must be evaluated. The main possibilities are oxidajion axid reduction’ of the platinum eIectrode And oxygen reduction. Either of these reactions is cabable &f pro- ducing beam deflections that may be, as large as that caused by the reaction under study. The n’iagnitude of each of these effects is tested by performing the poten- tial step experiments in the blank electrolyte.
The b&am deflection for a potential step experiment in potassium sulfate containing no ferricyanide/ ferrocyanide ii shoOti in Fig. 9. The small beam deflec- tions are attributed to dabble layer charging. The first deflection at t = - 10 s is caused by changing the working electrodd frorh open-circuit to the reversible
0.5 , I ,’ ! I
I
time/s
Fig. 8. The up&ental beam d&I is shown ,for a mas6 transfer limited pob&al step in K,sO~i IK3, aad ICC383 ciaeeolytes The beam deflection in each electrolyte is very similar, as predicted.
I I 1
0 10 20 30
kime f s Fig. 9. An experiment ww performed in a blank electrolyte (withoiit ferkyanide~~erroq+nide) to &ermine the magnitude of back- ground reactions.“&e, Gretreatment starts at t = - 10 s. At I = 0, the p%ential step is applied. The be&n deflections at - 10 s and 0 s are &used by d&ble layer charging. Note that beam deflections are three orders d magnitude’ shraller than in the regular experiments. The offset from zero in&+&s that the probe &am was not perfectly centered on the position detector before the experirpents began.
potential. The second step at t = 0 s is the potential step. The smaller f120 mV overpotential was pre- ferred to larger steps to minimize the effect of double layer charging. The blank experiment confirms.that the background reactions were. negligible. Fire ,9, shows that the noise level is less than 1 firad.
The discrepancy between experimental and theoreti- cal results is less than. 10%. Either an error ;in the physical parameters or shortcomings of the model can be at fault. As we will discuss later, small errors in either the probe diameter or the concentrative refrac- tivities could cause the observed discrepancy. The dis- agreement about the ferricyanide and ferrocyanide dif- fusion coefficients can alsd be a source of the discrep- ancy. We’ can identify several possible shortcomings of the model. One is the effect of free convection. In reK 55, the’authors show the effectof the orienttition‘of the electrode with respect to gravity on potential step experiments. Thk effect is slight, and is an uniikeljl explanation of the discrepancy. A second more proba- ble source of discrepancy is uncertainty in the angular alignment of the electrode with the probe beam. The most likely source of the discrepancy is the small angle approximation discussed in the introductory section. The models assume that the offset of the probe beam from the electrode surface does not change over the width of the electrode. The beam deflections shown in this work have magnitudes bf about 1.5 nirad. These

deflections cause the offset to change 15 pm over the width of the electrode (about 10% of the offset at the leading edge of the electrode).
8. Deter&ring traaspult pmpertks
We explore in this section the ability of probe beam deflection to determine diffusion coefficients. The main approach hasbeen based on the extremutkt in the beam deflection. We will attempt to disprove this approach and suggest that a non-linear regression is a possible, but also difficult, method to determine the diffusion coefficients.
8.1. Exrrema For a potential step experiment, it has been sug-
gested in the literature that the time of the extremum of the beam deflection transient r, can be used to determine the d&fusion coc&k&nts of the electrolyte species. References 6 and 24 assume that the diffusion coefficient pf the reactant and product are equal and conclude that the extremum occurs at r, -$/2D. If the reactant and product are assumed to be extremely similar species, it is odd to assume that the diffusion coefficients’ of the two species are the same, but that the concentrative refractivities are different. If the concentrative refractivities are also assumed to be the same, then eqn. (15) reduces to the uninteresting result 8 = 0. Reference 25 states that the extremum for the ferricyanidei ferrocyanide redox couple occurs at r, =xi/4D. Reference 21 assumes that onIy one species is transported and shows that the extremum otxurrs at
text =.$/8D. None of these references discusses the effect of the supporting eleotrolyte. The goal of all these authors was to determine an expression of the
r cxt = xi/nD (45) that could be used to determine diffusion coefficients. Typically, the experiment is repeated at a series of probe offsets, and a plot is made of r, vs. x,$ The points of such an experiment form a line with a slope of l/nD, although it is not clear what D is to be used.
We can use eqn. (43) to show that an expression similar to eqn. (45) is not achievable. The extrema can be determined from the time derivative of eqn. (43):
S’- 2LcZ (lu, - a*1Y,)
erfc[ -X,/t] ( “DA$‘* E’( DA)
(*n -%%)(DA/DE$'*
( vDB)“* E’(Dl3)
where, for i = A, B, e
This expression cannot be solved analytically for the time r, at which S’ = 0. Clearly, r, sf(DA, D,, D,, D_, FA, !PB, !Pe, r, x0) and this functionality is:not trivial.
The numerical solution of eqn. (46) for S’ = 0 does predict that plots of r, vs. xi are very close to straight lines. Table 4 shows the values of the slope m that would be achieved for several supporting electrolytes. Anodic and cathodic experiments result in the same slope. Based on the ferrocyanide diffusion coefficient, the values in Table 4 correspond to values of it (eqn. (45)) ranging from 1.5 to 1.7. These values are close enough to 2 to explain why experiments based on &t = x,2/2 D appear to be successful, but yield diffu- sion coefficients with large errors. A similar calculation of slopes for several beam diameters showed that #the slope varied about 10% as the diameter varied from 280 to 0 pm.
An experimental determination of r, vs. xi has been reported for the ferricyanide/ ferrocyanide redox couple supported by potassium chloride [6]. The exper- imental plot had a slope of 8.77 X lo4 cm-* s. Using m = l/20, ref. 6 calculates 5.7 X 10m6 cm* s-l for the ferricyanide/ ferrocyanide diffusion coefficient. This value is lo%-35% smaller than any reported measure- ments (Table 1) and demonstrates the inaccuracy of the approach. Using the diffusion coeffkients from ref.
TABLE 4. Theoretical calculations of slope of line fitting t,, vs. xi data for several electrolytes; the probe diameter is 212 pm
Electroke 10-4 In cm-* s
Potassium sulfate 7.80 Potassium chloride 8.15 Potassium hydroxide 8.46 Negkcted (eqn. (42)) 8.63

67
56 in Table 1, the numerical solution of eqn. (46) predicts that the slope is 8.46~ lo4 cme2 s for the 60 km probe diameter used in ref. 6. This theoretical slope is 4% smaller than the experimental value and well within the precision that extrema can be deter- mined experimentally. Using the older diffusion coeffi- cients reported in refs. 54 and 61, the numerical ,solu- tion of eqn. (46) predicts that the slope is 9.90 x lo4 cme2 s. This slope is 13% larger than the experimental value and suggests that the correct diffusion coeffi- cients are closer to the more modern values. Experi- ments in potassium sulfate were reported with a slope of 2.6 X lo4 cmm2 s in ref. 25. This slope is difficult to explain because the a,uthors do not clearly state how t kxt was determined. Using this slope, the diffusion coefficient is calculated as 9.4 x 10m6 cm2 s-l, which is 5%-25% larger than reported values. In neither case do the authors of refs. 6 or 25 indicate which diffusion coefficient, ferricyanide or ferrocyanide, is calculated.
8.2. Nordinear regression Another more promising possibility for determining
the diffusion coefficients is to use a curve fitting algo- rithm to fit eqn. (43) to a complete potential step response. Reference 62 states that regressions to equa- tions of the class y =A expC-at)+8 exg$-bt) are extremely difficult. Our expressions are similar to this form. Nonetheless, we have found that curve-fitting software (Peakfit, Jandel Scientific) using the Mar- quadt-Lever&erg algorithm [63-661 is able to fit eqn. (43) to “perfect” data and determine precisely the diffusion coefficients DA, Dn, D, and D_ within the range of parameters under study. This method has been used before in the analogous heat transfer prob- lem to determine thermal properties [65]. To test the ability to determine parameters with a non-linear re- gression, we used eqn. (43) to calculate a “perfect” experimental transient and then used the software to attempt to determine the parameters that were used in eqn. (43) to calculate those “perfect” data. Because the concentrative refractivities and probe diameter are easily measured, we assumed that they are knowns. The probe offset and four diffusion coefficients are treated as variables.
We have made several observations about this theo- retical curve-fitting process when x,,, DA, and D, are variables.
The initial guesses need not be very good. The regression converged quickly to the correct values, even with initial guesses from twice to half the correct value.
The value of the diffusion coefficients determined by the regression is sensitive to the probe diameter. Changing the probe diameter 10% from its input value
TABLE 5. Results of fittiag eqn. (43) to the anodic experimental data in Fig. 7 when various parts of the data are excluded
J%lude xn hrn 10’ Da cd s-' 10’ Dacm2s-l yz
None 124 0.841 0.971 0.56 < 0.5 s 120 0.752 0.848 0.17 <l.Os 116 0.682 0.754 0.05 <1.5 s 115 0.645 0.704 0.02
caused the diffusion coefficients to be more than 20% in error. This sensitivity indicates a problem of using probe beams focused to a small diameter. A probe beam focused to 100 pm at the center of a 10 mm wide electrode will be 8% larger at the edges of the elec- trode. A probe beam focused to 75 pm will be 20% larger [20]. The problem becomes which diameter should be used in the theoretical expressions, that at the center or at the edge? To avoid this problem, we usually work with probe diameters larger than 100 pm.
A similar sensitivity to the concentrative refractivi- ties is seen. The error in the diffusion coefficients is about twice the error in the concentrative refractivities.
The value of the diffusion coefficients is less sensi- tive to the diffisivities of the electrolyte anion and cation. Increasing the value of D + by 20% only changed the values of DA and D, by 1%. Decreasing the value of D_ by 50% only changed the values of DA and D, by 10%.
These results suggest that a regression to the real data should be able to determine the diffusion coeffi- cients.
The anodic experimental transient in Fig. 7 was fitted to eqn. (43) with x,,, DA, and D, treated as unknowns. At short times the beam deflection is domi- nated by a steep gradient that is very close (relative to the probe diameter) to the electrode surface. In this situation, the assumption that each differential slice of the probe beam is deflected independently is not valid. The deflection calculation (eqn. (41)) is not accurate for this situation and some short time data should be discarded (cf. ref. 21). Table 5 shows the results of the fit, along with the measure of the fit x2 for various amounts of excluded data. All the fits were very good; they varied less than 2% over the whole beam deflec- tion. The resulting diffusion coefficients can be varied more than 20% by excluding various amounts of data. Because the amount of data to be excluded can be chosen arbitrarily, the results are arbitrary. These re- sults clearly show the difficulty of the regression tech- nique for determining the diffusion coefficients.
9. Condusiou
We have shown both experimentally and theoreti- cally that the probe diameter limits our ability to

observe small features in the beam deflection. The small reversal in the beam deflection (see Fig. 5) is a characteristic of the mass transport and is not a ther- mal effect. The reversal occurs when one species has a large mobility and the other species has a large concen- trative refractivity. The fast moving species affects the probe beam first and for a short time controls the direction of the beam deflection. The slower moving species affects the probe beam second, and because it has the larger concentrative refractivity the direction of the beam deflection becomes controlled by this species. A large diameter probe beam cannot detect this unique feature. Figure 5 indicates that we should be motivated to decrease the probe diameter to the 50 pm range. Either decreasing the width. of the electrode or de- creasing the wavelength of the probe beam are possible methods of increasing the spatial resolution of the probe beam deflection technique.
There have been reports in the literature that the extrema of the beam deflections can be used to deter- mine the diffusion coefficients of the reactants [6,21,25]. We have discussed brefore that eqn. (15) demonstrates that the extremum of the beam deflection is not easily related to transport properties [18]. After having con- sidered the effect of the supporting electrolyte and probe diameter, we are further convinced that the extremum in the beam deflection is not a useful quan- tity, i.e. the extremum of the beam deflection cannot be used to determine the diffusivities of the participat- ing species. The extremum is a function of several parameters, and a single measurement cannot deter- mine more than one unknown quantity. Instead of using only the extremum, theoretically one can fit the entire beam deflection transient to one of the analytic solutions (eqns. (42) or (43)). This method has its own difficulties which can lead to erroneous results. Mainly, the beam deflection transient is not distinct enough to allow the precise determination of the main parame- ters, DA, Da, D,, D_, and x,,, by regression. Many combinations of parameters will be able to produce a good fit, and it will be difficult to determine when the fit between experiment ahd theory is satisfactory. We do not consider the difficulty of obtaining diffusion coefficients to be a failing of the probe beam deflection technique. Standard electrochemical techniques are better suited to the measurement of diffusion coeffi- cients [52,53,55],. During a mass transfer limited poten- tial step, the current is dependent only on the .diffusion of the reactant. This dependence is far simpler than the complex interaction of parameters in eqn. (43). In our opinion the strength of the technique is in deter- mining reaction mechanisms, not physical parameters.
When testing candidate reaction mechanisms against the results of probe beam deflection experiments, mod-
eling is required. The main conclusion of this work is that modeling must consider the effect of the support- ing electrolyte &d probe dia@etei. Figure 7 demon- strates that only when +he effect of ‘the supporting electrolyte is ‘considered can the experitiental’ and the- oretical results be matched.
Accurate modeling of beam deflections towards the electrode remains a problem. Wheh the probe beati is close to the electrode, part of the beam will be de- flected such that it hits the electrode surface. Modeling what happens to the beam after it hits the surface is a challenge. This problem can be avoided by placing ;the probe beam far from the electrode surface (200-300 pm). This route may improve the agreement between model and experiment, but decreases the magnitude of the beam deflection and decreases the resolution of features in the beam deflection. The present model overpredicts beam deflections towards the ilectrode by about 15%.
The two models presented are limited by a support- ing electrolyte approximation, which neglects the effect of migration on the reactants. Thii approximation lim- its us to the use of dilute react&&s in a concentrate& supporting electrolyte. The supporting electrolyte iap- proximation forces the concentrations into a diffiduft region. With the concentrations of the reactants very low, the effect of backgrbund ‘reactidns can. become significant. However, increasing the reabtant concen- tration to overcome any background reactions wobld void the supporting electrolyte approximation. An im- proved model would incorporate the effect of migra- tion on all species.
The removal of the small angle approximation from the model should be considered. An improved model would result if we could account for the change of the probe offset over the width of the electrode. Sudh a model would probably have to be solved numerically. Because the discrepancy between the present model and experiment is only a few per cent, there is not a strong motivation to account for the changing, probe offset.
Acknowledgment
G.M. Brisard acknowledges the support of The Min- istbre de 1’Enseignement supCrieur et de la Science (Programme Actions Structurantes).
This work is supported by the Assistant Secretary for Conservation and Renewabie Energy, Office of Transportation Technologies, Electric and Hyblid Propulsion Divison, of the United States Depart- ment of Energy under contract number DE-ACO3- 76SFOOO!JS.
69
References
1 0. Haas, Faraday Discuss. Chem. Sot., 88 (1989) 123. 2 MC. Pham, J. Moslih, C. Barber0 and 0. Haas, J. Electroanal.
Chem., 316 (1991) 143. 3 C. Barbero, M.C. Miras, 0. Haas and R. Katz, J. Electroanal.
Chem., 310 (1991) 437. 4 R. Kotz, C. Barber0 and 0. Haas, J. Electroanal. Chem., 296
(1990) 37. 5 C. Barbero, M.C. Miras, 0. Haas and R. Kotz, J. Electrochem.
Sot., 138 (1991) 669. 6 C. Barbero, MC. Miras and R. Kotz, Electrochim. Acta, 37(3)
(1992) 429. 7 E. Vie& T. Matencio, V. Plichon and S. Servagent, Synth. Met.,
43 (1991) 2837. 8 V. Plichon, R. Even and G. Beiner, J. Electroanal. Chem., 305
(1991) 195. 9 V. Plichon and S. Besbes, J. Electroanal. Chem., 284 (1990) 141.
10 V. Plichon and N. Rollat, Int. J. Mineral Proc., 28 (1990) 99. 11 F. Decker and M. Fracastoro-Decker, J. Electroanal. Chem., 243
(1988) 187. 12 F. Decker, R.T. Neuenschwander, C. Cesar and A.F.S. Penna, J.
Electroanal. Chem., 228 (1987) 481. 13 M. Fracastoro-Decker and F. Decker, J. Electroanal. Chem., 266
(1989) 215. 14 R.E. Russo, F.R. McLamon, J.D. Spear and E.J. Cairns, J.
Electrochem. Sot., 134 (1987) 2783. 15 J.K. Weaver, F.R. McLamon and E.J. Cairns, J. Electrochem.
Sot., 138 (1991) 2572. 16 J.K. Weaver, F.R. McLamon and E.J. Cairns, J. Electrochem.
sot., 138 (1991) 2579. 17 J.K. Weaver, MS Thesis, University of California at Berkeley,
1990 (also published as Rep. LBL30132, Lawrence Berkeley Laboratory, December 1990).
18 J.D. Rudnicki, F.R. McLamon and E.J. Cairns, in R. Varma and J.R. Selman (Eds.), Techniques for Characterization of Elec- trodes and Electrochemical Processes, Wiley, New York, 1991.
19 0. Haas, J. Rudnicki, F.R. McLarnon and E.J. Cairns, Faraday Trans., 87 (1991) 939.
20 J.D. Rudnicki, PhD Thesis, University of California at Berkeley, 1992 (also published as Rep. LBL-32127, Lawrence Berkeley Laboratory, March 1992).
21 A. Mandelis and B.S.H. Royce, Appl. Opt., 23 (1984) 2892. 22 H.J.V. Tyrrell, J.G. Firth and M. Kennedy, J. Chem. Sot., Lon-
don J., (August 1961) 3432. 23 M.A. Tamor and M. Zanini, J. Electrochem. Sot., 133 (1986)
1399. 24 J. Pawliszyn, Anal. Chem., 60 (1988) 1751. 25 B.S.H. Royce, D. Voss and A. Bocarsly, J. Phys. (Paris), 44 (1983)
C6-325. 26 J.P. Roger, D. Foumier and A.C. Boccara, J. Phys. (Paris), 44
(1983) C6-313. 27 J. Pawliszyn, M.F. Weber, M.J. Dignam, A. Mandelis, R.D.
Venter and S.-M. Park, Anal. Chem., 58 (1986) 236. 28 J. Pawliszyn, M.F. Weber, M.J. Dignam, A. Mandelis, R.D.
Venter and S.-M. Park, Anal. Chem., 58 (1986) 239. 29 F.R. McLamon, R.H. Muller and C.W. Tobias, J. Opt. Sot. Am.,
65 (1975) 1011. 30 G. Kegeles and L.J. Gosting, J. Am. Chem. Sot., 69 (1947) 2516.
31 H. Svensson, Acta Chem. Stand., 5 (1951) 72. 32 R.N. O’Brien, Rev. Sci. Instrum., 35 (1964) 803. 33 R.N. O’Brien, J. Electrochem. Sot., 113 (1966) 389. 34 K.W. Beach, R.H. Muller and C.W. Tobias, Rev. Sci. Instrum., 40
(1969) 1248. 35 KW. Beach, R.H. Muler and C.W. Tobias, J. Opt. Sot. Am., 63
(1973) 559. 36 F.R. McLamon, R.H. Muller and C.W. Tobias, Electrochim.
Acta, 21 (1976) 101. 37 C.-C. Jan and R.L. McCreery, Anal. Chem., 58 (1986) 2771. 38 H. Wu and R.L. McCreery, J. Electrochem. Sot., 136 (1989) 1375. 39 C.-C. Jan, R.L. McCreery and F.T. Gamble, Anal. Chem., 57
(1985) 1763. 40 X.Z. Li, S. Petrovic and D.J. Harrison, Sens. Actuators B, 1
(1990) 275. 41 Y. Fukunaka, K. Denpo, M. Iwata, K. Maruoka and Y. Kondo, J.
Electrochem. Sot., 130 (1983) 2492. 42 R. Pruiksma and R.L. McCreery, Anal. Chem., 51 (1979) 2253. 43 S.L. Liao, R.A. Couch and C.L. Olson, Anal. Chem., 64 (1992)
2413. 44 P. Rossi, W. McCurdy and R.L. McCreery, J. Am. Chem. Sot.,
103 (1981) 2524. 45 W.B. Jackson, N.M. Amer, A.C. Boccara and D. Fournier, Appl.
opt., 20 (1981) 1333. 46 M. Born and E. Wolf, Principles of Optics, Pergamon, oxford,
1970. 47 F.A. Jenkins and H.E. White, Fundamentals of Optics, McGraw-
Hill, New York, 1957, 3rd edn. 48 D. Foumier and AC. Boccara, in J.A. Sell (Ed.), Photothermal
Investigations of Solids and Fluids, Academic Press, Berkeley, CA 1989.
49 H. Kogelnik and T. Li, Appl. Opt. 5 (1966) 1550. 50 H. Kogelnik, in Applied Optics and Optical Engineering, Vol.
VII, Academic Press, 1979. 51 A. Bard and L. Faulkner, Electrochemical Methods, Wiley, New
York, 1980. 52 D.H. Angel1 and T. Dickinson, J. Electroanal. Chem., 35 (1972)
55. 53 J.J. Lingane and I.M. Kolthoff, J. Am. Chem. Sot., 61 (1939) 825. 54 V.M. Stackelberg, M. Pilgram and V. Toome, Z. Elektrochem.,
57 (1953) 342. 55 H.A. Laitinen and I.M. Kolthoff, J. Am. Chem. Sot., 61 (1939)
3344. 56 J. Newman, Electrochemical Systems, Prentice-Hall, Englewood
Cliffs, NJ, 1973. 57 R.C. Weast (Ed.), CRC Handbook of Chemistry and Physics,
CRC Press, Boca Raton, FL, 1987, 70th edn. 58 B. Levich, Acta Physicochim. URSR, 17 (1942) 257. 59 L.C. Aamodt and J.C. Murphy, J. Appl. Phys., 52 (1981) 4903. 60 WA. McGahan and K.D. Cole, J. Appl. Phys., 72 (1992) 1362. 61 R.N. Adams, Electrochemistry at Solid Electrodes, Marcel
Dekker, New York, 1969. 62 F.S. Acton; Numerical Methods That Work, Harper & Row, New
York, 1970. 63 K. Levenberg, Q. Appl. Math., 2 (1944) 164. 64 D.W. Marquardt, J. Sot. Ind. Appl. Math., 11 (1963) 431. 65 M. Hassanayn, W.A. McGahan and J.A. Woollam, Thin Solid
Films, 215 (1992) 103. 66 W.H. Press, B.P. Flannety, S.A. Teukolsky and W.T. Vetterling,
Numerical Recipes, Cambridge University Press, New York, 1989.
Related Documents