Int. J. Electrochem. Sci., 11 (2016) 4701 – 4711, doi: 10.20964/2016.06.40 International Journal of ELECTROCHEMICAL SCIENCE www.electrochemsci.org Effect of the Powder Metallurgy Manufacture Process on the Electrochemical Behaviour of Copper, Nickel and Copper- Nickel Alloys in Hydrochloric Acid Paula Rojas 1,* , Rosa Vera 2 , Carola Martínez 1 , María Villarroel 2 1 School of Design, Universidad Adolfo Ibáñez, Diagonal Las Torres 2640, Santiago, Chile 2 Institute of Chemistry, Faculty of Sciences, Pontificia Universidad Católica de Valparaíso, Av. Universidad 330, Casilla 4059, Curauma, Valparaíso, Chile. * E-mail: [email protected] Received: 11 March 2016 / Accepted: 3 April 2016 / Published: 4 May 2016 In this study materials were manufactured using powder metallurgy, by mechanically milling Cu and Ni and mechanically alloying Cu-Ni (at 50-50 and 60-40% in weight). In order to consolidate samples at the lowest possible temperature, after the milling cold sintering was used at 300°C and 900 MPa. This type of sintering does not always give high densities, though it is effective in not significantly altering the characteristics of the materials obtained from the milling process. The microstructural characteristics of the materials were analysed in each phase by X-ray diffraction, spectroscopy and scanning electron microscopy. Considering the sintering conditions and the materials in question, the results show that high densities were achieved (>90%) with the copper, but the densities were low for the binary alloys and the nickel alone (<80%). After the sintering, the electrochemical behaviour of each material was studied in acid media. The results show that under the manufacture conditions of this study, the consolidated 60-40 Cu-Ni and 50-50 Cu-Ni alloys behave better in terms of corrosion in 0.1M HCl than the copper and nickel alone. Keywords: corrosion, copper-nickel alloys, polarisation, hydrochloric acid 1. INTRODUCTION Copper and copper-based alloys have always played an important role in human development [1-2]. Today, properties such as electrical and thermal conductivity, together with corrosion resistance, make copper a standout material in several industrial sectors [1-3]. In the case of copper-based alloys, the most important alloying elements used are Zn, Sn, Al, Si and Ni. The first four possess limited

Welcome message from author
This document is posted to help you gain knowledge. Please leave a comment to let me know what you think about it! Share it to your friends and learn new things together.
Transcript

Int. J. Electrochem. Sci., 11 (2016) 4701 – 4711, doi: 10.20964/2016.06.40
International Journal of
ELECTROCHEMICAL SCIENCE
www.electrochemsci.org
Effect of the Powder Metallurgy Manufacture Process on the
Electrochemical Behaviour of Copper, Nickel and Copper-
Nickel Alloys in Hydrochloric Acid
Paula Rojas1,*
, Rosa Vera2, Carola Martínez
1, María Villarroel
2
1 School of Design, Universidad Adolfo Ibáñez, Diagonal Las Torres 2640, Santiago, Chile
2 Institute of Chemistry, Faculty of Sciences, Pontificia Universidad Católica de Valparaíso,
Av. Universidad 330, Casilla 4059, Curauma, Valparaíso, Chile. *E-mail: [email protected]
Received: 11 March 2016 / Accepted: 3 April 2016 / Published: 4 May 2016
In this study materials were manufactured using powder metallurgy, by mechanically milling Cu and
Ni and mechanically alloying Cu-Ni (at 50-50 and 60-40% in weight). In order to consolidate samples
at the lowest possible temperature, after the milling cold sintering was used at 300°C and 900 MPa.
This type of sintering does not always give high densities, though it is effective in not significantly
altering the characteristics of the materials obtained from the milling process. The microstructural
characteristics of the materials were analysed in each phase by X-ray diffraction, spectroscopy and
scanning electron microscopy. Considering the sintering conditions and the materials in question, the
results show that high densities were achieved (>90%) with the copper, but the densities were low for
the binary alloys and the nickel alone (<80%). After the sintering, the electrochemical behaviour of
each material was studied in acid media. The results show that under the manufacture conditions of
this study, the consolidated 60-40 Cu-Ni and 50-50 Cu-Ni alloys behave better in terms of corrosion in
0.1M HCl than the copper and nickel alone.
Keywords: corrosion, copper-nickel alloys, polarisation, hydrochloric acid
1. INTRODUCTION
Copper and copper-based alloys have always played an important role in human development
[1-2]. Today, properties such as electrical and thermal conductivity, together with corrosion resistance,
make copper a standout material in several industrial sectors [1-3]. In the case of copper-based alloys,
the most important alloying elements used are Zn, Sn, Al, Si and Ni. The first four possess limited

Int. J. Electrochem. Sci., Vol. 11, 2016
4702
solubility in solid form (37, 9, 19 and 8%, at maximum), while nickel is fully soluble. Copper-based
alloys can improve the mechanical properties of pure copper through one or more mechanisms, such as
solid solution, cold deformation, grain refinement and/or aging. However, all these affect electrical
conductivity and corrosion resistance due to microstructural changes caused by hardening [3-4].
Mechanical alloying is a manufacturing process that combines several hardening mechanisms
simultaneously; when applied to pure materials it is known as mechanical milling. The action of the
milling medium, which impacts the materials at high velocity, leads to microstructural refinement,
incorporation of crystalline defects, formation of solid solutions, precipitation of new phases and in
some cases even amorphization of crystalline phases [5-7].
Though some studies have looked at the effect of milling on the electrochemical properties of
different materials [8-14], the connection between the production of copper-based solid solutions
through mechanical alloying generating hardened alloys with above equilibrium solubility, and the
effect of the process on their electrochemical behaviour remains unclear [15-19]. Therefore, in this
study materials were manufactured by high-energy milling and mechanical alloying, and were then
consolidated by cold sintering in order to obtain a dense material with the least possible effect from the
consolidation process. Cold sintering is a consolidation technique in which high pressure and
temperatures below 450°C are applied to powdered materials, as a result of which the densities
achieved are often no higher than 85% of the theoretical value. However, the process does maintain the
majority of the microstructural characteristics of the powder [20].
2. MATERIALS AND METHODS
2.1 Manufacturing Processes
Samples: the samples under study correspond to pure copper, pure nickel and two Cu-
Ni alloys (50%-50% and 60%-40% wt respectively). In this study these materials are compared before
and after milling, for example, Cu-0H, means copper without milling and Cu-5H, means copper milled
for 5 hours.
Milling and Sintering: high energy milling of different powders was carried out in a
SPEX 8000D mill, with a ball/powder ratio of 10:1, using 1% stearic acid as the control agent. In all
cases, the milling time was set at 5 h. After milling, cold sintering was used to produce 13 mm
diameter cylinders of each material. Sintering was carried out in a hydraulic press of our own creation,
equipped with an oven, and applying a uniaxial pressure of 900 MPa at 300°C.
2.2 Experiment Techniques
Scanning electron microscopy (SEM): Micrographs of the powders were obtained in a
Zeiss Evo MA10 microscope. For the sintered materials and the electrochemical tests, a Hitachi
SU3500 microscope was used.
Int. J. Electrochem. Sci., Vol. 11, 2016
4703
X-ray diffraction (XRD): The analysis was carried out in a Shimadzu XRD-6000
diffractometer (Cu K) in a 2θ scanning range from 30° to 100°, and a step angle of 0.02° and 3
seconds per step.
Atomic Abortion Spectroscopy (AAS): The chemical analysis to determine iron
contamination was carried out in a Shimadzu AA 6800 F spectrophotometer.
Electrochemical test: Corrosion resistance was evaluated through potentiodynamic
polarisation experiments in 0.1M HCl aerated solution at room temperature, using a three-electrode
cell: Pt working electrode and counter electrode and Ag/AgCl reference electrode, with a potential
scanning rate of 0.5 mVs-1
. The Tafel curves were generated in an AUTOLAB PGSTAT30 potentiostat.
3. RESULTS AND DISCUSSION
3.1 Particle morphology before and after milling
a b
c d
e f
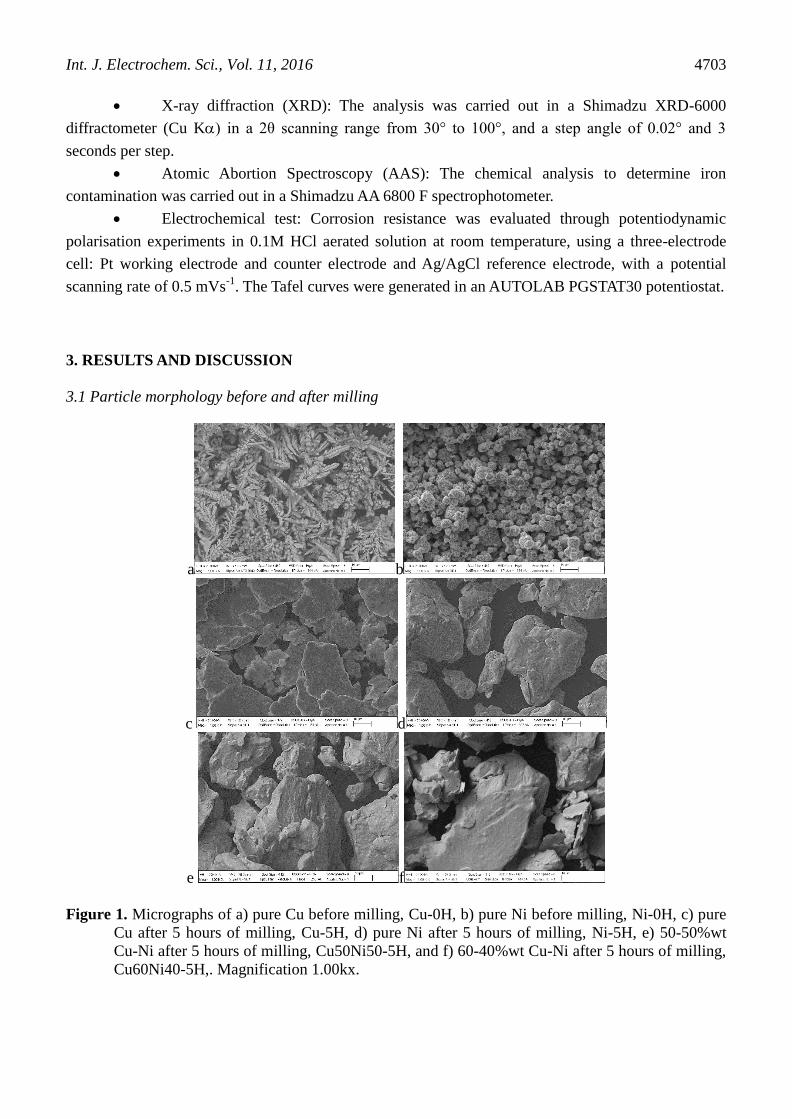
Figure 1. Micrographs of a) pure Cu before milling, Cu-0H, b) pure Ni before milling, Ni-0H, c) pure
Cu after 5 hours of milling, Cu-5H, d) pure Ni after 5 hours of milling, Ni-5H, e) 50-50%wt
Cu-Ni after 5 hours of milling, Cu50Ni50-5H, and f) 60-40%wt Cu-Ni after 5 hours of milling,
Cu60Ni40-5H,. Magnification 1.00kx.

Int. J. Electrochem. Sci., Vol. 11, 2016
4704
Micrographs were taken with a scanning electron microscope to show the morphology of the
powders before and after milling (Figure 1).
The micrographs show that the initial powders of the pure elements (Figures 1a and 1b) are
very different in morphology and size, due to their manufacturing processes. After 5 hours of milling,
the appearance of the particles changes drastically. In the case of the pure copper (Figure 1c), the
formation of flakes can be seen, which are characteristic of very ductile materials [5-7], while no
flakes are seen in the nickel and the Cu-Ni alloys (Figure 1d, 1e and 1f), instead showing particles
composed of layers of flakes, which is a result of fracturing and welding. Thus, the morphology of the
nickel and the Cu-Ni alloys shows that under the same milling conditions, the materials behave in a
less ductile manner than the copper, as their morphology is different to that of copper but similar to
each other.
3.2. Chemical composition after milling
The chemical analysis conducted after milling using Atomic Abortion Spectroscopy (AAS),
shows that the process contaminated the powders as a function of two variables: milling time and type
of milled material, Table 1.
Table 1. % Fe after milling as a function of the milled material and the milling time
Milled material
Milling time (h)
0 1 5 10 15 30 60
Cu 2E-04 0,018 0,073 0,115 0,155 0,430 0,580
Ni 0,001 0,053 0,575 2,670 6,687 11,749 14,326
60%Cu-40%Ni 0,039 0,024 0,165 0,537 0,270 1,225 2,260
50%Cu-50%Ni 0,005 0,029 0,457 0,401 2,193 2,960 6,478
Therefore, comparing the effect of the same milling conditions for copper and nickel (equation
1a and 1b), it can be seen that the nickel becomes very abrasive for the containers and the balls,
increasing the iron content in the samples by up to 15% iron after 60 hours of milling. This is
explained because different materials will have a different response to the same hardening
mechanisms, in this case, cold work hardening have a greater impact on nickel than copper, became it
in a very abrasive material for steel. Indeed, the milling conditions applied to nickel turned it into a Ni-
Fe alloy, rather than a sample of pure Ni.
3.3 X-ray diffraction after milling and after consolidation
In order to analyse the effect of the milling alone, Figure 2 shows the diffractograms of each
material as a function of milling time. As can be seen, for the pure copper and nickel samples (Figures
2a and 2b), the diffraction peaks of the elements lose intensity and drop with increased milling time.
This represents changes in the microstructure associated with refinement and crystalline defects [5-7].

Int. J. Electrochem. Sci., Vol. 11, 2016
4705
Unlike the pure metals, for both Cu-Ni alloys (Figures 2c and 2d) it can be seen that with increased
milling time, the nickel diffraction peaks diminish until they disappear, and only the copper peaks
remain, suggesting the formation of a total solid solution occurring in both cases after 5 hours of
milling. Therefore, these samples were used for hot consolidation.
In order to study the effect of the consolidation process on samples after 5 hours of milling,
Figure 3 shows the diffractograms obtained before and after cold sintering at 300°C and 900 MPa. In
this study, the sintering parameters were not varied for each alloy, maintaining the pressure and
temperature for each case. A pressure of 900 MPa was used for all samples. This value is relatively
high for conventional processes of cold sintering, for which up to 3 GPa can be applied, depending on
the equipment [20]. The temperature used, 300°C, represents approximately 28% of the melting point
temperature of copper, 23% for the liquids of the Cu-Ni alloys, and 20% for nickel [21]. Therefore,
thermal activation of the samples is minimised, leading to as little microstructural effect as possible,
though despite this the diffraction profiles do show some effect.
a)
20 30 40 50 60 70 80 90 100
oooo
Inte
nsi
ty /
a.u
.
2 /°
o
0 h
60 h
10 h
5 h
1 h
30 h
15 h
b)
20 30 40 50 60 70 80 90 100
+++++
0 h
60 h
10 h
5 h
1 h
30 h
15 h
Inte
nsi
ty /
a.u
.
2 /°
c)
20 30 40 50 60 70 80 90 100
O+
O+O+ O+ O+
2 /°
Inte
nsi
ty /
u.a
.
****
*
60 h
10 h
5 h
0 h
1 h
30 h
15 h
CuNi 50-50wt%
d)
20 30 40 50 60 70 80 90 100
O
+ O+ O
+O +O+
0 h
** * *
*
60 h
10 h
5 h
1 h
30 h
15 h
Inte
nsi
ty /
u.a
.
2 /°
CuNi 60-40 wt%
Figure 2. XRD analysis results for samples taken at different milling times: a) pure Cu, b) pure nickel,
c) 50-50%wt Cu-Ni and d) 60-40%wt Cu-Ni. Symbols: o pure Cu, + pure Ni and * Cu-Ni solid
solution

Int. J. Electrochem. Sci., Vol. 11, 2016
4706
As can be seen in the XRD results, the sintering process produced a slight movement in the
copper and nickel diffraction peaks, more notably for nickel, though this effect was not seen for the
alloys. The analysis of the powders shows that after milling the nickel had high iron content, but the
iron was not seen in the diffraction patterns. Therefore, it can be assumed that during milling, iron
content was incorporated into the solid solution, thus explaining the movement of the diffraction peaks
(Figure 2b), and when thermally activated, this element in oversaturated alloy precipitated during
sintering, which would explain the peak movements in Figure 3b.
a)
30 40 50 60 70 80 90 100
42 43 44 45 46 50 51 52 53
Inte
nsi
ty /
a.u
.
Cu 5 h
Cu 5 h + 300°C- 900 MPa
2 /°
b)
30 40 50 60 70 80 90 100
2/ °
Inte
nsi
ty /
a.u
.
Ni 5h
Ni 5h +300°C -900MPa
40 42 44 46 48 50 52 54
c)
30 40 50 60 70 80 90 100
Cu-Ni 50-50 5h
Cu-Ni 50-50+300°C -900MPa
2/ °
Inte
nsi
ty /
a.u
.
40 41 42 43 44 45 49 50 51 52 53 54 55
d)
30 40 50 60 70 80 90 100
Cu-Ni 60-40 5h
Cu-Ni 60-40 + 300°C- 900MPa
2/ °
Inte
nsi
ty /
a.u
.
40 41 42 43 44 45 49 50 51 52 53 54 55
Figure 3. XRD analysis results, comparison of after 5 hours of milling and after sintering of a) pure
Cu, b) pure Ni, c) 50-50%wt Cu-Ni and d) 60-40%wt Cu-Ni
After sintering, the density of each sample was determined using the geometric method.
Evaluating the densities achieved (Table 2), it can be seen that the high pressure compensated for the
low temperature only in the case of copper. In particular, the copper at 0h and after milling for 5h
attained 99% and 91% of theoretical density, respectively. The nickel and Cu-Ni alloys achieved much
lower densities, never above 80%. It can be said that the manufacturing conditions were appropriate
only for some materials and therefore for further analysis it is necessary to consider the high porosity
of the samples in order to avoid comparing the values obtained directly with materials with high or
total densification.

Int. J. Electrochem. Sci., Vol. 11, 2016
4707
Table 2. Density values obtained after consolidation.
Sample
Theoretical
density
(g/cm3)
Experimental
density
(g/cm3)
DT
(%) Sample
Theoretical
density
(g/cm3)
Experiment
density
(g/cm3)
DT
(%)
Cu_0 h 8.96 8.87 99 Ni_5h 8.90 7.04 79
Ni_0h 8.90 7.21 81 Cu-50%Ni_5h 8.93 6.87 77
Cu_5h 8.96 8.18 91 Cu-40%Ni_5h 8.94 6.97 78
3.4 Metallography characterisation before and after immersion in HCl
In order to visually compare the effect of immersion in acidic media on the manufactured
materials, they were analysed under a scanning electron microscope before and after immersion in HCl
solution for 2 hours. The results are shown in Figure 4.

Int. J. Electrochem. Sci., Vol. 11, 2016
4708
Figure 4. Metallography before and after immersion for two hours in HCl.
In general, a significant effect is not observed after two hours immersion, this shows that, at
least microscopically, not show a very marked effect.
3.5 Electrochemical behaviour of samples in acidic medium
3.5.1 Open circuit corrosion potential (OCP)
SEM microscopy showed no major differences in materials manufactured after and before
immersion, however, studying the electrochemical behaviour of the samples, differences between the
materials studied were identified. Figure 5 shows the evolution of the corrosion potential during two
hours for the different consolidated samples. At the end of the assay, the copper sample that was milled
for 5 hours reached a corrosion potential of -115.2 mV vs Ag/AgCl and the nickel -149.2 mV vs
Ag/AgCl. The two samples show different behaviour at early measurement times. The OCP of the Cu
falls at the beginning, indicating an active state, and then increases, giving rise to the formation of a
passive film of copper oxide. The morphology of the sample is shown in Fig. 4d. On the other hand,
the Ni shows an increase in potential practically from the beginning of the assay, thus confirming the
formation of a passive film mainly on pore-free areas (Fig. 4h). The two alloys, 60-40 and 50-50 Cu-
Ni, have pores in their microstructure and show very similar morphology (Figs. 4j and 4l). They also
reach similar OCP values, -68.1 mV vs Ag/AgCl for the 60-40 Cu-Ni and -43.8 mV vs Ag/AgCl for
the 50-50 Cu-Ni.
Comparing the potentials of the Cu and Ni that were not milled, the values obtained are -100.0
mV vs Ag/AgCl and -137.0 mV vs Ag/AgCl, respectively. The values are in agreement with expected
results, given that the milled samples have a greater amount of stored energy as a result of the milling
process, high plastic deformation and a high density of defects and impurities in their microstructure
[21].

Int. J. Electrochem. Sci., Vol. 11, 2016
4709
In general, the consolidation process affects the pure elements more (seen in the lower OCP),
mainly in the case of the nickel, in comparison to the binary alloys, which have higher OCP values.
Figure 5. Variation in corrosion potential as a function of time for Cu, Ni and their alloys in 0.1 M
HCl.
3.5.2 Potentiodynamic polarization measurements
Figure 6 shows the polarisation curves of the samples, while the values of corrosion potential
(Ecorr), corrosion current (Jcorr), cathodic Tafel slope (βc), anodic Tafel slope (βa) and polarisation
resistance (Rp) obtained from these polarisation curves shown are listed in Table 3.
The results in Table 3 corroborate the behaviour of the materials shown in point 3.5.1.. The
data supporting the better behaviour of the alloys are the higher Ecorr, lower jcorr and higher Rp [22-23].
It is important to note that the active dissolution zone is small for the copper (anodic current = 6.79 x
10-6
A cm-2
) in comparison to that of the nickel (anodic current = 3.82 x 10⁻⁵
A cm-2
), and that the
cathodic curve for the copper is obtained at lower current that the cathodic curve of the nickel (see
Figure 6). Both anodic and cathodic behaviour corroborates that the conditions for obtaining each
material, presents a major copper behaviour. The Ni sample and the alloys show a certain degree of
porosity, which affects their behaviour in terms of corrosion in acidic media. When the porosity
increases, the interconnectivity of pores will certainly increase, the interconnected channels allow the
free flow of the electrolyte and larger surface area is exposed to the hydrochloric acid
The results of the tests confirm that the consolidation process affects the pure elements to a
greater degree (higher jcorr), than the binary alloys (lower jcorr).

Int. J. Electrochem. Sci., Vol. 11, 2016
4710
Figure 6. Potentiodynamic polarisation curves obtained for Cu, Ni and and Cu-Ni in a 0.1 M HCl
solution.
Table 3. Polarisation curve parameters for copper, nickel and their alloys in 0.1 M HCl.
Sample Ecorr
(mV vs Ag/AgCl)
jcorr
(μA/cm2)
βc
(mV/dec)
βa
(mV/dec)
Rp
(Ω cm2)
Cu - 422.2 1.57 x 10⁻⁶
-29.57 36.60 4.51 x 10⁶
Ni -358.9 4.35 x 10⁻⁶
-34.52 30.83 1.63 x 10⁶
60-40 Cu-Ni -291.1 7.67 x 10⁻⁷
-36.44 33.28 9.85 x 10⁶
50-50 Cu-Ni -227.9 5.42 x 10⁻⁷
-30.63 31.48 1.24 x 10⁷
4. CONCLUSIONS
The process of milling and mechanical alloying affects both the morphology of the particles
and their microstructure. After 5 hours of milling, copper shows much more ductile behaviour than
nickel and the Cu-Ni alloys. Nickel generates a large amount of contamination during milling, shown
in the high levels of iron content found in the powder after milling. The process hardens this element
much more than it does copper or the binary alloys in question.
The process of consolidation, cold sintering, and the temperature and pressure values used,
300ºC and 900 MPa, were sufficient to produce high density in the copper powders without milling
and with 5 hours of milling. However, for the nickel and the Cu-Ni alloys, the conditions in question
were not sufficient to attain densities above 80% of theoretical density.

Int. J. Electrochem. Sci., Vol. 11, 2016
4711
The consolidated 60%Cu-40%Ni and 50%Cu-50%Ni alloys showed better behaviour in terms
of corrosion in 0.1M HCl, compared to copper and nickel samples alone under the sample processes
and conditions, obtained through powder metallurgy.
ACKNOWLEDGEMENTS
This project was supported by the FONDECYT program, project number 1130475 and 3140207.
References
1. Rolf Hummel, “Understanding materials science”, Springer, second edition, 2004.
2. M. Ashby, H. Shercliff, D. Cebon, “Materials engineering, science, processing and design”, BH
Elsevier, second edition, 2010.
3. Metals Handbook, Vol 2, Properties and Selection: Nonferrous Alloys and Special-Purpose
Materials. Edition Metals Handbook.Second printing (1992), ASM Handbook.
4. C. Brooks, “Heat Treatment, Structure and Properties of Nonferrous Alloys”, ASM International,
(1982).
5. Carl Koch, “Nanostructured materials”, William Andrew, second edition, 2007.
6. C. Suryanarayana, “Mechanical Alloying and Milling”, Marcel Dekker, Inc., New York, NY, 2004.
7. P.R. Soni, “Mechanical alloying”, Cambridge International Science Publishing, 2001.
8. Metals Handbook, Vol 13, Corrosion.Edition Metals Handbook.Secondprinting (1992), ASM
Handbook.
9. M. Zidoune, M.H. Grosjean, L. Roue,J. Huot, R.Schulz, Corros. Sci., 46 (2004) 3041.
10. M. H. Grosjean, M.Zidoune, L. Roué,J.Huot, R. Schulz, Electrochim. Acta 49 (2004) 2461.
11. K. R. Kim, J. W.Ahn, G. H. Kim, J. H. Han, K. K. Cho,et al., Met.Mater. Int. 20:6 (2014) 1095.
12. O.Elkedim, H.S. Cao and P. Fluzin, Mater. Sci. Forum 312-314 (1999)635.
13. O. Elkedim, H.S. Cao, D. Guay, J. Mater. Process. Technol. 121 (2002) 383.
14. E. M. Sherif, H. R. Ammar, K. A. Khalil, Int. J. Electrochem. Sci. 10 (2015) 775.
15. O. El Kedim, M. Tachikart and E. Gaffet, Mater. Sci. Forum 225-227 (1996) 825.
16. X. Zhao, Y. Ding, L. Ma, X. Shen, S. Xu, Int. J. Hydrogen Energ.33 (2008) 6351.
17. A.Barbucci, G.Farne, P. Matteazzi. R.Riccieri, G.Cerisola, Corros. Sci., 41 (1999) 463.
18. L. Durivault, O.Brylev, D.Reyter, M. Sarrazin, D. Bélanger, L. Roué, J. Alloy Compd.432 (2007)
19. G.Goupil, S.Helle, B.Davis, D.Guay, L. Roué, Electrochim. Acta 112 (2013) 176
20. Metals Handbook, Volume 7, Powder Metal Technologies and Applications was published in.
Edition Metals Handbook. Second printing (1998), ASM Handbook.
21. W. Badawy, K. Ismail, A. Fathi, J. Alloy Compd., 484 (2009) 365.
22. K. Ismail, A. Fathi, W. Badawy, Corros. Sci., 48 (2006) 1912.
23. S. Elle, M. Pedron, B. Assouli, B. Davis, D. Guay. L. Roué, Corros. Sci., 52 (2010) 3348.
© 2016 The Authors. Published by ESG (www.electrochemsci.org). This article is an open access
article distributed under the terms and conditions of the Creative Commons Attribution license
(http://creativecommons.org/licenses/by/4.0/).
Related Documents