Available online at www.sciencedirect.com Journal of Hazardous Materials 157 (2008) 319–327 Effect of temperature and initial dibutyl sulfide concentration in chloroform on its oxidation rate by ozone Stanislaw Popiel a,∗ , Tomasz Nalepa b , Dorota Dzier˙ zak a , Romuald Stankiewicz c , Zygfryd Witkiewicz a,d a Military University of Technology, Institute of Chemistry, 2 Kaliski Street, 00-908 Warsaw, Poland b Defence Department of Ministry of Economy, 3/5 Plac Trzech Krzy˙ zy, 00-507 Warsaw, Poland c University of Warsaw, Department of Chemistry, 1 Pasteur Street, 02-093 Warsaw, Poland d The “Jan Kochanowski” ´ Swi˛ etokrzyska Academy, Institute of Chemistry, 5, Ch˛ eci´ nska-Street, 25-020 Kielce, Poland Received 12 November 2007; received in revised form 21 December 2007; accepted 28 December 2007 Available online 12 January 2008 Abstract A scheme of dibutyl sulfide (DBS) oxidation with ozone and generation of transitional products was determined in this study. The main identified intermediate product was dibutyl sulfoxide (DBSO), and the main end product of DBS oxidation was dibutyl sulfone (DBSO2). It was determined that for three temperatures: 0, 10 and 20 ◦ C there was certain initial DBS concentration for which half-times observed in experimental conditions were equal and independent from temperature. Generation of phosgene and water as by-products was confirmed for the reaction of DBS with ozone in chloroform. Results of the described study allowed to present generalized mechanism of sulfide oxidation with ozone. © 2008 Elsevier B.V. All rights reserved. Keywords: Dibutyl sulfide; Oxidation; Chloroform; Ozone; Organic sulfur compounds; GC-AED; Reaction kinetics 1. Introduction Composition of liquid industrial waste depends on a kind of production and contain, among others, sulfur compounds. The following branches of industry constitute the main source of organic sulfur compounds: petrochemical, paper and tex- tile industry. The compounds are also present in liquid waste generated by food industry and in municipal wastes. Concentra- tions of organic sulfur compounds in liquid industrial waste can be significantly high. Water pollution with those compounds is especially noxious, for bacteria present in natural environ- ment cause their degradation to, among others, hydrogen sulfide, which is a dangerous poison with unpleasant odor. Organic sulfur compounds contained in waste water can be rendered harmless using an oxidation method. Using ozone for removal of organic pollutants from water is a common practice. Numerous studies of processes occur- ring under influence of ozone in aquatic environment have been ∗ Corresponding author. Tel.: +48 22 683 9097; fax: +48 22 683 9582. E-mail address: [email protected] (S. Popiel). performed [1,2]. The main advantage of this method is that it does not involve necessity to remove the introduced oxidizer and products of its decomposition. Using ozone is pure and environment friendly approach to decontamination of sulfides and almost all other degradable organic pollutants. Ozone is the strongest available oxidizer (among oxygen compounds) with redox potential 2.07 V. There are only two other known unstable chemical mediums demonstrating higher potential, i.e. singlet oxygen (2.43 V) and hydroxyl radical (2.81 V). The main dis- advantage of the ozone is that its production is still expensive and destruction of organic substances with ozone in water is not a cheap process. There are at least three other serious factors limiting (slowing down) oxidation with ozone in water. • Currently existing technologies used for ozone production do not allow generation of high concentration of the com- pound (even if pure oxygen is used as a raw material for ozone generation). This is only partially disadvantage. Ozone at high concentration becomes very unstable and dangerous explosive and using it is not safe. • Ozone is a very strong oxidizer, but its solubility in water is very low [3]. 0304-3894/$ – see front matter © 2008 Elsevier B.V. All rights reserved. doi:10.1016/j.jhazmat.2007.12.109

Welcome message from author
This document is posted to help you gain knowledge. Please leave a comment to let me know what you think about it! Share it to your friends and learn new things together.
Transcript
A
itwo©
K
1
oTotgtbimwsh
ir
0d
Available online at www.sciencedirect.com
Journal of Hazardous Materials 157 (2008) 319–327
Effect of temperature and initial dibutyl sulfide concentrationin chloroform on its oxidation rate by ozone
Stanisław Popiel a,∗, Tomasz Nalepa b, Dorota Dzierzak a,Romuald Stankiewicz c, Zygfryd Witkiewicz a,d
a Military University of Technology, Institute of Chemistry, 2 Kaliski Street, 00-908 Warsaw, Polandb Defence Department of Ministry of Economy, 3/5 Plac Trzech Krzyzy, 00-507 Warsaw, Poland
c University of Warsaw, Department of Chemistry, 1 Pasteur Street, 02-093 Warsaw, Polandd The “Jan Kochanowski” Swietokrzyska Academy, Institute of Chemistry, 5, Checinska-Street, 25-020 Kielce, Poland
Received 12 November 2007; received in revised form 21 December 2007; accepted 28 December 2007Available online 12 January 2008
bstract
A scheme of dibutyl sulfide (DBS) oxidation with ozone and generation of transitional products was determined in this study. The main identifiedntermediate product was dibutyl sulfoxide (DBSO), and the main end product of DBS oxidation was dibutyl sulfone (DBSO2). It was determined
hat for three temperatures: 0, 10 and 20 ◦C there was certain initial DBS concentration for which half-times observed in experimental conditionsere equal and independent from temperature. Generation of phosgene and water as by-products was confirmed for the reaction of DBS withzone in chloroform. Results of the described study allowed to present generalized mechanism of sulfide oxidation with ozone.2008 Elsevier B.V. All rights reserved.
poun
pdaeasrcoaaal
•
eywords: Dibutyl sulfide; Oxidation; Chloroform; Ozone; Organic sulfur com
. Introduction
Composition of liquid industrial waste depends on a kindf production and contain, among others, sulfur compounds.he following branches of industry constitute the main sourcef organic sulfur compounds: petrochemical, paper and tex-ile industry. The compounds are also present in liquid wasteenerated by food industry and in municipal wastes. Concentra-ions of organic sulfur compounds in liquid industrial waste cane significantly high. Water pollution with those compoundss especially noxious, for bacteria present in natural environ-ent cause their degradation to, among others, hydrogen sulfide,hich is a dangerous poison with unpleasant odor. Organic
ulfur compounds contained in waste water can be renderedarmless using an oxidation method.
Using ozone for removal of organic pollutants from waters a common practice. Numerous studies of processes occur-ing under influence of ozone in aquatic environment have been
∗ Corresponding author. Tel.: +48 22 683 9097; fax: +48 22 683 9582.E-mail address: [email protected] (S. Popiel).
•
304-3894/$ – see front matter © 2008 Elsevier B.V. All rights reserved.oi:10.1016/j.jhazmat.2007.12.109
ds; GC-AED; Reaction kinetics
erformed [1,2]. The main advantage of this method is that itoes not involve necessity to remove the introduced oxidizernd products of its decomposition. Using ozone is pure andnvironment friendly approach to decontamination of sulfidesnd almost all other degradable organic pollutants. Ozone is thetrongest available oxidizer (among oxygen compounds) withedox potential 2.07 V. There are only two other known unstablehemical mediums demonstrating higher potential, i.e. singletxygen (2.43 V) and hydroxyl radical (2.81 V). The main dis-dvantage of the ozone is that its production is still expensivend destruction of organic substances with ozone in water is notcheap process. There are at least three other serious factors
imiting (slowing down) oxidation with ozone in water.
Currently existing technologies used for ozone productiondo not allow generation of high concentration of the com-pound (even if pure oxygen is used as a raw material forozone generation). This is only partially disadvantage. Ozone
at high concentration becomes very unstable and dangerousexplosive and using it is not safe.Ozone is a very strong oxidizer, but its solubility in water isvery low [3].
3 rdous
•
sipfTdowtfufFvtstrpi[
pmsillreflmicc
fsoc
2
2
cbcHff
tf
2
itu
2
maoig1tD
iDi1gIotgwtd1o
2
s1o1aco
2
at
20 S. Popiel et al. / Journal of Haza
In aqueous phase there are various components, includingsome anions and cations, which react with ozone and causeadditional consumption of the compound.
Laboratory trials of indirect oxidation using a double-phaseystems: water–organic solvent have been undertaken in order toncrease the rate of water pollution oxidation. Numerous organicollutants are hydrophobic. Therefore it is easy to separate themrom water using extraction with appropriate organic solvents.he separated chemicals concentrated in the solvents might beecomposed by ozonation more efficiently than in water. Inrder to increase the rate of removal of organic pollution fromater a procedure of organic pollution extraction from water
o an organic phase with appropriate solvent is more and morerequently used. In the next stage, the obtained solution is sat-rated with ozone in order to oxidize the components extractedrom water. In some works fluorocarbon solvents FC40TM andC77TM (3M Corp.) were successfully used [4,5]. The sol-ents are suitable for water purification because they show lowoxicity, relatively low solubility in water, very low vapour pres-ure, and additionally—ozone dissolves in them very well andhe resulting solutions are stable and dissolved ozone is noteadily decomposed. Also various liquids with a structure ofolydimethylsiloxanes were used in studies of processes tak-ng place during destruction of organic compounds with ozone6–8].
In this study we have decided to investigate processes takinglace during oxidation of dibutyl sulfide (DBS) as a selected,odel sulphide pollution in environment of chloroform. Other
olvents were also taken into account, but preliminary stud-es indicated that among numerous selected organic solventsike: chloral, propionic acid, diethyl malonate, trichloroethy-ene, nitromethane, carbon tetrachloride, methanol, etc. [9], theate of DBS oxidation with ozone in chloroform was the high-st. Literature data [10,11] indicate that ozone solubility both inuorocarbons and in polydimethylsiloxane solvent is approxi-ately 10-times higher than in water, but ozone dissolves better
n chloroform, which is confirmed by the value of Ostwald coeffi-ient: polydimethylsiloxane—2.0, fluorocarbon FC77TM—2.0,hloroform—2.12 [11].
The great significance of the oxidation of sulfides not onlyor the environment protection, but also for the straightforwardynthesis of sulfoxides and sulfones directly from sulfides, bothf which are important as commodity chemicals and, in someases, as pharmaceuticals [12].
. Experimental
.1. Apparatus
Both quantitative analysis and identification of chemicalompounds generated as a result of ozonation of chloroform-ased solutions were performed using the HP 6890 gas
hromatograph from Hewlett Packard. Software ChemstationP 35920A was used for control of the chromatograph andor collection of measurement data. Ozone generator OEM-15rom Ozone Advanced Systems (Sweden) with ozone produc-
tfrg
Materials 157 (2008) 319–327
ion 1.5 g/h, and a glass reactor with 600 ml capacity were usedor sulfide oxidation.
.2. Reagents
Dibutyl sulfide (DBS) (Fluka, Buchs, Switzerland) dissolvedn chloroform (Chempur, Piekary Slaskie, Poland) was used forhe study. DBS and chloroform, were reagent grade and weresed without further purification.
.3. Oxidation of DBS
DBS oxidation was realized in a reactor controlled by a ther-ostat (Fig. 1). In the bottom part of the reactor there wasporous glass plate, through which a mixture of oxygen and
zone was passed. Magnetic stirrer was used for reagent mix-ng. 200 ml of chloroform was poured into the reactor, and aas mixture O2 + O3 was initially passed through the liquid for0 min in order to obtain a saturated solution. Then, still passinghe O2 + O3 mixture through the reactor, a measured portion ofBS was added and measurement of reaction time started.Oxidation of DBS with ozone in chloroform was carried out
n temperatures 0, 10 and 20 ◦C, using various initial quantities ofBS (50, 100, 200 and 400 �L) in 200 mL of chloroform, obtain-
ng DBS concentrations in chloroform equal: 1.4, 2.9, 5.7, and1.5 mmol/L, respectively. Mixture of ozone and oxygen from aenerator was passed through the DBS solution in chloroform.n case of all experiments, oxygen constantly flowed through thezone generator with rate of 400 L/h. A stream of O2 + O3 mix-ure from the generator was divided into two parts: one part of theas was directed into the reactor, and the other was directed toashers with potassium iodine, which were used for O3 concen-
ration control and then to ozone destructor, or directly to ozoneestructor. During the experiments O2 + O3 mixture, containing.2 mg/L ozone in oxygen, flowed through the reactor at the ratef 200 L/h.
.4. Sampling and preparing samples for analysis
Samples for analysis were collected from the reactor with ayringe after the following periods: 0.25, 0.5, 1, 1.5, 2, 3.5, 5,0, 15, 20, 25, 30, 35, 40, 50 and 60 min. Collected samplesf 100 �L each were placed in closed tubes. From there only�L samples were collected with a Hamilton micro-syringend dosed into the gas chromatograph. Oxidation in the sameonditions was repeated three times, obtaining 3 results for eachf the individual times. Those results were averaged.
.5. Chromatographic analysis
Work parameters of the gas chromatograph coupled withtomic emission spectrometer were the following: tempera-ure of a plasma cavity and transmission line 270 ◦C; injector
emperature: 270 ◦C, split ratio: 10:1; time of solvent removalrom the detector between 1 and 3.6 min; helium flowing atate of 1 mL/min was a carrier gas. The following reactionases were used: hydrogen, oxygen and methane–nitrogen mix-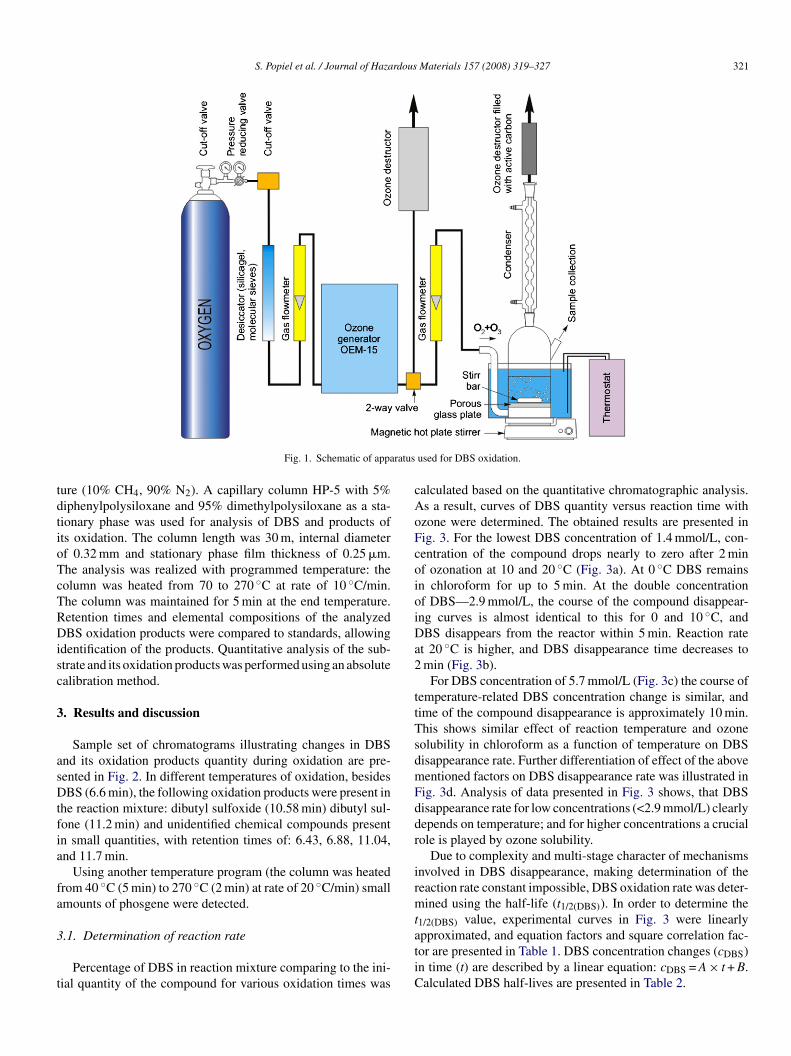
S. Popiel et al. / Journal of Hazardous Materials 157 (2008) 319–327 321
ratus
tdtioTcTRDisc
3
asDtfia
fa
3
t
cAoFcoioiDa2
ttTsdmFddr
irmt
Fig. 1. Schematic of appa
ure (10% CH4, 90% N2). A capillary column HP-5 with 5%iphenylpolysiloxane and 95% dimethylpolysiloxane as a sta-ionary phase was used for analysis of DBS and products ofts oxidation. The column length was 30 m, internal diameterf 0.32 mm and stationary phase film thickness of 0.25 �m.he analysis was realized with programmed temperature: theolumn was heated from 70 to 270 ◦C at rate of 10 ◦C/min.he column was maintained for 5 min at the end temperature.etention times and elemental compositions of the analyzedBS oxidation products were compared to standards, allowing
dentification of the products. Quantitative analysis of the sub-trate and its oxidation products was performed using an absolutealibration method.
. Results and discussion
Sample set of chromatograms illustrating changes in DBSnd its oxidation products quantity during oxidation are pre-ented in Fig. 2. In different temperatures of oxidation, besidesBS (6.6 min), the following oxidation products were present in
he reaction mixture: dibutyl sulfoxide (10.58 min) dibutyl sul-one (11.2 min) and unidentified chemical compounds presentn small quantities, with retention times of: 6.43, 6.88, 11.04,nd 11.7 min.
Using another temperature program (the column was heatedrom 40 ◦C (5 min) to 270 ◦C (2 min) at rate of 20 ◦C/min) smallmounts of phosgene were detected.
.1. Determination of reaction rate
Percentage of DBS in reaction mixture comparing to the ini-ial quantity of the compound for various oxidation times was
atiC
used for DBS oxidation.
alculated based on the quantitative chromatographic analysis.s a result, curves of DBS quantity versus reaction time withzone were determined. The obtained results are presented inig. 3. For the lowest DBS concentration of 1.4 mmol/L, con-entration of the compound drops nearly to zero after 2 minf ozonation at 10 and 20 ◦C (Fig. 3a). At 0 ◦C DBS remainsn chloroform for up to 5 min. At the double concentrationf DBS—2.9 mmol/L, the course of the compound disappear-ng curves is almost identical to this for 0 and 10 ◦C, andBS disappears from the reactor within 5 min. Reaction rate
t 20 ◦C is higher, and DBS disappearance time decreases tomin (Fig. 3b).
For DBS concentration of 5.7 mmol/L (Fig. 3c) the course ofemperature-related DBS concentration change is similar, andime of the compound disappearance is approximately 10 min.his shows similar effect of reaction temperature and ozoneolubility in chloroform as a function of temperature on DBSisappearance rate. Further differentiation of effect of the aboveentioned factors on DBS disappearance rate was illustrated inig. 3d. Analysis of data presented in Fig. 3 shows, that DBSisappearance rate for low concentrations (<2.9 mmol/L) clearlyepends on temperature; and for higher concentrations a crucialole is played by ozone solubility.
Due to complexity and multi-stage character of mechanismsnvolved in DBS disappearance, making determination of theeaction rate constant impossible, DBS oxidation rate was deter-ined using the half-life (t1/2(DBS)). In order to determine the
1/2(DBS) value, experimental curves in Fig. 3 were linearly
pproximated, and equation factors and square correlation fac-or are presented in Table 1. DBS concentration changes (cDBS)n time (t) are described by a linear equation: cDBS = A × t + B.alculated DBS half-lives are presented in Table 2.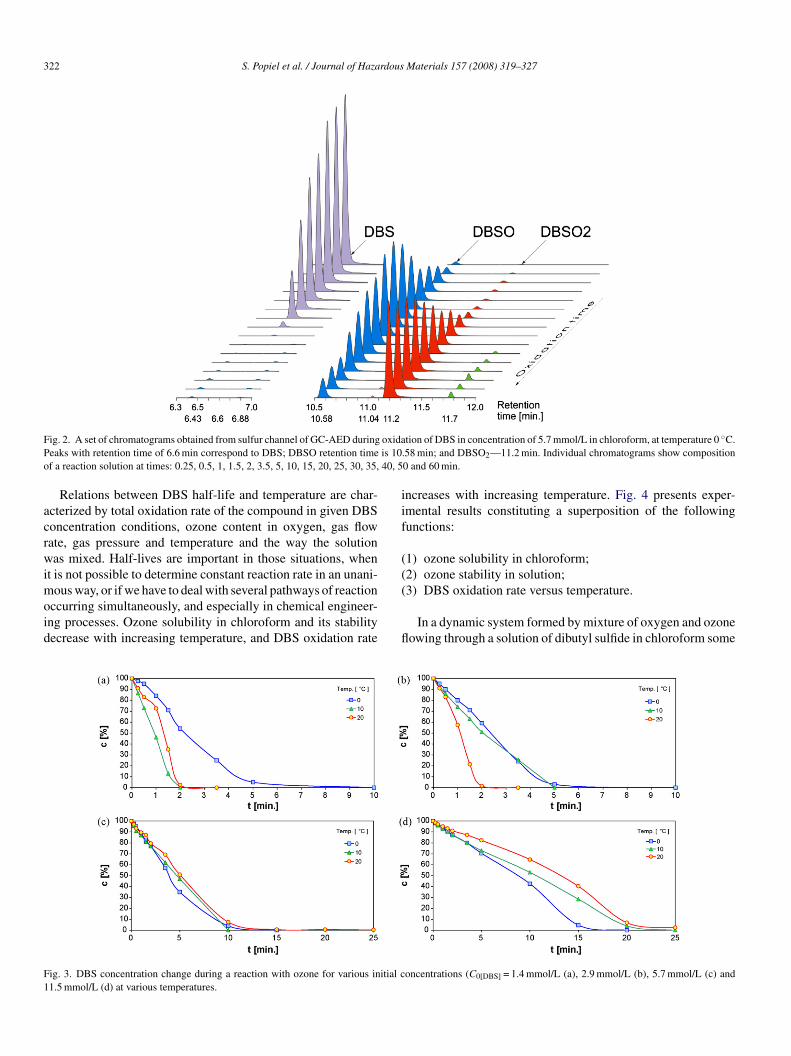
322 S. Popiel et al. / Journal of Hazardous Materials 157 (2008) 319–327
F oxidaP is 10o 40, 5
acrwimoid
iif
((
F1
ig. 2. A set of chromatograms obtained from sulfur channel of GC-AED duringeaks with retention time of 6.6 min correspond to DBS; DBSO retention timef a reaction solution at times: 0.25, 0.5, 1, 1.5, 2, 3.5, 5, 10, 15, 20, 25, 30, 35,
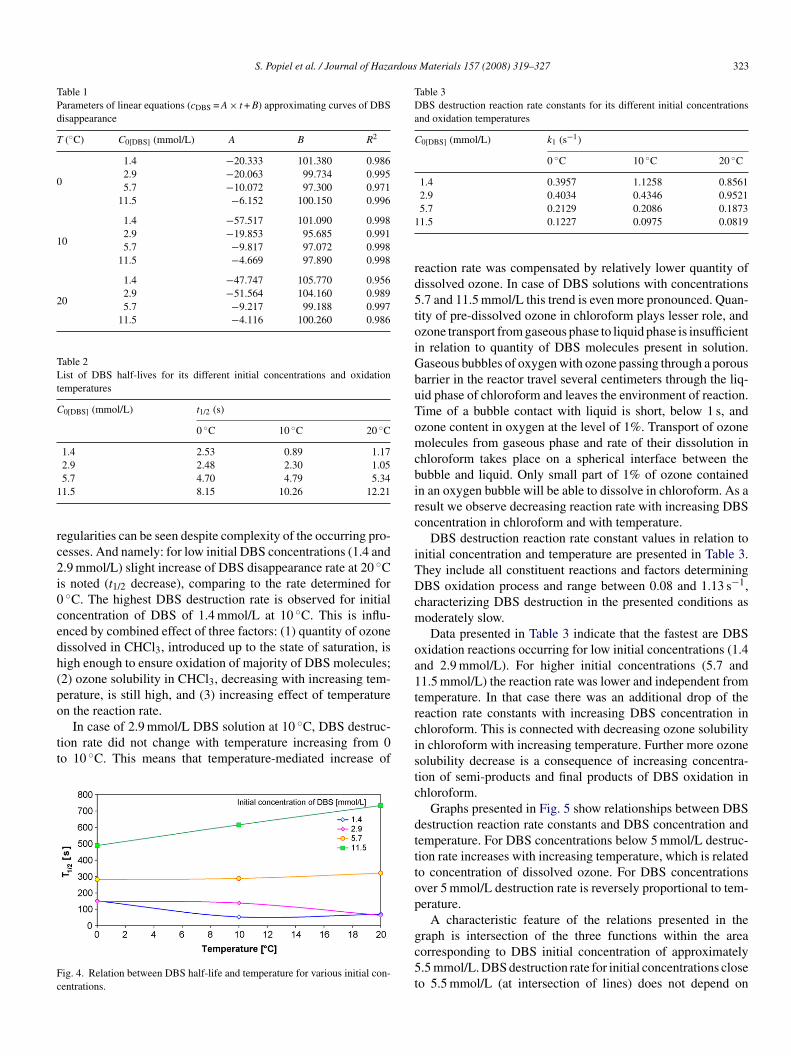
Relations between DBS half-life and temperature are char-cterized by total oxidation rate of the compound in given DBSoncentration conditions, ozone content in oxygen, gas flowate, gas pressure and temperature and the way the solutionas mixed. Half-lives are important in those situations, when
t is not possible to determine constant reaction rate in an unani-
ous way, or if we have to deal with several pathways of reactionccurring simultaneously, and especially in chemical engineer-ng processes. Ozone solubility in chloroform and its stabilityecrease with increasing temperature, and DBS oxidation rate
(
fl
ig. 3. DBS concentration change during a reaction with ozone for various initial c1.5 mmol/L (d) at various temperatures.
tion of DBS in concentration of 5.7 mmol/L in chloroform, at temperature 0 ◦C..58 min; and DBSO2—11.2 min. Individual chromatograms show composition0 and 60 min.
ncreases with increasing temperature. Fig. 4 presents exper-mental results constituting a superposition of the followingunctions:
1) ozone solubility in chloroform;2) ozone stability in solution;
3) DBS oxidation rate versus temperature.In a dynamic system formed by mixture of oxygen and ozoneowing through a solution of dibutyl sulfide in chloroform some
oncentrations (C0[DBS] = 1.4 mmol/L (a), 2.9 mmol/L (b), 5.7 mmol/L (c) and
S. Popiel et al. / Journal of Hazardous Materials 157 (2008) 319–327 323
Table 1Parameters of linear equations (cDBS = A × t + B) approximating curves of DBSdisappearance
T (◦C) C0[DBS] (mmol/L) A B R2
0
1.4 −20.333 101.380 0.9862.9 −20.063 99.734 0.9955.7 −10.072 97.300 0.971
11.5 −6.152 100.150 0.996
10
1.4 −57.517 101.090 0.9982.9 −19.853 95.685 0.9915.7 −9.817 97.072 0.998
11.5 −4.669 97.890 0.998
20
1.4 −47.747 105.770 0.9562.9 −51.564 104.160 0.9895.7 −9.217 99.188 0.997
11.5 −4.116 100.260 0.986
Table 2List of DBS half-lives for its different initial concentrations and oxidationtemperatures
C0[DBS] (mmol/L) t1/2 (s)
0 ◦C 10 ◦C 20 ◦C
1.4 2.53 0.89 1.172.9 2.48 2.30 1.05
1
rc2i0cedh(po
tt
Fc
Table 3DBS destruction reaction rate constants for its different initial concentrationsand oxidation temperatures
C0[DBS] (mmol/L) k1 (s−1)
0 ◦C 10 ◦C 20 ◦C
1.4 0.3957 1.1258 0.85612.9 0.4034 0.4346 0.9521
1
rd5toiGbuTomcbirc
iTDcm
oa1t
5.7 4.70 4.79 5.341.5 8.15 10.26 12.21
egularities can be seen despite complexity of the occurring pro-esses. And namely: for low initial DBS concentrations (1.4 and.9 mmol/L) slight increase of DBS disappearance rate at 20 ◦Cs noted (t1/2 decrease), comparing to the rate determined for◦C. The highest DBS destruction rate is observed for initialoncentration of DBS of 1.4 mmol/L at 10 ◦C. This is influ-nced by combined effect of three factors: (1) quantity of ozoneissolved in CHCl3, introduced up to the state of saturation, isigh enough to ensure oxidation of majority of DBS molecules;2) ozone solubility in CHCl3, decreasing with increasing tem-erature, is still high, and (3) increasing effect of temperature
n the reaction rate.In case of 2.9 mmol/L DBS solution at 10 ◦C, DBS destruc-ion rate did not change with temperature increasing from 0o 10 ◦C. This means that temperature-mediated increase of
ig. 4. Relation between DBS half-life and temperature for various initial con-entrations.
rcistc
dtttop
gc5t
5.7 0.2129 0.2086 0.18731.5 0.1227 0.0975 0.0819
eaction rate was compensated by relatively lower quantity ofissolved ozone. In case of DBS solutions with concentrations.7 and 11.5 mmol/L this trend is even more pronounced. Quan-ity of pre-dissolved ozone in chloroform plays lesser role, andzone transport from gaseous phase to liquid phase is insufficientn relation to quantity of DBS molecules present in solution.aseous bubbles of oxygen with ozone passing through a porousarrier in the reactor travel several centimeters through the liq-id phase of chloroform and leaves the environment of reaction.ime of a bubble contact with liquid is short, below 1 s, andzone content in oxygen at the level of 1%. Transport of ozoneolecules from gaseous phase and rate of their dissolution in
hloroform takes place on a spherical interface between theubble and liquid. Only small part of 1% of ozone containedn an oxygen bubble will be able to dissolve in chloroform. As aesult we observe decreasing reaction rate with increasing DBSoncentration in chloroform and with temperature.
DBS destruction reaction rate constant values in relation tonitial concentration and temperature are presented in Table 3.hey include all constituent reactions and factors determiningBS oxidation process and range between 0.08 and 1.13 s−1,
haracterizing DBS destruction in the presented conditions asoderately slow.Data presented in Table 3 indicate that the fastest are DBS
xidation reactions occurring for low initial concentrations (1.4nd 2.9 mmol/L). For higher initial concentrations (5.7 and1.5 mmol/L) the reaction rate was lower and independent fromemperature. In that case there was an additional drop of theeaction rate constants with increasing DBS concentration inhloroform. This is connected with decreasing ozone solubilityn chloroform with increasing temperature. Further more ozoneolubility decrease is a consequence of increasing concentra-ion of semi-products and final products of DBS oxidation inhloroform.
Graphs presented in Fig. 5 show relationships between DBSestruction reaction rate constants and DBS concentration andemperature. For DBS concentrations below 5 mmol/L destruc-ion rate increases with increasing temperature, which is relatedo concentration of dissolved ozone. For DBS concentrationsver 5 mmol/L destruction rate is reversely proportional to tem-erature.
A characteristic feature of the relations presented in the
raph is intersection of the three functions within the areaorresponding to DBS initial concentration of approximately.5 mmol/L. DBS destruction rate for initial concentrations closeo 5.5 mmol/L (at intersection of lines) does not depend on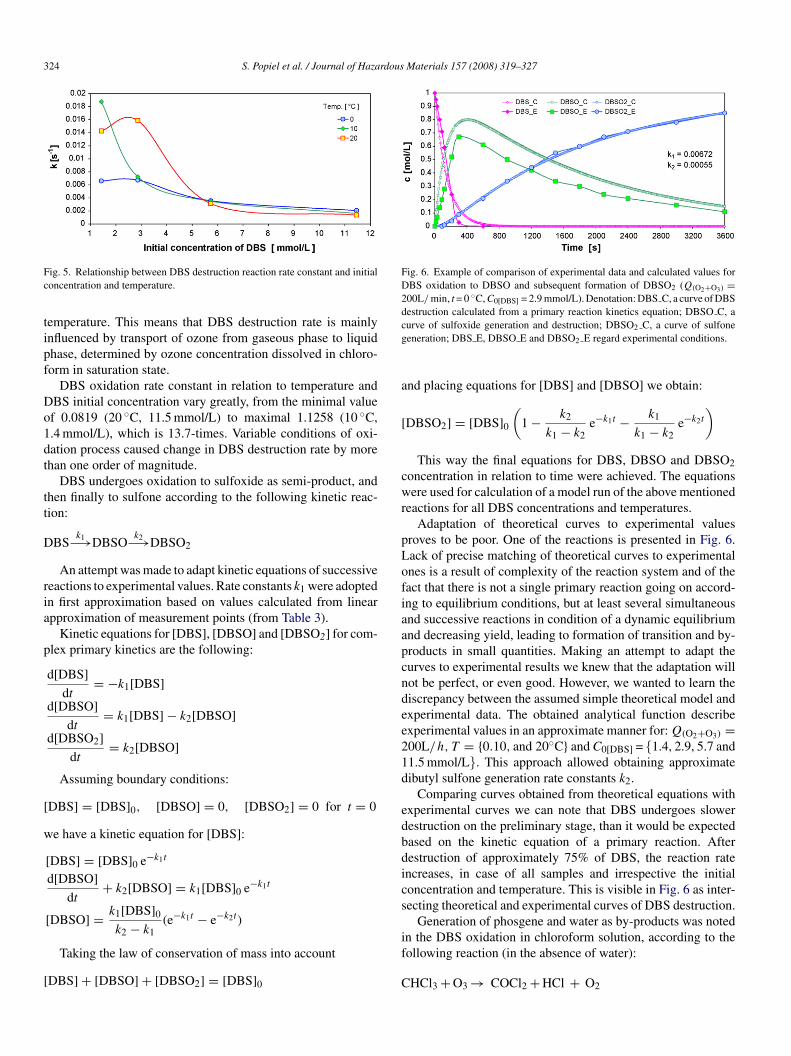
324 S. Popiel et al. / Journal of Hazardous Materials 157 (2008) 319–327
Fc
tipf
Do1dt
tt
D
ria
p
[
w
[
Fig. 6. Example of comparison of experimental data and calculated values forDBS oxidation to DBSO and subsequent formation of DBSO2 (Q(O2+O3) =200L/ min, t = 0 ◦C, C0[DBS] = 2.9 mmol/L). Denotation: DBS C, a curve of DBSdestruction calculated from a primary reaction kinetics equation; DBSO C, acg
a
[
cwr
pLofiaapcndee21d
edbdicsecting theoretical and experimental curves of DBS destruction.
Generation of phosgene and water as by-products was noted
ig. 5. Relationship between DBS destruction reaction rate constant and initialoncentration and temperature.
emperature. This means that DBS destruction rate is mainlynfluenced by transport of ozone from gaseous phase to liquidhase, determined by ozone concentration dissolved in chloro-orm in saturation state.
DBS oxidation rate constant in relation to temperature andBS initial concentration vary greatly, from the minimal valuef 0.0819 (20 ◦C, 11.5 mmol/L) to maximal 1.1258 (10 ◦C,.4 mmol/L), which is 13.7-times. Variable conditions of oxi-ation process caused change in DBS destruction rate by morehan one order of magnitude.
DBS undergoes oxidation to sulfoxide as semi-product, andhen finally to sulfone according to the following kinetic reac-ion:
BSk1−→DBSO
k2−→DBSO2
An attempt was made to adapt kinetic equations of successiveeactions to experimental values. Rate constants k1 were adoptedn first approximation based on values calculated from linearpproximation of measurement points (from Table 3).
Kinetic equations for [DBS], [DBSO] and [DBSO2] for com-lex primary kinetics are the following:
d[DBS]
dt= −k1[DBS]
d[DBSO]
dt= k1[DBS] − k2[DBSO]
d[DBSO2]
dt= k2[DBSO]
Assuming boundary conditions:
DBS] = [DBS]0, [DBSO] = 0, [DBSO2] = 0 for t = 0
e have a kinetic equation for [DBS]:
[DBS] = [DBS]0 e−k1t
d[DBSO]
dt+ k2[DBSO] = k1[DBS]0 e−k1t
[DBSO] = k1[DBS]0
k − k(e−k1t − e−k2t)
2 1
Taking the law of conservation of mass into account
DBS] + [DBSO] + [DBSO2] = [DBS]0
if
C
urve of sulfoxide generation and destruction; DBSO2 C, a curve of sulfoneeneration; DBS E, DBSO E and DBSO2 E regard experimental conditions.
nd placing equations for [DBS] and [DBSO] we obtain:
DBSO2] = [DBS]0
(1 − k2
k1 − k2e−k1t − k1
k1 − k2e−k2t
)
This way the final equations for DBS, DBSO and DBSO2oncentration in relation to time were achieved. The equationsere used for calculation of a model run of the above mentioned
eactions for all DBS concentrations and temperatures.Adaptation of theoretical curves to experimental values
roves to be poor. One of the reactions is presented in Fig. 6.ack of precise matching of theoretical curves to experimentalnes is a result of complexity of the reaction system and of theact that there is not a single primary reaction going on accord-ng to equilibrium conditions, but at least several simultaneousnd successive reactions in condition of a dynamic equilibriumnd decreasing yield, leading to formation of transition and by-roducts in small quantities. Making an attempt to adapt theurves to experimental results we knew that the adaptation willot be perfect, or even good. However, we wanted to learn theiscrepancy between the assumed simple theoretical model andxperimental data. The obtained analytical function describexperimental values in an approximate manner for: Q(O2+O3) =00L/h, T = {0.10, and 20◦C} and C0[DBS] = {1.4, 2.9, 5.7 and1.5 mmol/L}. This approach allowed obtaining approximateibutyl sulfone generation rate constants k2.
Comparing curves obtained from theoretical equations withxperimental curves we can note that DBS undergoes slowerestruction on the preliminary stage, than it would be expectedased on the kinetic equation of a primary reaction. Afterestruction of approximately 75% of DBS, the reaction ratencreases, in case of all samples and irrespective the initialoncentration and temperature. This is visible in Fig. 6 as inter-
n the DBS oxidation in chloroform solution, according to theollowing reaction (in the absence of water):
HCl3 + O3 → COCl2 + HCl + O2
rdous
on(
H
O
rb
H
C
H
H
cd
4
C
au
C
a[
caa
O
rdmfoo
ccaiavPd
stofcc
celuwtrec
3
waflctnoa(lbws
TR
C
1
S. Popiel et al. / Journal of Haza
The destruction of CHCl3 in absence of water and wide rangef temperatures [13] leads to transitive CCl4 formation. In theext step carbon tetrachloride is oxidized by atomic oxygenfrom decomposition of ozone) producing phosgen.
+ + CCl4 → CCl3+ + HCl
+ CCl3+ → O CCl2 + Cl−
As an effect of increasing amount of water in solution theole of a new mechanism of oxidation and phosgene synthesisecomes dominating:
3O+ + CCl4 → CCl3+ + HCl + H2O
Cl3+ + 2H2O → HOCCl3 + H3O+
OCCl3 + H3O+ → HCl + HOCCl2+ + H2O
OCCl2+ → O CCl2 + H2O
Hydrochloride being by-product of oxidation of carbon tetra-hloride in the next stage creates water, chloride and carbonioxide.
HCl + O2 → 2Cl2 + 2H2O
Cl4 + 2H2O → 2CO2 + 4HCl
Phosgene is a very toxic gas very well soluble in chloroformnd that is why it could be easily detected. Phosgene easilyndergoes reaction of hydrolysis:
OCl2 + H2O → 2HCl + 2CO2,
nd because of that reason it does not threaten the environment14,15].
Sulfine and sulfone acids and water formed during ozonationan catalyze DBS destruction. Water molecules, reacting withtomic oxygen formed as a result of ozone decomposition, createhighly reactive hydroxyl radical [16]:
+ H2O → 2OH• k = 1.1 × 10⁷ s−1.
The other reason for increased DBS destruction reactionate could be presence of protons, formed as a result of acidissociation, having a crucial influence on formation of water
olecules, with a very fast, transient stage of hydroxyl radicalsormation, with much higher oxidation capacity comparing tozone. Increase of real DBS oxidation rate in relation to thexidation rate calculated for kinetics of a primary reaction is
ocwo
able 4eaction rate constants k1 and k2 in relation to DBS initial concentration and tempera
0[DBS] (mmol/L) 0 ◦C 10 ◦C
k1 (s−1) k2 (s−1) k1/k2 k1 (s−1)
1.4 0.0066 0.00082 8.05 0.018762.9 0.00672 0.00055 12.22 0.007245.7 0.00355 0.00045 7.89 0.003481.5 0.00204 0.0003 6.80 0.00162
Materials 157 (2008) 319–327 325
onnected with presence of free protons originating from disso-iated molecules of acids, which causes separation of an oxygentom from a molecule of ozone and generation of a hydroxyl rad-cal OH•, which considerably speeds up oxidation reactions atll stages. An experiment of DBS ozonation in chloroform sol-ent with a slight addition of sulfuric acid confirmed this thesis.resence of dissociated protons really increases the rate of DBSestruction reaction.
In all graphs of calculated data fitted to experimental ones,hift of the experimental curve down for sulfoxide forma-ion DBSO M in relation to the calculated curve DBSO C isbserved. Consent between experimental and calculated curvesor sulfone DBSO2 formation is much better. As a result of fit ofalculated to measured data, values of constants k1 and k2 werealculated with some approximation. They are listed in Table 4.
The set of data presented above indicates that based on theonditions, k2 values are 4.5- to 17-times lower than k1. Differ-nces between calculated and experimental results obtained forow DBS concentrations indicate clearly presence of other prod-cts from side reaction pathways. Only in the case of a solutionith the highest DBS concentration and the temperature 0 ◦C,
he amount of by-products is minimal and approximation of realesults with kinetic equations for creation of an intermediate andnd product in the model of subsequent reactions shows the bestorrelation.
.2. Mechanisms of sulfide oxidation with ozone
Ozone molecules attack sulfur atoms in sulfide moleculeith their positive poles, and oxidation of the molecule starts
ccording to an electrophilic mechanism. This is due to theact that the positive charge of an ozone molecule is clearlyocalized at one place within the molecule, and the negativeharge is partially delocalized, and therefore much weaker. Onhe other hand, sulfur atoms in sulfide molecules have partialegative charge, which is due to stronger electronegativityf the sulfur atom comparing to electronegativity of carbontoms. This negative charge at the sulfur atom is twice biggerits absolute value) than uniformly distributed positive chargesocalized at carbon atoms located in direct neighborhood, onoth sides of the sulfur atom. As a result of sulfide oxidationith ozone according to the electrophilic mechanism a corre-
ponding sulfoxide is formed according to the Eq. (1). Further
xidation of sulfoxide with ozone is difficult, for negativeharge at ozone molecules is clearly delocalized (and thereforeeaker than the analogous positive charge accumulated atzone molecule), and a positive charge localized at the sulfurture
20 ◦C
k2 (s−1) k1/k2 k1 (s−1) k2 (s−1) k1/k2
0.0011 17.05 0.01427 0.002 7.140.0008 9.05 0.01587 0.002 7.940.00049 7.10 0.00312 0.00069 4.520.00027 6.00 0.00136 0.0003 4.53
326 S. Popiel et al. / Journal of Hazardous
aamm
mtac2tatir
d
4
asfotvtwtrdfco
krArpwrpo
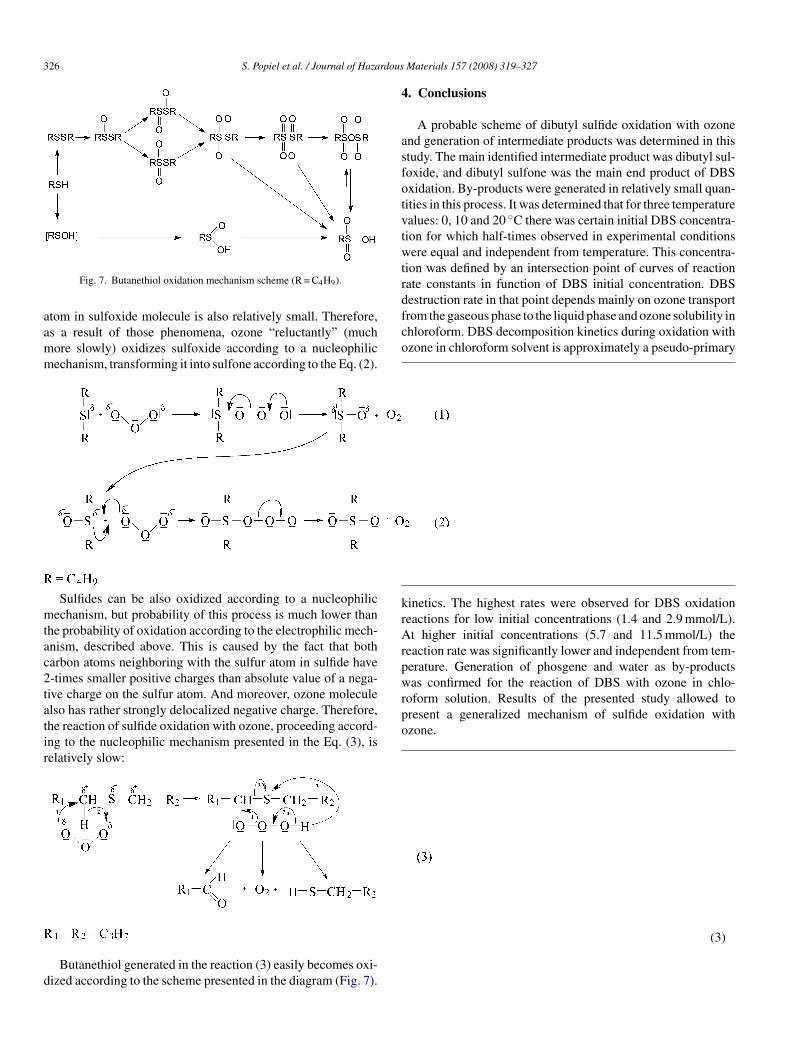
Fig. 7. Butanethiol oxidation mechanism scheme (R = C4H9).
tom in sulfoxide molecule is also relatively small. Therefore,s a result of those phenomena, ozone “reluctantly” (muchore slowly) oxidizes sulfoxide according to a nucleophilicechanism, transforming it into sulfone according to the Eq. (2).
Sulfides can be also oxidized according to a nucleophilicechanism, but probability of this process is much lower than
he probability of oxidation according to the electrophilic mech-nism, described above. This is caused by the fact that botharbon atoms neighboring with the sulfur atom in sulfide have-times smaller positive charges than absolute value of a nega-ive charge on the sulfur atom. And moreover, ozone moleculelso has rather strongly delocalized negative charge. Therefore,he reaction of sulfide oxidation with ozone, proceeding accord-ng to the nucleophilic mechanism presented in the Eq. (3), iselatively slow:
Butanethiol generated in the reaction (3) easily becomes oxi-ized according to the scheme presented in the diagram (Fig. 7).
Materials 157 (2008) 319–327
. Conclusions
A probable scheme of dibutyl sulfide oxidation with ozonend generation of intermediate products was determined in thistudy. The main identified intermediate product was dibutyl sul-oxide, and dibutyl sulfone was the main end product of DBSxidation. By-products were generated in relatively small quan-ities in this process. It was determined that for three temperaturealues: 0, 10 and 20 ◦C there was certain initial DBS concentra-ion for which half-times observed in experimental conditionsere equal and independent from temperature. This concentra-
ion was defined by an intersection point of curves of reactionate constants in function of DBS initial concentration. DBSestruction rate in that point depends mainly on ozone transportrom the gaseous phase to the liquid phase and ozone solubility inhloroform. DBS decomposition kinetics during oxidation withzone in chloroform solvent is approximately a pseudo-primary
inetics. The highest rates were observed for DBS oxidationeactions for low initial concentrations (1.4 and 2.9 mmol/L).t higher initial concentrations (5.7 and 11.5 mmol/L) the
eaction rate was significantly lower and independent from tem-erature. Generation of phosgene and water as by-productsas confirmed for the reaction of DBS with ozone in chlo-
oform solution. Results of the presented study allowed toresent a generalized mechanism of sulfide oxidation withzone.
(3)
rdous
A
H2
R
[
[
[
[
[
[
[16] C.C.D. Yao, W.R. Haag, T. Mill, Kinetic features of advanced oxida-
S. Popiel et al. / Journal of Haza
cknowledgement
This work was supported by the Ministry of Sciences andigh Education, Grant No. 3 T09D 024 29 for the period of005–2008.
eferences
[1] S. Parsons (Ed.), Advanced Oxidation Processes for Water and WastewaterTreatment, Iwa Publishing, London, 2004.
[2] P.R. Gogate, A.B. Pandit, A review of imperative technologies for wastew-ater treatment I: oxidation technologies at ambient conditions, Adv. Env.Res. 8 (2004) 501.
[3] B. Langlais, D.A. Recklow, D.R. Brink, Ozone in Water Treatment: Appli-cation and Engineering, American Water Works Association ResearchFoundation, Lewis Publishers, USA, 1991.
[4] A.R. Freshour, S. Mawhinney, D. Battacharyya, Two-phase ozonation ofhazardous organics: in single and multicomponent systems, Water Res. 30(1996) 1949–1958.
[5] K. Gromadzka, J. Nawrocki, Degradation of diclofenac and clofibric acidusing ozone-loaded perfluorinated solvent, Ozone Sci. Eng. 28 (2006)85–94.
[6] D.B. Ward, C. Tizaoui, M.J. Slater, Ozone-loaded solvents for use in watertreatment, Ozone Sci. Eng. 25 (2003) 485–495.
[7] D.B. Ward, C. Tizaoui, M.J. Slater, Extraction and destruction of organ-ics in wastewater using ozone-loaded solvent, Ozone Sci. Eng. 26 (2004)475–486.
Materials 157 (2008) 319–327 327
[8] D.B. Ward, C. Tizaoui, M.J. Slater, Wastewater dye destruction usingozone-loaded VolasilTM 245 in a continuous liquid–liquid/ozone system,Chem. Eng. Proc. 25 (2006) 124–139.
[9] Unpublished experimental data.10] A.K. Bin, Ozone solubility in liquids, Ozone Sci. Eng. 28 (2006) 67–
75.11] R. Battino (Ed.), Oxygen and ozone, IUPAC Solubility Data Series,
Pergamon Press, Oxford/New York/Toronto/Sydney/Paris/Frankfurt,1981.
12] K. Sato, M. Hyodo, M. Aoki, X.-Q. Zheng, R. Noyori, Oxidation ofsulfides to sulfoxides and sulfones with 30% hydrogen peroxide underorganic solvent- and halogen-free conditions, Tetrahedron 57 (2001) 2469–2476.
13] G. Sinquin, C. Petit, S. Libs, J.P. Hindermann, A. Kiennemann, Catalyticdestruction of chlorinated C1 volatile organic compounds (CVOCs) reac-tivity, oxidation and hydrolysis mechanisms, Appl. Catal. B: Environ. 27(2000) 105–115.
14] G. Duembgen, E. Voelkl, G. Pforr, Process for destroying phosgene, UnitedStates Patent 4,301,126, 1980.
15] J.R. Kittrell, D.A. Gerrish, M.C. Milazzo, Method, catalyst, and photo-catalyst for the destruction of phosgene, United States Patent 6,596,664,2002.
tion processes for treating aqueous chemical mixtures, in: Proceedingsof the Second International Symposium on Chemical Oxidation: Tech-nologies for the Nineties, vol. 2, Nashville, TN, 1992, pp. 112–139.
Related Documents