Effect of surface roughness and subsurface damage on grazing-incidence x-ray scattering and specular reflectance Gyanendra S. Lodha, Koujun Yamashita, Hideyo Kunieda, Yuzuru Tawara, Jin Yu, Yoshiharu Namba, and Jean M. Bennett Grazing-incidence specular reflectance and near-specular scattering were measured at Al-K a ~1.486-keV, 8.34-Å! radiation on uncoated dielectric substrates whose surface topography had been measured with a scanning probe microscope and a mechanical profiler. Grazing-incidence specular reflectance was also measured on selected substrates at the Cu–K a ~8.047-keV, 1.54-Å! wavelength. Substrates included superpolished and conventionally polished fused silica; SiO 2 wafers; superpolished and precision-ground Zerodur; conventionally polished, float-polished, and precision-ground BK-7 glass; and superpolished and precision-ground silicon carbide. Roughnesses derived from x-ray specular reflectance and scattering measurements were in good agreement with topographic roughness values measured with a scanning probe microscope ~atomic force microscope! and a mechanical profiler that included similar ranges of surface spatial wavelengths. The specular reflectance was also found to be sensitive to the density of polished surface layers and subsurface damage down to the penetration depth of the x rays. Density gradients and subsurface damage were found in the superpolished fused-silica and precision-ground Zerodur samples. These results suggest that one can nondestructively evaluate subsurface damage in transparent materials using grazing-incidence x-ray specular reflectance in the 1.5– 8-keV range. © 1998 Optical Society of America OCIS codes: 240.5770, 290.5880, 340.7470. 1. Introduction There is a need for extremely smooth, low-scatter mirrors for grazing-incidence x-ray applications and normal-incidence soft-x-ray mirrors as well as for longer wavelengths. Substrates used for high- reflectance x-ray mirrors must be exceedingly smooth, because multilayer coatings will replicate the roughness of the spatial wavelengths on the sub- strates as well as add additional short-spatial- wavelength roughness. The best way to test substrates used for x-ray mir- rors is to measure specular reflectance and scattering on samples of mirror substrates, using an x-ray wave- length close to that for which the x-ray mirrors are designed. The drawback is that these measure- ments are cumbersome and difficult to make. It is not possible to use them in a production environment, which requires real-time feedback. In contrast, pro- filing or mapping techniques such as are possible with an atomic force microscope ~AFM! or a mechan- ical profiler have adequate sensitivity to measure surface roughness, are easier to use, and can give nearly real-time results. However, the measured surface roughness must be shown to correlate with the roughness that affects the x-ray reflectance and scattering measurements. This is the purpose of this paper. Although numerous research groups have reported x-ray and surface topography measurements, 1–10 and one group correlated AFM surface roughness measure- ments with total integrated scattering in the visible, 11 only four groups correlated their far-ultraviolet, soft- x-ray, or hard-x-ray reflectance measurements with surface roughness measured by an AFM 5,7–9 or a scan- ning tunneling microscope. 10 Two of these groups 5,9 At the time the work was done, G. S. Lodha was a visiting professor at Nagoya University. He is now back at the Centre for Advanced Technology, Indore 452 013, India. K. Yamashita, H. Kunieda, and Y. Tawara are with the Department of Physics, Nagoya University, Chikusa-Ku, Nagoya 464-01, Japan; J. Yu and Y. Namba are with the Department of Mechanical Engineering, Chubu University, 1200 Matsumotocho, Kasugai, Aichi 487, Ja- pan; and J. M. Bennett is with the Naval Air Warfare Center, China Lake, California 93555. Received 26 March 1998. 0003-6935y98y225239-14$15.00y0 © 1998 Optical Society of America 1 August 1998 y Vol. 37, No. 22 y APPLIED OPTICS 5239

Welcome message from author
This document is posted to help you gain knowledge. Please leave a comment to let me know what you think about it! Share it to your friends and learn new things together.
Transcript
Effect of surface roughness and subsurfacedamage on grazing-incidence x-ray scattering andspecular reflectance
Gyanendra S. Lodha, Koujun Yamashita, Hideyo Kunieda, Yuzuru Tawara, Jin Yu,Yoshiharu Namba, and Jean M. Bennett
Grazing-incidence specular reflectance and near-specular scattering were measured at Al-Ka ~1.486-keV,8.34-Å! radiation on uncoated dielectric substrates whose surface topography had been measured with ascanning probe microscope and a mechanical profiler. Grazing-incidence specular reflectance was alsomeasured on selected substrates at the Cu–Ka ~8.047-keV, 1.54-Å! wavelength. Substrates includedsuperpolished and conventionally polished fused silica; SiO2 wafers; superpolished and precision-groundZerodur; conventionally polished, float-polished, and precision-ground BK-7 glass; and superpolished andprecision-ground silicon carbide. Roughnesses derived from x-ray specular reflectance and scatteringmeasurements were in good agreement with topographic roughness values measured with a scanningprobe microscope ~atomic force microscope! and a mechanical profiler that included similar ranges ofsurface spatial wavelengths. The specular reflectance was also found to be sensitive to the density ofpolished surface layers and subsurface damage down to the penetration depth of the x rays. Densitygradients and subsurface damage were found in the superpolished fused-silica and precision-groundZerodur samples. These results suggest that one can nondestructively evaluate subsurface damage intransparent materials using grazing-incidence x-ray specular reflectance in the 1.5– 8-keV range.© 1998 Optical Society of America
OCIS codes: 240.5770, 290.5880, 340.7470.
isnstst
x
1. Introduction
There is a need for extremely smooth, low-scattermirrors for grazing-incidence x-ray applications andnormal-incidence soft-x-ray mirrors as well as forlonger wavelengths. Substrates used for high-reflectance x-ray mirrors must be exceedinglysmooth, because multilayer coatings will replicatethe roughness of the spatial wavelengths on the sub-strates as well as add additional short-spatial-wavelength roughness.
The best way to test substrates used for x-ray mir-
At the time the work was done, G. S. Lodha was a visitingprofessor at Nagoya University. He is now back at the Centre forAdvanced Technology, Indore 452 013, India. K. Yamashita, H.Kunieda, and Y. Tawara are with the Department of Physics,Nagoya University, Chikusa-Ku, Nagoya 464-01, Japan; J. Yu andY. Namba are with the Department of Mechanical Engineering,Chubu University, 1200 Matsumotocho, Kasugai, Aichi 487, Ja-pan; and J. M. Bennett is with the Naval Air Warfare Center,China Lake, California 93555.
Received 26 March 1998.0003-6935y98y225239-14$15.00y0© 1998 Optical Society of America
rors is to measure specular reflectance and scatteringon samples of mirror substrates, using an x-ray wave-length close to that for which the x-ray mirrors aredesigned. The drawback is that these measure-ments are cumbersome and difficult to make. It isnot possible to use them in a production environment,which requires real-time feedback. In contrast, pro-filing or mapping techniques such as are possiblewith an atomic force microscope ~AFM! or a mechan-cal profiler have adequate sensitivity to measureurface roughness, are easier to use, and can giveearly real-time results. However, the measuredurface roughness must be shown to correlate withhe roughness that affects the x-ray reflectance andcattering measurements. This is the purpose ofhis paper.
Although numerous research groups have reported-ray and surface topography measurements,1–10 and
one group correlated AFM surface roughness measure-ments with total integrated scattering in the visible,11
only four groups correlated their far-ultraviolet, soft-x-ray, or hard-x-ray reflectance measurements withsurface roughness measured by an AFM5,7–9 or a scan-ning tunneling microscope.10 Two of these groups5,9
1 August 1998 y Vol. 37, No. 22 y APPLIED OPTICS 5239
c~
i1notnh
nwnnsie
wa
5
also used optical profilers to measure surface rough-ness but found that these roughnesses did not corre-late with the short-wavelength x-ray reflectance andscattering data because the spatial wavelength rangesof the surface roughness measured by the two tech-niques were quite different.
The experiments closest to those reported in thispaper were made on iridium-film-coated Zerodur sub-strates.9 ~The roughness of the iridium films wasstated to be negligible compared with the substrateroughness.! Surface roughness was measured withan AFM and an optical profiler; the specular reflec-tance of 8-keV ~1.54-Å! x rays was measured at graz-ing angles of 20 and 34 arcmin. The specularreflectance correlated with the AFM roughnesses butnot with those measured with an optical profiler forthe reason stated above. Inasmuch as x-ray reflec-tance was measured at only two discrete grazing an-gles of incidence, no comparisons could be made withtheoretical predictions of specular reflectance versusangle of incidence. Also, it is known that the surfaceroughness, as seen by the x rays, is highly sensitive tothe thickness and density of surface films. Thus thex-ray reflectance data on the iridium-coated sub-strates may not be representative of the reflectance ofuncoated Zerodur substrates.
The theory relating grazing-incidence x-ray re-flectance to material properties was pioneered byParratt,12 who studied the x-ray reflectance of aopper-coated glass mirror at a wavelength of 1.39 ÅCu–Kb1!. His theory assumed N smooth, stratified
homogeneous ~copper and copper oxide! layers, eachwith a different thickness, density, and refractive in-dex and with sharp boundaries between them. LaterNevot and Croce,13 who were studying the grazing-ncidence reflectance of polished glass surfaces at.54 Å ~Cu–Ka!, introduced the effect of surface rough-ess and graded density surface layers into their the-ry. Since then, many theories have been proposedhat contain other parameters including rms rough-ess, lateral correlation length, distribution of surfaceeights, and graded refractive index.14 Most relevant
to the study reported here is the theory of de Boer,15
which uses a distorted-wave Born approximation andcombines theories using the so-called Debye–Wallerfactor with the slightly different Nevot–Croce13 ap-proach. De Boer’s theory includes both the averagesurface roughness and the lateral correlation length ofthe roughness. The calculations in this paper useParatt’s stratified layers of constant density and re-fractive index and the Nevot–Croce theory for surfaceroughness effects.
In this paper we are studying the roughness effectsof bare uncoated substrates on grazing-incidence x-rayreflectance and scattering. We have chosen Al–Ka
1.486-keV ~8.34-Å! radiation for most of the measure-ments because the larger grazing angles of incidencegive more flexibility for probing different spatial wave-length regions of the surface roughness. Both specu-lar and diffuse reflectance near grazing incidence havebeen measured because residual optical fabrication er-rors in the mid-surface spatial frequency region pro-
240 APPLIED OPTICS y Vol. 37, No. 22 y 1 August 1998
duce small-angle scattering and lead to imagedegradation. These fabrication errors can be quan-tized by near-angle x-ray scattering measurements.Additional specular reflectance measurements weremade at the shorter Cu–Ka 8.047-keV ~1.54-Å! wave-length. They are valuable because they give informa-tion about density gradients and subsurface damageproduced by the surface preparation technique. Lit-tle is known about the effect of subsurface damagewithin supersmooth surfaces on the reflectance ofx-ray optics. This information is particularly impor-tant for ductile materials such as fused silica and op-tical glasses, especially when these materials are usedin high-power-density applications.
We report on measurements of specular and diffusex-ray reflectance for samples of fused silica, Zerodur,BK-7 glass, and silicon carbide. The surfaces wereprepared by optical polishing, precision grinding, andfloat polishing. Surface topography was mappedwith a scanning probe microscope ~SPM! ~another
ame for an AFM!, and roughness was measuredith a mechanical profiler. The topographic rough-ess values were found to correlate well with rough-esses determined from x-ray reflectance andcattering measurements. The smoothest superpol-shed surfaces also had the lowest x-ray scatter lev-ls.
2. Experimental Measurements and Samples
A. X-Ray Reflectance and Scattering Measurements
Grazing-incidence specular reflectance and near-angle scattering ~60.55° from the specular beam!
ere measured with a precision x-ray reflectometert Nagoya University with an Al–Ka 8.34-Å ~1.486-
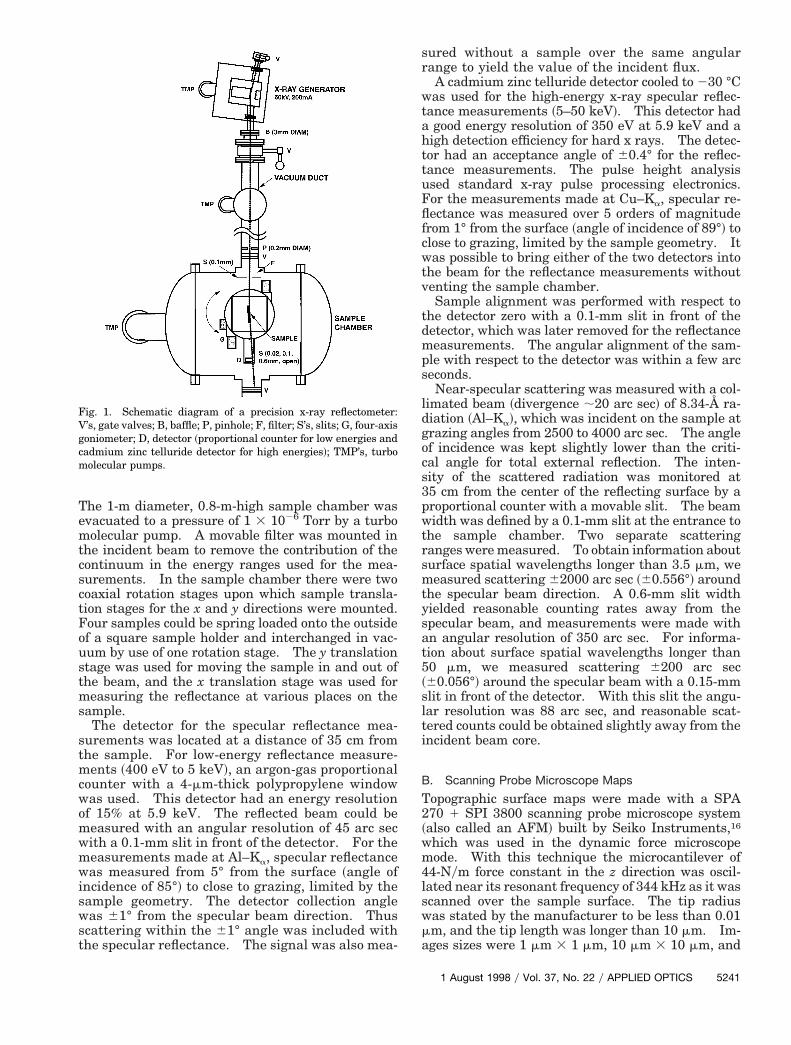
keV! radiation source. Grazing-incidence specularreflectance was also measured on selected sampleswith a Cu–Ka 1.54-Å ~8.047-keV! radiation source.A schematic diagram of the instrument is shown inFig. 1. The reflectometer had a 10-m long beam line,which included an x-ray source and a sample cham-ber that were connected through vacuum ducts.
The x-ray source was a windowless rotating anodex-ray generator capable of operating between 5 and60 kV at a maximum beam current of 200 mA. Itwas possible to generate x rays from a few hundredelectron volts to a few tens of kiloelectron volts. Theintensity of the x-ray source remained constant towithin 1%. The rotating copper anode was coatedwith aluminum and carbon, so characteristic x rays ofcarbon ~44.7 Å!, aluminum ~8.34 Å!, and copper ~1.54Å! could be obtained simultaneously. Energy dis-crimination of the incident flux was done with ab-sorption edge filters, multilayer reflection filters, andthe energy-discrimination characteristics of the de-tectors.
The sample, located in the sample chamber, was10 m from the x-ray generation point. With a 1-mmsource size, the incident beam had an angular diver-gence of 20 arc sec at a distance of 10 m. The beamwidth was defined by a 0.2-mm-diameter pinhole anda 0.1-mm movable slit in front of the sample chamber.
Fou
cwomwm
swst
sr
wtahttuF
cwtv
tdmps
ld
~slti
a
The 1-m diameter, 0.8-m-high sample chamber wasevacuated to a pressure of 1 3 1026 Torr by a turbomolecular pump. A movable filter was mounted inthe incident beam to remove the contribution of thecontinuum in the energy ranges used for the mea-surements. In the sample chamber there were twocoaxial rotation stages upon which sample transla-tion stages for the x and y directions were mounted.
our samples could be spring loaded onto the outsidef a square sample holder and interchanged in vac-um by use of one rotation stage. The y translation
stage was used for moving the sample in and out ofthe beam, and the x translation stage was used formeasuring the reflectance at various places on thesample.
The detector for the specular reflectance mea-surements was located at a distance of 35 cm fromthe sample. For low-energy reflectance measure-ments ~400 eV to 5 keV!, an argon-gas proportionalounter with a 4-mm-thick polypropylene windowas used. This detector had an energy resolutionf 15% at 5.9 keV. The reflected beam could beeasured with an angular resolution of 45 arc secith a 0.1-mm slit in front of the detector. For theeasurements made at Al–Ka, specular reflectance
was measured from 5° from the surface ~angle ofincidence of 85°! to close to grazing, limited by theample geometry. The detector collection angleas 61° from the specular beam direction. Thus
cattering within the 61° angle was included withhe specular reflectance. The signal was also mea-
Fig. 1. Schematic diagram of a precision x-ray reflectometer:V’s, gate valves; B, baffle; P, pinhole; F, filter; S’s, slits; G, four-axisgoniometer; D, detector ~proportional counter for low energies andcadmium zinc telluride detector for high energies!; TMP’s, turbomolecular pumps.
ured without a sample over the same angularange to yield the value of the incident flux.A cadmium zinc telluride detector cooled to 230 °Cas used for the high-energy x-ray specular reflec-
ance measurements ~5–50 keV!. This detector hadgood energy resolution of 350 eV at 5.9 keV and a
igh detection efficiency for hard x rays. The detec-or had an acceptance angle of 60.4° for the reflec-ance measurements. The pulse height analysissed standard x-ray pulse processing electronics.or the measurements made at Cu–Ka, specular re-
flectance was measured over 5 orders of magnitudefrom 1° from the surface ~angle of incidence of 89°! tolose to grazing, limited by the sample geometry. Itas possible to bring either of the two detectors into
he beam for the reflectance measurements withoutenting the sample chamber.Sample alignment was performed with respect to
he detector zero with a 0.1-mm slit in front of theetector, which was later removed for the reflectanceeasurements. The angular alignment of the sam-
le with respect to the detector was within a few arceconds.Near-specular scattering was measured with a col-
imated beam ~divergence ;20 arc sec! of 8.34-Å ra-iation ~Al–Ka!, which was incident on the sample at
grazing angles from 2500 to 4000 arc sec. The angleof incidence was kept slightly lower than the criti-cal angle for total external reflection. The inten-sity of the scattered radiation was monitored at35 cm from the center of the reflecting surface by aproportional counter with a movable slit. The beamwidth was defined by a 0.1-mm slit at the entrance tothe sample chamber. Two separate scatteringranges were measured. To obtain information aboutsurface spatial wavelengths longer than 3.5 mm, wemeasured scattering 62000 arc sec ~60.556°! aroundthe specular beam direction. A 0.6-mm slit widthyielded reasonable counting rates away from thespecular beam, and measurements were made withan angular resolution of 350 arc sec. For informa-tion about surface spatial wavelengths longer than50 mm, we measured scattering 6200 arc sec60.056°! around the specular beam with a 0.15-mmlit in front of the detector. With this slit the angu-ar resolution was 88 arc sec, and reasonable scat-ered counts could be obtained slightly away from thencident beam core.
B. Scanning Probe Microscope Maps
Topographic surface maps were made with a SPA270 1 SPI 3800 scanning probe microscope system~also called an AFM! built by Seiko Instruments,16
which was used in the dynamic force microscopemode. With this technique the microcantilever of44-Nym force constant in the z direction was oscil-lated near its resonant frequency of 344 kHz as it wasscanned over the sample surface. The tip radiuswas stated by the manufacturer to be less than 0.01mm, and the tip length was longer than 10 mm. Im-ges sizes were 1 mm 3 1 mm, 10 mm 3 10 mm, and
1 August 1998 y Vol. 37, No. 22 y APPLIED OPTICS 5241
d
ih
g
ajd
ar
Rtf
o
1
5
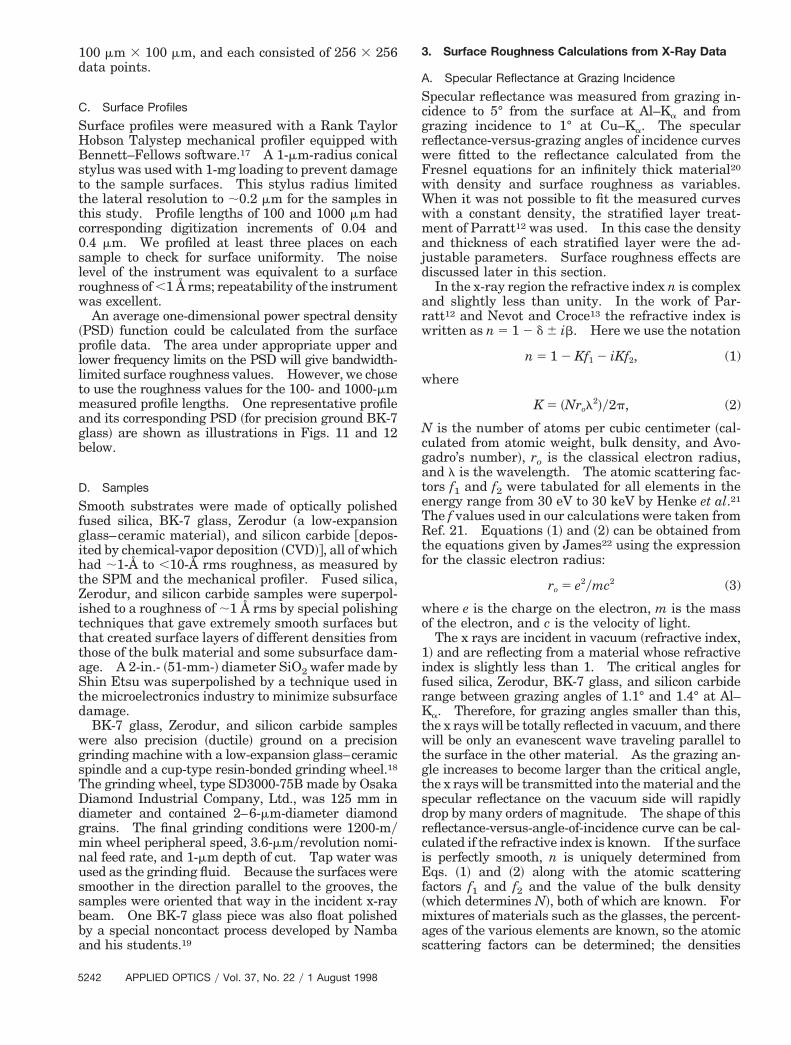
100 mm 3 100 mm, and each consisted of 256 3 256ata points.
C. Surface Profiles
Surface profiles were measured with a Rank TaylorHobson Talystep mechanical profiler equipped withBennett–Fellows software.17 A 1-mm-radius conicalstylus was used with 1-mg loading to prevent damageto the sample surfaces. This stylus radius limitedthe lateral resolution to ;0.2 mm for the samples inthis study. Profile lengths of 100 and 1000 mm hadcorresponding digitization increments of 0.04 and0.4 mm. We profiled at least three places on eachsample to check for surface uniformity. The noiselevel of the instrument was equivalent to a surfaceroughness of ,1 Å rms; repeatability of the instrumentwas excellent.
An average one-dimensional power spectral density~PSD! function could be calculated from the surfaceprofile data. The area under appropriate upper andlower frequency limits on the PSD will give bandwidth-limited surface roughness values. However, we choseto use the roughness values for the 100- and 1000-mmmeasured profile lengths. One representative profileand its corresponding PSD ~for precision ground BK-7glass! are shown as illustrations in Figs. 11 and 12below.
D. Samples
Smooth substrates were made of optically polishedfused silica, BK-7 glass, Zerodur ~a low-expansionglass–ceramic material!, and silicon carbide @depos-ted by chemical-vapor deposition ~CVD!#, all of whichad ;1-Å to ,10-Å rms roughness, as measured by
the SPM and the mechanical profiler. Fused silica,Zerodur, and silicon carbide samples were superpol-ished to a roughness of ;1 Å rms by special polishingtechniques that gave extremely smooth surfaces butthat created surface layers of different densities fromthose of the bulk material and some subsurface dam-age. A 2-in.- ~51-mm-! diameter SiO2 wafer made byShin Etsu was superpolished by a technique used inthe microelectronics industry to minimize subsurfacedamage.
BK-7 glass, Zerodur, and silicon carbide sampleswere also precision ~ductile! ground on a precisiongrinding machine with a low-expansion glass–ceramicspindle and a cup-type resin-bonded grinding wheel.18
The grinding wheel, type SD3000-75B made by OsakaDiamond Industrial Company, Ltd., was 125 mm indiameter and contained 2–6-mm-diameter diamondgrains. The final grinding conditions were 1200-mymin wheel peripheral speed, 3.6-mmyrevolution nomi-nal feed rate, and 1-mm depth of cut. Tap water wasused as the grinding fluid. Because the surfaces weresmoother in the direction parallel to the grooves, thesamples were oriented that way in the incident x-raybeam. One BK-7 glass piece was also float polishedby a special noncontact process developed by Nambaand his students.19
242 APPLIED OPTICS y Vol. 37, No. 22 y 1 August 1998
3. Surface Roughness Calculations from X-Ray Data
A. Specular Reflectance at Grazing Incidence
Specular reflectance was measured from grazing in-cidence to 5° from the surface at Al–Ka and fromrazing incidence to 1° at Cu–Ka. The specular
reflectance-versus-grazing angles of incidence curveswere fitted to the reflectance calculated from theFresnel equations for an infinitely thick material20
with density and surface roughness as variables.When it was not possible to fit the measured curveswith a constant density, the stratified layer treat-ment of Parratt12 was used. In this case the densitynd thickness of each stratified layer were the ad-ustable parameters. Surface roughness effects areiscussed later in this section.In the x-ray region the refractive index n is complex
nd slightly less than unity. In the work of Par-att12 and Nevot and Croce13 the refractive index is
written as n 5 1 2 d 6 ib. Here we use the notation
n 5 1 2 Kf1 2 iKf2, (1)
where
K 5 ~Nrol2!y2p, (2)
N is the number of atoms per cubic centimeter ~cal-culated from atomic weight, bulk density, and Avo-gadro’s number!, ro is the classical electron radius,and l is the wavelength. The atomic scattering fac-tors f1 and f2 were tabulated for all elements in theenergy range from 30 eV to 30 keV by Henke et al.21
The f values used in our calculations were taken fromef. 21. Equations ~1! and ~2! can be obtained from
he equations given by James22 using the expressionor the classic electron radius:
ro 5 e2ymc2 (3)
where e is the charge on the electron, m is the massf the electron, and c is the velocity of light.The x rays are incident in vacuum ~refractive index,
! and are reflecting from a material whose refractiveindex is slightly less than 1. The critical angles forfused silica, Zerodur, BK-7 glass, and silicon carbiderange between grazing angles of 1.1° and 1.4° at Al–Ka. Therefore, for grazing angles smaller than this,the x rays will be totally reflected in vacuum, and therewill be only an evanescent wave traveling parallel tothe surface in the other material. As the grazing an-gle increases to become larger than the critical angle,the x rays will be transmitted into the material and thespecular reflectance on the vacuum side will rapidlydrop by many orders of magnitude. The shape of thisreflectance-versus-angle-of-incidence curve can be cal-culated if the refractive index is known. If the surfaceis perfectly smooth, n is uniquely determined fromEqs. ~1! and ~2! along with the atomic scatteringfactors f1 and f2 and the value of the bulk density~which determines N!, both of which are known. Formixtures of materials such as the glasses, the percent-ages of the various elements are known, so the atomicscattering factors can be determined; the densities
cnqp
ttapt
pgda
a
s~dplwsfibbl
StdSi
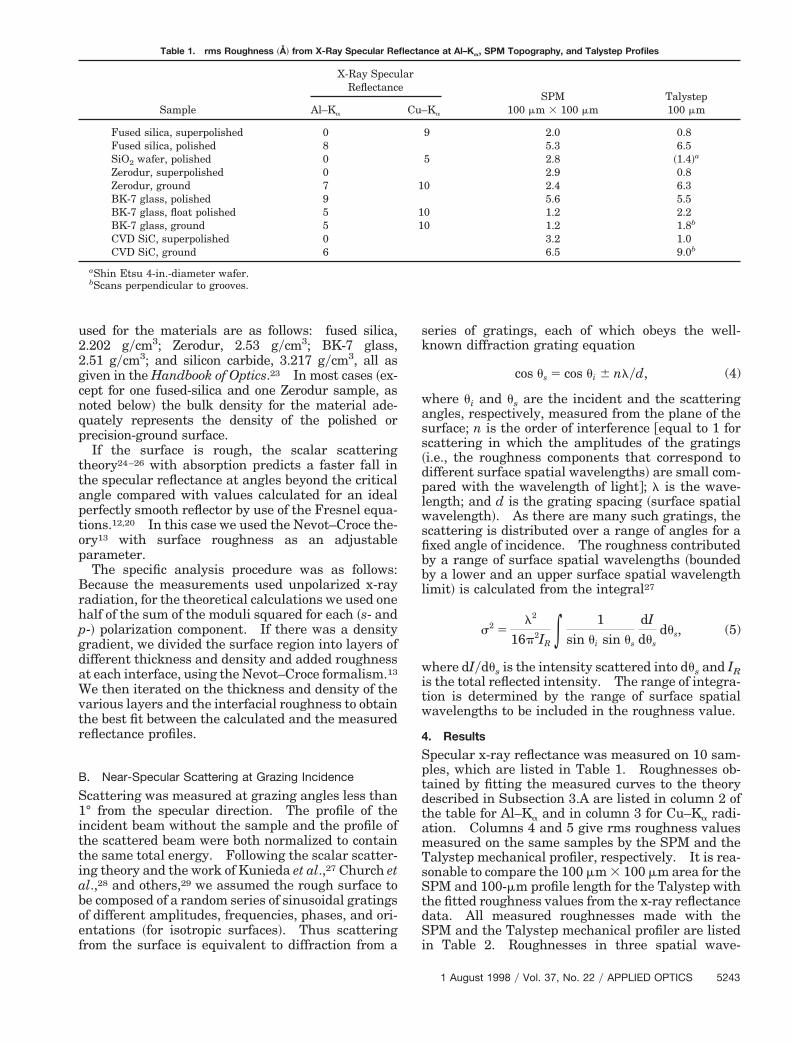
Table 1. rms Roughness ~Å! from X-Ray Specular Reflectance at Al–K , SPM Topography, and Talystep Profiles
used for the materials are as follows: fused silica,2.202 gycm3; Zerodur, 2.53 gycm3; BK-7 glass,2.51 gycm3; and silicon carbide, 3.217 gycm3, all asgiven in the Handbook of Optics.23 In most cases ~ex-ept for one fused-silica and one Zerodur sample, asoted below! the bulk density for the material ade-uately represents the density of the polished orrecision-ground surface.If the surface is rough, the scalar scattering
heory24–26 with absorption predicts a faster fall inhe specular reflectance at angles beyond the criticalngle compared with values calculated for an idealerfectly smooth reflector by use of the Fresnel equa-ions.12,20 In this case we used the Nevot–Croce the-
ory13 with surface roughness as an adjustableparameter.
The specific analysis procedure was as follows:Because the measurements used unpolarized x-rayradiation, for the theoretical calculations we used onehalf of the sum of the moduli squared for each ~s- and
-! polarization component. If there was a densityradient, we divided the surface region into layers ofifferent thickness and density and added roughnesst each interface, using the Nevot–Croce formalism.13
We then iterated on the thickness and density of thevarious layers and the interfacial roughness to obtainthe best fit between the calculated and the measuredreflectance profiles.
B. Near-Specular Scattering at Grazing Incidence
Scattering was measured at grazing angles less than1° from the specular direction. The profile of theincident beam without the sample and the profile ofthe scattered beam were both normalized to containthe same total energy. Following the scalar scatter-ing theory and the work of Kunieda et al.,27 Church et
l.,28 and others,29 we assumed the rough surface tobe composed of a random series of sinusoidal gratingsof different amplitudes, frequencies, phases, and ori-entations ~for isotropic surfaces!. Thus scatteringfrom the surface is equivalent to diffraction from a
series of gratings, each of which obeys the well-known diffraction grating equation
cos us 5 cos ui 6 nlyd, (4)
where ui and us are the incident and the scatteringangles, respectively, measured from the plane of thesurface; n is the order of interference @equal to 1 forcattering in which the amplitudes of the gratingsi.e., the roughness components that correspond toifferent surface spatial wavelengths! are small com-ared with the wavelength of light#; l is the wave-ength; and d is the grating spacing ~surface spatialavelength!. As there are many such gratings, the
cattering is distributed over a range of angles for axed angle of incidence. The roughness contributedy a range of surface spatial wavelengths ~boundedy a lower and an upper surface spatial wavelengthimit! is calculated from the integral27
s2 5l2
16p2IR * 1sin ui sin us
dIdus
dus, (5)
where dIydus is the intensity scattered into dus and IRis the total reflected intensity. The range of integra-tion is determined by the range of surface spatialwavelengths to be included in the roughness value.
4. Results
Specular x-ray reflectance was measured on 10 sam-ples, which are listed in Table 1. Roughnesses ob-tained by fitting the measured curves to the theorydescribed in Subsection 3.A are listed in column 2 ofthe table for Al–Ka and in column 3 for Cu–Ka radi-ation. Columns 4 and 5 give rms roughness valuesmeasured on the same samples by the SPM and theTalystep mechanical profiler, respectively. It is rea-sonable to compare the 100 mm 3 100 mm area for the
PM and 100-mm profile length for the Talystep withhe fitted roughness values from the x-ray reflectanceata. All measured roughnesses made with thePM and the Talystep mechanical profiler are listed
n Table 2. Roughnesses in three spatial wave-
a
Sample
X-Ray SpecularReflectance
SPM100 mm 3 100 mm
Talystep100 mmAl–Ka Cu–Ka
Fused silica, superpolished 0 9 2.0 0.8Fused silica, polished 8 5.3 6.5SiO2 wafer, polished 0 5 2.8 ~1.4!a
Zerodur, superpolished 0 2.9 0.8Zerodur, ground 7 10 2.4 6.3BK-7 glass, polished 9 5.6 5.5BK-7 glass, float polished 5 10 1.2 2.2BK-7 glass, ground 5 10 1.2 1.8b
CVD SiC, superpolished 0 3.2 1.0CVD SiC, ground 6 6.5 9.0b
aShin Etsu 4-in.-diameter wafer.bScans perpendicular to grooves.
1 August 1998 y Vol. 37, No. 22 y APPLIED OPTICS 5243
iHbgtu
daeld
aCi
agwm
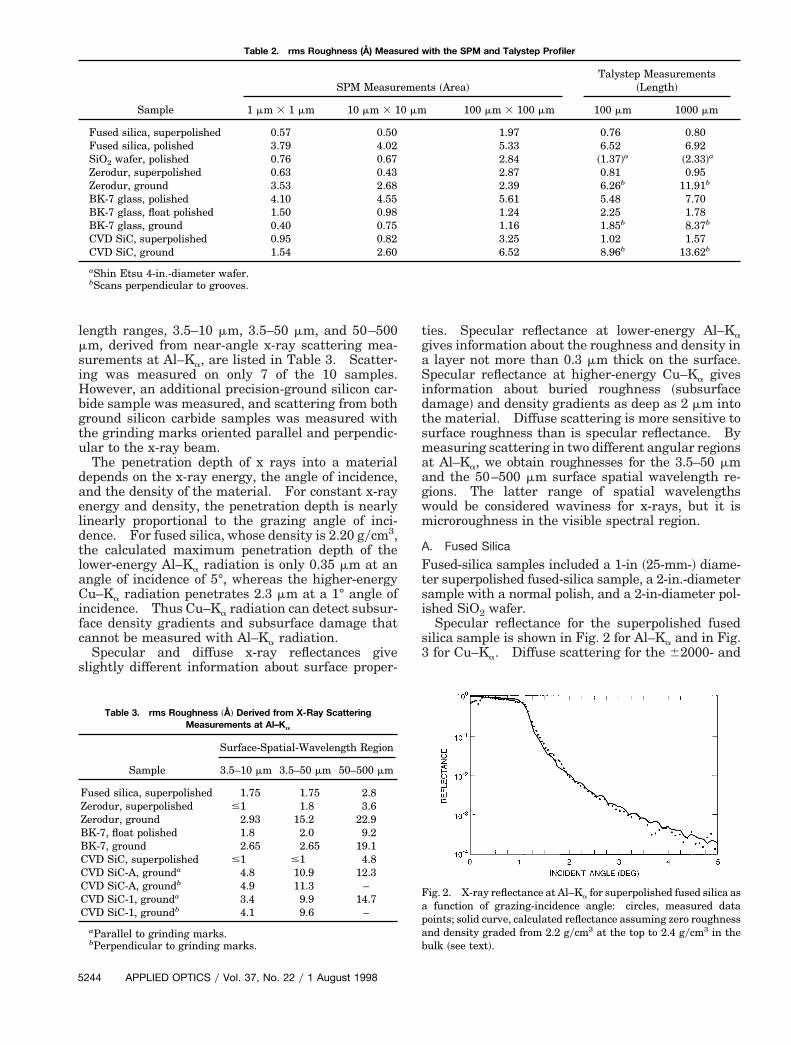
Table 2. rms Roughness (Å) Measured with the SPM and Talystep Profiler
5
length ranges, 3.5–10 mm, 3.5–50 mm, and 50–500mm, derived from near-angle x-ray scattering mea-surements at Al–Ka, are listed in Table 3. Scatter-ng was measured on only 7 of the 10 samples.owever, an additional precision-ground silicon car-ide sample was measured, and scattering from bothround silicon carbide samples was measured withhe grinding marks oriented parallel and perpendic-lar to the x-ray beam.The penetration depth of x rays into a material
epends on the x-ray energy, the angle of incidence,nd the density of the material. For constant x-raynergy and density, the penetration depth is nearlyinearly proportional to the grazing angle of inci-ence. For fused silica, whose density is 2.20 gycm3,
the calculated maximum penetration depth of thelower-energy Al–Ka radiation is only 0.35 mm at anngle of incidence of 5°, whereas the higher-energyu–Ka radiation penetrates 2.3 mm at a 1° angle of
ncidence. Thus Cu–Ka radiation can detect subsur-face density gradients and subsurface damage thatcannot be measured with Al–Ka radiation.
Specular and diffuse x-ray reflectances giveslightly different information about surface proper-
Table 3. rms Roughness ~Å! Derived from X-Ray Scattering
244 APPLIED OPTICS y Vol. 37, No. 22 y 1 August 1998
ties. Specular reflectance at lower-energy Al–Ka
gives information about the roughness and density ina layer not more than 0.3 mm thick on the surface.Specular reflectance at higher-energy Cu–Ka givesinformation about buried roughness ~subsurfacedamage! and density gradients as deep as 2 mm intothe material. Diffuse scattering is more sensitive tosurface roughness than is specular reflectance. Bymeasuring scattering in two different angular regionsat Al–Ka, we obtain roughnesses for the 3.5–50 mmnd the 50–500 mm surface spatial wavelength re-ions. The latter range of spatial wavelengthsould be considered waviness for x-rays, but it isicroroughness in the visible spectral region.
A. Fused Silica
Fused-silica samples included a 1-in ~25-mm-! diame-ter superpolished fused-silica sample, a 2-in.-diametersample with a normal polish, and a 2-in-diameter pol-ished SiO2 wafer.
Specular reflectance for the superpolished fusedsilica sample is shown in Fig. 2 for Al–Ka and in Fig.3 for Cu–Ka. Diffuse scattering for the 62000- and
Fig. 2. X-ray reflectance at Al–Ka for superpolished fused silica asa function of grazing-incidence angle: circles, measured datapoints; solid curve, calculated reflectance assuming zero roughnessand density graded from 2.2 gycm3 at the top to 2.4 gycm3 in thebulk ~see text!.
Sample
SPM Measurements ~Area!Talystep Measurements
~Length!
1 mm 3 1 mm 10 mm 3 10 mm 100 mm 3 100 mm 100 mm 1000 mm
Fused silica, superpolished 0.57 0.50 1.97 0.76 0.80Fused silica, polished 3.79 4.02 5.33 6.52 6.92SiO2 wafer, polished 0.76 0.67 2.84 ~1.37!a ~2.33!a
Zerodur, superpolished 0.63 0.43 2.87 0.81 0.95Zerodur, ground 3.53 2.68 2.39 6.26b 11.91b
BK-7 glass, polished 4.10 4.55 5.61 5.48 7.70BK-7 glass, float polished 1.50 0.98 1.24 2.25 1.78BK-7 glass, ground 0.40 0.75 1.16 1.85b 8.37b
CVD SiC, superpolished 0.95 0.82 3.25 1.02 1.57CVD SiC, ground 1.54 2.60 6.52 8.96b 13.62b
aShin Etsu 4-in.-diameter wafer.bScans perpendicular to grooves.
Measurements at Al–Ka
Sample
Surface-Spatial-Wavelength Region
3.5–10 mm 3.5–50 mm 50–500 mm
Fused silica, superpolished 1.75 1.75 2.8Zerodur, superpolished #1 1.8 3.6Zerodur, ground 2.93 15.2 22.9BK-7, float polished 1.8 2.0 9.2BK-7, ground 2.65 2.65 19.1CVD SiC, superpolished #1 #1 4.8CVD SiC-A, grounda 4.8 10.9 12.3CVD SiC-A, groundb 4.9 11.3 –CVD SiC-1, grounda 3.4 9.9 14.7CVD SiC-1, groundb 4.1 9.6 –
aParallel to grinding marks.bPerpendicular to grinding marks.
i
nas
s
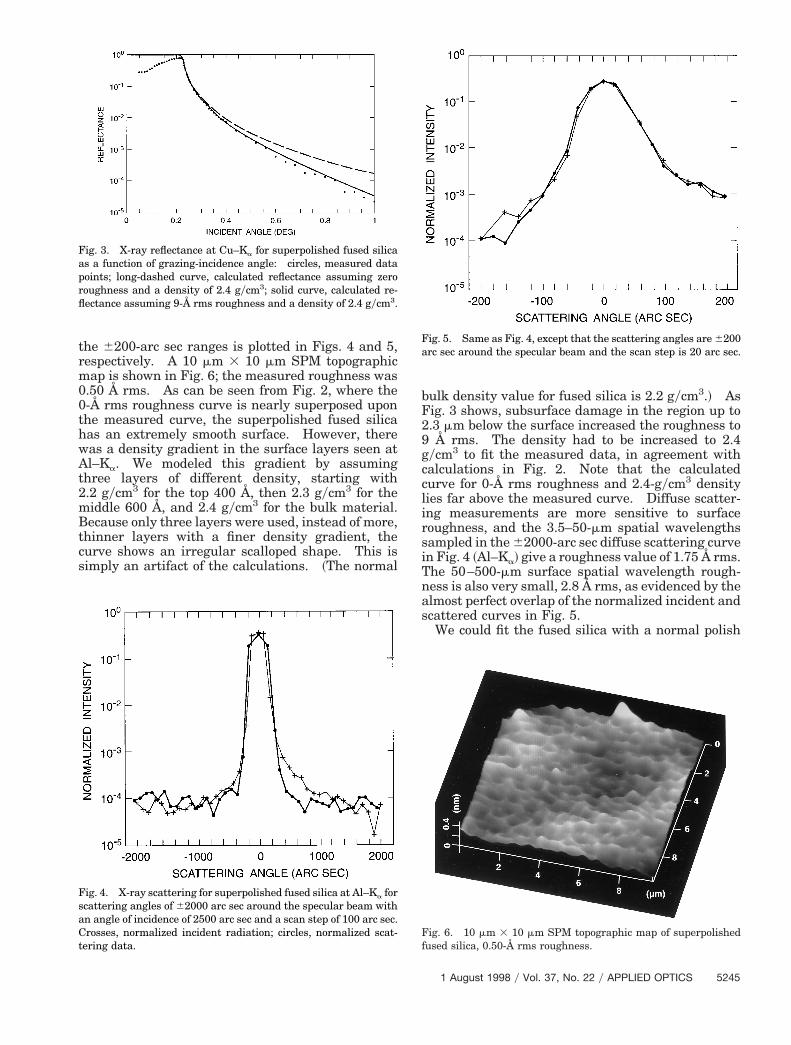
the 6200-arc sec ranges is plotted in Figs. 4 and 5,respectively. A 10 mm 3 10 mm SPM topographicmap is shown in Fig. 6; the measured roughness was0.50 Å rms. As can be seen from Fig. 2, where the0-Å rms roughness curve is nearly superposed uponthe measured curve, the superpolished fused silicahas an extremely smooth surface. However, therewas a density gradient in the surface layers seen atAl–Ka. We modeled this gradient by assumingthree layers of different density, starting with2.2 gycm3 for the top 400 Å, then 2.3 gycm3 for themiddle 600 Å, and 2.4 gycm3 for the bulk material.Because only three layers were used, instead of more,thinner layers with a finer density gradient, thecurve shows an irregular scalloped shape. This issimply an artifact of the calculations. ~The normal
Fig. 3. X-ray reflectance at Cu–Ka for superpolished fused silicaas a function of grazing-incidence angle: circles, measured datapoints; long-dashed curve, calculated reflectance assuming zeroroughness and a density of 2.4 gycm3; solid curve, calculated re-flectance assuming 9-Å rms roughness and a density of 2.4 gycm3.
Fig. 4. X-ray scattering for superpolished fused silica at Al–Ka forcattering angles of 62000 arc sec around the specular beam with
an angle of incidence of 2500 arc sec and a scan step of 100 arc sec.Crosses, normalized incident radiation; circles, normalized scat-tering data.
bulk density value for fused silica is 2.2 gycm3.! AsFig. 3 shows, subsurface damage in the region up to2.3 mm below the surface increased the roughness to9 Å rms. The density had to be increased to 2.4gycm3 to fit the measured data, in agreement withcalculations in Fig. 2. Note that the calculatedcurve for 0-Å rms roughness and 2.4-gycm3 densitylies far above the measured curve. Diffuse scatter-ing measurements are more sensitive to surfaceroughness, and the 3.5–50-mm spatial wavelengthssampled in the 62000-arc sec diffuse scattering curven Fig. 4 ~Al–Ka! give a roughness value of 1.75 Å rms.
The 50–500-mm surface spatial wavelength rough-ess is also very small, 2.8 Å rms, as evidenced by thelmost perfect overlap of the normalized incident andcattered curves in Fig. 5.We could fit the fused silica with a normal polish
Fig. 5. Same as Fig. 4, except that the scattering angles are 6200arc sec around the specular beam and the scan step is 20 arc sec.
Fig. 6. 10 mm 3 10 mm SPM topographic map of superpolishedfused silica, 0.50-Å rms roughness.
1 August 1998 y Vol. 37, No. 22 y APPLIED OPTICS 5245
ur
sct
1sctt
ptl
h
Z
Z
5
very well to an Al–Ka specular reflectance curve bysing 8-Å rms roughness, close to the topographicoughness values of 5.3 Å rms ~SPM! and 6.5 Å rms
~Talystep!. Also, the density of fused silica for thisfit was 2.2 gycm3, the same as that of bulk fusedilica, indicating that there were no surface densityhanges in the material during polishing. No scat-ering measurements were made on this sample.
The 2-in-diameter SiO2 wafer was very smooth andthe measured specular reflectance at Al–Ka could befitted to a calculated curve with zero roughness and adensity of 2.2 gycm3. A calculated curve with 5-Årms roughness and a density of 2.2 gycm3 fitted themeasured Cu–Ka specular reflectance, indicatingthat there were no density gradients and minimalsubsurface damage on this sample. Figure 7 showsa SPM topographic map of the surface. We did notmake Talystep profiles before taking the x-ray mea-surements because we did not wish to contaminate
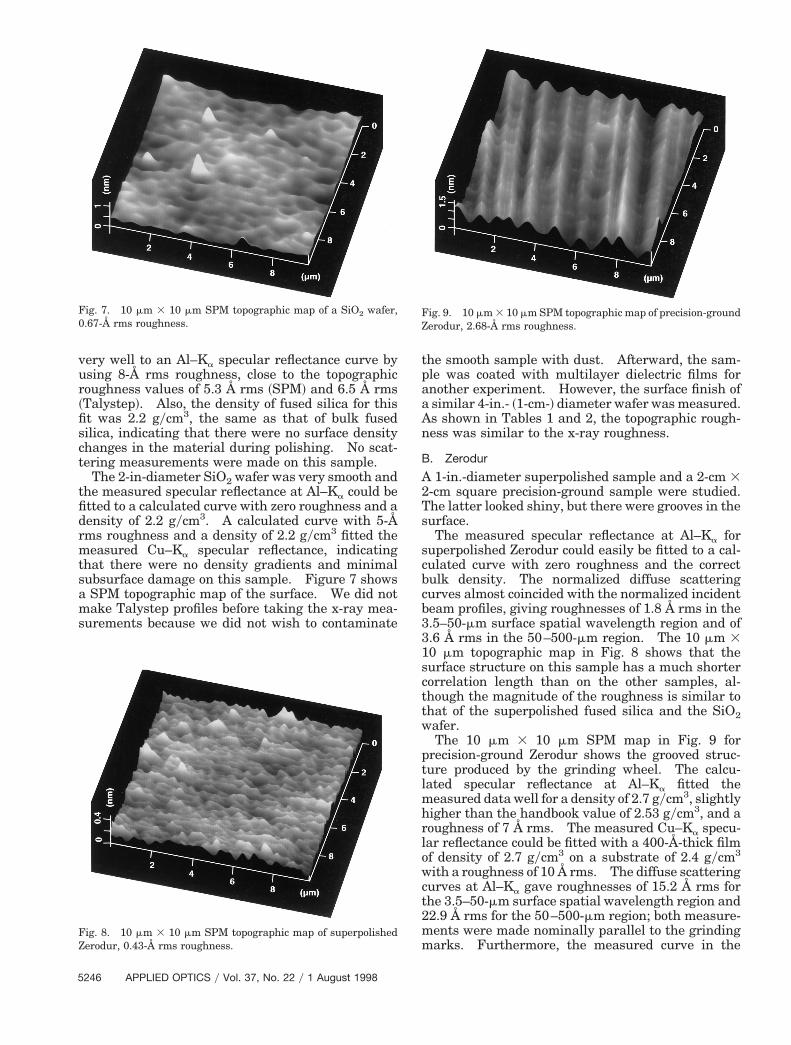
Fig. 8. 10 mm 3 10 mm SPM topographic map of superpolishederodur, 0.43-Å rms roughness.
246 APPLIED OPTICS y Vol. 37, No. 22 y 1 August 1998
the smooth sample with dust. Afterward, the sam-ple was coated with multilayer dielectric films foranother experiment. However, the surface finish ofa similar 4-in.- ~1-cm-! diameter wafer was measured.As shown in Tables 1 and 2, the topographic rough-ness was similar to the x-ray roughness.
B. Zerodur
A 1-in.-diameter superpolished sample and a 2-cm 32-cm square precision-ground sample were studied.The latter looked shiny, but there were grooves in thesurface.
The measured specular reflectance at Al–Ka forsuperpolished Zerodur could easily be fitted to a cal-culated curve with zero roughness and the correctbulk density. The normalized diffuse scatteringcurves almost coincided with the normalized incidentbeam profiles, giving roughnesses of 1.8 Å rms in the3.5–50-mm surface spatial wavelength region and of3.6 Å rms in the 50–500-mm region. The 10 mm 30 mm topographic map in Fig. 8 shows that theurface structure on this sample has a much shorterorrelation length than on the other samples, al-hough the magnitude of the roughness is similar tohat of the superpolished fused silica and the SiO2
wafer.The 10 mm 3 10 mm SPM map in Fig. 9 for
recision-ground Zerodur shows the grooved struc-ure produced by the grinding wheel. The calcu-ated specular reflectance at Al–Ka fitted the
measured data well for a density of 2.7 gycm3, slightlyigher than the handbook value of 2.53 gycm3, and a
roughness of 7 Å rms. The measured Cu–Ka specu-lar reflectance could be fitted with a 400-Å-thick filmof density of 2.7 gycm3 on a substrate of 2.4 gycm3
with a roughness of 10 Å rms. The diffuse scatteringcurves at Al–Ka gave roughnesses of 15.2 Å rms forthe 3.5–50-mm surface spatial wavelength region and22.9 Å rms for the 50–500-mm region; both measure-ments were made nominally parallel to the grindingmarks. Furthermore, the measured curve in the
Fig. 7. 10 mm 3 10 mm SPM topographic map of a SiO2 wafer,0.67-Å rms roughness.
Fig. 9. 10 mm 3 10 mm SPM topographic map of precision-grounderodur, 2.68-Å rms roughness.
qeastcm
tr
osgoo~
fivdp1fg
long-spatial-wavelength region ~6200 arc sec! wasuite asymmetric, undoubtedly because of the un-ven grinding marks. The x-ray roughness datagree better with the Talystep measurements ~whichhowed large amounts of waviness on the surface!han with the SPM maps, probably because an espe-ially smooth place was chosen for the SPM measure-ents.
C. BK-7 Glass
There were three 30-mm-diameter BK-7 glass sam-ples, all of which were made from the same materialbut had different types of surface finish. One had anormal optical polish, one was float polished, and athird sample was precision ground.
The optically polished sample had a topographicroughness of ;5 Å rms ~Table 2!, and the SPM image~not shown here! looked normal. The calculatedcurve for the specular reflectance at Al–Ka fitted theexperimental curve well over 3 orders of magnitudewith a roughness of 9 Å rms and bulk density, indi-cating that there were no density gradients in thesurface layer. No other x-ray measurements weremade of this sample.
The float-polished BK-7 glass sample was quitesmooth, ;1–2 Å rms, as measured by the SPM andhe Talystep ~Table 2!, but the calculated speculareflectance curve for Al–Ka with a roughness of 5 Å
rms gave a poor fit in the reflectance range from 2 31022 to ;3 3 1024. Similarly, the calculated curvefor the Cu–Ka reflectance gave a poor fit in the 1021
to 1024 reflectance range with a roughness of 10 Årms, showing that the top surface had a higher den-sity than the bulk material. Note that this densitygradient is in the opposite direction from that on thesuperpolished fused-silica sample. The diffusex-ray scattering curves looked similar to those of thesuperpolished fused silica, with a roughness of 2.0 Årms calculated for the 3.5–50-mm spatial wavelengthrange, but a larger value of 9.2 Å rms was determined
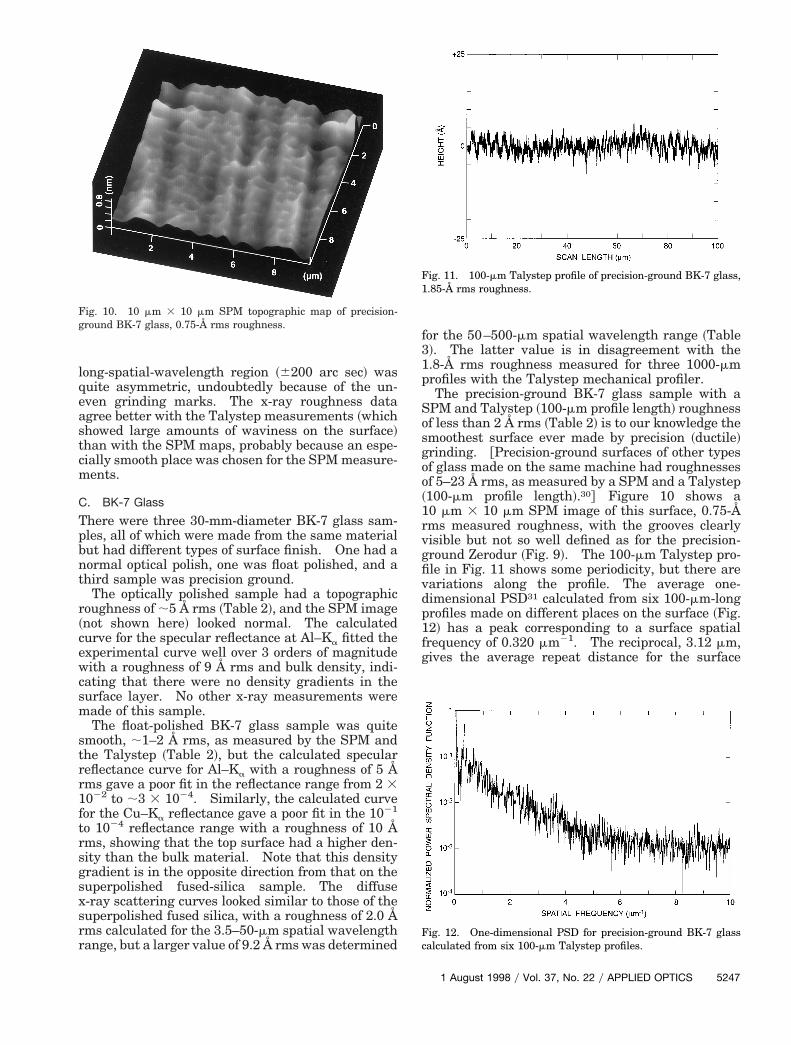
Fig. 10. 10 mm 3 10 mm SPM topographic map of precision-ground BK-7 glass, 0.75-Å rms roughness.
for the 50–500-mm spatial wavelength range ~Table3!. The latter value is in disagreement with the1.8-Å rms roughness measured for three 1000-mmprofiles with the Talystep mechanical profiler.
The precision-ground BK-7 glass sample with aSPM and Talystep ~100-mm profile length! roughnessf less than 2 Å rms ~Table 2! is to our knowledge themoothest surface ever made by precision ~ductile!rinding. @Precision-ground surfaces of other typesf glass made on the same machine had roughnessesf 5–23 Å rms, as measured by a SPM and a Talystep100-mm profile length!.30# Figure 10 shows a
10 mm 3 10 mm SPM image of this surface, 0.75-Årms measured roughness, with the grooves clearlyvisible but not so well defined as for the precision-ground Zerodur ~Fig. 9!. The 100-mm Talystep pro-
le in Fig. 11 shows some periodicity, but there areariations along the profile. The average one-imensional PSD31 calculated from six 100-mm-longrofiles made on different places on the surface ~Fig.2! has a peak corresponding to a surface spatialrequency of 0.320 mm21. The reciprocal, 3.12 mm,ives the average repeat distance for the surface
Fig. 11. 100-mm Talystep profile of precision-ground BK-7 glass,1.85-Å rms roughness.
Fig. 12. One-dimensional PSD for precision-ground BK-7 glasscalculated from six 100-mm Talystep profiles.
1 August 1998 y Vol. 37, No. 22 y APPLIED OPTICS 5247
b1mx
5
structure, i.e., the feed rate of the grinding wheel.This is consistent with the 3.6 mmyrevolution nomi-nal feed rate on the grinding machine. ~The actualfeed rate could be varied from 1.8 to 5.4 mmyrevolu-tion.! Although this surface is smooth over dis-tances of 100 mm and less, it is wavy over longerdistances because of instabilities between the grind-ing wheel and the sample. The average 1000-mmTalystep profile roughness was 8.37 Å rms ~Table 2!.If the PSD is plotted on a log–log scale in the spatialfrequency range between 1 and 10 mm21, the graph isapproximately a sine wave crossing a straight line ofslope 21.5 at a spatial frequency of 3 mm21.
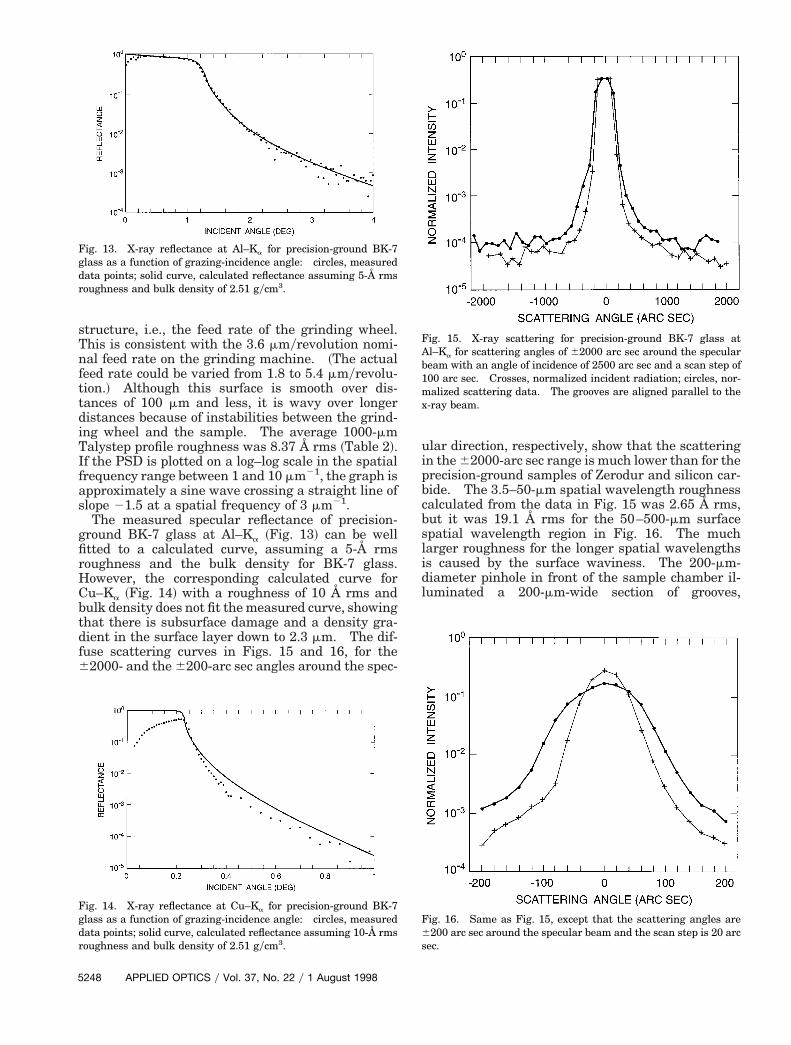
The measured specular reflectance of precision-ground BK-7 glass at Al–Ka ~Fig. 13! can be wellfitted to a calculated curve, assuming a 5-Å rmsroughness and the bulk density for BK-7 glass.However, the corresponding calculated curve forCu–Ka ~Fig. 14! with a roughness of 10 Å rms andbulk density does not fit the measured curve, showingthat there is subsurface damage and a density gra-dient in the surface layer down to 2.3 mm. The dif-fuse scattering curves in Figs. 15 and 16, for the62000- and the 6200-arc sec angles around the spec-
Fig. 13. X-ray reflectance at Al–Ka for precision-ground BK-7glass as a function of grazing-incidence angle: circles, measureddata points; solid curve, calculated reflectance assuming 5-Å rmsroughness and bulk density of 2.51 gycm3.
Fig. 14. X-ray reflectance at Cu–Ka for precision-ground BK-7glass as a function of grazing-incidence angle: circles, measureddata points; solid curve, calculated reflectance assuming 10-Å rmsroughness and bulk density of 2.51 gycm3.
248 APPLIED OPTICS y Vol. 37, No. 22 y 1 August 1998
ular direction, respectively, show that the scatteringin the 62000-arc sec range is much lower than for theprecision-ground samples of Zerodur and silicon car-bide. The 3.5–50-mm spatial wavelength roughnesscalculated from the data in Fig. 15 was 2.65 Å rms,but it was 19.1 Å rms for the 50–500-mm surfacespatial wavelength region in Fig. 16. The muchlarger roughness for the longer spatial wavelengthsis caused by the surface waviness. The 200-mm-diameter pinhole in front of the sample chamber il-luminated a 200-mm-wide section of grooves,
Fig. 15. X-ray scattering for precision-ground BK-7 glass atAl–Ka for scattering angles of 62000 arc sec around the speculaream with an angle of incidence of 2500 arc sec and a scan step of00 arc sec. Crosses, normalized incident radiation; circles, nor-alized scattering data. The grooves are aligned parallel to the
-ray beam.
Fig. 16. Same as Fig. 15, except that the scattering angles are6200 arc sec around the specular beam and the scan step is 20 arcsec.
s
b5mx
Table 4. Peak-to-Valley SPM Profile Roughness ~Å! of Silicon Carbide Samples, Average of 10 Profiles
corresponding to ;64 adjacent paths cut by the grind-ing wheel. Instabilities between the surface and thegrinding wheel will produce height variations andwill affect the long-surface-spatial-wavelength x-rayscattering. In contrast, the 100-mm Talystep profilein Fig. 11 includes the contributions of only 32 adja-cent paths, and the surface waviness is considerablyless.
D. CVD Silicon Carbide
Two types of surface finish were measured for CVDsilicon carbide. One 1.5-in.- ~38-mm-! diametersample was superpolished, and two 2-cm 3 2-cmsquare samples, SiC-A and SiC-1, were precisionground. Data for SiC-A are in Tables 1–4, and ad-ditional data for SiC-1 are in Table 3. The maxi-mum penetration depths calculated for SiC at Al–Ka
and Cu–Ka were 0.44 and 1.2 mm for angles of 5° and1°, respectively. The 0.44-mm value is slightlylarger than the 0.35-mm value for fused silica,whereas the 1.2-mm value is approximately half ofthat for fused silica at the same angles. Becausethere is no ductile flow when silicon carbide is pol-ished or machined, there should be a minimum ofsubsurface damage. For this reason, no reflectancemeasurements were made at Cu–Ka.
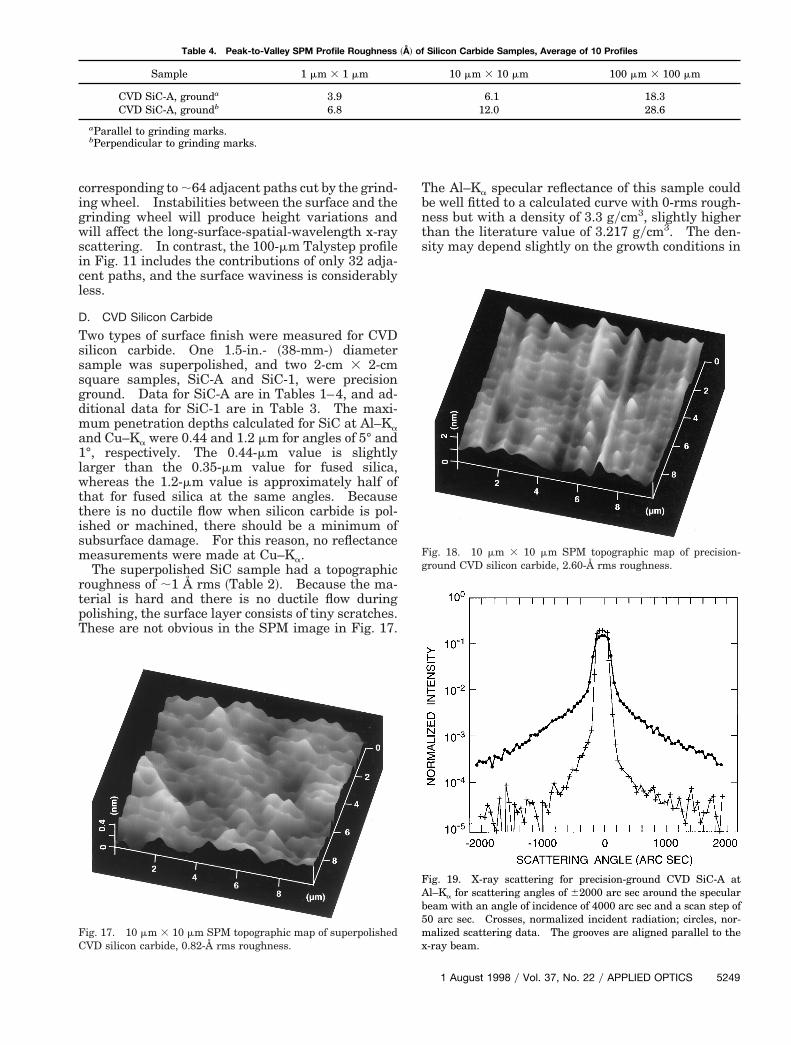
The superpolished SiC sample had a topographicroughness of ;1 Å rms ~Table 2!. Because the ma-terial is hard and there is no ductile flow duringpolishing, the surface layer consists of tiny scratches.These are not obvious in the SPM image in Fig. 17.
Fig. 17. 10 mm 3 10 mm SPM topographic map of superpolishedCVD silicon carbide, 0.82-Å rms roughness.
Sample 1 mm 3 1 mm
CVD SiC-A, grounda 3.9CVD SiC-A, groundb 6.8
aParallel to grinding marks.bPerpendicular to grinding marks.
The Al–Ka specular reflectance of this sample couldbe well fitted to a calculated curve with 0-rms rough-ness but with a density of 3.3 gycm3, slightly higherthan the literature value of 3.217 gycm3. The den-ity may depend slightly on the growth conditions in
Fig. 18. 10 mm 3 10 mm SPM topographic map of precision-ground CVD silicon carbide, 2.60-Å rms roughness.
Fig. 19. X-ray scattering for precision-ground CVD SiC-A atAl–Ka for scattering angles of 62000 arc sec around the speculaream with an angle of incidence of 4000 arc sec and a scan step of0 arc sec. Crosses, normalized incident radiation; circles, nor-alized scattering data. The grooves are aligned parallel to the
-ray beam.
10 mm 3 10 mm 100 mm 3 100 mm
6.1 18.312.0 28.6
1 August 1998 y Vol. 37, No. 22 y APPLIED OPTICS 5249
ssas
emfoirmg
tssbd3grrgtm
xmxagtwfrstfp
ttasosogpgtdPisodqTootetwsia
op
5
the CVD process. Both diffuse scattering curvesshowed that the scattered intensity was close to theincident intensity, giving small roughness values~Table 3!. This sample had the lowest 3.5–50-mmurface spatial wavelength scattering of any of theamples measured, but the superpolished fused-silicand Zerodur samples had slightly lower 50–500-mmurface spatial wavelength scattering.The precision-ground SiC-A sample was the rough-
st of the precision-ground samples for the largereasurement areas, with a roughness that varied
rom 1.5 to 13.6 Å rms, depending on the image sizer profile length ~Table 2!. The 10 mm 3 10 mm SPMmage shown in Fig. 18, with a roughness of 2.6 Åms, shows distinctive chatter marks in the grooves,any more than are visible on the other precision-
round samples. The specular reflectance at Al–Ka
could be fitted to a calculated curve with a density of3.3 gycm3 and roughness of 6 Å rms, consistent withhe SPM and Talystep roughness values for an imageize of ;100 mm. As for the superpolished CVD SiCample, the density is slightly higher than the quotedulk density. Roughness values calculated from theiffuse scattering curves were 10.9 Å rms for the.5–50-mm surface-spatial-wavelength scattering re-ion ~Fig. 19! and 12.3 Å rms for the 50–500-mmegion ~Table 3!. The longer-spatial-wavelengthoughness value is the lowest of the three precision-round samples, suggesting that instabilities duringhe grinding process were less of a problem with thisaterial.To determine the effect of groove orientation on the
-ray scattering, we also made diffuse scatteringeasurements with the grooves perpendicular to the
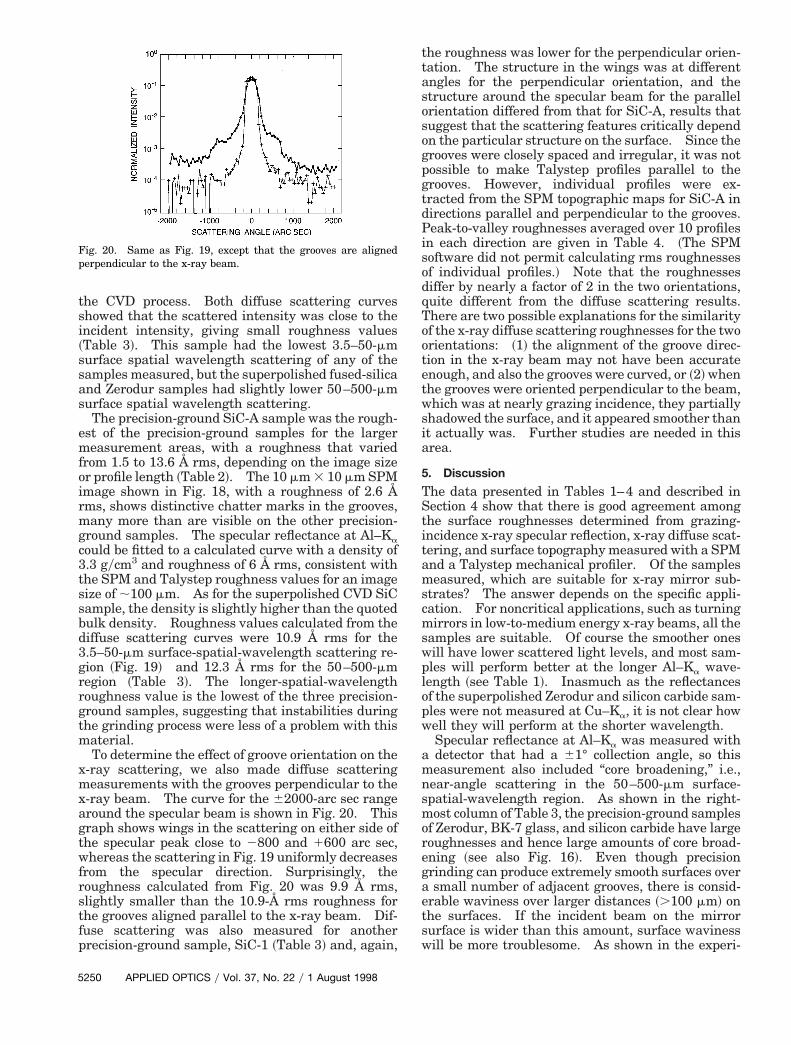
-ray beam. The curve for the 62000-arc sec rangeround the specular beam is shown in Fig. 20. Thisraph shows wings in the scattering on either side ofhe specular peak close to 2800 and 1600 arc sec,hereas the scattering in Fig. 19 uniformly decreases
rom the specular direction. Surprisingly, theoughness calculated from Fig. 20 was 9.9 Å rms,lightly smaller than the 10.9-Å rms roughness forhe grooves aligned parallel to the x-ray beam. Dif-use scattering was also measured for anotherrecision-ground sample, SiC-1 ~Table 3! and, again,
250 APPLIED OPTICS y Vol. 37, No. 22 y 1 August 1998
he roughness was lower for the perpendicular orien-ation. The structure in the wings was at differentngles for the perpendicular orientation, and thetructure around the specular beam for the parallelrientation differed from that for SiC-A, results thatuggest that the scattering features critically dependn the particular structure on the surface. Since therooves were closely spaced and irregular, it was notossible to make Talystep profiles parallel to therooves. However, individual profiles were ex-racted from the SPM topographic maps for SiC-A inirections parallel and perpendicular to the grooves.eak-to-valley roughnesses averaged over 10 profiles
n each direction are given in Table 4. ~The SPMoftware did not permit calculating rms roughnessesf individual profiles.! Note that the roughnessesiffer by nearly a factor of 2 in the two orientations,uite different from the diffuse scattering results.here are two possible explanations for the similarityf the x-ray diffuse scattering roughnesses for the tworientations: ~1! the alignment of the groove direc-ion in the x-ray beam may not have been accuratenough, and also the grooves were curved, or ~2! whenhe grooves were oriented perpendicular to the beam,hich was at nearly grazing incidence, they partially
hadowed the surface, and it appeared smoother thant actually was. Further studies are needed in thisrea.
5. Discussion
The data presented in Tables 1–4 and described inSection 4 show that there is good agreement amongthe surface roughnesses determined from grazing-incidence x-ray specular reflection, x-ray diffuse scat-tering, and surface topography measured with a SPMand a Talystep mechanical profiler. Of the samplesmeasured, which are suitable for x-ray mirror sub-strates? The answer depends on the specific appli-cation. For noncritical applications, such as turningmirrors in low-to-medium energy x-ray beams, all thesamples are suitable. Of course the smoother oneswill have lower scattered light levels, and most sam-ples will perform better at the longer Al–Ka wave-length ~see Table 1!. Inasmuch as the reflectancesf the superpolished Zerodur and silicon carbide sam-les were not measured at Cu–Ka, it is not clear how
well they will perform at the shorter wavelength.Specular reflectance at Al–Ka was measured with
a detector that had a 61° collection angle, so thismeasurement also included “core broadening,” i.e.,near-angle scattering in the 50–500-mm surface-spatial-wavelength region. As shown in the right-most column of Table 3, the precision-ground samplesof Zerodur, BK-7 glass, and silicon carbide have largeroughnesses and hence large amounts of core broad-ening ~see also Fig. 16!. Even though precisiongrinding can produce extremely smooth surfaces overa small number of adjacent grooves, there is consid-erable waviness over larger distances ~.100 mm! onthe surfaces. If the incident beam on the mirrorsurface is wider than this amount, surface wavinesswill be more troublesome. As shown in the experi-
Fig. 20. Same as Fig. 19, except that the grooves are alignedperpendicular to the x-ray beam.
rot
twbpw
csttgars
Srrtggisu
warprodscrfibld
oaHxespcttwt
ments with the precision-ground silicon carbide sur-faces ~Table 3!, there is no real difference in theoughness seen by the x rays when the grooves areriented parallel or perpendicular to the direction ofhe incident x-ray beam.
At first glance, SiO2 wafers produced for the micro-electronics industry would seem to be excellent inex-pensive substrates for grazing-incidence x-ray mirrors.They have smooth surfaces and presumably low scat-ter ~although it was not measured!. The major draw-back is that these wafers are very thin, some ,1 mmhick, so the surface will deform easily. Even if theafers could be mounted flat, heating from the x-rayeam could deform them. Also, waviness may beresent, depending on the particular polishing process,hich will produce core broadening.Superpolished fused silica, Zerodur, and silicon
arbide all have extremely smooth surfaces and thushould be ideal for low scatter x-ray mirrors. Unfor-unately, a superpolished surface on a glass-type ma-erial is often produced at the expense of densityradients in the surface layer and subsurface dam-ge, as was seen for the fused silica. The speculareflectance of Zerodur was not measured at thehorter Cu–Ka wavelength, so it is not clear whether
subsurface damage was present. Because the pol-ishing mechanism for silicon carbide is different, i.e.,the material does not flow and surface defects are notburied, subsurface damage should be absent. Sur-face density gradients and subsurface damage areparticularly important when the mirrors are used inhigh-power x-ray beams because the surface layersmay soften, exposing the subsurface damage andcausing the surface to crack. Thus the polishingtechnique used for producing high-quality x-ray mir-rors for high-power density applications is extremelyimportant.
6. Conclusions
The purpose of this study was to determine whethersurface roughness measurements made with suffi-ciently high lateral resolution can be used to predictx-ray specular reflectance and diffuse scattering fromslightly rough substrates at grazing incidence. Ac-curate predictions would save considerable time andexpense because elaborate x-ray equipment wouldnot be required. Samples studied were uncoatedsurfaces of fused silica, Zerodur, BK-7 glass, andCVD silicon carbide prepared by optical polishing andprecision grinding techniques. The results showedthat roughnesses obtained from 100 mm 3 100 mm
PM images and Talystep profiles made with a 1-mm-adius stylus were in good general agreement withoughnesses calculated from specular x-ray reflec-ance measured at Al–Ka ~1.486 keV, 8.34 Å! nearrazing incidence. The roughnesses calculated fromrazing-incidence diffuse x-ray scattering were alson good general agreement with the SPM and Taly-tep profile measurements. Grazing-incidence spec-lar x-ray reflectance measured at Cu–Ka ~8.047 keV,
1.54 Å! was also sensitive to subsurface polishingdamage and density gradients in the surface layer,
which were particularly pronounced for ductile ma-terials such as fused silica, Zerodur, and BK-7 glass,so the x-ray roughness did not correlate so well withthe topographic measurements. X-ray specular re-flectance for silicon carbide was not measured at Cu–Ka. Surface roughness is particularly important
hen the optics are to be used in high-power-densitypplications, for example, in undulator synchrotronadiation beam lines, x-ray laser cavities, and laserlasmas, in which subsurface density gradients mayelax and severely degrade the performance of theptics. Measurements made at two energies withifferent penetration depths are valuable to exposeubsurface defects. Because multilayer dielectricoatings deposited upon substrates contour theoughness of the substrates as well as add additionalne-grained roughness, the results of this study cane used as a starting point for calculating the specu-ar reflectance and diffuse scattering at grazing inci-ence from multilayer-coated mirrors.
The authors thank H. Kobayashi and H. Takeharaf Chubu University for making the precision-groundnd float-polished samples. They also thank H.aga of Nagoya University for assisting with the
-ray measurements. Finally, they thank the ref-ree for providing references to x-ray reflectance andcattering theories. This study was supported inart by a grant-in-aid for scientific research on spe-ially Promoted Research, contract 07102007, fromhe Ministry of Education, Science, Sports and Cul-ure, Japan. G. S. Lodha, J. Yu, and J. M. Bennettere supported by grants from the Japan Society for
he Promotion of Science.
References and Notes1. P. Croce and L. Prod’homme, “Etude par diffusion lumineuse
de la nature des surfaces de verre poli” ~“Light scattering in-vestigation of the nature of polished glass surfaces”!, Nouv.Rev. Opt. 7, 121–132 ~1976!.
2. H. Hogrefe, R.-P. Haelbich, and C. Kunz, “Specular and diffusereflection of soft x-rays from mirrors,” Nucl. Instrum. MethodsPhys. Res. A 246, 198–202 ~1986!.
3. H. Hogrefe and C. Kunz, “Soft x-ray scattering from roughsurfaces: experimental and theoretical analysis,” Appl. Opt.26, 2851–2859 ~1987!.
4. Y. Matsui, M. P. Ulmer, and P. Z. Takacs, “X-ray and opticalprofiler analysis of electroformed x-ray optics,” Appl. Opt. 27,1558–1563 ~1988!.
5. D. L. Windt, W. K. Waskiewicz, and J. E. Griffith, “Surfacefinish requirements for soft x-ray mirrors,” Appl. Opt. 33,2025–2031 ~1994!.
6. J. V. Bixler, C. W. Mauche, C. J. Hailey, and L. Madison,“Reflectivity and scattering measurements of an AdvancedX-ray Astrophysics Facility test coating sample,” Appl. Opt. 34,6542–6551 ~1995!.
7. J. I. Larruquert, J. A. Mendez, and J. A. Aznarez, “Far-ultraviolet reflectance measurements and optical constants ofunoxidized aluminum films,” Appl. Opt. 34, 4892–4899 ~1995!.
8. J. I. Larruquert, J. A. Mendez, and J. A. Aznarez, “Opticalconstants of aluminum films in the extreme ultraviolet inter-val of 82–77 nm,” Appl. Opt. 35, 5692–5697 ~1996!.
9. A. M. Clark, R. J. Bruni, S. E. Romaine, D. A. Schwartz, L. P.Van Speybroeck, P. W. Yip, A. J. Drehman, and A. P. Sha-piro, “Correlation between x-ray reflectivity measurements
1 August 1998 y Vol. 37, No. 22 y APPLIED OPTICS 5251
and surface roughness of AXAF coated witness samples,” in
1
20. M. Born and E. Wolf, Principles of Optics, 6th ed. ~Pergamon,
5
Multilayer and Grazing Incidence X-RayyEUV Optics III,R. B. Hoover and A. B. Walker, Jr., eds., Proc. SPIE 2805,268–276 ~1996!.
10. W. Weber and B. Lengeler, “Diffuse scattering of hard x raysfrom rough surfaces,” Phys. Rev. B 46, 7953–7956 ~1992!.
11. A. Duparre and S. Jakobs, “Combination of surface character-ization techniques for investigating optical thin-film compo-nents,” Appl. Opt. 35, 5052–5058 ~1996!.
12. L. G. Parratt, “Surface studies of solids by total reflection ofx-rays,” Phys. Rev. 95, 359–369 ~1954!.
3. L. Nevot and P. Croce, “Caracterisation des surfaces par re-flexion rasante de rayons X. Application a l’etude du polis-sage de quelques verres silicates” ~“Characterization ofsurfaces by grazing incidence x-ray reflection. Application tothe polishing study of several silicate glasses”!, Rev. Phys.Appl. ~France! 15, 761–779 ~1980!.
14. T. P. Russell, “X-ray and neutron reflectivity for the investi-gation of polymers,” Mater. Sci. Rep. 5, 171–271 ~1990!, andreferences therein.
15. D. K. G. de Boer, “Influence of the roughness profile on thespecular reflectivity of x rays and neutrons,” Phys. Rev. B 49,5817–5820 ~1994!.
16. Seiko Instruments, Inc., 1-8 Nakase, Mihama-ku, Chiba-shi,Chiba, 261 Japan.
17. J. M. Bennett and L. Mattsson, Introduction to Surface Rough-ness and Scattering ~Optical Society of America, Washington,D.C., 1989!, p. 20.
18. Y. Namba, R. Wada, K. Unno, and A. Tsuboi, “Ultra-precisionsurface grinder having a glass-ceramic spindle of zero-thermalexpansion,” Ann. CIRP 38, 331–334 ~1989!.
19. Y. Namba, H. Tsuwa, and R. Wada, “Ultra-precision float pol-ishing machine,” Ann. CIRP 36, 211–214 ~1987!.
252 APPLIED OPTICS y Vol. 37, No. 22 y 1 August 1998
New York, 1980!, pp. 47–48.21. B. L. Henke, E. M. Gullikson, and J. C. Davis, “X-ray interac-
tions: photoabsorption, scattering, transmission, and reflec-tion at E 5 50–30 000 eV, Z 5 1–92,” At. Data Nucl. DataTables 54, 181–342 ~1993!.
22. R. W. James, The Optical Principles of the Diffraction ofX-Rays ~Cornell U. Press, Ithaca, N.Y., 1965!, p. 138.
23. W. J. Tropf, M. E. Thomas, and T. J. Harris, “Properties ofcrystals and glasses,” in Handbook of Optics, Volume II De-vices, Measurements, and Properties, M. Bass, ed. ~McGraw-Hill, New York, 1995!, Vol. II, Chap. 33, Tables 7–9.
24. P. Beckmann and A. Spizzichino, The Scattering of Electro-magnetic Waves from Rough Surfaces ~Pergamon, London,1963!.
25. H. E. Bennett and J. O. Porteus, “Relation between surfaceroughness and specular reflectance at normal incidence,” J.Opt. Soc. Am. 51, 123–129 ~1961!.
26. Ref. 17, pp. 51–53, and references cited therein.27. H. Kunieda, S. Hayakawa, T. Hirano, T. Kii, F. Nagase, N.
Sato, Y. Tawara, F. Makino, and K. Yamashita, “Roughnessmeasurement of x-ray mirror surfaces,” Jpn. J. Appl. Phys. 25,1292–1299 ~1986!.
28. E. L. Church, H. A. Jenkinson, and J. M. Zavada, “Measure-ment of the finish of diamond turned metal surfaces by differ-ential light scattering,” Opt. Eng. 16, 360–374 ~1977!.
29. Ref. 17, pp. 27–31, 44–55.30. J. M. Bennett, Y. Namba, J. M. Guerra, J. Jahanmir, T. L.
Balter, and J. C. Podlesny, “Topographic measurements ofprecision-ground optical glasses,” Appl. Opt. 36, 2211–2216~1997!.
31. Ref. 17, pp. 48–50, 57–68.
Related Documents