Effect of MRI Acoustic Noise on Cerebral Fludeoxyglucose Uptake in Simultaneous MR-PET Imaging Daniel B. Chonde, SB,*Þ Nasreddin Abolmaali, MD,þ Grae Arabasz, RT(N),* Alexander R. Guimaraes, MD, PhD,* and Ciprian Catana, MD, PhD* Abstract: Integrated scanners capable of simultaneous positron emission to- mography (PET) and magnetic resonance imaging (MRI) data acquisition are now available for human use. Although the scanners’ manufacturers have made substantial efforts to understand and minimize the mutual electromagnetic interference between the 2 modalities, the potential physiological inference has not been evaluated. In this study, we have studied the influence of the acoustic noise produced by the magnetic resonance (MR) gradients on brain fludeoxyglucose (FDG) uptake in the Siemens MR-BrainPET prototype. Al- though particular attention was paid to the primary auditory cortex (PAC), a brain-wide analysis was also performed. Methods: The effects of the MR on the PET count rate and image quanti- fication were first investigated in phantoms. Next, 10 healthy volunteers underwent 2 simultaneous FDG-PET/MR scans in the supine position with the FDG injection occurring inside the MR-BrainPET, alternating between a ‘‘quiet’’ (control) environment in which no MR sequences were run during the FDG up- take phase (the first 40 minutes after radiotracer administration) and a ‘‘noisy’’ (test) environment in which MR sequences were run for the entire time. Cortical and subcortical regions of interest were derived from the high-resolution morpho- logical MR data using FreeSurfer. The changes in the FDG uptake in the FreeSurfer-derived regions of interest between the 2 conditions were analyzed from parametric and static PET images, and on a voxel-by-voxel basis using SPM8 and FreeSurfer. Results: Only minimal to no electromagnetic interference was observed for most of the MR sequences tested, with a maximum drop in count rate of 1.5% and a maximum change in the measured activity of 1.1% in the corre- sponding images. The region of interestYbased analysis showed statistically sig- nificant increases in the right PAC in both the parametric (9.13% [4.73%]) and static (4.18% [2.87%]) images. The SPM8 analysis showed no statistically sig- nificant clusters in any images when a P G 0.05 (corrected) was used; however, a P G 0.001 (uncorrected) resolved bilateral statistically significant clusters of in- creased FDG uptake in the area of the PAC for the parametric image (left, 8.37% [1.55%]; right, 8.20% [1.17%]) but only unilateral increase in the static image (left, 8.68% [3.89%]). Conclusions: Although the operation of the BrainPET prototype is virtually unaffected by the MR scanner, the acoustic noise produced by the MR gradi- ents causes a focal increase in the FDG uptake in the PAC, which could affect the interpretation of pathological (or brain-activationYrelated) changes in the FDG uptake in this region if the expected effects are of comparable amplitude. Key Words: PET, MRI, multimodality imaging, physiological interference, auditory cortex (Invest Radiol 2013;48: 302Y312) I ntegrated systems that simultaneously acquire magnetic resonance imaging (MRI) and positron emission tomographic (PET) data have recently become a reality for human imaging. 1,2 The quantita- tive nature of PET, which provides the absolute radiotracer concentra- tion in a specific voxel, can provide complementary information to structural MRI and can be combined with simultaneously collected functional MRI (fMRI) data. Similarly, the magnetic resonance (MR) information can be used for PET motion, 3 attenuation, 4Y6 partial volume effects correction, 7 and image-based arterial input function estimation, 8 to give just a few examples. In addition to these methodological oppor- tunities, simultaneous MR-PET systems will directly benefit patients who need both examinations because they will observe shorter total scan time. Simultaneous MR-PET systems are a result of considerable advances in both technologies. Although significant work has been done to address the hardware integration and to minimize the electro- magnetic interference, there are other aspects that have to be consid- ered in an integrated scanner. For example, the potential ‘‘physiologic interference’’ in a combined system (the influence of 1 modality on the biological process measured by the other) has not been thorough- ly investigated. Although the effects of static and varying magnetic fields on the resting brain’s metabolic activity have been studied, 9,10 others sources remain and must be understood for the validation of simultaneous MR-PET as a clinical tool. One potential source, for ex- ample, is the MR gradient-induced acoustic noise stimulating the au- ditory pathways of the brain. The MR-PETenvironment is significantly different from the tra- ditional PET environment; for routine clinical brain fludeoxyglucose (FDG)-PET studies, it is common practice to isolate the patient in a quiet environment for the initial uptake phase. 11 Because acquiring MR data during this phase would shorten the total MR-PET scan duration and could directly benefit PET (eg, motion correction), it is desirable to ad- minister the radiotracer on the table and perform MR immediately after radiotracer administration. However, the repetitive acoustic noise char- acteristic to the MR environment can reach as high as 131 dB, 12 which causes neuronal simulation of the primary auditory cortex (PAC), lead- ing to focal increase in blood flow and glucose consumption. 13 Using fMRI techniques, MR acoustic noise has been shown to directly stimu- late the PAC, requiring the development of specialized paradigms to minimize signal artifacts when studying the PAC. 14Y16 Unlike fMRI, whose time course is on the order of seconds for the measurement of a stimulus and thus allows for special data collection paradigms, FDG has an uptake on the order of tens of minutes and is influenced by any changes experienced over this time frame. Because FDG-PET nonspecifically images glucose uptake, the acoustic noise could po- tentially lead to artifacts in the form of focal uptake of FDG. These artifacts could, in turn, significantly impact the FDG-PET metabolic patterns observed in PET studies. ORIGINAL ARTICLE 302 www.investigativeradiology.com Investigative Radiology & Volume 48, Number 5, May 2013 Received for publication August 9, 2012; and accepted for publication, after revi- sion, December 17, 2012. From the *Athinoula A. Martinos Center for Biomedical Imaging, Department of Radiology, Massachusetts General Hospital and Harvard Medical School, Charlestown; †Program in Biophysics, Harvard University, Cambridge, MA; and ‡Biological and Molecular Imaging, OncoRay-National Center for Radia- tion Research in Oncology, University Clinics Carl Gustav Carus, Dresden, Germany. Conflicts of interest and sources of funding: Supported by grants R01CA137254- 01A1, 5T32GM008313, 5T90DA022759-05, and T32EB001680 from the National Institutes of Health, Bethesda, MD. N.A. was supported by BMBF grant 03ZIK042 from the German Federal Ministry of Education and Science, Berlin, Germany. Reprints: Daniel B. Chonde, SB, Massachusetts General Hospital, Charlestown, MA. E-mail: [email protected]. Copyright * 2013 by Lippincott Williams & Wilkins ISSN: 0020-9996/13/4805Y0302 Copyright © 2013 Lippincott Williams & Wilkins. Unauthorized reproduction of this article is prohibited.

Welcome message from author
This document is posted to help you gain knowledge. Please leave a comment to let me know what you think about it! Share it to your friends and learn new things together.
Transcript

Effect of MRI Acoustic Noise on Cerebral Fludeoxyglucose Uptakein Simultaneous MR-PET Imaging
Daniel B. Chonde, SB,*Þ Nasreddin Abolmaali, MD,þ Grae Arabasz, RT(N),*Alexander R. Guimaraes, MD, PhD,* and Ciprian Catana, MD, PhD*
Abstract: Integrated scanners capable of simultaneous positron emission to-mography (PET) and magnetic resonance imaging (MRI) data acquisitionare now available for human use. Although the scanners’ manufacturers havemade substantial efforts to understand and minimize the mutual electromagneticinterference between the 2 modalities, the potential physiological inference hasnot been evaluated. In this study, we have studied the influence of the acousticnoise produced by the magnetic resonance (MR) gradients on brainfludeoxyglucose (FDG) uptake in the Siemens MR-BrainPET prototype. Al-though particular attention was paid to the primary auditory cortex (PAC), abrain-wide analysis was also performed.Methods: The effects of the MR on the PET count rate and image quanti-fication were first investigated in phantoms. Next, 10 healthy volunteersunderwent 2 simultaneous FDG-PET/MR scans in the supine position with theFDG injection occurring inside the MR-BrainPET, alternating between a ‘‘quiet’’(control) environment in which no MR sequences were run during the FDG up-take phase (the first 40 minutes after radiotracer administration) and a ‘‘noisy’’(test) environment in which MR sequences were run for the entire time. Corticaland subcortical regions of interest were derived from the high-resolutionmorpho-logical MR data using FreeSurfer. The changes in the FDG uptake in theFreeSurfer-derived regions of interest between the 2 conditions were analyzedfrom parametric and static PET images, and on a voxel-by-voxel basis usingSPM8 and FreeSurfer.Results: Only minimal to no electromagnetic interference was observed formost of the MR sequences tested, with a maximum drop in count rate of1.5% and a maximum change in the measured activity of 1.1% in the corre-sponding images. The region of interestYbased analysis showed statistically sig-nificant increases in the right PAC in both the parametric (9.13% [4.73%]) andstatic (4.18% [2.87%]) images. The SPM8 analysis showed no statistically sig-nificant clusters in any images when a P G 0.05 (corrected) was used; however,a P G 0.001 (uncorrected) resolved bilateral statistically significant clusters of in-creased FDG uptake in the area of the PAC for the parametric image (left, 8.37%[1.55%]; right, 8.20% [1.17%]) but only unilateral increase in the static image(left, 8.68% [3.89%]).Conclusions: Although the operation of the BrainPET prototype is virtuallyunaffected by the MR scanner, the acoustic noise produced by the MR gradi-ents causes a focal increase in the FDG uptake in the PAC, which could affectthe interpretation of pathological (or brain-activationYrelated) changes in theFDG uptake in this region if the expected effects are of comparable amplitude.
Key Words: PET, MRI, multimodality imaging, physiological interference,auditory cortex
(Invest Radiol 2013;48: 302Y312)
Integrated systems that simultaneously acquire magnetic resonanceimaging (MRI) and positron emission tomographic (PET) data
have recently become a reality for human imaging.1,2 The quantita-tive nature of PET, which provides the absolute radiotracer concentra-tion in a specific voxel, can provide complementary information tostructural MRI and can be combined with simultaneously collectedfunctional MRI (fMRI) data. Similarly, the magnetic resonance (MR)information can be used for PETmotion,3 attenuation,4Y6 partial volumeeffects correction,7 and image-based arterial input function estimation,8
to give just a few examples. In addition to these methodological oppor-tunities, simultaneousMR-PET systemswill directly benefit patientswhoneed both examinations because they will observe shorter total scan time.
Simultaneous MR-PET systems are a result of considerableadvances in both technologies. Although significant work has beendone to address the hardware integration and to minimize the electro-magnetic interference, there are other aspects that have to be consid-ered in an integrated scanner. For example, the potential ‘‘physiologicinterference’’ in a combined system (the influence of 1 modality onthe biological process measured by the other) has not been thorough-ly investigated. Although the effects of static and varying magneticfields on the resting brain’s metabolic activity have been studied,9,10
others sources remain and must be understood for the validation ofsimultaneous MR-PET as a clinical tool. One potential source, for ex-ample, is the MR gradient-induced acoustic noise stimulating the au-ditory pathways of the brain.
The MR-PETenvironment is significantly different from the tra-ditional PET environment; for routine clinical brain fludeoxyglucose(FDG)-PET studies, it is commonpractice to isolate the patient in a quietenvironment for the initial uptake phase.11 Because acquiring MR dataduring this phase would shorten the total MR-PET scan duration andcould directly benefit PET (eg, motion correction), it is desirable to ad-minister the radiotracer on the table and perform MR immediately afterradiotracer administration. However, the repetitive acoustic noise char-acteristic to the MR environment can reach as high as 131 dB,12 whichcauses neuronal simulation of the primary auditory cortex (PAC), lead-ing to focal increase in blood flow and glucose consumption.13 UsingfMRI techniques, MR acoustic noise has been shown to directly stimu-late the PAC, requiring the development of specialized paradigms tominimize signal artifacts when studying the PAC.14Y16 Unlike fMRI,whose time course is on the order of seconds for the measurement ofa stimulus and thus allows for special data collection paradigms, FDGhas an uptake on the order of tens of minutes and is influenced byany changes experienced over this time frame. Because FDG-PETnonspecifically images glucose uptake, the acoustic noise could po-tentially lead to artifacts in the form of focal uptake of FDG. Theseartifacts could, in turn, significantly impact the FDG-PET metabolicpatterns observed in PET studies.
ORIGINAL ARTICLE
302 www.investigativeradiology.com Investigative Radiology & Volume 48, Number 5, May 2013
Received for publication August 9, 2012; and accepted for publication, after revi-sion, December 17, 2012.
From the *Athinoula A. Martinos Center for Biomedical Imaging, Department ofRadiology, Massachusetts General Hospital and Harvard Medical School,Charlestown; †Program in Biophysics, Harvard University, Cambridge, MA;and ‡Biological and Molecular Imaging, OncoRay-National Center for Radia-tion Research in Oncology, University Clinics Carl Gustav Carus, Dresden,Germany.
Conflicts of interest and sources of funding: Supported by grants R01CA137254-01A1, 5T32GM008313, 5T90DA022759-05, and T32EB001680 from theNational Institutes of Health, Bethesda, MD.
N.A. was supported by BMBF grant 03ZIK042 from the German Federal Ministryof Education and Science, Berlin, Germany.
Reprints: Daniel B. Chonde, SB, Massachusetts General Hospital, Charlestown,MA. E-mail: [email protected].
Copyright * 2013 by Lippincott Williams & WilkinsISSN: 0020-9996/13/4805Y0302
Copyright © 2013 Lippincott Williams & Wilkins. Unauthorized reproduction of this article is prohibited.
This pilot study sought to characterize any regional changes inFDG uptake resulting from MR acoustic noise and set an upper limiton its effect. As a first step, phantom experiments were performed toassess the hardware-related effects (ie, electromagnetic interferenceand MR eddy-currentYinduced heating) on the PET data acquisitionusing our standard MR protocol. Next, advanced data analysis toolswere used to compare the FDG-PET data acquired with and withoutrunning MR sequences during the FDG uptake phase in healthy volun-teers who underwent 2 MR-PET imaging sessions. Although particularattention was paid to the primary auditory cortex and associated areas,an explorative analysis of the entire brain was also performed.
MATERIALS AND METHODS
Integrated MR-PET ScannerThe imaging studies were performed on a 3-T TimMAGNETOM
Trio MR scanner (Siemens Healthcare, Inc) modified to support theBrainPET (Siemens), an MR-compatible brain-dedicated PET scannerprototype. The BrainPET, which uses magnetic-fieldYinsensitive av-alanche photodiodes in combination with lutetium oxyorthosilicatecrystals as photodetectors, has a transaxial/axial field of view of32/19.125 cm. Three-dimensional (3D) coincidence event data arecollected with a maximum ring difference of 67 and stored in a list-mode format. For reconstruction, the list mode files are sorted intoline-of-response space and further compressed into sinogram space(span, 9). The PET data are reconstructed with a standard 3D ordinaryPoisson ordered-subset expectation maximization algorithm using bothprompt and variance-reduced random coincidence events17 as well asnormalization, scatter,18 and attenuation sinograms. The attenuationsinograms are derived from dual-echo ultrashort echo time (DUTE)MR images.4 The data are reconstructed with a voxel size of 1.25-mmisotropic into a volume consisting of 153 transverse slices of 256 �256 pixels. The volumes are smoothed using a 3D filter with a 3-mmisotropic Gaussian kernel.
Magnetic resonance imaging was performed using 2 concentrichead coils: an outer circularly polarized transmit-receive coil and an inner8-channel receive-only coil specially designed for the BrainPET withconsiderations for their 511-keV photon attenuation properties. In thisstudy, we focused on theMR sequences that are part of our standard braintumor imaging research protocol. In addition to the localizer,these includ-ed the following: T2-prepared variable flip angle turbo spin echo (T2-SPACE) (0.9-mm isotropic; repetition time [TR]/echo time [TE], 3200/487 milliseconds; and acquisition time, 4:43 minutes), flow-attenuatedinversion recovery with turbo spin echo readout (1.1 � 0.9 � 5 mm3;TR/TE/inversion time [TI], 10000/70/2500 milliseconds; flip angle[FA], 150 degrees; and TA, 3 minutes and 2 seconds), DUTE (1.67-mmisotropic; TR/TE1/TE2, 200/0.07/2.24 milliseconds; FA, 10 degrees;and TA, 3 minutes and 20 seconds), blood oxygen levelYdependentT2*-weighted echo planar imaging (3.4 � 3.4 � 8 mm3; TR/TE,2000/19; FA, 90 degrees; and TA, 14 minutes and 6 seconds), time-of-flight MR angiography (0.7 � 0.5 � 0.7 mm3; TR/TE, 24/3.68milliseconds; FA, 18 degrees; and TA, 6 minutes and 16 seconds),multiecho spoiled gradient echo sequence (2-mm isotropic; TR/TE1/TE2/TE3/TE4, 2.46/4.92/7.38/9.84 milliseconds; and TA, 2 minutesand 28 seconds), mapping T1 relaxation effects with multiple inversionrecovery (T1 mapping) (1.8-mm isotropic; TR/TE, 7.3/4.41 millisec-onds; FA, 15 degrees; and TA, 13 seconds), dynamic contrast enhance-ment (DCE) imaging with T1-weighted gradient echo imaging (2.6 �1.8 � 2.1 mm3; TR/TE1/TE2, 6.8/2.6/3.89 milliseconds; FA, 10degrees; and TA, 5 minutes and 59 seconds), diffusion tensor imagingwith diffusion-weighted spin echo echo-planar imaging (1.9-mm isotro-pic; TR/TE, 7990/84 millseconds; TA, 6 minutes and 57 seconds),and multiple echo magnetizationYprepared gradient echo imaging(ME-MPRAGE) (1-mm isotropic; TR/TI/TE, 2530/1200/1.64 millisec-onds; flip angle, 7 degrees; and TA, 4 minutes and 56 seconds).
Phantom StudiesThe phantom experiments were first performed to evaluate the
effect of running MR sequences on the PET data acquisition. Partic-ular attention was given to temperature effects because it is knownthat the performance of the avalanche photodiodes is a strong func-tion of temperature. The BrainPET manages temperature changesusing 2 mechanisms. The first mechanism is a hardware-based tem-perature controller that activates a closed-loop chiller. When sensorsin the cassettes measure temperatures outside the optimal operatingrange, the chiller is activated, providing a heat sink for the forced air thatdirectly cools the cassettes. The second mechanism is a software-basedphotopeak tracking algorithm, which adjusts the crystals’ 511-keVphotopeak position on the basis of the cassette’s temperature. For thesemeasurements, a uniform cylindrical Ga-68/Ge-68 phantom (SiemensHealthcare, Inc) (È5 MBq, 25-cm length, 20-cm inner diameter) wasplaced inside the head coil and simultaneous MR-PET imaging wasperformed using the MR protocol described previously. The PET datathat were acquired in a list-mode format for 1 hour and 30 second frameswere subsequently generated. From the prompt and delayed events, totaltrue coincident events were determined for each frame. The measure-mentswere repeated 5 times. To determine the reproducibility, each framewas normalized to the mean number of counts per 30 second that trial.Relative change from the count averaged baseline and the difference be-tween the minimum and maximum values were determined. To evaluatechanges in the reconstructed images, 300-second frames werereconstructed and the maximum relative change from the mean was de-termined over the imaging session. For comparison, the same experi-ment was also performed with the software photopeak tracking featuredisabled.
Human Volunteer Studies
Volunteer SelectionTen healthy volunteers (10 males; mean [SD] age, 38.6 [11.2]
years) were enrolled in this study. The mean (SD) height and weightamong the volunteers were 181.4 (5.1) cm and 88.9 (22.1) kg, respec-tively. All volunteers gave written informed consent and were studiedin accordance with a protocol approved by the affiliated institutionalreview board. The volunteers were asked to follow a similar routinefor 24 hours before each scan to minimize metabolic changes be-tween imaging sessions which included fasting for at least 6 hoursbefore the injection. Immediately before the imaging, the volunteers’blood glucose levels were measured. The mean (SD) blood glucoselevels for the control and stimulation environments were 103.9(6.57) g/dL and 103.9 (9.29) g/dL, respectively; the mean (SD) differ-ence between visits 1 and 2 was 0.00 (5.79) g/dL.
Data Acquisition ProtocolBecause of the relatively long half-life of FDG (110 minutes),
to minimize residual uptake, the volunteers underwent simultaneousFDG-PET/MR imaging on 2 consecutive days, alternating betweenMR ‘‘quiet’’ (control) and ‘‘noisy’’ (stimulation) environments. Thevolunteers were divided equally into 2 groups: 1 group undergoingthe control environment on day 1 and the noisy environment onday 2, whereas the other group had the order reversed. Before PETdata collection in either environment, an MR localizer was run to as-sess the volunteer’s position in the field of view. Next, after the PETdata collection was initiated, approximately 185 MBq of FDG wasadministered intravenously, allowing for dynamic PET imaging. Inthe control condition (ie, no MR acoustic noise during the FDG up-take phase), no MR sequences were run for the first 40 minutes ofthe PET data acquisition. Subsequently, the ME-MPRAGE andDUTE sequences were run for deriving regions of interest (ROIs)and the attenuation correction map, respectively. For the noisy/auditory
Investigative Radiology & Volume 48, Number 5, May 2013 MR-Induced Physiologic Effects on Cerebral FDG-PET
* 2013 Lippincott Williams & Wilkins www.investigativeradiology.com 303
Copyright © 2013 Lippincott Williams & Wilkins. Unauthorized reproduction of this article is prohibited.
stimulation environment, the MR sequences that make up our standardbrain tumor imaging protocol were run immediately after the FDGinjection (ie, MR acoustic noise was present during the FDG uptakephase). As per required protocol, standard earplugs with a noise re-duction rating of 29 dB were used in both environments; however,the acoustic noise of the MR scanner remained clearly audible tothe volunteers.
Data AnalysisVoxelwise and ROI-based analyses were performed to identify
potential effects of the MR on the FDG uptake in the brain by evalu-ating the following:& time activity curves derived from dynamic (4-dimensional [4-D])PET data with a framing of 8 � 60 seconds, 2 � 150 seconds, 2 �180 seconds, and 8 � 300 seconds;
& local cerebral metabolic rate of glucose (LCMRGlu) parametricimages derived from the first 40 minutes of dynamic data using themethod presented by Wu19 and Monden et al20;
& static images reconstructed from the data acquired 40 to 60 minutesafter the injection (similar to a static FDG-PET scan). StandardizedUptake Values (SUVs) corrected for lean body mass (SUVlbm) werecalculated in each environment.
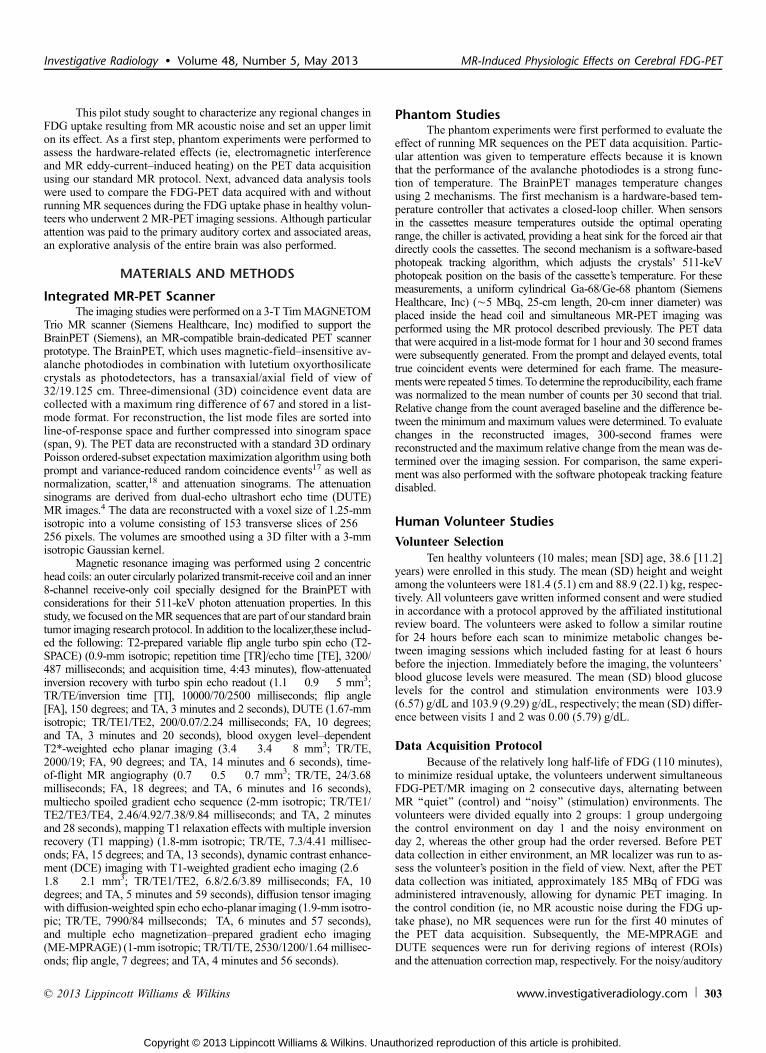
In addition to voxelwise statistical analysis using StatisticalParametric Mapping (SPM8; Wellcome Department of Cognitive Neu-rology, London, England),21 FreeSurfer 22 was used for both the voxelwiseanalysis and the automatic segmentation of volunteer-specific ROIs cor-responding to cortical and subcortical structures. These ROIs were usedfor the PET data analysis as described in the following subsections.Global whole brain and gray and white matter mean values were alsocomputed. A diagram of the experimental design, processing, and thesubsequent analysis can be found in Figure 1.
Time Activity Curves Analysis
For the analysis of the dynamic PET data, time activity curveswere defined as the mean within an ROI at each time point with thestandard deviation defined as the intervolunteer standard deviation.To determine the effect of gradient acoustic noise on the PAC (labeledin FreeSurfer as the superior transverse temporal gyrus), the left andright PACs were combined to yield a single ROI. For each time pointacross the volunteers, the brain ROIs were normalized to whole brainand then averaged over the volunteer population. The mean uptake forthe control and stimulation environments for each time point were thencompared with one another using a paired, 2-sample Student t test.
SPM-Based Analysis
Because SPM8 does not provide volunteer-specific definition ofcortical and subcortical structures, group analysis requires that the volun-teers are first registered to a common space using nonrigid transforma-tions. For the SPM8 analysis, the common space to which the imageswere normalized was the Montreal Neurological Institute (MNI) PETcontrast template (subsequently referred to as MNI-normalized). To de-rive the transformation fields to MNI space, a smoothed (3-mm isotropicGaussian kernel) version of the individual PET images was fit using a12-parameter affine transformation, followed by a nonlinear defor-mation using SPM8, and the normalized image was cropped to a vol-ume of 79 � 95 � 68 voxels measuring 2-mm isotropic. Before thestatistical analysis, the MNI-normalized PET images were smoothed(8-mm isotropic Gaussian kernel) using SPM8. A paired t test wasperformed on the data with a cluster size requirement of greater than20 voxels and both an uncorrected P G 0.001 and a familywise-error(FWE) of 0.05 for significance. Anatomic correlation of the PAC, de-fined as the Herschel gyrus for SPM8-based analyses, and more gen-eral cluster location was determined using the Talairach Daemon and
the Automated Anatomical Labeling atlas with the xjView toolboxfor SPM8 (http://www.alivelearn.net/xjview8/) and is described indetail elsewhere.23,24
FreeSurfer ROI-Based Analysis
In the FreeSurfer anatomic segmented output, each voxel is giv-en an integer label corresponding to the segmented region.25 For allFreeSurfer-based analyses, the PAC was determined as the transversetemporal gyrus from the cortical parcellation. Binary masks were gen-erated for each segmented region using Matlab, and the voxel ad-dresses of the ROIs were determined and used to create a lookuptable, which was then applied to the PET image. To account for thedifferences in spatial resolution and the spatial mismatch between the2 scanners, a downsampling operation and an affine transformationwere applied to the segmentation maps using nearest-neighbor inter-polation, and the subsequent analysis was performed in the PETspace. To account for interscan motion, the skull-stripped MPRAGEimage was coregistered to the PET image using a mutual informationalgorithm to derive any additional affine transformations, which, inturn, were applied to the segmentation map before the downsamplingand interpolation.
For the analysis of the parametric and static images, paired2-sample Student t test between the control and stimulation environ-ments were performed across the volunteers for each cortical andsubcortical brain region segmented in FreeSurfer. To normalize thestatic images across the volunteers, the regions were divided by thewhole brain activity (WB-normalized). Because the goal of this studyis to identify any potential regions of significant change, to be conserva-tive, no Bonferroni corrections were included in determining statisticalsignificance (P G 0.05) across the brain regions.
FreeSurfer Generalized Linear ModelYBased Analysis
For the group analysis, FreeSurfer uses a space obtained from‘‘inflating’’ the ME-MPRAGEYderived brain of the individual volun-teer into a sphere and registering it to a reference sphere. From thisregistration, FreeSurfer can map a volunteer’s data onto a reference-inflated brain representing the cortical surface. The same transforma-tions were applied to the PET data, and a surface was derived whereeach vertex value was the mean value along the normal path throughthe cortical ribbon. The volunteer-specific changes were determinedby subtracting the stimulation and control PET images, and a studyaveraged imagewas derived by taking the mean change across the volun-teers. The resulting image was smoothed (10-mm isotropic Gaussiankernel) on the surface of the brain, and a generalized linear model(GLM) analysis was performed. For conservative evaluation, datawere visualized with a P G 0.01, which is equivalent to the defaultthreshold of Ylog(p)=2 used in FreeSurfer.
RESULTS
Phantom StudiesThe normalized count rate versus time and the corresponding
temperature time courses for 5 representative trials with and withoutphotopeak tracking can be found in Figures 2 and 3, respectively,demonstrating very high reproducibility when photopeak trackingwas either enabled or disabled. With the photopeak tracking enabled,the maximum change in count rate was less than 1.5%. Reconstructingthese data into 300-second frames yielded a maximum drop of 1.08%(0.39%) in a large ellipsoidal ROI. This drop in counts occurred duringsimultaneous DCE imaging, and shortly after the DCE imaging wasconcluded, the count rate returned to baseline. When the photopeaktracking was disabled, the normalized count rate decreased linearlywith time with a maximum change from baseline to the order of 25%.Comparatively, the DCE imaging did not seem to have as proportionally
Chonde et al Investigative Radiology & Volume 48, Number 5, May 2013
304 www.investigativeradiology.com * 2013 Lippincott Williams & Wilkins
Copyright © 2013 Lippincott Williams & Wilkins. Unauthorized reproduction of this article is prohibited.
strong of an influence on the count rate when the photopeak trackingwas disabled.
Human Volunteer Studies
Time Activity CurvesA total of 105 cortical and subcortical regions of the brain
were automatically segmented from the ME-MPRAGE image usingFreeSurfer and were subsequently used for the ROI-based analyses. Arepresentative volunteer’s segmentation, along with the ME-MPRAGEimage, can be found in Figure 4. The combined left and right PACROI had a mean (SD) volumetric change of 0.157 (0.196) mL betweenthe 2 visits (P = 0.21). A representative volunteer’s time activity curvesfor the PAC, motor cortex (M1), and white matter for the control andstimulation environments can be found in Figure 5. As previously men-tioned, for the time activity curve analysis, the PAC and white mattertime points were normalized to whole brain and averaged across the
patients to create a group time activity curve, which can be foundin Figure 5. A paired t test for each cross-volunteer time point yieldedno significant points (P G 0.05) for the whole brain, the white mater,or the PAC for the non-WBYnormalized images; however, a pairedt test of the WB-normalized PAC showed significant differences at alltime points after 270 seconds.
Parametric ImagesThe mean (SD) uptake in the whole brain for the stimulation
and control environments was 22.993 (0.005) Kmol/min per 100 gand 22.997 (0.005) Kmol/min per 100 g, respectively, with a mean(SD) change of j0.004 (0.006) Kmol/min per 100 g (P = 0.0643).The mean (SD) uptake in the gray matter for the stimulation and con-trol environments was 26.577 (0.492) Kmol/min per 100 g and26.515 (0.425) Kmol/min per 100 g, respectively, with a mean (SD)change of 0.0625 (0.4182) Kmol/min per 100 g (P = 0.648). The
FIGURE 1. Design of paradigm: data processing and analysis. The volunteers were scanned on 2 separate days in either a quietcontrol environment or a stimulation environment withMR acoustic noise present during the FDG uptake phase. The data processingsteps are identical in both environments and are only shown for the control environment for simplicity. Similarly, the analysis ofthe static and parametric PET images was identical. Ovals represent raw list-mode PET data. Squares represent images, wheregreen are PET and purple are MR. Triangles represent processes (eg, image reconstruction) and green, purple, and black denotethat only PET, MR, or combined MR-PET data, respectively, were used as inputs. Only ROI-based analysis was performed on thetime activity curves.
Investigative Radiology & Volume 48, Number 5, May 2013 MR-Induced Physiologic Effects on Cerebral FDG-PET
* 2013 Lippincott Williams & Wilkins www.investigativeradiology.com 305
Copyright © 2013 Lippincott Williams & Wilkins. Unauthorized reproduction of this article is prohibited.

mean (SD) uptake in the white matter for the stimulation and controlenvironments was 20.896 (0.766) Kmol/min per 100 g and 20.877(0.615) Kmol/min per 100 g, respectively, with a mean (SD) changeof 0.019 (0.500)Kmol/min per 100 g (P = 0.907). When tested with apaired t test, none of these regions were found to have P’s G 0.05.
SPM-Based Analysis
The SPM8 analysis using an FWE of 0.05 and a minimumcluster size of 20 voxels yielded no significant activation clusters be-tween the stimulation and control environments. The SPM analysisusing a P G 0.001 (uncorrected) resolved focal bilateral activationclusters, which extended into Herschel’s gyrus and can be found inFigure 6. Both regions were found to have increased metabolism of
glucose in the stimulation environment as compared with the controlenvironment. No regions with significantly decreased metabolismwere detected. The left and right cluster sizes were 45 and 41 voxels witha change between stimulation and control of 2.46 (0.51) Kmol/min per100 g (8.37% T 1.55%) and 2.66 (0.55) Kmol/min per 100 g (8.70% T1.17%), respectively.
FreeSurfer ROI-Based Analysis
The parametric images showed a bilateral increase in PACLCMRGlu in 6 volunteers, with opposing changes in the left andright PAC uptake in the remaining 4. The mean (SD) LCMRGluof the control environment for the left and right PAC glucose metab-olism was found to be 31.631 (1.895) Kmol/min per 100 g and
FIGURE 2. Positron emission tomography count rate fluctuation over the course of the protocol (top) with correspondingtemperature fluctuation (bottom) for 5 independent runs. The highly reproducible drop occurred during the simultaneous MR-DCEimaging. The maximum drop in count rate was less than 1.5% during the duration of the protocol.
FIGURE 3. The PET count rate fluctuation for the same protocol as performed in Figure 2 but without photopeak trackingshows a steady decline in counts during the duration of the protocol. The maximum deviation from the mean count rate is foundto be on the order of 25%, whereas a total change on the order of 45% is observed during the duration of the protocol.
Chonde et al Investigative Radiology & Volume 48, Number 5, May 2013
306 www.investigativeradiology.com * 2013 Lippincott Williams & Wilkins
Copyright © 2013 Lippincott Williams & Wilkins. Unauthorized reproduction of this article is prohibited.

31.734 (1.263) Kmol/min per 100 g, respectively, and 32.952 (2.642)Kmol/min per 100 g and 34.615 (1.683) Kmol/min per 100 g for thestimulation environment. No statistically significant change was foundin the left PAC (1.321 [2.927] Kmol/min per 100 g, 4.42% [9.27%];P = 0.1872); however, a significant increase in the right PAC was noted(2.88 [1.46] Kmol/min per 100 g, 9.13% [4.73%]; P = 0.0002). Whenthe left and right PACs were treated as a single ROI, the mean (SD)change was found to be 2.10 (1.52) Kmol/min per 100 g (6.67%[4.91%]; P = 0.0018).
Statistically significant increases in LCMRglu were found in5 other regions: the long gyrus of the left insula (0.79 [0.89] Kmol/minper 100 g; 3.48% [4.08%]; P = 0.0204), the left superior temporalplane (1.19 [1.16] Kmol/min per 100 g; 4.52% [4.33%]; P =0.0097), the left middle temporal gyrus (0.70 [0.94] Kmol/min per
100 g; 3.14% [4.10%]; P = 0.0429), the right superior temporal plane(1.38 [1.66] Kmol/min per 100 g; 4.94% [5.73%]; P = 0.0279), andthe right transverse temporal sulci (2.92 [3.52] Kmol/min per 100 g;10.03% [12.32%]; P = 0.0277). A statistically significant decrease inthe LCMRglu was found in the right chroid plexus (j1.01 [1.27]Kmol/min per 100 g;j6.66% [8.09%]; P = 0.0336).
FreeSurfer GLM-Based Analysis
The results of the FreeSurfer GLM-based analysis can befound in Figure 7. The surface-based analysis using FreeSurferdisplayed increased metabolism in the left hemisphere’s frontal infe-rior triangular gyrus, superior temporal lateral gyrus extending intothe temporal superior plane, and inferior circular sulci of the insulaextending into the superior transverse temporal gyrus. In addition,
FIGURE 4. Generation of high-resolution ROIs for the PET analysis. The high-resolution ME-MPRAGE (A) is used to generate alabeledmask volume (B) with FreeSurfer, both of which were subsequently resampled to the PET geometry. The labeledmask volumewas then used for automated ROI PET analysis of the 4-D PET images to derive the time activity curves and for analysis of bothparametric (0Y40 minute) images (C) and static (40Y60 minutes) images (D). Unlike the static images, where MPRAGE and UTEwere acquired during the PET acquisition in a similar manner in both the stimulation and control environments, no MR sequenceswere run in the control environment during the time frame used to generate the parametric images.
FIGURE 5. A, Representative volunteer’s time activity curves for both the control (solid line/filled marker) and stimulation (hashedline hollow marker) environments. In addition to the PAC (circle), the motor cortex (M1) (square) and white matter(triangle) are shown for reference. Solid line represents the control environment (no MR performed during the first 40 minutesafter the injection), whereas the dashed lines represent the stimulation environment. B, Whole brain time activity curves, whitematter normalized to WB (C), and PAC time activity curves normalized to white matter (D). Each point represents the mean of the4 volunteers, with error bars representing 1 standard deviation (* represents P G 0.05).
Investigative Radiology & Volume 48, Number 5, May 2013 MR-Induced Physiologic Effects on Cerebral FDG-PET
* 2013 Lippincott Williams & Wilkins www.investigativeradiology.com 307
Copyright © 2013 Lippincott Williams & Wilkins. Unauthorized reproduction of this article is prohibited.

in the left hemisphere, small foci of decreased activation were observedin the postcentral sulci, the occipital middle gyrus, and the inferior an-gular parietal gyrus. The right hemisphere showed increased uptakein the superior transverse temporal gyrus, the superior transverse tem-poral sulci, the temporal superior plane, the opercular part of the inferiorfrontal gyrus, and the H-shaped orbital sulcus and orbital gyrus. The righthemisphere showed a small focus of decreased uptake in the inferior an-gular parietal gyrus.
Static ImageThe mean (SD) uptake in the whole brain for the stimulation
and control environments was 4.127 (0.823) SUVlbm and 4.149(0.624) SUVlbm, respectively, with a mean (SD) change of j0.022(0.856) SUVlbm (P = 0.937). The mean (SD) uptake in the gray mat-ter for the stimulation and control environments was 4.870 (0.954)SUVlbm and 4.90 (0.758) SUVlbm, respectively, with a mean (SD)change of j0.0357 (0.980) SUVlbm (P = 0.911). The mean (SD) up-take in the white matter for the stimulation and control environmentswas 3.617 (0.650) SUVlbm and 3.636 (0.548) SUVlbm, respectively,with a mean (SD) change of j0.019 (0.700) SUVlbm (P = 0.933).The WB-normalized mean (SD) uptake in the gray matter for thestimulation and control environments was 1.180 (0.023) and 1.18
(0.021), respectively, with a mean (SD) change of j0.001 (0.011;P = 0.780). The WB-normalized mean (SD) uptake in the white mat-ter for the stimulation and control environments was 0.880 (0.037)and 0.877 (0.004), respectively, with a mean (SD) change of 0.004(0.017; P = 0.476).
SPM-Based Analysis
The SPM8 analysis using an FWE of 0.05 and a minimumcluster size of 20 voxels yielded no significant activation clusters be-tween the stimulation and control environments. The SPM8 analysisusing a P G 0.001, which can be found in Figure 8, resolved 4 distinctclusters: one within the left Heschel gyrus, one in the right superiortemporal gyrus on the border of Broadman areas 22 and 42, and 2 inthe frontal white matter. The volumes of the clusters in the Heschel gy-rus and the right superior temporal gyrus were 74 and 36 voxels, re-spectively. The mean (SD) change in the left Heschel gyrus was0.100 (0.041) (8.68% [3.89%]) and 0.082 (0.024) (6.75% [1.94%])in the superior temporal gyrus.
FreeSurfer ROI-Based Analysis
The analysis of the static frames revealed a bilateral increase inPAC SUVlbm in 4 volunteers, a bilateral decrease in 1 volunteer, andopposing changes in the left and right PAC in 5 volunteers. The mean
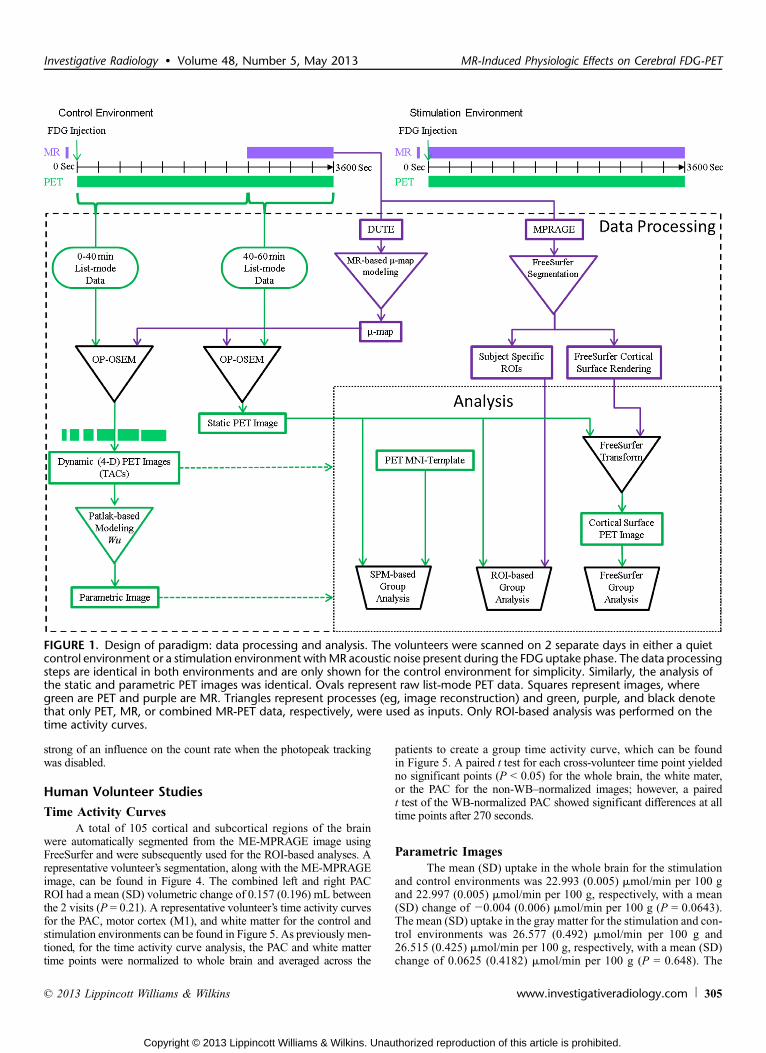
FIGURE 6. An SPM8 glass brain of a parametric image. Cluster analysis performed with P G 0.001 (uncorrected) and aminimum cluster size of 20 voxels (left). Activation is also plotted on 3 orthogonal slices of a single volunteer’s MRI from MNIdatabase (right). Statistically significant increases in CMRGlu are localized to the left and right PAC when a paired t test isperformed on the noisy MR environment (continuous MRI immediately after the FDG injection) versus the quite controlenvironment wherein no MR sequences were run for the first 40 minutes.
FIGURE 7. Cortical FreeSurfer analysis of parametric image generated from dynamic 4-D PET data. Segmented cortical regionsare shown in color. Activation clusters are shown in a hot and cold color scheme corresponding to Z score reflecting statistical increaseor decrease of FDG compared with no change in uptake, respectively. P’s G 0.01 are shown. Clusters of increased uptake arelocalized proximal in and around the PAC.
Chonde et al Investigative Radiology & Volume 48, Number 5, May 2013
308 www.investigativeradiology.com * 2013 Lippincott Williams & Wilkins
Copyright © 2013 Lippincott Williams & Wilkins. Unauthorized reproduction of this article is prohibited.
(SD) FDG uptake for the left and right PAC glucose uptake wasfound to be 5.660 (0.953) SUVlbm and 5.723 (0.837) SUVlbm, respec-tively, for the control environment and 5.766 (1.048) SUVlbm and5.931 (1.187 SUVlbm) for the stimulation environment. After normal-izing the volunteers to their whole-brain activity, 7 volunteers showedbilateral increases in the FDG uptake, whereas the remaining 3 showeda decrease in the left PAC. The WB-normalized mean (SD) uptake orthe left and right PAC glucose uptake was found to be 1.363 (0.084)and 1.381 (0.063), respectively, for the control environment and 1.40(0.083) and 1.438 (0.065) for the stimulation environment. The changebetween the stimulation and control environments for the left and rightPACs was found to be 0.0398 (0.969) (3.17% [7.28%]; P = 0.202) and0.0572 (0.0397) (4.18% [2.87%]; P = 0.001), respectively. When theleft and right PACs were treated as a single ROI, the mean (SD) changewas found to be 0.0485 (0.0437) (3.61% [3.34%]; P = 0.007).
The remaining 103 cortical and subcortical regions of the brainwere evaluated across the volunteers using a paired, 2-sample Studentt test between the control and stimulation environments. Statisticallysignificant regional changes in the normalized brains were found inthe midposterior of the corpus callosum (j0.020 [0.027]; j4.00%[5.23%]; P = 0.0422), the left long gyrus and the central sulcus of theinsula (0.019 [0.021]; 1.94% [2.10%]; P = 0.0186), the left temporalsuperior plane (0.032 [0.036]; 2.80% [3.00%]; P = 0.0188), the leftH-shaped orbital sulcus and orbital gyrus (0.028 [0.034]; 2.11%
[2.53%]; P = 0.027), the right choroid plexus (j0.033 [0.038]; j5.21%[5.78%]; P = 0.022), the right opercular part of the inferior frontal gy-rus (0.024 [0.019]; 1.97% [1.69%]; P = 0.003), and the right superiortransverse temporal gyrus (0.057 [0.040]; 4.18% [2.87%]; P = 0.001).
FreeSurfer GLM-Based Analysis
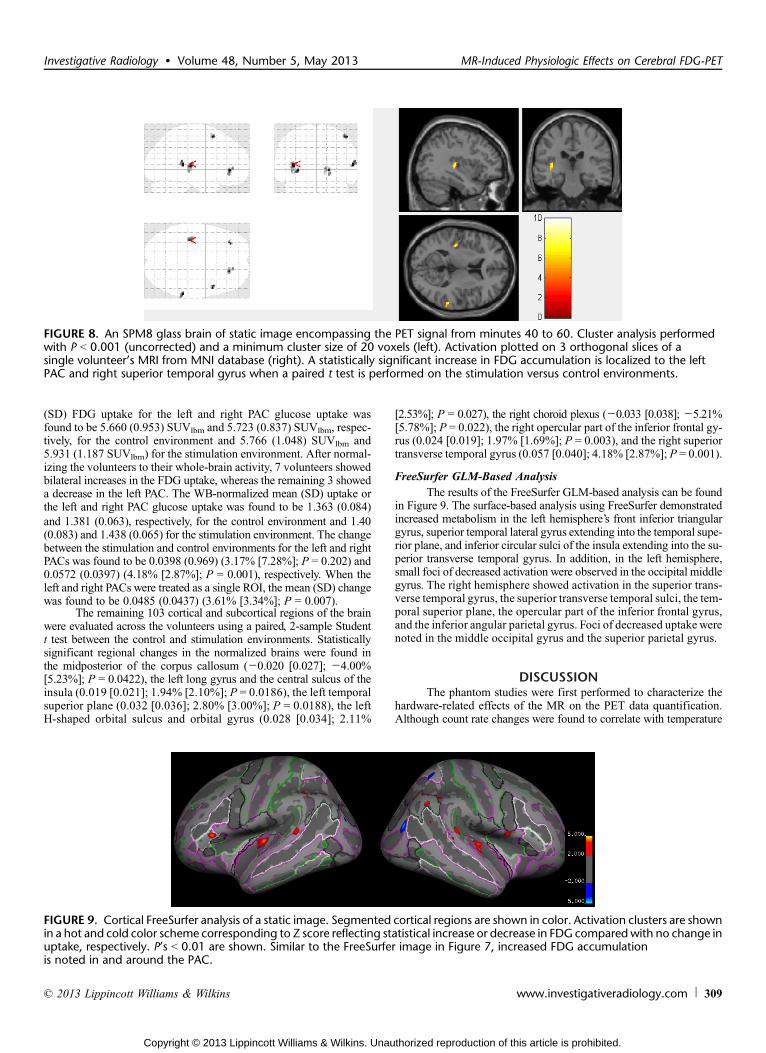
The results of the FreeSurfer GLM-based analysis can be foundin Figure 9. The surface-based analysis using FreeSurfer demonstratedincreased metabolism in the left hemisphere’s front inferior triangulargyrus, superior temporal lateral gyrus extending into the temporal supe-rior plane, and inferior circular sulci of the insula extending into the su-perior transverse temporal gyrus. In addition, in the left hemisphere,small foci of decreased activation were observed in the occipital middlegyrus. The right hemisphere showed activation in the superior trans-verse temporal gyrus, the superior transverse temporal sulci, the tem-poral superior plane, the opercular part of the inferior frontal gyrus,and the inferior angular parietal gyrus. Foci of decreased uptakewerenoted in the middle occipital gyrus and the superior parietal gyrus.
DISCUSSIONThe phantom studies were first performed to characterize the
hardware-related effects of the MR on the PET data quantification.Although count rate changes were found to correlate with temperature
FIGURE 8. An SPM8 glass brain of static image encompassing the PET signal from minutes 40 to 60. Cluster analysis performedwith P G 0.001 (uncorrected) and a minimum cluster size of 20 voxels (left). Activation plotted on 3 orthogonal slices of asingle volunteer’s MRI from MNI database (right). A statistically significant increase in FDG accumulation is localized to the leftPAC and right superior temporal gyrus when a paired t test is performed on the stimulation versus control environments.
FIGURE 9. Cortical FreeSurfer analysis of a static image. Segmented cortical regions are shown in color. Activation clusters are shownin a hot and cold color scheme corresponding to Z score reflecting statistical increase or decrease in FDG comparedwith no change inuptake, respectively. P’s G 0.01 are shown. Similar to the FreeSurfer image in Figure 7, increased FDG accumulationis noted in and around the PAC.
Investigative Radiology & Volume 48, Number 5, May 2013 MR-Induced Physiologic Effects on Cerebral FDG-PET
* 2013 Lippincott Williams & Wilkins www.investigativeradiology.com 309
Copyright © 2013 Lippincott Williams & Wilkins. Unauthorized reproduction of this article is prohibited.
changes, the total count rate changes were found to be relatively insig-nificant. The robust operation of the BrainPET is likely because of itsability to address temperature changes induced in the PET cassettescaused by eddy currents. With both the photopeak tracking softwareand the hardware-based temperature controllers activated, a drop incounts on the order of 1.5% was observed, which was determined tohave little impact on the PET data quantification; however, whenphotopeak tracking was disabled, there was a drop in true counts onthe order of 45%. This severe change suggests that, in addition to thehardware-based temperature control, software-based photopeak track-ing is essential for simultaneous imaging using the BrainPET and evenfor sequential imaging because heat is not immediately dissipated.
The primary purpose of this study was to explore MR physio-logic interference on FDG uptake. Although it is likely not an issuefor most applications, the observed MR-induced increase in FDG up-take in the PAC could have implications for certain studies. For exam-ple, care should be taken when evaluating progression in lesions thatlie near the auditory cortex if MR sequences are run during the uptakephase of the FDG. It is worth noting that both the static and paramet-ric images showed a statically significant decrease in the right choroidplexus uptake. Although the change in FDGuptake of the choroid plexusis likely an artifact because of its small size, whichmakes it susceptible toartifacts arising from motion, studies in rats have reported that intensenoise can lead to cell damage26; however, given the limited body ofexisting work concerning this potential phenomenom, a more extensivestudy is necessary before a correlation should be suggested.
The unintended physiological effects of combining other medi-cal devices with PET have been previously explored. For instance,transcranial magnetic stimulation has been combined with PET to ex-plore in vivo brain connectivity.27Y29 Siebner et al30 found that repet-itive transcranial magnetic stimulation of the sensorimotor hand arealeads to increased FDG uptake in the PAC because of the acousticnoise produced by the transcranial magnetic stimulation hardware.Stimulating the left sensorimotor hand area, they noted a change inthe left and right PAC of 7.2% and 6.6%, respectively, using anROI-based analysis. Although the changes of 8.37% (1.55%) and8.70% (1.17%) reported here are slightly larger, they are consistentwith those presented by Siebner et al,30 especially considering the higherresolution of the BrainPET compared with the Siemens 951 R/31 PETscanner and the smaller smoothing kernel used in this study. Furthermore,Siebner et al30 used 2-cm circular ROIs centered on the peak activa-tion in regions using registered T1-weighted MR images for anatomiclandmarks.31
Direct analysis of the time activity curves, the parametric 0 to40Yminute image, and the static 40 to 60Yminute image illustrate3 different situations that are of importance for evaluating potentialphysiological interference.
First, by distinguishing significant changes in uptake on a frame-by-frame basis, the time activity curve analysis is sensitive to specificMR sequences. The dynamics of FDG uptake in unstimulated brain tis-sue has a predictable time course; any deflections from its smoothprojected trajectory would suggest prior stimulation, and spikes wouldsuggest possible RF interference. The absence of spikes in the wholebrain activity time activity curve (Fig. 4A) and WB-normalized whitematter (Fig. 4B), as determined by serial t tests, suggests a lack of RFinterference (at least for the framing and reconstruction used in ourstudy). This, in turn, suggests that any changes in the FDG uptakeare linked to physiologic changes induced from sources other thanhardware interference. This result is further confirmed by the ROIanalysis of PAC time activity curve where a statistically significantchange between the control and stimulation environments is maintainedacross subsequent time points.
Second, the parametric images, in addition to being sensitiveto the integral of the activity and accounting for the FDG transportand trapping components, allow for the detection of the cumulative
effects of noise in the uptake phase. In this study, we used a blood-free approach to estimate LCMRGlu using the method presented byWu.19 An appealing aspect of this method is that the whole brain val-ue of each patient is normalized to a constant, which has been used inother group studies on the effects of MR on LCMRGlu.9,10 Similarly,we only used the first 40 minutes rather than 60. Monden et al20 dem-onstrated that using a shorter duration could lead to an increase in Ki
on the order of 3% to 5%; however, in this study, we are interested inthe relative change between the control and stimulation environ-ments, so the error derived from this reduced duration should be pres-ent in both control and stimulation data sets.
The SPM8/MNI-normalized parametric images showed a bilateralstatistically significant increase in LCMRGlu within PAC suggestingthat this regionwas being activated during the first 40minutes in the stim-ulation environment relative to the control. Activation of the PAC is alsosupported by the FreeSurfer ROI-based analysis of the LCMRGlu image,where a statistically significant increasewas observed in anROI spanningboth the left and right PACs. When taken separately, the left PAC didnot show significance; however, on closer observation of the FreeSurferGLM image, this could be because of the small size of the region withsignificant uptake with respect to the ROI. In addition to a statisticallysignificant increase in LCMRGlu in the right PAC, the ROI analysisshowed statistically significant activation in other regions known tohave involvement in auditory stimulation: the left and right superior tem-poral planes, the right transverse temporal sulci, and the left middletemporal gyrus.32
Third, the semiquantitative static analysis is most likely to beused clinically with the early adopters of simultaneous MR-PET; thus,any interference caused by adopting our protocol (ie, administer theFDG in the scanner while running MR sequences) should be deter-mined. In this study, the simultaneously acquired MR sequences duringthe static frame (ie, 40Y60 minutes of postinjection) were the same inboth the control and stimulation environments; as a result, differencesbetween the static images of the stimulation and control environmentsshould only reflect changes in the uptake that occurred between the in-jection and minute 40. The static images showed a glucose uptake pat-tern that had some similarities to the parametric images: increaseduptake in the PAC using all 3 analytic methods (SPM8, FreeSurferROIYbased, FreeSurfer GLMYbased). An ROI spanning the combinedleft and right PAC showed a significant increase in the FDG uptake;however, only the right PAC was found to be significantly differentbetween the control and stimulation environments. The GLM-basedanalysis explains this difference: a region of increased uptake is appar-ent just anterior to the PAC. Although this activation may be physio-logic, it could also be a result of stochastic errors.
The 2 FreeSurfer-based methods used for analyzing the PETdata in this work provided complementary information concerning ac-tivation. The minimum requirement for significance in the ROI-basedanalysis is that there must be either a small focal change (or a numberof smaller foci) of rather significant intensity (when compared withthe ROI size) or a less intense change distributed over a large portionof the ROI. The ROI-based method places no requirements on theconnectedness of the regions of increased or decreased activationwithin an ROI; it is rather sensitive to the average change in the re-gion likely detecting whether the PAC has been activated. TheFreeSurfer GLMYbased analysis, on the other hand, focuses on clus-ters of activation allowing them to traverse multiple brain regions.This method may be preferred to detect focal changes within a brainregion, for example, tonotopic activation.33,34
Aside from evaluating the effects of MR acoustic noise on ce-rebral FDG uptake, we have shown that FreeSurfer, in comparisonwith SPM8, can provide statistical descriptions of cerebral FDG up-take. In the case of nonsimultaneous acquisition, wherein spatial reg-istration of the 2 modalities may be inaccurate, the more conservativeanalytic technique is to transform the PET data directly to a conformed
Chonde et al Investigative Radiology & Volume 48, Number 5, May 2013
310 www.investigativeradiology.com * 2013 Lippincott Williams & Wilkins
Copyright © 2013 Lippincott Williams & Wilkins. Unauthorized reproduction of this article is prohibited.
space. Accurate transformation to this conformed space usually re-quires that the volunteer data be significantly smoothed because itmust have a smoothness similar to that of the template. Smoothingthe data can obscure small and/or less intense clusters of uptake. Inan integrated system, wherein the spatial transformation between theMR and PET images is known, the MR data can provide all the neces-sary transformations to a conformed space, reducing the need for addi-tional smoothing of the PET data. In FreeSurfer, where this conformedspace is derived directly from the volunteer-specific brain, there is abetter intervolunteer alignment of the cortical regions, which can im-prove the localization or contrast of statistically significant changesin the brain.35 Similarly and, perhaps, equally if not more importantly,SPM uses volumetric smoothing where in cortical voxels that are near-by but may be on different cortical folds will have a significant influ-ence on each other after computing the smoothed values. However,Freesurfer computes its smoothing on the inflated cortical surface, sotheir distance between points on different cortical folds are increased.If the assumption is that function follows the cortical surface ratherthan the absolute distance between neurons, then FreeSurfer has amore logical smoothing algorithm. One example of these improve-ments in contrast is the conservation of the uptake patterns betweenthe parametric and static images. Because the static image occurs dur-ing a period where the glucose uptake is small relative to earlier timepoints, it should have a metabolic pattern that resembles the parametricimage, which is sensitive to the 0 to 40Yminute uptake phase. Compar-ing the similarities of the metabolic patterns between the static and para-metric frames provides a metric for evaluating SPM-based andFreeSurfer-based analyses. The PAC cluster in the right hemisphere isnot conserved between the parametric and static images using SPM8;however, they, in addition to the clusters in the temporal superior plane,are conserved in the FreeSurfer-based analysis. Another example is theconservation of activation of the left opercular part of the inferior frontalgyrus, which is associated with the Broca area.
FreeSurfer does not entirely replace the need for SPM-basedanalyses. A drawback to FreeSurfer is the processing time requiredto segment and inflate the brain. Whereas the transformation to theMNI space with SPM8 can be computed in minutes, processing ofthe MR data can take on the order of 20 hours with FreeSurfer, mak-ing SPM appealing for real-time clinical targeted applications.36 Forstudies wherein the activation area is expected to be larger or whereROIs can be determined before analysis, SPM8 can provide faster re-sults. In addition, FreeSurfer does not segment some of the brainstemstructures, such as the inferior colliculus, a region that has beenshown to play a role in auditory processing.37,38
One aspect that was not controlled in this experiment waspatient motion. Spurious patient motion can lead to a virtual loss ofresolution and contrast in the PET images, can introduce artifactsfrom mismatch between the data and the attenuation map, and canlead to misregistration between the MR-derived ROIs and PET data.Although we have previously implemented an MR-assisted PET mo-tion correction for the BrainPET,3 motion estimates were not availablefor all the sequences used in this study. To reduce the effects ofmisregistration due to motion on the static image, the MPRAGE usedto derive the ROIs was collected near the middle of the 40 to 60Yminutewindow. In addition, each of the dynamic frames were coregistered to a5-minute frame reconstructed from the data acquired 38 to 43 minutesafter the injection. Had there been more accurate motion tracking andcorrection, it is possible that smaller foci of increased or decreased up-take could have been detected and that the uptake could have been betterlocalized.
Finally, the placement of the earplugs was not standardized:the volunteers were given the option to place the earplugs by them-selves or have a technologist place the earplugs for them, which isour center’s standard protocol for hearing protection in the MR envi-ronment. The volunteers were asked for confirmation whether the
earplugs were adequately placed and whether they were equal bilater-ally before initiating the MR scanning. To ensure maximum efficacyfrom the earplugs, we could have tested the volunteers’ hearing; how-ever, this would bias our results because this is not done routinely forMR participants and it is not likely to occur in a clinical setting.
CONCLUSIONSThis study sought to determine the effects of MR on brain
FDG uptake when MR sequences are run during the FDG uptakephase in an integrated MR-PET system. Group analyses of paramet-ric images derived from the uptake phase, along with static imagesreconstructed from the data acquired 40 to 60 minutes after the radio-tracer administration showed foci of uptake in cortical areas associa-ted with auditory processing, which are likely a result of acousticnoise produced by the MR gradients. The relative increase in thePAC glucose uptake ranged from 3% to 9%, depending on the imagetype and method. Using SPM8 and distorting the data to the MNI-normalized space showed clusters of statistical significance only withan uncorrected P G 0.001; however, no clusters were observed withan FWE of 0.05. The ROI analysis showed similar results of in-creased uptake in the PAC with some ROIs that are significant andsome that are trending toward significance; however, they were insen-sitive to focal activations in large ROIs and activations that spannedthe border of multiple ROIs. Statistical maps of the parametric and staticimages derived from FreeSurfer were qualitatively more similar thanthose derived from SPM8 with many of the clusters conserved, sug-gesting that, in a simultaneous system wherein software coregistrationis unnecessary, an improvement in group analysis can be attained usingFreeSurfer and the simultaneously acquired MR data. This suggeststhat, although the MR-PET environment is considerably different thanthe traditional PET environment, its impact on patient physiology isminimal and can thus still produce comparable results. Our results alsodemonstrate that the performance of the PET scanner is virtually unaf-fected by the MR data acquisition and that highly reproducible PETdata can be obtained. Still, for certain experiments, specific knowledgeon effects of integrated multimodal imaging is required.
ACKNOWLEDGMENTSThe authors thank Larry Byars from Siemens for his technical
work concerning the BrainPET acquisition and reconstruction soft-ware. The authors also thank Dr Douglas Greve from Martinos Cen-ter for his assistance with FreeSurfer and Dr Jennifer Melcher forher assistance with structural/functional correlations of the brain.
REFERENCES1. Schlemmer HP, Pichler BJ, Schmand M, et al. Simultaneous MR/PET imaging
of the human brain: feasibility study. Radiology. 2008;248:1028Y1035.2. Drzezga A, Souvatzoglou M, Eiber M, et al. First clinical experience with in-
tegrated whole-body PET/MR: comparison to PET/CT in patients with onco-logic diagnoses. J Nucl Med. 2012;53:845Y855.
3. Catana C, Benner T, van der Kouwe A, et al. MRI-assisted PET motion correc-tion for neurologic studies in an integrated MR-PET scanner. J Nucl Med.2011;52:154Y161.
4. Catana C, van der Kouwe A, Benner T, et al. Toward implementing an MRI-based PET attenuation-correction method for neurologic studies on theMR-PET brain prototype. J Nucl Med. 2010;51:1431Y1438.
5. Hofmann M, Steinke F, Scheel V, et al. MRI-based attenuation correction forPET/MRI: a novel approach combining pattern recognition and atlas registra-tion. J Nucl Med. 2008;49:1875Y1883.
6. Hu Z, Ojha N, Renisch S, et al. MR-based attenuation correction for a whole-body sequential PET/MR system. 2009 IEEE; 2009:3508Y3512. Nuclear ScienceSymposium Conference Record (NSS/MIC).
7. Meltzer CC, Zubieta JK, Links JM, et al. MR-based correction of brain PETmeasurements for heterogeneous gray matter radioactivity distribution. J CerebBlood Flow Metab. 1996;16:650Y658.
8. Fung EK, Planeta-Wilson B, Mulnix T, et al. A multimodal approach to image-derived input functions for brain PET. IEEE Nucl Sci Symp Conf Rec (1997).2009:2710Y2714.
Investigative Radiology & Volume 48, Number 5, May 2013 MR-Induced Physiologic Effects on Cerebral FDG-PET
* 2013 Lippincott Williams & Wilkins www.investigativeradiology.com 311
Copyright © 2013 Lippincott Williams & Wilkins. Unauthorized reproduction of this article is prohibited.

9. Volkow ND, Tomasi D, Wang GJ, et al. Effects of low-field magnetic stimula-tion on brain glucose metabolism. Neuroimage. 2010;51:623Y628.
10. Volkow ND, Wang GJ, Fowler JS, et al. Resting brain metabolic activity in a 4tesla magnetic field. Magn Reson Med. 2000;44:701Y705.
11. Waxman A, Herholz K, Lewis D, et al. Society of Nuclear Medicine proce-dure guideline for FDG PET brain imaging version 1.0. Society of NuclearMedicine. 2009.
12. Foster JR, Hall DA, Summerfield AQ, et al. Sound-level measurements andcalculations of safe noise dosage during EPI at 3 T. J Magn Reson Imaging.2000;12:157Y163.
13. Fox PT, Raichle ME, Mintun MA, et al. Nonoxidative glucose consumptionduring focal physiologic neural activity. Science. 1988;241:462Y464.
14. Belin P, Zatorre RJ, Hoge R, et al. Event-related fMRI of the auditory cortex.Neuroimage. 1999;10:417Y429.
15. Cho ZH, Chung SC, Lim DW, et al. Effects of the acoustic noise of the gradientsystems on fMRI: a study on auditory, motor, and visual cortices. Magn ResonMed. 1998;39:331Y335.
16. Schmitter S, Diesch E, Amann M, et al. Silent echo-planar imaging for auditoryFMRI. MAGMA. 2008;21:317Y325.
17. Byars LG, Sibomana M, Burbar Z, et al. Variance reduction on randoms fromcoincidence histograms for the HRRT. 2005 IEEE; 2005:2622Y2626. NuclearScience Symposium Conference Record.
18. Watson CC. New, faster, image-based scatter correction for 3D PET. IEEETrans Nucl Sci. 2000;47:1587Y1594.
19. Wu YG. Noninvasive quantification of local cerebral metabolic rate of glucosefor clinical application using positron emission tomography and 18F-fluoro-2-deoxy-D-glucose. J Cereb Blood Flow Metab. 2008;28:242.
20. Monden T, Kudomi N, Sasakawa Y, et al. Shortening the duration of [18F]FDGPET brain examination for diagnosis of brain glioma. Mol Imaging Biol.2011;13:754Y758.
21. Friston KJ, Holmes AP, Worsley KJ, et al. Statistical parametric maps in func-tional imaging: a general linear approach. Hum Brain Mapp. 1994;2:189Y210.
22. Fischl B. FreeSurfer. Neuroimage. 2012;62:774Y781.23. Maldjian JA, Laurienti PJ, Kraft RA, et al. An automated method for neuroan-
atomic and cytoarchitectonic atlas-based interrogation of fMRI data sets.Neuroimage. 2003;19:1233Y1239.
24. Yoon HJ, Park KW, Jeong YJ, et al. Correlation between neuropsychologicaltests and hypoperfusion in MCI patients: anatomical labeling using xjViewand Talairach Daemon software. Ann Nucl Med.2012;26:656Y664.
25. Fischl B, Salat DH, Busa E, et al. Whole brain segmentation: automated label-ing of neuroanatomical structures in the human brain.Neuron. 2002;33:341Y355.
26. Aydin MD, Ungoren MK, Aydin N, et al. The effects of impulse noise on theepithelial cells of the choroid plexus. Turk Neurosurg. 2011;21:191Y196.
27. Paus T, Jech R, Thompson CJ, et al. Transcranial magnetic stimulation duringpositron emission tomography: a new method for studying connectivity of thehuman cerebral cortex. J Neurosci. 1997;17:3178Y3184.
28. Fox P, Ingham R, George MS, et al. Imaging human intra-cerebral connectivityby PET during TMS. Neuroreport. 1997;8:2787Y2791.
29. Siebner HR, Takano B, Peinemann A, et al. Continuous transcranial magneticstimulation during positron emission tomography: a suitable tool for imagingregional excitability of the human cortex. Neuroimage. 2001;14:883Y890.
30. Siebner HR, Peller M, Willoch F, et al. Imaging functional activation of theauditory cortex during focal repetitive transcranial magnetic stimulation ofthe primary motor cortex in normal subjects. Neurosci Lett. 1999;270:37Y40.
31. Pietrzyk U,Herholz K, FinkG, et al. An interactive technique for three-dimensionalimage registration: validation for PET, SPECT, MRI and CT brain studies. J NuclMed. 1994;35:2011Y2018.
32. Binder JR, Frost JA, Hammeke TA, et al. Human temporal lobe activation byspeech and nonspeech sounds. Cereb Cortex. 2000;10:512Y528.
33. Lauter JL, Herscovitch P, Formby C, et al. Tonotopic organization in humanauditory cortex revealed by positron emission tomography. Hear Res. 1985;20:199Y205.
34. Wessinger CM, Buonocore MH, Kussmaul CL, et al. Tonotopy in human audi-tory cortex examined with functional magnetic resonance imaging. Hum BrainMapp. 1997;5:18Y25.
35. Fischl B, Sereno MI, Tootell RBH, et al. High-resolution intersubject averagingand a coordinate system for the cortical surface. Hum Brain Mapp. 1999;8:272Y284.
36. Signorini M, Paulesu E, Friston K, et al. Rapid assessment of regional cerebralmetabolic abnormalities in single subjects with quantitative and nonquantitative[18F]FDG PET: a clinical validation of statistical parametric mapping.Neuroimage. 1999;9:63Y80.
37. Krishna BS, Semple MN. Auditory temporal processing: responses to sinusoi-dally amplitude-modulated tones in the inferior colliculus. J Neurophysiol.2000;84:255Y273.
38. Huffman RF, Henson OW Jr. The descending auditory pathway and acoustico-motor systems: connections with the inferior colliculus. Brain Res Brain Res Rev.1990;15:295Y323.
Chonde et al Investigative Radiology & Volume 48, Number 5, May 2013
312 www.investigativeradiology.com * 2013 Lippincott Williams & Wilkins
Copyright © 2013 Lippincott Williams & Wilkins. Unauthorized reproduction of this article is prohibited.
Related Documents