UNIVERSIDADE ESTADUAL PAULISTA – UNESP CÂMPUS JABOTICABAL EFEITO DA UTILIZAÇÃO DE DIFERENTES MATRIZES GENÔMICAS E PARENTESCO NA AVALIAÇÃO GENÉTICA DE BOVINOS DE CORTE Michel Marques Farah Zootecnista 2014

Welcome message from author
This document is posted to help you gain knowledge. Please leave a comment to let me know what you think about it! Share it to your friends and learn new things together.
Transcript

UNIVERSIDADE ESTADUAL PAULISTA – UNESP CÂMPUS JABOTICABAL
EFEITO DA UTILIZAÇÃO DE DIFERENTES MATRIZES GENÔMICAS E PARENTESCO NA AVALIAÇÃO GENÉTICA
DE BOVINOS DE CORTE
Michel Marques Farah
Zootecnista
2014
UNIVERSIDADE ESTADUAL PAULISTA – UNESP CÂMPUS JABOTICABAL
EFEITO DA UTILIZAÇÃO DE DIFERENTES MATRIZES GENÔMICAS E PARENTESCO NA AVALIAÇÃO GENÉTICA
DE BOVINOS DE CORTE
Michel Marques Farah
Orientador: Prof. Dr. Ricardo da Fonseca Coorientador: Prof. Dr. Aldrin Vieira Pires
Tese apresentada à Faculdade de Ciências Agrárias e Veterinárias - Unesp, Campus de Jaboticabal, como parte das exigências para a obtenção do título de Doutor em Genética e Melhoramento Animal.
2014

Farah, Michel Marques
F219e Efeito da utilização de diferentes matrizes genômicas e parentesco na avaliação genética de bovinos de corte / Michel Marques Farah. – – Jaboticabal, 2014
iv, 76 p. ; 28 cm Tese (doutorado) - Universidade Estadual Paulista, Faculdade de
Ciências Agrárias e Veterinárias, 2014 Orientador: Ricardo da Fonseca Banca examinadora: Idalmo Garcia Pereira, Mauricio de
Alvarenga Mudadu, Sandra Aidar de Queiroz, Roberto Carvalheiro Bibliografia 1. Bos indicus. 2. Coeficiente de Parentesco. 3. Gado de corte. 4.
Seleção genômica. 5. Validação cruzada. I. Título. II. Jaboticabal-Faculdade de Ciências Agrárias e Veterinárias.
CDU 636.082:636.2
Ficha catalográfica elaborada pela Seção Técnica de Aquisição e Tratamento da Informação – Serviço Técnico de Biblioteca e Documentação - UNESP, Câmpus de Jaboticabal.


DADOS CURRICULARES DO AUTOR
Michel Marques Farah, filho de Nicolau Wladimir Farah e Elide Marques
Farah, nasceu em São Paulo – SP, em 24 de setembro de 1982. Em 2002, iniciou
curso de graduação em Zootecnia, pela Universidade Federal dos Vales do
Jequitinhonha e Mucuri - MG, graduando-se em julho de 2007. Em março de 2008
iniciou curso de Mestrado em Zootecnia, na área de Melhoramento Animal, pela
Universidade Federal dos Vales do Jequitinhonha – MG. Em 15 de julho de 2010
tornou-se Mestre em Zootecnia. Em agosto de 2010 iniciou curso de Doutorado em
Genética e Melhoramento Animal, pela Universidade Estadual Paulista “Júlio de
Mesquita Filho” – SP. Realizou o programa de sanduiche na University of Queensland
- Austrália durante o ano de 2013.

DEDICATÓRIA
À minha família
À Camila e a família dela

AGRADECIMENTOS
À Camila, minha parceira, companheira e meu amor, que muitas vezes
passamos pelo mesmo sofrimento e juntos, finalmente, conseguimos superar mais
este desafio.
À toda minha família por muitas vezes compreenderem meus momentos de
ausência, por me darem todo seu apoio em todas as minhas decisões e estarem
sempre ao meu lado.
Ao professor Ricardo da Fonseca, pelo papel não só de orientador mas de um
grande amigo e conselheiro que me ensinou, apoiou e confiou no meu trabalho.
Aos professores Aldrin Vieira Pires, Idalmo Garcia Pereira e todos os outros
professores por me dedicarem a amizade, a atenção e especialmente por me
dedicarem excepcionais momentos de sabedoria.
Aos meus grandes amigos, Adam, André, Fábio (Pogrão), Gustavo (Xuxa),
Márcio (Saque) McLean, Rodrigo e todos os demais que moram ou moraram na
EternaMent.
Ao LuCCA-Z e todos os integrantes, Rafael, Adam, Orlando, Ligia, Thamilis,
Tássia, Michele e todos os demais que eu cometi o erro de esquecer e também aos
integrantes anexos, pelos momentos de trabalho pesado e momentos de lazer
dentro do laboratório.
À CAPES pelo auxílio financeiro tanto aqui no Brasil quanto com a bolsa para
a realização do meu doutorado sanduíche na Austrália.
Ao programa de Pós-Graduação em Genética e Melhoramento Animal da
FCAV pela estrutura, pelo excelente quadro de professores que me ajudaram muito
no meu desenvolvimento.
À University of Queensland por me receber e me oferecer toda a
infraestrutura para o desenvolvimento da minha tese.
I can’t forget to say that I’m very grateful to Marina, Laércio (Juca), Stephen
Moore, Matthew Kelly, Sigrid Lehnert, Bing, McLean (again), Amy, Mr. Russell,
Mauricio Mudadu, Mrs. Flynn, Mrs. Ruth and Greg, João Paulo, Paula and all QAAFI
and CSIRO members. It was a pleasure know all you. Thank you!
i
SUMÁRIO Página
Resumo ...................................................................................................................... iii Abstract ...................................................................................................................... iv
CAPÍTULO 1 - CONSIDERAÇÕES GERAIS .............................................................. 5
INTRODUÇÃO .................................................................................................................. 5
REVISÃO DE LITERATURA ........................................................................................... 7
Predição dos Valores Genéticos ........................................................................ 7
Seleção Genômica ............................................................................................... 8
Matrizes de Relacionamento ............................................................................. 10
Determinação da proporção racial (Proporção Bos indicus) ....................... 11
REFERÊNCIAS BIBLIOGRÁFICAS ............................................................................ 14
CAPÍTULO 2 - ACCURACY OF GENOMIC SELECTION PREDICTIONS FOR STATURE IN CATTLE USING HD CHIP GENOTYPES: COMPARING RELATIONSHIP MATRICES ESTIMATED FROM PEDIGREE WITH GENOMIC DERIVED MATRICES ................................................................................................................ 18
Summary (80 words) ...................................................................................................... 19
Introduction ...................................................................................................................... 20
Methods ............................................................................................................................ 21
Phenotype and genotype data: ......................................................................... 21
Statistical data analysis: ..................................................................................... 22
Results .............................................................................................................................. 26
Relationship coefficients .................................................................................... 26
Variance components ......................................................................................... 26
Breeding values and accuracies ....................................................................... 27
Discussion ........................................................................................................................ 29
Conclusions ..................................................................................................................... 32
References ....................................................................................................................... 32
CAPÍTULO 3 - ACCURACY OF GENOMIC SELECTION FOR AGE AT PUBERTY IN A MULTI BREED POPULATION OF TROPICALLY ADAPTED BEEF CATTLE ........ 54
Summary .......................................................................................................................... 55
Introduction ...................................................................................................................... 55
Material and Methods ..................................................................................................... 56
Phenotype and genotype data .......................................................................... 56
Genomic analysis methods ............................................................................... 57
Estimation of Brahman content ......................................................................... 59
Estimation of genomic breeding values ........................................................... 59

ii
Scenarios tested ................................................................................................. 60
Results .............................................................................................................................. 60
Comparison of different GRM methods ........................................................... 61
Discussion ........................................................................................................................ 63
Conclusions ..................................................................................................................... 65
References ....................................................................................................................... 66
CAPÍTULO 4 - CONSIDERAÇÕES FINAIS .............................................................. 75

iii
Efeito da utilização de diferentes matrizes genômicas de parentesco na avaliação genética de bovinos de corte
Resumo RESUMO - No melhoramento genético animal a forma tradicional de realizar
seleção é com base no fenótipo dos indivíduos e na informação do parentesco entre estes, porém é um processo lento, sendo assim, programas de melhoramento estão procurando identificar os genes responsáveis pela característica de interesse e assim realizar a seleção dos animais que carregam a informação desejada. Com as informações dos indivíduos genotipados, tornou-se possível a utilização da informação de genes idênticos em estado tornando viável a utilização de uma matriz de parentesco (G) permitindo aumentar a precisão das avaliações genéticas, porém, devido à dificuldade de se obter o genótipo de todos os animais de uma população, foi proposto um método que realiza a integração da matriz G com a matriz de parentesco (A) em uma matriz de parentesco-genômica (H). Embora tenham trabalhos que indiquem uma similaridade no progresso genético utilizando estas diferentes matrizes é importante a avaliação da contribuição da avaliação genômica nos processos de avaliação genética em populações com estruturas de parentesco diferentes, bem como avaliar a metodologia de seleção genômica em populações multirraciais, a fim de atender o sistema de criação de animais cruzados. Assim, o objetivo geral deste trabalho foi estudar os efeitos da informação genômica na avaliação genética animal por meio de diferentes matrizes genômicas, utilizando dados de bovinos de corte com diferentes estruturas populacionais e composições raciais. Primeiramente avaliou-se 3 diferentes metodologias de se obter a matriz H, com a frequência alélica observada (HGOF), menor frequência alélica (HGMF) e uma frequência de 0,5 para todos os SNPs (HG50). Foram feitas comparações entre estas matrizes genômicas e a matriz de parentesco tradicional (A) utilizando uma população de 1695 animais da raça Brahman (BB). De acordo com os resultados obtidos, a HGOF foi a matriz que apresentou melhor similaridade com a matriz A. Porém, as maiores diferenças foram encontradas na classificação dos animais, quando avaliou-se a classificação dos animais utilizando as diferentes matrizes, todas as matrizes genômicas apresentaram diferente classificação da matriz A. Outro trabalho foi feito para investigar a possiblidade de aumentar a acurácia da seleção genômica em animais da raça Tropical Composite (TC), obtida pelo cruzamento principalmente da raça Brahman com animais Bos taurus, usando dados de BB. Assim foram criadas duas matrizes genômicas, uma utilizando apenas as informações genômicas da população de TC (GRMSB) e outra utilizando a informação da contribuição da raça BB em cada animal TC (GRMXB). Ambas as matrizes estimaram parâmetros genéticos similares mas maiores que quando utilizando a matriz A. Porém, a GRMSB apresentou maiores acurácias na predição dos valores genéticos, principalmente quando aumenta o uso da informação de BB na população de TC. De maneira geral, o uso da informação genômica para criar matrizes de parentesco contribui para melhorar a predição de relacionamento entre os indivíduos e é uma importante ferramenta para uso em populações de gado composto. Palavras-chave: bos indicus, coeficiente de parentesco, gado de corte, parâmetros
genéticos, seleção genômica, validação cruzada

iv
Effect of different genomic relationship matrices on genetic evaluation of beef cattle
Abstract ABSTRACT - In animal breeding methodologies, the traditional method of
performing selection is based on the phenotype of individuals and information of relationship between them, but it is a slow process, so breeding programs are trying to identify the genes responsible for the trait of interest and thus achieve selection of animals that carry the interesting genes. With the information of genotyped individuals, it became possible to use the information of genes identical in state making it feasible to use a relationship matrix (G) which increase the accuracy of genetic evaluations, however, due to difficulty of obtaining the genotype of all animals in a population, we propose a method that performs the integration of the G matrix with the relationship matrix (A) in a pedigree-genomic relationship matrix (H). Although studies indicating a similarity in genetic progress using these matrices is important to evaluate the contribution of genomic evaluation in the process of genetic evaluation in populations with different structures of kinship, as well as evaluating the methodology of genomic selection in multiracial populations in order to cater to the creation of crossbred system. Thus the objective of this work was to study the effects of genomic information in genetic evaluation through different genomic arrays using data from beef cattle with different population structures and racial compositions. First we evaluated three different methods of obtaining the H matrix with the observed allele frequency (HGOF), lower allele frequency (HGMF) and a frequency of 0.5 for all SNPs (HG50). Comparisons between these genomic arrays and traditional kinship (A) using a population of 1695 animals breed Brahman (BB) matrix were made. According to the results , the HGOF was a matrix that showed the greatest similarity to the matrix A but the greatest differences were found in the classification of animals, when we evaluated the classification of animals using different matrices, all matrices showed different genomic rank of the matrix A. Another study was done to investigate the possibility of increasing the accuracy of genomic selection in animals breed Tropical Composite (TC) , which is a breed obtained by crossing Brahman mainly with Bos taurus, using data from BB. So two genomic matrices, one using only the genomic information of the population of TC (GRMSB) and another one using the information of the contribution of the BB breed in each animal TC (GRMXB) were created. Both similar but larger matrices estimated genetic parameters when using the matrix A. However, GRMSB showed higher accuracies in the prediction of breeding values, especially when increasing the use of information in the BB population of TC. In general, the use of genomic information to create relationship matrices contributes to an increase of the prediction of relationship between individuals and is an important tool for use in multibreed cattle populations. Key words: bos indicus, relationship coefficient, beef cattle, genetic parameters,
genomic selection, cross-validation
5
CAPÍTULO 1 - CONSIDERAÇÕES GERAIS
INTRODUÇÃO
Tradicionalmente a seleção de características de interesse econômico são
realizadas com base no valor fenotípico dos indivíduos e na informação do parentesco
entre os animais. Esta seleção é eficiente, porém o processo demanda tempo,
principalmente para características que são medidas em apenas um sexo, como
produção de leite, ou características medidas após o abate dos animais, como a
qualidade da carne, ou ainda medidas mensuradas no final da vida do indivíduo, por
exemplo, longevidade. Assim, para realizar programas de melhoramento para estas
características, pesquisadores buscam identificar os genes que afetam tais
características e a seleção de animais que carregam os alelos desejáveis
(MEUWISSEN; GODDARD, 1996).
Os projetos de sequenciamento e geração de informações genômicas de alta
qualidade estão cada vez mais sendo utilizados no melhoramento genético animal. A
quantidade de nucleotídeos de polimorfismos únicos (SNP) identificados cresce
rapidamente em bovinos. E com isso vem crescendo também a quantidade de
pesquisadores interessados em utilizar as informações genômicas nos programas de
melhoramento genético animal (MEUWISSEN; GODDARD, 1996; CHRISTENSEN;
LUND, 2010; GIANOLA et al., 2010; HAYES et al., 2010).
Com o avanço destas novas tecnologias, os pesquisadores também estão
procurando novas técnicas de incorporação desta informação na estimação do
parentesco dos animais, formando uma matriz de relacionamento genômico (G). A
utilização de G nas avaliações genéticas, permitiu aumentar a precisão da avaliação
genética dos animais, criando o conceito de Seleção Genômica (SG). Segundo
Meuwissen et al. (2001), a SG aumenta a taxa de ganho genético e reduz o custo do
teste de progênie, permitindo aos criadores pré-selecionar animais que tenham
herdado segmentos cromossômicos de maior mérito. Estes valores genéticos podem
ser obtidos usando o modelo de equações de modelos mistos (EMM) com a matriz
de parentesco A, substituída pela matriz G.
De modo geral, G inclui informações genômicas de poucos animais, devido a
impossibilidade de genotipar toda a população ou de se obter o genótipo de alguns
6
ancestrais. Christensen; Lund (2010) propuseram um método para a predição do
genoma de animais não genotipados, tornando possível a integração de todas as
informações genômicas no pedigree e levando ao aumento na precisão das
estimativas dos componentes de variância.
Entretanto, o método proposto por Christensen; Lund (2010) é complexo,
exigindo alta demanda por equipamentos com grande capacidade de processamento
e memória. Por fim, outros trabalhos, como em Forni et al. (2011) e Legarra et al.
(2009), procuraram uma maneira de integrar esta informação genômica com a
informação de parentesco, com o objetivo de aumentar a quantidade de informações
no pedigree e assim buscar uma melhor estimativa dos componentes genéticos dos
indivíduos e da população.
Além de proporcionar parentesco mais acurado entre os indivíduos, a utilização
da informação genômica pode auxiliar na avaliação genética de animais compostos
por duas ou mais raças, levando à estimação de relacionamento entre os indivíduos
mais acurada devido a informação de parentesco e a real proporção de cada raça no
animal que compõe a população em análise.
Já no Brasil, a avaliação genética considerando uma população multirracial
pode ser de interesse para os programas de melhoramento genético animal pois
aproximadamente 80% da população de bovinos que é destinado ao corte,
praticamente 80% da população é composta por raças zebu ou cruzamento de zebu
(JOSAHKIAN, 2000). Em consequência, existe um grande número de subpopulações
de vários tamanhos, com composição racial Bos indicus x Bos indicus e Bos indicus
x Bos taurus, as quais se enquadram na descrição de população multirracial (ELZO
& BORJAS, 2004).
Assim, o objetivo geral deste trabalho foi estudar os efeitos da informação
genômica na avaliação genética animal por meio de diferentes matrizes genômicas
utilizando dados de bovinos de corte com diferentes estruturas populacionais.
Para isto foram feitos dois trabalhos, no primeiro objetivou-se avaliar a
integração entre as matrizes genômicas, obtidas por variações nas frequências
alélicas, e as informações de pedigree formando diferentes matrizes de parentesco.
No segundo trabalho o objetivo principal foi desenvolver métodos de predição
genômica para populações cruzadas, utilizando informações da proporção de
semelhança genética entre animais compostos e a principal raça formadora.

7
REVISÃO DE LITERATURA
Predição dos Valores Genéticos
O valor genético de um indivíduo consiste no mérito genético que pode ser
transmitido às progênies deste indivíduo. De acordo com Henderson (1975) há
diversas maneiras de se predizer este valor genético, sendo o Melhor Preditor Linear
Não-Viesado (BLUP) o método mais utilizado pelos melhoristas para a predição dos
valores genéticos dos animais.
Este método de predição envolve todos os indivíduos identificados na estrutura
genealógica da população para estabelecer os relacionamentos genéticos. Indivíduos
relacionados tem uma proporção maior de genes em comum relacionada ao grau de
parentesco, que é informado por meio de uma inversa da matriz de parentesco
(PEREIRA, 2012), possibilitando assim, a metodologia Equações de Modelos Mistos
(MME) para a obtenção do BLUP dos valores genéticos dos animais, proposta por
Henderson (1975).
Diversos modelos podem ser especificados para as MME, dependendo da
aplicação das características avaliadas e estrutura de dados desenvolvidos, como o
Modelo Animal, Modelo Animal Reduzido e Modelo Touro entre outros (PEREIRA,
2012).
A equação básica que descreve estes modelos é:
� = �� + �� + �
em que:
y é um vetor de observações;
β é um vetor de efeitos fixos desconhecidos;
X é uma matriz de incidência dos efeitos fixos;
a é um vetor de efeitos aleatórios genéticos desconhecidos para todos os indivíduos
envolvidos na análise;
Z é uma matriz de incidência dos efeitos aleatórios;
e é um vetor de efeitos aleatórios residuais desconhecidos.
Para o modelo Touro, cada reprodutor tem uma equação e o desempenho de
todas as progênies ligadas de um determinado reprodutor estão ligados a este por
8
meio da matriz Z. Já no modelo Animal todos os indivíduos apresentam uma equação
e a matriz Z é uma matriz de incidência, associando cada observação ao indivíduo
que a produziu. Outra diferença básica entre estes dois modelos é que o primeiro
estima a Diferença Esperada na Progênie (DEP) enquanto o segundo estima o valor
genético do indivíduo, que corresponde ao dobro da DEP.
O Modelo Animal mudou a forma de pensar na interpretação da covariância
entre parentes para a estrutura de modelo linear, onde se determinam variâncias
diretamente pelo ajustamento correspondente aos efeitos aleatórios do modelo de
análise. As covariâncias entre os efeitos aleatórios para parentes são levadas em
conta através da especificação da matriz de variâncias dos efeitos aleatórios. A
variância genética aditiva é estimada como a variância do mérito genético aditivo dos
animais. Da mesma forma, os componentes genéticos não-aditivos podem ser
estimados pelo ajustamento de um efeito aleatório correspondente, como a
dominância ou efeito genético materno, para cada animal (VAYEGO, 2007).
A partir do modelo de predição do valor genético dos indivíduos desenvolveu-
se novas metodologias de seleção, com base nas informações fenotípicas e
correlações entre os indivíduos, porém, com o avanço das tecnologias e possibilidade
de conhecer o genótipo dos animais uma nova ferramenta está atualmente disponível
e amplamente utilizada pelos pesquisadores, conhecida como Seleção Genômica.
Seleção Genômica
Seleção genômica (SG) é um método que usa a informação genômica para
predizer os valores genéticos e os indivíduos candidatos à seleção nos programas de
melhoramento genético (CLARK et al., 2012). A SG foi proposta inicialmente por
Meuwissen et al. (2001) que tem como principal objetivo a utilização direta das
informações de marcadores moleculares e informações do DNA na seleção.
Este método apresenta uma grande vantagem em relação à seleção
tradicional, pois permite uma alta eficiência seletiva, principalmente em
características de difícil mensuração, como características de carcaça, fertilidade,
longevidade e eficiência alimentar, pois são características com alto custo para medir,
medidas apenas em um sexo ou necessita de informações de seus parentes para
obter estimativa do animal (BOLORMAA et al., 2013a). A SG também pode ser
definida como seleção simultânea para centenas ou milhares de marcadores, os quais

9
cobrem o genoma de uma maneira densa fazendo com que os genes de uma
característica quantitativa estejam em desequilíbrio de ligação com pelo menos uma
parte dos marcadores utilizados (VANRADEN, 2008).
Esta metodologia pode ser aplicada em todas as famílias com informações de
fenótipo e genótipo, bem como combinando dados de diferentes raças (BOLORMAA
et al., 2013b). Esta avaliação apresenta alta acurácia seletiva para seleção baseada
exclusivamente em marcadores e não exige prévio conhecimento das posições dos
“quantitative trait loci” (QTL) (RESENDE et al. 2008), além de reduzir o número de
medidas fenotípicas em cada geração (MUIR, 2007) e possibilitar uma predição mais
acurada entre diferentes raças, desde que tenha uma densidade suficiente de
marcadores (GODDARD, 2009).
A implementação da SG segue, basicamente, dois passos: 1) estimação dos
efeitos dos SNPs em uma população de referência e 2) predição dos valores
genéticos genômicos (“Genomic Estimated Breeding Values” - GEBV) para animais
que não estão na população de referência (candidatos à seleção).
A questão chave da predição genômica está na estimativa do efeito individual
de um SNP em uma característica de interesse. Para isso é necessário a utilização
de uma população de referência, também conhecida como população de treinamento
(MEUWISSEN, 2007).
Esta população de treinamento contém indivíduos com informação fenotípica
confiável, bem como informação do genótipo de cada indivíduo desta população
(CALUS, 2010). Esta população é usada para obter informações sobre os fenótipos
e genótipos importantes para que os GEBVs tenham uma alta acurácia nos indivíduos
candidatos à seleção (CLARK et al., 2012).
Para predizer os valores genéticos a partir de informações genômicas, diversos
métodos são utilizados como: Mínimos Quadrados, gBLUP, BayesA, BayesB
(MEUWISSEN, 2001), LASSO (TIBSHIRANI, 1996), entre outros. Esta vasta gama
de métodos de estimação de valores genéticos assume desde um pequeno número
de loci tenham efeito, como no caso do BayesB, até modelo que assume igual
variância em todos os loci, como no caso do gBLUP e todas elas seguem abordagens
multi passos (“multi-steps”) e um único passo (“single-step”) (DUCROCQ et al., 2009,
VANRADEN et al. 2009, HARRIS & JOHNSON et al. 2010 e SU et al., 2012).
Atualmente, o método “single-step” tem sido mais utilizado por obter maior
acurácia do GEBV do que a abordagem “multi-steps” (SU et al., 2012). A base da

10
abordagem “single-step” consiste na integração de uma matriz de relacionamento
genômico (“Genomic Relationship Matrix” - GRM) com a matriz de pedigree
(“Numerator Relationship Matrix” - NRM) utilizando, simultaneamente, informações de
indivíduos genotipados e não genotipados (LEGARRA et al., 2009; CHRISTENSEN;
LUND, 2010).
Matrizes de Relacionamento
A maioria dos métodos de seleção utilizados necessita de parentesco, ou
relacionamento, entre os indivíduos de uma população obtendo uma melhor acurácia
de predição (Henderson, 1975). Para a estimação destes parentescos foi
desenvolvido métodos propostos por Wright (1917) e Malécot (1948), os quais
definiram conceitos e métodos para calcular genes idênticos por descendência (IBD),
que são usados para indicar a probabilidade de que dois alelos homólogos tenham
sido herdados a partir de um ancestral comum (POWELL et al., 2010).
Tradicionalmente, a probabilidade de que dois alelos sejam IBD pode ser
estimada utilizando informações de pedigree da população. Assim, os programas de
melhoramento genético utilizam-se esta informação de pedigree para calcular a
probabilidade de que dois indivíduos compartilhem o mesmo alelo proveniente de um
ancestral em comum, montando a matriz de parentesco conhecida como “Numerator
Relationship Matrix” (NRM).
A partir da definição desta matriz NRM, tornou-se possível a obtenção de
componentes de variância para uma população-base e a predição de valores
genéticos de indivíduos de qualquer geração, por meio do Método da Máxima
Verossimilhança Restrita (REML) proposto por Patterson e Thompson (1971).
Este processo é eficiente, porém lento, principalmente para características de
difícil mensuração ou mensuradas em apenas um sexo, como produção de leite e
características de carcaça (MEUWISSEN; GODDARD, 1996). A principal limitação
desta metodologia está no cálculo do parentesco entre os indivíduos, o qual é
calculado como uma probabilidade destes animais apresentarem genes em comum,
porém muitos alelos podem ser idênticos por estado (IBS) podendo tornar os
indivíduos mais aparentados que a média da população (POWELL et al., 2010).
Conforme definido anteriormente, as covariâncias genéticas (parentesco
genético) entre os indivíduos são derivadas das probabilidades de que pares de

11
genes compartilhados entre os indivíduos são idênticos por descendência (LYNCH &
WALSH, 1998), assim, espera-se, por exemplo, que dois irmãos germanos
apresentem 50% de seus alelos IBD. No entanto, esta metodologia baseada nas
informações do pedigree ignora os efeitos aleatórios devido à meiose no processo de
gametogênese, esta variação é definida como Amostragem Mendeliana (AVENDAÑO
et al., 2005).
Assim, com o avanço das técnicas utilizadas no melhoramento genético animal
e a possibilidade de genotipar indivíduos, tornou-se possível a utilização de
informações mais precisas sobre os genes IBD e IBS que podem ser compartilhados
através de ancestrais comuns, ausentes no pedigree tornando possível a utilização
de uma matriz de parentesco genômica denominada “Genomic Relationship Matrix”
(GRM) (FORNI et al. 2011). Diversas metodologias são usadas para calcular uma
matriz GRM, como observado em VanRaden et al. (2008), Harris and Johnson (2010)
e Yang et al. (2010). Porém, o principal objetivo destes métodos é tornar os
coeficientes da matriz de parentesco genômico o mais próximo da matriz de
parentesco tradicional.
A GRM pode substituir a matriz NRM na tradicional metodologia BLUP e de
acordo com Clark et al. (2012) é esperado que a GRM forneça estimativas mais
acurada da covariância entre os indivíduos, entretanto, é importante entender o
quanto de ganho de acurácia será atribuída ao conhecimento mais preciso do
parentesco e quanto se ganha com a adição de informações sobre parentes distantes,
anteriormente ignorados pela matriz de parentesco.
Outra possível vantagem da utilização de uma GRM pode ser em se obter
coeficientes de parentesco dos indivíduos mais acurados, por exemplo, em uma
população multirracial. Algumas pesquisas em gado de leite estão utilizado métodos
de cálculo destes parentescos genômicos através de uma estimativa da proporção de
raças que compõe os indivíduos sob avaliação genética (ERBE et al., 2012; HARRIS
& JOHNSON, 2010; OLSON et al., 2012).
Determinação da proporção racial (Proporção Bos indicus)
Os bovinos podem ser divididos em dois diferentes grupos, ambos
descendentes do agora extinto Bos primigenius. Estas duas subespécies foram
separadas há centenas de milhares de anos com independentes domesticações,
12
resultando nas subespécies Bos taurus e Bos indicus (MCTAVISH et al., 2013). Hoje
estes dois grupos apresentam características distintas tais como adaptabilidade a
específicos ambientes, fertilidade e qualidades de produção (TEASDALE et al., 2012).
Estas duas subespécies geralmente são cruzadas formando um animal
comumente conhecido como mestiço ou composto que pode ser utilizado para a
formação de raças compostas, aproveitando as caraterísticas de produção dos Bos
taurus e adaptação aos ambientes tropicais do Bos indicus (KUEHN et al., 2011).
A Austrália está entre os maiores produtores de carne do mundo, de acordo
com o site da Meat & Livestock Austrália (MLA), as previsões para o rebanho bovino
em junho de 2014 serão em torno de 27,5 milhões de cabeça, desta população total
pode-se dividir a população, basicamente, em animais da raça Brahman,
aproximadamente 39% e raça Tropical Composite, representando aproximadamente
30% da população total.
Como pode ser observado, a raça Brahman é predominante na Austrália e vem
crescendo significativamente no Brasil. Esta raça foi criada no Estados Unidos,
derivada de quatro raças Bos indicus (Guzerá, Nelore, Gir e Krishna Valley). Na
Austrália, sua importação teve início no começo do século passado, porém, de acordo
com o “Departamento of Primary Industries of New South Wales”, a raça só teve
importância econômica a partir do ano 1933 quando uma grande quantidade de
animais foi importado pelo Sindicado de criadores de gado de “Queensland” que
realizou mais duas importantes importações de animais dos Estados Unidos entre os
anos de 1950 e 1954.
Esta raça é caracterizada por sua docilidade, vivacidade e curiosidade.
Apresenta porte médio com resistência a doenças e parasitas e boa adaptação a
variações de ambiente (MARQUES, 2003) e, de acordo com a Associação de
Criadores de Brahman da Austrália, apesar de apresentar maturidade mais tardia, a
raça é adequada para cruzamentos, dando excelente vigor hibrido nas progênies.
A raça Tropical “Composite” é um dos principais compostos, obtido pelo
cruzamento de Brahman com outras raças (Bos taurus) não adaptadas aos trópicos,
como “Hereford”, “Shorthorn”, “Red Angus”, “Red Pull” e Charolês (PORTO-NETO et
al., 2013). Este composto foi criado no norte da Austrália na tentativa de aumentar o
vigor hibrido de várias características reprodutivas e adaptativas utilizando as raças
estabelecidas no país, assim, resultaram na formação de raças compostas a partir de
raças tropicais adaptadas e raças britânicas ou européias (BOLORMAA et al., 2013a).

13
A determinação da proporção de genes de uma raça específica em um
indivíduo composto pode ser uma ferramenta auxiliar na seleção dos animais com
habilidades específicas, principalmente em sistemas de manejo onde se adota uma
estrutura de reprodutor múltiplo, assim, a composição de raças em um indivíduo é
desconhecida. Outra aplicação das estimativas genômicas da composição de raças
é para certificar a proporção de raça em programas que certificam a qualidade da
carne e a raça produzida, por exemplo, o esquema de certificação da “Australian
Angus beef”, o qual as progênies necessitam ser provenientes de reprodutores
exclusivamente da raça Angus e rastreados através de amostras de DNA obtidas nas
análises da carcaça (Australian Angus Society, 2013).
O mercado australiano também beneficia os produtores pela qualidade da
carcaça e de acordo com o “Meet & Livestock Australia”, que é um programa de
pesquisas e “marketing” do governo australiano, a proporção de Bos indicus no animal
tem impacto negativo sobre uma série de cortes comuns neste país. Assim, o grau de
Bos indicus em uma carcaça poderia ser mais exato com o auxílio de ferramentas
genômicas (THOMPSON, 2002).
14
REFERÊNCIAS BIBLIOGRÁFICAS
AVENDAÑO, S.; WOOLLIAMS, J.A.; VILLANUEVA B. Prediction of accuracy of estimated Mendelian sampling terms. Journal of Animal Breeding and Genetics, v.122, n.5, p.302-308, 2005.
BOLORMAA, S.; PRYCE, J.E.; KEMPER, K.E.; HAYES, B.J.; ZHANG Y. et al. Detection of quantitative trait loci in Bos indicus and Bos taurus cattle using genome-wide association studies. Genetics Selection Evolution, v. 45, n.43, 2013a.
BOLORMAA, S.; PRYCE, J.E.; KEMPER, K.E.; SAVIN, K.; HAYES, B.J. et al. Accuracy of prediction of genomic breeding values for residual feed intake and carcass and meat quality traits in Bos taurus, Bos indicus, and composite beef cattle. Journal of Animal Science. v. 91, p. 3088-3104, 2013b.
CALUS, M.P.L. Genomic breeding value prediction: methods and procedures. Animal, v. 4, n. 2, p. 157-164, 2010.
CHRISTENSEN, O. F.; LUND, M. S. Genomic prediction when some animals are not genotyped. Genetics Selection Evolution, v. 42, n. 2, p. 1–8, 2010.
CLARK, S.A.; HICKEY, J.M.; DAETWYLER, H.D.; van der WERF, J.H.J. The importance of information on relatives for the prediction of genomic breeding values and the implications for the makeup of reference data sets in livestock breeding schemes, Genetics Selection Evolution, v. 44, n. 4, p. 1-9, 2012.
DUCROCQ, V.; LIU, Z. Combining genomic and classical information in national BLUP evaluations. Interbull Bull, v.40, p.172-177, 2009.
ERBE, M, HAYES, BJ, MATUKUMALLI, LK, GOSWAMI, S, BOWMAN, PJ, REICH, CM, MASON, BA, GODDARD, ME. Improving accuracy of genomic predictions within and between dairy cattle breeds with imputed high-density single nucleotide polymorphism panels. Journal of Dairy Science, v.95, p.4114-4129, 2012.
FORNI, S. et al. Different genomic relationship matrices for single-step analysis using phenotypic, pedigree and genomic information. Genetics Selection Evolution, v. 43, n. 1, p. 1–7, 2011.
GIANOLA, D. et al. A two-step method for detecting selection signatures using genetic markers. Genetics Research, v. 92, p. 141–155, 2010.
15
GODDARD M. Genomic selection: prediction of accuracy and maximization of long term response. Genetica, v.136, p.245–257, 2009.
HARRIS, B. L., AND D. L. JOHNSON. Genomic predictions for New Zealand dairy bulls and integration with national genetic evaluation. Journal of Dairy Science, v.93, p.1243-1252. 2010.
HENDERSON, C.R. Use of relationships among sires to increase accuracy of sire evaluation. Journal of Dairy Science, v. 58, 1731–1738, 1975.
HEYES, B. J. et al. Genetic architecture of complex traits and accuracy of genomic prediction: Coat colour, milk-fat percentage, and type in Holstein cattle as contrasting model traits. PLoS Genetics, v. 6, n. 9, p. 1–11, 2010.
JOSAHKIAN, L. A. Genetic improvement program for Zebu breeds. Proc. of 3rd Natl. Anim. Improv. Symp. p. 76-93, 2000.
KUEHN, L. A., KEELE, J. W., BENNETT, G. L., MCDANELD, T. G., SMITH, T. P., SNELLING, W. M., SONSTEGARD, T. S. & THALLMAN, R. M. Predicting breed composition using breed frequencies of 50,000 markers from the US Meat Animal Research Center 2,000 Bull Project. Journal of Animal Science, v.89, p.1742-50, 2011.
LEGARRA, A. et al. A relationship matrix including full pedigree and genomic information. Journal of Dairy Science, v. 92, n. 9, p. 4656–4663, 2009.
LYNCH, M.; WALSH, B. Genetics and Analysis of Quantitative Traits. Sinauer Associates, Massachusetts, p.131-177,980p. 1998.
MALÉCOT, G. Les Mathématiques de I’Hérédité. Paris: Masson, 63p., 1948
MARQUES, D. da C. Criação de Bovinos. 7 ed., rev., atual e ampl. Belo Horizonte: CVP, Consultoria Veterinária e Publicações, 2003, 586 f.
MCTAVISH, E., DECKER, JE, SCHNABEL, TD, TAYLOR, JF, HILLS DM 2013. New World Show Ancestry form Multiple Independent Domestication Events. PNAS 110, 1398-1406.
MEUWISSEN, T. H. E.; GODDARD, M. E. The use of marker haplotypes in animal breeding schemes. Genetics Selection Evolution, v. 28, p. 161–176, 1996.
16
MEUWISSEN, T. H. E. et al. Prediction of total genetic value using genome-wide dense marker maps. Genetics, v. 157, p. 1819–1829, 2001.
MEUWISSEN, T.H.E. Genomic selection: marker assisted selection on a genome wide scale. Journal of Animal Breeding and Genetics, v.124, p.321–322, 2007.
MUIR, W. M. Comparison of genomic and traditional BLUP estimated breeding value accuracy and selection response under alternative trait and genomic parameters. Journal of Animal Breeding and Genetics, v. 124, p. 342-355, 2007.
OLSON, K. M.; VANRADEN P. M.; TOOKER, M. E. Multibreed genomic evaluations using purebred Holsteins, Jerseys, and Brown Swiss. Journal of Dairy Science, v.95, p.5378-5383, 2012.
PATTERSON, H. D., THOMPSON R., Recovery of inter-block information when block sizes are equal. Biometrika, v.58, p.545–554, 1971.
PEREIRA J.C.C., Melhoramento genético aplicado à produção animal. Ed. FEPMVZ, Belo Horizonte, 6ª ed, p.204-227, 758p., 2012.
PORTO NETO L.R.; LEHNERT S.A.; FORTES M.R.S.; KELLY M.; REVERTER A. Population Stratification and Breed Composition of Australian Tropically Adapted Cattle. Proceedings of the Association for the Advancement of Animal Breeding and Genetics, v. 20 n. 4, 2013.
POWELL, E.J.; VISSCHER, P.M.;GODDARD, M.E., Reconciling the analysis of IBD and IBS in complex trait studies. Nature, v. 11, p. 800-805, 2010.
RESENDE, M.D.V.; LOPES, P.S.; SILVA, R. L.; PIRES, I.E. Seleção genômica ampla (GWS) e maximização da eficiência do melhoramento genético. Pesquisa Florestal Brasileira, n. 56, p. 63-77, 2008.
SU G., MADSEN P., NIELSEN U.S., MÄNTYSAARI E.A., AAMAND G.P., CHRISTENSEN O.F., LUND M.S. Genomic prediction for Nordic Red Cattle using one-step and selection index blending. Journal of Dairy Science, v.95, p.909–917, 2012.
TEASDALE, M., BRADLEY, DG. The Origins of Cattle. Bovine Genomics. 1ª ed., Online: John Wiley & Sons, 2012.
17
THOMPSON, J. Managing meat tenderness. Meat Science. v.62, p.295-308, 2002.
TIBSHIRANI, R. Regression shrinkage and selection via the Lasso. Journal of the Royal Statistics Society Series B, Oxford, v.58, p.267-288, 1996.
VANRADEN, P.M. Efficient methods to compute genomic predictions. Journal of Dairy Science, v. 91, p. 4414-23, 2008.
VANRADEN, P.M.; VAN TASSELL, C.P.; WIGGANS, G.R.; SONSTEGARD, T.S.; SCHNABEL, R.D.; TAYLOR, J.F.; SCHENKEL, F.S. Invited review: reliability of genomic predictions for North American Holstein bulls. Journal of Dairy Science, v. 92, p.16-24, 2009.
VAYEGO, S.A. Uso de modelos mistos na avaliação genética de linhagens de matrizes de frango de corte. 2007. 121f. Tese (Doutorado em Genética) – Universidade Federal do Paraná, 2007.
WRIGHT, S. Coefficients of inbreeding and relationship. American Naturalist, v. 51, p. 636-639, 1917.
YANG, J. et al. Common SNPs explain a large proportion of the heritability for human. Nature Genetics, v.42, p565-571, 2010.

18
CAPÍTULO 2 - ACCURACY OF GENOMIC SELECTION PREDICTIONS FOR STATURE IN CATTLE USING HD CHIP GENOTYPES: COMPARING RELATIONSHIP MATRICES ESTIMATED FROM PEDIGREE WITH GENOMIC DERIVED MATRICES
Accuracy of genomic selection predictions for hip height in Brahman cattle using HD
chip genotypes: comparing relationship matrices estimated from pedigree with genomic
derived matrices
Michel Marques FarahA, Marina R S FortesB, Matthew KellyB, Laercio R Porto-NetoC,
Camila Tangari MeiraA, Luis O C DuitamaA, Aldrin Vieira PiresD, Ricardo da FonsecaA,
Stephen S MooreB*
AFaculdade de Ciências Agrárias e Veterinárias, UNESP - Univ Estadual Paulista,
Jaboticabal, São Paulo 14884-900, Brazil.
BQueensland Alliance for Agriculture and Food Innovation, Centre for Animal Science, The
University of Queensland, Brisbane, Queensland 4072, Australia.
CCSIRO Food Futures Flagship and Animal, Food and Health Sciences, Queensland
Bioscience Precinct, Brisbane, QLD, 4067, Australia.
DUniversidade Federal dos Vales do Jequitinhonha e Mucuri, Diamantina, Minas Gerias,
39100-000, Brazil.
RUNNING HEAD: Genomic selection with different relationship matrices
*Corresponding author: [email protected]
19
Summary (80 words)
We compared 3 variations of genomic relationship matrices (G) with each other and with the
pedigree matrix (NRM). The use of G resulted in accuracies higher than 70%. The top 20% animals
(higher breeding values) were similar across methods. The use of the observed allele frequency was
the option for estimating G that gave variance and heritability results most similar to the pedigree
matrix and resulted in the higher accuracy of prediction.
Abstract (250 words)
Cattle selection is based on the phenotype of individuals and information of kinship, which is
traditionally derived from pedigree records. It is possible to predict kinship from genomic
information. Potential advantages of using a genomic relationship matrix (G) are reduced generation
interval and increased genetic evaluation accuracy. The objective of this study was to evaluate the
effects of genomic information in genetic evaluation, using different matrices built from genomic
and pedigree data in Brahman cattle. Hip height measurements from 1,695 animals were used. Cattle
were genotyped with high-density BeadChip or imputed (569,620 markers after quality control).
The pedigree matrix NRM was compared to the H matrix, which incorporated NRM and G matrices.
Genotypes were used to estimate 3 versions of G: observed allele frequency of each SNP (HGOF),
average minor allele frequency (HGMF), and 0.5 for all markers (HG50). For matrices comparisons,
animal data were either used in full or divided in calibration (80% older animals) and validation
(20% younger animals) datasets. All matrices had similar accuracies close to 0.80. Minor variances,
diagonal and off-diagonal elements, and estimated breeding values for NRM and HGOF were very
similar. The use of genomic information resulted in very similar relationship estimates when
compared to pedigree-based relationships. The top 20% animals were very similar for all matrices,
but ranking within these varied depending on the method used. The use of HGOF resulted in the
higher accuracy of prediction for hip height estimated breeding values.
Key words: genomics, Bos indicus, beef cattle, hip height, rare alleles
20
Introduction
Traditionally, animal selection studies target traits of interest and use the phenotype of individuals
and information of kinship derived from pedigree records. Recorded pedigree information is the
basis for building the relationship matrix NRM. This animal breeding and selection method is
efficient, but the process can be slow, especially for traits that are measured only in one sex such as
milk production, traits measured after the slaughter of animals, such as meat quality, or traits
measured late in life, for example, longevity. To enhance or accelerate selection programs focussed
on such traits, researchers seek to identify genes or genetic markers associated to the traits, enabling
the selection for animals carrying desirable alleles (Meuwissen and Goddard 1996).
A growing number of researchers are interested in the use of genomic information in animal
breeding programs (Meuwissen and Goddard, 1996; Christensen and Lund, 2010; Gianola et al.,
2010; Hayes et al., 2010; Erbe et al., 2012; Bolormaa et al., 2013). Advancement of technology and
the opportunity of genotyping a high number of individuals made possible to use information more
precise on alleles identical by state that can be shared through common ancestors in the pedigree
(including ancestors that may be missing from pedigree or not genotyped). This technology made
the use a genomic relationship matrix G feasible (Meuwissen et al., 2001; Forni et al., 2011),
allowing to increase accuracy of predicted breeding values in genetic evaluations. According to
Meuwissen et al. (2001), genomic selection (GS) using G increases the rate of genetic improvement
and reduces the cost of testing progeny. This model of “pre-selection” contributed greatly to the
rapid implementation of GS in dairy cattle, despite claims it may create bias (Patry and Ducrocq,
2011).
Breeding values are obtained, traditionally, using mixed model equations (MME) that use the
NRM relationship matrix (pedigree information). In one form of GS, NRM or G represent the
additive genetic matrix. However, in most circumstances, G includes genomic information of fewer
animals. So, Legarra et al. (2009) and Misztal et al. (2009) proposed a method that performs a
integration of the NRM and G matrices in a single H matrix, enabling genetic evaluation based on
21
Best Linear Unbiased Prediction (BLUP), which was successfully applied to dairy cattle (Aguilar et
al., 2010). Forni et al. (2011) used different ways to create the genomic relationship G matrix and
subsequent integration with the NRM matrix by varying the population allele frequencies used. Forni
et al. (2011) concluded that varying population allele frequencies to build G did not affect estimated
breeding values and variance components in a population of pigs. Despite the result in pigs, however
different outcomes may be obtained in other populations or species that present with a different
relationship structure. The pig industry is quite unique in its breeding practices and it is different
from beef cattle breeding. Thus, it is important to evaluate the contribution of genomic information
in genetic evaluation processes in different species and different population structures.
The objective of this study was to evaluate the effects of genomic information in genetic
evaluation of beef cattle, using different matrices built from genomic and pedigree data. The
population under investigation in this study is a population of Brahman cattle, with predominantly
(90%) Bos indicus genes (Bolormaa et al., 2011).
Methods
Animal Care and Use Committee approval was not required for this study because the data were
obtained from existing phenotypic databases and DNA storage banks as described in the following
section.
Phenotype and genotype data:
Height measurements taken from 1,695 Brahman animals between 15 and 18 months of age were
used in the current study. These cattle represent a subset of the extensively phenotyped population
bred by the Cooperative Research Centre for Beef Genetic Technologies (Beef CRC, Australia) that
has been described in detail previously (Barwick et al., 2009; Johnston et al., 2009; Corbet et al.,
2011; Fortes et al., 2011; Hawken et al., 2012). All individuals in this population have genotype
information for 777,000 SNP, and these high-density SNP data were genotyped or imputed. Animals
22
were genotyped using three different SNP chips: the BovineSNP50 bead chip (Matukumalli et al.,
2009) version 1 was used to genotype females, version 2 was used to genotype males (that combined
are the 1,695 phenotyped animals), and the high-density SNP chip was used to genotype 917
samples. These 917 samples were from sires and selected representative animals of the Beef CRC
populations, which were genotyped with the high-density SNP chip to allow for genotype
imputation, using the BEAGLE program (Browning and Browning, 2011) with average of
imputation accuracy of 0.90. Further detail on genotyping, imputation and quality control was
described previously (Bolormaa et al., 2013). All SNP chips were processed according to the
manufacturer’s protocols (Illumina Inc., San Diego, CA). Repeated samples were included in the
genotyping for quality assurance, and BEAD STUDIO software (Illumina Inc., San Diego, CA) was
used to determine genotype calls.
In quality control analysis, SNP was excluded if: the minor allele frequency was smaller than 0.05
or the correlation between SNP genotypes was bigger than 0.95. After quality control procedures,
569,620 SNPs remained and were used to estimate genomic relationship coefficients in the G
matrices.
The pedigree information used to build the matrix NRM was composed by 3,030 animals,
including the genotyped animals that corresponded to 55.94% of the total population.
Statistical data analysis:
Estimated breeding values for hip height (HH) were calculated following the animal model
represented below, in matrix notation:
� = �� + �� + �
were y is the vector of observations; X is a incidence matrix of the fixed effects that included
information of sex, cohort (interaction between year of birth and farm), and age at HH measurement
was fitted as covariate; β is a vector of the fixed effects; Z is a incidence matrix of the genetics
random effects; a is a vector of the animal random effects, representing the additive genetic values
23
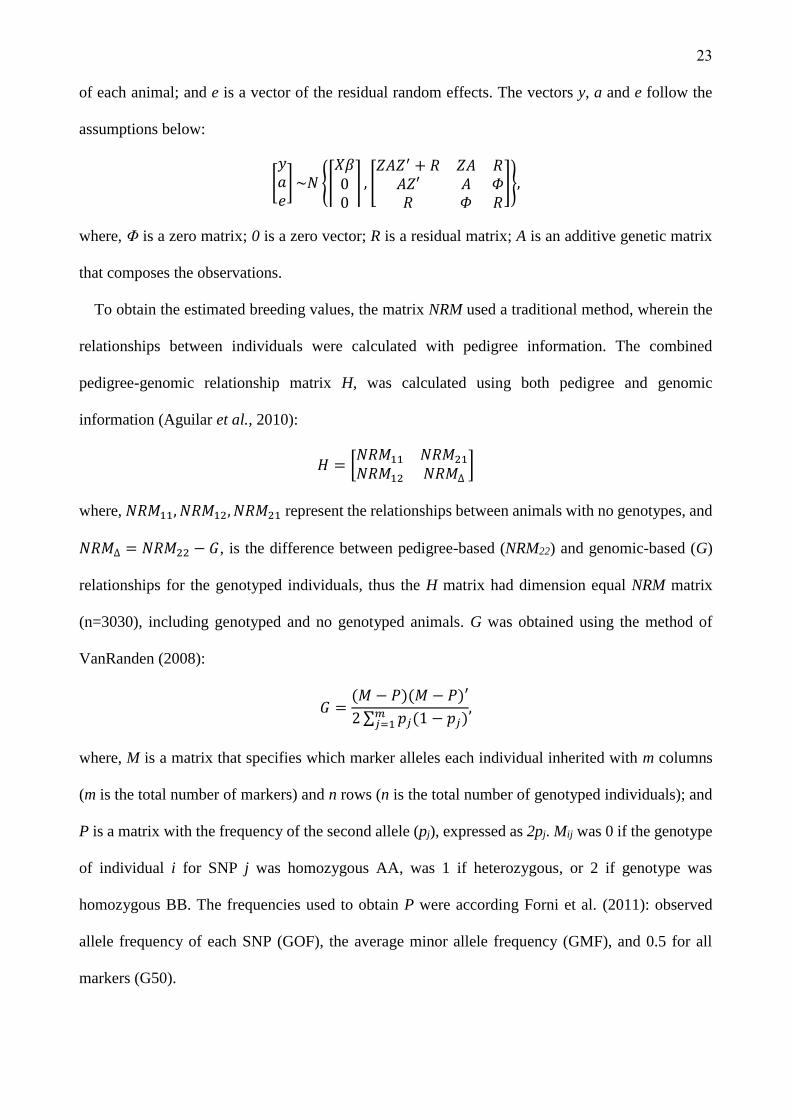
of each animal; and e is a vector of the residual random effects. The vectors y, a and e follow the
assumptions below:
���� ~ ����00 , ����� + � �� ���′ � �� � ���, where, Φ is a zero matrix; 0 is a zero vector; R is a residual matrix; A is an additive genetic matrix
that composes the observations.
To obtain the estimated breeding values, the matrix NRM used a traditional method, wherein the
relationships between individuals were calculated with pedigree information. The combined
pedigree-genomic relationship matrix H, was calculated using both pedigree and genomic
information (Aguilar et al., 2010):
� = ����� �������� ��∆ �
where, ����, ����, ���� represent the relationships between animals with no genotypes, and
��∆ = ���� − �, is the difference between pedigree-based (NRM22) and genomic-based (G)
relationships for the genotyped individuals, thus the H matrix had dimension equal NRM matrix
(n=3030), including genotyped and no genotyped animals. G was obtained using the method of
VanRanden (2008):
� = (� − �)(� − �)′2 ∑ !"(1 − !")#"$� , where, M is a matrix that specifies which marker alleles each individual inherited with m columns
(m is the total number of markers) and n rows (n is the total number of genotyped individuals); and
P is a matrix with the frequency of the second allele (pj), expressed as 2pj. Mij was 0 if the genotype
of individual i for SNP j was homozygous AA, was 1 if heterozygous, or 2 if genotype was
homozygous BB. The frequencies used to obtain P were according Forni et al. (2011): observed
allele frequency of each SNP (GOF), the average minor allele frequency (GMF), and 0.5 for all
markers (G50).

24
To avoid problems with inversion in MME, we also used the method proposed by VanRaden
(2008) that includes a weighting between G and NRM22 matrices:
�% = %� + (1 − %)����, where, Gw is a genomic matrix used to obtain the inverse of H matrix; G is an initial genomic matrix,
before weighting; w is a weighting factor equal to 0.95, Aguilar et al. (2010) reported negligibe
differences in GEBV unsing w between 0.95 and 0.98; and NRM22 is the subset of the pedigree
relationship matrix with the genotyped animals.
After obtaining the weighted Gw matrix, we used the method developed by Aguilar et al. (2010)
and Christensen & Lund (2010) to calculate the inverse of H:
�&� = ��&� + �0 00 �%&� − ����&��, where, H-1 is the inverse of the pedigree-genomic relationship matrix; NRM-1 is the inverse of the
pedigree relationship matrix; �'&� is the inverse of the genomic matrix; and ����&� is an the inverse
of the pedigree relationship matrix of the genotyped individuals. Related to the variations in allele
frequencies used to build the G matrices, we built 3 versions of the H matrix: HGOF, HGMF, and HG50.
Thus, obtained the variations of H matrix, the additive genetic matrix, NRM or G, on MME can
be replaced by H and obtain the genomic breeding values (GEBV).
To obtain the inversions of these matrices, the estimates of the variance components and genetic
parameters, we used restricted maximum likelihood (REML) methods in Wombat (Meyer 2007).
To compare the accuracies of GEBVs obtained with each H matrix, the mean accuracy was
estimated using the prediction error variance (PEV):
*- = .1 − �/3"456�
where, *- is the accuracy of mean additive value for each matrix i; 456� is the additive variance
estimated for each matrix i; �/3" is the prediction error variance for each animal j estimated by the
matrix i. These PEV was obtained by Wombat, which provides approximate sampling errors.
25
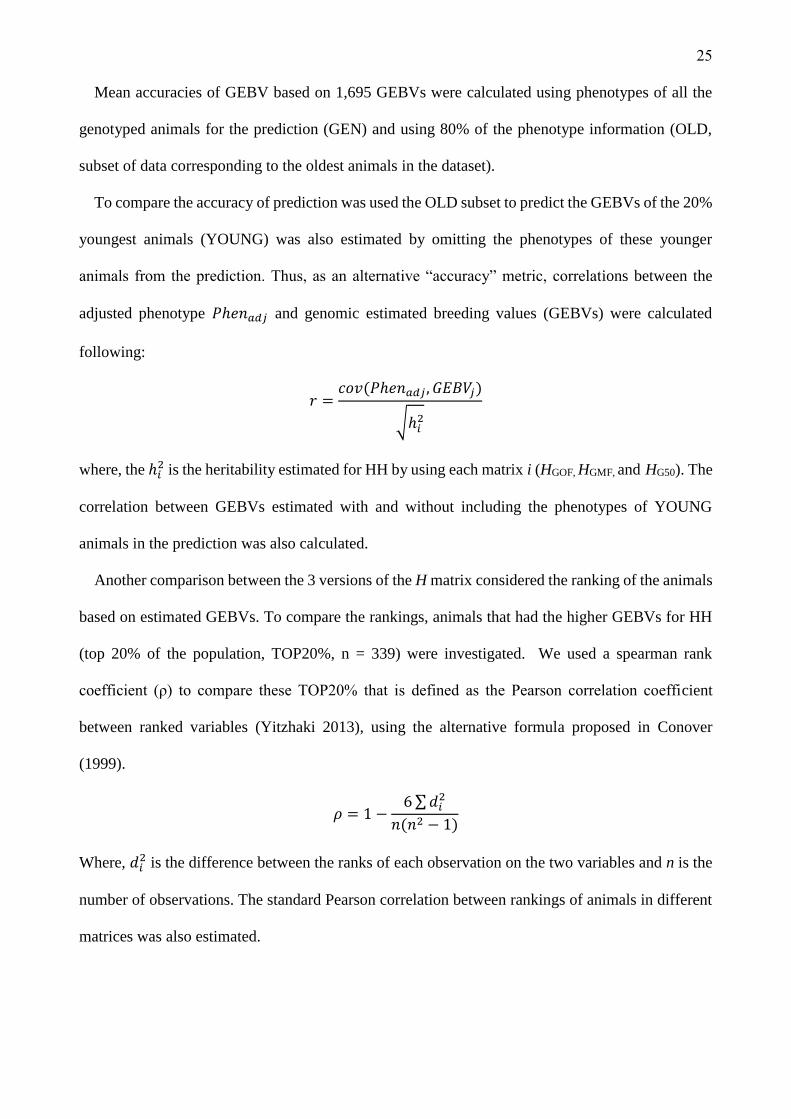
Mean accuracies of GEBV based on 1,695 GEBVs were calculated using phenotypes of all the
genotyped animals for the prediction (GEN) and using 80% of the phenotype information (OLD,
subset of data corresponding to the oldest animals in the dataset).
To compare the accuracy of prediction was used the OLD subset to predict the GEBVs of the 20%
youngest animals (YOUNG) was also estimated by omitting the phenotypes of these younger
animals from the prediction. Thus, as an alternative “accuracy” metric, correlations between the
adjusted phenotype �ℎ�859" and genomic estimated breeding values (GEBVs) were calculated
following:
* = :;<(�ℎ�859", �/>3")?ℎ-�
where, the ℎ-� is the heritability estimated for HH by using each matrix i (HGOF, HGMF, and HG50). The
correlation between GEBVs estimated with and without including the phenotypes of YOUNG
animals in the prediction was also calculated.
Another comparison between the 3 versions of the H matrix considered the ranking of the animals
based on estimated GEBVs. To compare the rankings, animals that had the higher GEBVs for HH
(top 20% of the population, TOP20%, n = 339) were investigated. We used a spearman rank
coefficient (ρ) to compare these TOP20% that is defined as the Pearson correlation coefficient
between ranked variables (Yitzhaki 2013), using the alternative formula proposed in Conover
(1999).
@ = 1 − 6 ∑ B-�8(8� − 1)
Where, B-� is the difference between the ranks of each observation on the two variables and n is the
number of observations. The standard Pearson correlation between rankings of animals in different
matrices was also estimated.

26
Results
Relationship coefficients
Descriptive statistics of the relationship coefficients estimated for genotyped animals are provided
in Table 1. Minor variances and both diagonal elements and off-diagonal elements were obtained
for HGOF, HGMF, and HG50 and the NRM matrix. For the diagonal elements, the NRM matrix had
smaller variance, probably because the inbreeding value of this population is very small, how
indicated on mean of diagonal to NRM, indicating that there is low relationship between studied
families. In addition, it can be explained because the NRM is incomplete. In this population the no
genotyped animals represent 55.94% of all animals. Also, the NRM matrix calculates the probability
of kinship, decreasing the variances of the elements. However, when genomic information was used
these families did shared common alleles and the estimated relationship coefficients were different
(Table 1). For off-diagonal elements, the matrices A and HGOF were very similar. The greatest
variance and relationship coefficients were found in HGMF, followed by HG50, both of these matrices
have used the same allele frequency for all markers: 0.50 or 0.27 (the average minor allele frequency
was 0.27). Observed allele frequencies were distant from 0.5 for many markers (Fig. 1), which may
be an effect of SNP chip development, based mostly on Bos taurus data not Bos indicus (Gibbs et
al. 2009).
(Insert Table 1 about here)
(Insert Fig 1 about here)
Variance components
The estimates of variance components are presented in Table 2. The data used to compare variance
components were either the full phenotype dataset of genotyped animals (GEN, n = 1,695) or a
subset that included 80% of the oldest animals data (OLD, n = 1,356). In both GEN and OLD
datasets the variance components were similar when matrices estimated with the same methodology
were compared (i.e. the A matrix of GEN was similar to the A matrix of OLD). However, when

27
matrices estimated with difference methodologies were compared the variance components were
different. For example, HG50 resulted in higher additive variances while A resulted in smaller. These
differences between matrices are in contrast to the data presented by Forni et al. (2011), who
detected that the additive variance was higher when the difference between the average diagonal and
the off-diagonal elements of the matrix was smaller. In our study, the differences in of the diagonal
and off-digonal elemens estimated with A, HGOF and HGMF were not important (0.99, 1.03 and 0.93
respectively), but the additive variances were different. Only for HG50 this relation found in Forni et
al. (2011) was true. For HG50, the difference between the coefficients was 0.68.
(Insert Table 2 about here)
Breeding values and accuracies
Average GEBVs of genotyped animals were similar for the matrices A and HGOF. Average GEBVs
were also similar for the matrices HGMF and HG50 (Table 3). When phenotypes of the 20% youngest
animals (YOUNG) were omitted, GEBVs remained similar (Table 3).
(Insert Table 3 about here)
Correlations between GEBVs of all genotyped animals estimated using different matrices are
presented in Fig. 2. On average, the choice of relationship matrix did not influence GEBVs, as
correlations were high. However, when validation phenotypes were omitted (20% YOUNG
omitted), the GEBVs estimated for the youngest animals in the population varied and correlations
between GEBV from H matrices and A were lower (Fig. 3).
(Insert Fig 2 about here)
(Insert Fig 3 about here)
The average accuracies, using GEN phenotype information (n = 1,695), 80% of the phenotype
information represented by the oldest animals (OLD, n = 1356) and just for the 20% of youngest

28
animals that the phenotype was omitted for validation (YOUNG, n = 339) are show in Table 4. This
Table represent the accuracies of prediction in YOUNG population and correlations for GEN and
OLD based in GEBVs estimated with the adjusted phenotype. To YOUNG subset, the accuracies of
prediction were based on 339 GEBVs and the correlations were made with the GEBVs estimated
with and without the phenotypic information. The GEBVs predicted for GEN and OLD in all
matrices did not had significant difference. However, the accuracy of GEBVs when YOUNG
phenotypes were omitted decreased, it as expected, but the accuracy was less to NRM matrix when
compared with the inclusion of genomic information (Table 4). In the present study, the average
accuracy reflects more variance components estimates than predictive ability, thus, HGOF provided
a better rate �/3- 456�C than others matrix. Because this, the average accuracy for HGOF was highest
in all population scenarios.
(Insert Table 4 about here)
All the matrices estimated a high correlation (predictive ability) in GEN and OLD scenarios
(Table 4). These correlations was calculated using the GEBVs estimated and the adjusted phenotype.
The correlations showed in YOUNG scenario was calculated between the GEBVs estimated with
and without the phenotype information and for all genomic matrices this correlation was bigger than
NRM matrix.
Other difference between matrices is in the ranking of individual animals (Supplementary Table
S1). Table 5 shows the number of common animals when the 20% genotyped animals with higher
GEBVs were selected (TOP20%, n = 339). From this TOP20%, 87% of the animals were the same
when comparing NRM with any of the H matrices. Between different H matrices 99% of the
TOP20% animals were same (Fig. 4, Fig. 5). However, the ranking of these TOP20% animals was
different between matrices, and these differences in ranking impact on the correlations between
matrices (Fig. 3). In the comparisons between H matrices almost all TOP20% animals were the same
29
and the Spearman coefficient between ranking positions were higher. In the comparisons between
NRM and the H matrices, the correlations between ranking of animals were also similar, around
0.83.
(Insert Table 5 about here)
(Insert Fig 4 about here)
(Insert Fig 5 about here)
Discussion
Relationships using the observed allele frequencies can provided more accurate GEBV
predictions, when compared to pedigree derived relationships. It is possible that the increased
accuracy observed results from more precise estimates of genetic covariance between relatives
(Clark et al. 2012). Estimates of genetic covariance in G matrices are influenced by allele
frequencies in the population. Ideally, G matrices should be estimated using the allele frequencies
from the unselected base population, which is not available. In real situation is practically impossible
to obtain this information and the three methods tested alternative solutions: using the observed
allele frequencies (HGOF), the minor allele frequencies (HGMF) and a fixed frequency (HG50). In our
study, using HGOF seemed advantageous as this matrix presented a greater similarity to NRM in terms
of the variance components and resulted in higher accuracies for predicted GEBVs, an artefact of
inflated additive variance. It is possible that HGOF was the best option in our study for two reasons:
the presence of extreme allele frequencies observed for many markers and the fact that the validation
population was not independent from the calibration dataset. As the YOUNG animals used for
validation are related to the OLD animals (calibration), it is expected that observed allele frequencies
are similar in both subgroups of this Brahman population.
The variance components obtained using HGOF and NRM were quite similar in this study. This
similarity is consistent with the findings of Riley et al. (2007). Variance components in HGMF and
HG50 were less similar to NRM than those in HGOF and may have been inflated with the use of fixed

30
allele frequencies. Several researcher related problems with inflated estimates of variance
components (Aguilar et al. 2010; Forni et al. 2011; Chen et al. 2011) due to false kinship
coefficients, in this case in HGMF and HG50 matrices, that showed a higher values than NRM or HGOF.
When observed allele frequencies are distant from 0.5, “rare” alleles have greater influence in the
relationship estimated and this may be the underlying reason approximating HG50 to HGMF and
distancing these from NRM and HGOF. This difference between NRM and HG50 or HGMF was not
observed in a previous study that tested the same variations of H in a population of pigs (Forni et al.
2011). Average MAF in our population was similar to that observed in the pig population studied
by Forni et al. (2011): 0.24 and 0.27, respectively. However, the distribution of allele frequencies
was different: while in pig population allele frequencies were all close to 0.5, in the Brahman cattle
population many markers had allele frequencies distant from 0.5. Presence of these markers that are
“rare” (allele frequency distant from 0.5) may reflect the fact that the families in this population can
be distinct, whereas that the high density SNP chip was developed using markers selected from Bos
Taurus animals and Bos indicus. And the animals of current population were genotyped or inputted
to high density SNP chip.
In addition, using the same allele frequency for all SNPs increased the correlation between the
animals, also the estimates of variance components in the population and PEV for each animal were
increased (Table 2). In the case of HGMF these PEVs were bigger than additive variance, thus, the
accuracies were not calculated because generated a negative numbers.
The difference between the elements of the diagonal and off-diagonal elements were
approximately one for all matrices, disagreeing with the (Forni et al. 2011) who concluded that the
inflation of genetic values can be related to this difference between how much individuals are more
closely related (off-diagonal elements) and the average inbreeding of the population (diagonal
elements). These genetic values inflated can be explained by the alleles frequencies, when the same
frequency was used the animals unrelated were more related because decrease the importance of
rare alleles.
31
Our results support the idea of observing and evaluating population allele frequencies prior to
construction of G matrices for improved accuracies. The pig industry is quite unique in its breeding
practices and it is different from beef cattle breeding. Therefore, H matrices that were used with no
apparent difference to predictions in pigs (i.e. HG50 and HGMF) may not be ideal for the studied
Brahman population. Nonetheless, correlations between GEBVs and adjusted phenotypes were
similar regardless of the H matrix used.
Other point, is that need be observed is that these correlations, accuracies and prediction ability,
following the formulas described above, and are influenced by the additive variance estimated for
each matrix and consequently the heritability. So, if the estimated additive variance was inflated
may be these results were sub estimated. Bijma (2012) showed that the ordinary accuracies of
estimated breeding values (EBVs) obtained form genetic evaluations may deviate very substantially
from the correlation between true and EBVs.
The TOP20% animals (339 animals with higher GEBVs) were a similar group irrespective of
which H or NRM matrix formulation was used. However, within this TOP20% the individual
rankings of animals varied. Variation in ranking of animals may be a problematic issue for practical
application of genomic selection, because of commercial implications. In some countries, bull
ranking is used as a marketing tool and the bull ranked number one could sell more doses of semen,
or achieve a higher price on an auction and finally sire a higher number of offspring in the following
generation. Evidently, if the use of different methods (NRM, HGOF, HGMF and HG50) leads to a
different bull ranked, there is room for discussion and conflict of interest. In the dairy industry, this
issue seems more openly discussed or overcome by a standardization of the genomic method used.
In the beef industry, this is not resolved yet. The TOP20% as a group is very similar between
methods and in most industries, but specially where artificial insemination (AI) is not so common
this is probably enough to avoid any conflict, as all TOP20% are equally likely to sire the next
generation. Ideally, for the top bull to be in fact the “best” sire of future generations, a progeny test
of the best group of animals (TOP20%) would be performed.
32
Conclusions
In this study, the use of genomic information resulted in very similar relationship estimates when
compared to pedigree based relationships in beef cattle. The use of the observed allele frequency
seems to be the best option for estimating G; this method (HGOF) estimated relationships most similar
to those of the NRM matrix and resulted in the higher accuracy of predictions, in the studied
population allele frequencies were distant from 0.5 for many markers. Was a clear the differences
between the ranking presented in TOP20%, despite all genomic matrices resulted in similar animals
being selected, more studies are necessary to choose how matrix (NRM or Genomic matrices)
selected the rank more accurate. This variation may have implications for cattle breeding
commercial practices. Matrices HGMF and HG50 can be a good alternative to selection method but not
to evaluate the genetic progress in this beef cattle population.
Acknowledgements
The authors acknowledge that this research uses resources of the Cooperative Research Centre for
Beef Genetic Technologies (Beef CRC) and the financial support for genotyping Brahman animals
was provided by Meat and Livestock Australia (project code B.NBP.0723). We thank the support
of CAPES (Process: 13843/12-5). The Lab of scientific computation applied to animal science
(LuCCA-Z), QAAFI and CSIRO are acknowledged for providing the structure available.
References
Aguilar, I, Misztal, I, Johnson, DL, Legarra, A, Tsuruta, S, Lawlor, TJ (2010) Hot topic: A unified approach to utilize phenotypic, full pedigree, and genomic information for genetic evaluation of Holstein final score. J Dairy Sci 93, 743-752.
Barwick, SA, Johnston, DJ, Burrow, HM, Holroyd, RG, Fordyce, G, Wolcott, ML, Sim, WD, Sullivan, MT (2009) Genetics of heifer performance in 'wet' and 'dry' seasons and their relationships with steer performance in two tropical beef genotypes. Animal Production Science 49, 367-382.

33
Bolormaa, S, Pryce, JE, Kemper, K, Savin, K, Hayes, BJ, Barendse, W, Zhang, Y, Reich, CM, Mason, BA, Bunch, RJ, Harrison, BE, Reverter, A, Herd, RM, Tier, B, Graser, HU, Goddard, ME (2013) Accuracy of prediction of genomic breeding values for residual feed intake and carcass and meat quality traits in Bos taurus, Bos indicus, and composite beef cattle. J Anim Sci 91, 3088-104.
Browning, BL, Browning, SR (2011) A Fast, Powerful Method for Detecting Identity by Descent. American Journal of Human Genetics 88, 173-182.
Christensen, OF, Lund, MS (2010) Genomic prediction when some animals are not genotyped. Genet Sel Evol 42, 2.
Clark, SA, Hickey, JM, Daetwyler, HD, van der Werf, JH (2012) The importance of information on relatives for the prediction of genomic breeding values and the implications for the makeup of reference data sets in livestock breeding schemes. Genet Sel Evol 44, 4.
Conover, WJ (Ed. WsipasApas section (1999) 'Practical nonparametric statistics.' (Wiley: New York)
Corbet, NJ, Burns, BM, Corbet, DH, Crisp, JM, Johnston, DJ, McGowan, MR, Venus, BK, Holroyd, RG (2011) 'Bull traits measured early in life as indicators of herd fertility, Proceedings of the 19th Conference of the Association for the Advancement of Animal Breeding and Genetics.' Perth, W.A., Australia, 19-21 July, 2011. Available at <Go to ISI>://CABI:20113386669
Erbe, M, Hayes, BJ, Matukumalli, LK, Goswami, S, Bowman, PJ, Reich, CM, Mason, BA, Goddard, ME (2012) Improving accuracy of genomic predictions within and between dairy cattle breeds with imputed high-density single nucleotide polymorphism panels. J Dairy Sci 95, 4114-4129.
Forni, S, Aguilar, I, Misztal, I (2011) Different genomic relationship matrices for single-step analysis using phenotypic, pedigree and genomic information. Genet Sel Evol 43, 1.
Fortes, MR, Reverter, A, Nagaraj, SH, Zhang, Y, Jonsson, NN, Barris, W, Lehnert, S, Boe-Hansen, GB, Hawken, RJ (2011) A single nucleotide polymorphism-derived regulatory gene network underlying puberty in 2 tropical breeds of beef cattle. J Anim Sci 89, 1669-83.
Gianola, D, Simianer, H, Qanbari, S (2010) A two-step method for detecting selection signatures using genetic markers. Genet Res (Camb) 92, 141-55.
Gibbs, RA, Taylor, JF, Van Tassell, CP, Barendse, W, Eversoie, KA, Gill, CA, Green, RD, Hamernik, DL, Kappes, SM, Lien, S, Matukumalli, LK, McEwan, JC, Nazareth, LV, Schnabel, RD, Weinstock, GM, Wheeler, DA, Ajmone-Marsan, P, Boettcher, PJ, Caetano, AR, Garcia, JF, Hanotte, O, Mariani, P, Skow, LC, Williams, JL, Diallo, B, Hailemariam, L, Martinez, ML, Morris, CA, Silva, LOC, Spelman, RJ, Mulatu, W, Zhao, K, Abbey, CA, Agaba, M, Araujo, FR, Bunch, RJ, Burton, J, Gorni, C, Olivier, H, Harrison, BE, Luff, B, Machado, MA, Mwakaya, J, Plastow, G, Sim, W, Smith, T, Sonstegard, TS, Thomas, MB, Valentini, A, Williams, P, Womack, J, Wooliams, JA, Liu, Y, Qin, X, Worley, KC, Gao, C, Jiang, H, Moore, SS, Ren, Y, Song, X-Z, Bustamante, CD, Hernandez, RD, Muzny, DM, Patil, S, Lucas, AS, Fu, Q, Kent, MP, Vega, R, Matukumalli, A, McWilliam, S, Sclep, G, Bryc, K, Choi, J, Gao, H, Grefenstette, JJ, Murdoch, B, Stella, A, Villa-Angulo, R, Wright, M, Aerts, J, Jann, O, Negrini, R, Goddard, ME, Hayes, BJ, Bradley, DG, da Silva, MB, Lau, LPL, Liu, GE, Lynn, DJ, Panzitta, F, Dodds, KG (2009) Genome-Wide Survey of SNP Variation Uncovers the Genetic Structure of Cattle Breeds. Science 324, 528-532.
Hawken, RJ, Zhang, YD, Fortes, MR, Collis, E, Barris, WC, Corbet, NJ, Williams, PJ, Fordyce, G, Holroyd, RG, Walkley, JR, Barendse, W, Johnston, DJ, Prayaga, KC, Tier, B, Reverter, A, Lehnert, SA (2012) Genome-wide association studies of female reproduction in tropically adapted beef cattle. J Anim Sci 90, 1398-410.
Hayes, BJ, Pryce, J, Chamberlain, AJ, Bowman, PJ, Goddard, ME (2010) Genetic Architecture of Complex Traits and Accuracy of Genomic Prediction: Coat Colour, Milk-Fat Percentage, and Type in Holstein Cattle as Contrasting Model Traits. Plos Genetics 6,
34
Johnston, DJ, Barwick, SA, Corbet, NJ, Fordyce, G, Holroyd, RG, Williams, PJ, Burrow, HM (2009) Genetics of heifer puberty in two tropical beef genotypes in northern Australia and associations with heifer- and steer-production traits. Animal Production Science 49, 399-412.
Legarra, A, Aguilar, I, Misztal, I (2009) A relationship matrix including full pedigree and genomic information. J Dairy Sci 92, 4656-4663.
Matukumalli, LK, Lawley, CT, Schnabel, RD, Taylor, JF, Allan, MF, Heaton, MP, O'Connell, J, Moore, SS, Smith, TP, Sonstegard, TS, Van Tassell, CP (2009) Development and characterization of a high density SNP genotyping assay for cattle. PLoS ONE 4, e5350.
Meuwissen, T, Goddard, M (1996) The use of marker haplotypes in animal breeding schemes. Genetics Selection Evolution 28, 161-176.
Meuwissen, THE, Hayes, BJ, Goddard, ME (2001) Prediction of total genetic value using genome-wide dense marker maps. Genetics 157, 1819-1829.
Meuwissen, THE, Luan, T, Woolliams, JA (2011) The unified approach to the use of genomic and pedigree information in genomic evaluations revisited. Journal of Animal Breeding and Genetics 128, 429-439.
Meyer, K (2007) WOMBAT: a tool for mixed model analyses in quantitative genetics by restricted maximum likelihood (REML). J Zhejiang Univ Sci B 8, 815-21.
Misztal, I, Legarra, A, Aguilar, I (2009) Computing procedures for genetic evaluation including phenotypic, full pedigree, and genomic information. J Dairy Sci 92, 4648-4655.
Patry, C, Ducrocq, V (2011) Evidence of biases in genetic evaluations due to genomic preselection in dairy cattle. Journal of Dairy Science 94, 1011-1020.
Quaas, RL (1976) Computing diagonal elements and inverse of a large numerator relationship matrix. Biometrics 32, 949-953.
Riley, DG, Coleman, SW, Chase, CC, Jr., Olson, TA, Hammond, AC (2007) Genetic parameters for body weight, hip height, and the ratio of weight to hip height from random regression analyses of Brahman feedlot cattle. J Anim Sci 85, 42-52.
VanRaden, PM (2008) Efficient methods to compute genomic predictions. J Dairy Sci 91, 4414-23. VanRaden, PM, Van Tassell, CP, Wiggans, GR, Sonstegard, TS, Schnabel, RD, Taylor, JF,
Schenkel, FS (2009) Invited review: reliability of genomic predictions for North American Holstein bulls. J Dairy Sci 92, 16-24.
Yitzhaki S, Schechtman E (2013) The Gini Methodology: A Primer on a Statistical Methodology. Editor: Springer New York Heidelberg Dordrecht London, 548.
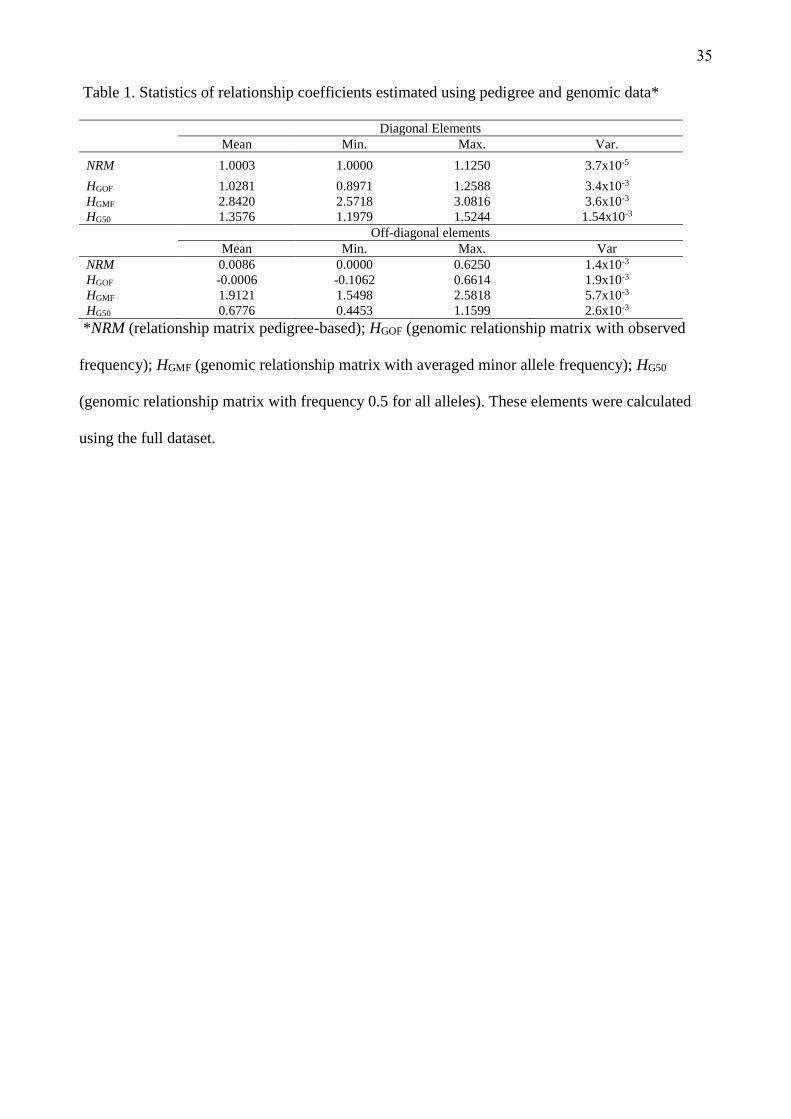
35
Table 1. Statistics of relationship coefficients estimated using pedigree and genomic data*
Diagonal Elements Mean Min. Max. Var.
NRM 1.0003 1.0000 1.1250 3.7x10⁻⁵
HGOF 1.0281 0.8971 1.2588 3.4x10⁻³
HGMF 2.8420 2.5718 3.0816 3.6x10⁻³
HG50 1.3576 1.1979 1.5244 1.54x10⁻³
Off-diagonal elements Mean Min. Max. Var NRM 0.0086 0.0000 0.6250 1.4x10⁻³
HGOF -0.0006 -0.1062 0.6614 1.9x10⁻³
HGMF 1.9121 1.5498 2.5818 5.7x10⁻³
HG50 0.6776 0.4453 1.1599 2.6x10⁻³
*NRM (relationship matrix pedigree-based); HGOF (genomic relationship matrix with observed
frequency); HGMF (genomic relationship matrix with averaged minor allele frequency); HG50
(genomic relationship matrix with frequency 0.5 for all alleles). These elements were calculated
using the full dataset.
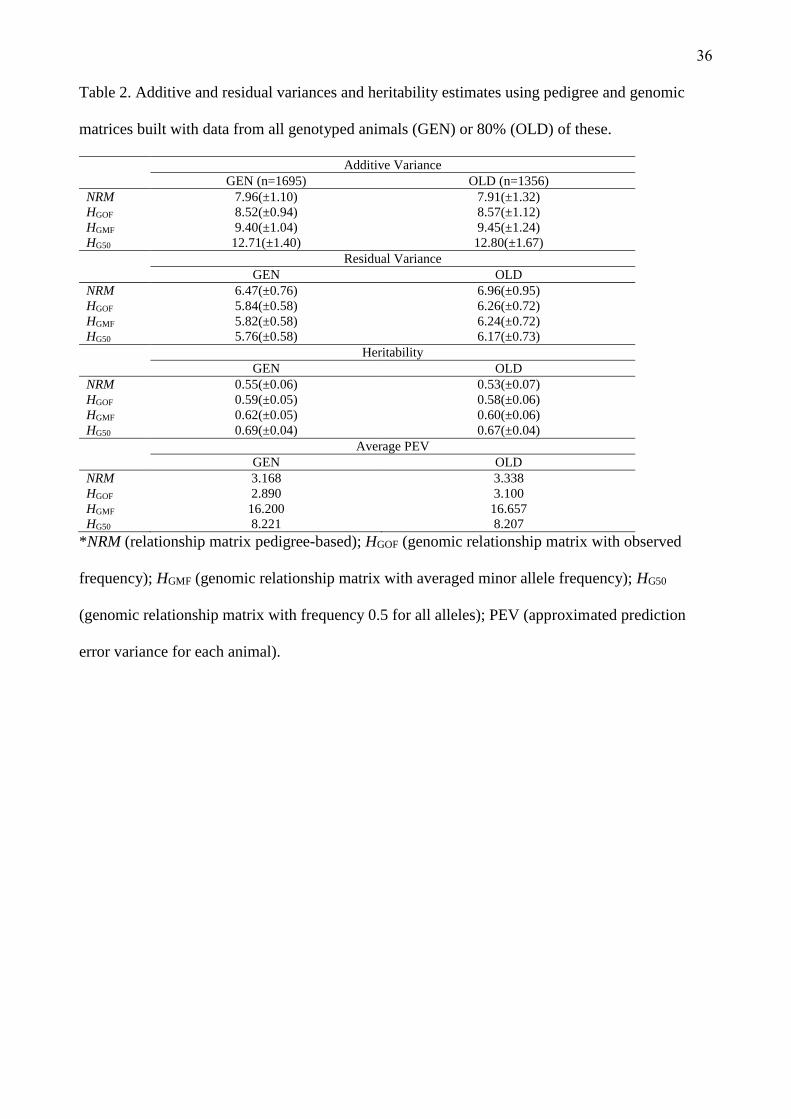
36
Table 2. Additive and residual variances and heritability estimates using pedigree and genomic
matrices built with data from all genotyped animals (GEN) or 80% (OLD) of these.
Additive Variance GEN (n=1695) OLD (n=1356)
NRM 7.96(±1.10) 7.91(±1.32) HGOF 8.52(±0.94) 8.57(±1.12) HGMF 9.40(±1.04) 9.45(±1.24) HG50 12.71(±1.40) 12.80(±1.67) Residual Variance GEN OLD NRM 6.47(±0.76) 6.96(±0.95) HGOF 5.84(±0.58) 6.26(±0.72) HGMF 5.82(±0.58) 6.24(±0.72) HG50 5.76(±0.58) 6.17(±0.73) Heritability GEN OLD NRM 0.55(±0.06) 0.53(±0.07) HGOF 0.59(±0.05) 0.58(±0.06) HGMF 0.62(±0.05) 0.60(±0.06) HG50 0.69(±0.04) 0.67(±0.04) Average PEV GEN OLD NRM 3.168 3.338 HGOF 2.890 3.100 HGMF 16.200 16.657 HG50 8.221 8.207
*NRM (relationship matrix pedigree-based); HGOF (genomic relationship matrix with observed
frequency); HGMF (genomic relationship matrix with averaged minor allele frequency); HG50
(genomic relationship matrix with frequency 0.5 for all alleles); PEV (approximated prediction
error variance for each animal).
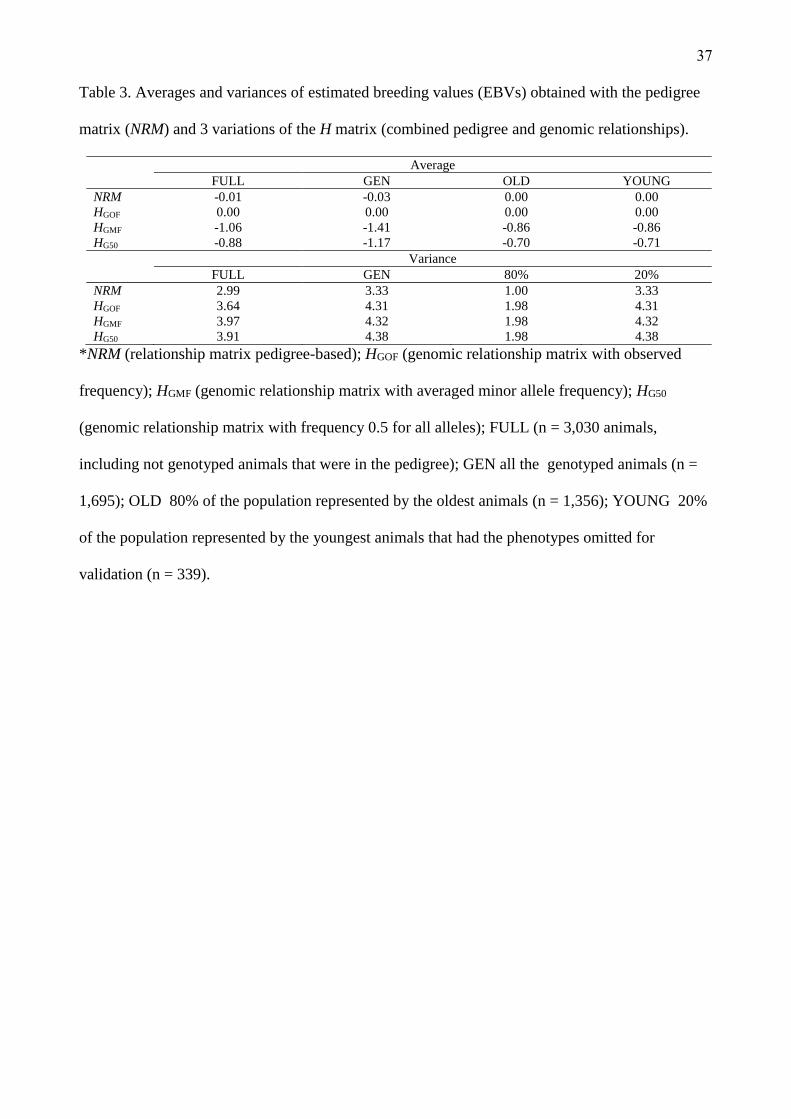
37
Table 3. Averages and variances of estimated breeding values (EBVs) obtained with the pedigree
matrix (NRM) and 3 variations of the H matrix (combined pedigree and genomic relationships).
Average FULL GEN OLD YOUNG
NRM -0.01 -0.03 0.00 0.00 HGOF 0.00 0.00 0.00 0.00 HGMF -1.06 -1.41 -0.86 -0.86 HG50 -0.88 -1.17 -0.70 -0.71 Variance FULL GEN 80% 20% NRM 2.99 3.33 1.00 3.33 HGOF 3.64 4.31 1.98 4.31 HGMF 3.97 4.32 1.98 4.32 HG50 3.91 4.38 1.98 4.38
*NRM (relationship matrix pedigree-based); HGOF (genomic relationship matrix with observed
frequency); HGMF (genomic relationship matrix with averaged minor allele frequency); HG50
(genomic relationship matrix with frequency 0.5 for all alleles); FULL (n = 3,030 animals,
including not genotyped animals that were in the pedigree); GEN all the genotyped animals (n =
1,695); OLD 80% of the population represented by the oldest animals (n = 1,356); YOUNG 20%
of the population represented by the youngest animals that had the phenotypes omitted for
validation (n = 339).
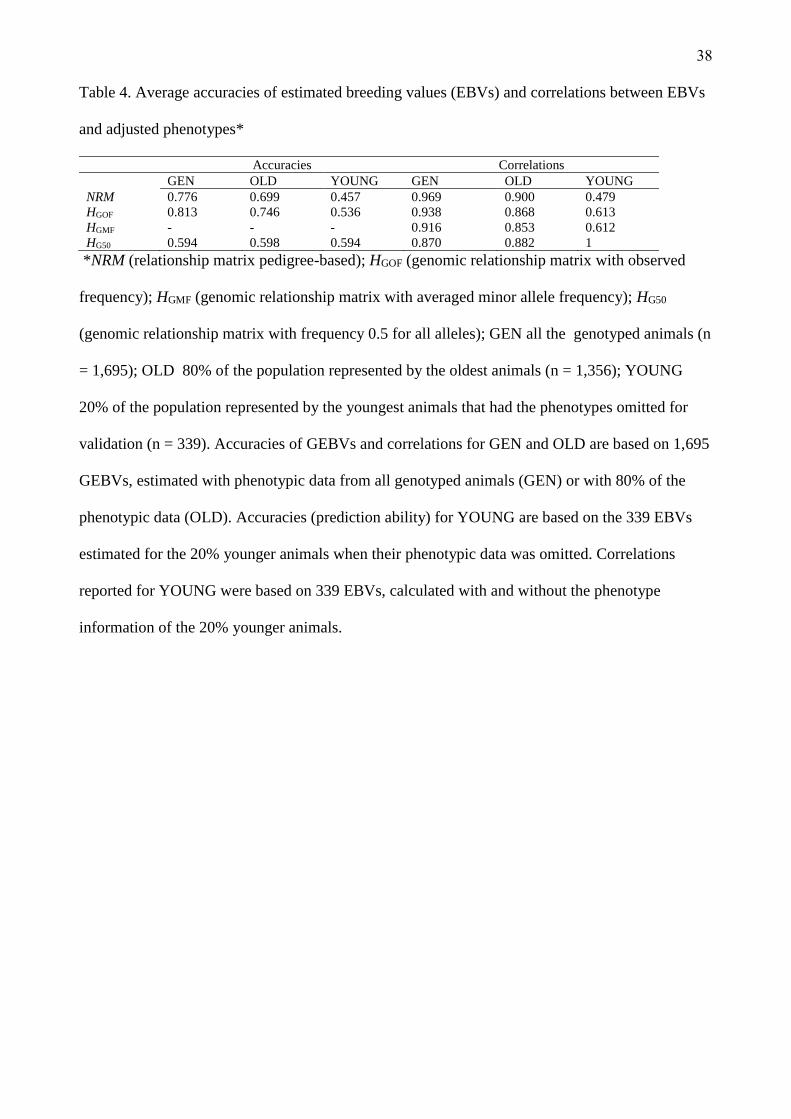
38
Table 4. Average accuracies of estimated breeding values (EBVs) and correlations between EBVs
and adjusted phenotypes*
Accuracies Correlations GEN OLD YOUNG GEN OLD YOUNG NRM 0.776 0.699 0.457 0.969 0.900 0.479 HGOF 0.813 0.746 0.536 0.938 0.868 0.613 HGMF - - - 0.916 0.853 0.612 HG50 0.594 0.598 0.594 0.870 0.882 1
*NRM (relationship matrix pedigree-based); HGOF (genomic relationship matrix with observed
frequency); HGMF (genomic relationship matrix with averaged minor allele frequency); HG50
(genomic relationship matrix with frequency 0.5 for all alleles); GEN all the genotyped animals (n
= 1,695); OLD 80% of the population represented by the oldest animals (n = 1,356); YOUNG
20% of the population represented by the youngest animals that had the phenotypes omitted for
validation (n = 339). Accuracies of GEBVs and correlations for GEN and OLD are based on 1,695
GEBVs, estimated with phenotypic data from all genotyped animals (GEN) or with 80% of the
phenotypic data (OLD). Accuracies (prediction ability) for YOUNG are based on the 339 EBVs
estimated for the 20% younger animals when their phenotypic data was omitted. Correlations
reported for YOUNG were based on 339 EBVs, calculated with and without the phenotype
information of the 20% younger animals.

39
Table 5. Number of highest GEBV (TOP20%, n = 339) animals in common between the different
matrices, and Pearson correlations between EBVs, above diagonal. Below diagonal, Spearman
coefficients calculated between the rank position of each animal*
NRM HGOF HGMF HG50 NRM 296(0.996) 296(0.996) 296(0.996) HGOF 0.834 339(0.999) 337(0.999) HGMF 0.836 0.999 337(0.999) HG50 0.837 0.999 0.999
*A (pedigree-based relationship matrix); HGOF (genomic relationship matrix with observed allele
frequencies); HGMF (genomic relationship matrix with averaged minor allele frequency); HG50
(genomic relationship matrix with allele frequency 0.5 for all markers).

40
Fig. 1. Distribution of observed frequencies for the second allele

41
Fig. 2. Correlations between estimated breeding values using pedigree (NRM) and genomic
relationship coefficients with observed allele frequency (HGOF), average of minor allele frequency
(HGMF) and frequency 0.5 for all alleles (HG50), using phenotypes from all genotyped animals (n =
1,695).
HGMF
HGOF HGMF HG50
NRM
HG50 HGMF
HG
50
HG
OF
HG
OF
NRM NRM
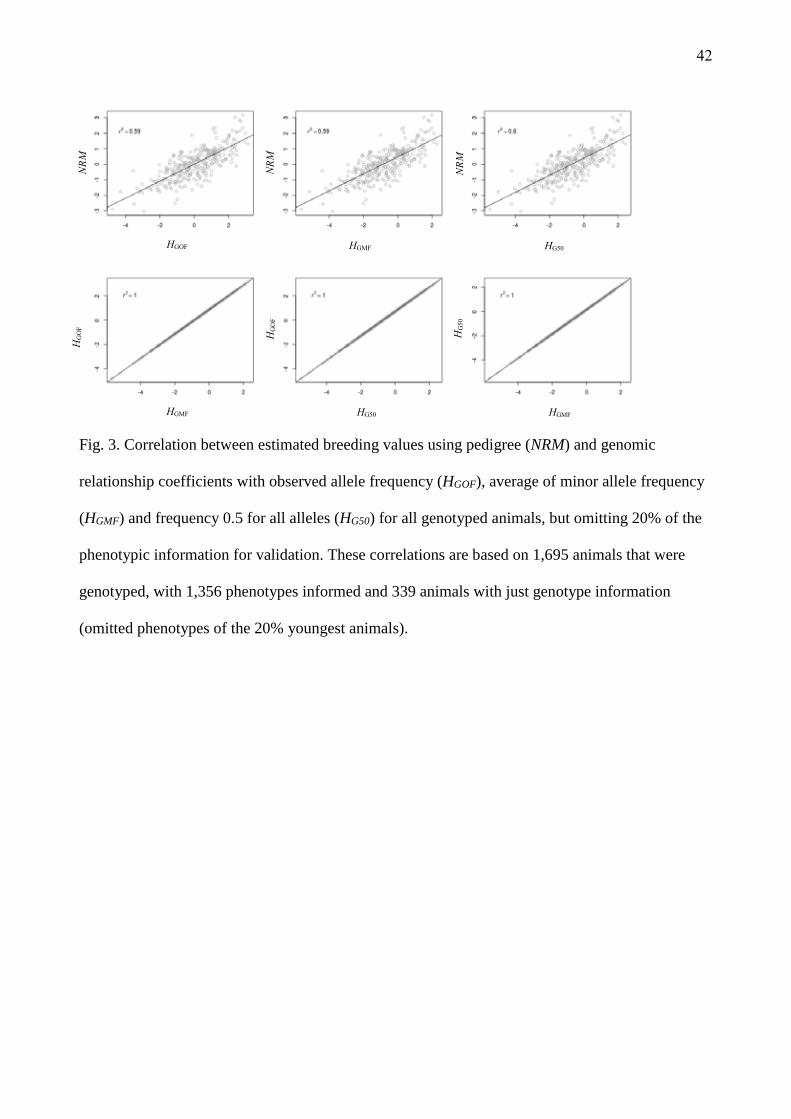
42
Fig. 3. Correlation between estimated breeding values using pedigree (NRM) and genomic
relationship coefficients with observed allele frequency (HGOF), average of minor allele frequency
(HGMF) and frequency 0.5 for all alleles (HG50) for all genotyped animals, but omitting 20% of the
phenotypic information for validation. These correlations are based on 1,695 animals that were
genotyped, with 1,356 phenotypes informed and 339 animals with just genotype information
(omitted phenotypes of the 20% youngest animals).
HGMF
HGOF HGMF HG50
NRM
HG50 HGMF
HG
OF
HG
OF
HG
50
NRM
NRM

43
Fig. 4. Correlations between rankings of genotyped animals estimated with different relationship
matrices. Rankings were based on EBVs of 1,695 animals (all genotyped population).
Abbreviations in figure are: NRM (relationship matrix pedigree-based); HGOF (genomic
relationship matrix with observed frequency); HGMF (genomic relationship matrix with averaged
minor allele frequency); HG50 (genomic relationship matrix with frequency 0.5 for all alleles).
HGMF
HGOF HGMF HG50
NRM
HG50 HGMF
HG
OF
HG
OF
HG
MF
no selected selected in NRM selected in HGOF
no selected selected in NRM selected in HGMF
no selected selected in NRM selected in HG50
no selected selected in HGOF
selected in HGMF
no selected selected in HGOF selected in HG50
no selected selected in HGMF selected in HG50
NRM
NRM
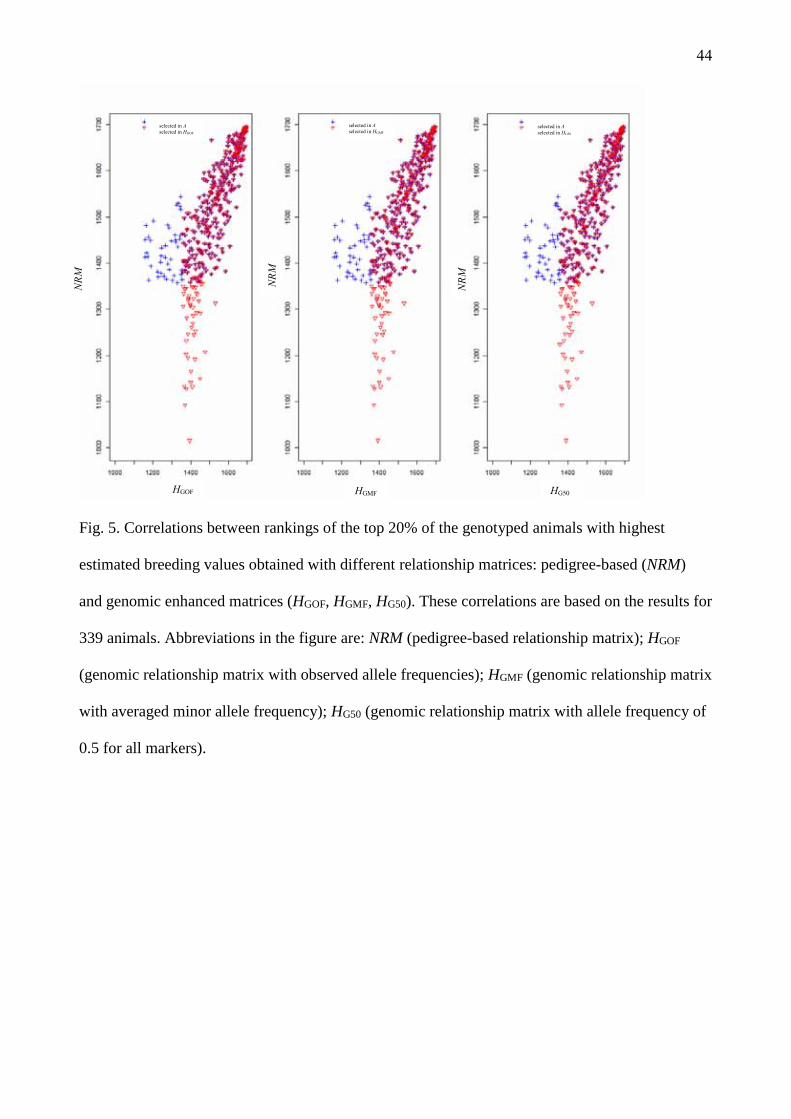
44
Fig. 5. Correlations between rankings of the top 20% of the genotyped animals with highest
estimated breeding values obtained with different relationship matrices: pedigree-based (NRM)
and genomic enhanced matrices (HGOF, HGMF, HG50). These correlations are based on the results for
339 animals. Abbreviations in the figure are: NRM (pedigree-based relationship matrix); HGOF
(genomic relationship matrix with observed allele frequencies); HGMF (genomic relationship matrix
with averaged minor allele frequency); HG50 (genomic relationship matrix with allele frequency of
0.5 for all markers).
HGOF HGMF HG50
NRM
selected in A selected in HGOF
selected in A selected in HGMF
selected in A selected in HG50
NRM
NRM

45
Supplementary Table
S 1. Ranking of animals that had the highest estimated breeding values (EBVs) for hip height, top
20% of the genotyped animals (TOP20%, n = 339*), based on EBVs calculated with different
relationship matrices: pedigree-based relationship matrix (NRM) and genomic enhanced matrices
based on observed allele frequencies (HGOF), minor allele frequency (HGMF) and allele frequency
equal to 0.50 for all markers (HG50).
Animal ID Rank NRM HGOF HGMF HG50
16 14 22 22 22 19 91 72 72 71 20 304 308 307 307 21 126 168 166 165 22 166 205 204 202 26 31 20 20 20 27 219 - - - 28 7 12 12 12 30 252 257 257 259 32 138 124 125 124
667 174 242 241 234 669 34 35 35 35 673 53 39 40 42 674 2 5 5 5 677 194 272 272 270 679 52 45 45 44 680 225 136 136 140 684 313 214 215 217 687 189 315 315 312 689 231 198 199 201 690 152 - - - 691 151 200 200 200 695 186 218 219 220 699 147 154 155 155 731 89 146 146 146 739 298 - - - 740 208 177 177 179 741 281 - - - 744 261 - - - 745 210 253 253 250 749 273 243 243 245 750 13 10 10 10 756 96 79 79 79 769 101 225 224 219 784 306 159 159 159

46
799 135 83 83 86 807 187 188 187 187 834 163 222 222 221 836 311 - - - 838 69 94 94 94 840 213 - - - 845 110 176 176 175 848 15 54 53 51 850 109 128 128 129 854 288 - - - 860 112 121 121 123 866 178 197 195 193 867 250 260 259 261 870 182 265 265 265 875 8 16 16 16 876 198 262 262 260 880 190 120 120 121 881 67 115 115 113 889 103 123 122 122 890 66 44 44 45 899 155 163 163 163 910 84 145 145 141 912 173 - - - 915 87 85 86 87 918 263 - - - 934 188 307 306 305 945 240 - - - 946 258 - - - 952 282 - - - 957 321 - - - 966 245 - - - 969 29 77 76 74 970 235 - - - 971 - 322 321 324 989 97 104 104 105 992 319 234 236 236 993 176 139 139 139 997 241 152 152 157
1036 227 211 210 208 1039 - 266 266 266 1061 107 193 193 189 1090 333 - - - 1111 339 - - - 1112 93 81 81 81 1141 284 - - - 1145 259 156 157 158 1151 64 19 19 19 1155 60 63 63 62 1158 54 110 110 109
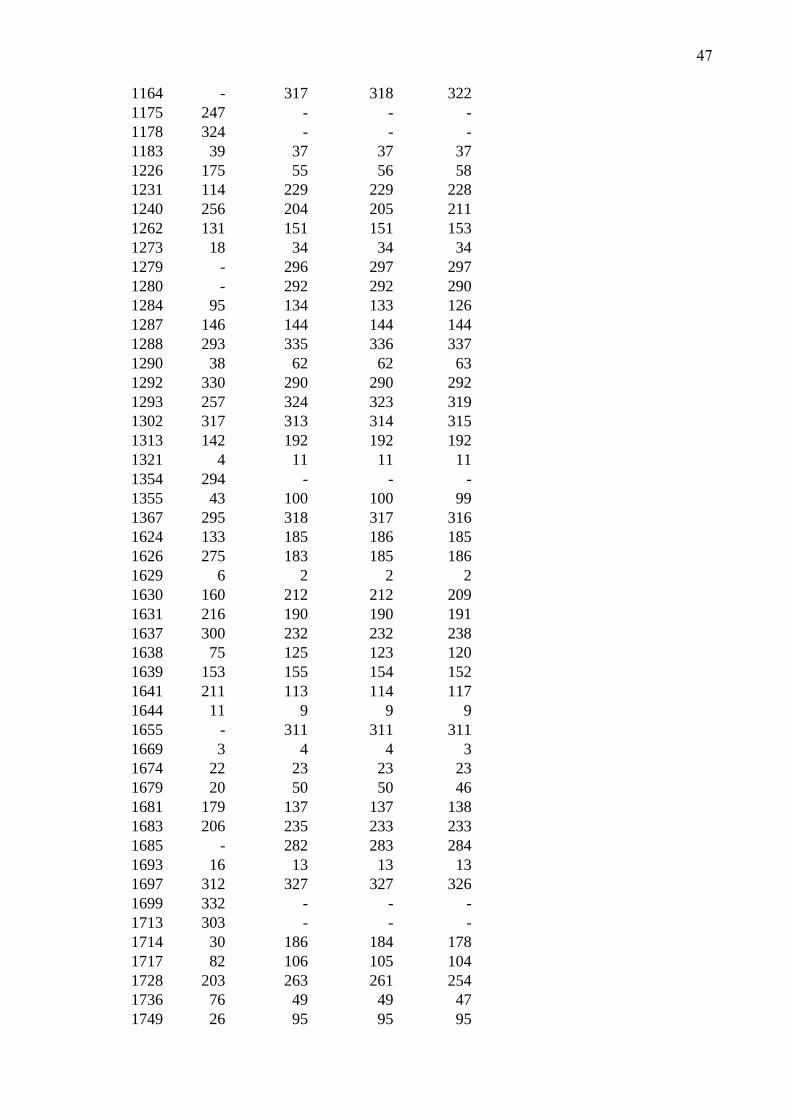
47
1164 - 317 318 322 1175 247 - - - 1178 324 - - - 1183 39 37 37 37 1226 175 55 56 58 1231 114 229 229 228 1240 256 204 205 211 1262 131 151 151 153 1273 18 34 34 34 1279 - 296 297 297 1280 - 292 292 290 1284 95 134 133 126 1287 146 144 144 144 1288 293 335 336 337 1290 38 62 62 63 1292 330 290 290 292 1293 257 324 323 319 1302 317 313 314 315 1313 142 192 192 192 1321 4 11 11 11 1354 294 - - - 1355 43 100 100 99 1367 295 318 317 316 1624 133 185 186 185 1626 275 183 185 186 1629 6 2 2 2 1630 160 212 212 209 1631 216 190 190 191 1637 300 232 232 238 1638 75 125 123 120 1639 153 155 154 152 1641 211 113 114 117 1644 11 9 9 9 1655 - 311 311 311 1669 3 4 4 3 1674 22 23 23 23 1679 20 50 50 46 1681 179 137 137 138 1683 206 235 233 233 1685 - 282 283 284 1693 16 13 13 13 1697 312 327 327 326 1699 332 - - - 1713 303 - - - 1714 30 186 184 178 1717 82 106 105 104 1728 203 263 261 254 1736 76 49 49 47 1749 26 95 95 95
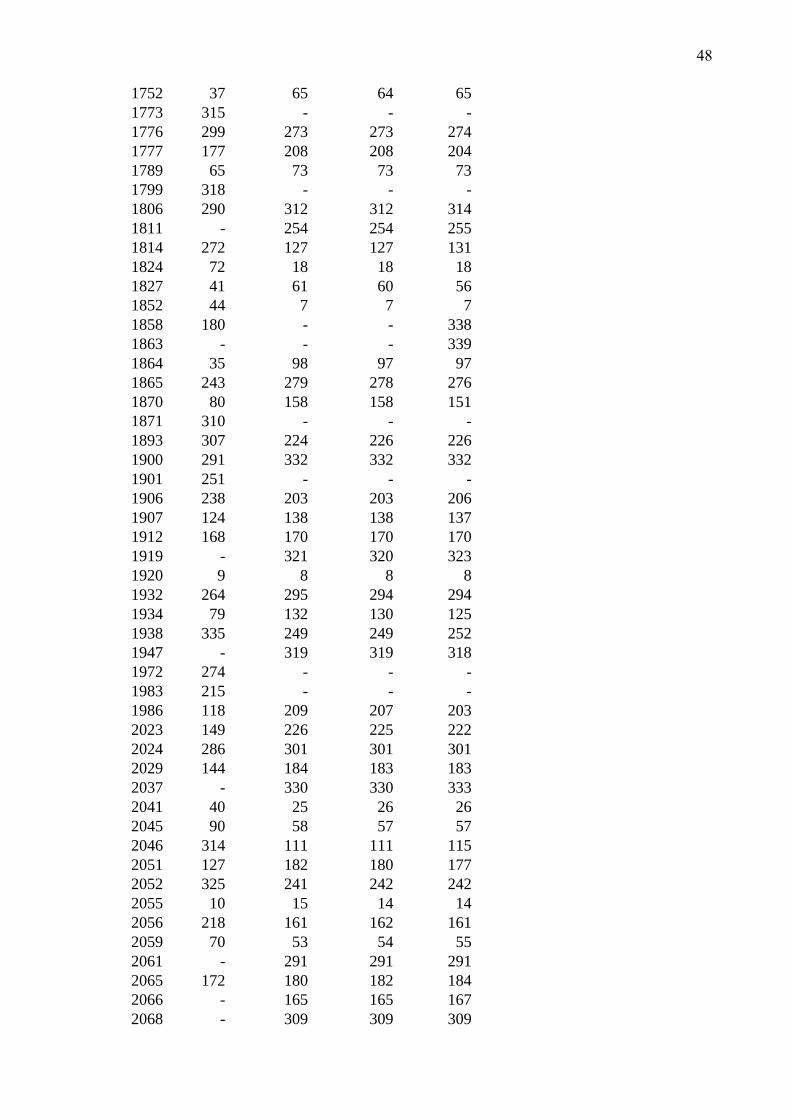
48
1752 37 65 64 65 1773 315 - - - 1776 299 273 273 274 1777 177 208 208 204 1789 65 73 73 73 1799 318 - - - 1806 290 312 312 314 1811 - 254 254 255 1814 272 127 127 131 1824 72 18 18 18 1827 41 61 60 56 1852 44 7 7 7 1858 180 - - 338 1863 - - - 339 1864 35 98 97 97 1865 243 279 278 276 1870 80 158 158 151 1871 310 - - - 1893 307 224 226 226 1900 291 332 332 332 1901 251 - - - 1906 238 203 203 206 1907 124 138 138 137 1912 168 170 170 170 1919 - 321 320 323 1920 9 8 8 8 1932 264 295 294 294 1934 79 132 130 125 1938 335 249 249 252 1947 - 319 319 318 1972 274 - - - 1983 215 - - - 1986 118 209 207 203 2023 149 226 225 222 2024 286 301 301 301 2029 144 184 183 183 2037 - 330 330 333 2041 40 25 26 26 2045 90 58 57 57 2046 314 111 111 115 2051 127 182 180 177 2052 325 241 242 242 2055 10 15 14 14 2056 218 161 162 161 2059 70 53 54 55 2061 - 291 291 291 2065 172 180 182 184 2066 - 165 165 167 2068 - 309 309 309

49
2071 115 70 70 70 2076 - 283 282 279 2086 297 255 255 253 2087 104 29 29 29 2089 334 - - - 2112 134 64 66 69 2117 - 281 281 283 2121 125 96 96 96 2123 296 239 239 241 2124 220 202 202 205 2133 248 - - - 2136 167 - - - 2139 309 270 270 269 2143 253 334 333 330 2144 59 59 59 59 2147 17 26 25 25 2148 150 112 112 114 2154 12 3 3 4 2155 - 298 298 299 2157 - 261 263 263 2166 287 277 277 278 2168 88 51 51 53 2171 181 194 194 196 2175 - 294 295 300 2182 73 87 88 88 2184 137 135 135 134 2188 255 196 196 197 2191 102 97 98 98 2192 121 93 93 93 2201 145 108 108 108 2205 192 206 206 207 2206 228 237 234 232 2207 254 223 223 224 2218 212 228 228 229 2222 162 101 101 102 2231 32 47 46 49 2238 116 219 218 218 2243 207 217 217 215 2245 308 169 169 168 2246 242 142 142 142 2254 140 84 84 85 2255 156 162 161 160 2256 130 43 43 43 2257 185 103 103 103 2263 27 14 15 15 2266 221 213 213 210 2267 209 157 156 154 2272 83 117 117 112 2277 120 118 118 116

50
2279 81 76 77 76 2280 260 88 89 90 2287 271 238 237 235 2288 269 215 214 214 2296 337 246 246 246 2303 - 336 335 334 2304 249 303 302 298 2306 - 240 240 240 2309 62 56 55 54 2312 36 32 32 32 2313 265 131 132 135 2317 327 258 258 258 2326 277 201 201 198 2328 58 42 42 41 2329 159 149 149 148 2336 5 6 6 6 2339 336 259 260 262 2340 98 82 82 82 2359 78 75 75 75 2366 224 316 316 317 2368 85 173 174 172 2370 100 130 131 132 2373 323 - - - 2374 105 67 67 66 2378 63 60 61 61 2380 322 244 244 244 2386 270 304 304 303 2389 329 268 268 268 2393 161 181 181 180 2405 237 - - - 2409 47 21 21 21 2410 244 - - - 2425 246 - - - 2429 57 89 87 84 2435 71 33 33 33 2449 1 1 1 1 2452 232 148 148 149 2459 276 236 238 237 2472 267 248 248 248 2479 197 293 293 293 2481 42 46 47 50 2482 193 105 106 107 2495 - 274 275 275 2496 - 302 303 306 2501 - 245 245 243 2504 86 31 31 31 2507 113 107 107 106 2516 196 90 90 89 2517 - 328 328 331

51
2522 92 68 68 68 2524 117 141 140 136 2526 - 305 305 304 2530 199 331 331 325 2540 200 166 168 169 2541 204 99 99 100 2549 223 314 313 313 2560 154 252 250 247 2563 230 221 220 223 2567 143 191 191 195 2569 222 207 209 213 2571 23 41 41 38 2572 - 247 247 249 2577 - 306 308 308 2580 164 91 91 92 2583 266 256 256 257 2588 - 320 322 328 2601 111 179 179 182 2606 108 114 113 111 2608 184 231 230 230 2609 283 - - - 2621 94 171 171 173 2625 123 172 172 174 2626 128 80 80 80 2630 - 269 269 271 2634 236 325 325 321 2648 229 275 276 277 2651 195 276 274 272 2654 21 92 92 91 2659 279 289 287 285 2660 25 27 27 27 2664 51 38 38 39 2669 33 78 78 78 2670 28 28 28 28 2677 302 323 324 320 2678 202 210 211 212 2683 320 187 188 190 2687 141 153 153 156 2688 338 299 300 302 2699 - 297 296 295 2704 - 284 284 281 2707 - 310 310 310 2708 45 36 36 36 2711 268 288 288 286 2713 - 271 271 273 2714 316 338 339 - 2716 217 251 252 251 2721 77 74 74 77 2723 169 160 160 162

52
2741 - 264 264 264 2743 326 - - - 2750 24 24 24 24 2759 233 339 337 336 2765 49 57 58 60 2768 148 150 150 150 2770 - 326 326 329 2780 68 69 69 67 2782 50 17 17 17 2783 48 48 48 48 2786 56 40 39 40 2797 46 52 52 52 2799 106 102 102 101 2805 - 285 285 282 2806 262 195 198 199 2819 239 178 178 181 2820 - 233 235 239 2824 280 167 167 166 2827 214 216 216 216 2834 171 140 141 145 2837 285 189 189 188 2838 - 278 279 287 2839 157 116 116 119 2841 226 286 286 288 2845 132 174 173 171 2849 139 133 134 133 2850 301 300 299 296 2873 129 129 129 130 2876 289 147 147 147 2877 170 - - - 2885 19 66 65 64 2894 158 164 164 164 2898 55 86 85 83 2904 99 199 197 194 2906 292 329 329 327 2907 191 119 119 118 2922 61 109 109 110 2933 122 122 124 127 2934 205 - - - 2943 119 175 175 176 2949 278 267 267 267 2952 305 250 251 256 2961 165 230 231 231 2962 - 337 338 - 2984 201 227 227 227 2992 183 143 143 143 2993 - 220 221 225 3000 328 280 280 280 3003 234 126 126 128
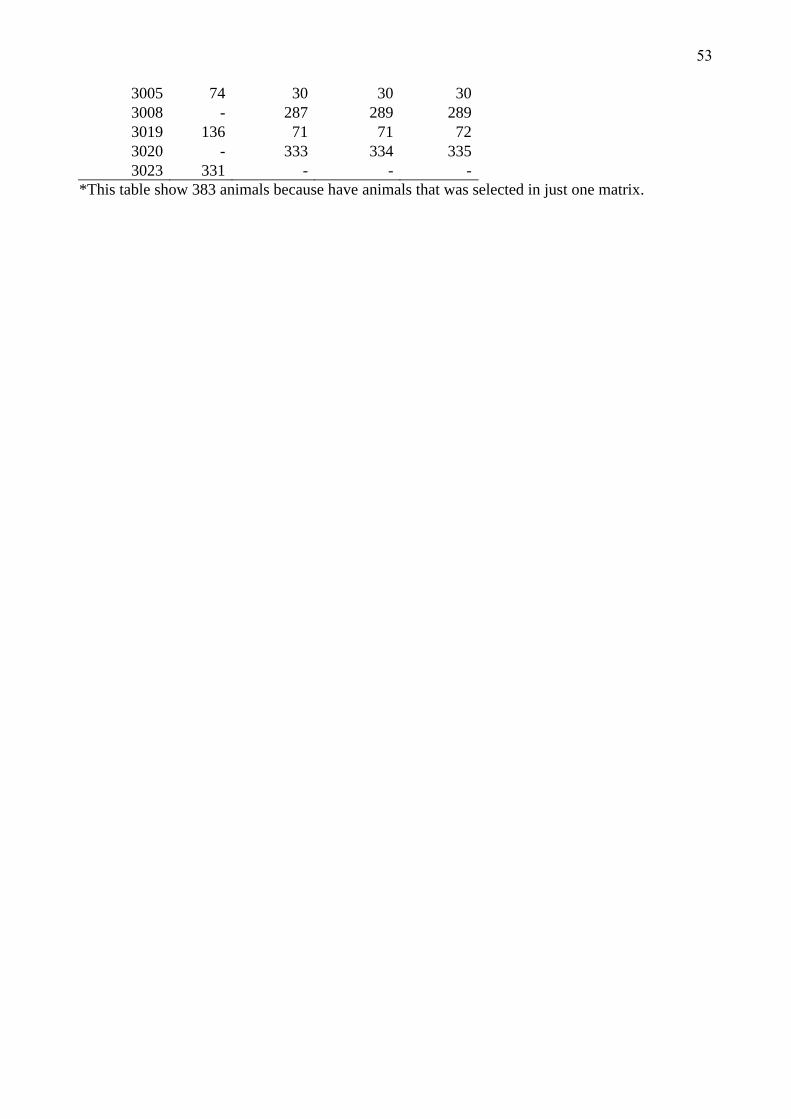
53
3005 74 30 30 30 3008 - 287 289 289 3019 136 71 71 72 3020 - 333 334 335 3023 331 - - -
*This table show 383 animals because have animals that was selected in just one matrix.
54
CAPÍTULO 3 - ACCURACY OF GENOMIC SELECTION FOR AGE AT PUBERTY IN A
MULTI BREED POPULATION OF TROPICALLY ADAPTED BEEF CATTLE
Short title: Genomic selection in a multi-breed population
M. M. Farah*, A. Swan§, M. R. S Fortes†, R. Fonseca*, S. Moore†, M. Kelly†
*Faculdade de Ciências Agrárias e Veterinárias, Universidade Estadual Paulista, Jaboticabal, São
Paulo 14884-900, Brazil.
†Queensland Alliance for Agriculture and Food Innovation, Centre for Animal Science, The
University of Queensland, Brisbane, Queensland 4072, Australia.
§Animal Genetics and Breeding Unit, University of New England, Armidale, NSW, 2351,
Australia.
Corresponding author:
Matthew Kelly
Postal address: Queensland Alliance for Agriculture and Food Innovation, Centre for Animal
Science, The University of Queensland, Brisbane, Queensland 4072, Australia.
E-mail: [email protected]
Phone number: +61 7 334 62773
Fax number: +61 7 334 60555

55
Summary
Genomic selection is becoming a standard tool in livestock breeding programs, particularly for traits
that are hard to measure. Accuracy of genomic selection can be improved by increasing quantity and
quality of data and potentially by improving analytical methods. Adding genotypes and phenotypes
from additional breeds or crosses often improves the accuracy of genomic predictions, but will
require specific methodology. A model was developed to incorporate breed composition estimated
from genotypes into genomic selection models. This method was applied to age at puberty data (as
estimated from age at first observation of a corpus luteum) from a mix of Brahman and Tropical
Composite beef cattle. In this data set the new model incorporating breed composition did not
increase the accuracy of genomic selection. However the breeding values exhibited slightly less bias
(as assessed by deviation of regression of phenotype and genomic breeding values from the expected
value of 1). Adding additional Brahman animals to the Tropical Composite analysis increased the
accuracy of genomic predictions and did not affect the accuracy of the Brahman predictions.
Keywords: Bos taurus, Brahman, cross validation, Tropical Composite
Introduction
Improved genomic selection for fertility and other economically important traits associated
to beef production will be reliant on the availability of genotyped reference populations with
accurate phenotypes, and the development of better analytical methods. There is a need to test
alternative methods of genomic prediction and estimation of individual marker effects, given the
multi-breed scenario that is typical of the beef industry in Northern Australia. Most of the methods
used to date have been based on those implemented in the dairy industry, and have therefore been
developed and tested within a single breed (Holstein). The Australian beef industry in contrast
consists of a mix of breeds, especially in tropical regions where adaption traits are important and
animals with varying degrees of Bos indicus genetics are widely used (Bolormaa et al. 2013b;
Burrow 2012). Tropical Composite is a term used to define a breed that is a stable cross of Zebu
56
(Bos indicus) and Taurine (Bos taurus) breeds, which is prominent in in Northern Australia (Burns
et al. 2013; Prayaga et al. 2009). Recent studies have analysed Tropical Composite cattle and have
considered them to be a single population (Corbet et al. 2013). Alternative prediction methods have
been proposed for use in multi-breed dairy cattle populations (Erbe et al. 2012; Harris & Johnson
2010; Olson et al. 2012). These methods were shown to increase accuracy of genomic selection for
Jerseys where additional Holstein data were added to the analysis. Both studies also suggest that
the methods could be further modified to account for crossbred animals. Accordingly methods have
been proposed by Harris & Johnson (2010) that will accommodate both multiple breeds and crosses.
Because of the complexity of multi-breed populations, there is increased potential for biases
in genomic breeding values if models do not account for breed of origin (Misztal et al. 2013). Better
understanding of the factors that degrade predictive power in multi-breed populations is necessary
in order to increase the accuracy of estimated genomic breeding values. Therefore, the arm of this
paper was to develop genomic prediction methods to model the diverse nature of the population.
Material and Methods
Phenotype and genotype data
The trait used for this study was age at the first corpus luteum (AGECL, days) recorded on
2054 genotyped females that consisted of Brahman (BB, n=980) and Tropical Composite breeds
(TC, n=1074). AGECL is used as an indicator of the age at puberty in beef cattle. Actual mean
AGECL in days (± s.d.) of females on each breed was 750.6 ± 141.8 for BB and 652.2 ± 119.4 for
TC. These cattle represent a subset of the population established by the Cooperative Research Centre
for Beef Genetic Technologies (Beef CRC). This population and its phenotypes have been described
in detail previously (Barwick et al. 2009; Burns et al. 2013; Hawken et al. 2012; Johnston et al.
2009). A key feature of the population structure relevant to our study is that the Tropical Composite
animals used were formed by crossing Bos indicus (Brahman) and Bos taurus breeds. The relative

57
contribution from genes of each group (Bos indicus and Bos taurus) was established for the Tropical
Composite animals in our study, and used as a central component of the analyses.
All individuals have high density SNP genotypes available, either directly genotyped or
imputed from lower density genotypes. Animals were genotyped using the Illumina Bovine SNP50
bead chip (Matukumalli et al. 2009) version 1 (containing approximately 50,000 SNP). Imputation
was performed using a reference set of 917 animals genotyped with the high density BovineHD.
The imputation was performed using BEAGLE and the methods, number of animals used and
accuracy is described in in detail in (Bolormaa et al. 2013a). All SNP chips were processed
according to the manufacturer’s protocols. Repeated samples were included in the genotyping for
quality assurance, and Bead Studio software (Illumina, Inc.) was used to determine genotype calls.
Quality control analysis methods and results have been reported previously (Hawken et al. 2012).
Genomic analysis methods
Genomic breeding values were estimated using GBLUP, based on the following general
mixed model:
� = �� + �D + �
were y is the vector of AGECL phenotypes; X is an incidence matrix for fixed effects; β is a vector
of fixed effects; Z is an incidence matrix for genomic breeding values; u is a vector of random
genomic breeding values for each animal (3�*(D) = �4E�where G is a genomic relationship matrix
as described below and 4E� is the variance of genomic breeding values), and e is a vector of residual
random effects (3�*(�) = F4G�where I is an identity matrix and 4G� is the residual variance).
The model was fitted with one of two genomic relationship matrices (GRM), genomic
relationships using allele frequencies calculated as a single breed group GRMSB and GRMXB with
allele frequency adjusted for breed, for the 2054 recorded and genotyped females. The GRMs were
calculated following an adaptation of the methods described by Harris & Johnson (2010); VanRaden
et al. (2011); Yang et al. (2010):
58
�* = (HH′)8
where H = � − 2�, in which M is the n×m matrix of genotypes for n=2054 animals and m SNP,
with values of 0 for the homozygous genotype of the first allele, 1 for the heterozygous genotype,
and 2 for the homozygous genotype of the second allele. P is the n×m matrix containing the
frequencies of the second allele of each SNP (pi) expressed as the frequency multiplied by 2.
For GRMSB, allele frequencies for each SNP in P were calculated from the group of 2054
analysis females, irrespective of breed. Therefore, rows of P are the same for all animals.
For GRMXB, P was calculated as IJ, where Q is a n×2 matrix describing the fraction of
genes of Brahman and Bos taurus origin (columns) for each of the 2054 analysis animals (rows).
Each row of Q sums to 1. C is a 2×m matrix containing the allele frequencies of each SNP (columns)
for BB and Bos taurus populations (rows). Both Q and C were derived from analyses using the
software package Admixture (Alexander & Lange, 2011; Alexander et al. 2009), as described below.
Apart from the multi-breed formulation of IJ a key difference between GRMXB and GRMSB is that
allele frequencies in GRMXB were estimated in the Admixture analysis from animals of known
breed not including the analyzed animals, whereas allele frequencies in GRMSB were estimated
directly from the analyzed animals. Harris & Johnson (2010) described a similar method for deriving
a multi-breed GRM, although in their study the breed fractions (Q) were derived from pedigree
rather than genomic information.
Such genomic relationships matrices are positive semi-definite, and often singular (Forni et
al. 2011). So, to enable inversion, genomic relationship matrices were weighted following
(VanRaden 2008):
� = %�* + (1 − %)���, where, G is the final genomic relationship matrix to be used in the analysis; Gr is the initial genomic
relationship matrix as described above and based only on genotypic information, w is a weighting
factor equal to 0.95 (Aguilar et al. 2010); and A22 is the subset of the pedigree based numerator
relationship matrix (NRM) for the genotyped females in the analysis.
59
Estimation of Brahman content
The Brahman and Bos taurus content (Q) for each animal was estimated using a supervised
Admixture analysis as described previously in (Alexander & Lange 2011; Alexander et al. 2009).
The dataset used to estimate Brahman content (BB%) consisted of training animals from five Bos
taurus breeds (Angus, Murray Grey, Charolais, Hereford, and Shorthorn) with 2,000, 200, 400, 500
and 500 cattle respectively, totaling 3,600 animals in training group. The Bos indicus training set
included 2000 Brahman cattle. Both groups are part of the same Beef CRC experimental population,
but excluded the 2054 analyzed females used in this study. To obtain the estimates of breed content
required for Q the analyzed females were added to the Admixture analysis with their breed masked.
The analysis was performed considering the six Bos taurus breeds as a single breed, and compared
with the Brahman animals. Thus the number of breeds (the 'k' parameter) in Admixture was set to
2, and all other parameters set to their default values (Alexander & Lange 2011; Alexander et al.
2009).
Estimation of genomic breeding values
Variance components for 4E� and 4G�used in GBLUP analyses were estimated by restricted
maximum likelihood (REML) using the Wombat software package (Meyer 2007). The variance
estimates used in GBLUP were calculated based on all animals with phenotype and genotype data
using an animal model fitted with the inverse of the pedigree based numerator relationship matrix.
Fixed effects fitted included cohort (year of birth and farm, n=14), origin (O, n=8), month of birth
(BM, n=9), sire breed (Sg, n=7), dam breed (Dg, n=9) and the interactions between BM*O (n=34),
cohort*O (n=30), Sg*Dg (n=34), BM*Sg (n=35) and has been tested the inclusion or not of BB%
in the model as a covariate. Variance estimates from these models are presented in Table 4 and were
used in the estimation of breeding values for the GBLUP cross validation analysis. The GBLUP
analyses were also fitted in Wombat using the same fixed effects and the two GRM previously
described (GRMSB and GRMXB).
60
Scenarios tested
Cross validation was used to evaluate the impact of data and model factors on accuracy and
bias of genomic evaluation. To study the impact of data on Tropical Composite predictions,
increasing amounts of records on Brahman females were added to the analyses. The model factors
studied were: fitting GRMSB compared to GRMXB, fitting Brahman content (BB%) as a covariate,
and pre-adjustment (rescale) of data by breed to the same phenotypic variance dividing the
phenotype values by the variance.
A series of cross validation analysis were performed to estimate the effect of each of the
three factors on accuracy and bias of genomic predictions. Cross validation groups were formed
within each breed group (Brahmans and Tropical Composites) by randomly selecting sire families
into one of four groups, stratified by number of sibs with genotypes to ensure reasonably similar
sized groups.
The cross validation strategies are described in Table 1. Standard cross validation where one
of the four groups was omitted from the analysis to use as a validation group was performed within
Brahman and Tropical Composites (denoted 3BB and 3TC, respectively). A series of cross
validation analysis was then run where additional groups were added to the Tropical Composite
cross validation. In each case all, possible combinations of BB groups were run in cross validation.
At the end of the analysis for each of the cross validation runs the correlation between adjusted
phenotype and genomic estimated breeding value (GEBV) was estimated for animals that were not
included in training the model for each combination. The mean correlation and regression was then
estimated from the group estimates.
Results
Figure 1 represents the absolute value of the difference in allele frequency between Brahman
(BB) and Bos taurus (BT). The smaller difference between the frequencies show similarity between
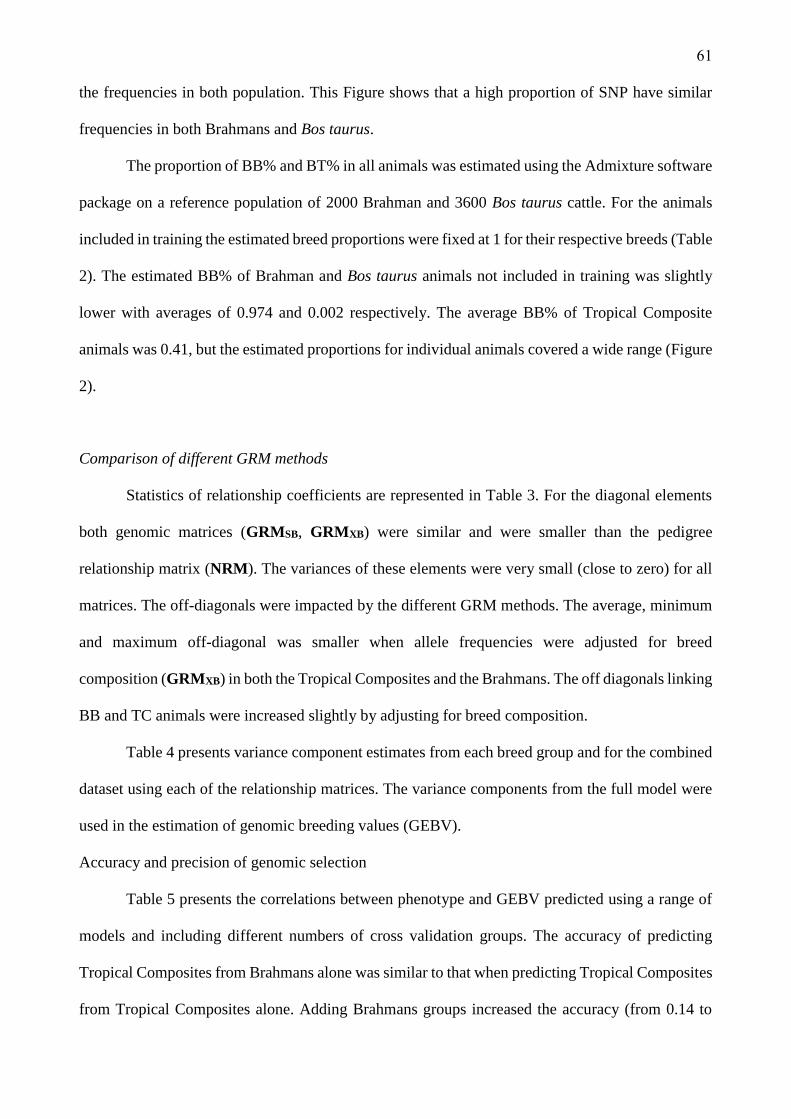
61
the frequencies in both population. This Figure shows that a high proportion of SNP have similar
frequencies in both Brahmans and Bos taurus.
The proportion of BB% and BT% in all animals was estimated using the Admixture software
package on a reference population of 2000 Brahman and 3600 Bos taurus cattle. For the animals
included in training the estimated breed proportions were fixed at 1 for their respective breeds (Table
2). The estimated BB% of Brahman and Bos taurus animals not included in training was slightly
lower with averages of 0.974 and 0.002 respectively. The average BB% of Tropical Composite
animals was 0.41, but the estimated proportions for individual animals covered a wide range (Figure
2).
Comparison of different GRM methods
Statistics of relationship coefficients are represented in Table 3. For the diagonal elements
both genomic matrices (GRMSB, GRMXB) were similar and were smaller than the pedigree
relationship matrix (NRM). The variances of these elements were very small (close to zero) for all
matrices. The off-diagonals were impacted by the different GRM methods. The average, minimum
and maximum off-diagonal was smaller when allele frequencies were adjusted for breed
composition (GRMXB) in both the Tropical Composites and the Brahmans. The off diagonals linking
BB and TC animals were increased slightly by adjusting for breed composition.
Table 4 presents variance component estimates from each breed group and for the combined
dataset using each of the relationship matrices. The variance components from the full model were
used in the estimation of genomic breeding values (GEBV).
Accuracy and precision of genomic selection
Table 5 presents the correlations between phenotype and GEBV predicted using a range of
models and including different numbers of cross validation groups. The accuracy of predicting
Tropical Composites from Brahmans alone was similar to that when predicting Tropical Composites
from Tropical Composites alone. Adding Brahmans groups increased the accuracy (from 0.14 to

62
0.22). There was no difference in the correlations observed between the two GRMs (<0.003), adding
the covariate BB% (<0.03), or rescaling the phenotypes (<0.03).
The accuracy of predicting Brahman animals from Tropical Composites was low. Adding as
little as one BB group into the analysis increased the accuracy substantially (from 0.086 to 0.242).
Additional groups increased the accuracy to around 0.33. The accuracy using three groups from both
breeds was similar to the results from the Brahman only analysis, although adding Tropical
Composite data to Brahman analysis did not reduce accuracy of prediction within Brahmans. There
was no difference in the accuracy between the two relationships matrices. In contrast to the Tropical
Composite results, adding BB% had a small impact in some scenarios, but when three groups of
Brahmans were included in the analysis there was no difference (scenarios 3BB and 3TC + 3BB).
However, if less than three BB groups were included in the analysis the inclusion of BB% increased
the correlation. The correlation was increased by 0.04-0.05 for the TC only analysis and by a smaller
amount for the other training scenarios (0.01-0.03). Rescaling the phenotypes had no impact on the
correlation.
Table 6 presents the slope of the regression coefficients between GEBV and adjusted
phenotypes. In general the regression coefficients were closer to 1 for the Tropical Composite
animals and well above 1 for the BB animals. Within the Tropical Composite animals adding
Brahmans increased the regression coefficient when BB% was not included in the model. When
BB% was included in the model the regression coefficient was either stable when phenotypes were
rescaled, or decreasing when not rescaled. Lastly, the regression coefficient was slightly more stable
when considering GRMXB compared to GRMSB.
Within the BB animals the regression coefficients were lowest (and closest to 1) when no
Brahmans were included in training. Adding Brahman animals increased the regression coefficients.
Adding BB% as a covariate reduced the range in regression coefficients across all other scenarios,
particularly when no BB animals were included in the analysis. There was little difference in the
regression coefficients between the two GRMs.

63
The principally difference when used a bivariate analysis were represented on Table 9 and
Table 10, that represent the regression coefficient between the GEBV and adjusted phenotype to
AGECL-BB and AGECL-TC. In these scenarios, the regression coefficients increased when
compared with Table 6. The principal difference was AGECL-TC trait that showed highest results
when compared whit a univariate analysis. Just when added 3 BB groups that these values decreased,
that can be occur because a highest correlation between these family groups. And observing the
AGCL-BB in Brahman these values showed very high because increase the Brahman phenotype
information leaving a better estimation of GEBV than compared with others scenarios.
Discussion
Genetic evaluation in mixed or admixed breed populations is complicated by the estimation
of the effect of the ancestral breeds on each trait. The breed proportion in traditional analysis is
calculated by tracing the parental breed through the pedigree. Using this approach each animal is
given the average proportion of its parents, however through recombination the actual proportion
inherited may vary from this due to Mendelian segregation. It has been proposed that breed
component should be estimated from genomic information to use in genetic evaluation (Porto-Neto
et al. 2013; Thomasen et al. 2013). Accuracy of breed composition estimated from high density
genotype SNP panels are high (Frkonja et al. 2012; Kuehn et al. 2011) thus it would be expected
that using these values in place of pedigree based estimates of breed proportions may increase
accuracy. Accordingly, Thomasen et al. (2013) added breed proportion as a covariate in analysis of
genomic data using random regression. In this case the accuracy of genomic selection was not
improved, however in this study the divergence between the breeds was rather small as the two
breeds (Danish and US Jersey populations) had only been separated for 100 years (Thomasen et al.
2013). This is in contrast to Brahman and the Bos taurus component of Tropical Composites which
are estimated to have diverged hundreds of thousands of years ago. Accordingly, Porto-Neto et al.

64
(2013) suggested that the Zebu content could be added to genetic evaluation programs that include
Tropical Composites.
Genomic predictions across breeds have low accuracy, particularly for breeds not
represented within the training population (Erbe et al. 2012; Garrick 2011). However, when a minor
breed is represented in both the training and validation populations the accuracy is often similar to
or slightly better than training on the smaller population. For example (Erbe et al. 2012; Pryce et al.
2012) found that adding Holstein animals to a Jersey reference increased accuracy with either no
reduction or a small reduction in Holstein accuracies depending on the trait. Similarly, Zhang et al.
(2014) found that adding Brahman animals to TC increases accuracy for Tropical Composites, and
this also was observed in our analysis: adding additional groups of Brahmans to the training
population lead to consistent increases in realised accuracy.
This study confirmed that adding BB information can lead to increases in accuracy of TC
using genomic evaluations. Adding breed specific GRMs did not improve the accuracy of genomic
evaluation however it did improve the regression coefficient for TC animals, considering no
covariate scenario (Q=No). This impact will be particularly important when there are animals that
do not have links to animals in the current genetic evaluation. Such animals need to be placed into
appropriate genetic groups. The effect of incorrect genetic grouping can have substantial impact on
breeding value estimates (Misztal et al. 2013).
As noted it was observed that the Brahman regression coefficient was inflated when the value
for the Tropical Composite regression coefficient was around 1 in all scenarios studied. So, an
additional analysis was performed where the variances were adjusted so the Brahman regression
coefficient was closer to 1, however under these parameters the Tropical Composite regressions
were well below 1 (data not shown). Thus it does not seem possible to obtain correct regressions for
both traits under a univariate model
Porto-Neto et al. (2013) estimated the Zebu content of this population using a different set
of reference animals and a larger validation population: in their study 81 Angus and 29 Nelore were

65
used as reference animals. The Brahman animals used in our study would contain a proportion of
Bos taurus genes as a consequence of the grading up process, where a small number of imported
Brahman sires were crossed to Australian Bos taurus animals to produce the current industry
Brahman herds. This is reflected in the Zebu average content of 95% in the analysis of (Porto-Neto
et al. 2013). The contrasts with the estimate using Brahman animals as reference population
(BB%=98) the estimate of BB% in the Tropical Composites was also slightly lower (43%) than the
estimate of Porto-Neto et al. (2013).
All models does influence the precision of genomic evaluations, maybe the model used had
a problem of multicolinearity, principally when include the sire and dam breed and Brahman
proportion, and therefore highlights the importance of correctly accounting for breed in genetic
evaluation. It is suggested that future work would examine the effect of BB% on multibreed GEBVs
in more detail and examine the effect in additional data sets. However, the model used did not have
an impact on the accuracy of prediction, but showed that adding Brahman information increase the
predictive capacity in training population.
Conclusions
There was a clear benefit in adding Brahman animals to Tropical Composite genomic
evaluations. The Brahman information with an accurate and high correlated between these two
breeds is appropriated to evaluate the genomic breeding values in Tropical Composite breed.
Considering the two breeds as separate traits for AGECL can be a strategy for obtain more precise
information in prediction of genomic estimate breeding values.
Acknowledgments
The authors acknowledge that this research uses resources build by the Cooperative Research
Centre for Beef Genetic Technologies (Beef CRC). We thank the support of CAPES (Process:
13843/12-5). The Lab of scientific computation applied to animal science (LuCCA-Z), FCAV-

66
Jaboticabal, QAAFI, AGBU and CSIRO are acknowledged for providing infrastructure and
computational facilities.
References
Aguilar I., Misztal I., Johnson D.L., Legarra A., Tsuruta S., & Lawlor T.J. (2010) Hot topic: A unified approach to utilize phenotypic, full pedigree, and genomic information for genetic evaluation of Holstein final score. Journal of Dairy Science 93, 743-52.
Alexander D.H. & Lange K. (2011) Enhancements to the ADMIXTURE algorithm for individual ancestry estimation. BMC bioinformatics 12, 246.
Alexander D.H., November J., & Lange K. (2009) Fast model-based estimation of ancestry in unrelated individuals. Genome research 19, 1655-64.
Barwick S.A., Johnston D.J., Burrow H.M., Holroyd R.G., Fordyce G., Wolcott M. L., et al. (2009) Genetics of heifer performance in 'wet' and 'dry' seasons and their relationships with steer performance in two tropical beef genotypes. Animal Production Science 49, 367.
Bolormaa S., Pryce J.E., Kemper K., Savin K., Hayes B.J., Barendse W. et al. (2013a) Accuracy of prediction of genomic breeding values for residual feed intake and carcass and meat quality traits in Bos taurus, Bos indicus and composite beef cattle. Journal of Animal Science 91, 3088-104.
Bolormaa S., Pryce J.E., Kemper K.E., Hayes B.J., Zhang Y., Tier B., et al. (2013b) Detection of quantitative trait loci in Bos indicus and Bos taurus cattle using genome-wide association studies. Genetics Selection Evolution 45, 43.
Burns B.M., Corbet N.J., Corbet D.H., Crisp J.M., Venus B.K., Johnston D.J., et al. (2013) Male traits and herd reproductive capability in tropical beef cattle. 1. Experimental design and animal measures. Animal Production Science 53, 87-100.
Burrow H.M. (2012) Importance of adaptation and genotype x environment interactions in tropical beef breeding systems. Animal 6, 729-40.
Corbet N.J., Burns B.M., Johnston D.J., Wolcott M.L., Corbet D.H., Venus B.K., et al. (2013) Male traits and herd reproductive capability in tropical beef cattle. 2. Genetic parameters of bull traits. Animal Production Science 53, 101–13.
Erbe M., Hayes B.J., Matukumalli L.K., Goswami S., Bowman P.J., Reich C.M., et al. (2012) Improving accuracy of genomic predictions within and between dairy cattle breeds with imputed high-density single nucleotide polymorphism panels. Journal of Dairy Science 95, 4114-29.
Forni S., Aguilar I., & Misztal I. (2011) Different genomic relationship matrices for single-step analysis using phenotypic, pedigree and genomic information. Genetics Selection Evolution 43, 1.
Frkonja A., Gredler B., Schnyder U., Curik I. & Solkner J. (2012) Prediction of breed composition in an admixed cattle population. Animal Genetics 43, 696-703.
Garrick D.J. (2011) The nature, scope and impact of genomic prediction in beef cattle in the United States. Genetics Selection Evolution 43, 17.
Harris B.L. & Johnson D.L. (2010) Genomic predictions for New Zealand dairy bulls and integration with national genetic evaluation. Journal of Dairy Science 93,1243-52.
67
Hawken R.J., Zhang Y.D., Fortes M.R.S., Collis E., Barris W.C., Corbet N.J., et al. (2012) Genome-wide association studies of female reproduction in tropically adapted beef cattle. Journal of Animal Science 90, 1398-410.
Johnston D.J., Barwick S.A., Corbet N.J., Fordyce G., Holroyd R.G., Williams P.J., & Burrow H.M. (2009) Genetics of heifer puberty in two tropical beef genotypes in northern Australia and associations with heifer- and steer-production traits. Animal Production Science 49, 399-412.
Kuehn L.A., Keele J.W., Bennett G.L., McDaneld T.G., Smith T.P., Snelling W.M., et al. (2011) Predicting breed composition using breed frequencies of 50,000 markers from the US Meat Animal Research Center 2,000 Bull Project. Journal of Animal Science 89, 1742-50.
Matukumalli L.K., Lawley C.T., Schnabel R.D., Taylor J.F., Allan M.F., Heaton M.P., et al. (2009) Development and characterization of a high density SNP genotyping assay for cattle. PloS one 4, e5350.
Meyer K. (2007) WOMBAT: a tool for mixed model analyses in quantitative genetics by restricted maximum likelihood (REML). Journal of Zhejiang University Science B 8, 815-21.
Misztal I., Vitezica Z.G., Legarra A., Aguilar I. & Swan A.A. (2013) Unknown-parent groups in single-step genomic evaluation. Journal of Animal Breeding and Genetics 130, 252–8.
Olson K.M., VanRaden P.M. & Tooker M.E. (2012) Multibreed genomic evaluations using purebred Holsteins, Jerseys, and Brown Swiss. Journal of Dairy Science 95, 5378-83.
Porto-Neto L.R., Lehnert S.A., Fortes M.R.S., Kelly M. & Reverter A. (2013) Population Stratification and Breed Composition of Australian Tropically Adapted Cattle. Proceedings of the Association for the Advancement of Animal Breeding and Genetics 20, 4.
Prayaga K.C., Corbet N.J., Johnston D.J., Wolcott M.L., Fordyce G. & Burrow H.M. (2009) Genetics of adaptive traits in heifers and their relationship to growth, pubertal and carcass traits in two tropical beef cattle genotypes. Animal Production Science 49, 413-25.
Pryce J.E., Hayes B.J. & Goddard M.E. (2012) Novel strategies to minimize progeny inbreeding while maximizing genetic gain using genomic information. Journal of Dairy Science 95, 377-88.
Thomasen J.R., Sorensen A.C., Su G., Madsen P., Lund M.S. & Guldbrandtsen B. (2013) The admixed population structure in Danish Jersey dairy cattle challenges accurate genomic predictions. Journal of Animal Science 91, 3105-12.
VanRaden P.M. (2008) Efficient methods to compute genomic predictions. Journal of Dairy Science 91, 4414-23.
VanRaden P.M., Olson K.M., Wiggans G.R., Cole J.B. & Tooker M.E. (2011) Genomic inbreeding and relationships among Holsteins, Jerseys, and Brown Swiss. Journal of Dairy Science 94, 5673-82.
Yang J., Benyamin B., McEvoy B.P., Gordon S., Henders A.K., Nyholt D.R., et al. (2010) Common SNPs explain a large proportion of the heritability for human height. Nature Genetics 42, 565-9.
Zhang Y.D., Johnston D.J., Bolormaa S., Hawken R.J. & Tier B. (2014) Genomic selection for female reproduction in Australian tropically adapted beef cattle. Animal Production Science 54, 16.

68
Table 1. Example of cross validation strategy used for each scenario examined. All possible combinations of groups were run within BB when < 3 groups were included in training (T) and validation (V)
Training Strategy Name
TC groups Number of
TC CV groups
BB groups Number of
BB CV groups
Number of analysis
1 2 3 4 1 2 3 4 0TC+3BB V V V V 0 T T T V 3 4
3TC T T T V 3 V V V V 0 4 3TC+1BB T T T V 3 T V V V 1 4*4=16 3TC+2BB T T T V 3 T T V V 2 4*6=24 3TC+3BB T T T V 3 T T T V 3 4*4=16 3TC+4BB T T T V 3 T T T T 4 4
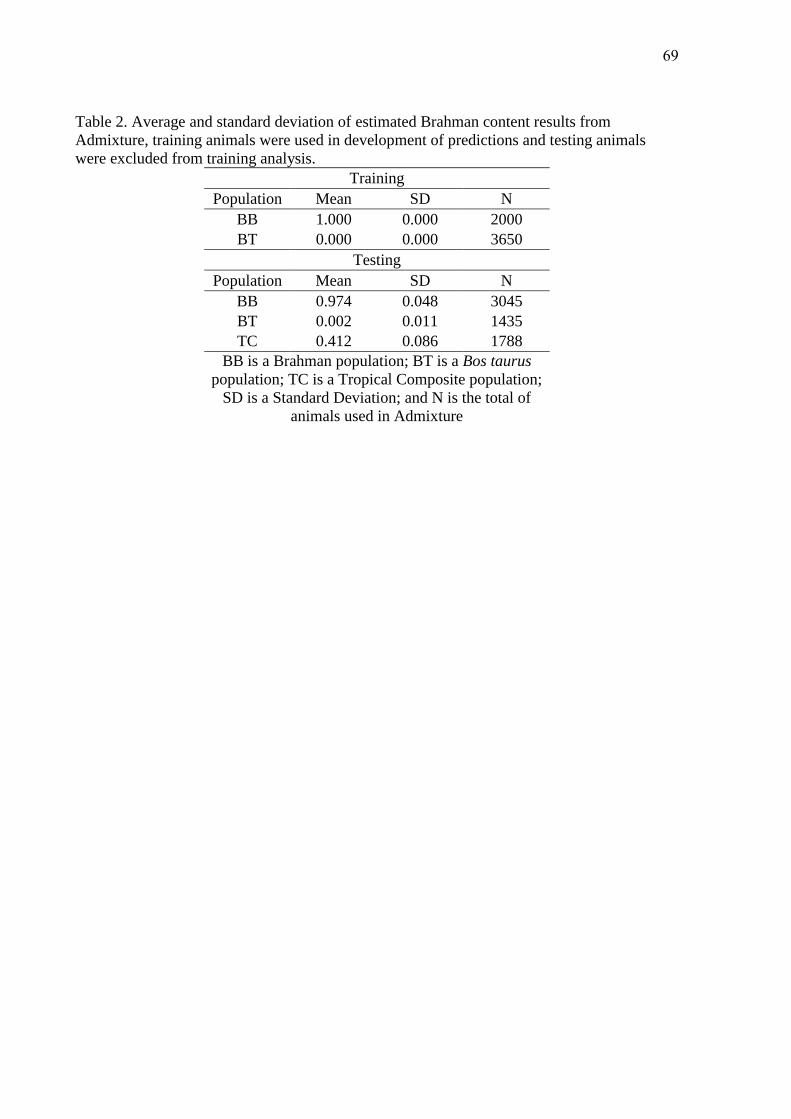
69
Table 2. Average and standard deviation of estimated Brahman content results from Admixture, training animals were used in development of predictions and testing animals were excluded from training analysis.
Training Population Mean SD N
BB 1.000 0.000 2000 BT 0.000 0.000 3650
Testing Population Mean SD N
BB 0.974 0.048 3045 BT 0.002 0.011 1435 TC 0.412 0.086 1788
BB is a Brahman population; BT is a Bos taurus population; TC is a Tropical Composite population;
SD is a Standard Deviation; and N is the total of animals used in Admixture

70
Ta
ble
3. S
tatis
tics
of re
latio
nshi
p co
effic
ient
s fo
r Bra
hman
(BB
), Tr
opic
al C
ompo
site
(TC
), be
twee
n B
rahm
an a
nd T
ropi
cal
Com
posi
te (B
BTC
) and
all
the
popu
latio
n (F
ULL
) usi
ng p
edig
ree
and
geno
mic
info
rmat
ion
Dia
gona
l
FU
LL
BB
TC
BBT
C
N
RM
G
RM
SB
GR
MXB
N
RM
G
RM
SB
GR
MXB
N
RM
G
RM
SB
GR
MXB
N
RM
G
RM
SB
GR
MXB
Ave
rage
1.
002
0.76
6 0.
760
1.00
2 0.
796
0.78
9 1.
001
0.73
8 0.
734
- -
- M
in.
1.00
0 0.
689
0.69
2 1.
000
0.74
2 0.
741
1.00
0 0.
689
0.69
2 -
- -
Max
. 1.
266
0.89
9 0.
888
1.26
6 0.
899
0.88
8 1.
158
0.86
4 0.
861
- -
- V
ar.
0.00
0 0.
001
0.00
1 0.
000
0.00
0 0.
000
0.00
0 0.
000
0.00
0 -
- -
Off-
Dia
gona
l
FU
LL
BB
TC
BBT
C
N
RM
G
RM
SB
GR
MXB
N
RM
G
RM
SB
GR
MXB
N
RM
G
RM
SB
GR
MXB
N
RM
G
RM
SB
GR
MXB
Ave
rage
0.
004
0.33
8 0.
339
0.00
8 0.
473
0.46
5 0.
008
0.31
9 0.
316
0.00
0 0.
286
0.29
4 M
in.
0.00
4 0.
338
0.33
9 0.
008
0.47
3 0.
465
0.00
8 0.
319
0.31
6 0.
000
0.28
6 0.
294
Max
. 0.
511
0.65
4 0.
643
0.51
1 0.
654
0.64
3 0.
454
0.55
3 0.
550
0.00
0 0.
433
0.43
0 V
ar.
0.00
1 0.
006
0.00
5 0.
001
0.00
1 0.
001
0.00
2 0.
001
0.00
1 0.
000
0.00
1 0.
001
NR
M –
Ped
igre
e ba
sed
rela
tions
hip
mat
rix; G
RM
SB e
lem
ents
adj
uste
d by
ave
rage
alle
le fr
eque
ncy
of th
e si
ngle
bree
d da
tase
t; G
RM
XB e
lem
ents
of t
he G
RM
adj
uste
d by
indi
vidu
al a
nim
als
bree
d pr
opor
tion
thus
incl
udin
g br
eed
alle
le
frequ
enci
es.
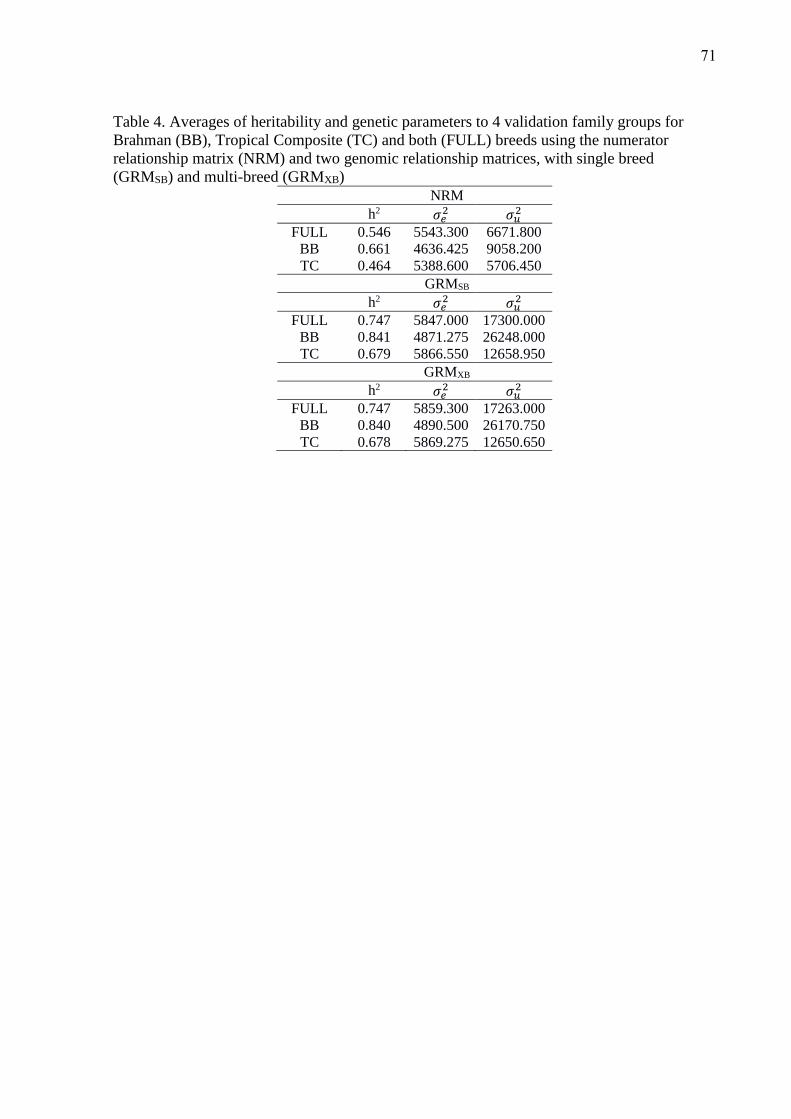
71
Table 4. Averages of heritability and genetic parameters to 4 validation family groups for Brahman (BB), Tropical Composite (TC) and both (FULL) breeds using the numerator relationship matrix (NRM) and two genomic relationship matrices, with single breed (GRMSB) and multi-breed (GRMXB)
NRM h2 4G� 4E�
FULL 0.546 5543.300 6671.800 BB 0.661 4636.425 9058.200 TC 0.464 5388.600 5706.450
GRMSB h2 4G� 4E�
FULL 0.747 5847.000 17300.000 BB 0.841 4871.275 26248.000 TC 0.679 5866.550 12658.950
GRMXB h2 4G� 4E�
FULL 0.747 5859.300 17263.000 BB 0.840 4890.500 26170.750 TC 0.678 5869.275 12650.650

72
Table 5. Realized correlations between genomic breeding values (GEBV) and adjusted phenotypes considering increasing numbers of Brahman animals in training (Row Q No/ Yes indicates BB% included as covariate in analysis; Rescale Yes/No indicates phenotypes Brahman and Tropical Composite animals rescaled to the same phenotypic variance; BD SB and XB indicate Single breed allele frequency and adjusted for breed specific allele frequency respectively)
Q No Yes
Rescale No Yes No Yes
GRM SB XB SB XB SB XB SB XB
Tropical Composites
3BB 0.142 0.144 0.142 0.144 0.131 0.137 0.131 0.137
TC 0.151 0.151 0.151 0.151 0.178 0.177 0.178 0.177
TC+1BB 0.174 0.174 0.173 0.173 0.191 0.191 0.191 0.191
TC+2BB 0.196 0.195 0.194 0.193 0.205 0.206 0.205 0.206
TC+3BB 0.213 0.212 0.211 0.210 0.217 0.219 0.217 0.218
TC+4BB 0.227 0.226 0.225 0.223 0.226 0.230 0.226 0.229
Brahman
3BB 0.335 0.334 0.335 0.334 0.336 0.335 0.336 0.335
TC 0.086 0.091 0.086 0.091 0.135 0.133 0.135 0.133
TC+1BB 0.242 0.243 0.237 0.238 0.266 0.265 0.263 0.262
TC+2BB 0.316 0.316 0.312 0.312 0.330 0.329 0.328 0.327
TC+3BB 0.334 0.333 0.332 0.332 0.344 0.343 0.344 0.342
*TC is cross validation with 3 groups included in training; Number preceding BB represents the number of BB cross validation groups included in training

73
Table 6. Regression coefficient between genomic breeding values (GEBV) and adjusted phenotypes considering increasing numbers of Brahman animals in training (Row Q No/ Yes indicates BB% included as covariate in analysis; Rescale Yes/No indicates phenotypes Brahman and Tropical Composite animals rescaled to the same phenotypic variance; BD SB and XB indicate Single breed allele frequency and adjusted for breed specific allele frequency respectively)
Q No Yes
Rescale No Yes No Yes
BD SB XB SB XB SB XB SB XB
Tropical Composites
TC 0.783 0.789 0.746 0.752 1.018 1.015 0.971 0.968
TC+1BB 0.885 0.881 0.844 0.841 0.992 1.007 0.963 0.974
TC+2BB 0.944 0.936 0.908 0.900 0.972 0.995 0.955 0.975
TC+3BB 0.971 0.964 0.943 0.936 0.948 0.978 0.941 0.968
3BB 0.970 1.006 1.027 1.065 0.830 0.895 0.879 0.948
TC+4BB 0.976 0.972 0.957 0.952 0.919 0.956 0.921 0.954
Brahman
TC 1.036 1.101 0.987 1.049 1.704 1.680 1.624 1.601
TC+1BB 1.895 1.906 1.879 1.892 2.054 2.051 2.063 2.059
TC+2BB 1.921 1.920 1.965 1.966 1.945 1.950 2.004 2.008
TC+3BB 1.690 1.687 1.757 1.754 1.693 1.696 1.767 1.769
3BB 1.749 1.750 1.852 1.853 1.729 1.734 1.831 1.835
*TC is cross validation with 3 groups included in training; Number preceding BB represents the number of BB cross validation groups included in training

74
Figure 1 Histogram of the absolute value of the difference in allele frequency between
Brahman (KLL) and Bos Taurus (KMN) for individual SNP (calculated across 6 BT breeds)
Figure 2 Histogram demonstrating the diversity of Bos indicus proportion estimates within
Tropical Composite beef cattle.

75
CAPÍTULO 4 - CONSIDERAÇÕES FINAIS
A partir dos resultados encontrados neste estudo observa-se que as matrizes
de parentesco utilizando as informações de dados genômicos podem ser uma
importante informação para auxiliar na avaliação e seleção de gado de corte.
Mesmo não detectando diferença significativa na estimação dos parâmetros
genéticos populacionais utilizando as diferentes matrizes, é possível notar a diferença
da classificação dos animais em cada metodologia. Isto pode não ser de extrema
importância para o melhoramento genético animal, principalmente se for selecionar
grupos de animais, porém pode ter uma grande influência econômica já que existe
diferença na posição de classificação dos animais melhores classificados. Por
exemplo, o sêmen de um touro tem maior valor quanto melhor sua classificação na
população e o número de doses vendidas também poderá alterar-se. Este trabalho
indicou que existem diferenças neste ranqueamento dos indivíduos usando diferentes
matrizes de relacionamento, porém seria interessante uma melhor investigação de
qual matriz de relacionamento apresenta uma classificação mais acurada dos animais.
Para características de moderada a alta herdabilidade, a seleção genômica
pode não ser viável quando comparada ao método tradicional devido ao alto custo de
implementação e o baixo ganho na acurácia mesmo adicionando informações de
relacionamento genético entre indivíduos não correlacionados pelo pedigree. Porém
deve-se levar em conta que os bancos de dados com estas novas informações vêm
crescendo e acredita-se que, no futuro, com o domínio da tecnologia e a redução do
custo de genotipagem dos animais, esta nova metodologia poderá trazer grandes
vantagens para características que podem ser medidas com precisão e que não
tenham alta herdabilidade.
Quanto a avaliação multirracial no Brasil, apesar da população bovina de gado
de corte ser predominante zebuína, cada vez mais vem sendo utilizado cruzamento
entre raças devido à crescente exigência do mercado por cortes de melhor qualidade
e para maior adaptação dos animais.
Os coeficientes de parentesco genômico podem levar a uma melhor avaliação
genética dos animais e as novas metodologias propostas neste trabalho podem ser
uma ferramenta importante para esta avaliação, pois como observado em alguns
76
trabalhos, animais Bos taurus apresentam melhor classificação de carcaça, aliado
com as características já conhecidas do zebuíno brasileiro pode-se atender as
exigências do mercado sem perder a qualidade genética obtida nestes longos anos
de melhoramento genético animal brasileiro.
Finalmente, deve-se considerar que todas as análises realizadas nestes
trabalhos foram univariadas, ou seja, para uma característica. Portanto, seria
interessante comparar estes resultados com outras analises utilizando várias
características e também deve-se considerar a utilização de outras fontes de
informação, como índices de seleção, podendo, assim, detectar algumas diferenças
significativas nas metodologias descritas, tanto na determinação de qual matriz de
parentesco é a mais adequada para a população em análise quanto na adição de
informações de proporção de Bos indicus em populações multirraciais.
Related Documents