DISCUSSION PAPER SERIES Forschungsinstitut zur Zukunft der Arbeit Institute for the Study of Labor Education Policies and Practices: What Have We Learnt and the Road Ahead for Bihar IZA DP No. 6614 June 2012 Priya Ranjan Nishith Prakash

Welcome message from author
This document is posted to help you gain knowledge. Please leave a comment to let me know what you think about it! Share it to your friends and learn new things together.
Transcript

DI
SC
US
SI
ON
P
AP
ER
S
ER
IE
S
Forschungsinstitut zur Zukunft der ArbeitInstitute for the Study of Labor
Education Policies and Practices:What Have We Learnt and the Road Ahead for Bihar
IZA DP No. 6614
June 2012
Priya RanjanNishith Prakash
Education Policies and Practices:
What Have We Learnt and the Road Ahead for Bihar
Priya Ranjan University of California, Irvine
Nishith Prakash University of Connecticut,
IZA & CReAM
Discussion Paper No. 6614 June 2012
IZA
P.O. Box 7240 53072 Bonn
Germany
Phone: +49-228-3894-0 Fax: +49-228-3894-180
E-mail: [email protected]
Any opinions expressed here are those of the author(s) and not those of IZA. Research published in this series may include views on policy, but the institute itself takes no institutional policy positions. The Institute for the Study of Labor (IZA) in Bonn is a local and virtual international research center and a place of communication between science, politics and business. IZA is an independent nonprofit organization supported by Deutsche Post Foundation. The center is associated with the University of Bonn and offers a stimulating research environment through its international network, workshops and conferences, data service, project support, research visits and doctoral program. IZA engages in (i) original and internationally competitive research in all fields of labor economics, (ii) development of policy concepts, and (iii) dissemination of research results and concepts to the interested public. IZA Discussion Papers often represent preliminary work and are circulated to encourage discussion. Citation of such a paper should account for its provisional character. A revised version may be available directly from the author.

IZA Discussion Paper No. 6614 June 2012
ABSTRACT
Education Policies and Practices: What Have We Learnt and the Road Ahead for Bihar*
This paper assesses the status of education, both quantity and quality, in Bihar in both absolute terms and relative to other states in India. It then performs a regression exercise using a panel data of Indian states to identify the correlates of educational outcomes. It also surveys the broader literature on education policies which provides a perspective on the current policies in the field of education in Bihar. Finally, it makes a case for several policy initiatives that should be accorded priority by the policymakers in Bihar. JEL Classification: I2, J31, O15, O22 Keywords: education, enrollment, out-of-school, Bihar, India Corresponding author: Nishith Prakash Department of Economics and Human Rights Institute University of Connecticut Storrs, CT 06269-1063 USA E-mail: [email protected]
* This paper was written under the aegis of International Growth Centre, U.K. We are grateful to International Growth Center at London School of Economics for funding this research proposal. We are grateful to Aimee Chin, Maitreesh Ghatak, Anjan Mukherji, officials at Ministry of Human Resources and Development, the participants at IGC Growth Week at London School of Economics and Political Science, and IGC Bihar Growth Conference in Patna, Bihar for helpful comments and suggestions. We would also like to thank Ian Michael Salas for providing excellent research assistance. We are responsible for any errors that may remain.
1 Introduction
Educational attainment of a society is an important determinant of its level of economic
development. If a poor state like Bihar wants to become rich, it must ensure that its children
are well educated. The aim of this paper is to assess the status of education in Bihar, identify
the correlates of educational outcomes, and analyze the education policy initiatives of the
government of Bihar.1 It also surveys the broader literature on education policies which
provides a perspective on the current policies in Bihar and allows us to make some informed
policy recommendations.
We first look at the status of education (both quality and quantity) in Bihar, mainly at the
primary and upper primary levels because of data availability issues, both in absolute terms
and in relation to other states in India. We find that the enrolment rate at the primary level
in Bihar has been increasing over time and is higher than the median of the 20 large states
starting in 2006-07. The enrolment rate at the upper primary level is very low in absolute
terms and right at the bottom of the 20 major states in India. An alternative way to look at
enrolment is to see what percentage of school age children are not attending school. Again,
Bihar has a higher percentage of children not attending school than the median state in
India, however, the percentage has been declining over time. Consistent with the enrolment
numbers, the out of school rate is higher among older children.
Looking at the quality dimension of education, we find that Bihar is right around the
median in both “Reading attainment” and “Math attainment”. Therefore, the performance
is satisfactory in relative terms, however, there is a lot of scope for improvement in raising
the quality of education. To cite a couple of stark statistics: 30% of students in class VI
cannot read a paragraph taken from a class II textbook; 50% of class V students cannot
solve a simple division problem.
1Bihar is the third largest state in India in terms of population with a population exceeding 100 millionaccording to the 2011 census.
1

Next, we look at the correlates of educational outcomes using state level data from India.
We find that Bihar has the highest pupil-teacher ratio as well as the student-classroom ratio
among Indian states. In 2009-10, which is the last year for which we had data, Bihar had
a student-teacher ratio of 53, while the median was 26. Among other notable schooling
infrastructure measure, the percentage of schools with separate girls’ toilet is well below the
median in Bihar. Also, more than 10% of primary schools in Bihar do not have drinking
water facility.
Looking at the bivariate relationship between schooling inputs and educational outcomes
we find expected results. For example, higher pupil-teacher ratio or higher student-classroom
ratio is negatively associated with Reading and Math attainment and positively associated
with out of school rate. Similarly, the availability of drinking water, girls’ toilet, or good
quality classrooms is associated with better learning outcomes and lower out of school rates.
In our regression exercise relating schooling inputs to educational outcomes using state
level data from India we find that pupil-teacher is negatively associated with learning as
reflected in performance on reading and math, while the availability of drinking water facility
is positively associated with learning. As far as the impact on enrolment is concerned,
the availability of drinking water facility and well-maintained classrooms are significantly
associated with higher enrolment. As well, states which have increased the percentage of
schools with separate girls’ toilet have improved the enrolment of both boy and girls.
The next part of the paper is a survey of the literature on the effectiveness of education
policies adopted in different parts of the world to improve both the quantity and quality of
education. One policy that is extremely cost-effective in improving educational outcomes
is the school based deworming program. It is heartening to note that taking this result
seriously, the government of Bihar launched a massive deworming program in the early 2011,
which by some estimates treated 17 million children. The government intends to do a follow
up in 2012.
The extensive survey of Glewwe et al. (2011) finds an adequately-equipped and well-
2
functioning school, which means one with quality roofs, walls or floors, with usable desks,
tables and chairs, and with a school library, appears to have a clear positive impact on test
scores. Well maintained classrooms were found to be significant in explaining enrolment in
our regression exercise as well. Also, Chaudhury et al. (2006) find schooling infrastructure
to be a key determinant of teacher absence. Therefore, improving schooling infrastructure
in general and classrooms in particular should be a policy imperative.
Two policy initiatives that we emphasize most in our discussions are the provision of
drinking water facilities and separate girls’ toilet in all schools in the state. We provide some
back of the envelope calculations for the cost of providing these schooling inputs and come
up with numbers that are not large by any means.
Our survey of the literature suggests that the perceived returns to schooling are much
less than the market returns resulting in underinvestment in education in many developing
countries. A policy implication is to reduce the gap between the perceived returns and the
market returns through information campaigns. Experimental studies suggest that these
information campaigns are extremely cost effective in increasing school enrolment. Since
Bihar does not have a program of this kind in place, we would make a strong recommendation
for launching a systemic program of information campaign regarding the returns to education.
Most studies on the link between incentive pay and educational outcomes find the effects
to be positive. An essential prerequisite to the implementation of any kind of incentive pay
scheme is to set up a data system for monitoring the performance of schools and teachers.
Such a data system is essential in linking student performance to teacher effectiveness. We
provide some back of the envelope calculations for the cost of developing such a data system.
Developing such a data system will be a fruitful endeavor even if the government didn’t
want to implement an incentive pay scheme. It will allow the administrators to monitor the
performance of schools and take remedial actions in weakly performing schools. Again, we
provide some back of the envelope calculations for developing such a data system.
The rest of the paper is organized as follows. In section 2 we look at the status of
3

education in Bihar relative to other states in India and provide a quantitative exercise on
the correlates of educational outcomes. In section 3 we provide a survey of the literature
on educational policy interventions. Section 4 discusses the policy initiatives undertaken
by the government in the context of our broader survey framework and makes some policy
recommendations. Section 5 provides some concluding remarks.
2 Status of Education in Bihar
2.1 Quantity of Education
We use two measures of quantity of education. First, out of school rate–percentage of
school–age population not attending school (from ASER)2. Second, net enrolment ratio–
percentage attending school in appropriate age group among school–age population (from
DISE)3.
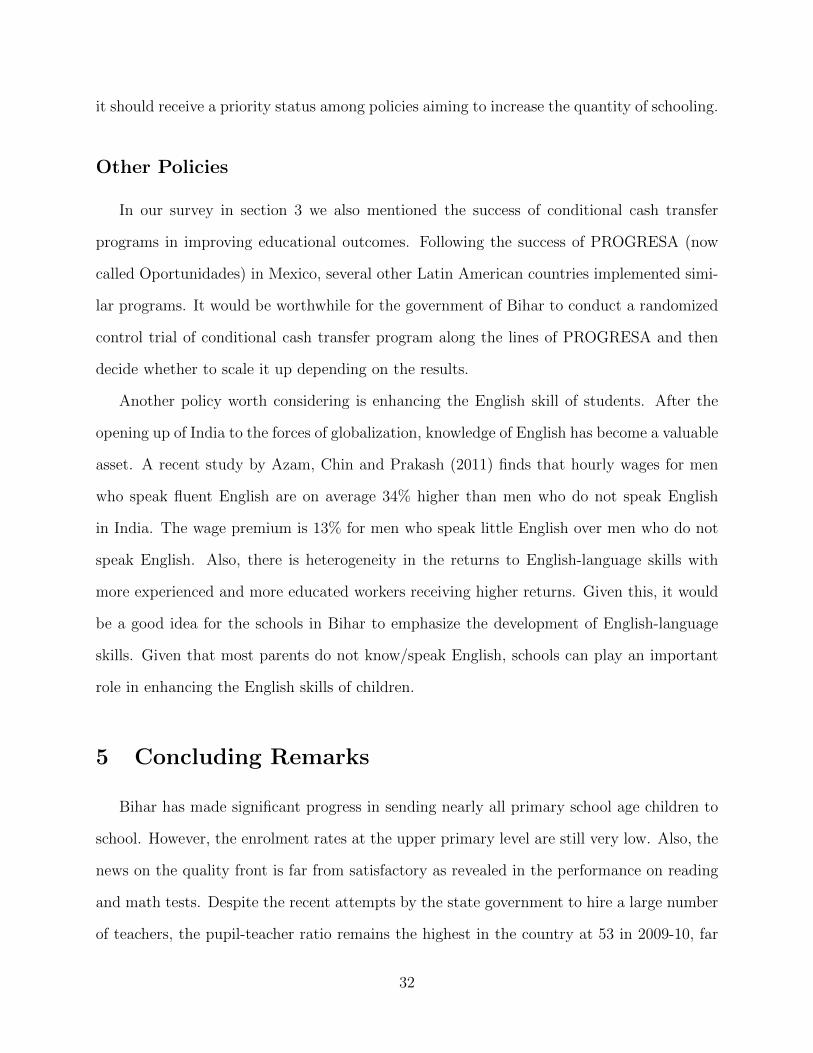
Figure 1, drawn using ASER data, shows that the out of school rate among primary
school age children (age 6-14) has been declining over time. It was close to 15% in 2005 but
has fallen to below 5% by 2010. While Bihar was the worst performing state by this measure
in 2005, it has converged to the median by 2010.
Figure 2 looks at the net enrolment ratio at the primary level using data from DISE. The
net enrolment ratio at primary level has been increasing over time and in the last year for
which DISE data for Bihar are available, it increased from below 70% in 2003-04 to almost
100% in 2006-07. This suggests that the recent enrolment drives launched by the government
of Bihar has been successful in increasing the enrolment rate at the primary level.
The picture changes dramatically when we look at the upper primary level. As can
be clearly seen from Figure 3, even though Bihar has made some progress in increasing
enrolment at the upper primarily level, the enrolment remains abysmally low both in absolute
2Assessment Survey Evaluation Research, India.3District Information System for Education, India.
4
and relative terms. In relative terms, while Bihar was at the bottom in 2003-04 with an
enrolment ratio of less than 20% it has increased to 48% in 2009-10, but is still well below
the median which stands at close to 60%. Therefore, the enrolment drive at primary level
has not been sustained for higher grades. Having looked at the quantity of education, we
turn our attention to the quality dimension.
2.2 Quality of Education
We use two measures to look at the quality of education in Bihar. The first one has to
do with the Reading attainment and looks at the percentage of children who can read a long
paragraph/story from a grade 2 level textbook in their vernacular language. The second
measure assesses the Math attainment of children based on the percentage of children who
can solve a 3-digit by 1-digit division problem correctly. Both these measures are from ASER
and are available for several years.
From Figure 4 it is clear that Bihar’s performance on reading is very close to the median
of 20 states. However, in absolute terms the performance is highly unsatisfactory. To cite
one representative number, 30% of students in class VI cannot read a paragraph taken from
a class II textbook.
Figure 5 plots data on Math attainment of children taken from ASER. Again, Bihar does
reasonably well in relative terms. The Math attainment of students in Bihar is consistently
at or above the median of 20 states, but the gap with the best performing state in India is
substantial. However, in absolute terms, there is a vast scope for improvement. To cite one
stark number: 50% of class V students cannot solve a simple division problem.
Having looked at the status of education in Bihar, we move to a discussion of the proxi-
mate determinants of educational outcomes in terms of various schooling inputs.
5

2.3 Correlates of Educational Outcomes
We look at the following five schooling input measures available from DISE: Pupil-teacher
ratio; Student-classroom ratio; percentage of schools with toilet for girls; percentage of
schools with drinking water facility; percentage of classrooms in good condition.
Figure 6 plots the pupil-teacher ratio for primary schools in different states in India. It
is clear from the figure that the pupil-teacher ratio in primary schools in Bihar is the highest
among the 20 states that we look at. Even though the ratio has been declining over time, it
remains the highest in the country at 53 in 2009-10 against a median of 26.
The story for the student-classroom ratio is similar to that for pupil-teacher ratio. As
shown in Figure 7, Bihar, once again is the worst performer with a very high student to
classroom ratio, exceeding 80 in all years. There is a huge gap between Bihar and the
median for Indian states.
Next, we look at some measures of schooling infrastructure. Figure 8 shows that Bihar
has been making a steady progress in equipping schools with drinking water facilities and is
closing in on the goal of drinking water facilities in all primary schools. From being below
the median at the beginning of our data period, Bihar has moved beyond the median and
has narrowed the gap with the best performing state in India. However, in the last year of
the sample, roughly 10% of the primary schools were without drinking water facilities, which
is unacceptable.
The PROBE report had found the availability of a separate girls’ toilet to be an important
determinant of female schooling. Figure 9 shows that Bihar has a long way to go in terms of
equipping schools with separate girls’ toilet. In the last year of our data only 20% of schools
had separate girls’ toilet which is low both in absolute and relative terms. This is a cause for
concern not only because of its consequences for female enrolment and attendance but also
for female teacher attendance. Bihar has been focusing on hiring female teachers for primary
schools, and a lack of separate toilet can be a significant contributor to teacher absenteeism.
6

Our final measure of schooling input is the proportion of classrooms in good condition.
As Figure 10 shows, the proportion of classrooms in good conditions was just about 60%
in the last year for which data are available. This again, is below the median and the gap
between Bihar and the best performing state in India is to the order of 20 percentage points.
It is worth pointing out that when we look at the schooling inputs at the upper primary
levels, we get a qualitatively similar picture. To conserve space, we do not put these figures
in the paper.
Having good schooling infrastructure has been found to be a significant determinant
of teacher attendance in the cross-country study of Chaudhury et al. (2006). Therefore,
improving schooling infrastructure should be a policy imperative of the government of Bihar.
The first aim should be to close the gap with the median state on measures where Bihar
is below the median and subsequently the aim should be to close the gap with the best
performing state in India.
2.4 Cross-State Regression Analysis
Having looked at various measures of schooling attainment and inputs, we provide some
cross-state correlation analysis between the two. We first look at the simple correlation
between our outcome measures and input measures provided in Table 1.
We see that all input measures (D)-(I) have intuitive bivariate associations with reading
and math attainment. First, both the pupil-teacher ratio (D) and the student-classroom
ratio (E) are negatively related to learning attainment (more crowded school settings are
associated with lower learning attainment). All the school infrastructure variables (F)-(I),
where higher numbers denote having more adequate school infrastructure, are positively
related to learning attainment (better-provisioned school settings are associated with higher
learning attainment).
For the out of school rate, the relationships are reversed from above and are also intuitive.
The pupil-teacher ratio (D) and the student-classroom ratio (E) are positively related to the
7

out of school rate (less crowded school settings exist in areas where school attendance is
high), while the school infrastructure variables (F)-(I) are negatively related to the out of
school rate (better-provisioned school settings exist in areas where school attendance is high).
Having looked at the bivariate correlations we move to the regression analysis to isolate
the impact of individual input measures on our outcomes of interest. Our estimating equation
is the following:
(Learning Outcome)st = α + β1(Pupil − Teacher Ratio)st + β2(Student− Classroom Ratio)st
+β3(Drinking Water)st + β4(Girl′s Toilet)st
+β5(Classrooms in Good Condition)st + eist (1)
In the equation above s is state and t is year. We use data on 20 major states over a period
of 6 years. Due to missing data for some states in some years, our panel is unbalanced
and the number of observations is less than 120. We use three alternative dependent vari-
ables: 1) Proportion of children who can read a long paragraph (Table 2); 2) Proportion of
children who can solve a division problem (Table 3); 3) Out of school rate (Table 4). We
exploit cross-state and over time variations to identify the effects of independent variables
on the dependent variables of interest. We use state fixed effects to control for any time-
invariant state characteristics and time fixed effects to control for any time trends arising
from macroeconomic shocks or national policies that affected all states uniformly.
Table 2 provides results on the determinants of Reading. The key results in table 2
are the following. Lower pupil-teacher ratio and availability of drinking water facility are
significantly associated with higher reading attainment. However, the statistical significance
of the above determinants of reading attainment goes away when year and state fixed effects
are included suggesting that the results are driven by cross-state variation rather than within-
state variation.
Table 3 provides results on the determinants of Math attainment. The results are qual-
8

itatively similar to those for Reading. The two regressors, pupil-teacher ratio and drinking
water facility, which were found to be significant in the Reading regressions, have large co-
efficients but fail to be statistically significant at the conventional levels. Drinking water
facility, however, turns out to be significant in the separate regression for girls.
Table 4 provides results on the relationship between out of school rate and measures
of schooling inputs. Note from Table 4 that the availability of drinking water facility and
well-maintained classrooms are significantly associated with lower out of school rate (higher
school attendance). Regressions with time and state fixed effects show that states which have
improved classrooms have lowered out of school rates. As well, states which have increased
the percentage of schools with separate girls’ toilet have improved the enrolment of both boy
and girls.
As far as the implications of pupil-teacher ratio and student-classroom ratio for enrolment
are concerned, we get some positive and some negative coefficients. Normally, we would
expect states with high pupil-teacher ratio or student-classroom ratio to have bad quality
schools and therefore enrolment should be lower. That is, the coefficients of pupil-teacher
ratio and student-classroom ratio should be positive in Table 4. However, in cases of these
variables there is a possibility of reverse causality. That is, states which succeed in increasing
enrolments may have crowded schools because the hiring of teachers or building of classrooms
has not gone at the same pace. We also observed this for the case of Bihar where the
increased enrolment since 2007-08 (see Figure 1) was accompanied by a slight uptick in the
pupil-teacher ratio since 2007-08 (see Figure 6).
To conclude this section, we found several measures of schooling inputs to be significantly
correlated with our outcome measures. Having good schooling infrastructure has been found
to be a significant determinant of teacher attendance in the cross-country study of Chaudhury
et al. (2006). Therefore, improving schooling infrastructure should be a policy imperative
of the government of Bihar. The first aim should be to close the gap with the median state
on measures where Bihar is below the median and subsequently the aim should be to close
9

the gap with the best performing state in India. Next, we turn our attention to a survey of
the literature on education policies.
3 Survey of Literature on Education Policies
Kremer and Holla (2009) provide an excellent survey of education policies with a focus
on randomized evaluations. In this section we draw upon their work and also summarize
findings of papers that are not discussed in their survey.
3.1 Increase Enrolments in Schools
3.1.1 Supply-Side Interventions
Duflo (2001) studies the implications of a large school expansion program launched in
Indonesia from 1973 to 1978. More than 61,000 primary schools were constructed-an av-
erage of two schools per 1000 children aged 5-14 in 1971. The school expansion program
followed a general allocation rule-the number of schools to be constructed in each district
was proportional to the number of children of primary school age not enrolled in school in
1972. During this period of rapid expansion of schools, the enrolment rate went up from 69%
in 1973 to 83% in 1978 for children aged 7-12. Combining differences across regions in the
numbers of schools constructed with differences across cohorts induced by the timing of the
programs, Duflo estimated that each primary school constructed per 1000 children led to an
average increase of 0.12 to 0.19 years of education and 1.5 to 2.7 percent increase in wages.
The increase in years of education was brought about by increasing primary schooling. The
estimated returns to education ranged from 6.8 to 10.6 percent.
From a policy perspective, it is worth bearing in mind that a school construction program
like this takes a very long time to generate positive returns. This is because costs are incurred
early on, whereas the benefits are spread over generations.
10
3.1.2 Demand-Side Interventions
Reduction in Cost of Schooling
While economists generally agree that the reduced cost of access to health and education
is likely to increase the usage of these services, there is a contrarian view that people are likely
to value a good more if it commands a price compared to the case when it is given for free.
Therefore, the usage may be higher in the former case. In the case of education, however,
there is no empirical work supporting the contrarian view. All the papers described below
support the view that reducing the cost of access to education improves schooling outcomes.
Kremer and Holla (2009) in their survey discuss the three randomized experiments that
were undertaken in Kenya to measure the responsiveness of school participation to out-
of-pocket costs of schooling. The out-of-pocket expense in these studies was the cost of
school uniforms which was about $6 in 2002, a non-trivial amount considering that the per
capita GDP was about $340. The study by Kremer, Moulin, and Namunyu (2003) finds
that students in the treatment schools where uniforms were given for free remained enrolled
longer and advanced grades further than their counterparts in comparison schools. Since
the program had other components as well, it was difficult to isolate the impact of school
uniforms, although the authors claim that the other components didn’t affect enrolment.
The other two experiments were able to isolate the impact of uniforms. Evans, Kremer, and
Ngatia (2008) find that free uniforms given to primary school students reduced their absence
by one-third, or 6 percentage points, with larger effects (13 percentage points, or 64 percent)
for students who lacked uniforms prior to the program. Similarly, Duflo, Dupas, Kremer,
and Sinei (2006) find that providing free uniforms to sixth graders reduced the dropout rates.
Interestingly, it also reduced the childbearing of girls.
Providing free textbooks is another way to reduce the out of pocket cost of schooling.
In their extensive survey of the literature on the impact of school resources on educational
outcomes, Glewwe et al. (2011) come across 60 estimates from 21 different studies on the
11

impact of textbooks and workbooks on learning outcomes. Out of the 60 estimates, 36 are
positive and 26 are significantly positive, the number of significantly negative estimates is 4.
Thus, on balance the evidence in favor of providing textbooks/workbooks to enhance learning
outcomes is strong. One of the prominent studies that didn’t find free textbooks to have a
positive effect on test scores is Glewwe, Kremer and Moulin (2007). Digging deeper, they
find that the test scores of the strongest students did increase, which suggests a mismatch
between the curriculum and the needs of the majority of students.
While subsidizing school uniforms or textbooks can reduce the direct cost of schooling,
there is an opportunity cost of schooling coming from the foregone earning opportunities of
children coming from poor families. An intervention that reduced the opportunity cost of
schooling is the conditional cash transfer program in Mexico called PROGRESA. The pro-
gram provided cash grants to families linked to the school attendance of children. According
to Schultz (2004) this program had several desirable effects. In addition to increasing school
attendance, the program also increased the transition rate from elementary school to junior
secondary school. Interestingly, the repetition rate decreased for children in grade 1 and 2
who were not yet eligible for benefits, suggesting positive spillovers.
School meals can also be thought of as conditional transfer program because the meal
is provided to only children who are present in school. Kremer and Vermeersch (2004) find
that a school feeding program in preschools in Kenya had a positive effect on attendance.
Merit Scholarship
Experimental evidence from developing countries suggests that in some cases merit schol-
arship induces students to work hard. One such intervention was in Western Kenya. This
intervention provided grade 6 girls a two year award consisting of free school supplies for one
year, and a public recognition at an awards assembly. The student had to score in the top
15 percent of their district exam to qualify for this award. In an evaluation of this program
Kremer, Miguel, and Thornton (2009) find that the test scores of eligible girls increased
12

by 0.19 standard deviations and the gains were more pronounced in larger and prosperous
districts. In addition to the impact on test scores, student absenteeism went down as well.
The authors also find positive spillovers of this intervention on students not eligible for this
program.
Information Provision on Returns to Schooling and Job Opportunities
If the actual returns to schooling are greater than the perceived returns, then providing
information on the returns to schooling can potentially increase participation in school. Using
survey data from Dominican Republic for class 8th male students Jensen (2010) finds that the
measured economic returns to secondary schooling exceed the returns perceived by students.
When students are provided information on the measured returns to schooling in randomly
selected schools, the average years of completed schooling goes up by 0.20 - 0.35 over the next
four years compared to children in other schools. This study also finds that the residential
segregation by income is one of the factors why students underestimate returns to education.
A policy implication of these findings is to stimulate demand by information campaigns
about returns to schooling. Such policies tend to require minimal fiscal expenditure.
Nguyen (2008) studies a program in Madagascar that informs students of class 4 and
their parents about the earnings differences by the levels of education. The program led to
increases in attendance and test scores. Another intervention was to have role models with
high education from different income backgrounds talk about their life stories to the students
from the treatment group. The intervention was effective in raising test scores if the role
model came from a poor income background similar to the students.
Health-Related Interventions
In a widely cited paper, Miguel and Kremer (2004) study the impact of a randomized
mass deworming program carried out in primary schools in Kenya. The program was very
successful in reducing the absence rates of students not only in treatment schools but also in
13

neighboring schools through spillover effects. One plausible explanation behind the positive
spillover is the interruption of disease transmission both within and across schools.
A similar program was conducted in urban India where deworming and iron supplements
were provided in the treatment pre-schools. Bobonis, Miguel, and Sharma (2004) report that
the intervention reduced the absence rate with the results being more pronounced among
girls and children from low socio-economic status areas.
Using temporal and spatial variation in the implementation of an iodine supplement
program in Tanzania, Field, Robles and Torero (2007) find that the children who had been
exposed to this program in utero completed more years of schooling than those who did not
get the treatment in utero.
Bleakley (2007) presents historical evidence on the effectiveness of deworming campaign
in the early 20th century United States in improving school enrolment, school completion,
and increased wages.
3.2 Improve School Quality
In the education literature poor school quality is often blamed for low school attendance.
Below we look at the empirical evidence on the subject.
3.2.1 Teacher Inputs
Improving teacher inputs can improve educational outcomes along both quantitative and
qualitative dimensions. Chin (2005) studies one such program in India, namely Operation
Blackboard. Under this program, the central government of India provided all primary
schools a teaching- learning equipment packet consisting of blackboards, books, charts and
teacher’s manual. Another component of this program provided all one teacher primary
schools an additional teacher. Using survey data Chin (2005) finds that there was a substan-
tial misallocation of resources in the sense that teachers were not necessarily allocated to the
schools where they were needed most. She doesn’t find evidence of a decrease in class size
14

either. One possible explanation is that the states which were getting additional teachers
under this program slowed down their normal hiring. However, the teacher component of
this program did lead to an increase in the primary school completion rate for the girls and
the poor.
Duflo, Dupas, and Kremer (2007) study Kenya’s Extra Teacher Program to see the impact
of hiring a contract on test scores. While the program reduced the pupil-teacher ratio from
84 to 46, there was no effect on students test scores in the treatment schools.
Banerjee, Jacob, Kremer, Lanjouw and Lanjouw (2005) study the impact of hiring an
extra teacher on educational outcomes in one-teacher non-formal education centers in India.
The results from this experiment suggest that this program increased girls’ attendance by
50 percent but had no impact on the boys’ attendance primarily because of the fact that 63
percent of the new hires were females while only 19 percent of the teachers in comparison
schools were females. Consistent with the view that households are more likely to send a girl
child to school if at least one teacher is of the same gender, the authors find smaller impact
on girls’ enrollment when the original teacher in the school was female.
In a recent paper, Chetty et al. (2011) link data on the random assignment of students
and teachers in Tennessee to small class sizes in kindergarten to third grade to later life
outcomes using Social Security and other administrative records. They demonstrate that
while innate ability, as measured by test scores in early childhood, is strongly correlated
with various indicators of well-being such as earnings at age 27, college attendance, home
ownership, and retirement savings, students who were assigned to small classes were still
significantly more likely to go to college. They also show that peer effects are important
even at young ages since children who were assigned to high-quality class environments, as
measured by having classmates with high test scores, had higher earnings.
15

Recruitment and Promotion
Gordon, Kane and Staiger (2006) cite evidence from the U.S. that the distribution of
performance of traditionally certified teachers is no different from alternatively certified or
even uncertified teachers. Also, a teacher’s performance in the first couple of years is a
good indicator of his/her long term performance. Based on this evidence they advocate a
new approach for improving teacher quality. They recommend moving away from raising
the credential for entry (the traditional approach) and focusing instead on identifying good
teachers directly and linking the rewards to effective teaching. Teaching effectiveness should
be measured by a combination of things: student achievement (some measure of value added
or average gain in performance), subjective evaluations by principals and peers, and parental
evaluations. They recommend against evaluating teachers based on licensure status, degrees
awarded or courses taken. They advocate a bonus for highly rated teachers willing to teach
in high poverty schools. They also suggest making it harder to promote least effective
teachers to tenured positions. One approach would be that teachers in the bottom quartile
of effectiveness after two years would not qualify for tenure and not be allowed to continue
teaching.
To get around the problem of evaluating teachers in early elementary grades or high
schools where test scores are not available they make the following suggestion. A state could
require probationary teachers to start teaching in grades four or five, where their performance
could be measured using the test score data. They could also develop alternative evaluation
systems for teachers in non tested grades and subjects where value added measures are not
practical. As an example they cite Connecticut’s Beginning Educator Support and Training
(BEST) program in which teachers submit portfolios of their work including lesson logs,
videotaped segments of teaching, examples of student work, and reflective commentaries
on the goals during the lesson. Portfolios are scored by multiple external assessors with
experience in the same area as beginning teachers.
16
Teacher Absenteeism
Chaudhury et al. (2006) study the issue of teacher absenteeism using first hand data
from 6 developing countries including India. Their data are based on surveys where the
enumerators made unannounced visits to schools and primary health care centers. They
found the average teacher absence rate across the 6 countries to be around 19%. The number
for India was 25%. The welfare effect of teacher absence is particularly high in India because
many schools are one-teacher schools and substitutes rarely replace absent teachers. In this
event, the students simply mill around, are unproductive, go home or join another class,
often of a different grade. Despite such a high rate of absenteeism, teachers are not held
accountable in India. An even more vexing problem is that even when teachers are present,
they are not necessarily teaching. The paper finds that in Indian government-run schools,
only 45% of the teachers assigned to a school are actually engaged in teaching activity at a
given point of time. In Kenya enumerators found that while teachers were absent from the
class 27% times, they were absent from school only 20% of the time.
Despite the provision of punitive action against absenteeism, teachers are rarely fired in
India. Out of the 3000 Indian government run schools in their sample, only one head teacher
reported a case where a teacher was fired for repeated absence. This may partly be due to
the fact that Indian teachers have the support of unions which are strong and politically
influential.
Chaudhury et al. (2006) conduct a regression exercise to understand the correlates of
teacher absence in their sample of countries. Among teacher characteristics, somewhat sur-
prisingly, they find that higher salaries are not necessarily correlated with lower teacher
absence. Some important teacher characteristics related to teacher’s absence are as follows:
more powerful teachers are absent more; men are absent more than woman; head teachers
are absent more than regular teachers; better educated teachers appear to be absent more;
and finally, teachers who were born in the same district where the school is located are less
17

likely to be absent.
Among school characteristics, they find a strong effect of school infrastructure on teacher
absenteeism. A one standard-deviation increase in the school infrastructure index (toilets,
covered classroom, non-dirt floors, electricity, and a school library) is associated with a 2.7
percentage point reduction in absence. This relationship remains even for teachers on their
first posting, suggesting that the reverse causality from bad/sanctioned teachers being sent
to schools with poor infrastructure is not driving the results.
More frequent monitoring of schools by higher authorities reduces teacher absenteeism.
Among community characteristics, they find significant effect of parental literacy on teacher
absenteeism. The regression result shows that a 10 percentage point increase in the parental
literacy rate reduces the predicted absence by more than one percentage point.
Chaudhury et al. (2006) also find that private school teachers are 8 percentage points less
likely to be absent than public school teachers working in the same village. As well, contract
teachers from local areas less likely to be absent in all 6 countries. Some experiments from
Kenya and India suggest the effectiveness of contract teachers. However, it is not clear
which characteristics of contract teachers were responsible for the success in Kenya and
India. The following are some of the possible reasons: they came from the same community
as parents meaning they could have faced effective sanctions outside the school environment;
they were chosen by school committees rather than central bureaucracy; contract teachers
had renewable contracts, and they could be fired.
In a study based on data from Kenya, Glewwe, Ilias, and Kremer (2008) find that absences
are not primarily due to a few teachers being absent all the time, but many teachers being
absent from 20 percent to 50 percent of the times, with median teacher being absent 14-19
percent of the time.
In their survey of teacher incentive programs, Glewwe, Holla, and Kremer (2008) report
that the merit scholarship program for 6th grade girls in Kenya mentioned earlier also led
to an increase in teacher attendance in the program schools by 4.8% points from a baseline
18
of 84% suggesting a 30% decrease in absence. In addition to teachers being more motivated
to teach if students were motivated, parental monitoring may have played a role as well.
Parents in treatment schools would visit schools more frequently to monitor teachers and
pressure them to work hard so that their daughters could win scholarships.
Glewwe, Holla, and Kremer (2008) also study the impact of “Tracking” in explaining
absenteeism. Tracking happens when children are segregated into classes based on their
pre-intervention achievement score. They found that civil service teachers in the “tracked”
schools with extra contract teachers were 5.4 percent points more likely to be found in schools
on a random day relative to counterparts in untracked schools with contract teachers. The
results suggest that it is more pleasant to teach children with above median ability. This
is also consistent with the evidence in Chaudhury et al. (2006) that work environment (as
reflected in school infrastructure in their study) is a key determinant of teacher absenteeism.
Policies Aiming to Reduce Absenteeism
Duflo, Hanna, and Ryan (2007) use a randomized experiment to study whether giving
teachers cameras equipped with a tamper proof date and time function and rewarding them
for attendance had an impact on teacher absence. They find that teacher absence rate
declined from 42 percent to 22 percent in treatment schools. The decline in absence was
accompanied by a 30 percent increase in instruction time which resulted in increased student
learning: the test scores in the treatment schools were 0.17 standard deviation higher than
in the comparison schools. As well, the teachers in treatment schools were no less likely
to teach conditional on being present than the teachers in comparison schools. Children in
treatment schools obtained 2.7 more days of schooling per month. The program also resulted
in higher test scores and increased the graduation rate to mainstream schools. The program
was extremely cost effective because the per child cost of raising test scores by 0.1 standard
deviation was only $3.58.
In contrast to the above studies which show the effectiveness of incentives in reducing
19

teacher absenteeism, Kremer and Chen (2001) find that the incentives failed to reduce teacher
absence under a program in rural Kenya. Under this program headmasters were supposed to
reward teachers for attendance with cash bonuses. However, headmasters ended up giving
bonuses to all teachers regardless of attendance.
3.2.2 Incentive Structure
Incentive Pay for Teachers
One of the more controversial policies in the literature on education reforms is that
of incentive pay for teachers. Opponents of incentive pay schemes argue that teaching is
inherently different from other jobs because the output of a teacher is not marketed. This
makes it extremely difficult to measure the performance of a teacher. As well, since teachers
work as a team creating performance based awards for individual teachers can vitiate the
atmosphere of cooperation in schools. Finally, problems arise due to multitasking. That
is, a teacher’s performance is multi-dimensional, and tying the incentives to certain easy to
measure dimensions of performance such as student test scores can result in “teaching to the
test” at the cost of overall learning of students. However, supporters of incentive pay argue
that advances in data systems allow more precise estimation of “value added” which can be
used to design performance pay schemes. In the U.S. the department of education has created
a competitive grant program to encourage states to develop databases that support value
added measures (see Podgursky and Springer, 2007). If teachers work in teams then group
incentive programs can work better than individual incentives. As far as the multitasking
problem is concerned, the solution may lie in linking the incentives to a broader set of
outcomes rather than just test scores. Finally, the advocates of merit pay argue that even
if performance pay does not raise student achievement it may improve the overall quality of
teachers through a positive selection effect. That is, it may attract people with higher ability
into the teaching profession and may induce those with lower ability to either leave or work
really hard to improve.
20

Despite the controversy over merit pay, several school districts and states in the U.S.
have started using merit pay schemes. Several states in the US have begun to use merit pay
for teachers. In 1999 the city of Denver started a new teacher pay program linked to student
performance and professional evaluations. In 2006 the state of Texas created the largest
pay for performance program in the U.S. The state of Florida requires school districts to
earmark at least 5 percent of the total salary pool for merit pay (see Table 2 in Podgursky
and Springer (2007) for a comprehensive list of merit pay schemes in the U.S.)
Despite the controversy over merit pay, several school districts and states in the U.S.
have started using merit pay schemes. In 1999 the city of Denver started a new teacher
pay program linked to student performance and professional evaluations. In 2006 the state
of Texas created the largest pay for performance program in the U.S. The state of Florida
requires school districts to earmark at least 5% of the total salary pool for merit pay (see
Table 2 in Podgursky and Springer (2007) for a comprehensive list of merit pay schemes in
the U.S.)
Podgursky and Springer (2007) also provide a survey of the literature assessing the ef-
fectiveness of performance pay programs in the U.S. as well as outside the U.S. They nicely
summarize the literature in Table 3 of their paper according to which most studies (both
experimental and non-experimental) find the performance pay to have a positive impact on
student achievement. Below we discuss some of these studies in detail.
Lavy (2002) estimates the impact of a group incentive program carried out non-randomly
in 62 secondary schools in Israel in 1995. The objective of this intervention was to improve
the performance of high-school graduates in their matriculation exams and to reduce the
dropout rates in secondary schools. To get an award a school had to finish in the top third
of the participating schools. The award ranged from $13,250 to $105,000. Two-thirds of
the award amount was distributed among the teachers as salary bonuses. The awards were
distributed equally among all teachers in the winning schools. The resulting bonuses ranged
from $250 to $1000. The remainder third of the award was used to improve all-faculty
21

facilities. The program increased the average test scores and reduced the dropout rates in
the participating schools relative to the non- participating schools in the comparison group.
Lavy (2004) examines the results of an individual teacher incentive program in Israel
where each participating teacher was ranked on the basis of value added in student achieve-
ment. Out of 629 participating teachers, 302 were awarded salary bonuses which could range
up to 30% of their base salary. Again, the program had a positive effect on the performance
of participating teachers (both the winners of awards and the other participants) relative to
the comparison group of teachers who didn’t participate in the program. His cost effective-
ness analysis suggests that the individual incentive programs were more cost effective than
the group incentive programs.
Figlio and Kenny (2007) conduct a survey to collect information on frequency and mag-
nitude of merit raises and bonuses, teacher evaluation, and teacher termination. Combining
data from the National Education Longitudinal Survey (NELS) on schools, students, and
their families with their own survey on teacher incentives the authors find a positive as-
sociation between the use of individual teacher incentives and student achievement. That
is, students learn more in schools where teacher are offered incentive pay. Given the cross-
sectional nature of the data used, the authors do not claim to have found a causal mechanism.
That is, the observed positive association could be either due to the effect of incentives on
student outcomes or simply because better schools are self-selecting to implement merit pay
programs. Due to the non-experimental nature of the study, one cannot ascribe causality
from performance pay to student achievement.
Ahn (2011) studies the school based incentive program in North Carolina and finds the
incentive pay to have a positive effect on student achievement. He also finds evidence of free
riding behavior among teachers: teachers in larger schools are less responsive to incentive
pay than teachers in smaller schools.
Glewwe, Ilias, and Kremer (2008) find evidence of existing teacher incentive programs
to be weak in Kenya with teacher absenteeism being 20%. In a randomized trial where
22

teacher incentive was linked to performance on a test, children in the treatment schools had
higher test scores. However, the authors attribute this mainly to increased teacher effort in
teaching to the test by conducting more test preparations. They didn’t find any evidence
of improvement in teacher attendance, homework assignment or any change in pedagogy in
treatment schools. As a consequence students in the treatment schools didn’t retain the
gains after the program was discontinued. Therefore, this study provides evidence of short
term gains leading to better test performance from a teacher incentive program linked to
test scores, but no long term learning.
Muralidharan and Sundararaman (2011) perform a randomized experiment of teacher
incentive pay scheme in the state of Andhra Pradesh in India. They devise two incentive
schemes: individual bonuses and group bonuses. The average bonus was calibrated to 3% of
the annual salary of teachers. They report results on the program after it was in effect for two
years. They find that students in incentive schools performed better than in control schools
on math and language tests. Interestingly, students in incentive schools also performed
better on subjects for which there were no incentives suggesting positive spillover. Both
incentive schools performed better at the end of the first year but only individual incentive
schools performed better at the end of the second year. In another treatment they provided
schooling inputs to some schools and found that schools with teacher incentives performed
better than those which were provided more schooling inputs. Digging deeper, they find that
the impact of the incentive program worked not through increased attendance but greater
teaching effort conditional on being present. Finally, their cost-effectiveness analysis suggests
that performance based incentives are more cost effective than schooling inputs.
Kingdon and Teal (2007) use data from 10 private and 20 government funded schools in
India to examine the impact of payment of performance related pay on student achievement.
They find evidence of performance related pay in private schools but not in government
schools. They also find that after controlling for student ability, parental background and
the resources available, student outcomes in private schools respond positively to performance
23

related pay but not so in government schools. The authors suggest that it is the fear of losing
a well-paid job that raises the effort level of teachers in private schools.
3.2.3 Other Inputs and Pedagogical Changes
Increasing Non-Teacher Inputs
Non teacher inputs include things like providing teaching materials such as blackboards,
flipcharts etc. There seems to be a difference in the results coming from non-experimental
and experimental studies as far as the non-teacher inputs are concerned. While the former
suggest positive impact of non-teaching inputs on educational outcomes, the latter suggest
otherwise. For example, Filmer and Pritchett (1999) estimate that non-teacher inputs have a
marginal product per dollar that is 10 to 100 times higher than teacher inputs. However, this
is at odds with the experimental evidence from Kenya reported in Glewwe, Kremer, Moulin,
and Zitzewitz (2004) which finds that flipcharts presenting material from the science, math,
or geography curriculum did not improve test scores.
Glewwe et al. (2011) review the evidence from 1990 to 2010 on the contribution of
various school resources and infrastructure in improving learning outcomes and increasing
educational attainment. Based on 43 high-quality studies that they identified, they find that
having an adequately-equipped and well-functioning school, which means one with quality
roofs, walls or floors, with usable desks, tables and chairs, and with a school library, appears
to have a clear positive impact on test scores. In terms of teaching inputs, their summary
shows that having teachers that are knowledgeable in the subjects that they teach, that
provide tutoring, and that absent themselves from work less often matter for achievement in
cognitive tests. They also find that school-building programs consistently raise students’ time
in school, which makes them more likely to finish at a higher grade. They find inconclusive
results for all the other variables also thought to be good interventions, and they attribute
this ambiguity to either sensitivity to the local context or a small effect size that is not easily
detectable.
24

Pedagogical Changes
Can changing the medium of instruction improve learning? This is the question studied
by Roy (2004) using data from West Bengal, a state in India where the medium of instruction
was changed from English to Bengali, the vernacular language, at the primary level in 1983.
The aim was to make primary education more accessible to poorer and rural children. The
policy had a positive impact on educational attainment (measured by years of schooling),
with the effect being more pronounced for poorer children. However, the policy did not
affect enrollment either in rural or in urban areas. Interestingly, there was an increase
in expenditure on private tutoring among the households belonging to richest quartiles,
implying that well-off parents were supplementing the education imparted to their children
in public school by private tutoring. This suggests that the policy change was deemed by
the rich to be lowering the quality of public education which needed to be compensated by
increased private tutoring.
Kremer and Holla (2008) survey several studies on the effectiveness of pedagogical changes,
both experimental and non-experimental, and find most of the interventions to be successful
in improving learning outcomes. For example, a program that provided electronic machine
or flash card based activities to help improve the teaching of English led to an increase in
the English test scores of treated students.
Banerjee et al. (2005) report results of two randomized experiments carried out in urban
slums in Mumbai and Vadodara in India to assess the effectiveness of a remedial education
program aimed at children who were lagging behind in government schools. Young women
from the community were hired to teach these students basic literacy and numeracy skills.
The intervention increased the average test score of all children in the treatment schools by
0.14 standard deviations in the first year and 0.28 in the second year compared to the control
schools. Also, the gains were largest for the weakest students some of whom were the direct
beneficiaries of the program. For example, the gain for the children in the bottom third of
25
the initial distribution was 0.40 standard deviation in the second year of the program.
In the second treatment, each child from the 4th grade was provided two hours of com-
puter time per week when students played educational games that reinforced their mathe-
matical skills. The intervention increased the math score of children in treatment schools
by 0.35 standard deviations in the first year and 0.47 in the second year compared to the
control schools. In the case of both interventions, students continued to show improvements
for at least one year after leaving the program.
The success of these programs suggests that it may be possible to carry out interventions
to improve the quality of education in developing countries in a cost effective way and without
fundamentally transforming the entire system.
Community Participation
Can greater community participation improve educational outcomes? With the aim of
improving the quality of education, in year 2000 the state government of UP in India came up
with the idea of Village Educational Council (VEC) with the following functions: monitoring
performance of govt. school, reporting problems to higher authorities, requesting additional
resources, deciding on the renewal of contract of community based teachers, recruiting new
hires, allocating any additional resources for school improvement received from national
education program.
Banerjee et al. (2008) conduct a randomized experiment in UP to test some ideas on the
effectiveness of community participation, community monitoring of teachers, local control
over hiring, or a system where schools compete for students. They devised 3 kinds of inter-
ventions. In the first one, the NGO workers organized meetings and informed villagers about
the status of education in the village, quality of local schools, state mandated provisions for
schools relating to student-teacher ratio, infrastructure, mid-day meals, and scholarships,
local funds available for education, and the responsibilities of VECs. In the second inter-
vention, in addition to everything in the first, they gave specific monitoring tool by actively
26

encouraging and equipping communities to participate in testing to see if children can read
and do math. And finally, in the third intervention, in addition to 1 and 2, they added
a training component in which community volunteers with a grade of 10 or 12 education
trained for 4 days to teach children how to read.
All 3 interventions failed to raise teacher attendance. They didn’t lead to increased
parental involvement either. The third intervention led to increased community participation
in reading and significantly improved reading achievement. Children who attended reading
camps were 22.3% points more likely to read letters, 23.2% points more likely to read a
paragraph, 22.4% points more likely to read a story than the comparison groups.
4 Education Policies in Bihar and the Road Ahead
The government of Bihar has launched several policy initiatives to improve the status of
education in Bihar. We provide details on these programs in an appendix. In this section
we analyze some of those initiatives from the perspective of the literature survey done in the
previous sections and make some policy recommendations of our own.
Health Intervention
In our literature survey we found the effectiveness of certain school based health interven-
tions in improving educational outcomes. Dhaliwal et al. (2011) provide cost-effectiveness
estimates for the deworming program carried out in Kenya and India. Based on the study
of Kremer and Miguel (2004) from Kenya they estimate that per $100 spent on deworming
leads to 13.9 years of extra schooling, while Bobonis et al. (2004) study for India suggests
that the iron fortification and deworming program led to 2.9 extra years of schooling per
$100 spent. Seeing the success of these programs in raising schooling, in addition to their
direct health benefits, the government of Bihar launched a massive deworming program in
primary schools all over the state between February and April 2011. It is estimated that
27

over 17 million children were treated in the largest school-based deworming effort of its kind.
No systematic evaluation of this program has been undertaken yet.
Cost of Schooling
As detailed in the appendix, the government of Bihar has undertaken several policy ini-
tiatives aiming to reduce the out of pocket expenses or cost of schooling. The programs
we are talking about are: the free textbook program; free school uniform program; mid-day
meal program; and the cycle program. As discussed in section 3, the existing literature gen-
erally finds evidence in support of the effectiveness of these programs in improving learning
outcomes. However, two caveats are in order here. One, unlike the deworming program or
the information campaign, the cost-effectiveness of these programs is less clear cut. Two,
sometimes these interventions may not yield desirable results because the binding constraint
may lie somewhere else. For example, in our quantitative exercise we noted that 30% of
students in class VI cannot read a paragraph taken from a class II textbook. Clearly, if
students cannot read, free textbooks may fail to raise their test scores. In this case, a more
appropriate intervention would be remedial education for children lagging behind.
Increasing Enrolment
From the quantitative exercise performed in the paper we learnt that enrollment ratio
at the upper primary level is quite low both in absolute terms and relative to other states
in India. Any attempt to increase enrollment rate at the upper primary level needs to
be accompanied by an increase in the number of upper primary schools fully staffed with
teachers. According to ADRI (2011), the number of primary and upper primary schools
nearly doubled between 2005-06 and 2008-09, however, Bihar has a huge shortage of teachers.
To meet the teacher-pupil ratio norm of 1:30 mandated in the Education Act, Bihar needs
246000 more teachers against the current strength of approximately 354000. This would
28

require an enormous expansion in the number of teachers in the state.
Improving School Quality
Among the schooling inputs found significant in explaining the educational outcomes in
our quantitative exercise, drinking water facility came up significant. There are about 79781
primary schools in Bihar (ADRI, 2011). According to DISE, in 2009-10 about 10 percent of
the primary schools in the state did not have a proper drinking water facility (see figure 8).
The cost of providing drinking water facility in these schools will be approximately Rs. 400
million4. Similarly, at the upper primary level, roughly 3 percent (about 620 out of 20771)
of the schools did not have drinking water facilities in 2009-10 and the cost of providing
it would be about Rs. 31 million. To put these numbers in perspective, the total public
expenditure on elementary education in Bihar in 2009-10 was Rs. 48310 million (source:
ADRI (2011)). Therefore, the cost of ensuring drinking water facilities in all primary and
upper primary schools would be less than 1% of the annual public expenditure on elementary
education. Providing drinking water facilities in all schools should be a policy imperative
not simply because of its cost-effectiveness, but because it also satisfies a basic human need
which makes it a moral imperative as well.
Another schooling input that turned out to be important in determining the out of
school rate is the availability of separate toilet facilities for girls. According to DISE, about
79 percent (63026 out of 79781) of the primary schools in the state lacked separate toilet
facilities for girls (see figure 9). The cost of building a single person toilet facility in the
remaining primary schools will be about Rs. 4412 million5. Similarly, about 71 percent
(about 14747 out of 20771) of the upper primary schools in the state do not have separate
toilet facilities for girls. The cost of building separate toilets in these schools would be about
4According to government sources the approximate cost of installing one hand pump is Rs. 50000.However, this should be considered an upper bound because according to quotes from some private sources,the approximate cost of installing a hand pump is Rs. 15000.
5According to the government sources the approximate cost of installing a one person toilet is Rs. 70000.The cost according to a private party is Rs. 35000.
29

Rs. 1032 million. Again, the cost of ensuring that every primary and upper primary school
in the state has separate toilet facilities for girls would be about 11% of the annual public
expenditure on elementary education. Even though this is a significant amount, it is an
investment which will yield benefits for several years.
We would like to re-emphasize that ensuring drinking water and separate toilet for girls
should be a policy imperative for the government of Bihar. One of the key insights of
the extensive survey of the education literature by Glewwe et al. (2011) is that having an
adequately-equipped and well-functioning school has a clear positive impact on educational
outcomes. One cannot imagine an adequately equipped school without having such basic
facilities as drinking water and separate toilet for girls. While on the subject of adequately
equipped school, it is worth re-iterating that our quantitative exercise identified classrooms in
good condition as a significant correlate of educational outcomes. As shown clearly in Figure
10, only about 60% of the primary schools in Bihar had classrooms in good conditions, and
therefore, this is another area in need of immediate attention.
Incentive Pay for Teachers
The existing literature suggests that performance pay for teachers can help improve stu-
dent achievement. However, in order to implement a performance pay scheme, a necessary
pre-requisite is to develop data systems to link student performance with teacher effective-
ness. Several states and school districts in the U.S. have established data systems which
enable them to link student performance with the effectiveness of individual teachers over
time. Dallas estimates that its value-added system, serving 160000 students, cost about
$210,000 to start up and now costs about $100,000 per year to operate. This suggests that
the costs are small roughly equal to $1.31 per youth in startup cost and $0.62 per youth in
annual operating cost.
According to ADRI (2011), in 2009-10 the estimated number of children in the age group
6-14 was 24.07 million. Assuming the same set up and running cost per student as in Dallas,
30

the total set up cost in Bihar would be $31.5 million which at current exchange rate would
be Rs. 1577 million. The operating cost would be less than Rs. 750 million per year.
That is the one time cost of setting up a data system would be 3.02% of the annual public
expenditure on primary education, while the running cost would be roughly 1.5%. However,
these numbers are clearly an upper bound because there has to be huge economies of scale
in setting up a statewide system. As well, while the cost of computers, which is a tradable,
is likely to be similar in the U.S. and India, the labor cost is much cheaper, and therefore,
the cost of creating such a system should be much less in Bihar. In addition to allowing the
implementation of performance pay schemes, such a data system will allow the administrators
to track schools over time and carry out interventions, not necessarily performance pay, in
poorly performing schools. It will also serve as a valuable tool for researchers in the field of
education. Given the long term benefits of setting up such a data system, the government
of Bihar could even attempt to get an international organization or a foundation to provide
initial funding for it. Based on the annual budget report for the year 2011-12, the government
of Bihar plans to spend Rs. 72.24 millions on centralized monitoring cum data center. This
seems to be a step in the right direction; however, the details of this policy are not available
yet.
Information Campaign
While surveying the literature on demand side policies we discussed the role of information
provision regarding the returns to schooling and their impact on schooling attainment. In
a recent paper looking at the cost effectiveness of alternative policies to increase schooling,
Dhaliwal et al. (2011) find the information provision to be one of the most cost effective
programs in terms of increasing schooling. Based on the work Nguyen (2008) they calculate
that on average $100 spent on the information program led to a 20.7 years of additional
schooling, while the estimate of Jensen (2010) from Dominican Republic suggests that the
increasing in schooling per $100 spent is 3.1 years. Given the cost effectiveness of this policy,
31
it should receive a priority status among policies aiming to increase the quantity of schooling.
Other Policies
In our survey in section 3 we also mentioned the success of conditional cash transfer
programs in improving educational outcomes. Following the success of PROGRESA (now
called Oportunidades) in Mexico, several other Latin American countries implemented simi-
lar programs. It would be worthwhile for the government of Bihar to conduct a randomized
control trial of conditional cash transfer program along the lines of PROGRESA and then
decide whether to scale it up depending on the results.
Another policy worth considering is enhancing the English skill of students. After the
opening up of India to the forces of globalization, knowledge of English has become a valuable
asset. A recent study by Azam, Chin and Prakash (2011) finds that hourly wages for men
who speak fluent English are on average 34% higher than men who do not speak English
in India. The wage premium is 13% for men who speak little English over men who do not
speak English. Also, there is heterogeneity in the returns to English-language skills with
more experienced and more educated workers receiving higher returns. Given this, it would
be a good idea for the schools in Bihar to emphasize the development of English-language
skills. Given that most parents do not know/speak English, schools can play an important
role in enhancing the English skills of children.
5 Concluding Remarks
Bihar has made significant progress in sending nearly all primary school age children to
school. However, the enrolment rates at the upper primary level are still very low. Also, the
news on the quality front is far from satisfactory as revealed in the performance on reading
and math tests. Despite the recent attempts by the state government to hire a large number
of teachers, the pupil-teacher ratio remains the highest in the country at 53 in 2009-10, far
32

in excess of the national norm of 30 specified in the Education Act. The government has
undertaken several policy initiatives to lower the cost of schooling such as free textbooks,
free uniforms, mid-day meals, and free bicycles. However, much remains to be done in
improving the schooling infrastructure. Only 60% of the schools have classrooms in good
condition; 10% of the primary schools still lack drinking water facility; more than 70% of the
primary and upper primary schools do not have separate girls’ toilets. These are some areas
of concern which should be of highest priority to the policy makers. We are encouraged by
the government’s efforts in going in for a massive school based deworming program in 2011.
Experimental research suggests that providing information about returns to schooling
can encourage children to stay longer in school, and given the cost-effectiveness of this
policy, the government of Bihar must seriously look into this policy option. More generally,
understanding the determinants of household’s decision to invest in education should be an
important component of academic research and policy in the area of education which has
tended to focus more on improving the quantity and quality of educational inputs.
Looking to the future, incentive pay for teachers can play an important role in improving
the quality of education. However, to link student performance to teacher effectiveness, a
statewide data system needs to be created. Such a data system will also help monitor the
performance of schools and allow the administrators to take remedial action in failing schools.
33

References
Ahn, Thomas. “The Missing Link: Estimating the Impact of Incentives on Effort and Effort
on Production Using Teacher Accountability Legislation.” Mimeo.
Angrist, Joshua, Eric Bettinger, and Michael Kremer. “Long-Term Educational Consequences
of Secondary School Vouchers: Evidence from Administrative Records in Colombia.”
American Economic Review, 2006, 93 (3), pp 847–862.
Angrist, Joshua, Eric Bettinger, Erik Bloom, Elizabeth King, and Michael Kremer. “Vouchers
for Private Schooling in Colombia: Evidence from a Randomized Natural Experiment.”
American Economic Review, 2002, 92 (5), pp 1535-1558.
Asian Development Research Institute. “Elementary Education in Bihar: Progress and Chal-
lenges.” Manuscript, 2011.
Azam, M., A. Chin, and N. Prakash. “The Returns to English-Language Skills in India.”
Economic Development and Cultural Change, Forthcoming.
Banerjee, Abhijit, Rukmini Banerji, Esther Duflo, Rachel Glennerster, and Stuti Khemani.
“Pitfalls of Participatory Programs: Evidence from a Randomized Evaluation in Edu-
cation in India.” National Bureau of Economic Research, Working Paper No. 14311,
2008.
Banerjee, Abhijit, Shawn Cole, Esther Duflo, and Leigh Linden. “Remedying Education: Ev-
idence from two Randomized Experiments in India.” National Bureau of Economic
Research, Working Paper No. 11904, 2005.
Banerjee, Abhijit, Suraj Jacob, Michael Kremer, Jenny Lanjouw, and Peter Lanjouw. “Moving
to Universal Education: Costs and Trade Offs.” Massachusetts Institute of Technology,
Manuscript, 2005.
34

Bleakley, Hoyt. “Disease and Development: Evidence from Hookworm Eradication in the
American South.” Quarterly Journal of Economics, 2007, 122 (1), pp 73–117.
Bleakley, Hoyt. “Malaria Eradication in the Americas: A Retrospective Analysis of Child-
hood Exposure.” American Economic Journal: Applied Economics, 2010, 2 (2), pp
1–45.
Bobonis, Gustavo, Edward Miguel, and Charu Puri Sharma. “Iron Deficiency Anemia and
School Participation.” Abdul Latif Jameel Poverty Action Lab (J-PAL), Paper No. 7,
2004.
Chaudhury, Nazmul, Jeffrey Hammer, Michael Kremer, Karthik Muralidharan, and F. Halsey Rogers.
“Missing in Action: Teacher and Health Worker Absence in Developing Countries.”
Journal of Economic Perspectives, 2006, 20 (1), pp 91–116.
Chetty, Raj, John Friedman, Nathaniel Hilger, Emmanuel Saez, Diane Schanzenbach, and Danny Yagan.
“How Does Your Kindergarten Classroom Affect Your Earnings? Evidence from Project
STAR.” Quarterly Journal of Economics, 2011, 126 (4), pp 1593–1660.
Chin, Aimee. “Can Redistributing Teachers Across Schools Raise Educational Attainment?
Evidence from Operation Blackboard in India.” Journal of Development Economics,
2005, 78 (2), pp 384–405.
Dhaliwal, Iqbal, Esther Duflo, Rachel Glennerster, and Caitlin Tulloch. “Comparative Cost
Effectiveness Analysis to Inform Policy in Developing Countries: A General Framework
with Applications for Education.” Abdul Latif Jameel Poverty Action Lab (J-PAL),
Massachusetts Institute of Technology, Manuscript, 2011.
Duflo, Esther, Rema Hanna, Stephen Ryan. “Monitoring Works: Getting Teachers to Come
to School.” National Bureau of Economic Research, Working Paper No. 11880, 2007.
35

Duflo, Esther, Pascaline Dupas, and Michael Kremer. “Peer Effects, Pupil-Teacher Ratios,
and Teacher Incentives: Evidence from a Randomized Evaluation in Kenya.” Manuscript,
2007.
Duflo, Esther, Pascaline Dupas, Michael Kremer, and Samuel, Sinei. “Education and HIV/AIDS
Prevention: Evidence From a Randomized Evaluation in Western Kenya.” World Bank
Policy Research Working Paper No. 4024, 2006.
Duflo, Esther. “Schooling and Labor Market Consequences of School Construction in In-
donesia: Evidence From an Unusual Policy Experiment.” American Economic Review,
2001, 91 (4), pp 795–813.
Evans, David, Michael Kremer, and Muthoni Ngatia. “The Impact of Distributing School
Uniforms on Children’s Education in Kenya.” Manuscript, 2008.
Field, Erica, Omar Robles, and Maximo Torero. “Iodine Deficiency and Schooling Attain-
ment in Tanzania.” Manuscript, 2007.
Figlio, David and Lawrence Kenny. “Individual Teacher Incentives and Student Performance.”
Journal of Public Economics, 2007, 91 (5-6), pp 901–914.
Filmer, Deon and Lant Pritchett “What Education Production Functions Really Show: A
Positive Theory of Education Expenditures.” Economics of Education Review, 1999,
18 (2), pp 223–239.
Gleww, Paul, Eric Hanushek, Sarah Humpage, and Renato Ravina. “School Resources and
Educational Outcomes in Developing Countries: A Review of the Literature From
1990 to 2010.” National Bureau of Economic Research, Working Paper No. 17554,
2011.
Glewwe, Paul, Alaka Holla, and Michael Kremer. “Teacher Incentives in the Developing World.”
Manuscript, 2008.
36

Glewwe, Paul, Michael Kremer and Sylvie Moulin. “Many Children Left Behind? Textbooks
and Test Scores in Kenya.” National Bureau of Economic Research, Working Paper
No. 13300, 2007.
Glewwe, Paul, Michael Kremer, Sylvie Moulin, and Eric Zitzewitz. “Retrospective vs. Prospec-
tive Analysis of School Inputs: The Case of Flip Charts in Kenya.” Journal of Devel-
opment Economics, 2004, 74 (1), pp 251–268.
Glewwe, Paul, Nauman Ilias, and Michael Kremer. “Teacher Incentives in the Developing
World.” Manuscript, 2008.
Gordon, Robert, Thomas Kane, and Douglas Staiger. “Identifying Effective Teachers Using
Performance on the Job.” The Brookings Institution, Discussion Paper 2006-01, 2006.
He, Fang, Leigh Linden, and Margaret Leod. “Helping Teach What Teachers Don’t Know:
An Assessment of the Pratham English Language Program.”, Manuscript, 2007.
Hoxby, Caroline. “Does Competition Among Public Schools Benefit Students and Taxpay-
ers?” American Economic Review, 2000, 90 (5), pp 1209–1238.
Jamison, Dean, Barbara Searle, Klaus Galda, and Stephen Heyneman. “Improving Elemen-
tary Mathematics Education in Nicaragua: An Experimental Study of the Impact of
Textbooks and Radio on Achievement.” Journal of Educational Psychology, 1981, 73
(4), pp 556–567.
Jensen, Robert. “The (Perceived) Returns to Education and the Demand for Schooling.”
Quarterly Journal of Economics, 2010, 125 (2), pp 515–548.
Kingdon, Geeta and Francis Teal. “Does Performance Related Pay for Teachers Improve
Student Performance? Some Evidence from India.” Economics of Education Review,
2007, 26 (4), pp 473–486.
37

Kirschner, Paul, John Sweller, and Richard Clark. “Why Minimal Guidance During Instruc-
tion Does Not Work: An Analysis of the Failure of Constructivist, Discovery, Problem-
Based, Experiential, and Inquiry-Based Teaching.” Educational Psychologist, 2006 41
(2), pp 75–86.
Kouskalis, Eric. “Does Not Compute: The Introduction of New Technologies to South African
and Namibian Classrooms.” Harvard Undergraduate Thesis, 2008.
Kremer, Michael and Alaka Holla. “Improving Education in the Developing World: What
Have We Learned from Randomized Evaluations?” in Kenneth J. Arrow and Tim-
othy F. Bresnahan, eds., Annual Review of Economics, Volume 1, 2009. Palo Alto,
California: Annual Reviews.
Kremer, Michael and Christel Vermeersch. “School Meals, Educational Achievement, and
School Competition: Evidence from a Randomized Evaluation.” Manuscript, 2004.
Kremer, Michael and Daniel Chen. “An Interim Program on a Teacher Attendance Incentive
Program in Kenya.” Manuscript, 2001.
Kremer, Michael, Edward Miguel, and Rebecca Thornton. “Incentives to Learn.” Review of
Economics and Statistics, 2009, 91 (3), pp 437–456.
Kremer, Michael, Sylvie Moulin, and Robert Namunyu. “Decentralization: A Cautionary Tale.”
Manuscript, 2003.
Lavy, Victor. “Evaluating the Effect of Teachers’ Group Performance Incentives on Pupil
Achievements.” Journal of Political Economy, 2002, 110 (6), pp 1286–1317.
Lavy, Victor. “Performance Pay and Teachers’ Effort, Productivity and Grading Ethics.”
National Bureau of Economic Research, Working Paper No. 10622, 2004.
Miguel, Edward and Michael Kremer. “Worms: Identifying Impacts on Education and Health
in the Presence of Treatment Externalities.” Econometrica, 2004, 72 (1), pp 159–217.
38

Muralidharan, Karthik and Venkatesh Sundararaman. “Teacher Performance Pay: Experi-
mental Evidence From India.” Journal of Political Economy, 2011 119 (1), pp 39–77.
Nguyen, Trang. “Information, Role Models and Perceived Returns to Education: Experi-
mental Evidence From Madagascar.” Job Market Paper, Massachusetts Institute of
Technology.
Podgursky, Michael and Matthew Springer. “Teacher Performance Pay: A Review.” Journal
of Policy Analysis and Management, 2007 26 (4), pp 909–950.
PROBE Team. “Public Report on Basic Education in India.” New Delhi: Oxford University
Press, 1999.
Roy, Joydeep. “The Impact of Lowering of Academic Standards on Educational Outcomes:
Evidence From an Unusual Policy in India.” Manuscript, 2004.
Schultz, T. Paul. “School Subsidies For The Poor: Evaluating the Mexican Progresa Poverty
Program.” Journal of Development Economics, 2004, 74 (1), pp 199–250.
39
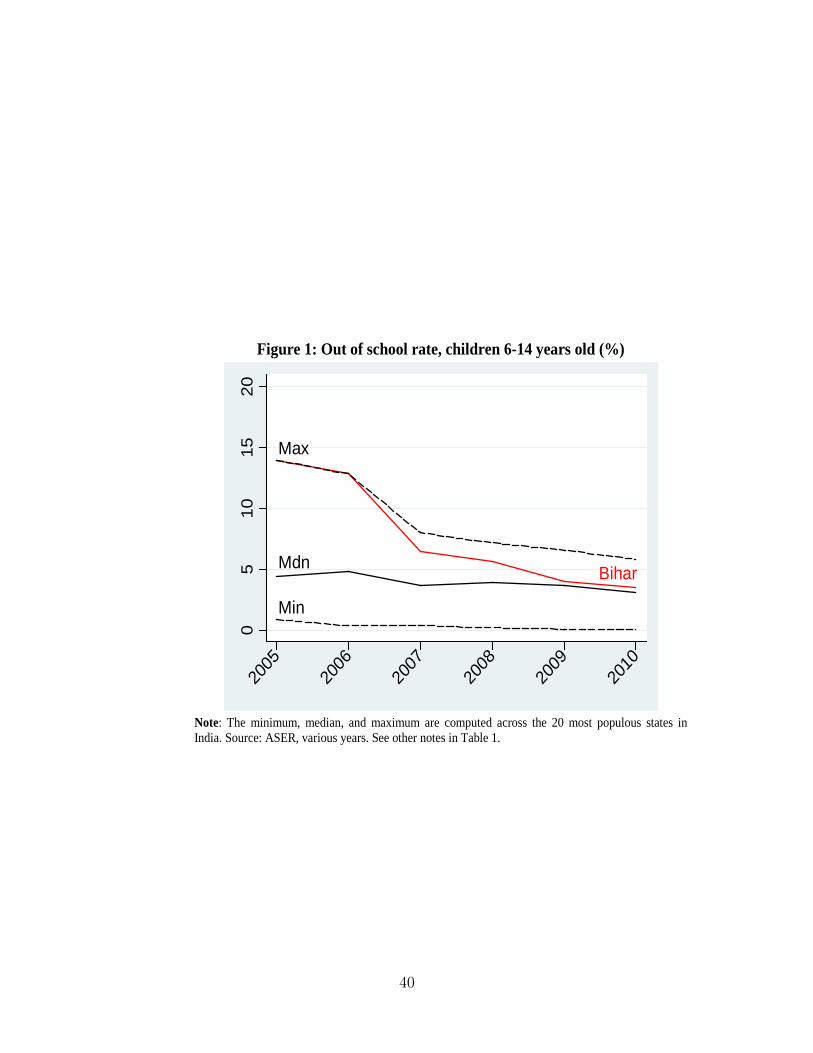
Figure 1: Out of school rate, children 6-14 years old (%)
Note: The minimum, median, and maximum are computed across the 20 most populous states in India. Source: ASER, various years. See other notes in Table 1.
Bihar
Max
Min
Mdn
05
1015
20
2005
2006
2007
2008
2009
2010
40

Figure 2: Net enrolment ratio, primary schools
Note: The minimum, median, and maximum are computed across the 20 most populous states in India. Source: ASER, various years. See other notes in Table 1.
BiharMin
Mdn
Max
020
4060
8010
0
2003
-04
2004
-05
2005
-06
2006
-07
2007
-08
2008
-09
2009
-10
41

Figure 3: Net enrolment ratio, upper primary schools
Note: The minimum, median, and maximum are computed across the 20 most populous states in India. Source: ASER, various years. See other notes in Table 1.
Max
Mdn
Min
Bihar
020
4060
8010
0
2003
-04
2004
-05
2005
-06
2006
-07
2007
-08
2008
-09
2009
-10
42

Figure 4: Percentage of children who can read long paragraph (6-14 years old)
Note: The minimum, median, and maximum are computed across the 20 most populous states in India. Source: ASER, various years. See other notes in Table 1.
Min
Mdn
Max
Bihar
020
4060
8010
0
2005
2006
2007
2008
2009
2010
43

Figure 5: Percentage of children who can solve division problem (6-14 years old)
Note: The minimum, median, and maximum are computed across the 20 most populous states in India.
Source: ASER, various years. See other notes in Table 1.
Min
Mdn
Max Bihar
020
4060
8010
0
2005
2006
2007
2008
2009
2010
44

Figure 6: Pupil-teacher ratio (primary schools)
Note: The minimum, median, and maximum are computed across the 20 most populous states in India. Source: ASER, various years. See other notes in Table 1.
Min
Mdn
Max
Bihar
020
4060
8010
0
2003
-04
2004
-05
2005
-06
2006
-07
2007
-08
2008
-09
2009
-10
45

Figure 7: Student-classroom ratio (primary schools)
Note: The minimum, median, and maximum are computed across the 20 most populous states in India.
Source: ASER, various years. See other notes in Table 1.
Min
Mdn
Max Bihar
020
4060
8010
0
2003
-04
2004
-05
2005
-06
2006
-07
2007
-08
2008
-09
2009
-10
46

Figure 8: Percentage of schools with drinking water facility (primary level)
Note: The minimum, median, and maximum are computed across the 20 most populous states in India.
Source: ASER, various years. See other notes in Table 1.
Min
Mdn
MaxBihar
020
4060
8010
0
2003
-04
2004
-05
2005
-06
2006
-07
2007
-08
2008
-09
2009
-10
47
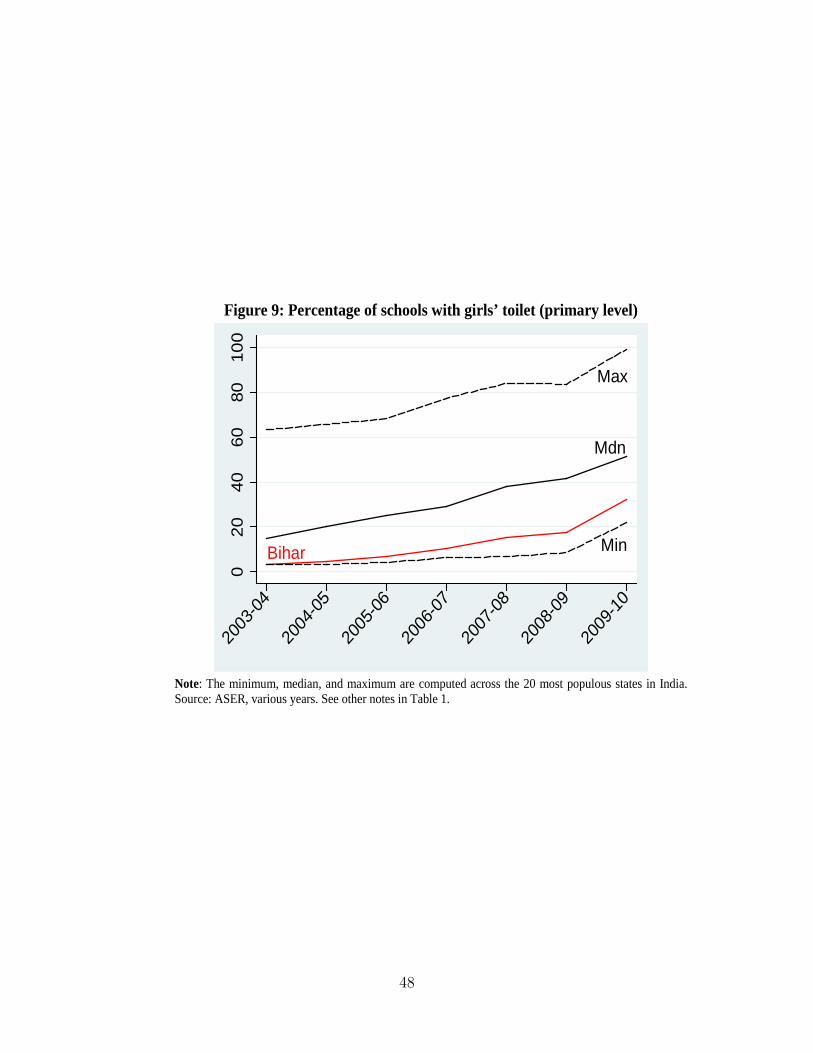
Figure 9: Percentage of schools with girls’ toilet (primary level)
Note: The minimum, median, and maximum are computed across the 20 most populous states in India. Source: ASER, various years. See other notes in Table 1.
Max
Mdn
MinBihar
020
4060
8010
0
2003
-04
2004
-05
2005
-06
2006
-07
2007
-08
2008
-09
2009
-10
48

Figure 10: Proportion of classrooms in good condition (primary level)
Note: The minimum, median, and maximum are computed across the 20 most populous states in India. Source: ASER, various years. See other notes in Table 1.
Max
Mdn
Min
Bihar
020
4060
8010
0
2003
-04
2004
-05
2005
-06
2006
-07
2007
-08
2008
-09
2009
-10
49

Table 1: Correlation Matrix (N=119)
(A) (B) (C) (D) (E) (F) (G) (H)% Can read long paragraph (A) 1.00
% Can solve division problem (B) 0.82 1.00Out of school rate (C) -0.53 -0.32 1.00Pupil-teacher ratio (D) -0.38 -0.11 0.57 1.00
Student-classroom ratio (E) -0.36 -0.12 0.52 0.85 1.00% Schools with drinking water facility (F) 0.40 0.36 -0.37 0.08 -0.19 1.00
% Schools with girls' toilet (G) 0.34 0.24 -0.38 -0.03 -0.30 0.69 1.00% Classrooms in good condition (H) 0.13 0.04 -0.37 -0.08 -0.29 0.40 0.57 1.00
Source: ASER (2005-2010) for variables A-C, and DISE (2004-05 to 2009-10) for variables D-
H. Computed using data from the following 20 most populous states: Andhra Pradesh, Assam, Bihar, Chhattisgarh, Gujarat, Haryana, Himachal Pradesh, Jharkhand, Karnataka, Kerala, Madhya Pradesh, Maharashtra, Orissa, Punjab, Rajasthan, Tamil Nadu, Tripura, Uttar Pradesh, Uttaranchal, and West Bengal. ASER data for Madhya Pradesh was missing in 2010. To ensure consistency across time, variables A-C refer to data in the ASER sample for all children 6-14 years old, while variables D-H refer to data reported in the DISE for all primary-only schools.
50

Table 2: Determinants of Reading Attainment
Independent variables:Pupil-teacher ratio -0.5419 ** 0.1403 -0.2211 -0.0010 -0.3614 -0.0001
(0.232) (0.205) (0.175) (0.086) (0.212) (0.085) Student-classroom ratio 0.1627 0.0014 0.0251 0.0022 -0.0055 0.0020
(0.107) (0.074) (0.073) (0.075) (0.098) (0.085) % Schools with drinking water facility 0.3561 * 0.0028 0.3248 * 0.1165 0.3909 ** 0.1588
(0.170) (0.146) (0.167) (0.090) (0.154) (0.097) % Schools with girls' toilet 0.0654 0.0392 0.0161 -0.0339 0.0284 -0.0276
(0.078) (0.080) (0.075) (0.051) (0.079) (0.039) % Classrooms in good condition -6.7212 -15.4403 -0.0321 -0.1382 -0.0755 -0.0679
(11.615) (11.405) (0.111) (0.080) (0.118) (0.082) Constant 28.8727 * 45.8596 ** 28.4981 * 46.5593 *** 31.2813 ** 38.8758 ***
(14.160) (17.183) (13.907) (9.649) (12.927) (10.309) Year and state fixed effectsAdj. R-squaredNo. of observations
Dependent variable: Proportion who can read long paragraph
99
(1) (2) (3) (4) (5)All Boys Girls
No0.327 0.786
Yes No0.225
Yes0.853
No0.384
Yes0.895
(6)
119 119 99 99 99 Note: Standard errors were clustered at the state level and shown above in parentheses. Significance indicated at the following confidence levels: * 90 percent, ** 95 percent, *** 99 percent. See other notes in Table 1. The number of observations is smaller in columns 3-6 because ASER data that is disaggregated by gender and consistently defined for the same age group could only be obtained starting in 2006.
51
Table 3: Determinants of Math Attainment
Independent variables:Pupil-teacher ratio -0.3226 0.2452 -0.0465 0.1105 -0.1851 0.1568
(0.274) (0.258) (0.177) (0.136) (0.196) (0.143) Student-classroom ratio 0.1534 0.0919 0.0258 0.0389 0.0071 0.0645
(0.118) (0.151) (0.069) (0.141) (0.065) (0.160) % Schools with drinking water facility 0.3651 -0.0876 0.3478 -0.0790 0.4176 * -0.0706
(0.222) (0.149) (0.220) (0.141) (0.202) (0.148) % Schools with girls' toilet 0.0305 0.0818 -0.0146 0.0371 -0.0128 0.0681
(0.096) (0.097) (0.093) (0.093) (0.098) (0.083) % Classrooms in good condition -8.4640 -7.4306 -0.0721 -0.0801 -0.0968 -0.0242
(12.692) (10.113) (0.128) (0.115) (0.127) (0.120) Constant 12.3868 27.7266 15.0396 45.0482 ** 14.5608 36.2175 *
(18.714) (16.646) (19.293) (19.071) (17.720) (20.943) Year and state fixed effectsAdj. R-squaredNo. of observations
Dependent variable: Proportion who can solve division problemAll Boys Girls
0.10099
Yes0.806
99
No Yes0.193
(1) (2) (3) (4) (5) (6)
No0.146119
Yes0.778119
No
990.835
99 Note: Standard errors were clustered at the state level and shown above in parentheses. Significance indicated at the following confidence levels: * 90 percent, ** 95 percent, *** 99 percent. See other notes in Table 1. The number of observations is smaller in columns 3-6 because ASER data that is disaggregated by gender and consistently defined for the same age group could only be obtained starting in 2006.
52

Table 4: Determinants of Out of School Rate
Independent variables:Pupil-teacher ratio 0.2316 *** 0.1443 0.1493 * -0.0976 ** 0.1877 * -0.0848
(0.049) (0.089) (0.073) (0.037) (0.091) (0.051) Student-classroom ratio -0.0742 ** -0.1299 ** -0.0443 -0.1133 *** -0.0572 -0.1040 **
(0.030) (0.052) (0.038) (0.034) (0.060) (0.048) % Schools with drinking water facility -0.0902 *** -0.0005 -0.0941 ** 0.0308 -0.1145 * 0.0390
(0.029) (0.033) (0.037) (0.037) (0.062) (0.048) % Schools with girls' toilet -0.0124 -0.0366 ** -0.0099 -0.0522 *** -0.0081 -0.0633 ***
(0.014) (0.016) (0.022) (0.014) (0.030) (0.017) % Classrooms in good condition -4.3589 * -6.9657 ** -0.0649 * -0.1259 *** -0.0124 -0.1104 **
(2.415) (2.782) (0.032) (0.030) (0.045) (0.048) Constant 9.9488 *** 11.6671 *** 14.5661 *** 21.7187 *** 12.6385 ** 21.3959 ***
(2.719) (3.302) (2.634) (3.523) (5.186) (4.952) Year and state fixed effectsAdj. R-squaredNo. of observations
No0.557119
Yes0.806
Dependent variable: Out of school rate
Yes0.833
99119
No0.453
99
Yes0.846
99
No0.269
99
All Boys Girls(1) (2) (3) (4) (5) (6)
Note: Standard errors were clustered at the state level and shown above in parentheses. Significance indicated at the following confidence levels: * 90 percent, ** 95 percent, *** 99 percent. See other notes in Table 1. The number of observations is smaller in columns 3-6 because ASER data that is disaggregated by gender and consistently defined for the same age group could only be obtained starting in 2006.
53

Appendix: Recent Policy Initiatives by the Government of Bihar
Policy Objective
Mukhyamantri
Cycle Yojana
Year = 2011
Treatment = Boys
Budget = Rs. 17500
lakhs
After observing the successful impact of the Balika Cycle Yojana, in the beginning of the
second term of the Nitish Kumar government (2011), this scheme was extended for the boys
as well.
Like Balika Cycle Yojana, according to this scheme too, Rs. 2500 in cash is given to students
of Std. IX to purchase a bicycle.
Mukhyamantri
Balika Cycle
Yojana
Year = 2006
Treatment = Girls
Budget = Rs. 15300
lakhs
Mukhyamantri Balika Cycle Yojana was initiated in 2006, and has been continuing since
then.
According to this scheme, all girls enrolled into Std. IX in the government schools (or the
schools aided by the government) are provided cash to buy a bicycle. Earlier the amount was
Rs. 2000, but from this year the amount has been increased to Rs. 2500.
Mukhyamantri
Balika Poshak
Yojana
Year = 2006
Treatment = Girls
Budget = Rs. 500
lakhs
Mukhyamantri Balika Poshak Yojana was initiated in 2006. Under this scheme, girl students
of Std. III-VIII are provided financial support to purchase uniform and supplementary study
materials or stationary items necessary for their studies.
Initially, the scheme was meant only for girls of Std. VI-VIII, but after its successful impact,
in 2009 the scheme was extended for students of Std. III-V. The girl students of Std. III-V are
provided Rs. 500 per year to buy two pairs of uniform and stationary items required for their
study. For students of Std. VI-VIII, the amount is Rs.700 per year for the same purpose.
Mukhyamantri
Poshak Yojana
Treatment = Boys &
Girls
Budget = Rs. 12600
lakhs
Mukhyamantri Poshak Yojana was soon initiated after the positive response of the Balika
Poshak Yojna scheme. Under this scheme, the students of Std. I-II are provided Rs. 400. The
amount for Std. III-V is Rs. 500 whereas for Std. VI-VIII, it is increased to Rs. 700. The main
objective is to attract children to school and encourage them for study.
With the increase in number of school going children, the problem of Child Labour will
automatically be decreased. The aim is to let the parents feel free from the burden of expense
so that they can send their children to study.
54

Mukhyamantri
Balika Protsahan
Yojana
Treatment = Girls
Budget = Rs. 5400
lakhs
According to this scheme, all girls who have passed the matriculation examination with 1st
Division are rewarded with a sum of Rs.10, 000/- so that they can afford pursuing further
studies.
As there is not proper number of +2 schools and also as most of the population lies below
average profile, it is still not feasible for girls to opt higher studies. In a way to strengthen &
stabilize the girls, this scheme provides financial support so that they can initiate for further
study without worrying about family scope and limitations.
Mukhyamantri
Paribhraman
Yojana
Year = 2006
Treatment = Boys &
Girls
Budget = Rs. 300
lakhs
The scheme was started in 2006. According to this Scheme, each school is provided Rs.
10000/-to make available educational tour. A group of 40 students, 5 from each class are
prepared and taken to some significant place for excursion.
To make the students know about the geographical area, related history and other such facts
that realize them about the state of affairs about their surroundings. The scheme also let them
learn team spirit and work as a group.
Text Book
Distribution
Scheme
Treatment = Boys &
Girls
Budget = Rs. 5 lakhs
The scheme is concerned with providing free text books to all students from Std. I-VIII.
Earlier till 2008, the scheme was only for ‘Focus Group’ i.e. for girls and students of SC/ST
category. After that, the scheme was extended for the minority and EBC (Extreme Backward
Class) group. As the scheme turned out successful, it was further extended for all students.
Each Student is provided with a complete set of books. So the number of books' sets prepared
by the Corporation is equal to total number of students. For this year, the number of books' set
is 19048695. The Corporation is presently working on for session 2011-12. Total number of
books for this session is 10 crores 17 lakhs 80 thousands and 297.
55

Mid-Day Meal
Scheme
Year = 2001
Treatment = Boys &
Girls
Budget = Rs. 240
lakhs [Rs. 30000
lakhs from Central
Government]
The Mid-Day Meal Scheme is a unique school meal programme in our country under which
free lunch to school children is provided on all working days. The programme become
instrumental in protecting children from classroom hunger, increasing school enrolment and
attendance, improved socialization among children belonging to different socio-economic
background, addressing malnutrition, and social empowerment through provision of
employment to women and disadvantaged.
In a landmark order on 28 November 2001, the Supreme Court directed state governments to
introduce cooked mid-day meals in all government and government-assisted primary schools
within six months. The cooked food distribution was piloted in Bihar during 2003-04 in 2532
schools under 10 districts. During January 2005, the scheme was universalised in all primary
schools (up to fifth Standard) of the state which were further expanded till Standard VIII in
year 2008.
The government has instructed the school to maintain nutritional value worth of 12 Gram of
Protein, 400 K Calories, Micro Nutrients and Vitamin supplement for the children till
standard VI. The nutritional value prescribed for the children of Std. VII & VIII is 20 Gram of
Protein, 700 K Calories, Micro Nutrients and Vitamin supplement. The state government has
also instructed about the Lunch menu that changes every day.
This scheme has created huge employment opportunity for widows, dalits and weaker section.
They are serving as cook and helpers in the school.
56
Related Documents


