OIKOS 90: 279 – 294. Copenhagen 2000 Ecosystem response of pasture soil communities to fumigation-induced microbial diversity reductions: an examination of the biodiversity – ecosystem function relationship B. S. Griffiths, K. Ritz, R. D. Bardgett, R. Cook, S. Christensen, F. Ekelund, S. J. Sørensen, E. Ba ˚a ˚th, J. Bloem, P. C. de Ruiter, J. Dolfing and B. Nicolardot Griffiths, B. S., Ritz, K., Bardgett, R. D., Cook, R., Christensen, S., Ekelund, F., Sørensen, S. J., Ba ˚a ˚th, E., Bloem, J., de Ruiter, P. C., Dolfing, J. and Nicolardot, B. 2000. Ecosystem response of pasture soil communities to fumigation-induced micro- bial diversity reductions: an examination of the biodiversity – ecosystem function relationship. – Oikos 90: 279 – 294. A technique based on progressive fumigation was used to reduce soil microbial biodiversity, and the effects of such reductions upon the stability of key soil processes were measured. Mineral soil samples from a grassland were fumigated with chloro- form for up to 24 h and then incubated for 5 months to allow recolonisation by surviving organisms. The diversity of cultivable and non-cultivable bacteria, protozoa and nematodes was progressively reduced by increasing fumigation times, as was the number of trophic groups, phyla within trophic groups, and taxa within phyla. Total microbial biomass was similar within fumigated soils, but lower than for unfumigated soil. There was no direct relationship between biodiversity and function. Some broad-scale functional parameters increased as biodiversity decreased, e.g. thymidine incorporation, growth on added nutrients, and the decomposition rate of plant residues. Other more specific parameters decreased as biodiversity decreased, e.g. nitrification, denitrification and methane oxidation. Thus specific functional parame- ters may be a more sensitive indicator of environmental change than general parameters. Although fumigation reduced soil microbial biodiversity, there was evidence to suggest that it selected for organisms with particular physiological characteristics. The consequences of this for interpreting biodiversity – function relationships are discussed. The stability of the resulting communities to perturbation was further examined by imposing a transient (brief heating to 40°C) or a persistent (addition of CuSO 4 ) stress. Decomposition of grass residues was determined on three occasions after such perturbations. The soils clearly demonstrated resilience to the transient stress; decomposition rates were initially depressed by the stress and recovered over time. Resilience was reduced in the soils with decreasing biodiversity. Soils were not resilient to the persistent stress, there was no recovery in decomposi- tion rate over time, but the soils with the highest biodiversity were more resistant to the stress than soils with impaired biodiversity. The study of functional stability under applied perturbation is a powerful means of examining the effects of biodiver- sity. B. S. Griffiths and K. Ritz, Scottish Crop Research Inst., In6ergowrie, Dundee, UK DD25DA (bgriff@scri.sari.ac.uk).– R. D. Bardgett, Dept of Biological Sciences, Inst. of En6ironmental and Natural Sciences, Uni6. of Lancaster, Lancaster, UK LA14YQ. – R. Cook, Inst. of Grassland and En6ironmental Research, Plas Gogerddan, Aberyst - wyth, UK SY23 3EB.– S. Christensen and F. Ekelund, Dept of Population Biology, Uni6. of Copenhagen, Uni6ersitetsparken 15, DK-2100 Copenhagen O, Denmark.– S. J. Sørensen, Dept of General Microbiology, Uni6. of Copenhagen, Søl6gade 83H, Copenhagen 1307, Denmark. – E. Ba ˚a ˚th, Dept of Ecology, Lund Uni6., Ecology Building, SE-223 62 Lund, Sweden.– J. Bloem, P. C. de Ruiter and J. Dolfing, DLO Research Inst. for Agrobiology and Soil Fertility, P.O. Box 14, NL-6700 AA Wagenin - gen, The Netherlands.– B. Nicolardot, INRA, 2 Esplanade Roland Garros, BP 224, F -51686 Reims CEDEX 2, France. Accepted 14 January 2000 Copyright © OIKOS 2000 ISSN 0030-1299 Printed in Ireland – all rights reserved OIKOS 90:2 (2000) 279

Welcome message from author
This document is posted to help you gain knowledge. Please leave a comment to let me know what you think about it! Share it to your friends and learn new things together.
Transcript
OIKOS 90: 279–294. Copenhagen 2000
Ecosystem response of pasture soil communities tofumigation-induced microbial diversity reductions: an examinationof the biodiversity–ecosystem function relationship
B. S. Griffiths, K. Ritz, R. D. Bardgett, R. Cook, S. Christensen, F. Ekelund, S. J. Sørensen, E. Baath, J. Bloem,P. C. de Ruiter, J. Dolfing and B. Nicolardot
Griffiths, B. S., Ritz, K., Bardgett, R. D., Cook, R., Christensen, S., Ekelund, F.,Sørensen, S. J., Baath, E., Bloem, J., de Ruiter, P. C., Dolfing, J. and Nicolardot, B.2000. Ecosystem response of pasture soil communities to fumigation-induced micro-bial diversity reductions: an examination of the biodiversity–ecosystem functionrelationship. – Oikos 90: 279–294.
A technique based on progressive fumigation was used to reduce soil microbialbiodiversity, and the effects of such reductions upon the stability of key soil processeswere measured. Mineral soil samples from a grassland were fumigated with chloro-form for up to 24 h and then incubated for 5 months to allow recolonisation bysurviving organisms. The diversity of cultivable and non-cultivable bacteria, protozoaand nematodes was progressively reduced by increasing fumigation times, as was thenumber of trophic groups, phyla within trophic groups, and taxa within phyla. Totalmicrobial biomass was similar within fumigated soils, but lower than for unfumigatedsoil. There was no direct relationship between biodiversity and function. Somebroad-scale functional parameters increased as biodiversity decreased, e.g. thymidineincorporation, growth on added nutrients, and the decomposition rate of plantresidues. Other more specific parameters decreased as biodiversity decreased, e.g.nitrification, denitrification and methane oxidation. Thus specific functional parame-ters may be a more sensitive indicator of environmental change than generalparameters. Although fumigation reduced soil microbial biodiversity, there wasevidence to suggest that it selected for organisms with particular physiologicalcharacteristics. The consequences of this for interpreting biodiversity – functionrelationships are discussed. The stability of the resulting communities to perturbationwas further examined by imposing a transient (brief heating to 40°C) or a persistent(addition of CuSO4) stress. Decomposition of grass residues was determined on threeoccasions after such perturbations. The soils clearly demonstrated resilience to thetransient stress; decomposition rates were initially depressed by the stress andrecovered over time. Resilience was reduced in the soils with decreasing biodiversity.Soils were not resilient to the persistent stress, there was no recovery in decomposi-tion rate over time, but the soils with the highest biodiversity were more resistant tothe stress than soils with impaired biodiversity. The study of functional stabilityunder applied perturbation is a powerful means of examining the effects of biodiver-sity.
B. S. Griffiths and K. Ritz, Scottish Crop Research Inst., In6ergowrie, Dundee, UKDD2 5DA ([email protected]). – R. D. Bardgett, Dept of Biological Sciences, Inst.of En6ironmental and Natural Sciences, Uni6. of Lancaster, Lancaster, UK LA1 4YQ.– R. Cook, Inst. of Grassland and En6ironmental Research, Plas Gogerddan, Aberyst-wyth, UK SY23 3EB. – S. Christensen and F. Ekelund, Dept of Population Biology,Uni6. of Copenhagen, Uni6ersitetsparken 15, DK-2100 Copenhagen O, Denmark. – S.J. Sørensen, Dept of General Microbiology, Uni6. of Copenhagen, Søl6gade 83H,Copenhagen 1307, Denmark. – E. Baath, Dept of Ecology, Lund Uni6., EcologyBuilding, SE-223 62 Lund, Sweden. – J. Bloem, P. C. de Ruiter and J. Dolfing, DLOResearch Inst. for Agrobiology and Soil Fertility, P.O. Box 14, NL-6700 AA Wagenin-gen, The Netherlands. – B. Nicolardot, INRA, 2 Esplanade Roland Garros, BP 224,F-51686 Reims CEDEX 2, France.
Accepted 14 January 2000
Copyright © OIKOS 2000ISSN 0030-1299Printed in Ireland – all rights reserved
OIKOS 90:2 (2000) 279
The relationship between biodiversity and ecosystemfunction is of increasing importance in ecology. Initialresearch claimed to demonstrate benefits to ecosystemfunction from higher biodiversity (Naeem et al. 1994,Tilman and Downing 1994, Tilman et al. 1996, 1997).However, there is a growing body of experimentalevidence that the functional characteristics of compo-nent species are at least as important as the numberof species per se for maintaining critical ecosystemprocesses (Grime 1997, Hooper and Vitousek 1997,Wardle et al. 1997, 1999, Bardgett and Shine 1999).However, contrasting life-history or species traits canconfound the interpretation of data where differencesin species richness are correlated with differences inecosystem functions (Grime 1997, Huston 1997).
All of the above biodiversity experiments have beenconcerned with organisms that live above ground andthere has been very little attention to relationshipsbetween biodiversity and ecosystem processes in soilsystems. In most terrestrial ecosystems, soils containby far the greatest diversity of organisms and further-more, these organisms are of fundamental importanceto ecosystem function through determining decompo-sition, nutrient cycling and energy flow (Wardle andGiller 1997). For microbial communities in the soil,the effects of biodiversity on ecosystem processes maynot be the same as those relationships occurringabove ground. This is due to some fundamental dif-ferences in the physical structure of above- and be-low-ground systems (Lawton 1994, Grime 1997). Inparticular, unlike above-ground communities, very lit-tle is known about the composition of functionalgroups within the soil microbial community and it isgenerally thought that there may be considerableoverlap in function at the level of the microbial spe-cies (Chapin et al. 1997). Conversely, it has beenspeculated that high biodiversity may be vitally im-portant in structurally diverse ecosystems (Grime1997), such as soil. Beare et al. (1995) argued thatbelow-ground biodiversity was important in maintain-ing spatial and temporal heterogeneity in the soil sys-tem and for maintaining complex biotic interactionswhich determine biogeochemical cycling. In one ofthe few rigorous experimental tests of the role of soilmicrobial biodiversity, Van der Heijden et al. (1998)demonstrated that mycorrhizal diversity directly af-fected plant diversity and production. However, An-dren et al. (1995) found little indication thatdecomposition rates were controlled by organism di-versity, and speculated that there is generally a redun-dancy of species within the decomposer communitiesin soils. A similar hypothesis has been put forwardfor the role of microbes in the functioning of aquaticecosystems (Finlay et al. 1997). Concern has alsobeen expressed that the loss of species with similarfunctional roles, but differing in environmental re-sponse, may reduce the resilience of ecosystems to
stress (Chapin et al. 1997). It is possible that themajor importance of biodiversity for ecosystem pro-cesses is not apparent under relatively stable condi-tions (Andren et al. 1995). The conservation ofbiodiversity is thought to matter because of the con-siderable importance of community composition andindividual species in maintaining ecosystems underchanging conditions (Wardle 1999). Studies on thefunctionality of soil biodiversity are, therefore, timely.
A key to establishing empirical relationships be-tween biodiversity and ecosystem processes is the ma-nipulation of species diversity in model systems. Thishas generally been achieved either: (1) constructively,starting with a sterile medium and building up com-munities of different diversity by adding cultures ofknown species (McGrady-Steed et al. 1997, Naeemand Li 1997), or by adding different dilutions of asoil suspension (Salonius 1981), or (2) destructively,reducing the diversity of the community by progres-sively removing species. Some workers have adoptedapproaches that enable the selection of species at ran-dom from a pool of available species. For example,Naeem and Li (1997) had up to three known species(of bacteria or protists) per functional group, whileMcGrady-Steed et al. (1997) increased eukaryotic di-versity up to 31 species with a constant bacterial con-sortium averaging 24 taxa. There are two problemswith this approach for studies of soil microbial diver-sity. First, the cultivable microorganisms that couldform such a species pool are unrepresentative of theindigenous soil microbial communities. Cultural en-richment techniques to create microbial species poolsare highly selective, with at best 2% of all microbialcells being expressed in culture (Faegri et al. 1977,Bakken 1985, Hopkins et al. 1993). Therefore, the useof cultural enrichment techniques in model studies ofthe importance of soil biodiversity will create micro-bial communities that are unrepresentative of in situcommunity structure (Ward et al. 1990, Weller et al.1991, Wagner et al. 1993). Second, the resulting com-munities have unrealistically low species diversity.Natural soil microbial communities are extremely spe-cies rich, with as many as 4000 different geneticallydistinct units (‘species’) in only 100 g of beech forestsoil (Torsvik et al. 1990), and some 350 and 8000distinct units in sandy soil and organic soils, respec-tively (Øvreas and Torsvik 1998).
Given these problems with the constructive ap-proach, there could be some benefit from utilising thedestructive approach. Fumigation of soil with chloro-form vapour, a technique commonly used to deter-mine the size of the soil microbial biomass (Jenkinsonand Powlson 1976), results in a progressive increasein microbial death with fumigation time. Fumigationaffects all organisms, and there is rapid regrowth of
280 OIKOS 90:2 (2000)
bacteria and fungi in soil following cessation of fumiga-tion (Ingham and Horton 1987). In addition, there isevidence that organisms survive fumigation because ofthe structural heterogeneity of the soil rather thanbecause of intrinsic resistance to chloroform fumigation(Darbyshire et al. 1989). Degens (1998) showed thatchloroform fumigation reduced the functional diversityof a soil microbial community, and although the meth-ods used could not be related to taxonomic diversity,the implication was that fumigation could be a usefultool to reduce soil biodiversity non-selectively.
In this study we asked if chloroform fumigationcould be used to reduce the biodiversity of the soilbiotic community. If so, is reduction non-selective, re-moving species in a random fashion and hence min-imising the possibility of effects being due to thefumigation treatment rather than changes in biodiver-sity. We also asked if observed changes in biodiversityaltered key soil functions related to nutrient flux, suchas nitrogen mineralization and substrate decomposi-tion.
Concepts relating to the stability of ecosystems havebeen described by McNaughton (1994). Stability com-prises both resistance, i.e. the ability to withstand aperturbation or stress, and resilience, i.e. the time re-quired to recover to pre-perturbation levels. It has beenhypothesised that while there may be no direct relation-ship between biodiversity and ecosystem function, theremay be a direct link between biodiversity and stability(Griffiths et al. 1997). If progressive chloroform fumi-gation reduced soil biodiversity, it would be possible totest this hypothesis in an experimental soil system. Thefinal question we asked is whether changes in soilbiodiversity affect soil stability to perturbation.
Methods
Fumigation and selection of appropriatefumigation times
A clay-loam soil (72% sand, 21% silt, 7% clay, with3.07% C, 0.14% N and a pH (CaCl2) of 5.7) wascollected from the top 10 cm of a permanent pasture inMarch and sieved through a 7-mm diameter mesh. Thesoil was fumigated with chloroform vapour (Jenkinsonand Powlson 1976), in batches of 1 kg spread on ashallow glass tray in a vacuum desiccator. Individualbatches were exposed to chloroform vapour for 0 (un-fumigated control), 1, 5, 15, 30 (0.5 h), 60, 120 (2 h),240 and 1440 (24 h) minutes at room temperature.Following removal of the chloroform, the C-flush wasdetermined by extracting duplicate 5-g samples with 20ml 1M KCl and measuring dissolved organic-C in theextract (Ritz et al. 1997). The soils were then incubatedin glass jars with loosely fitting lids at 15°C and werevented and watered with sterile distilled water to a
constant weight at regular intervals. To select appropri-ate fumigation times for detailed analysis, sub-sampleswere taken 2 months after fumigation, and assayed formicrobial and microfaunal community structure byPLFA, CLPP and microfaunal analyses (see below fordetails). Soils fumigated for 0, 0.5, 2 and 24 h wereselected for more detailed analysis after incubation for5 months following fumigation. The experiment wasrepeated in successive years (1996 and 1997, subse-quently referred to as Year 1 and Year 2) to determinethe generality of the fumigation response. In Year 2soils were fumigated for 0, 0.5, 2 and 24 h only.
We stress that the purpose of the fumigation treat-ment was to determine the effect of biodiversity on soilfunction, by providing a set of soils with different levelsof biodiversity in them, and not to examine the repro-ducibility of the fumigation treatment. Fumigation wasthus merely a tool to alter soil biodiversity in a globalsense. To this end, it was deemed more appropriate totake repeated samples from a single batch of fumigatedsoil, which would have a defined level of biodiversity,than from multiple batches of soil which, althoughfumigated for the same length of time, would notnecessarily have the same biodiversity. Further, by re-peating the experiment over time we could be confidentthat any consistently observed trends were a real effectof the experimental manipulation.
Community population and diversity parameters
Phospholipid fatty acid analysis (PLFA)This is an indicator of microbial community structure(but not diversity, as individual species contain a sig-nificant number of the fatty acids exhibited by a wholecommunity – see Haack et al. (1994)), and of microbialbiomass from total phospholipid-P. It was performedas described by Frostegard et al. (1993). Briefly, thisinvolved the extraction of fatty acids from single sam-ples of each soil, separation and esterification of thephospholipid fraction, and identification and quantifi-cation of individual fatty acid methyl esters by gaschromatography.
Direct counts of bacteria and fungiBacterial cells and fungal hyphae were counted andmeasured by automated microscopic analysis of sus-pensions prepared from the different soils, as describedby Bloem et al. (1995a, b). There were 10 replicatemeasurements per sample for bacteria and three forfungi. Biomass was estimated from the bacterial biovol-ume (number×mean cell volume) assuming a specificcarbon content of 3.1×10⁻¹³ g C mm−3 (Bloem et al.1995a, b), and from the fungal length by calculatingbiovolume (assuming cylindrical hyphae with a diame-
OIKOS 90:2 (2000) 281

ter of 2 mm) and assuming a specific carbon content of1.3×10−13 g C mm−3 (Bloem et al. 1995a).
Colony forming units of bacteria, and their di6ersityBacteria were harvested from soil samples by adding 1g of soil to 9 ml PBS buffer (Sambrook et al. 1989).The soil suspensions were vortexed vigorously for 2 minto dislodge cells from soil particles. Aerobic hetero-trophic bacteria were enumerated by plating appropri-ate dilutions, single determinations in Year 1 andtriplicate determinations in Year 2, on 10% LuriaBertani (LB) agar plates supplemented with natamycin25 mg/ml to prevent fungal growth (Pedersen 1992).Colonies appearing after five days incubation at 24°Cwere enumerated and visually grouped by colony mor-phology into 33 different morphotypes.
Genetic di6ersity of soil bacteriaTo overcome the potential problem that cultivable bac-teria are unrepresentative of the soil population, DNAwas directly extracted from two replicates of each soil(Van Elsas and Smalla 1995), amplified with universalbacterial primers in a polymerase chain reaction (PCR),and analysed by denaturing gradient gel electrophoresis(DGGE), in which species richness is related to thenumber of DNA bands present (Muyzer et al. 1993).
MicrofaunaMicrofauna were extracted from single soil samples ofca 50 g on trays (Whitehead and Hemming 1965). Thelimited sub-sample of soil available necessitated a singleextraction, although triplicate samples of unfumigatedsoil before inoculation were extracted in Year 1 to givesome estimate of reproducibility. Nematodes, rotifersand enchytraeids were counted in total extracts orsub-samples at ×50 magnification. Nematodes werethen killed and fixed by adding to the extract an equalvolume of boiling 8% formaldehyde. Subsequently, sub-samples of nematodes (all specimens or a maximum of100) were mounted on microscope slides, examined at×400 magnification, identified to genus or family andallocated to a feeding group (Yeates et al. 1993, 1997).
ProtozoaIn Year 1 protozoan abundance and diversity wasdetermined simultaneously by a modified most-proba-ble-number (MPN) method. A 10-fold dilution seriesfor each soil was established in triplicate in sterile 50 mlNunclon® bottles. After dilution the bottles containedfrom 1.5 to 1.5×10⁻⁸ g of soil and 3 ml sterileModified Neff’s amoeba saline (Page 1988), and asterilised wheat seed was added to provide nutrients.Three samples from the control soil (0 h) were exam-ined in this manner. For each of the other treatments(0.5, 2 and 24 h) only one triplicate series was estab-lished. Bottles were stored in darkness at 10°C, andwere inspected by microscope six times during a one-
month period. Flagellates were identified to the lowesttaxonomic level possible in a routine examination; pres-ence of naked and testate amoebae, cells with ‘‘helio-zoan morphology’’ and ciliates was noted.
In Year 2 protozoan abundance was determined byan MPN-method using micro titre plates as describedby Darbyshire et al. (1974) with modifications of Rønnet al. (1995). Three microtitre plates were prepared foreach treatment, stored as above, and inspected forpresence of protozoa 1 and 3 weeks after inoculation.Qualitative diversity was studied in sterile 50-ml Nun-clon® bottles containing 1.5 g of soil and 5 ml sterileModified Neff’s amoeba saline (Page 1988) with asterilised wheat grain to provide nutrients for the or-ganisms. For each of the four soils eight bottles wereprepared, stored and examined as described for Year 1.
Community function parameters
We selected a range of measures of microbial activitiescentral to the soil ecosystem-level processes of organicmatter decomposition and nutrient cycling, namely:
Mineral nitrogen (Nmin)To determine rates of net N mineralisation and nitrifi-cation, NH4
+ and NO3− were extracted and quantified
in triplicate, as described by Wheatley et al. (1989),after incubation for two and five months followingfumigation.
Thymidine and leucine incorporationSpecific assays to measure rates of microbial DNA andprotein synthesis, by the incorporation of labelledthymidine and leucine respectively, were carried out onthree replicate samples of each soil as described byMichel and Bloem (1993).
Microbial acti6ity and growth response to addedsubstratesThe initial release of CO2 from glucose added to soil,known as substrate-induced respiration (SIR), is pro-portional to the microbial biomass (Anderson andDomsch 1978). The longer-term response is a measureof microbial growth on the added substrate, and deter-mination of the response with additional nitrogen andphosphorus gives an indication of relative nutrient limi-tation (Stotsky and Norman 1961). These were investi-gated in the fumigated soils by incubating triplicatesamples of 2 g fresh soil with 3 ml nutrient solutioncontaining C (glucose), N as (NH4)2SO4 and P (primaryand secondary phosphate) in all combinations (eighttreatments) in sufficient amounts to saturate existingenzymes and support growth for a period of 1–3 d(Christensen et al. 1996). The initial constant respira-tion rate (up to 6 h) reflects the SIR rate whereasgrowth rates were calculated from the increase in respi-ration rate that occurred during the following 18–36 h.
282 OIKOS 90:2 (2000)
The initial release rate of N2O in anaerobic soilslurries, amended with glucose and nitrate and incu-bated with 10 vol-% acetylene, is an indicator of thedenitrification enzyme activity of the soil (Tiedje 1994).The existing enzyme activity was estimated from thefirst 6–10 h incubation. Following this period an expo-nential increase in denitrification rate showed thegrowth potential of the denitrifying bacteria within thesoil (Smith and Tiedje 1979), this was observed during12–50 h incubation.
Community le6el physiological profiling (CLPP)This was used to test for the ability of soil microbialcommunities to utilise a range of carbon substrates, andhence determine the functional diversity of the soilmicrobial community (Garland and Mills 1991). Al-though it is essentially function-based, the technique isalso an indicator of the community structure of cul-tivable organisms (Garland 1997). Briefly, duplicatesamples of 1 g dry weight equivalent of each soil weredispersed in 10 ml 1/4 strength Ringer’s solution (NaCl– 2.25, KCl – 0.105, CaCl2.2H2O – 0.12, NaHCO3 –0.05 g l−1) for 20 s in a Stomacher Lab Blender 400(Colworth, UK), further diluted 1:10 in 1/4 strengthRinger’s solution, left to settle for 30 min at 4°C, and125 ml of the supernatant inoculated into each well of aBiolog GN microplate (Hayward, CA). The CLPP wasanalysed as previously described (Hackett and Griffiths1997).
Soil respiration and microbial biomass C dynamicsThe recovery of microbial biomass post-fumigation,and the activity of that biomass, would affect theusefulness of the fumigation technique for biodiversitystudies in soil. In Year 2, respiration, microbial biomassand extractable carbon were determined on four repli-cate aliquots of each of the fumigated soils. Aliquots of25 g soil were incubated in 250-ml sealed glass jars inthe presence of 10 ml 0.25M NaOH, total CO2 trappedwas determined by a continuous flow colorimetricmethod (Nicolardot et al. 1984). Biomass-C was mea-sured using the method proposed by Vance et al. (1987)and adapted by Chaussod et al. (1988). Extractable-Cwas obtained by extraction with 100 ml 0.1 M K2SO4,persulfate oxidation at 100°C and the CO2 producedbeing measured by non-dispersive infra-red gas detec-tion (1010 TOC analyzer, OI Analytical) (Barcelona1984).
Decomposition of plant residuesThis was chosen as the main indicator of ecosystemfunction, as decomposition is such a centrally impor-tant process (Heal et al. 1997). Aliquots of 10 g soilwere mixed with 20 mg dried and ground plant materialand incubated at 15°C in a sealed 120-ml glass jar inthe presence of 1-ml 0.5M NaOH to trap evolved CO2.In Year 1 short-term decomposition (10 d) was assessed
by adding ryegrass (Lolium perenne L.) shoots, that hadbeen pulse-labelled with 14CO2 (Paterson et al. 1996), tofour replicate samples of each soil. Radioactivity in theNaOH was determined by liquid scintillation countingusing 15 ml fluor. In Year 2 short-term decomposition(10 d) was assessed by adding ryegrass (Lolium perenne)shoots, that had been pulse-labelled with 13CO2 (Hodgeet al. 1998), to four replicate samples of each soil. TheNaOH from each sample was transferred to a 12-mlglass vial capped with a rubber septum (‘Exetainer’,Europa Scientific Ltd, Crewe, UK), the vial was evacu-ated and CO2 released by acidifying the NaOH. Thetotal amount of CO2 and the delta-13C of the CO2 weredetermined by continuous-flow isotope mass spectrome-try (Tracermass G, Europa Scientific). Longer-term de-composition (105 d) was also assessed in Year 2 byusing continuously labelled barley straw (Hordeum 6ul-gare L., 47.4% C, 0.76% N and 1221.8 kBq g−1 C,Contrepas and Gaudilliere 1987), or maize stover (Zeamays L., 44.3% C, 1.43% N and 78500 kBq g−1 C,Lespinat et al. 1976) to three replicate samples of eachsoil in place of ryegrass.
Stability to perturbationAs contrasting examples of environmental stress weapplied either a transient (brief temperature change) ora persistent perturbation (addition of a heavy metal) tothe fumigated soils. Aliquots of 10 g soil in 120-ml glassjars were either: (1) incubated at 40°C for 18 h; (2)amended with 16.3 mg finely ground CuSO4 · 5H2O(equivalent to 500 mg Cu g−1, or 7.8 mmol kg−1, drysoil); (3) left untreated, as a control. Short-term decom-position of plant residues was measured, as describedabove, on three separate occasions after the perturba-tion. Thus, immediately after perturbation grass shootmaterial was added to triplicate aliquots and CO2 evo-lution monitored over 24 h, as described above. Thiswas repeated with another three replicates two weeksafter perturbation, and with a final three replicates twomonths after perturbation. The rationale for choosingdecomposition over 24 h was that the initial mineralisa-tion of the added substrate would be carried out by theindigenous microbial community, whereas after tendays incubation certain species will have proliferatedresulting in a shift in microbial community structurewhich would be different from the starting community.For this reason calculations of stability were based onthe response over 24 h, as being most directly related tothe biodiversity of the soils. Resistance to perturbationwas determined as the difference between respiration inthe control soil (CO2 · con) and respiration in the per-turbed soil (CO2 · pert), for each fumigation time. Be-cause of the absolute differences in respiration ratebetween fumigated soils, resistance was normalised tothe control value. i.e.
OIKOS 90:2 (2000) 283
Resistance=% change from control
= (CO2·con−CO2·pert/CO2·con)×100%
The statistical significance of the resistance was calcu-lated by bootstrapping. Resilience was taken to be thechange in resistance over time, and stability (sensuMcNaughton 1994) the combination of resistance andresilience.
Results
Selection of appropriate fumigation times
The soils selected for further studies were those fumi-gated for: 0 h (unfumigated control), 0.5 h, 2 h, and 24h. This selection was on the basis of the flush of carbonreleased by fumigation, and the PLFA profiles, CLPPprofiles and nematode numbers two months after fumi-gation (data not shown).
Effect of fumigation on microbial communitystructure
CLPPIn Year 1, principal component analysis (PCA) of thetime-course of substrate utilisation, after 5 months in-cubation, distinguished three groups (0 and 0.5 h), 2 h,and 24 h. The number of positive wells developing inthe Biolog plates was significantly lower (PB0.05) forthe 2-h soil (26.5 positive wells after 5 d incubation,SED=3.2) than any other treatment, and not signifi-cantly different between 0, 0.5 and 24 h (61.5, 62.0 and57.5 positive wells respectively, P\0.05). In Year 2only the 2-h treatment could be separated from theother three treatments by both PCA, and in havingfewer positive wells (67.5, 76.5, 31.5 and 64.5 positivewells, respectively, SED=2.6).
PLFAYears 1 and 2 Microbial community structure, as as-sessed by PCA of the phospholipid fatty acids, consis-tently separated the (0 and 0.5 h) from the (2 and 24 h)treatments in both years. Of the individual phospho-
lipid fatty acids, branched fatty acids such as br16:0and br18:0 became proportionally more common asfumigation time increased, while fungally associatedfatty acids (18w:2, 20:4) became less common.
Effect of fumigation on biodiversity
Colony forming units (CFU) of bacteria and theirdi6ersityThe number of CFU tended to increase with increasingfumigation, while their diversity tended to decrease(Table 1). There was a clear decrease in diversity be-tween the (0 and 0.5 h) and the (2 and 24 h) treatments.The numbers of bacteria tended to be lower in Year 2than in Year 1.
Genetic di6ersity of soil bacteriaThe banding pattern of the amplified soil DNAchanged following fumigation. Although the grosstrend was the same in subsequent years, i.e. fewerbands with increased fumigation time (Fig. 1), and ashift in the most intense bands (Fig. 1), the patternswere also different between years. Automated analysisof the 0 and 24 h samples in Year 1 indicated that thenumber of bands decreased from 18 to 8 respectively,while the most intense bands (\50% of maximumrecorded grey level) had shifted from one in the unfu-migated soil (at ca 57% denaturant concentration) tothree in the 24 h treatment (ca 48, 53 and 70% denatu-rant). In Year 2, the number of bands fell from 26 to 22following fumigation, with three dominant bands in theunfumigated soil (ca 62, 64 and 69% denaturant) andfour in the 24-h treatment (ca 51, 54, 57 and 59%denaturant) (Fig. 2).
MicrofaunaNumbers of nematodes in control soil sampled pre-in-cubation in Year 1 were 2800 (SD=340) 100 g−1 drysoil, and were unchanged after 5 months incubation(Table 2). In both years, the shortest fumigation (0.5 h)reduced nematode populations compared with un-treated soil (Table 2). Fumigation for 2 h eliminatedmost nematodes and none survived the longest period(24 h). Enchytraeids and rotifers did not persist in soilsfumigated for more than 1 h in Year 1 nor 2 h in Year
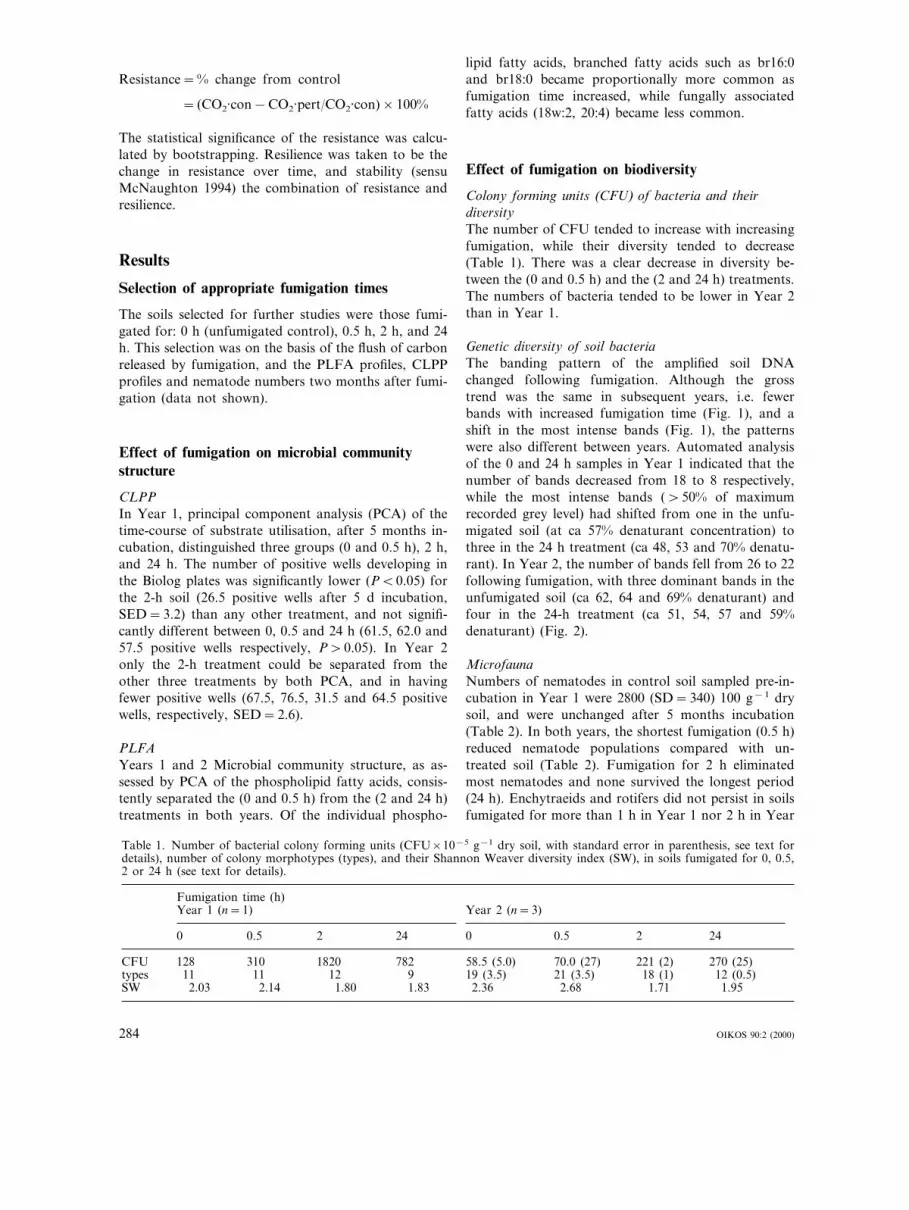
Table 1. Number of bacterial colony forming units (CFU×10−5 g−1 dry soil, with standard error in parenthesis, see text fordetails), number of colony morphotypes (types), and their Shannon Weaver diversity index (SW), in soils fumigated for 0, 0.5,2 or 24 h (see text for details).
Fumigation time (h)Year 2 (n=3)Year 1 (n=1)
0 0.5 2 24 0 0.5 2 24
270 (25)CFU 221 (2)70.0 (27)58.5 (5.0)782182031012812 (0.5)18 (1)21 (3.5)19 (3.5)9121111types
SW 2.03 2.14 1.80 1.83 2.36 2.68 1.71 1.95
284 OIKOS 90:2 (2000)
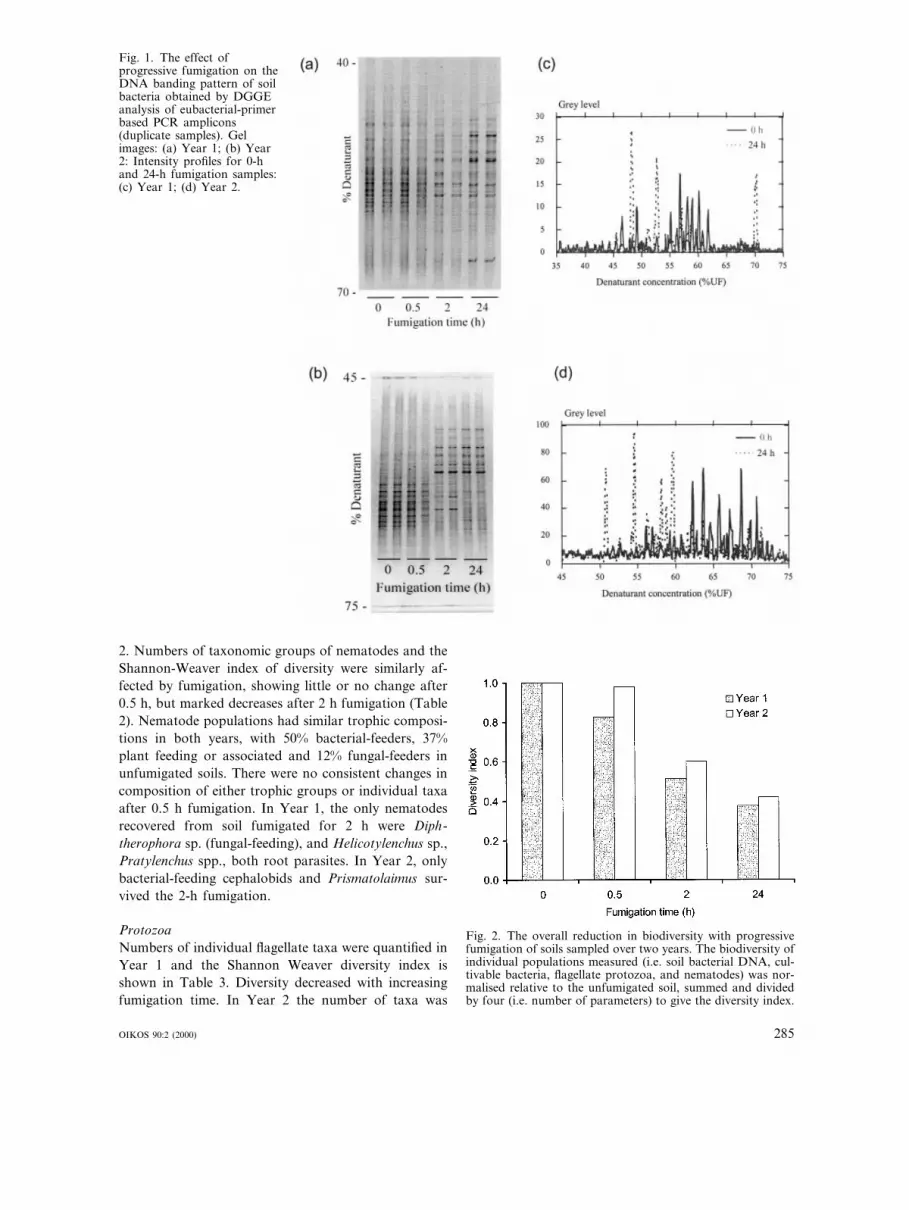
Fig. 1. The effect ofprogressive fumigation on theDNA banding pattern of soilbacteria obtained by DGGEanalysis of eubacterial-primerbased PCR amplicons(duplicate samples). Gelimages: (a) Year 1; (b) Year2: Intensity profiles for 0-hand 24-h fumigation samples:(c) Year 1; (d) Year 2.
2. Numbers of taxonomic groups of nematodes and theShannon-Weaver index of diversity were similarly af-fected by fumigation, showing little or no change after0.5 h, but marked decreases after 2 h fumigation (Table2). Nematode populations had similar trophic composi-tions in both years, with 50% bacterial-feeders, 37%plant feeding or associated and 12% fungal-feeders inunfumigated soils. There were no consistent changes incomposition of either trophic groups or individual taxaafter 0.5 h fumigation. In Year 1, the only nematodesrecovered from soil fumigated for 2 h were Diph-therophora sp. (fungal-feeding), and Helicotylenchus sp.,Pratylenchus spp., both root parasites. In Year 2, onlybacterial-feeding cephalobids and Prismatolaimus sur-vived the 2-h fumigation.
ProtozoaNumbers of individual flagellate taxa were quantified inYear 1 and the Shannon Weaver diversity index isshown in Table 3. Diversity decreased with increasingfumigation time. In Year 2 the number of taxa was
Fig. 2. The overall reduction in biodiversity with progressivefumigation of soils sampled over two years. The biodiversity ofindividual populations measured (i.e. soil bacterial DNA, cul-tivable bacteria, flagellate protozoa, and nematodes) was nor-malised relative to the unfumigated soil, summed and dividedby four (i.e. number of parameters) to give the diversity index.
OIKOS 90:2 (2000) 285
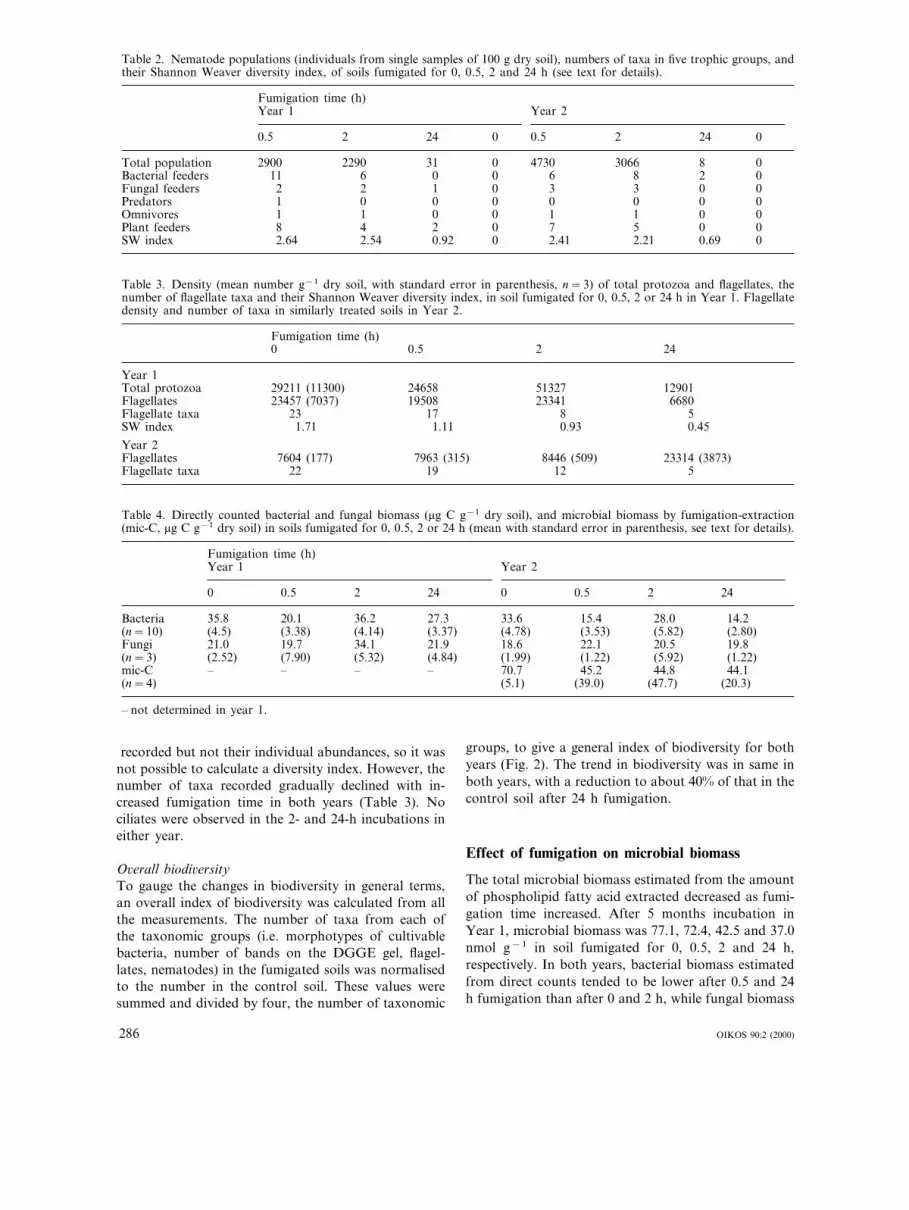
Table 2. Nematode populations (individuals from single samples of 100 g dry soil), numbers of taxa in five trophic groups, andtheir Shannon Weaver diversity index, of soils fumigated for 0, 0.5, 2 and 24 h (see text for details).
Fumigation time (h)Year 1 Year 2
0.5 2 24 0 0.5 2 24 0
Total population 2900 2290 31 00 4730 3066 8Bacterial feeders 11 6 00 0 6 8 2Fungal feeders 2 2 1 00 3 3 0Predators 1 0 0 0 0 0 00Omnivores 1 1 0 00 1 1 0Plant feeders 8 4 2 0 07 5 0SW index 2.64 2.54 0.92 0 02.41 2.21 0.69
Table 3. Density (mean number g−1 dry soil, with standard error in parenthesis, n=3) of total protozoa and flagellates, thenumber of flagellate taxa and their Shannon Weaver diversity index, in soil fumigated for 0, 0.5, 2 or 24 h in Year 1. Flagellatedensity and number of taxa in similarly treated soils in Year 2.
Fumigation time (h)240 0.5 2
Year 112901Total protozoa 29211 (11300) 24658 51327
Flagellates 23457 (7037) 19508 23341 6680Flagellate taxa 23 517 8SW index 0.451.71 1.11 0.93
Year 223314 (3873)Flagellates 7604 (177) 7963 (315) 8446 (509)
Flagellate taxa 22 19 512
Table 4. Directly counted bacterial and fungal biomass (mg C g−1 dry soil), and microbial biomass by fumigation-extraction(mic-C, mg C g−1 dry soil) in soils fumigated for 0, 0.5, 2 or 24 h (mean with standard error in parenthesis, see text for details).
Fumigation time (h)Year 2Year 1
0 0.5 2 2424 0 0.5 2
Bacteria 35.8 20.1 14.236.2 27.3 33.6 15.4 28.0(n=10) (4.5) (3.38) (4.14) (2.80)(3.37) (4.78) (3.53) (5.82)Fungi 21.0 19.7 19.834.1 21.9 18.6 22.1 20.5(n=3) (2.52) (7.90) (5.32) (1.22)(4.84) (1.99) (1.22) (5.92)mic-C – – – 44.1– 70.7 45.2 44.8(n=4) (20.3)(5.1) (39.0) (47.7)
– not determined in year 1.
groups, to give a general index of biodiversity for bothyears (Fig. 2). The trend in biodiversity was in same inboth years, with a reduction to about 40% of that in thecontrol soil after 24 h fumigation.
Effect of fumigation on microbial biomass
The total microbial biomass estimated from the amountof phospholipid fatty acid extracted decreased as fumi-gation time increased. After 5 months incubation inYear 1, microbial biomass was 77.1, 72.4, 42.5 and 37.0nmol g−1 in soil fumigated for 0, 0.5, 2 and 24 h,respectively. In both years, bacterial biomass estimatedfrom direct counts tended to be lower after 0.5 and 24h fumigation than after 0 and 2 h, while fungal biomass
recorded but not their individual abundances, so it wasnot possible to calculate a diversity index. However, thenumber of taxa recorded gradually declined with in-creased fumigation time in both years (Table 3). Nociliates were observed in the 2- and 24-h incubations ineither year.
O6erall biodi6ersityTo gauge the changes in biodiversity in general terms,an overall index of biodiversity was calculated from allthe measurements. The number of taxa from each ofthe taxonomic groups (i.e. morphotypes of cultivablebacteria, number of bands on the DGGE gel, flagel-lates, nematodes) in the fumigated soils was normalisedto the number in the control soil. These values weresummed and divided by four, the number of taxonomic
286 OIKOS 90:2 (2000)
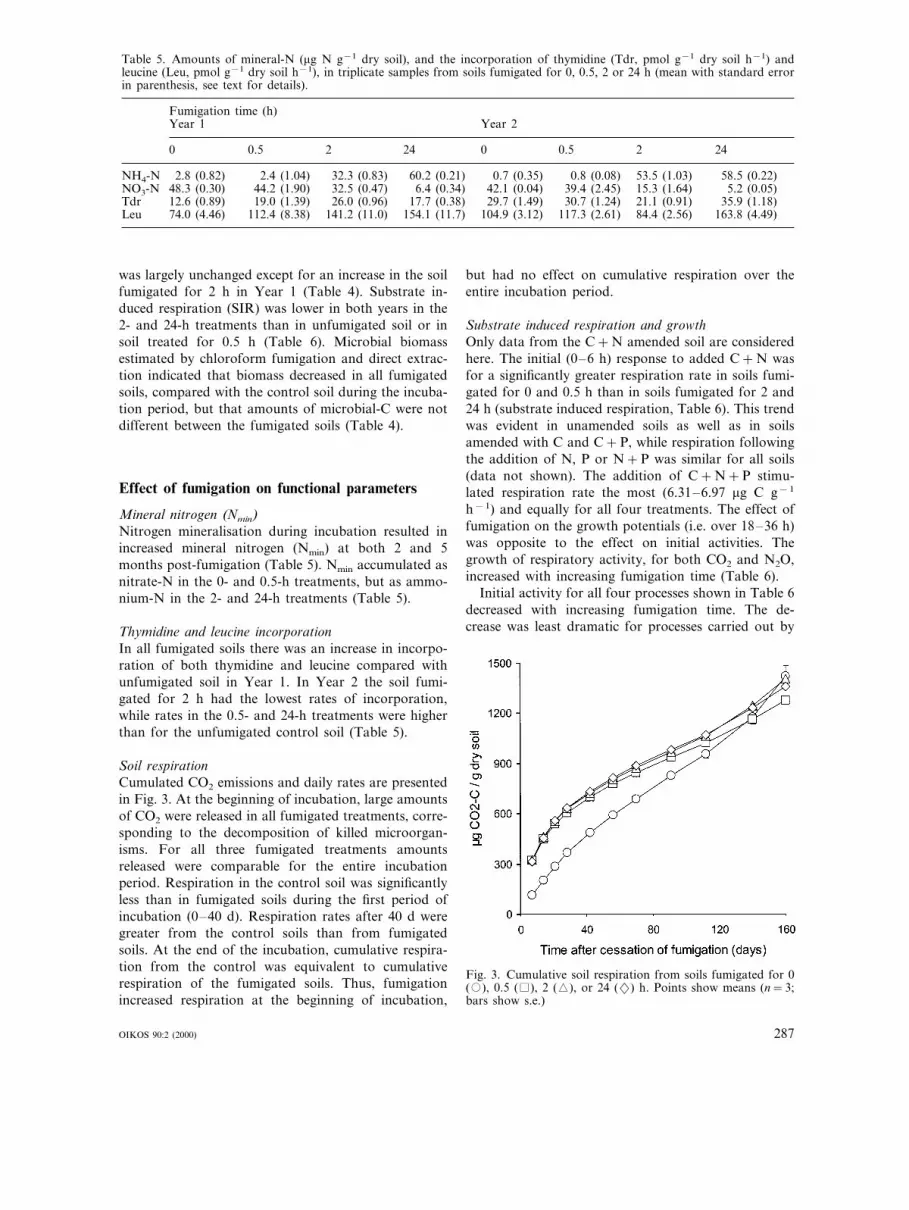
Table 5. Amounts of mineral-N (mg N g−1 dry soil), and the incorporation of thymidine (Tdr, pmol g−1 dry soil h−1) andleucine (Leu, pmol g−1 dry soil h−1), in triplicate samples from soils fumigated for 0, 0.5, 2 or 24 h (mean with standard errorin parenthesis, see text for details).
Fumigation time (h)Year 1 Year 2
0 0.5 2 24 0 0.5 2 24
NH4-N 2.8 (0.82) 2.4 (1.04) 32.3 (0.83) 58.5 (0.22)60.2 (0.21) 0.7 (0.35) 0.8 (0.08) 53.5 (1.03)NO3-N 48.3 (0.30) 44.2 (1.90) 5.2 (0.05)32.5 (0.47) 6.4 (0.34) 42.1 (0.04) 39.4 (2.45) 15.3 (1.64)Tdr 12.6 (0.89) 19.0 (1.39) 26.0 (0.96) 35.9 (1.18)17.7 (0.38) 29.7 (1.49) 30.7 (1.24) 21.1 (0.91)Leu 74.0 (4.46) 112.4 (8.38) 141.2 (11.0) 154.1 (11.7) 104.9 (3.12) 163.8 (4.49)117.3 (2.61) 84.4 (2.56)
was largely unchanged except for an increase in the soilfumigated for 2 h in Year 1 (Table 4). Substrate in-duced respiration (SIR) was lower in both years in the2- and 24-h treatments than in unfumigated soil or insoil treated for 0.5 h (Table 6). Microbial biomassestimated by chloroform fumigation and direct extrac-tion indicated that biomass decreased in all fumigatedsoils, compared with the control soil during the incuba-tion period, but that amounts of microbial-C were notdifferent between the fumigated soils (Table 4).
Effect of fumigation on functional parameters
Mineral nitrogen (Nmin)Nitrogen mineralisation during incubation resulted inincreased mineral nitrogen (Nmin) at both 2 and 5months post-fumigation (Table 5). Nmin accumulated asnitrate-N in the 0- and 0.5-h treatments, but as ammo-nium-N in the 2- and 24-h treatments (Table 5).
Thymidine and leucine incorporationIn all fumigated soils there was an increase in incorpo-ration of both thymidine and leucine compared withunfumigated soil in Year 1. In Year 2 the soil fumi-gated for 2 h had the lowest rates of incorporation,while rates in the 0.5- and 24-h treatments were higherthan for the unfumigated control soil (Table 5).
Soil respirationCumulated CO2 emissions and daily rates are presentedin Fig. 3. At the beginning of incubation, large amountsof CO2 were released in all fumigated treatments, corre-sponding to the decomposition of killed microorgan-isms. For all three fumigated treatments amountsreleased were comparable for the entire incubationperiod. Respiration in the control soil was significantlyless than in fumigated soils during the first period ofincubation (0–40 d). Respiration rates after 40 d weregreater from the control soils than from fumigatedsoils. At the end of the incubation, cumulative respira-tion from the control was equivalent to cumulativerespiration of the fumigated soils. Thus, fumigationincreased respiration at the beginning of incubation,
but had no effect on cumulative respiration over theentire incubation period.
Substrate induced respiration and growthOnly data from the C+N amended soil are consideredhere. The initial (0–6 h) response to added C+N wasfor a significantly greater respiration rate in soils fumi-gated for 0 and 0.5 h than in soils fumigated for 2 and24 h (substrate induced respiration, Table 6). This trendwas evident in unamended soils as well as in soilsamended with C and C+P, while respiration followingthe addition of N, P or N+P was similar for all soils(data not shown). The addition of C+N+P stimu-lated respiration rate the most (6.31–6.97 mg C g−1
h−1) and equally for all four treatments. The effect offumigation on the growth potentials (i.e. over 18–36 h)was opposite to the effect on initial activities. Thegrowth of respiratory activity, for both CO2 and N2O,increased with increasing fumigation time (Table 6).
Initial activity for all four processes shown in Table 6decreased with increasing fumigation time. The de-crease was least dramatic for processes carried out by
Fig. 3. Cumulative soil respiration from soils fumigated for 0(�), 0.5 ( ), 2 (�), or 24 (2) h. Points show means (n=3;bars show s.e.)
OIKOS 90:2 (2000) 287
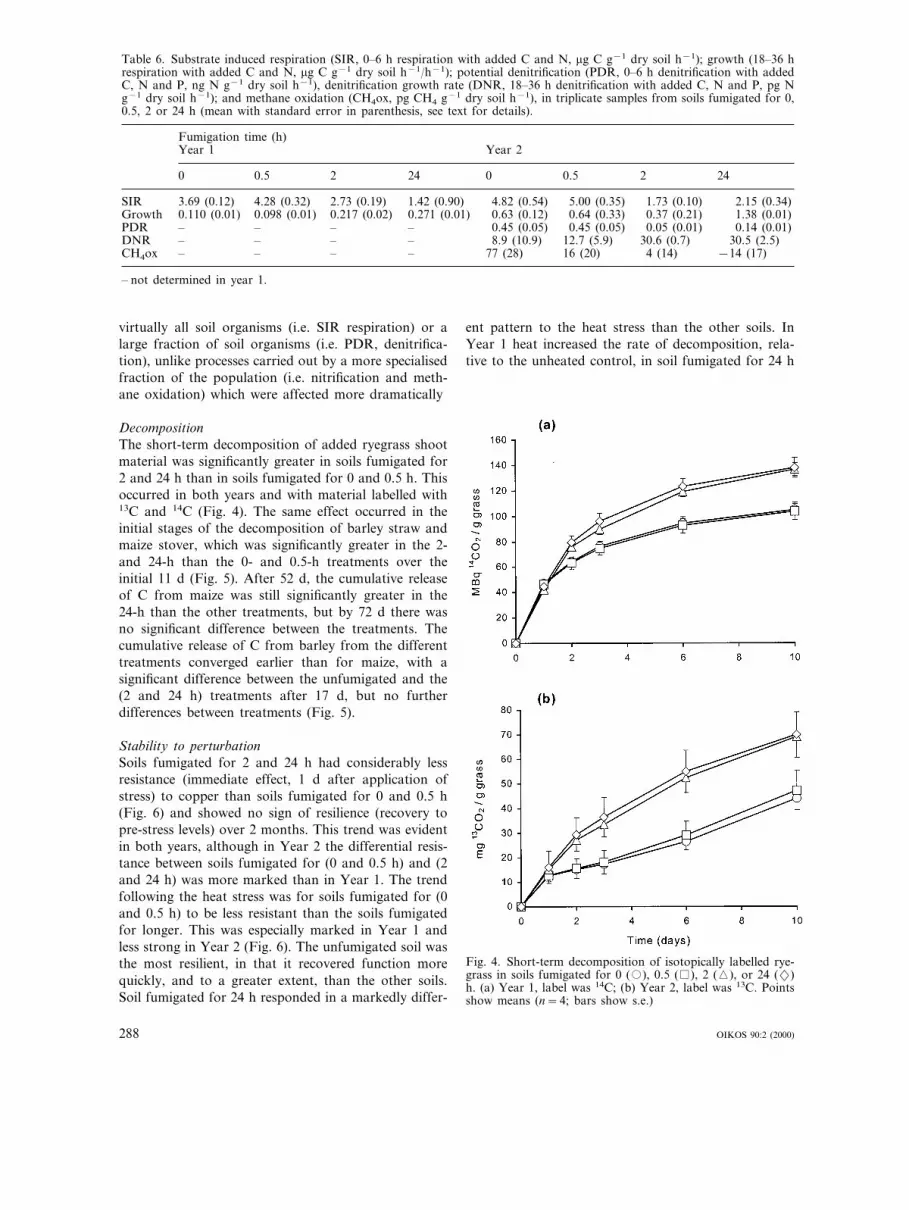
Table 6. Substrate induced respiration (SIR, 0–6 h respiration with added C and N, mg C g−1 dry soil h−1); growth (18–36 hrespiration with added C and N, mg C g−1 dry soil h−1/h−1); potential denitrification (PDR, 0–6 h denitrification with addedC, N and P, ng N g−1 dry soil h−1), denitrification growth rate (DNR, 18–36 h denitrification with added C, N and P, pg Ng−1 dry soil h−1); and methane oxidation (CH4ox, pg CH4 g−1 dry soil h−1), in triplicate samples from soils fumigated for 0,0.5, 2 or 24 h (mean with standard error in parenthesis, see text for details).
Fumigation time (h)Year 1 Year 2
0 0.5 2 24 0 0.5 242
SIR 3.69 (0.12) 4.28 (0.32) 2.73 (0.19) 2.15 (0.34)1.42 (0.90) 4.82 (0.54) 5.00 (0.35) 1.73 (0.10)Growth 0.110 (0.01) 0.098 (0.01) 1.38 (0.01)0.217 (0.02) 0.271 (0.01) 0.63 (0.12) 0.64 (0.33) 0.37 (0.21)PDR – – – 0.14 (0.01)– 0.45 (0.05) 0.45 (0.05) 0.05 (0.01)DNR – – 30.5 (2.5)– – 8.9 (10.9) 12.7 (5.9) 30.6 (0.7)CH4ox – – – −14 (17)– 77 (28) 16 (20) 4 (14)
– not determined in year 1.
virtually all soil organisms (i.e. SIR respiration) or alarge fraction of soil organisms (i.e. PDR, denitrifica-tion), unlike processes carried out by a more specialisedfraction of the population (i.e. nitrification and meth-ane oxidation) which were affected more dramatically
DecompositionThe short-term decomposition of added ryegrass shootmaterial was significantly greater in soils fumigated for2 and 24 h than in soils fumigated for 0 and 0.5 h. Thisoccurred in both years and with material labelled with13C and 14C (Fig. 4). The same effect occurred in theinitial stages of the decomposition of barley straw andmaize stover, which was significantly greater in the 2-and 24-h than the 0- and 0.5-h treatments over theinitial 11 d (Fig. 5). After 52 d, the cumulative releaseof C from maize was still significantly greater in the24-h than the other treatments, but by 72 d there wasno significant difference between the treatments. Thecumulative release of C from barley from the differenttreatments converged earlier than for maize, with asignificant difference between the unfumigated and the(2 and 24 h) treatments after 17 d, but no furtherdifferences between treatments (Fig. 5).
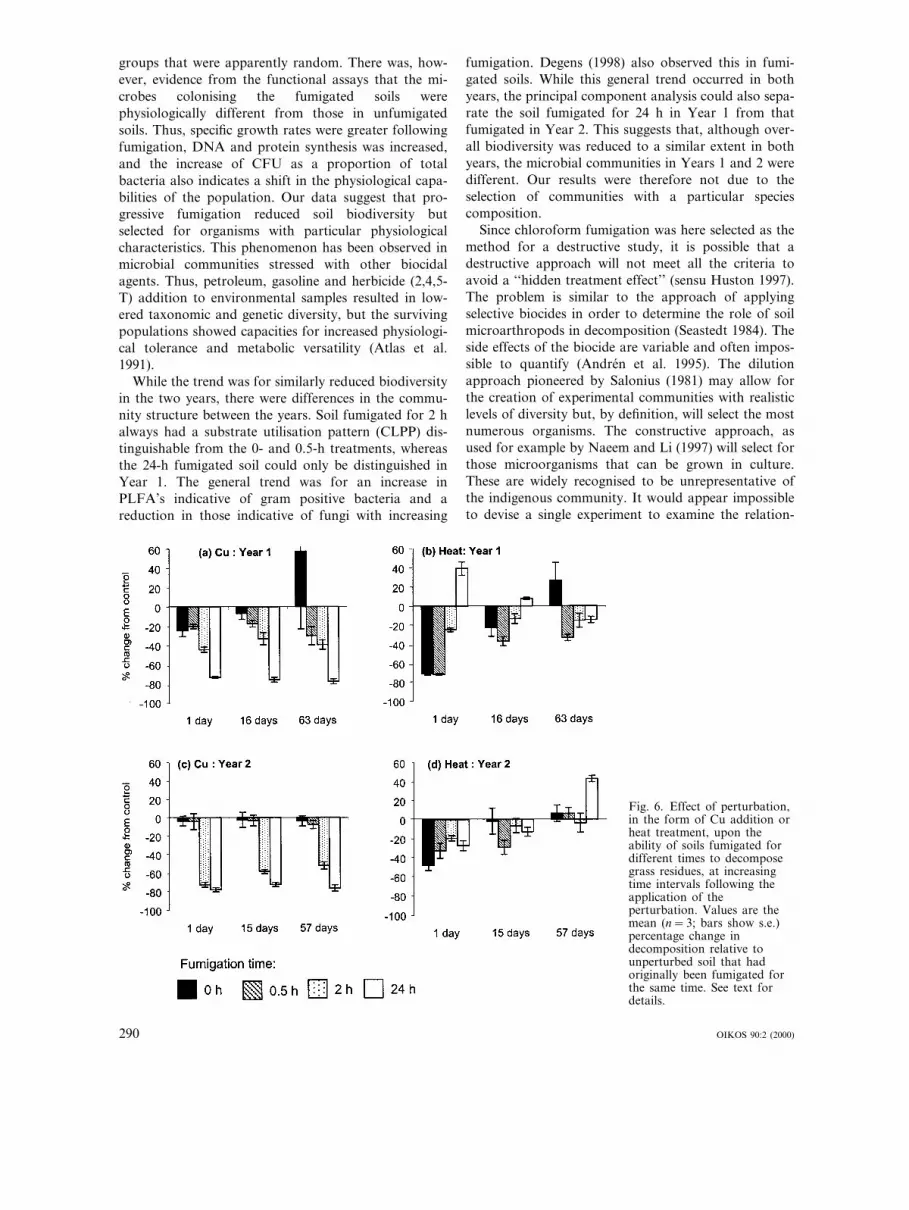
Stability to perturbationSoils fumigated for 2 and 24 h had considerably lessresistance (immediate effect, 1 d after application ofstress) to copper than soils fumigated for 0 and 0.5 h(Fig. 6) and showed no sign of resilience (recovery topre-stress levels) over 2 months. This trend was evidentin both years, although in Year 2 the differential resis-tance between soils fumigated for (0 and 0.5 h) and (2and 24 h) was more marked than in Year 1. The trendfollowing the heat stress was for soils fumigated for (0and 0.5 h) to be less resistant than the soils fumigatedfor longer. This was especially marked in Year 1 andless strong in Year 2 (Fig. 6). The unfumigated soil wasthe most resilient, in that it recovered function morequickly, and to a greater extent, than the other soils.Soil fumigated for 24 h responded in a markedly differ-
ent pattern to the heat stress than the other soils. InYear 1 heat increased the rate of decomposition, rela-tive to the unheated control, in soil fumigated for 24 h
Fig. 4. Short-term decomposition of isotopically labelled rye-grass in soils fumigated for 0 (�), 0.5 ( ), 2 (�), or 24 (2)h. (a) Year 1, label was 14C; (b) Year 2, label was 13C. Pointsshow means (n=4; bars show s.e.)
288 OIKOS 90:2 (2000)
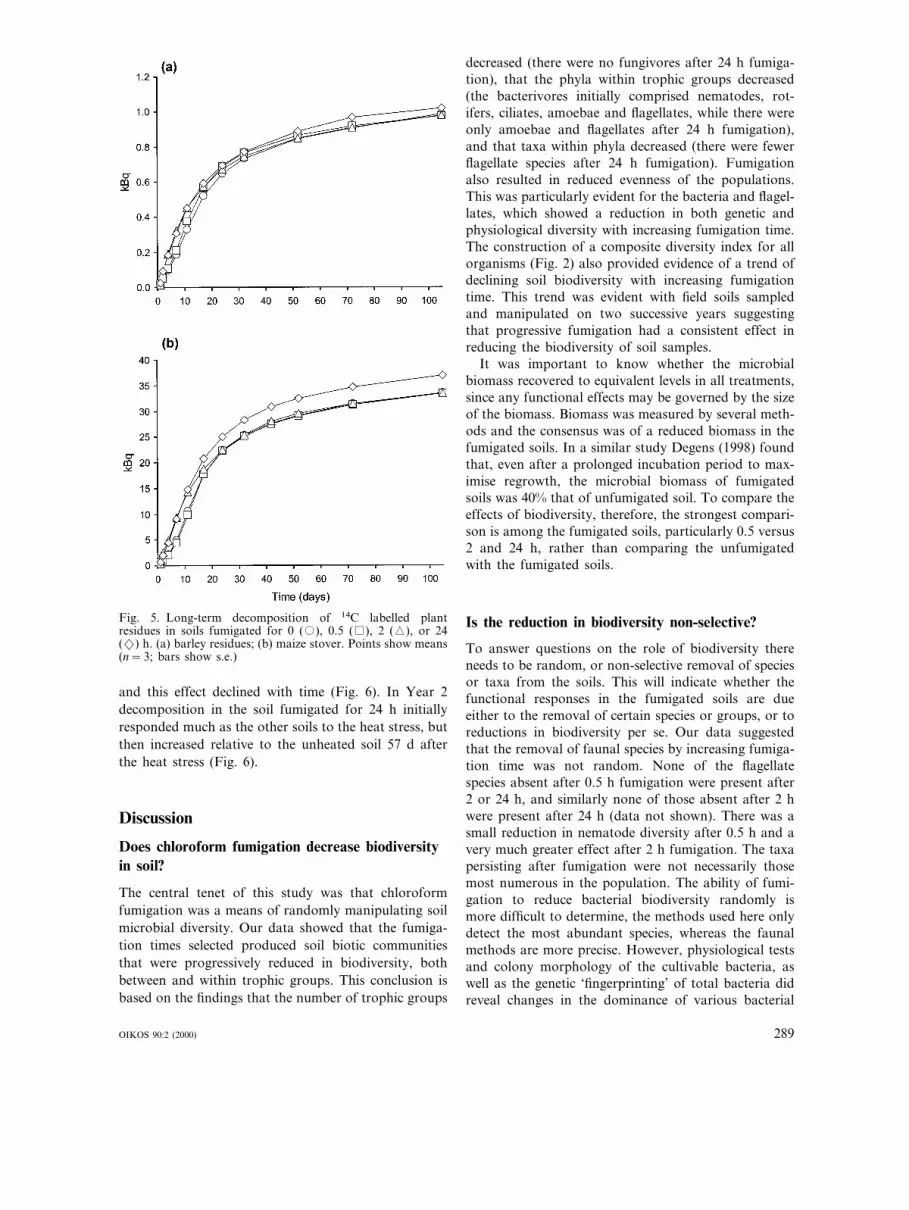
Fig. 5. Long-term decomposition of 14C labelled plantresidues in soils fumigated for 0 (�), 0.5 ( ), 2 (�), or 24(2) h. (a) barley residues; (b) maize stover. Points show means(n=3; bars show s.e.)
decreased (there were no fungivores after 24 h fumiga-tion), that the phyla within trophic groups decreased(the bacterivores initially comprised nematodes, rot-ifers, ciliates, amoebae and flagellates, while there wereonly amoebae and flagellates after 24 h fumigation),and that taxa within phyla decreased (there were fewerflagellate species after 24 h fumigation). Fumigationalso resulted in reduced evenness of the populations.This was particularly evident for the bacteria and flagel-lates, which showed a reduction in both genetic andphysiological diversity with increasing fumigation time.The construction of a composite diversity index for allorganisms (Fig. 2) also provided evidence of a trend ofdeclining soil biodiversity with increasing fumigationtime. This trend was evident with field soils sampledand manipulated on two successive years suggestingthat progressive fumigation had a consistent effect inreducing the biodiversity of soil samples.
It was important to know whether the microbialbiomass recovered to equivalent levels in all treatments,since any functional effects may be governed by the sizeof the biomass. Biomass was measured by several meth-ods and the consensus was of a reduced biomass in thefumigated soils. In a similar study Degens (1998) foundthat, even after a prolonged incubation period to max-imise regrowth, the microbial biomass of fumigatedsoils was 40% that of unfumigated soil. To compare theeffects of biodiversity, therefore, the strongest compari-son is among the fumigated soils, particularly 0.5 versus2 and 24 h, rather than comparing the unfumigatedwith the fumigated soils.
Is the reduction in biodiversity non-selective?
To answer questions on the role of biodiversity thereneeds to be random, or non-selective removal of speciesor taxa from the soils. This will indicate whether thefunctional responses in the fumigated soils are dueeither to the removal of certain species or groups, or toreductions in biodiversity per se. Our data suggestedthat the removal of faunal species by increasing fumiga-tion time was not random. None of the flagellatespecies absent after 0.5 h fumigation were present after2 or 24 h, and similarly none of those absent after 2 hwere present after 24 h (data not shown). There was asmall reduction in nematode diversity after 0.5 h and avery much greater effect after 2 h fumigation. The taxapersisting after fumigation were not necessarily thosemost numerous in the population. The ability of fumi-gation to reduce bacterial biodiversity randomly ismore difficult to determine, the methods used here onlydetect the most abundant species, whereas the faunalmethods are more precise. However, physiological testsand colony morphology of the cultivable bacteria, aswell as the genetic ‘fingerprinting’ of total bacteria didreveal changes in the dominance of various bacterial
and this effect declined with time (Fig. 6). In Year 2decomposition in the soil fumigated for 24 h initiallyresponded much as the other soils to the heat stress, butthen increased relative to the unheated soil 57 d afterthe heat stress (Fig. 6).
Discussion
Does chloroform fumigation decrease biodiversityin soil?
The central tenet of this study was that chloroformfumigation was a means of randomly manipulating soilmicrobial diversity. Our data showed that the fumiga-tion times selected produced soil biotic communitiesthat were progressively reduced in biodiversity, bothbetween and within trophic groups. This conclusion isbased on the findings that the number of trophic groups
OIKOS 90:2 (2000) 289
groups that were apparently random. There was, how-ever, evidence from the functional assays that the mi-crobes colonising the fumigated soils werephysiologically different from those in unfumigatedsoils. Thus, specific growth rates were greater followingfumigation, DNA and protein synthesis was increased,and the increase of CFU as a proportion of totalbacteria also indicates a shift in the physiological capa-bilities of the population. Our data suggest that pro-gressive fumigation reduced soil biodiversity butselected for organisms with particular physiologicalcharacteristics. This phenomenon has been observed inmicrobial communities stressed with other biocidalagents. Thus, petroleum, gasoline and herbicide (2,4,5-T) addition to environmental samples resulted in low-ered taxonomic and genetic diversity, but the survivingpopulations showed capacities for increased physiologi-cal tolerance and metabolic versatility (Atlas et al.1991).
While the trend was for similarly reduced biodiversityin the two years, there were differences in the commu-nity structure between the years. Soil fumigated for 2 halways had a substrate utilisation pattern (CLPP) dis-tinguishable from the 0- and 0.5-h treatments, whereasthe 24-h fumigated soil could only be distinguished inYear 1. The general trend was for an increase inPLFA’s indicative of gram positive bacteria and areduction in those indicative of fungi with increasing
fumigation. Degens (1998) also observed this in fumi-gated soils. While this general trend occurred in bothyears, the principal component analysis could also sepa-rate the soil fumigated for 24 h in Year 1 from thatfumigated in Year 2. This suggests that, although over-all biodiversity was reduced to a similar extent in bothyears, the microbial communities in Years 1 and 2 weredifferent. Our results were therefore not due to theselection of communities with a particular speciescomposition.
Since chloroform fumigation was here selected as themethod for a destructive study, it is possible that adestructive approach will not meet all the criteria toavoid a ‘‘hidden treatment effect’’ (sensu Huston 1997).The problem is similar to the approach of applyingselective biocides in order to determine the role of soilmicroarthropods in decomposition (Seastedt 1984). Theside effects of the biocide are variable and often impos-sible to quantify (Andren et al. 1995). The dilutionapproach pioneered by Salonius (1981) may allow forthe creation of experimental communities with realisticlevels of diversity but, by definition, will select the mostnumerous organisms. The constructive approach, asused for example by Naeem and Li (1997) will select forthose microorganisms that can be grown in culture.These are widely recognised to be unrepresentative ofthe indigenous community. It would appear impossibleto devise a single experiment to examine the relation-
Fig. 6. Effect of perturbation,in the form of Cu addition orheat treatment, upon theability of soils fumigated fordifferent times to decomposegrass residues, at increasingtime intervals following theapplication of theperturbation. Values are themean (n=3; bars show s.e.)percentage change indecomposition relative tounperturbed soil that hadoriginally been fumigated forthe same time. See text fordetails.
290 OIKOS 90:2 (2000)

ship between biodiversity and function in soil commu-nities without including a ‘hidden treatment’. Rather,this relationship should be examined with several differ-ent constructive and destructive approaches to identifytrends associated with altered biodiversity. The fewpublished data from such experiments provide conflict-ing results. Some studies have manipulated the diversityof higher trophic groups whilst maintaining a constantinoculum of decomposer bacteria and fungi (e.g.Naeem et al. 1994, McGrady-Steed et al. 1997, Mikolaand Setala 1998) from which it is difficult to drawconclusions about the effects of microbial biodiversity.Degens (1998) used fumigation to reduce biodiversity(but did not measure it), and found that the effects ofthe assumed reduction in biodiversity were dependentupon the matric potential of the soil. Salonius (1981)reduced microbial biodiversity with a constructive ap-proach, and found that soil respiration was reduced asbiodiversity reduced. More studies need to be under-taken before conclusions about the role of microbialbiodiversity can be made.
Microbial biodiversity–function relationships
In the real world, changes in soil biodiversity will resultfrom a particular stress, which will select for speciesadapted to that stress. For example, in the case ofmicroarthropods, environmental pressures such as fer-tilisation, livestock grazing, seasonal inundation, heavymetals and pesticides, select for species with distinctlife-history tactics (Siepel 1995, Bardgett and Cook1998). Thus, changed soil biodiversity resulting fromthose ‘‘real’’ environmental changes is non-random.Fumigation as practised here is an unrealistically harshselection pressure, or at best is representative of onlythe most drastic of environmental perturbations (i.e.severe fire, prolonged flood, gross contamination), butit does seem that such a harsh pressure is needed tochange soil biodiversity in a measurable and empiricalway. It was evident that well-defined microbial func-tions such as nitrification and methane oxidation, car-ried out by a limited microbial sub-set, were moresensitive to fumigation than general functions such asrespiration and decomposition, or those such as deni-trification, carried out by a wide range of microorgan-isms. This was also seen in soils fumigated with sodiummethyl dithiocarbamate (Toyota et al. 1999), which hada relatively small effect on broad-scale properties, but apronounced effect on nitrification. When a greaternumber of species is able to fulfil a function, there maybe a greater level of redundancy. This has implicationsfor detecting the effects of environmental change onsoil systems, and suggests that specific functionalparameters would be more sensitive indicators thangeneral functional parameters.
The observation that short-term decomposition in-creased in soils with decreasing biodiversity could resultfrom two mechanisms. Intertaxon competition is one ofthe strongest hypotheses to explain the unimodal pro-ductivity–biodiversity relationship (Rosenzweig andAbramsky 1993). But it does not necessarily follow thatbecause competition in areas of high productivity (i.e.addition of substrate) can reduce biodiversity, thatcompetition in areas of high biodiversity can reduceproductivity. However, the productivity of an individ-ual microorganism in a soil aggregate was markedlyreduced if the aggregate was colonised by other mi-crobes (Toyota et al. 1996). In response to environmen-tal stress, microbial communities tend to increase theproportion of carbon respired to that incorporated inthe biomass (Killham 1985). That the fumigated soilsare respiring more per unit biomass might reflect thisphysiological response of the microbial biomass.
The responses of the soils to the two contrastingperturbations were strikingly different. Following theaddition of copper (persistent stress), at levels whichcaused significant shifts in microbial community struc-ture in a mineral soil (Frostegard et al. 1993), there wasa greater reduction in initial decomposition rate in theleast diverse soils than in the most diverse soils (Fig. 6).There was essentially no resilience to this persistentperturbation, as the reduction in function was largelyunchanged over two months following perturbation.Soils given the transient heat stress showed a cleartrend of resilience, with the most diverse soils regainingpre-stress levels of function faster than the least diversesoil. The assessment of resilience with three measure-ments after perturbation can only be approximate, andwe recommend more time points for a more accurateassessment of resilience.
These results are consistent with the hypothesis that,following a transient perturbation, systems can regaintheir original level of function, but that recovery (re-silience) is impaired by a loss of diversity (McNaughton1994). The presence of a persistent perturbation pre-vents resilience; all we could measure here is the resis-tance of the community to that stress. In this case, themost diverse communities were more resistant. In adiverse system there may be removal of redundant orcompensating species without loss of function, whereasin less diverse systems any applied stress which furtherreduces species richness could lead to loss of function.It is also possible that the organisms that selectivelysurvive fumigation are more sensitive to copper thanthe general population. These results are an indicationthat the relationships between biodiversity and soilfunction are not direct, as also shown by Mikola andSetala (1998) for a model soil system. In addition, thegeneral statements that ‘the capacity of ecosystems toresist changing conditions is related positively to speciesnumbers’ and ‘diversity provides insurance against largechanges in ecosystem processes’ (Mooney et al. 1995)holds true for soil microbial systems. Further studies on
OIKOS 90:2 (2000) 291
stability to experimental perturbation are potentially apowerful means of examining the effects ofbiodiversity in soil.
Stress–diversity relationships of soilmicro-organisms
The intermediate-disturbance hypothesis (Connell 1978)suggests that in the comparative absence of compensa-tory mechanisms, species diversity will be highest atintermediate levels of disturbance. We observed more ofa linear decline in biodiversity with disturbance, andcertainly no indication of an increase with the shortestfumigation time. The humpback relationship betweenbiodiversity and stress, predicted by the hypothesis, hasbeen observed within a soil microbial population, be-tween the genetic diversity of Rhizobium and heavy-metalstress (Giller 1998). However, in order for the character-istic relationship to occur, the levels of disturbance mightneed to be a constant feature of the system, such as waveaction (Sousa 1979), whereas our experimental distur-bance was a single event. Also, the effects of disturbanceon biodiversity will be much less clear-cut whenevercompensatory mechanisms are sufficiently potent toensure that stable climax communities exhibit a highdegree of diversity themselves (Begon et al. 1996). Soilmicrobial communities normally have exceptionally highlevels of biodiversity, which might prevent the expectedstress–diversity relationship developing.
Conclusions
We have presented an example where the biodiversity ofa soil microbial community was dramatically reduced butfunctions were generally maintained. This implies thatthere was a high degree of functional redundancy in theoriginal soil community. However, the soils with lowdiversity had lost stability as shown by the strongresponse to, and low recovery from, persistent or tran-sient perturbations.
Acknowledgements – This work was carried out under EUContract ERB ENV4-CT 95 0017: Effect of environmentalchange on the biodiversity and function of belowground mi-crobial communities, as part of the TERI Initiative. BryanGriffiths and Karl Ritz acknowledge the Scottish ExecutiveRural Affairs Department for grant-in-aid. Flemming Ekelundwas supported by a grant from the Danish Strategic Environ-mental Research Initiative 1998–2001, and thanks KammaWestergaard for skilful technical assistance. Helpful commentsby S. Naeem are gratefully acknowledged.
ReferencesAnderson, J. P. E. and Domsch, K. H. 1978. A physiological
method for the quantitative measurement of microbialbiomass in soils. – Soil Biol. Biochem. 10: 215–222.
Andren, O., Bengtsson, J. and Clarholm, M. 1995. Biodiversityand species redundancy among litter decomposers. – In:Collins, H. P., Robertson, G. P. and Klug, M. J. (eds), Thesignificance and regulation of soil biodiversity. Kluwer, pp.141–151.
Atlas, R. M., Horowitz, A., Krichevsky, M. and Bej, A. K. 1991.Response of microbial populations to environmental distur-bance. – Microb. Ecol. 22: 249–256.
Bakken, L. R. 1985. Separation and purification of bacteriafrom soil. – Appl. Environ. Microbiol. 49: 1482–1487.
Barcelona, M. J. 1984. TOC determinations in ground water.– Ground Water 22: 18–24.
Bardgett, R. D. and Cook, R. 1998. Functional aspects of soilanimal diversity in agricultural grasslands. – Appl. Soil Ecol.10: 263–276.
Bardgett, R. D. and Shine, A. 1999. Linkages between plantlitter diversity, soil microbial biomass and ecosystem func-tion in temperate grasslands. – Soil Biol. Biochem. 31:317–321.
Beare, M. H., Coleman, D. C., Crossley, D. A. et al. 1995. Ahierarchical approach to evaluating the significance of soilbiodiversity to biogeochemical cycling. – Plant Soil 170:5–12.
Begon, M., Mortimer, M. and Thompson, D. J. 1996. Popula-tion ecology, 3rd ed. – Blackwell Science.
Bloem, J., Bolhuis, P. R., Veninga, M. R. and Wieringa, J.1995a. Microscopic methods for counting bacteria and fungiin soil. – In: Alef, K. and Nannipieri, P. (eds), Methods inapplied soil microbiology and biochemistry. Academic Press,pp. 162–173.
Bloem, J., Veninga, M. and Shepherd, J. 1995b. Fully automaticdetermination of soil bacterium numbers, cell volumes andfrequencies of dividing cells by confocal laser scanningmicroscopy and image analysis. – Appl. Environ. Microbiol.61: 926–936.
Chapin, F. S. III., Walker, B. H., Hobbs, R. J. et al. 1997. Bioticcontrol over the functioning of ecosystems. – Science 277:500–504.
Chaussod, R., Houot, S., Guiraud, G. and Hetier, J. M. 1988.Size and turnover of the microbial biomass in agriculturalsoils: laboratory and field measurements. – In: Jenkinson,D. S. and Smith, K. A. (eds), Nitrogen in agricultural soils.Elsevier, pp. 312–326.
Christensen, S., Rønn, R., Ekelund, F. et al. 1996. Soil respira-tion profiles and protozoan enumeration agree as microbialgrowth indicators. – Soil Biol. Biochem. 28: 865–868.
Connell, J. H. 1978. Diversity in tropical rainforests and coralreefs. – Science 199: 1302–1310.
Contrepas, M. P. and Gaudilliere, J. P. 1987. Efficacite de lacroissance de ble lors du passage a l’autotrophie. – PlantPhysiol. Biochem. 25: 35–42.
Darbyshire, J. F., Wheatley, R. E., Greaves, M. P. and Inkson,R. H. E. 1974. A rapid micromethod for estimating bacterialand protozoan populations in soil. – Rev. Ecol. Biol. Sol 11:465–475.
Darbyshire, J. F., Griffiths, B. S., Davidson, M. S. andMcHardy, W. J. 1989. Ciliate distribution amongst soilaggregates. – Rev. Ecol. Biol. Sol 26: 47–56.
Degens, B. P. 1998. Decreases in microbial functional diversitydo not result in corresponding changes in decompositionunder different moisture conditions. – Soil Biol. Biochem.30: 1989–2000.
Faegri, A., Torsvik, V. L. and Goksoyr, J. 1977. Bacterial andfungal activities in soil; separation of bacteria and fungi bya rapid fractionated centrifugation technique. – Soil Biol.Biochem. 9: 105–112.
Finlay, B. J., Maberly, S. C. and Cooper, J. I. 1997. Microbialdiversity and ecosystem function. – Oikos 80: 209–213.
Frostegard, A, ., Tunlid, A. and Baath, E. 1993. Phospholipidfatty acid composition, biomass and activity of microbialcommunities from two soil types experimentally exposed todifferent heavy metals. – Appl. Environ. Microbiol. 59:3605–3617.
292 OIKOS 90:2 (2000)
Garland, J. L. 1997. Analysis and interpretation of commu-nity-level physiological profiles in microbial ecology. –FEMS Microbiol. Ecol. 24: 289–300.
Garland, J. L. and Mills, A. L. 1991. Classification andcharacterization of heterotrophic microbial communitieson the basis of patterns of community-level sole-carbon-source utilization. – Appl. Environ. Microbiol. 57: 2351–2359.
Giller, K. E. 1998. Toxicity of heavy metals to microorganismsand microbial processes in agricultural soils: a review. –Soil Biol. Biochem. 30: 1389–1414.
Griffiths, B. S., Ritz, K. and Wheatley, R. E. 1997. Relation-ship between functional diversity and genetic diversity incomplex microbial communities. – In: Insam, H. andRangger, A. (eds), Microbial communities, functional ver-sus structural approaches. Springer-Verlag, pp. 1–9.
Grime, J. P. 1997. Biodiversity and ecosystem function: thedebate deepens. – Science 277: 1260–1261.
Haack, S. K., Garchow, H., Odelson, D. A. et al. 1994.Accuracy, reproducibility, and interpretation of fatty acidmethyl ester profiles of model bacterial communities. –Appl. Environ. Microbiol. 60: 2483–2493.
Hackett, C. A. and Griffiths, B. S. 1997. Statistical analysis ofthe time-course of Biolog substrate utilization. – J. Micro-biol Meth. 30: 63–69.
Heal, O. W., Anderson, J. M. and Swift, M. J. 1997. Plantlitter quality and decomposition: an historical overview. –In: Cadisch, G. and Giller, K. E. (eds), Driven by Nature.CAB International, Wallingford, UK, pp. 3–30.
Hodge, A., Stewart, J., Robinson, D. et al. 1998. Root prolif-eration, soil fauna and plant nitrogen capture from nutri-ent-rich patches in soil. – New Phytol. 139: 479–494.
Hooper, D. U. and Vitousek, P. M. 1997. The effects of plantcomposition and diversity on ecosystem processes. – Sci-ence 277: 1302–1305.
Hopkins, D. W., MacNaughton, S. J. and O’Donnell, A. G.1993. A dispersal and differential centrifugation techniquefor representatively sampling micro-organisms from soil. –Soil Biol. Biochem. 23: 217–225.
Huston, M. A. 1997. Hidden treatments in ecological experi-ments: re-evaluating the ecosystem function of biodiversity.– Oecologia 110: 449–460.
Ingham, E. R. and Horton, K. A. 1987. Bacterial, fungal andprotozoan responses to chloroform fumigation in storedsoil. – Soil Biol. Biochem. 19: 545–550.
Jenkinson, D. S. and Powlson, D. S. 1976. The effects ofbiocidal treatment on metabolism in soil. V. A method formeasuring soil biomass. – Soil Biol. Biochem. 8: 209–213.
Killham, K. 1985. A physiological determination of the impactof environmental stress on the activity of microbialbiomass. – Environ. Pollut. Ser. A 38: 282–294.
Lawton, J. H. 1994. What do species do in ecosystems? –Oikos 71: 367–374.
Lespinat, P. A., Hetier, J. M., Thomann, C. and Chone, T.1976. Utilisation de maısmur uniformement marque au14C pour l’etude de la matiere organique de trois sols(Andosol, sol brun, sol ferrallitique). – Bull. Assoc. Fr. Sci.Sol 1: 53–66.
McGrady-Steed, J., Harris, P. M. and Morin, P. J. 1997.Biodiversity regulates ecosystem predictability. – Nature390: 162–165.
McNaughton, S. J. 1994. Biodiversity and function of grazingecosystems. – In: Schulze, E. D. and Mooney, H. A. (eds).Biodiversity and ecosystem function. Springer-Verlag, pp.361–383.
Michel, P. H. and Bloem, J. 1993. Conversion factors forestimation of cell production rates of soil bacteria fromthymidine and leucine incorporation. – Soil Biol. Biochem.25: 943–950.
Mikola, J. and Setala, H. 1998. Relating species diversity toecosystem functioning: mechanistic backgrounds and ex-perimental approach with a decomposer food web. –Oikos 83: 180–194.
Mooney, H. A., Lubchenco, J., Dirzo, R. and Sala, O. E.1995, Biodiversity and ecosystem functioning: basic princi-ples. – In: Heywood, V. H. and Watson, R. T. (eds),Global biodiversity assessment. Cambridge Univ. Press,pp. 275–325.
Muyzer, G., De Wall, E. C. and Uitterlinden, A. G. 1993.Profiling complex microbial populations by denaturing gra-dient gel electrophoresis analysis of polymerase chain reac-tion-amplified genes encoding for 16S rRNA. – Appl.Environ. Microbiol. 59: 695–700.
Naeem, S. and Li, S. 1997. Biodiversity enhances ecosystemreliability. – Nature 390: 507–509.
Naeem, S., Thompson, L. J., Lawler, S. P. et al. 1994. Declin-ing biodiversity can alter the performance of ecosystems. –Nature 368: 737–743.
Nicolardot, B., Chaussod, R. and Catroux, G. 1984. Decom-position de corps microbiens dans des sols fumiges auchloroform: effects du type de sol et de microorganisme. –Soil Biol. Biochem. 16: 453–458.
Øvreas, L. and Torsvik, V. 1998. Microbial diversity andcommunity structure in two different agricultural soil com-munities. – Microb. Ecol. 36: 303–315.
Page F. C. 1988. A new key to freshwater and soil gymnamoe-bae. – Freshwater Biological Association, Ambleside, UK.
Paterson, E., Rattray, E. A. S. and Killham, K. 1996. Effect ofelevated atmospheric CO2 concentration on C-partitioningand rhizosphere C-flow for 3 plant species. – Soil Biol.Biochem. 28: 195–201.
Pedersen, J. C. 1992. Natamycin as a fungicide in agar media.– Appl. Environ. Microbiol. 58: 1064–1066.
Ritz, K., Wheatley, R. E. and Griffiths, B. S. 1997. Effects ofanimal manure application and crop plants upon size andactivity of soil microbial biomass under organically grownspring barley. – Biol. Fertil. Soils 24: 372–377.
Rønn, R., Ekelund, F. and Christensen, S. 1995. Optimisingsoil extract and broth media for MPN-enumeration ofnaked amoebae and heterotrophic flagellates in soil. –Pedobiologia 39: 10–19.
Rosenzweig, M. L. and Abramsky, Z. 1993. How are diversityand productivity related? – In: Ricklefs, R. E. andScuhlter, D. (eds), Species diversity in ecological communi-ties: historical and geographic perspectives. Univ. ofChicago Press, pp. 52–65.
Salonius, P. O. 1981. Metabolic capabilities of forest soilmicrobial populations with reduced species diversity. – SoilBiol. Biochem. 13: 1–10.
Sambrook, J., Fritsch, E. F. and Maniatis, T. 1989. Molecularcloning: a laboratory manual. 2nd ed. – Cold SpringHarbor Laboratory Press, Cold Spring Harbor, NY.
Seastedt, T. R. 1984. The role of microarthropods in decom-position and mineralization processes. – Annu. Rev. Ento-mol. 29: 25–46.
Siepel, H. 1995. Applications of microarthropod life-historytactics in nature management and ecotoxicology. – Biol.Fertil. Soils 19: 75–83.
Smith, M. S. and Tiedje, J. M. 1979. The effect of roots on soildenitrification. – Soil Sci. Soc. Am. J. 43: 951–955.
Sousa, W. P. 1979. Disturbance in marine intertidal boulderfields: the non-equilibrium maintenance of species diver-sity. – Ecology 60: 1225–1239.
Stotsky, G. and Norman, A. G. 1961. Factors limiting micro-bial activities in soil. I. The level of substrate, nitrogen andphosphorus. – Arch. Mikrobiol. 40: 341–369.
Tiedje, J. M. 1994. Denitrifiers. – In: Mickelson, S. H. (man-aging ed.), Methods of soil analysis. Part 2 Microbiologicaland biochemical properties. Soil Science Society of Amer-ica, Madison, WI, pp. 245–267.
Tilman, D. A. and Downing, J. A. 1994. Biodiversity andstability in grasslands. – Nature 376: 363–365.
Tilman, D. A., Wedin, D. and Knops, J. 1996. Productivityand sustainability influenced by biodiversity in grasslandecosystems. – Nature 379: 718–720.
Tilman, D. A., Knops, J., Wedin, D. et al. 1997. The influenceof functional diversity and composition of ecosystem pro-cesses. – Science 277: 1300–1302.
OIKOS 90:2 (2000) 293
Torsvik, V. L., Goksoyr, J. and Daae, F. L. 1990. Highdiversity in soil bacteria. – Appl. Environ. Microbiol. 56:782–787.
Toyota, K., Ritz, K. and Young, I. M. 1996. Microbiologicalfactors affecting the colonisation of soil aggregates byFusarium oxysporum f. sp. raphani. – Soil Biol. Biochem.28: 1513–1521.
Toyota, K., Ritz, K., Kuninaga, S. and Kimura, M. 1999.Impact of fumigation with metam sodium upon soil micro-bial community structure in two Japanese soils. – Soil Sci.Plant Nutr. 45: 207–223.
Vance, E. D., Brookes, P. C. and Jenkinson, D. S. 1987. Anextraction method for measuring soil microbial biomass C.– Soil Biol. Biochem. 19: 703–707.
Van der Heijden, M. G. A., Klironomas, J. N., Ursic, M. et al.1998. Mycorrhizal fungal diversity determines plant biodi-versity, ecosystem variability and productivity. – Nature396: 69–72.
Van Elsas, J. D. and Smalla, K. 1995. Extraction of microbialcommunity DNA from soils. – In: Akkermans, A. D. L.,van Elsas, J. D. and de Bruijn, F. J. (eds), Molecularmicrobial ecology manual. Kluwer, pp. 1.3.3.1–1.3.3.11.
Wagner, M., Amman, R., Lemmer, H. and Schleifer, K.-H.1993. Probing activated sludge with oligonucleotides spe-cific for proteobacteria: inadequacy of culture-dependentmethods for describing microbial community structure. –Appl. Environ. Microbiol. 59: 1520–1525.
Ward, D. M., Weller, R. and Bateson, M. M. 1990. 16S rRNAsequences reveal numerous uncultured inhabitants in anatural community. – Nature 345: 63–65.
Wardle, D. A. 1999. Biodiversity, ecosystem and interactionsthat transcend the interface. – Trends Ecol. Evol. 14:125–127.
Wardle, D. A. and Giller, K. E. 1997. The quest for acontemporary ecological dimension to soil biology. – SoilBiol. Biochem. 28: 1549–1554.
Wardle, D. A., Zackrisson, O., Hornberg, G. and Gallet, C.1997. The influence of island area on ecosystem properties.– Science 277: 1296–1299.
Wardle, D. A., Bonner, K. L., Barker, G. M. et al. 1999. Plantremoval in perennial grassland: vegetation dynamics, de-composers, soil biodiversity, and ecosystem properties. –Ecol. Monogr. 69: 535–568.
Weller, R., Weller, J. W. and Ward, D. M. 1991. 16S rRNAsequences of uncultivated hot spring cyanobacterial matinhabitants retrieved as randomly primed cDNA. – Appl.Environ. Microbiol. 57: 1146–1151.
Wheatley, R. E., MacDonald, R. and Smith, A. M. 1989.Extraction of nitrogen from soils. – Biol. Fertil. Soils 8:189–190.
Whitehead, A. G. and Hemming, J. R. 1965. A comparison ofsome quantitative methods of extracting small vermiformnematodes from soil. – Ann. Appl. Biol. 55: 25–38.
Yeates, G. W., Bongers, T., de Goede, R. G. M. et al. 1993.Feeding habits in soil nematode families and genera – anoutline for soil ecologists. – J. Nematol. 25: 315–331.
Yeates, G. W., Bardgett, R. D., Cook, R. et al. 1997. Faunaland microbial diversity in three Welsh grassland soilsunder conventional and organic management regimes. – J.Appl. Ecol. 34: 453–470.
294 OIKOS 90:2 (2000)
.
Related Documents