Economic and steel market outlook 2021-2022 ECONOMIC REPORT Second quarter 2021 report Data up to, and including, fourth quarter 2020 May 2021

Welcome message from author
This document is posted to help you gain knowledge. Please leave a comment to let me know what you think about it! Share it to your friends and learn new things together.
Transcript
Economic and steel market outlook 2021-2022
E C O N O M I C R E P O R T
Second quarter 2021 reportData up to, and including, fourth quarter 2020
May 2021
2E U R O F E R E C O N O M I C R E P O R TE C O N O M I C A N D S T E E L M A R K E T O U T L O O K 2 0 2 1 - 2 0 2 2
S E C O N D Q U A R T E R R E P O R T
IntroductionIn 2020, the COVID-19 pandemic caused steel consumption to collapse and shattered the overall economic outlook across both the EU and the world. Shutdown measures, implemented by governments from March 2020, severely impacted manufacturing activity and steel-using industrial sectors.
However, some of the measures that had the greatest impact on the economy were loosened as of June 2020, though many social measures remain in effect or have been reinforced in recent months. As a result, both steel-using sectoral output and steel demand experienced a considerable quarter-on-quarter rebound over the third and fourth quarters.
Although the general economic recovery in the EU appears to be uneven and exposed to risks, the recovery in steel-using industries and in steel demand should continue through 2021.
EU steel market overviewThe whole year 2020 was, as expected, considerably impacted by the pandemic and saw apparent steel consumption in the EU plummet (-11.1%). It is set to rebound (+11.7%) in 2021, and to grow more moderately (+4.9%) in 2022, when it is expected to return above 2017 levels thanks to continued improvement in demand from steel-using sectors.
EU28 apparent steel consumption increased (+3.3%) year-on-year in the fourth quarter of 2020. This is the first quarterly growth since the fourth quarter of 2019, after the drop (-10.4%) recorded over the third quarter (that followed the unprecedented drop (-25%) in the second quarter). Apparent steel consumption in the fourth quarter amounted to 35.2 million tonnes.
Mirroring the improvement in demand, EU domestic deliveries in the in the fourth quarter of 2020 increased (+4.5%, after -6.8% recorded in the previous quarter). However, overall domestic deliveries fell (-9.7) over the full year.
Data for the fourth quarter also showed the continued downturn in imports from third countries. After the severe drop (-25%) in the third quarter of 2020, imports from third countries dropped – albeit less severely - also in the fourth quarter of 2020, with a year-on-year fall (-7%), that is the eighth consecutive quarterly drop.
EU steel-using sectorsTotal production activity in steel-using sectors fell (-10.4%) over the full year 2020.
The second quarter saw a sharp fall in steel-using industrial output (-25%), linked to industrial stoppages caused by the COVID pandemic. The third quarter also saw a decline (-6.7%) as did the fourth quarter (-1.9%). This is the fifth consecutive quarterly decline.
The COVID-19 outbreak further hit EU industrial sectors at a time when these had already been experiencing a severe downturn and were coping with serious challenges. Over the course of 2019, business conditions in the manufacturing industry had continued to deteriorate.
This downward trend gained speed in the second half of 2019, particularly in the automotive industry. This resulted in a pronounced slowdown in output growth in steel-using sectors, which then culminated in unprecedented drops over the second quarter 2020, mainly as a result of the severe lockdown measures imposed by governments in March and April 2020.
The second quarter marked the trough of the industrial recession. The loosening of lockdown measures over the third quarter allowed industrial activity to restart, with a considerable rebound in output compared to the record

3E U R O F E R E C O N O M I C R E P O R TE C O N O M I C A N D S T E E L M A R K E T O U T L O O K 2 0 2 1 - 2 0 2 2
S E C O N D Q U A R T E R R E P O R T
lows seen in the preceding quarter. However, industrial activity remained around low levels in historical terms and still exposed to fragility and risks. As a result, despite the quarter-on-quarter rebound, output fell year-on-year (-6.7%) in the third quarter.
The fresh wave of the pandemic that hit Europe at the start of the fourth quarter 2020 led to new lockdowns (albeit without affecting industrial activity per se) which cast a shadow on the overall recovery. As a result, however, in the fourth quarter of 2020 industrial output all over the EU recorded a considerable second consecutive quarter-on-quarter rebound, driven by faster-than-expected recovery in output in some sectors (domestic appliances and automotive in particular).
Steel-using sectors’ output growth over the fourth quarter was still negative (-1.9%), i.e. the fifth consecutive quarterly drop, but at a much lower rate than the third quarter (-6.7%). This could pave the way for a stronger acceleration in industrial recovery over the first quarter of 2021, despite persistent economic uncertainty due the ongoing pandemic across the EU.

Table of contents
Economic and steel market outlook 2021-20222 Introduction2 EU steel market overview2 EU steel-using sectors4 Table of contents5 The EU steel market: supply5 Real steel consumption5 Apparent steel consumption7 Imports8 Exports10 The EU steel market: final use10 Outlook for steel-using sectors11 Construction industry11 Automotive industry12 Mechanical engineering13 Steel tube industry13 Electrical domestic appliances industry15 EU Economic outlook 2020-202115 GDP growth16 Confidence indicators18 Economic fundamentals20 Glossary of terms21 EU steel market definitions22 About the European Steel Association (EUROFER)22 About the European steel industry

5E U R O F E R E C O N O M I C R E P O R TE C O N O M I C A N D S T E E L M A R K E T O U T L O O K 2 0 2 1 - 2 0 2 2
S E C O N D Q U A R T E R R E P O R T
The supply-side of the EU steel market analyses factors affecting domestic and foreign supply, as well as stock effects in the distribution chain and at the end-user level.
Real steel consumptionDefinition
Real consumption is the use of all steel products used by steel-using sectors in their production processes, also referred to as the ‘final use’ of steel products, adjusted for the stock cycle.
Real steel consumption in 2020
Real steel consumption fell year-on-year in the second quarter (-21.5%), in the third quarter (-8.9%) and in the fourth quarter (-2.6%) of 2020. Volume for the fourth quarter was 36.3 million tonnes.
Over the entire year 2020, real consumption fell (-10.3%) compared to 2019. This was the second consecutive yearly drop after the fall recorded in 2019 (-2.9%). Real steel consumption is expected to recover in 2021 (+7.7%) and in 2022 (+4%).
These declines were caused by the pronounced slowdown in the activity of steel-using sectors due to the COVID crisis and related effects. A counter-cyclical destocking trend from late 2019 continued into the first half of 2020. Normally, stocks increase in the first half of the year, but the opposite occurred in 2020.
Apparent steel consumptionDefinition
Apparent consumption is also referred to as ‘steel demand’. It is total deliveries of all steel products and qualities by EU producers plus imports less 'receipts' into the EU, minus exports to third countries.
In other words, apparent consumption is deliveries by EU producers plus imports minus receipts (that is, imports by EU producers themselves of material that is further processed), minus exports to third countries.
The EU steel market: supply
FORECAST FOR EU APPARENT STEEL CONSUMPTION - % CHANGE YEAR-ON-YEAR
Period Year 2020 Q1’21 Q2’21 Q3’21 Q4’21 Year 2021 Q1’22 Q2’22 Q3’22 Q4’22 Year 2022
% change -10.3 1.4 20.6 6. 3.7 7.7 -0.3 9.5 3.8 2.9 4.0
EU REAL STEEL CONSUMPTIONForecast from Q1-2021

6E U R O F E R E C O N O M I C R E P O R TE C O N O M I C A N D S T E E L M A R K E T O U T L O O K 2 0 2 1 - 2 0 2 2
S E C O N D Q U A R T E R R E P O R T
EUROFER’s definition of apparent consumption includes all qualities, including stainless, and all finished products and semi-finished products.
If apparent consumption exceeds real steel consumption, the surplus is stocked in the distribution chain. If apparent consumption is less than real steel consumption, inventories are being withdrawn.
Apparent steel consumption in 2020
The whole year 2020 was, as expected, considerably impacted by the pandemic and saw apparent steel consumption in the EU plummet (-11.1%). It is set to rebound (+11.7%) in 2021, and to grow more moderately (+4.9%) in 2022, when it is expected to return above 2017 levels thanks to continued improvement in demand from steel-using sectors.
There were exceptional quarterly falls in the second quarter (-24.4%), continuing in the third quarter (-10.4%) despite the loosening of some lockdown constraints. The fourth quarter registered growth in apparent consumption (+3.3%), the first quarterly growth in apparent consumption since the fourth quarter of 2018. Total volumes in the fourth quarter were 35.2 million tonnes.
Apparent steel consumption has been weak since at least the middle of 2019, thus the COVID outbreak only compounded existing woes. The most extreme falls in demand coincided with the strictest periods of lockdown which hindered most industrial output. With economic measures gradually loosening, growth is returning, though apparently steel demand is still well below levels seen in 2018.
EU domestic and foreign supply
EU domestic deliveries fell (-9.7%) in 2020. In 2019 they also fell (-4.2%). 2020 was the second consecutive yearly decline. Domestic deliveries by EU steel suppliers increased year-on-year in the fourth quarter of 2020 (+4.5%), after eight consecutive quarterly drops, reflecting the improvement in demand within the EU.
Imports – including semi-finished products – into the EU fell year-on-year in the third quarter (-25.4%) and again in the fourth quarter (-6%). This was the result of extremely weak steel demand in the EU, coupled with the effect of the EU steel safeguard measures.
EU APPARENT STEEL CONSUMPTION - IN MILLION TONNES PER YEAR
Year 2013 2014 2015 2016 2017 2018 2019 2020 2021 (f) 2022 (f)
Million tonnes 141 146 152 156 158 162 154 136 152 160
FORECAST FOR EU APPARENT STEEL CONSUMPTION - % CHANGE YEAR-ON-YEAR
Period Year 2020 Q1’21 Q2’21 Q3’21 Q4’21 Year 2021 Q1’22 Q2’22 Q3’22 Q4’22 Year 2022
% change -11.1 4.9 37.5 7.7 0.8 11.7 2.3 9.9 4.2 2.8 4.9
EU APPARENT STEEL CONSUMPTIONForecast from Q1-2021
7E U R O F E R E C O N O M I C R E P O R TE C O N O M I C A N D S T E E L M A R K E T O U T L O O K 2 0 2 1 - 2 0 2 2
S E C O N D Q U A R T E R R E P O R T
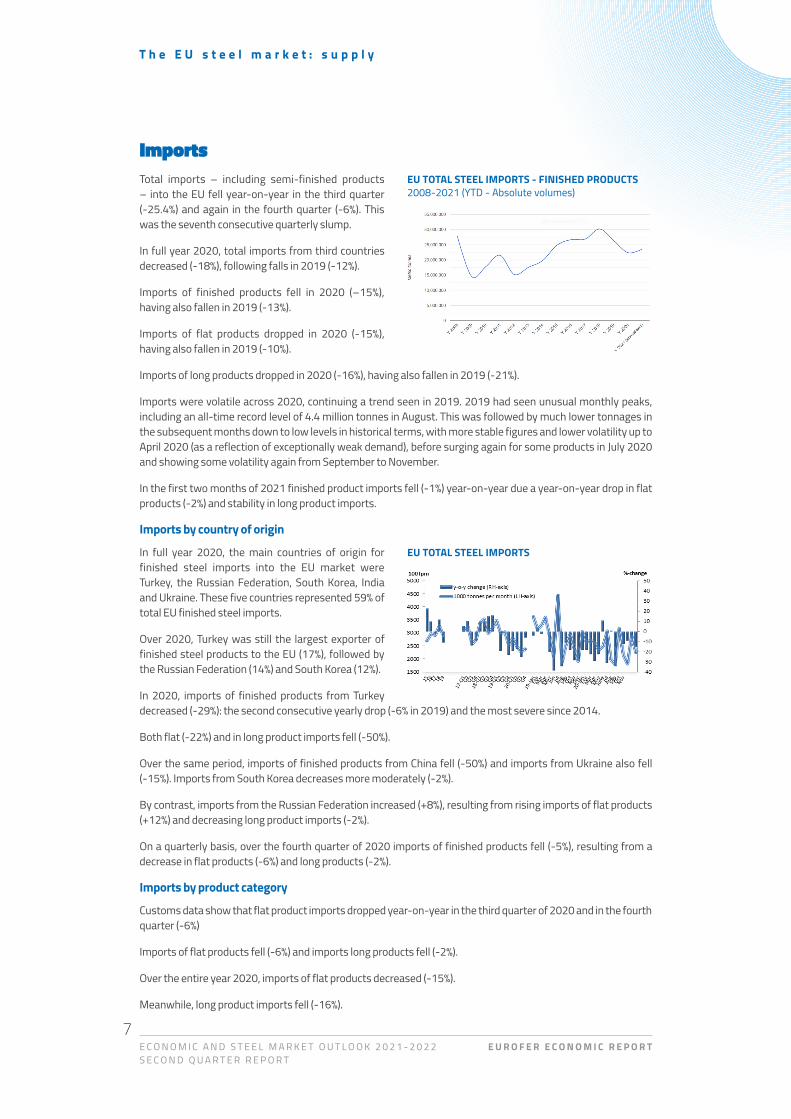
ImportsTotal imports – including semi-finished products – into the EU fell year-on-year in the third quarter (-25.4%) and again in the fourth quarter (-6%). This was the seventh consecutive quarterly slump.
In full year 2020, total imports from third countries decreased (-18%), following falls in 2019 (-12%).
Imports of finished products fell in 2020 (–15%), having also fallen in 2019 (-13%).
Imports of flat products dropped in 2020 (-15%), having also fallen in 2019 (-10%).
Imports of long products dropped in 2020 (-16%), having also fallen in 2019 (-21%).
Imports were volatile across 2020, continuing a trend seen in 2019. 2019 had seen unusual monthly peaks, including an all-time record level of 4.4 million tonnes in August. This was followed by much lower tonnages in the subsequent months down to low levels in historical terms, with more stable figures and lower volatility up to April 2020 (as a reflection of exceptionally weak demand), before surging again for some products in July 2020 and showing some volatility again from September to November.
In the first two months of 2021 finished product imports fell (-1%) year-on-year due a year-on-year drop in flat products (-2%) and stability in long product imports.
Imports by country of origin
In full year 2020, the main countries of origin for finished steel imports into the EU market were Turkey, the Russian Federation, South Korea, India and Ukraine. These five countries represented 59% of total EU finished steel imports.
Over 2020, Turkey was still the largest exporter of finished steel products to the EU (17%), followed by the Russian Federation (14%) and South Korea (12%).
In 2020, imports of finished products from Turkey decreased (-29%): the second consecutive yearly drop (-6% in 2019) and the most severe since 2014.
Both flat (-22%) and in long product imports fell (-50%).
Over the same period, imports of finished products from China fell (-50%) and imports from Ukraine also fell (-15%). Imports from South Korea decreases more moderately (-2%).
By contrast, imports from the Russian Federation increased (+8%), resulting from rising imports of flat products (+12%) and decreasing long product imports (-2%).
On a quarterly basis, over the fourth quarter of 2020 imports of finished products fell (-5%), resulting from a decrease in flat products (-6%) and long products (-2%).
Imports by product category
Customs data show that flat product imports dropped year-on-year in the third quarter of 2020 and in the fourth quarter (-6%)
Imports of flat products fell (-6%) and imports long products fell (-2%).
Over the entire year 2020, imports of flat products decreased (-15%).
Meanwhile, long product imports fell (-16%).
T h e E U s t e e l m a r k e t : s u p p l y
EU TOTAL STEEL IMPORTS
EU TOTAL STEEL IMPORTS - FINISHED PRODUCTS 2008-2021 (YTD - Absolute volumes)
8E U R O F E R E C O N O M I C R E P O R TE C O N O M I C A N D S T E E L M A R K E T O U T L O O K 2 0 2 1 - 2 0 2 2
S E C O N D Q U A R T E R R E P O R T
The share of long products out of total finished steel product imports was 23%.
Within the flat product market segment, imports of cold rolled sheet decreased (-20%) in full year 2020, as did imports of strip mill products (-17%) and hot-rolled wide (-20%). Imports of coated sheets and hot-dipped galvanised sheets also fell (both by -13%). Imports of quarto plate (-3%).
All long product imports were lower in 2020 compared to 2019: Rebars (-36%) heavy sections (-27%), merchant bars (-9%) and wire rod (-5%).
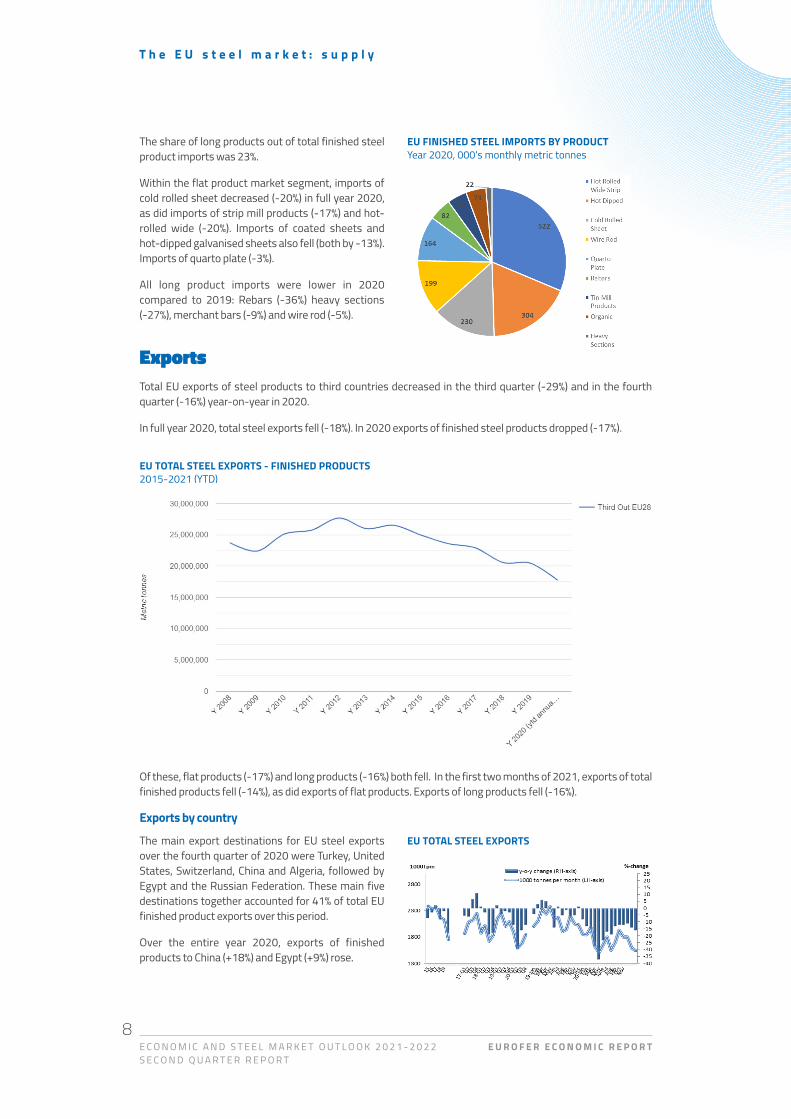
ExportsTotal EU exports of steel products to third countries decreased in the third quarter (-29%) and in the fourth quarter (-16%) year-on-year in 2020.
In full year 2020, total steel exports fell (-18%). In 2020 exports of finished steel products dropped (-17%).
Of these, flat products (-17%) and long products (-16%) both fell. In the first two months of 2021, exports of total finished products fell (-14%), as did exports of flat products. Exports of long products fell (-16%).
Exports by country
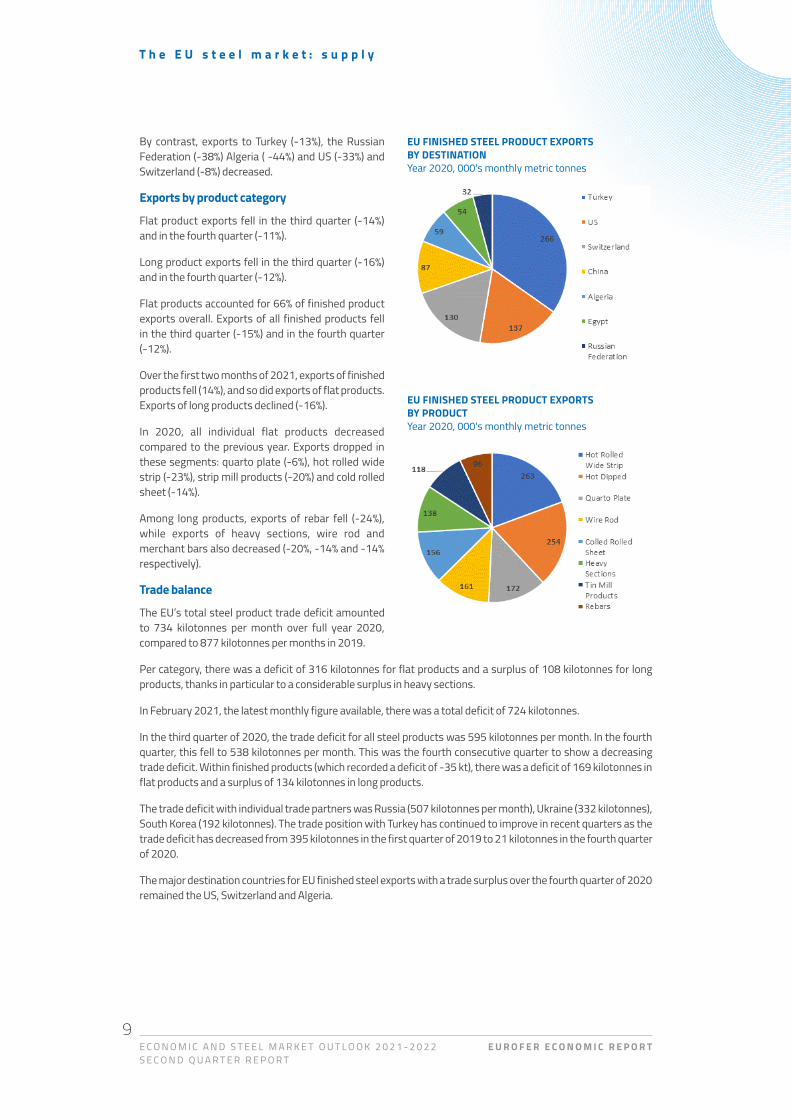
The main export destinations for EU steel exports over the fourth quarter of 2020 were Turkey, United States, Switzerland, China and Algeria, followed by Egypt and the Russian Federation. These main five destinations together accounted for 41% of total EU finished product exports over this period.
Over the entire year 2020, exports of finished products to China (+18%) and Egypt (+9%) rose.
T h e E U s t e e l m a r k e t : s u p p l y
EU TOTAL STEEL EXPORTS - FINISHED PRODUCTS2015-2021 (YTD)
EU TOTAL STEEL EXPORTS
EU FINISHED STEEL IMPORTS BY PRODUCT Year 2020, 000's monthly metric tonnes
9E U R O F E R E C O N O M I C R E P O R TE C O N O M I C A N D S T E E L M A R K E T O U T L O O K 2 0 2 1 - 2 0 2 2
S E C O N D Q U A R T E R R E P O R T
By contrast, exports to Turkey (-13%), the Russian Federation (-38%) Algeria ( -44%) and US (-33%) and Switzerland (-8%) decreased.
Exports by product category
Flat product exports fell in the third quarter (-14%) and in the fourth quarter (-11%).
Long product exports fell in the third quarter (-16%) and in the fourth quarter (-12%).
Flat products accounted for 66% of finished product exports overall. Exports of all finished products fell in the third quarter (-15%) and in the fourth quarter (-12%).
Over the first two months of 2021, exports of finished products fell (14%), and so did exports of flat products. Exports of long products declined (-16%).
In 2020, all individual flat products decreased compared to the previous year. Exports dropped in these segments: quarto plate (-6%), hot rolled wide strip (-23%), strip mill products (-20%) and cold rolled sheet (-14%).
Among long products, exports of rebar fell (-24%), while exports of heavy sections, wire rod and merchant bars also decreased (-20%, -14% and -14% respectively).
Trade balance
The EU’s total steel product trade deficit amounted to 734 kilotonnes per month over full year 2020, compared to 877 kilotonnes per months in 2019.
Per category, there was a deficit of 316 kilotonnes for flat products and a surplus of 108 kilotonnes for long products, thanks in particular to a considerable surplus in heavy sections.
In February 2021, the latest monthly figure available, there was a total deficit of 724 kilotonnes.
In the third quarter of 2020, the trade deficit for all steel products was 595 kilotonnes per month. In the fourth quarter, this fell to 538 kilotonnes per month. This was the fourth consecutive quarter to show a decreasing trade deficit. Within finished products (which recorded a deficit of -35 kt), there was a deficit of 169 kilotonnes in flat products and a surplus of 134 kilotonnes in long products.
The trade deficit with individual trade partners was Russia (507 kilotonnes per month), Ukraine (332 kilotonnes), South Korea (192 kilotonnes). The trade position with Turkey has continued to improve in recent quarters as the trade deficit has decreased from 395 kilotonnes in the first quarter of 2019 to 21 kilotonnes in the fourth quarter of 2020.
The major destination countries for EU finished steel exports with a trade surplus over the fourth quarter of 2020 remained the US, Switzerland and Algeria.
T h e E U s t e e l m a r k e t : s u p p l y
EU FINISHED STEEL PRODUCT EXPORTS BY DESTINATIONYear 2020, 000's monthly metric tonnes
EU FINISHED STEEL PRODUCT EXPORTS BY PRODUCTYear 2020, 000's monthly metric tonnes

10E U R O F E R E C O N O M I C R E P O R TE C O N O M I C A N D S T E E L M A R K E T O U T L O O K 2 0 2 1 - 2 0 2 2
S E C O N D Q U A R T E R R E P O R T
Outlook for steel-using sectors Total steel-using sector activity in 2020
Total production activity in steel-using sectors fell (-10.4%) over the full year 2020.
The second quarter saw a sharp fall in steel-using industrial output (-25%), linked to industrial stoppages caused by the COVID pandemic. The third quarter also saw a decline (-6.7%) as did the fourth quarter (-1.9%). This is the fifth consecutive quarterly decline.
Overall output in the steel-using sectors in the fourth quarter of 2020 did to positive growth in some Central European countries such as the Czech Republic, Poland and Hungary, as well as at low rates- in Italy, Belgium, the Netherlands and – outside the EU – the UK1.
The pandemic is not yet over and continues to weigh down confidence and growth prospects, however, there is the potential now for the first quarters of 2021 to see rebound growth in steel-using sectors.
Total steel-using sectors forecast 2021-2022
Total steel-using sectors output, after the severe drop (-10.4%) experienced in 2020, will rebound (8+%) in 2021 – due to very low output levels recorded in the preceding year – and will grow more moderately in 2022 (+3.5%).
The EU steel market: final use
EU STEEL USING SECTORS Production Activity - forecast from Q1-2021
YEAR-ON-YEAR % CHANGE - EU STEEL WEIGHTED INDUSTRIAL PRODUCTION (SWIP) INDEX
% Share in total Consumption
Year 2020 Q1’21 Q2’21 Q3’21 Q4’21
Year 2021 Q1’22 Q2’22 Q3’22 Q4’22
Year 2022
Construction 35 -4.6 0.3 12.1 4.9 3.5 5.0 6.9 5.9 2.6 0.9 4.0
Mechanical engineering 14 -11.7 0.1 22.0 6.6 5.1 8.0 5.5 3.1 3.2 2.8 3.6
Automotive 18 -19.8 4.1 81.8 9.0 -1.7 15.9 6.2 5.3 2.8 2.4 4.2
Domestic appliances 3 -2.8 7.2 21.3 0.0 1.0 6.4 0.0 3.5 3.9 1.8 2.3
Other Transport 2 -10.6 -8.8 19.6 4.4 7.1 4.6 4.3 5.8 3.3 2.8 4.0
Tubes 13 -15.3 1.2 24.0 10.1 7.7 9.6 6.0 4.3 4.2 3.4 4.4
Metal goods 14 -8.6 1.8 24.0 4.0 2.7 7.4 3.0 3.5 2.5 2.2 2.8
Miscellaneous 2 -8.2 -2.2 18.1 6.6 2.8 5.8 4.7 3.2 2.7 2.0 3.1
TOTAL 100 -10.4 0.8 25.5 5.9 3.3 8.0 4.3 3.9 3.3 2.3 3.5
1 UK data are still included in this report as the UK was part of the EU Internal Market until 31.12.2020.
11E U R O F E R E C O N O M I C R E P O R TE C O N O M I C A N D S T E E L M A R K E T O U T L O O K 2 0 2 1 - 2 0 2 2
S E C O N D Q U A R T E R R E P O R T
T h e E U s t e e l m a r k e t : f i n a l u s e
Construction industry Construction industry activity in 2020
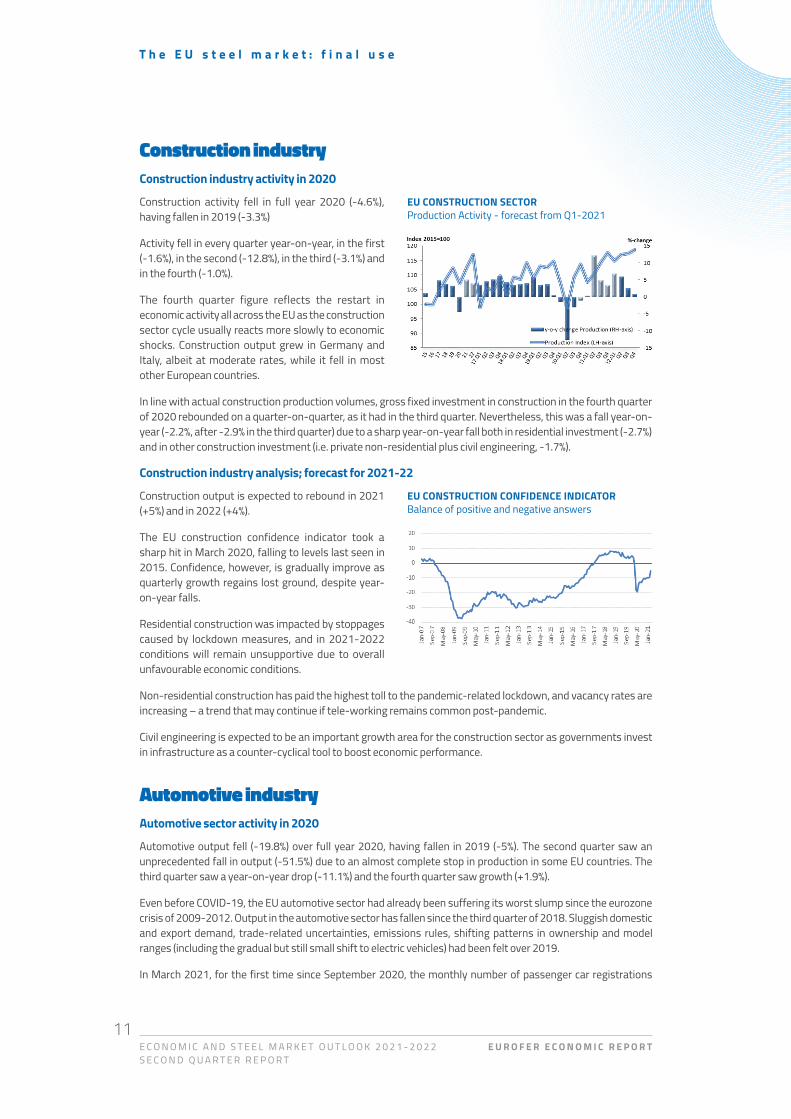
Construction activity fell in full year 2020 (-4.6%), having fallen in 2019 (-3.3%)
Activity fell in every quarter year-on-year, in the first (-1.6%), in the second (-12.8%), in the third (-3.1%) and in the fourth (-1.0%).
The fourth quarter figure reflects the restart in economic activity all across the EU as the construction sector cycle usually reacts more slowly to economic shocks. Construction output grew in Germany and Italy, albeit at moderate rates, while it fell in most other European countries.
In line with actual construction production volumes, gross fixed investment in construction in the fourth quarter of 2020 rebounded on a quarter-on-quarter, as it had in the third quarter. Nevertheless, this was a fall year-on-year (-2.2%, after -2.9% in the third quarter) due to a sharp year-on-year fall both in residential investment (-2.7%) and in other construction investment (i.e. private non-residential plus civil engineering, -1.7%).
Construction industry analysis; forecast for 2021-22
Construction output is expected to rebound in 2021 (+5%) and in 2022 (+4%).
The EU construction confidence indicator took a sharp hit in March 2020, falling to levels last seen in 2015. Confidence, however, is gradually improve as quarterly growth regains lost ground, despite year-on-year falls.
Residential construction was impacted by stoppages caused by lockdown measures, and in 2021-2022 conditions will remain unsupportive due to overall unfavourable economic conditions.
Non-residential construction has paid the highest toll to the pandemic-related lockdown, and vacancy rates are increasing – a trend that may continue if tele-working remains common post-pandemic.
Civil engineering is expected to be an important growth area for the construction sector as governments invest in infrastructure as a counter-cyclical tool to boost economic performance.
Automotive industryAutomotive sector activity in 2020
Automotive output fell (-19.8%) over full year 2020, having fallen in 2019 (-5%). The second quarter saw an unprecedented fall in output (-51.5%) due to an almost complete stop in production in some EU countries. The third quarter saw a year-on-year drop (-11.1%) and the fourth quarter saw growth (+1.9%).
Even before COVID-19, the EU automotive sector had already been suffering its worst slump since the eurozone crisis of 2009-2012. Output in the automotive sector has fallen since the third quarter of 2018. Sluggish domestic and export demand, trade-related uncertainties, emissions rules, shifting patterns in ownership and model ranges (including the gradual but still small shift to electric vehicles) had been felt over 2019.
In March 2021, for the first time since September 2020, the monthly number of passenger car registrations
EU CONSTRUCTION SECTORProduction Activity - forecast from Q1-2021
EU CONSTRUCTION CONFIDENCE INDICATORBalance of positive and negative answers

12E U R O F E R E C O N O M I C R E P O R TE C O N O M I C A N D S T E E L M A R K E T O U T L O O K 2 0 2 1 - 2 0 2 2
S E C O N D Q U A R T E R R E P O R T
recorded a large paper increase (+87%) year-on-year, further to a drop (-10%) in February 2021. The year-on-year comparison is, however, distorted by the exceptionally low figure recorded in March 2020, that is when the worst effects of the pandemic started to be felt and both plants and dealerships were temporarily closed.
Automotive industry forecast 2021-2022
Automotive output is expected to rebound in 2021 (+15.9%), followed by more moderate growth in 2022 (+4.2%), according to data from EUROFER members.
Production activity largely started in the second half of 2020, albeit with significant disruption in the supply chain. The rebound seen over the third quarter and fourth quarter has led to sharp quarter-on-quarter rises in output, but still around historically low levels.
General economic uncertainty across the EU during the ongoing pandemic and subdued consumer confidence, due in part to poor disposable income developments, has continued to impact passenger car demand.
In 2021, recovery in global trade and external demand from major markets such as the US, China and Turkey will remain a key factor for EU car exporters. With the distortions of the WTLP testing regime having faded and new models coming on stream, output growth expectations are positive, though absolute output will remain below recent highs for the foreseeable future.
Mechanical engineeringMechanical engineering activity in 2020
In 2020, the mechanical engineering sector fell (-11.7%), having been stable in 2019 (-0.9%).
Activity in the sector fell year-on-year in the second quarter (-22.2%), in the third quarter (-9.6%) and in the fourth quarter (-5.8%).
Output in mechanical engineering had been falling since the second quarter of 2019, in connection with the continued downturn in manufacturing. It was then hit by the industrial shutdowns accompanying the second quarter 2020 COVID lockdowns.
In line with expectations, production activity in the EU mechanical engineering sector registered record recession in the second quarter of 2020, which was equally affected by the industrial lockdown in response to the COVID-19 outbreak as the lack of new orders took its toll on production activity.
A recovery in orders and output has continued since the third quarter but remains fragile and exposed to the general weakness of the economic recovery in the EU.
Mechanical engineering forecast 2021-2022
Activity in the mechanical engineering sector is expected to rebound in 2021 (+8%) and continue in 2022 (+3.6%).
The combined effect of poor business confidence, trade friction, weakened demand in key EU domestic markets in recent quarters alongside policy uncertainty and the impact of the pandemic will cast a long shadow. This could put a brake on investment decisions at least until the second half of 2021.
T h e E U s t e e l m a r k e t : f i n a l u s e
EU AUTOMOTIVE SECTORProduction Activity - Forecast from Q1-2021
EU MECHANICAL ENGINEERINGProduction Activity - Forecast from Q1-2021

13E U R O F E R E C O N O M I C R E P O R TE C O N O M I C A N D S T E E L M A R K E T O U T L O O K 2 0 2 1 - 2 0 2 2
S E C O N D Q U A R T E R R E P O R T
EU manufacturing is lagging behind in its recovery compared to its man export partners in the US and China, which are enjoying stronger-than-expected economic recoveries. A rebound in international trade will thus contribute to the rebound of this segment.
Despite the constraints, the EU manufacturing sector has seen a rebound. This recovery is expected to continue, albeit at historically low levels of output. COVID disruptions in the global supply chain (high transportation costs etc) should ease substantially and then disappear by the third quarter of 2021.
Steel tube industrySteel tube industry activity in 2020
In 2020 the steel tube industry declined (-15.3%), following stability in 2019 (-0.3%). This is the third consecutive year of decline. The second quarter saw a sharp year on year fall (-27.3%), then another fall in the third quarter (-11.5%) and in the fourth quarter (-8.3%).
Increasingly aligned with sectors that it feeds, such as construction, mechanical engineering and automotive, the steel tube sector had nevertheless experienced a flat 2019. However, 2020 saw sharp declines, particularly in the second quarter, due to the constraints placed on its comparable with those experienced by other steel-using sectors in the EU.
Steel tube industry forecast 2021-2022
Activity in the steel tube industry is expected to grow in 2021 (+9.6%) and again in 2022 (+4.4%)
During 2020, output in the EU steel tube industry was heavily impacted by COVID-induced shutdowns, as well as commercial and political issues hampering some large EU and regional projects.
Assuming the pandemic fades by mid-2021, the full year should see a moderate rebound. Demand for large welded tubes is particularly expected to grow because of positive prospects for the oil and gas industry.
Demand from the construction sector looks set to recover, whereas tube demand from the automotive and engineering sectors is forecast to remain less strong. In addition, import pressure on steel tube markets in the EU will remain high, particularly for the commodity segment. In any case, recovery in tube sector’s output is expected to continue steadily at every quarter during 2021.
Electrical domestic appliances industryElectrical domestic appliances industry activity in the fourth quarter of 2020
Activity in the electrical domestic appliance industry fell in 2020 (-2.8%), supported, to some extent, by consumers locked down at home investing in home appliances.
The second quarter saw a severe drop year on year (-19.3%), followed by a rebound in the third quarter (+9.5%) and in the fourth quarter (+5%). The third quarter rebound was the first period of growth after nine consecutive quarters of decline.
T h e E U s t e e l m a r k e t : f i n a l u s e
EU STEEL TUBE SECTORProduction Activity - Forecast from Q1-2021
ELECTRICAL DOMESTIC APPLIANCE SECTORProduction Activity - Forecast from Q1-2021
14E U R O F E R E C O N O M I C R E P O R TE C O N O M I C A N D S T E E L M A R K E T O U T L O O K 2 0 2 1 - 2 0 2 2
S E C O N D Q U A R T E R R E P O R T
Electrical domestic appliances industry forecast 2021-2022
Electrical domestical appliance output is expected to rise in 2021 (+6.4%) and in 2022 (+2.3%).
Even once the pandemic ends, there are indications that home-working will remain common. That may support demand for appliances that improve the quality of home life, including smart devices connected to the ‘internet-of-things’.
T h e E U s t e e l m a r k e t : f i n a l u s e
15E U R O F E R E C O N O M I C R E P O R TE C O N O M I C A N D S T E E L M A R K E T O U T L O O K 2 0 2 1 - 2 0 2 2
S E C O N D Q U A R T E R R E P O R T
GDP growthEUROFER’s estimates EU GDP will have fallen in 2020 (-7.1%). This is the first recession since 2013 and the sharpest on record. EUROFER’s prediction is for growth for 2021 (+4.5%) and in 2022 (+4.3%).
The first quarter saw year on year falls (-3.3%), the record slump in the second quarter (-14%) and another fall in the third (-4.1%) and fourth quarters (-4.6%). The third quarter did see rebound growth quarter-on-quarter (+12%) as the most aggressive lockdown factors eased. Quarter-on-quarter growth in the fourth quarter was flat (-0.5%).
The 2020 trends in the EU economy began in the second half of 2019. Though the COVID pandemic masks the impact, growth was marginal at the end of 2019. This reflected global trade tensions and the continued downturn in manufacturing, particularly in export-led Germany.
The COVID pandemic caused substantial falls in real GDP across the EU in the first quarter of 2020. Even more severe quarterly GDP falls were reflected in the data of the second quarter of 2020 (which include April – the month most affected by the general economic lockdown), such that the entire EU technically entered economic recession (i.e. two consecutive quarterly GDP drops).
In the third quarter, reflecting restarted economic activity, EU economies experienced strong quarter-on-quarter growth which were however widely expected and equally exceptional, being a mere technical rebound from the record lows of the preceding quarter.
Individual EU economies recorded comparable GDP falls. Eastern European countries generally recorded relatively less pronounced year-on-year falls in real GDP (i.e. below -10%) over the third quarter. The continuation of the pandemic across the EU took its toll on confidence and economic activity, particularly services (whereas the industry had almost fully recovered the record losses seen in the second quarter of 2020), which were most impacted. Recovery has so far been subdued and subject to persistent uncertainty, contrary to other world major economies (US and China) where recovery is gaining ground and the economy seems to back to almost full speed.
Government consumption was the only GDP component which provided positive contribution to growth also during the second quarter of 2020.
Major forecasters have improved their outlook, particularly the IMF– in its April 2020 Economic Outlook – which has signalled that there are signs of global economic growth accelerating, particularly thanks to the pronounced recovery in US and China.
As a result, for the euro area (forecast for the EU is not available) GDP growth in 2021 has been upped (+4.4%, previously +4.2%).
EU economic outlook
16E U R O F E R E C O N O M I C R E P O R TE C O N O M I C A N D S T E E L M A R K E T O U T L O O K 2 0 2 1 - 2 0 2 2
S E C O N D Q U A R T E R R E P O R T
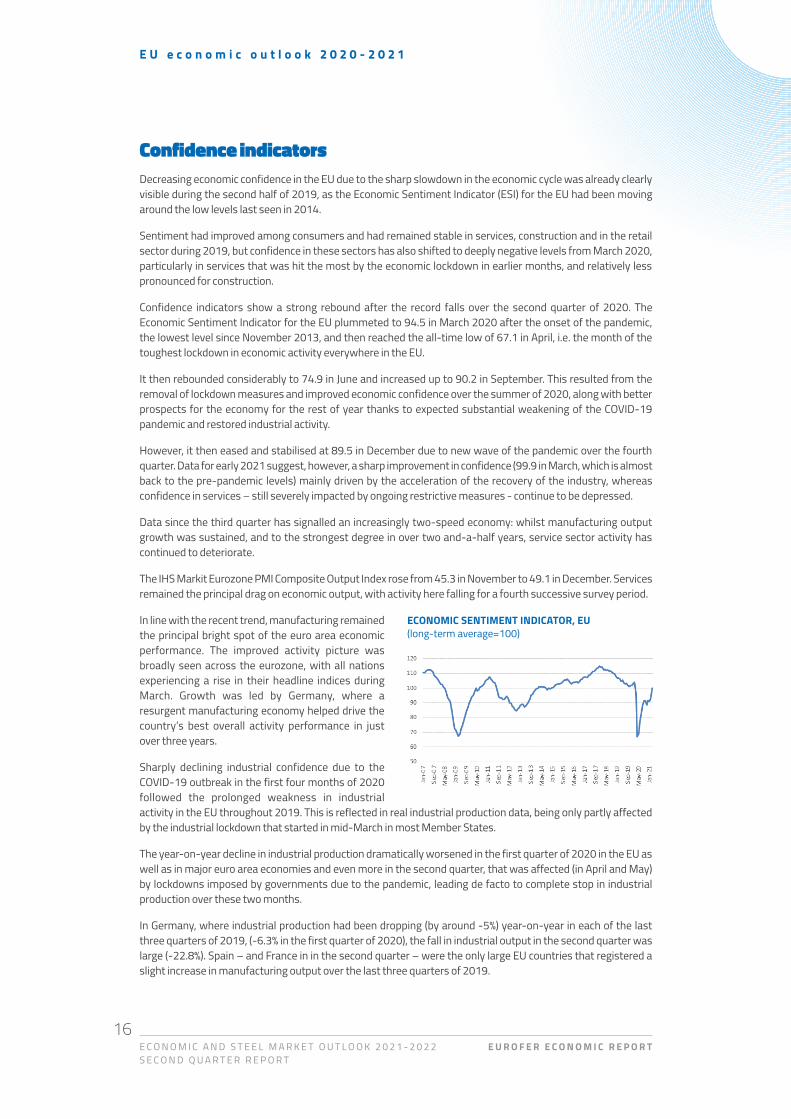
Confidence indicatorsDecreasing economic confidence in the EU due to the sharp slowdown in the economic cycle was already clearly visible during the second half of 2019, as the Economic Sentiment Indicator (ESI) for the EU had been moving around the low levels last seen in 2014.
Sentiment had improved among consumers and had remained stable in services, construction and in the retail sector during 2019, but confidence in these sectors has also shifted to deeply negative levels from March 2020, particularly in services that was hit the most by the economic lockdown in earlier months, and relatively less pronounced for construction.
Confidence indicators show a strong rebound after the record falls over the second quarter of 2020. The Economic Sentiment Indicator for the EU plummeted to 94.5 in March 2020 after the onset of the pandemic, the lowest level since November 2013, and then reached the all-time low of 67.1 in April, i.e. the month of the toughest lockdown in economic activity everywhere in the EU.
It then rebounded considerably to 74.9 in June and increased up to 90.2 in September. This resulted from the removal of lockdown measures and improved economic confidence over the summer of 2020, along with better prospects for the economy for the rest of year thanks to expected substantial weakening of the COVID-19 pandemic and restored industrial activity.
However, it then eased and stabilised at 89.5 in December due to new wave of the pandemic over the fourth quarter. Data for early 2021 suggest, however, a sharp improvement in confidence (99.9 in March, which is almost back to the pre-pandemic levels) mainly driven by the acceleration of the recovery of the industry, whereas confidence in services – still severely impacted by ongoing restrictive measures - continue to be depressed.
Data since the third quarter has signalled an increasingly two-speed economy: whilst manufacturing output growth was sustained, and to the strongest degree in over two and-a-half years, service sector activity has continued to deteriorate.
The IHS Markit Eurozone PMI Composite Output Index rose from 45.3 in November to 49.1 in December. Services remained the principal drag on economic output, with activity here falling for a fourth successive survey period.
In line with the recent trend, manufacturing remained the principal bright spot of the euro area economic performance. The improved activity picture was broadly seen across the eurozone, with all nations experiencing a rise in their headline indices during March. Growth was led by Germany, where a resurgent manufacturing economy helped drive the country’s best overall activity performance in just over three years.
Sharply declining industrial confidence due to the COVID-19 outbreak in the first four months of 2020 followed the prolonged weakness in industrial activity in the EU throughout 2019. This is reflected in real industrial production data, being only partly affected by the industrial lockdown that started in mid-March in most Member States.
The year-on-year decline in industrial production dramatically worsened in the first quarter of 2020 in the EU as well as in major euro area economies and even more in the second quarter, that was affected (in April and May) by lockdowns imposed by governments due to the pandemic, leading de facto to complete stop in industrial production over these two months.
In Germany, where industrial production had been dropping (by around -5%) year-on-year in each of the last three quarters of 2019, (-6.3% in the first quarter of 2020), the fall in industrial output in the second quarter was large (-22.8%). Spain – and France in in the second quarter – were the only large EU countries that registered a slight increase in manufacturing output over the last three quarters of 2019.
E U e c o n o m i c o u t l o o k 2 0 2 0 - 2 0 2 1
ECONOMIC SENTIMENT INDICATOR, EU(long-term average=100)

17E U R O F E R E C O N O M I C R E P O R TE C O N O M I C A N D S T E E L M A R K E T O U T L O O K 2 0 2 1 - 2 0 2 2
S E C O N D Q U A R T E R R E P O R T
These countries then recorded a first quarter slump (-6.4% and -8% respectively), which culminated in drops (-26.5% and 25.2% respectively) over the second quarter. As reported in the first quarter, the most severe impact was felt in Italy, where industrial production in the second quarter of 2020 plummeted by 28%. The second quarter, largely influenced by widespread and hard lockdowns leading to an almost complete stop of industrial activity, has indeed marked the trough of the cycle.
In the third quarter industrial production rebound considerably quarter-on-quarter over the third quarter of 2020. Growth was seen in the EU (+17.8%), Germany (+14.8%), France (+22.6%), Italy (+31.9%), and Spain (+28.3%), but these rebounds translated into year-on-year drops again, albeit more moderate than in the second quarter.
The year-on-year comparison in the third quarter turned out to be negative, showing that industrial activity, in absolute terms, was around low historical levels despite the quarter-on-quarter rebound. In the EU, industrial production fell (-6%) compared to the third quarter of 2019, in Germany (-10.1%), in France (-7.3%), in Italy (-4.3%), in Spain (-5.3%).
Against expectation of robust industrial recovery, despite improvement in confidence and output, in the fourth quarter 2020 year-on-year growth was still negative (-1.8%) – for the seventh consecutive quarter, albeit at much lower rate than the second and the third quarter, and despite a second consecutive quarter-on-quarter rebound.
This signals that industrial activity remains around levels in historical terms. There are not yet signs on a monthly basis (up to February 2021) of a stronger acceleration of industrial production which may lead to positive year-on-year growth over the first quarter of 2021, as the economic uncertainty remains widespread across the EU. Industrial production fell by -3.1% in Germany, by -4.4% in France, -3% in Italy and -2.2% in Spain.
These developments resulted from disappointing economic developments over the whole fourth quarter 2020 due to the widespread resurgence of the pandemic.
Any significant rebound around high levels in industrial output is not likely to materialise before the second quarter of 2021, provided that other adverse pandemic-related shocks do not negatively affect this outlook and the current acceleration pace in industrial activity continues.
After the dramatic fall in industrial production in the EU (-9.5%) in 2020, EUROFER foresees a rebound (+6.5%) in 2021 and a more moderate growth (+4.2%) in 2022.
E U e c o n o m i c o u t l o o k 2 0 2 0 - 2 0 2 1
INDUSTRIAL PRODUCTION, YEAR-ON-YEAR GROWTH RATES, SEASONALLY ADJUSTED (%)
INDUSTRIAL PRODUCTION,S.A., MONTHLY DATA (2015=100)

18E U R O F E R E C O N O M I C R E P O R TE C O N O M I C A N D S T E E L M A R K E T O U T L O O K 2 0 2 1 - 2 0 2 2
S E C O N D Q U A R T E R R E P O R T
Economic fundamentalsDue to the global pandemic, the downward trend in world trade has dramatically worsened up to the third quarter of 2020, with some improvement in the fourth quarter reflecting improved trade conditions and higher demand in economies such as China and the US. This is reported by short-term (i.e. monthly) trade volumes according to WTO data.
As a result, world merchandise export volumes increased by 3% in the fourth quarter of 2020 year-on-year (-4.3% in the third quarter).
All world regions recorded increased volumes of exports in the fourth quarter. Growth in exports from Europe even outperformed the, i.e. US +5% vs. 3%, while Asia (thanks to the considerable economic rebound in China) saw a growth of exports of +9%. World imports also increased (+2%, after -6% in the third quarter).
Still in the first quarter of 2020, as in the previous three quarters – and prior to any possible impact on actual data by the current COVID-19 outbreak – private consumption had remained relatively resilient and continued to provide positive contribution to GDP growth. Labour market fundamentals had continued to improve, albeit at a slower pace than before in most EU countries.
However, job creation continued to be affected by lower levels of production activity in industry and by persistent uncertainty on short-term business conditions. The dramatic deterioration of the economic situation due to the pandemic, the ongoing rise in unemployment have – as expected – completely reversed the picture.
The EU unemployment rate – which had remained around the levels observed around late 2019, started to rise, i.e. from 6.6% in March to 7.8% in September has then eased to 7.4% in December and only marginally rose to 7.5% in February 2021, with considerable variations across Member States and across economic sectors (employment in services being particularly impacted). Consumers have been suffering from substantial losses in their in disposable income, due to job losses or temporary lay-off or reduction of working time, which will slash private consumption growth.
Other major GDP components are set to pay a high price for the COVID-19 disruption. The combined effect of cooling global GDP growth, increasing trade frictions, policy uncertainty and the ongoing profit squeeze in the corporate sector will curb business investment in machinery and equipment at least until the third quarter of 2020, but repercussions on investment of the deteriorated economic environment have already been felt during the fourth quarter.
The outlook for construction investment is relatively less negative, as the construction sector is set to be more resilient and, to some extent, less exposed to the huge repercussions of the COVID-19 lockdown. It is thus likely to achieve relatively better performance than other GDP components in 2020.
In addition, government investment and public expenditure are expected to play a rather robust, countercyclical role and could provide a strong contribution to the growth of domestic demand. The role of fiscal policy in providing stimulus could be an approach, as both ‘conventional’ and ‘unconventional’ monetary policies (e.g. quantitative easing, negative interest rates) have been deployed by the ECB to a very large extent.
It is expected that the ECB will provide further support until the end of the current crisis. Further measures are being discussed and/or refined, both at the EU level as well as the state level. The objective is to provide adequate support for, and liquidity to, the economy (both to households and businesses) so as to alleviate the huge costs of the economic lockdown and the related output (and job) losses.
EUROFER MACROECONOMIC DATAANNUAL % CHANGE, UNLESS OTHERWISE INDICATED
2019 2020 2021 2022
GDP 1.4 -7.1 4.5 4.3
Private consumption 1.4 -8.4 4.1 4.8
Government consumption 2.1 0.2 4.4 1.2
Investment 2.6 -7.5 6.2 5.1
Investment in mach. equip. 1.6 -13.1 6.2 5.9
Investment in construction 3.1 -8.0 4.9 3.5
Exports 2.5 -11.5 7.0 6.1
Imports 3.1 -10.5 7.6 6.4
Unemployment rate (level) 6.6 7.3 8.1 7.5
Inflation 1.4 0.5 1.5 1.5
Industrial production -0.9 -9.3 7.1 4.1
E U e c o n o m i c o u t l o o k 2 0 2 0 - 2 0 2 1
19E U R O F E R E C O N O M I C R E P O R TE C O N O M I C A N D S T E E L M A R K E T O U T L O O K 2 0 2 1 - 2 0 2 2
S E C O N D Q U A R T E R R E P O R T
The central EU institutions and bodies have responded to the outbreak-related economic emergency with a detailed set of measures, whose implementation will however require time (and additional political negotiations). The Stability and Growth Pact and the Fiscal Compact have been suspended.
With regard to monetary policy, the ECB has extended and enhanced its ongoing Asset Purchase Programme (APP, or Quantitative Easing, QE) – that had been launched in 2015 in order to tackle the already weak economic environment. The ‘augmented’ APP is now called the Pandemic Emergency Purchase Programme (PEPP) will have an overall envelope of €750 billion, and will last until March 2022, including all the asset categories (i.e. government and corporate bonds) eligible under the previous APP.
The ECB has also continued to provide its forward guidance, leaving its key policy rate unchanged at zero, its deposit facility rates at negative levels (-0.50%) and indicating that its key policy rates will remain at current levels as long as the economic circumstances make it appropriate (i.e. in the absence of any inflationary pressure and as long as economic conditions remain depressed).
The European Commission has launched the SURE fund worth €100 billion. This will be distributed among Member States in order to provide short-time working schemes and tackle unemployment costs. The European Investment Bank (EIB) has committed to leveraging its €25 billion guarantee fund up to €200 billion that will be available for EU Member States.
In addition, the European Stability Mechanism (ESM) will make €240 billion available in the form of very cheap loans for those EU countries that might have difficulty on government bond markets (Italy, Spain etc).
The above measures total some €540 billion that EU countries can use as additional resources so as to cope with the costs of the recession. Lastly, it is worth mentioning the Next Generation EU package that was agreed at the European Council last summer, and will provide support to the EU economies worth €750 billion, of which grants worth 390 billion and loans worth 360 billion. It will be financed by issuing common bonds for the first time in EU history.
The core programme of the package is the so-called Recovery and Resilience Facility (RRF) and will amount to €313 billion. The Next Gen EU will lead to an unprecedented increase in gov debt, albeit mutualised (via emission of common EU bonds), which may cause some problems to highlyy-indebted economies once the ECB asset purchase scheme ends.
E U e c o n o m i c o u t l o o k 2 0 2 0 - 2 0 2 1

20E U R O F E R E C O N O M I C R E P O R TE C O N O M I C A N D S T E E L M A R K E T O U T L O O K 2 0 2 1 - 2 0 2 2
S E C O N D Q U A R T E R R E P O R T
Glossary of terms Sector definitions according to NACE Rev.2
Building & Civil Engineering
41 Construction of buildings42 Civil engineering43 Specialised construction activities25.1 Manufacture of metal structures and part of structures25.2 Manufacture of tanks. generators. radiators. boilers
Mechanical Engineering
28 Manufacture of machinery and equipment27.1 Manufacture of electric motors. generators. transformers25.3 Manufacture of steam generators. except central heating hot water boilers
Automotive
29 Manufacture of motor vehicles and trailers
Domestic Appliances
27.51 Manufacture of electric domestic appliances
Other Transport Equipment
30 Manufacture of other transport equipment30.1 Building and repair of ships30.2 Manufacture of railway locomotives and rolling stock30.91 Manufacture of motorcycles
Steel Tubes
24.2 Manufacture of steel tubes
Metal Goods
25 Manufacture of fabricated metal products excluding 25.1-25.2-25.3
Other sectors
26 Manufacture of computer. electronic and optical products27 Manufacture of electric motors. generators. transformers and electricity distribution and control
apparatus excluding 27.1 and 27.5

21E U R O F E R E C O N O M I C R E P O R TE C O N O M I C A N D S T E E L M A R K E T O U T L O O K 2 0 2 1 - 2 0 2 2
S E C O N D Q U A R T E R R E P O R T
EU steel market definitionsSWIP: abbreviation for Steel Weighted Industrial Production index. It is used as a proxy for real steel consumption. Activity in the steel-using sectors is weighted with the relative share of each sector in total steel consumed by all sectors.
Real steel consumption: Real consumption is the use of all steel products used by steel-using sectors in their production processes, also referred to as the ‘final use’ of steel products, adjusted for the stock cycle.
Apparent steel consumption: Apparent consumption is also referred to as ‘steel demand’. It is total deliveries of all steel products and qualities by EU producers plus imports less 'receipts' into the EU, minus exports to third countries. In other words, apparent consumption is deliveries by EU producers plus imports minus receipts (that is, imports by EU producers themselves of material that is further processed), minus exports to third countries. EUROFER’s definition of apparent consumption includes all qualities, including stainless, and all finished products and semi-finished products.If apparent consumption exceeds real steel consumption, the surplus is stocked in the distribution chain. If apparent consumption is less than real steel consumption, inventories are being withdrawn.
Steel industry receipts: In both the apparent consumption and market supply statistics, the imports component of the calculation is written, in the EUROFER definition, as 'imports less receipts'. The 'receipts' in this instance mean imports by EU producers themselves of finished or semi-finished steel products that are further processed by the producer and transformed into other products. In the publicly available EUROFER figures, only finished products are shown and thus impacted by the receipts calculation.This correction is important because it prevents double-counting that would artificially inflate the size of the market. If an EU producer imports a tonne of hot rolled strip that it further processes into a tonne of cold rolled which it then delivers to the EU market - in an uncorrected calculation the import of one tonne would then become one imported tonne plus one EU-processed and delivered tonne. The imported tonne is thus corrected out in the import side of the market supply and apparent consumption figures. Narrow definition: EUROFER applies the so-called “narrow definition” which excludes steel tubes and first transformation products from the product scope used for calculating steel consumption. Hence, the steel tube sector is a steel-using sector under this definition.
Steel intensity: the ratio of real steel consumption to steel weighted production in the steel-using sectors. This reflects the usually slightly negative impact on consumption of innovation in steel products, inter-material substitution, improvements in process efficiency and design, etc.
22E U R O F E R E C O N O M I C R E P O R TE C O N O M I C A N D S T E E L M A R K E T O U T L O O K 2 0 2 1 - 2 0 2 2
S E C O N D Q U A R T E R R E P O R T
About the European Steel Association (EUROFER)EUROFER AISBL is located in Brussels and was founded in 1976. It represents the entirety of steel production in the European Union. EUROFER members are steel companies and national steel federations throughout the EU. The major steel companies and national steel federations in Switzerland and Turkey are associate members.
The European Steel Association is recorded in the EU transparency register: 93038071152-83.
About the European steel industryThe European steel industry is a world leader in innovation and environmental sustainability. It has a turnover of around €170 billion and directly employs 330,000 highly-skilled people, producing on average 160 million tonnes of steel per year. More than 500 steel production sites across 22 EU Member States provide direct and indirect employment to millions more European citizens. Closely integrated with Europe’s manufacturing and construction industries, steel is the backbone for development, growth and employment in Europe.
Steel is the most versatile industrial material in the world. The thousands of different grades and types of steel developed by the industry make the modern world possible. Steel is 100% recyclable and therefore is a fundamental part of the circular economy. As a basic engineering material, steel is also an essential factor in the development and deployment of innovative, CO2-mitigating technologies, improving resource efficiency and fostering sustainable development in Europe.

Related Documents