By Research Department Dec 2021 OUTLOOK 2022

Welcome message from author
This document is posted to help you gain knowledge. Please leave a comment to let me know what you think about it! Share it to your friends and learn new things together.
Transcript

By Research Department
Dec 2021
OUTLOOK 2022

MACROECONOMY
FIXED INCOME MARKET
EQUITY MARKET
INDUSTRY AND STOCK PICKS
MACROECONOMY EQUITY MARKET INDUSTRY & STOCK PICKS FIXED INCOME
3
Source: IMF, WB, Bloomberg, VCBS Research
Economic prospects have diverged further across countries with the
advantage of developed economies having strong policy support
measures.
New variants show up, which prevent lives from returning to post-
pandemic period. However, the impact on the economy will diminish
compared to the previous waves.
Demands shift for “work from home” related products.
Gaining momentum for commodity prices is weak. Even there is a
probability that commodities price may decrease compared to the
average level recorded in 2021.
Inflation gradually cooled down as transitory shortages are resolved.
=> In general, still Vietnamese economy shall benefit from the recovery of
the world economy, plus the supportive policies going on the right track.
Phenomena and assumption post-pandemic period. Outlook: Economic prospects have diverged further across countries and
appeared to extend through 2022.
Central Banks aim to put an end to pandemic’s easy money era.
However, there will be a break before an interest rate hike.
regarding the speed of this procedure, Fed is likely to take the lead
while others may still struggle for the timeline.
According to VCBS, it is hard to neutral the loosening monetary
policies as method used is unconventional loose monetary policy.
In case the central banks begin to neutralize the loosened
monetary policy, (1) this is a positive signal when the world
economy gradually recovers, minimizing the risk of global
economic crisis. (2) Note that, the negative impact on Vietnam is
faint and weak as it is indirect effect.
WORLD ECONOMY- AN IMPORTANT FOUNDATION
0
100
200
300
400
500
600
700
0
1000
2000
3000
4000
5000
6000
7000
8000
01/1
2/1
0
01/0
7/1
1
01/0
2/1
2
01/0
9/1
2
01/0
4/1
3
01/1
1/1
3
01/0
6/1
4
01/0
1/1
5
01/0
8/1
5
01/0
3/1
6
01/1
0/1
6
01/0
5/1
7
01/1
2/1
7
01/0
7/1
8
01/0
2/1
9
01/0
9/1
9
01/0
4/2
0
01/1
1/2
0
01/0
6/2
1
Monetary base in some countries
US, $bn (LHS) Europe, €bn (LHS) Japan, ¥ tril (RHS)
0
30
60
90
120
150
180
Commodities indexes, 2019=100
Energy Agriculture Metals Precious metals
MACROECONOMY EQUITY MARKET INDUSTRY & STOCK PICKS FIXED INCOME
EXPECTATION OF VIETNAM ECONOMIC REBOUND POST- PANDEMIC
4
Vietnam's success in recent years has been to ensure
macroeconomic stability, create attractiveness for private and
international investment flows so as to utilize the resource to
restore production activities in the post-pandemic period.
A bright spot from the SBV's operating policy that they have
flexibility and clear forward guidance to market participants. With
resources available on hand, the SBV has enough tools and policy
measures space to control inflation and stabilize the macro-
economy in the coming period.
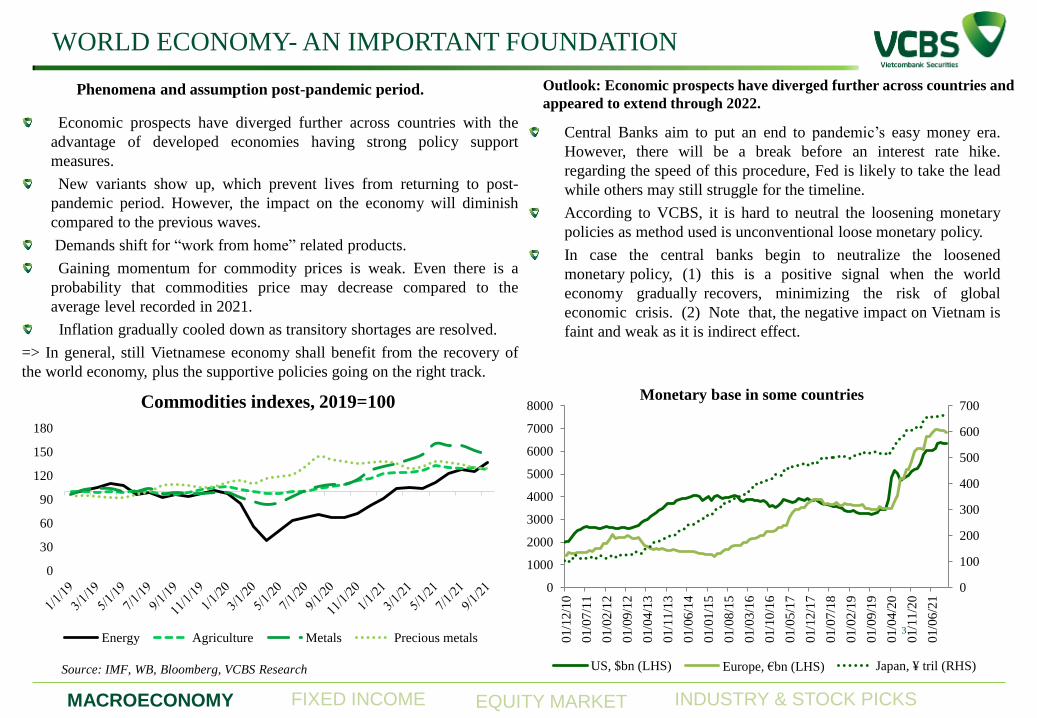
In 2022, Vietnam is forecast to continue to benefit from the trend of
(1) shifting production from China to Asian countries; and (2) Free
Trade Agreements are signed. However, some risks may arise from
a lower-than-expected recovery in world demand. Similarly, the
domestic economic recovery is fragile against the threat of new
strains.
Source: IMF, GSO, CEIC, VCBS Research
44.8
23.1
14.6
3.6
8.7 5.4 6.1
15.6
1 2.2
8.7 6.4
Fiscal response to the Covid-19 crisis in some
Asian countries (%GDP)
0
5
10
15
20
25
2015 2016 2017 2018 2019 2020 11T.2021
Foreign Direct Investment (bn USD)
FDI Registered FDI Implemented
30
35
40
45
50
55
60Manufacturing PMI
Manufacturing PMI PMI threadhold (50)
MACROECONOMY EQUITY MARKET INDUSTRY & STOCK PICKS FIXED INCOME
GROW REBOUNDS BUT STILL VULNERABLE TO NEW WAVE OF THE
PANDEMIC
5
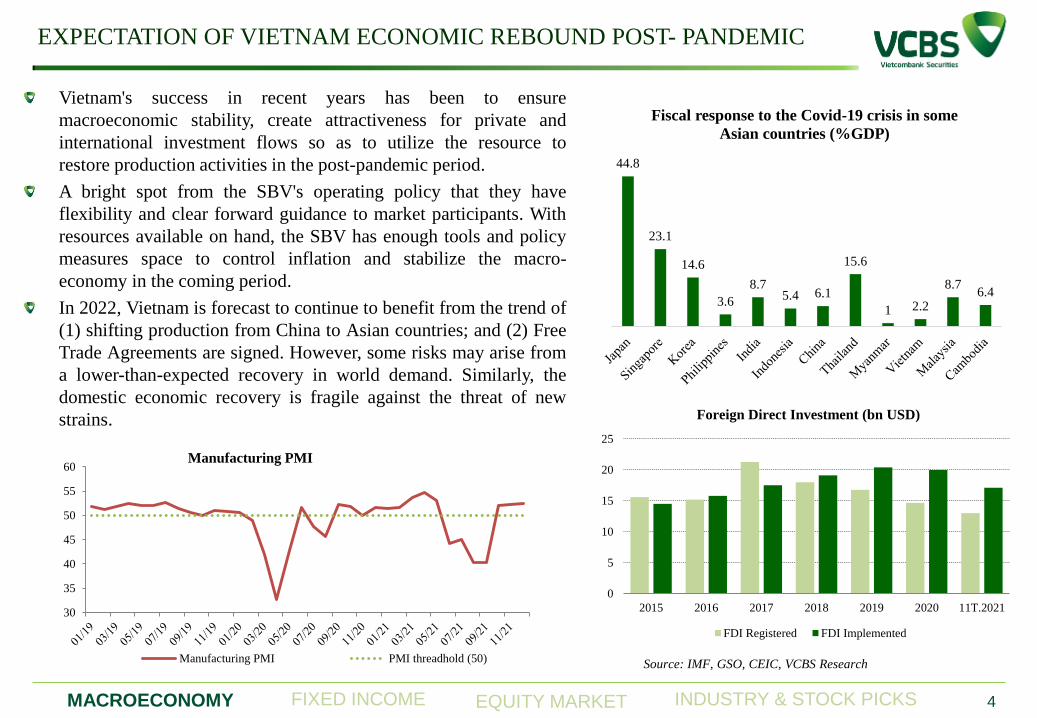
Vietnam is on the right track in the process of safely adapting to the
epidemic.
Compared with other countries in the region, Vietnam, although
lagging behind, has made many remarkable achievements in the
vaccination campaign.
The economic stimulus package will have a significant amount of
money for the health sector.
Risks: New variants emerge (Omicron variant is expected to account
for a quarter of new global cases early next year).
2021: GDP growth is estimated at 2.58%
Economic activities continued to recover despite the degree of
divergence, the Government showed a quick response in management.
A bright spot in the coordination of monetary and fiscal policy.
2022: GDP growth will reach 6.8%-7.2%.
Growth in public spending can have a positive impact on consumer
spending and private investment. Consumer demand gradually
recovered.
A reasonably sized economic stimulus package targeting the right
sectors and before the Lunar New Year will help Vietnam keep up with
the world's recovery. The risk, if any, is that the world economic
recovery slows down, reducing the growth rate of import and export
turnover.
Expectations of bright spots on monetary policies and a harmonious
combination with fiscal policies will continue to be prolonged in the
coming years.
Source: Ourworldindata, VCBS Research
75.0
80.0
85.0
90.0
95.0
100.0
105.0
110.0
Q4 Q1 Q2 Q3 Q4 Q1
2019 2020 2021
GDP index , 2019Q4=100
Philippines
Malaysia
Việt Nam
-10
-5
0
5
10
15
200
250
300
350
400
450
500
550
01/19 05/19 09/19 01/20 05/20 09/20 01/21 05/21 09/21
Tn
. V
ND
Retail Sales
Trade Hotel & Restaurant Services & Tourism Growth rate (%)
MACROECONOMY EQUITY MARKET INDUSTRY & STOCK PICKS FIXED INCOME
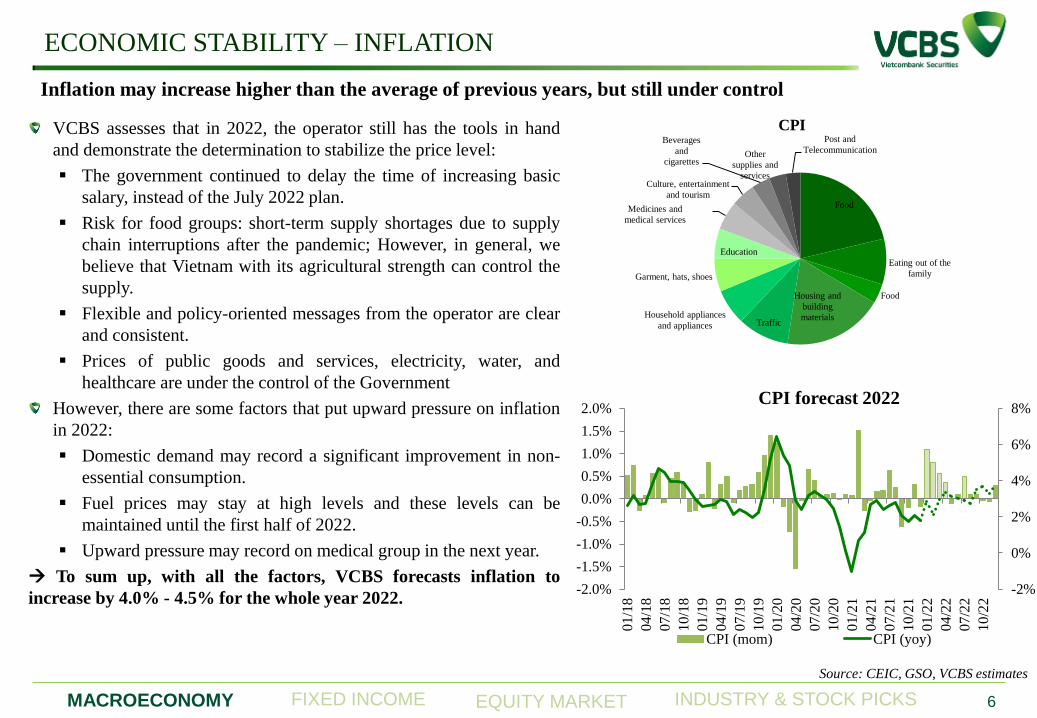
VCBS assesses that in 2022, the operator still has the tools in hand
and demonstrate the determination to stabilize the price level:
The government continued to delay the time of increasing basic
salary, instead of the July 2022 plan.
Risk for food groups: short-term supply shortages due to supply
chain interruptions after the pandemic; However, in general, we
believe that Vietnam with its agricultural strength can control the
supply.
Flexible and policy-oriented messages from the operator are clear
and consistent.
Prices of public goods and services, electricity, water, and
healthcare are under the control of the Government
However, there are some factors that put upward pressure on inflation
in 2022:
Domestic demand may record a significant improvement in non-
essential consumption.
Fuel prices may stay at high levels and these levels can be
maintained until the first half of 2022.
Upward pressure may record on medical group in the next year.
To sum up, with all the factors, VCBS forecasts inflation to
increase by 4.0% - 4.5% for the whole year 2022.
ECONOMIC STABILITY – INFLATION
6
Source: CEIC, GSO, VCBS estimates
Inflation may increase higher than the average of previous years, but still under control
Food
Eating out of the
family
Food Housing and
building
materials Traffic
Household appliances
and appliances
Garment, hats, shoes
Education
Medicines and
medical services
Culture, entertainment
and tourism
Beverages
and
cigarettes Other
supplies and
services
Post and
Telecommunication
CPI
-2%
0%
2%
4%
6%
8%
-2.0%
-1.5%
-1.0%
-0.5%
0.0%
0.5%
1.0%
1.5%
2.0%
01/1
8
04/1
8
07/1
8
10/1
8
01/1
9
04/1
9
07/1
9
10/1
9
01/2
0
04/2
0
07/2
0
10/2
0
01/2
1
04/2
1
07/2
1
10/2
1
01/2
2
04/2
2
07/2
2
10/2
2
CPI forecast 2022
CPI (mom) CPI (yoy)
MACROECONOMY EQUITY MARKET INDUSTRY & STOCK PICKS FIXED INCOME
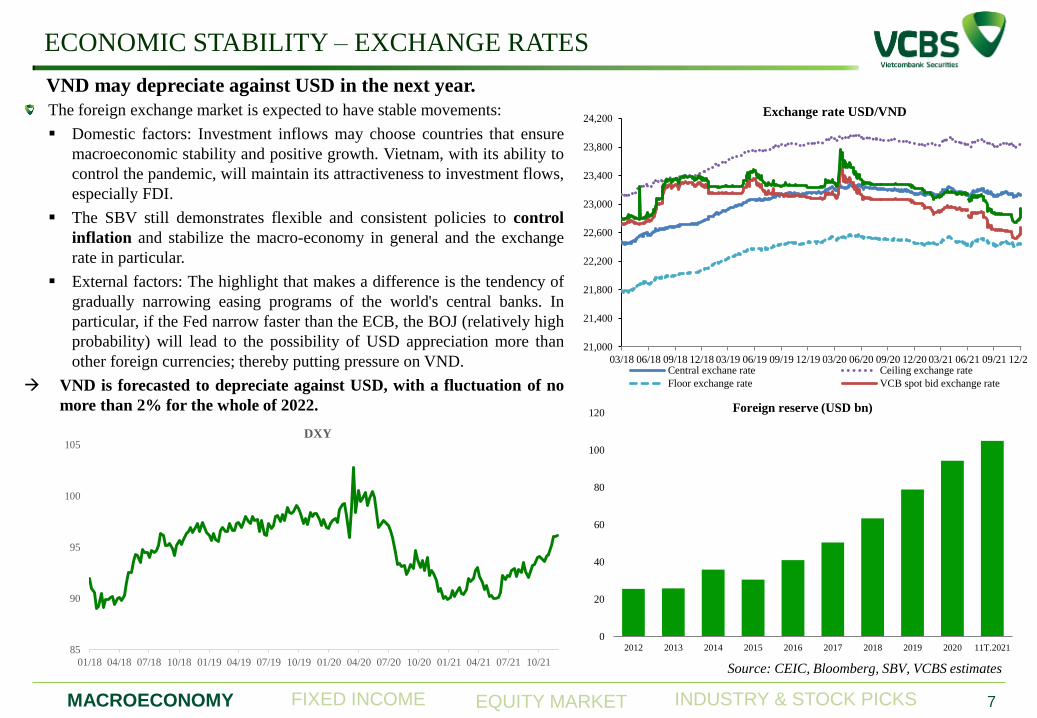
The foreign exchange market is expected to have stable movements:
Domestic factors: Investment inflows may choose countries that ensure
macroeconomic stability and positive growth. Vietnam, with its ability to
control the pandemic, will maintain its attractiveness to investment flows,
especially FDI.
The SBV still demonstrates flexible and consistent policies to control
inflation and stabilize the macro-economy in general and the exchange
rate in particular.
External factors: The highlight that makes a difference is the tendency of
gradually narrowing easing programs of the world's central banks. In
particular, if the Fed narrow faster than the ECB, the BOJ (relatively high
probability) will lead to the possibility of USD appreciation more than
other foreign currencies; thereby putting pressure on VND.
VND is forecasted to depreciate against USD, with a fluctuation of no
more than 2% for the whole of 2022.
ECONOMIC STABILITY – EXCHANGE RATES
7
Source: CEIC, Bloomberg, SBV, VCBS estimates
VND may depreciate against USD in the next year.
0
20
40
60
80
100
120
2012 2013 2014 2015 2016 2017 2018 2019 2020 11T.2021
Foreign reserve (USD bn)
85
90
95
100
105
01/18 04/18 07/18 10/18 01/19 04/19 07/19 10/19 01/20 04/20 07/20 10/20 01/21 04/21 07/21 10/21
DXY
21,000
21,400
21,800
22,200
22,600
23,000
23,400
23,800
24,200
03/18 06/18 09/18 12/18 03/19 06/19 09/19 12/19 03/20 06/20 09/20 12/20 03/21 06/21 09/21 12/21
Exchange rate USD/VND
Central exchane rate Ceiling exchange rate
Floor exchange rate VCB spot bid exchange rate
MACROECONOMY EQUITY MARKET INDUSTRY & STOCK PICKS FIXED INCOME
ECONOMIC STABILITY – DEPOSIT AND LENDING RATES
8
Source: GSO, VCBS compiles
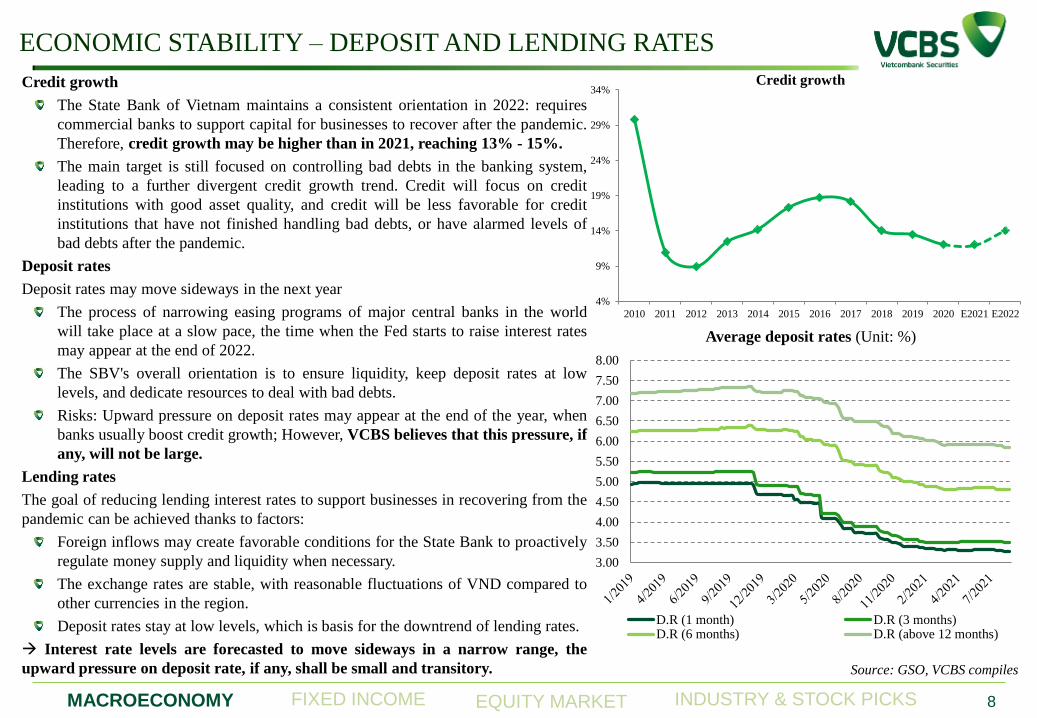
Credit growth
The State Bank of Vietnam maintains a consistent orientation in 2022: requires
commercial banks to support capital for businesses to recover after the pandemic.
Therefore, credit growth may be higher than in 2021, reaching 13% - 15%.
The main target is still focused on controlling bad debts in the banking system,
leading to a further divergent credit growth trend. Credit will focus on credit
institutions with good asset quality, and credit will be less favorable for credit
institutions that have not finished handling bad debts, or have alarmed levels of
bad debts after the pandemic.
Deposit rates
Deposit rates may move sideways in the next year
The process of narrowing easing programs of major central banks in the world
will take place at a slow pace, the time when the Fed starts to raise interest rates
may appear at the end of 2022.
The SBV's overall orientation is to ensure liquidity, keep deposit rates at low
levels, and dedicate resources to deal with bad debts.
Risks: Upward pressure on deposit rates may appear at the end of the year, when
banks usually boost credit growth; However, VCBS believes that this pressure, if
any, will not be large.
Lending rates
The goal of reducing lending interest rates to support businesses in recovering from the
pandemic can be achieved thanks to factors:
Foreign inflows may create favorable conditions for the State Bank to proactively
regulate money supply and liquidity when necessary.
The exchange rates are stable, with reasonable fluctuations of VND compared to
other currencies in the region.
Deposit rates stay at low levels, which is basis for the downtrend of lending rates.
Interest rate levels are forecasted to move sideways in a narrow range, the
upward pressure on deposit rate, if any, shall be small and transitory.
4%
9%
14%
19%
24%
29%
34%
2010 2011 2012 2013 2014 2015 2016 2017 2018 2019 2020 E2021 E2022
Credit growth
3.00
3.50
4.00
4.50
5.00
5.50
6.00
6.50
7.00
7.50
8.00
Average deposit rates (Unit: %)
D.R (1 month) D.R (3 months)D.R (6 months) D.R (above 12 months)
MACROECONOMY EQUITY MARKET INDUSTRY & STOCK PICKS FIXED INCOME 9
Source: VCBS Research
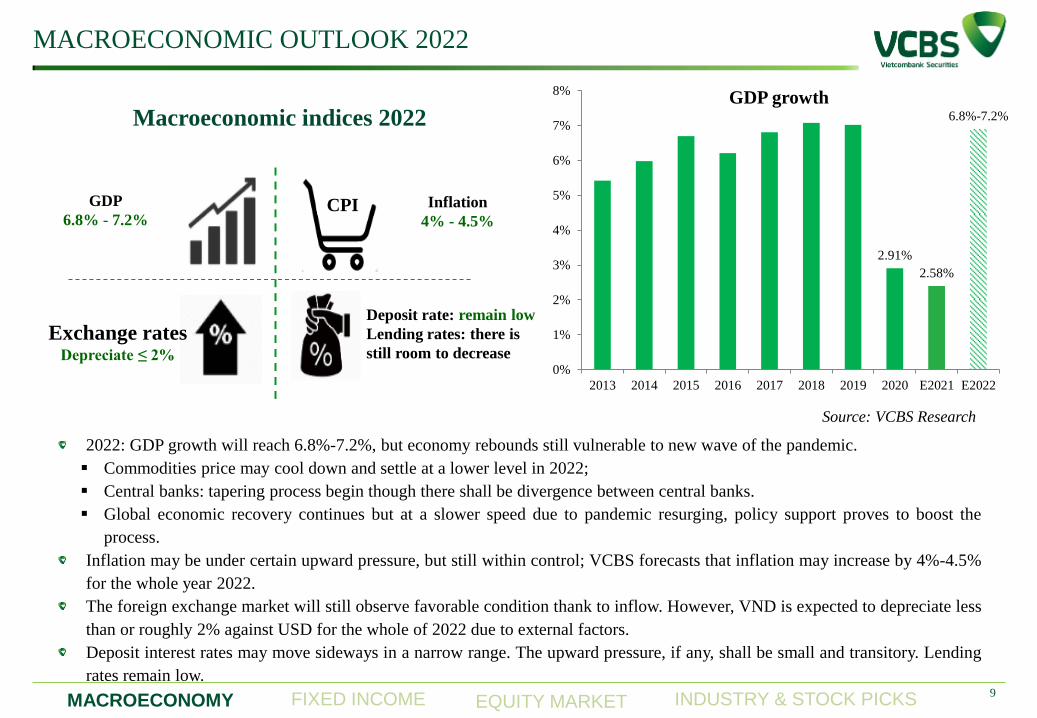
Macroeconomic indices 2022
CPI
Deposit rate: remain low
Lending rates: there is
still room to decrease
GDP
6.8% - 7.2%
Exchange rates Depreciate ≤ 2%
Inflation
4% - 4.5%
MACROECONOMIC OUTLOOK 2022
2.91%
2.58%
6.8%-7.2%
0%
1%
2%
3%
4%
5%
6%
7%
8%
2013 2014 2015 2016 2017 2018 2019 2020 E2021 E2022
GDP growth
2022: GDP growth will reach 6.8%-7.2%, but economy rebounds still vulnerable to new wave of the pandemic.
Commodities price may cool down and settle at a lower level in 2022;
Central banks: tapering process begin though there shall be divergence between central banks.
Global economic recovery continues but at a slower speed due to pandemic resurging, policy support proves to boost the
process.
Inflation may be under certain upward pressure, but still within control; VCBS forecasts that inflation may increase by 4%-4.5%
for the whole year 2022.
The foreign exchange market will still observe favorable condition thank to inflow. However, VND is expected to depreciate less
than or roughly 2% against USD for the whole of 2022 due to external factors.
Deposit interest rates may move sideways in a narrow range. The upward pressure, if any, shall be small and transitory. Lending
rates remain low.

MACROECONOMY
FIXED INCOME MARKET
EQUITY MARKET
INDUSTRY AND STOCK PICKS
MACROECONOMY EQUITY MARKET INDUSTRY AND STOCKS PICK FIXED INCOME
BOND MARKET - Overview
11
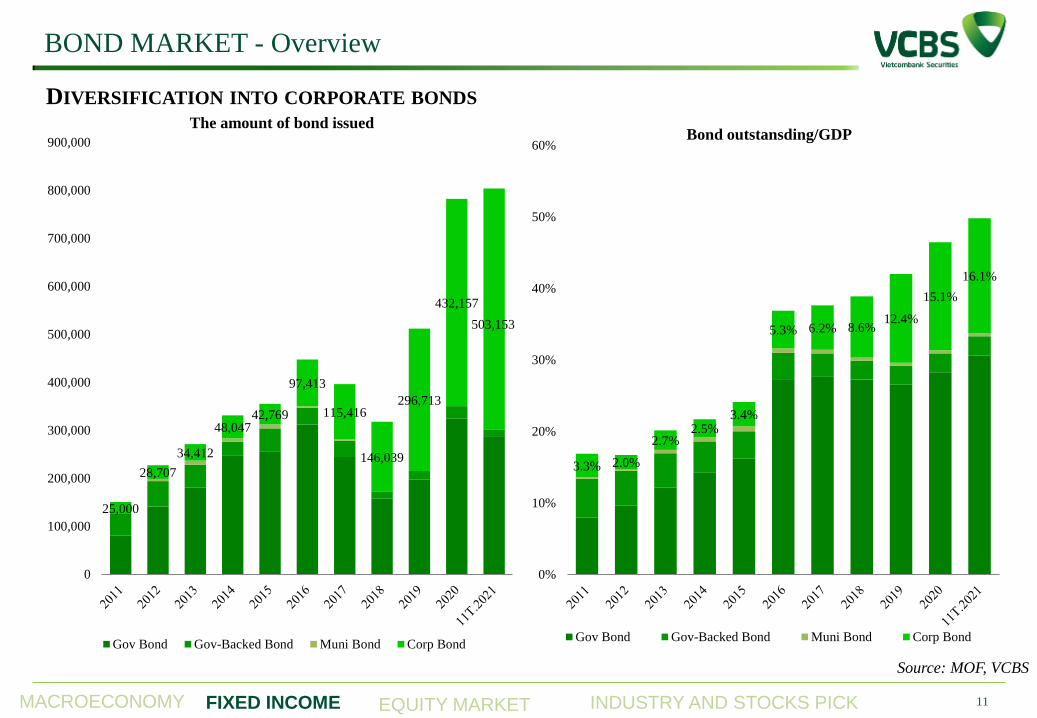
DIVERSIFICATION INTO CORPORATE BONDS
Source: MOF, VCBS
25,000
28,707
34,412
48,047 42,769
97,413
115,416
146,039
296,713
432,157
503,153
0
100,000
200,000
300,000
400,000
500,000
600,000
700,000
800,000
900,000
The amount of bond issued
Gov Bond Gov-Backed Bond Muni Bond Corp Bond
3.3% 2.0%
2.7% 2.5%
3.4%
5.3% 6.2% 8.6% 12.4%
15.1%
16.1%
0%
10%
20%
30%
40%
50%
60%Bond outstansding/GDP
Gov Bond Gov-Backed Bond Muni Bond Corp Bond
MACROECONOMY EQUITY MARKET INDUSTRY & STOCK PICKS FIXED INCOME
GORVERNMENT BOND - Recap 2021
12
Source: HNX, VCBS estimates
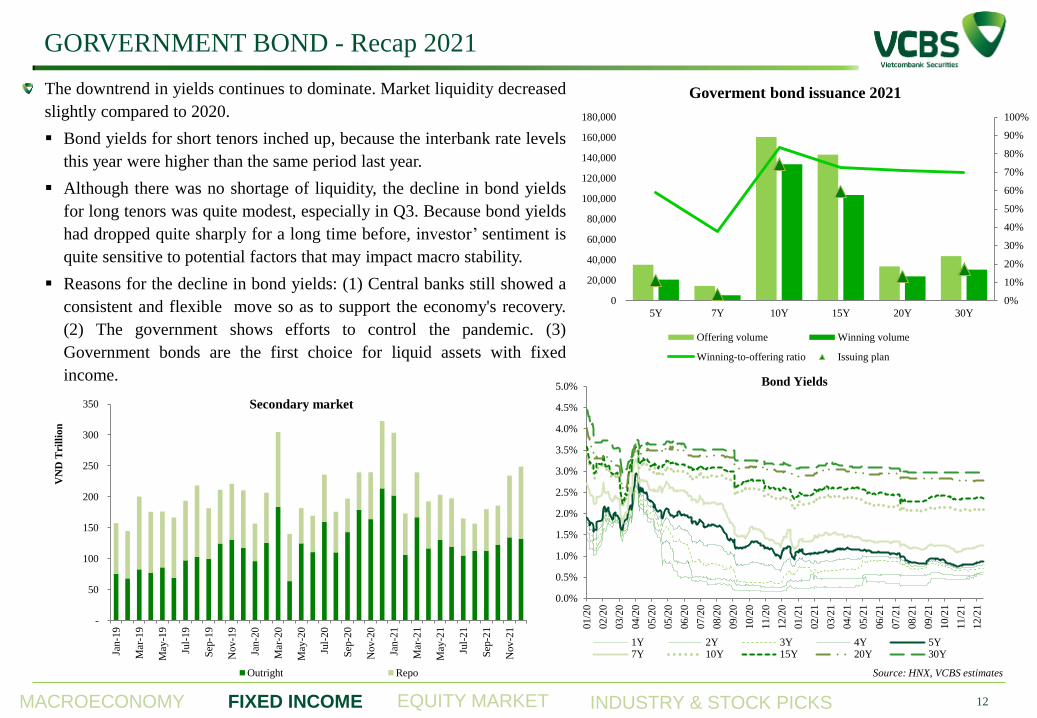
The downtrend in yields continues to dominate. Market liquidity decreased
slightly compared to 2020.
Bond yields for short tenors inched up, because the interbank rate levels
this year were higher than the same period last year.
Although there was no shortage of liquidity, the decline in bond yields
for long tenors was quite modest, especially in Q3. Because bond yields
had dropped quite sharply for a long time before, investor’ sentiment is
quite sensitive to potential factors that may impact macro stability.
Reasons for the decline in bond yields: (1) Central banks still showed a
consistent and flexible move so as to support the economy's recovery.
(2) The government shows efforts to control the pandemic. (3)
Government bonds are the first choice for liquid assets with fixed
income.
-
50
100
150
200
250
300
350
Jan-1
9
Mar
-19
May
-19
Jul-
19
Sep
-19
Nov
-19
Jan-2
0
Mar
-20
May
-20
Jul-
20
Sep
-20
Nov
-20
Jan-2
1
Mar
-21
May
-21
Jul-
21
Sep
-21
Nov
-21
VN
D T
ril
lio
n
Secondary market
Outright Repo
0.0%
0.5%
1.0%
1.5%
2.0%
2.5%
3.0%
3.5%
4.0%
4.5%
5.0%
01
/20
02
/20
03
/20
04
/20
05
/20
05
/20
06
/20
07
/20
08
/20
09
/20
10
/20
11
/20
12
/20
01
/21
02
/21
03
/21
04
/21
05
/21
06
/21
07
/21
08
/21
09
/21
10
/21
11
/21
12
/21
Bond Yields
1Y 2Y 3Y 4Y 5Y7Y 10Y 15Y 20Y 30Y
0%
10%
20%
30%
40%
50%
60%
70%
80%
90%
100%
0
20,000
40,000
60,000
80,000
100,000
120,000
140,000
160,000
180,000
5Y 7Y 10Y 15Y 20Y 30Y
Goverment bond issuance 2021
Offering volume Winning volume
Winning-to-offering ratio Issuing plan
MACROECONOMY EQUITY MARKET INDUSTRY & STOCK PICKS FIXED INCOME
INTERBANK RATES – Forecast 2022
13
Source: Bloomberg, VCBS estimates
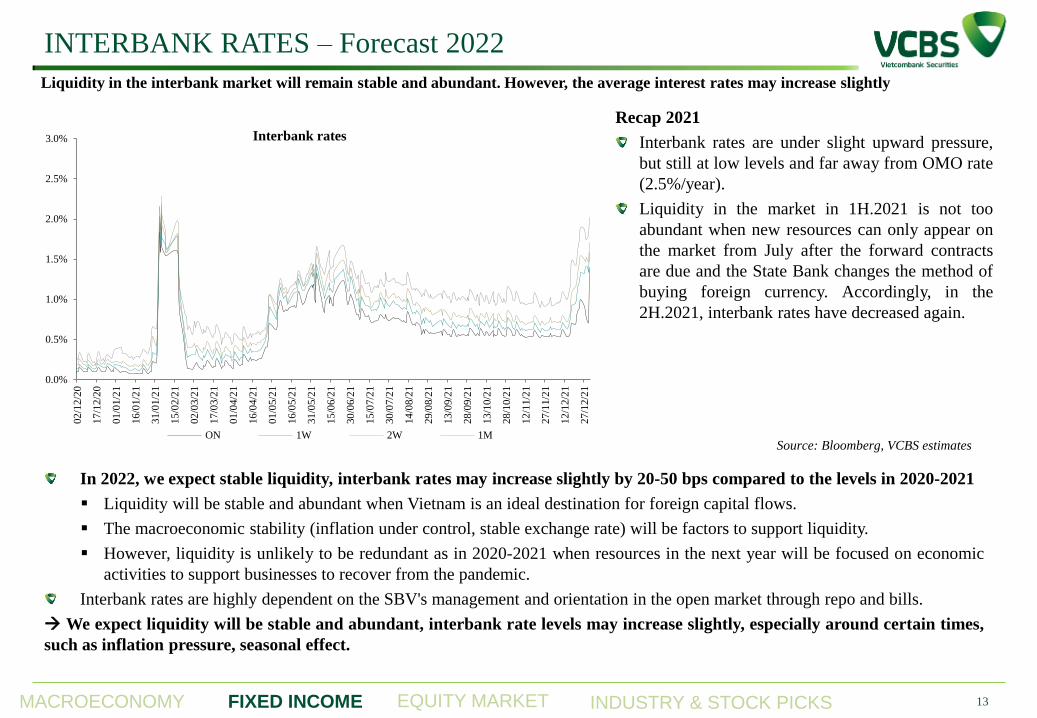
In 2022, we expect stable liquidity, interbank rates may increase slightly by 20-50 bps compared to the levels in 2020-2021
Liquidity will be stable and abundant when Vietnam is an ideal destination for foreign capital flows.
The macroeconomic stability (inflation under control, stable exchange rate) will be factors to support liquidity.
However, liquidity is unlikely to be redundant as in 2020-2021 when resources in the next year will be focused on economic
activities to support businesses to recover from the pandemic.
Interbank rates are highly dependent on the SBV's management and orientation in the open market through repo and bills.
We expect liquidity will be stable and abundant, interbank rate levels may increase slightly, especially around certain times,
such as inflation pressure, seasonal effect.
Liquidity in the interbank market will remain stable and abundant. However, the average interest rates may increase slightly
Recap 2021
Interbank rates are under slight upward pressure,
but still at low levels and far away from OMO rate
(2.5%/year).
Liquidity in the market in 1H.2021 is not too
abundant when new resources can only appear on
the market from July after the forward contracts
are due and the State Bank changes the method of
buying foreign currency. Accordingly, in the
2H.2021, interbank rates have decreased again.
0.0%
0.5%
1.0%
1.5%
2.0%
2.5%
3.0%
02
/12/2
0
17
/12/2
0
01
/01/2
1
16
/01/2
1
31
/01/2
1
15
/02/2
1
02
/03/2
1
17
/03/2
1
01
/04/2
1
16
/04/2
1
01
/05/2
1
16
/05/2
1
31
/05/2
1
15
/06/2
1
30
/06/2
1
15
/07/2
1
30
/07/2
1
14
/08/2
1
29
/08/2
1
13
/09/2
1
28
/09/2
1
13
/10/2
1
28
/10/2
1
12
/11/2
1
27
/11/2
1
12
/12/2
1
27
/12/2
1
ON 1W 2W 1M
Interbank rates
MACROECONOMY EQUITY MARKET INDUSTRY & STOCK PICKS FIXED INCOME
GOVERNMENT BOND– BOND YIELDS PROJECTION 2021
14
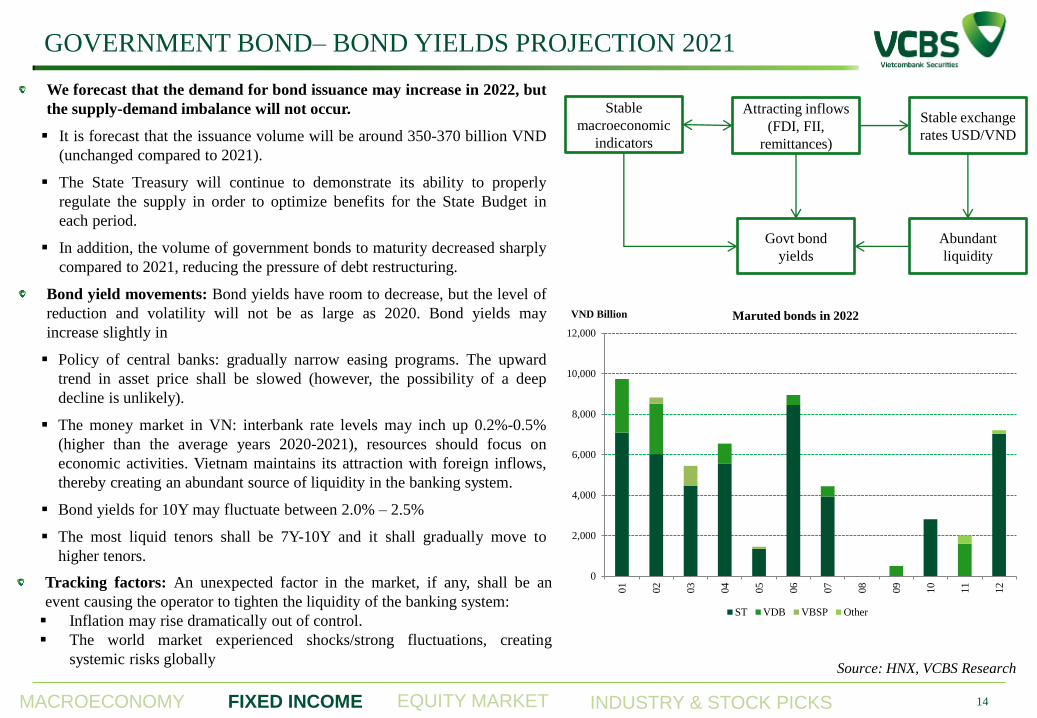
We forecast that the demand for bond issuance may increase in 2022, but
the supply-demand imbalance will not occur.
It is forecast that the issuance volume will be around 350-370 billion VND
(unchanged compared to 2021).
The State Treasury will continue to demonstrate its ability to properly
regulate the supply in order to optimize benefits for the State Budget in
each period.
In addition, the volume of government bonds to maturity decreased sharply
compared to 2021, reducing the pressure of debt restructuring.
Bond yield movements: Bond yields have room to decrease, but the level of
reduction and volatility will not be as large as 2020. Bond yields may
increase slightly in
Policy of central banks: gradually narrow easing programs. The upward
trend in asset price shall be slowed (however, the possibility of a deep
decline is unlikely).
The money market in VN: interbank rate levels may inch up 0.2%-0.5%
(higher than the average years 2020-2021), resources should focus on
economic activities. Vietnam maintains its attraction with foreign inflows,
thereby creating an abundant source of liquidity in the banking system.
Bond yields for 10Y may fluctuate between 2.0% – 2.5%
The most liquid tenors shall be 7Y-10Y and it shall gradually move to
higher tenors.
Source: HNX, VCBS Research
Stable
macroeconomic
indicators
Attracting inflows
(FDI, FII,
remittances)
Stable exchange
rates USD/VND
Abundant
liquidity
Govt bond
yields
Tracking factors: An unexpected factor in the market, if any, shall be an
event causing the operator to tighten the liquidity of the banking system:
Inflation may rise dramatically out of control.
The world market experienced shocks/strong fluctuations, creating
systemic risks globally
0
2,000
4,000
6,000
8,000
10,000
12,000
01
02
03
04
05
06
07
08
09
10
11
12
VND Billion Maruted bonds in 2022
ST VDB VBSP Other
MACROECONOMY EQUITY MARKET INDUSTRY & STOCK PICKS FIXED INCOME 15
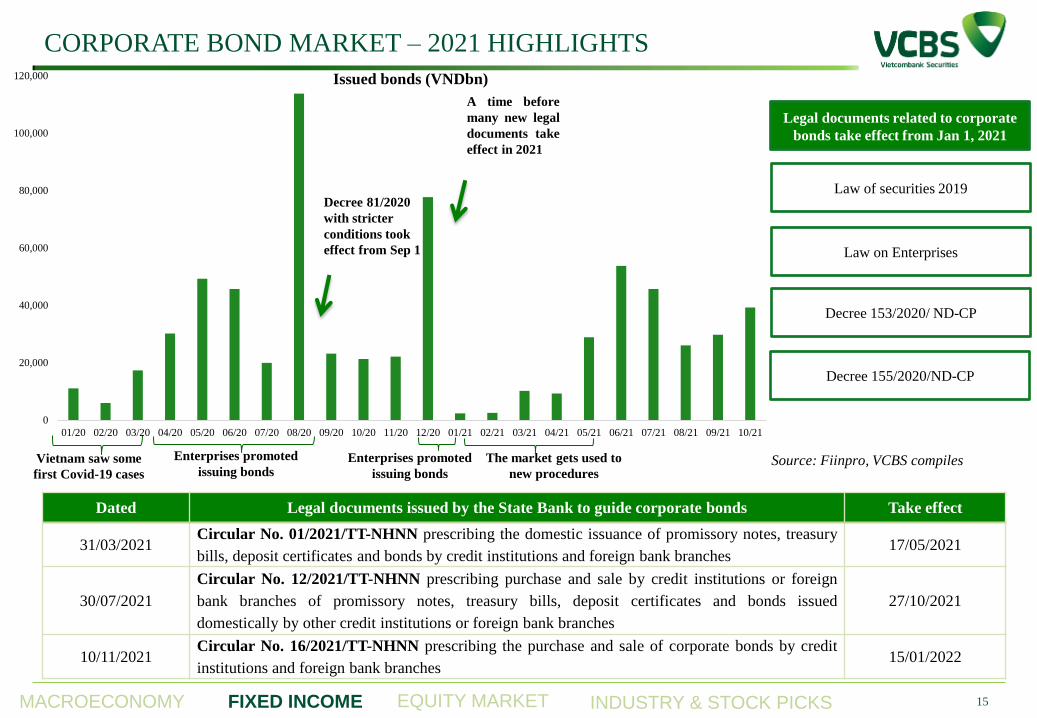
Source: Fiinpro, VCBS compiles
CORPORATE BOND MARKET – 2021 HIGHLIGHTS
Enterprises promoted
issuing bonds
Decree 81/2020
with stricter
conditions took
effect from Sep 1
Vietnam saw some
first Covid-19 cases
A time before
many new legal
documents take
effect in 2021
The market gets used to
new procedures Enterprises promoted
issuing bonds
0
20,000
40,000
60,000
80,000
100,000
120,000
01/20 02/20 03/20 04/20 05/20 06/20 07/20 08/20 09/20 10/20 11/20 12/20 01/21 02/21 03/21 04/21 05/21 06/21 07/21 08/21 09/21 10/21
Issued bonds (VNDbn)
Legal documents related to corporate
bonds take effect from Jan 1, 2021
Law of securities 2019
Law on Enterprises
Decree 153/2020/ ND-CP
Decree 155/2020/ND-CP
Dated Legal documents issued by the State Bank to guide corporate bonds Take effect
31/03/2021 Circular No. 01/2021/TT-NHNN prescribing the domestic issuance of promissory notes, treasury
bills, deposit certificates and bonds by credit institutions and foreign bank branches 17/05/2021
30/07/2021
Circular No. 12/2021/TT-NHNN prescribing purchase and sale by credit institutions or foreign
bank branches of promissory notes, treasury bills, deposit certificates and bonds issued
domestically by other credit institutions or foreign bank branches
27/10/2021
10/11/2021 Circular No. 16/2021/TT-NHNN prescribing the purchase and sale of corporate bonds by credit
institutions and foreign bank branches 15/01/2022
MACROECONOMY EQUITY MARKET INDUSTRY & STOCK PICKS FIXED INCOME 16
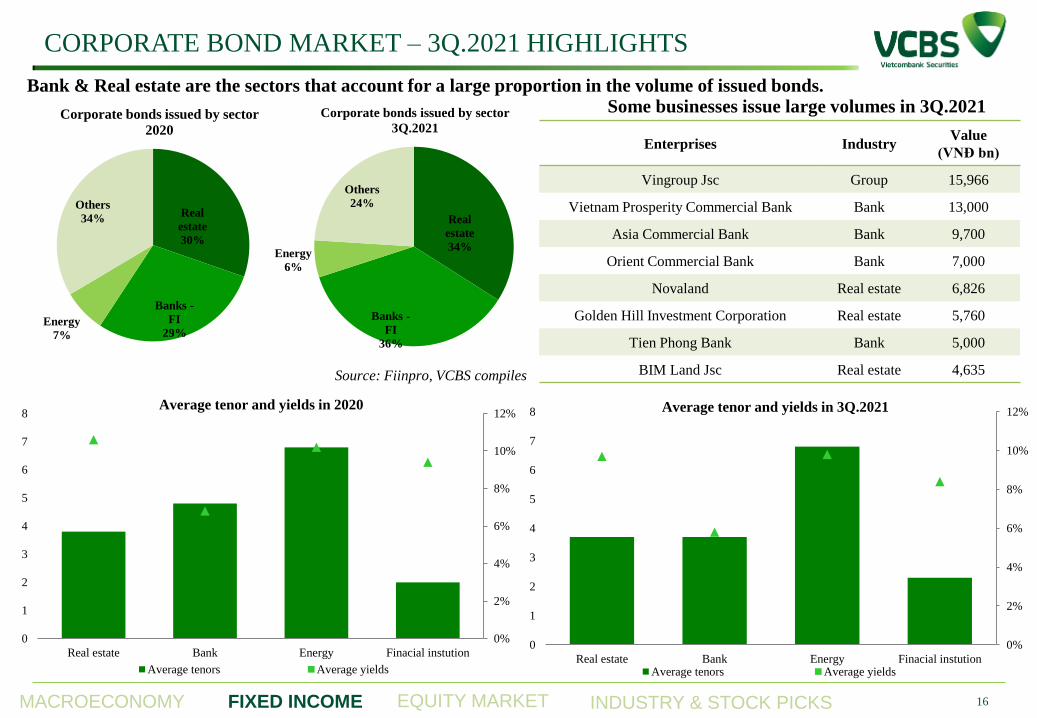
Bank & Real estate are the sectors that account for a large proportion in the volume of issued bonds.
Source: Fiinpro, VCBS compiles
0%
2%
4%
6%
8%
10%
12%
0
1
2
3
4
5
6
7
8
Real estate Bank Energy Finacial instution
Average tenor and yields in 2020
Average tenors Average yields
CORPORATE BOND MARKET – 3Q.2021 HIGHLIGHTS
0%
2%
4%
6%
8%
10%
12%
0
1
2
3
4
5
6
7
8
Real estate Bank Energy Finacial instution
Average tenor and yields in 3Q.2021
Average tenors Average yields
Real
estate
30%
Banks -
FI
29% Energy
7%
Others
34%
Corporate bonds issued by sector
2020
Real
estate
34%
Banks -
FI
36%
Energy
6%
Others
24%
Corporate bonds issued by sector
3Q.2021
Some businesses issue large volumes in 3Q.2021
Enterprises Industry Value
(VNĐ bn)
Vingroup Jsc Group 15,966
Vietnam Prosperity Commercial Bank Bank 13,000
Asia Commercial Bank Bank 9,700
Orient Commercial Bank Bank 7,000
Novaland Real estate 6,826
Golden Hill Investment Corporation Real estate 5,760
Tien Phong Bank Bank 5,000
BIM Land Jsc Real estate 4,635

MACROECONOMY
FIXED INCOME MARKET
EQUITY MARKET
INDUSTRY AND STOCK PICKS
UPDATES ON
COMMODITIES PRICE
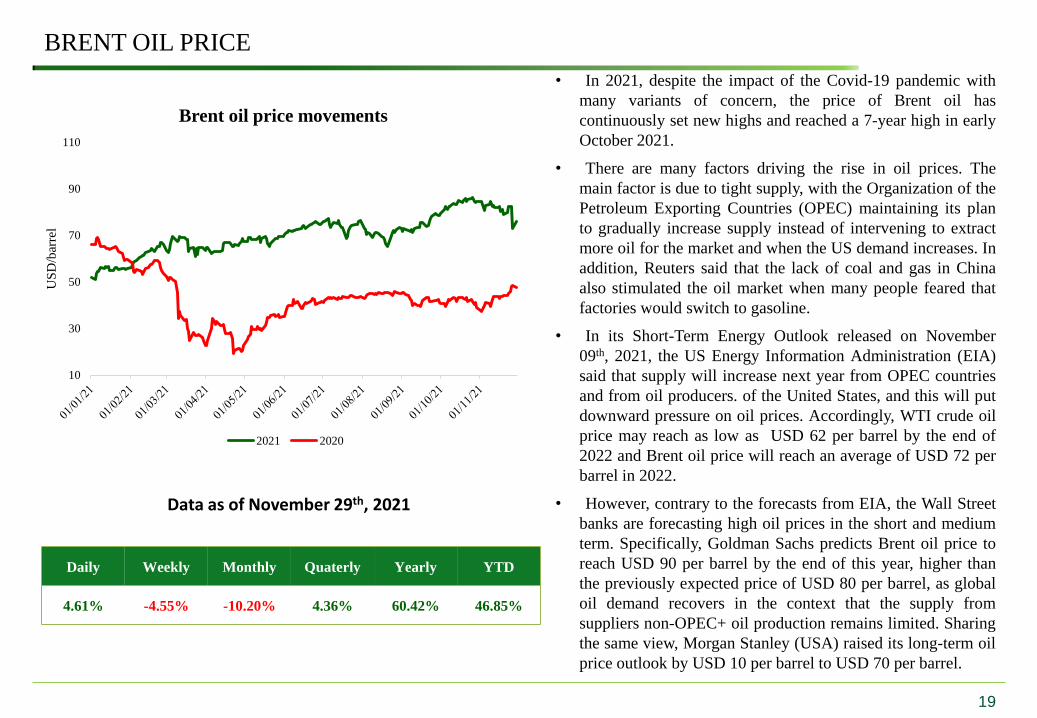
BRENT OIL PRICE
19
Daily Weekly Monthly Quaterly Yearly YTD
4.61% -4.55% -10.20% 4.36% 60.42% 46.85%
Data as of November 29th, 2021
• In 2021, despite the impact of the Covid-19 pandemic with
many variants of concern, the price of Brent oil has
continuously set new highs and reached a 7-year high in early
October 2021.
• There are many factors driving the rise in oil prices. The
main factor is due to tight supply, with the Organization of the
Petroleum Exporting Countries (OPEC) maintaining its plan
to gradually increase supply instead of intervening to extract
more oil for the market and when the US demand increases. In
addition, Reuters said that the lack of coal and gas in China
also stimulated the oil market when many people feared that
factories would switch to gasoline.
• In its Short-Term Energy Outlook released on November
09th, 2021, the US Energy Information Administration (EIA)
said that supply will increase next year from OPEC countries
and from oil producers. of the United States, and this will put
downward pressure on oil prices. Accordingly, WTI crude oil
price may reach as low as USD 62 per barrel by the end of
2022 and Brent oil price will reach an average of USD 72 per
barrel in 2022.
• However, contrary to the forecasts from EIA, the Wall Street
banks are forecasting high oil prices in the short and medium
term. Specifically, Goldman Sachs predicts Brent oil price to
reach USD 90 per barrel by the end of this year, higher than
the previously expected price of USD 80 per barrel, as global
oil demand recovers in the context that the supply from
suppliers non-OPEC+ oil production remains limited. Sharing
the same view, Morgan Stanley (USA) raised its long-term oil
price outlook by USD 10 per barrel to USD 70 per barrel.
10
30
50
70
90
110
US
D/b
arre
l
Brent oil price movements
2021 2020
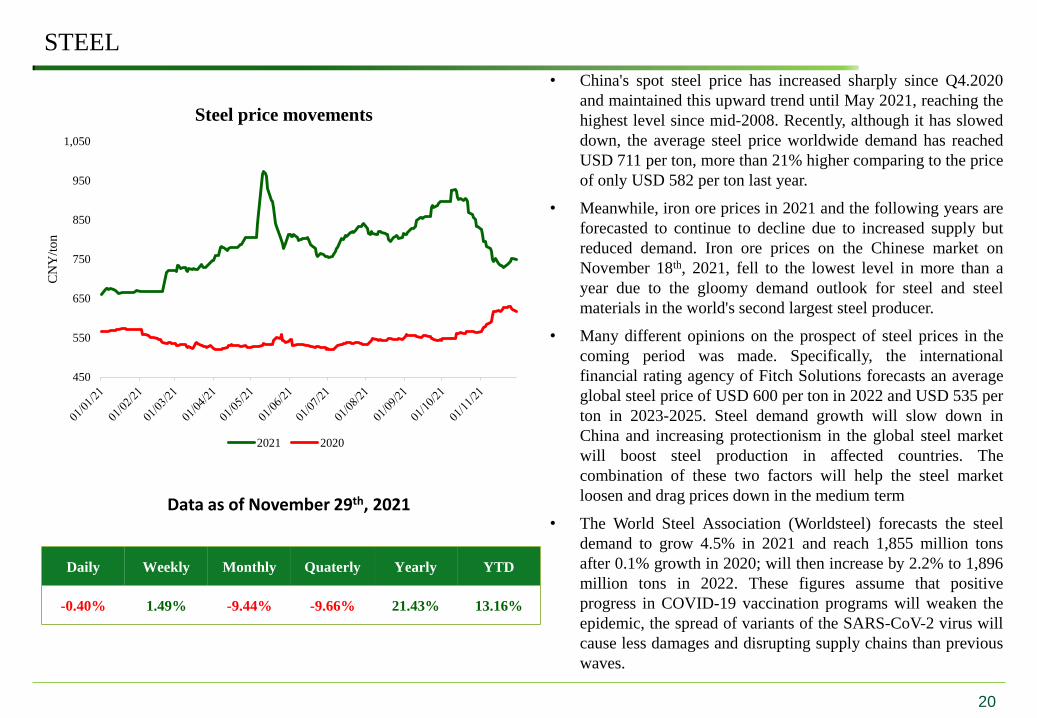
STEEL
20
Daily Weekly Monthly Quaterly Yearly YTD
-0.40% 1.49% -9.44% -9.66% 21.43% 13.16%
• China's spot steel price has increased sharply since Q4.2020
and maintained this upward trend until May 2021, reaching the
highest level since mid-2008. Recently, although it has slowed
down, the average steel price worldwide demand has reached
USD 711 per ton, more than 21% higher comparing to the price
of only USD 582 per ton last year.
• Meanwhile, iron ore prices in 2021 and the following years are
forecasted to continue to decline due to increased supply but
reduced demand. Iron ore prices on the Chinese market on
November 18th, 2021, fell to the lowest level in more than a
year due to the gloomy demand outlook for steel and steel
materials in the world's second largest steel producer.
• Many different opinions on the prospect of steel prices in the
coming period was made. Specifically, the international
financial rating agency of Fitch Solutions forecasts an average
global steel price of USD 600 per ton in 2022 and USD 535 per
ton in 2023-2025. Steel demand growth will slow down in
China and increasing protectionism in the global steel market
will boost steel production in affected countries. The
combination of these two factors will help the steel market
loosen and drag prices down in the medium term
• The World Steel Association (Worldsteel) forecasts the steel
demand to grow 4.5% in 2021 and reach 1,855 million tons
after 0.1% growth in 2020; will then increase by 2.2% to 1,896
million tons in 2022. These figures assume that positive
progress in COVID-19 vaccination programs will weaken the
epidemic, the spread of variants of the SARS-CoV-2 virus will
cause less damages and disrupting supply chains than previous
waves.
Data as of November 29th, 2021
450
550
650
750
850
950
1,050
CN
Y/t
on
Steel price movements
2021 2020
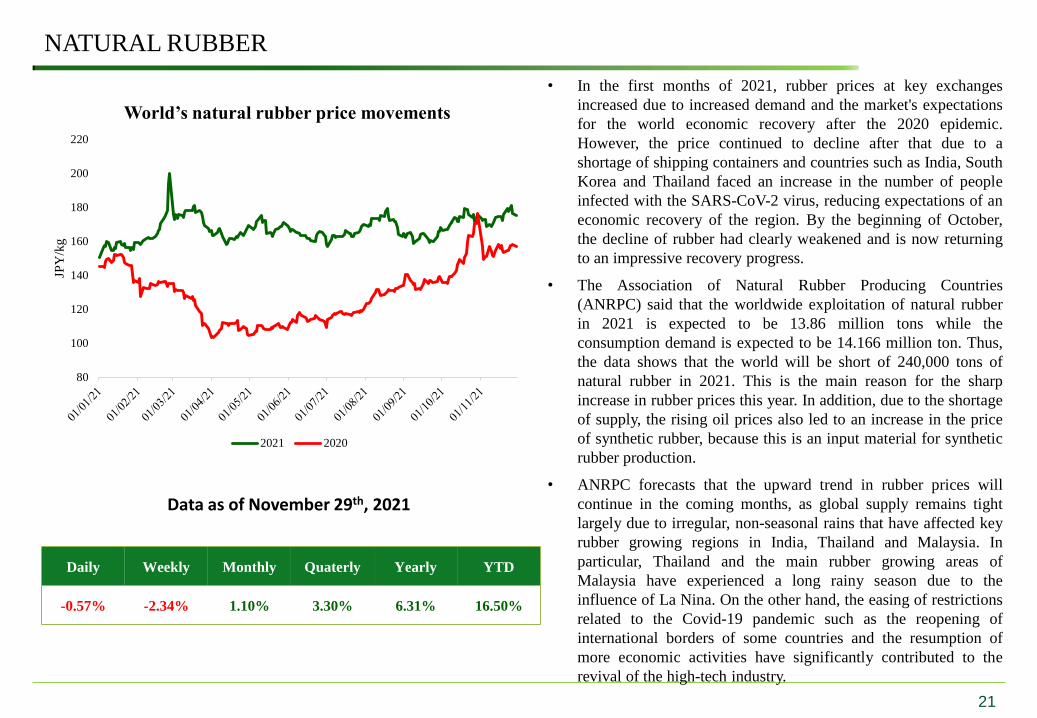
NATURAL RUBBER
21
Daily Weekly Monthly Quaterly Yearly YTD
-0.57% -2.34% 1.10% 3.30% 6.31% 16.50%
• In the first months of 2021, rubber prices at key exchanges
increased due to increased demand and the market's expectations
for the world economic recovery after the 2020 epidemic.
However, the price continued to decline after that due to a
shortage of shipping containers and countries such as India, South
Korea and Thailand faced an increase in the number of people
infected with the SARS-CoV-2 virus, reducing expectations of an
economic recovery of the region. By the beginning of October,
the decline of rubber had clearly weakened and is now returning
to an impressive recovery progress.
• The Association of Natural Rubber Producing Countries
(ANRPC) said that the worldwide exploitation of natural rubber
in 2021 is expected to be 13.86 million tons while the
consumption demand is expected to be 14.166 million ton. Thus,
the data shows that the world will be short of 240,000 tons of
natural rubber in 2021. This is the main reason for the sharp
increase in rubber prices this year. In addition, due to the shortage
of supply, the rising oil prices also led to an increase in the price
of synthetic rubber, because this is an input material for synthetic
rubber production.
• ANRPC forecasts that the upward trend in rubber prices will
continue in the coming months, as global supply remains tight
largely due to irregular, non-seasonal rains that have affected key
rubber growing regions in India, Thailand and Malaysia. In
particular, Thailand and the main rubber growing areas of
Malaysia have experienced a long rainy season due to the
influence of La Nina. On the other hand, the easing of restrictions
related to the Covid-19 pandemic such as the reopening of
international borders of some countries and the resumption of
more economic activities have significantly contributed to the
revival of the high-tech industry.
Data as of November 29th, 2021
80
100
120
140
160
180
200
220
JPY
/kg
World’s natural rubber price movements
2021 2020
MACROECONOMY EQUITY MARKET INDUSTRY & STOCK PICKS FIXED INCOME
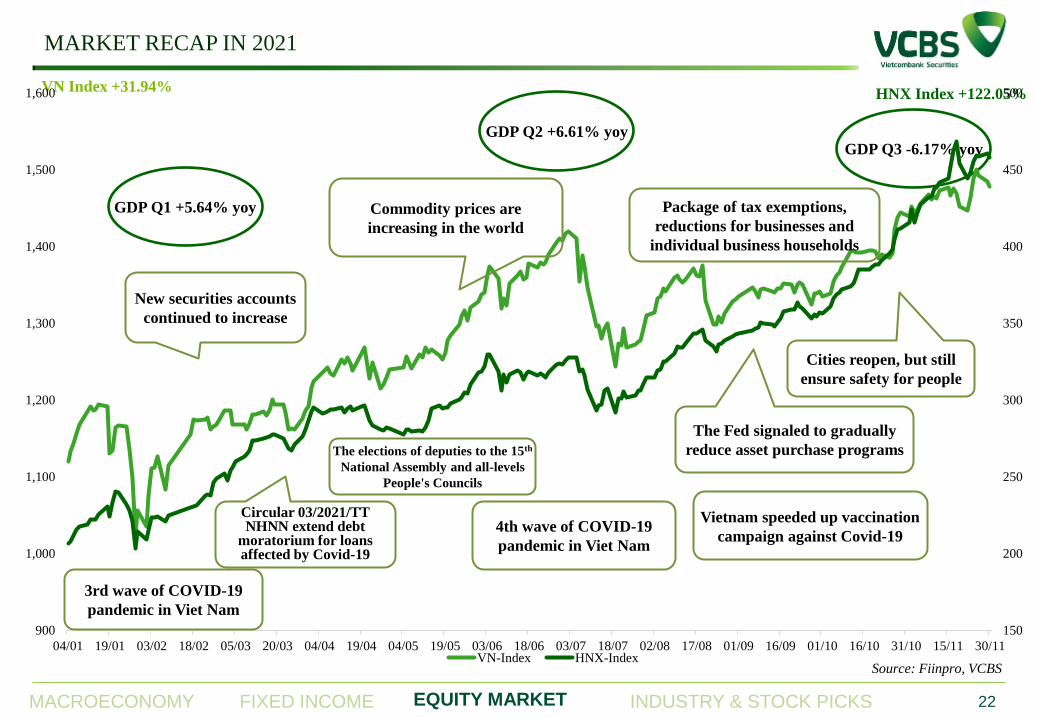
MARKET RECAP IN 2021
22
Source: Fiinpro, VCBS
VN Index +31.94% HNX Index +122.05%
GDP Q3 -6.17% yoy
150
200
250
300
350
400
450
500
900
1,000
1,100
1,200
1,300
1,400
1,500
1,600
04/01 19/01 03/02 18/02 05/03 20/03 04/04 19/04 04/05 19/05 03/06 18/06 03/07 18/07 02/08 17/08 01/09 16/09 01/10 16/10 31/10 15/11 30/11VN-Index HNX-Index
4th wave of COVID-19
pandemic in Viet Nam
New securities accounts
continued to increase
Commodity prices are
increasing in the world
Vietnam speeded up vaccination
campaign against Covid-19
The Fed signaled to gradually
reduce asset purchase programs
Package of tax exemptions,
reductions for businesses and
individual business households
Cities reopen, but still
ensure safety for people
3rd wave of COVID-19
pandemic in Viet Nam
GDP Q2 +6.61% yoy
GDP Q1 +5.64% yoy
The elections of deputies to the 15th
National Assembly and all-levels
People's Councils
Circular 03/2021/TT NHNN extend debt
moratorium for loans affected by Covid-19
MACROECONOMY EQUITY MARKET INDUSTRY & STOCK PICKS FIXED INCOME
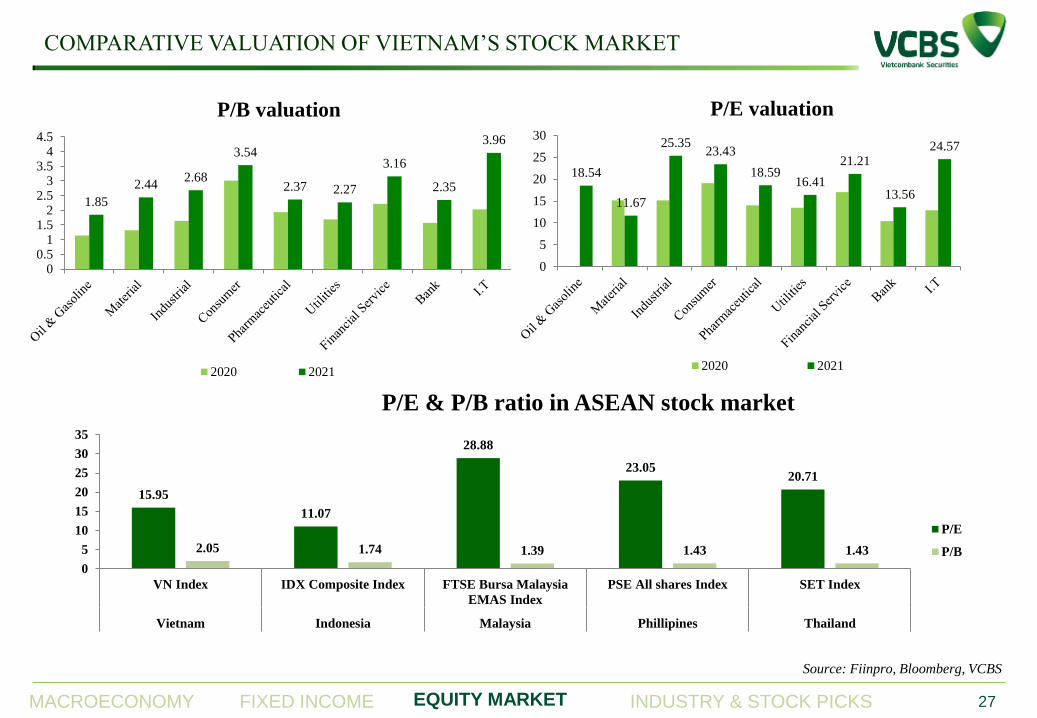
COMPARATIVE VALUATION OF VIETNAM’S STOCK MARKET
27
Source: Fiinpro, Bloomberg, VCBS
15.95
11.07
28.88
23.05 20.71
2.05 1.74 1.39 1.43 1.43
0
5
10
15
20
25
30
35
VN Index IDX Composite Index FTSE Bursa Malaysia
EMAS Index
PSE All shares Index SET Index
Vietnam Indonesia Malaysia Phillipines Thailand
P/E & P/B ratio in ASEAN stock market
P/E
P/B
1.85
2.44 2.68
3.54
2.37 2.27
3.16
2.35
3.96
00.5
11.5
22.5
33.5
44.5
P/B valuation
2020 2021
18.54
11.67
25.35 23.43
18.59 16.41
21.21
13.56
24.57
0
5
10
15
20
25
30
P/E valuation
2020 2021
MACROECONOMY EQUITY MARKET INDUSTRY & STOCK PICKS FIXED INCOME
HIGHLIGHTS OF VN INDEX
25
Source: Fiinpro, Bloomberg, VCBS
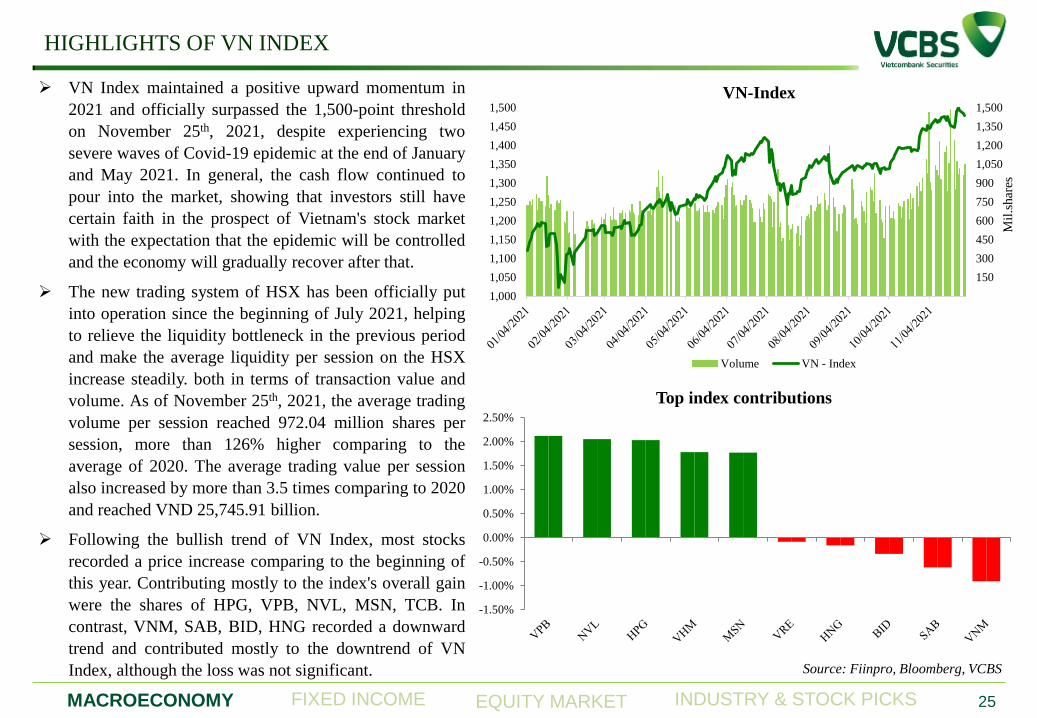
VN Index maintained a positive upward momentum in
2021 and officially surpassed the 1,500-point threshold
on November 25th, 2021, despite experiencing two
severe waves of Covid-19 epidemic at the end of January
and May 2021. In general, the cash flow continued to
pour into the market, showing that investors still have
certain faith in the prospect of Vietnam's stock market
with the expectation that the epidemic will be controlled
and the economy will gradually recover after that.
The new trading system of HSX has been officially put
into operation since the beginning of July 2021, helping
to relieve the liquidity bottleneck in the previous period
and make the average liquidity per session on the HSX
increase steadily. both in terms of transaction value and
volume. As of November 25th, 2021, the average trading
volume per session reached 972.04 million shares per
session, more than 126% higher comparing to the
average of 2020. The average trading value per session
also increased by more than 3.5 times comparing to 2020
and reached VND 25,745.91 billion.
Following the bullish trend of VN Index, most stocks
recorded a price increase comparing to the beginning of
this year. Contributing mostly to the index's overall gain
were the shares of HPG, VPB, NVL, MSN, TCB. In
contrast, VNM, SAB, BID, HNG recorded a downward
trend and contributed mostly to the downtrend of VN
Index, although the loss was not significant.
150
300
450
600
750
900
1,050
1,200
1,350
1,500
1,000
1,050
1,100
1,150
1,200
1,250
1,300
1,350
1,400
1,450
1,500
Mil
.shar
es
VN-Index
Volume VN - Index
-1.50%
-1.00%
-0.50%
0.00%
0.50%
1.00%
1.50%
2.00%
2.50%
Top index contributions
MACROECONOMY EQUITY MARKET INDUSTRY & STOCK PICKS FIXED INCOME
FOREIGN INVESTORS’ HIGHLIGHTS
25
Source: Fiinpro
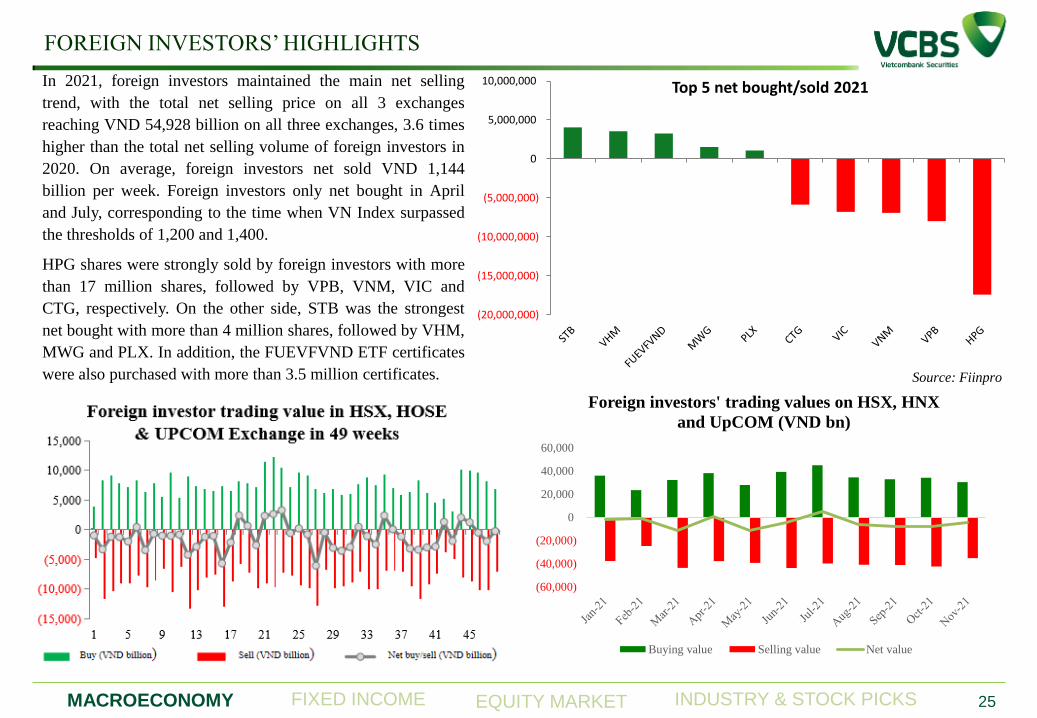
In 2021, foreign investors maintained the main net selling
trend, with the total net selling price on all 3 exchanges
reaching VND 54,928 billion on all three exchanges, 3.6 times
higher than the total net selling volume of foreign investors in
2020. On average, foreign investors net sold VND 1,144
billion per week. Foreign investors only net bought in April
and July, corresponding to the time when VN Index surpassed
the thresholds of 1,200 and 1,400.
HPG shares were strongly sold by foreign investors with more
than 17 million shares, followed by VPB, VNM, VIC and
CTG, respectively. On the other side, STB was the strongest
net bought with more than 4 million shares, followed by VHM,
MWG and PLX. In addition, the FUEVFVND ETF certificates
were also purchased with more than 3.5 million certificates.
(20,000,000)
(15,000,000)
(10,000,000)
(5,000,000)
0
5,000,000
10,000,000 Top 5 net bought/sold 2021
(60,000)
(40,000)
(20,000)
0
20,000
40,000
60,000
Foreign investors' trading values on HSX, HNX
and UpCOM (VND bn)
Buying value Selling value Net value
MACROECONOMY EQUITY MARKET INDUSTRY & STOCK PICKS FIXED INCOME
VN30 INDEX HIGHLIGHT
26
Source: Fiinpro, Bloomberg, VCBS
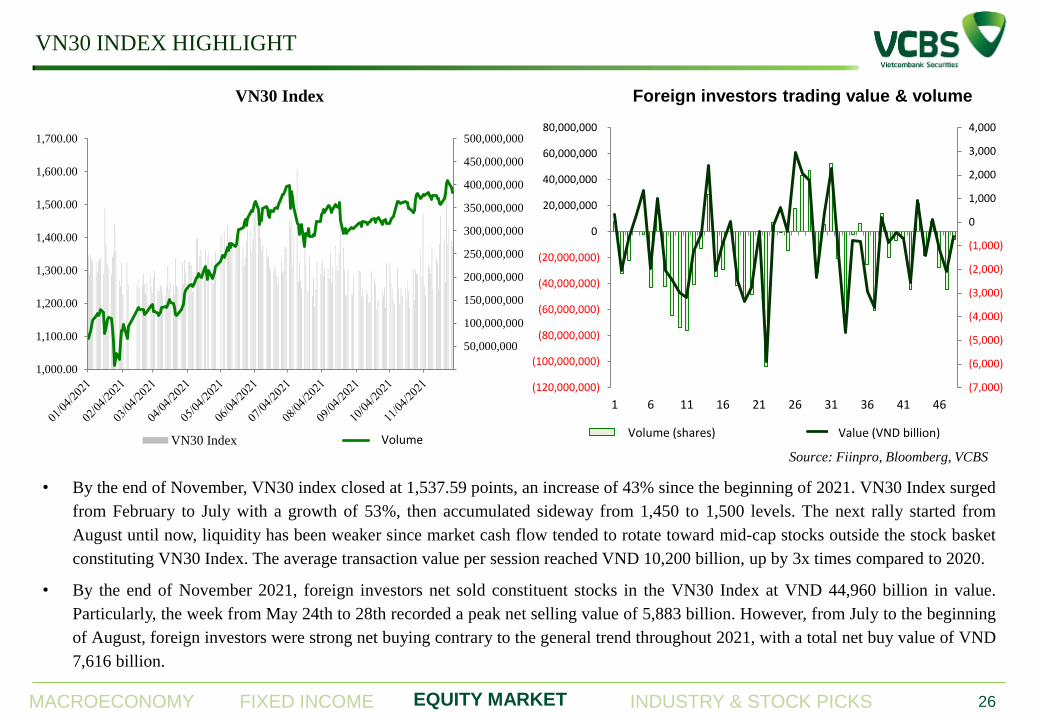
• By the end of November, VN30 index closed at 1,537.59 points, an increase of 43% since the beginning of 2021. VN30 Index surged
from February to July with a growth of 53%, then accumulated sideway from 1,450 to 1,500 levels. The next rally started from
August until now, liquidity has been weaker since market cash flow tended to rotate toward mid-cap stocks outside the stock basket
constituting VN30 Index. The average transaction value per session reached VND 10,200 billion, up by 3x times compared to 2020.
• By the end of November 2021, foreign investors net sold constituent stocks in the VN30 Index at VND 44,960 billion in value.
Particularly, the week from May 24th to 28th recorded a peak net selling value of 5,883 billion. However, from July to the beginning
of August, foreign investors were strong net buying contrary to the general trend throughout 2021, with a total net buy value of VND
7,616 billion.
50,000,000
100,000,000
150,000,000
200,000,000
250,000,000
300,000,000
350,000,000
400,000,000
450,000,000
500,000,000
1,000.00
1,100.00
1,200.00
1,300.00
1,400.00
1,500.00
1,600.00
1,700.00
VN30 Index
VN30 Index Đóng cửa
(7,000)
(6,000)
(5,000)
(4,000)
(3,000)
(2,000)
(1,000)
0
1,000
2,000
3,000
4,000
(120,000,000)
(100,000,000)
(80,000,000)
(60,000,000)
(40,000,000)
(20,000,000)
0
20,000,000
40,000,000
60,000,000
80,000,000
1 6 11 16 21 26 31 36 41 46
Foreign investors trading value & volume
Khối lượng ròng(CP) Giá trị ròng(tỷ VNĐ) Volume
Volume (shares) Value (VND billion)
MACROECONOMY EQUITY MARKET INDUSTRY & STOCK PICKS FIXED INCOME
DERIVATIVE MARKET HIGHLIGHT
27
Source: Fiinpro, Bloomberg, VCBS
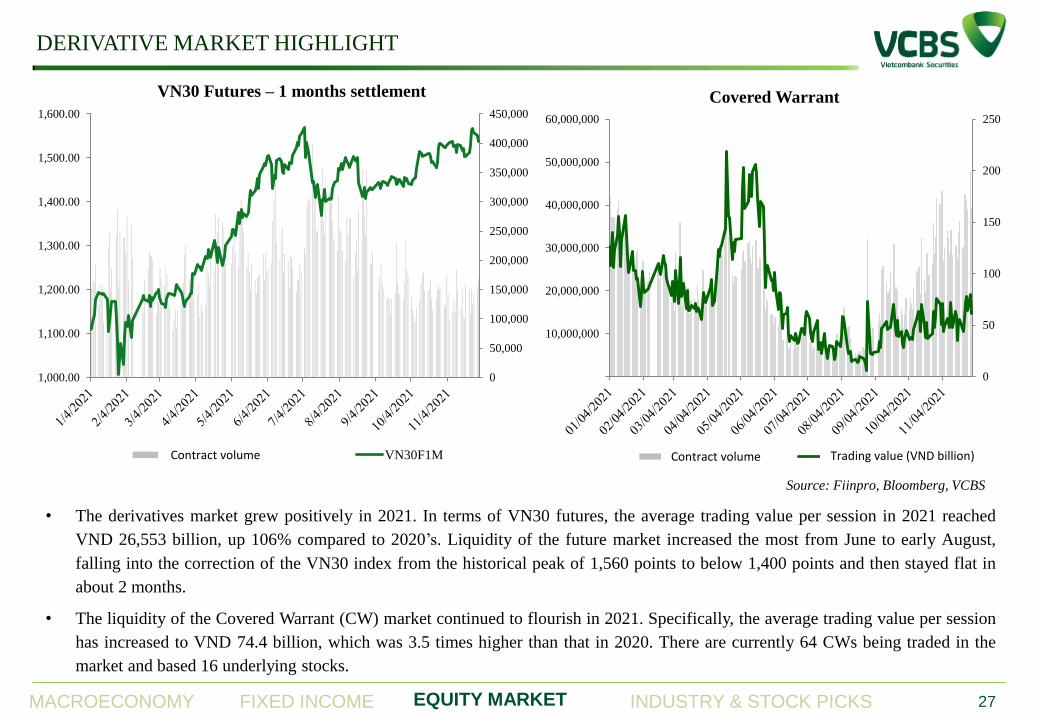
• The derivatives market grew positively in 2021. In terms of VN30 futures, the average trading value per session in 2021 reached
VND 26,553 billion, up 106% compared to 2020’s. Liquidity of the future market increased the most from June to early August,
falling into the correction of the VN30 index from the historical peak of 1,560 points to below 1,400 points and then stayed flat in
about 2 months.
• The liquidity of the Covered Warrant (CW) market continued to flourish in 2021. Specifically, the average trading value per session
has increased to VND 74.4 billion, which was 3.5 times higher than that in 2020. There are currently 64 CWs being traded in the
market and based 16 underlying stocks.
0
50,000
100,000
150,000
200,000
250,000
300,000
350,000
400,000
450,000
1,000.00
1,100.00
1,200.00
1,300.00
1,400.00
1,500.00
1,600.00
VN30 Futures – 1 months settlement
KLGD (Hợp đồng) VN30F1M
0
50
100
150
200
250
10,000,000
20,000,000
30,000,000
40,000,000
50,000,000
60,000,000
Covered Warrant
KLGD GTGD (tỷ đồng) Contract volume Contract volume Trading value (VND billion)

STOCK MARKET
OUTLOOK IN 2022
MACROECONOMY EQUITY MARKET INDUSTRY & STOCK PICKS FIXED INCOME
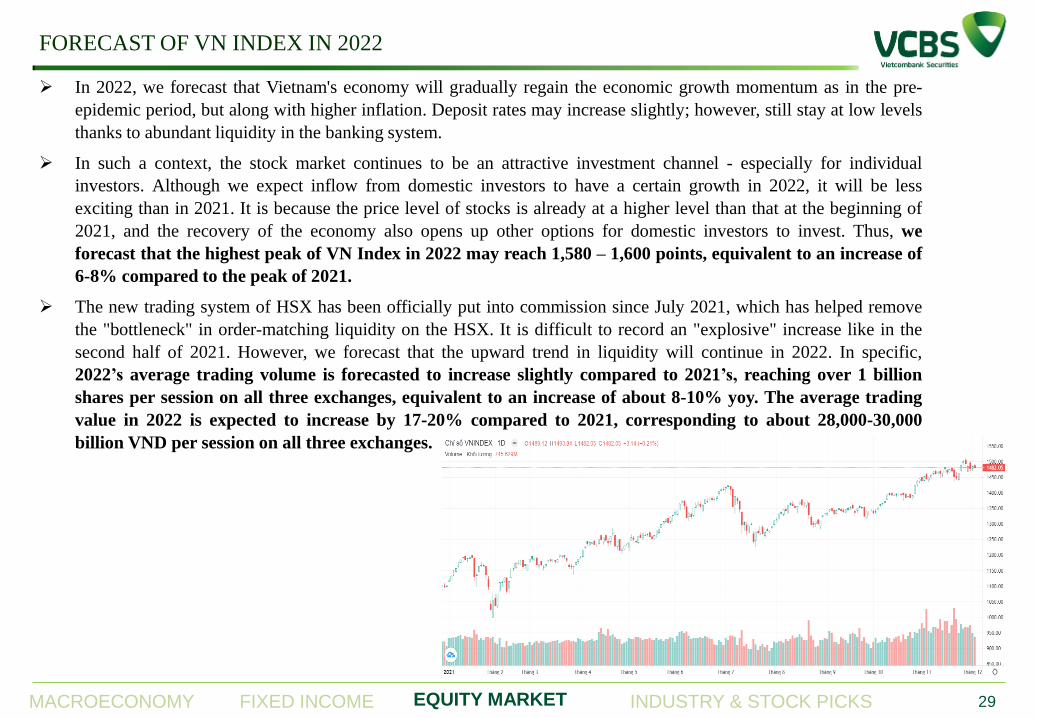
In 2022, we forecast that Vietnam's economy will gradually regain the economic growth momentum as in the pre-
epidemic period, but along with higher inflation. Deposit rates may increase slightly; however, still stay at low levels
thanks to abundant liquidity in the banking system.
In such a context, the stock market continues to be an attractive investment channel - especially for individual
investors. Although we expect inflow from domestic investors to have a certain growth in 2022, it will be less
exciting than in 2021. It is because the price level of stocks is already at a higher level than that at the beginning of
2021, and the recovery of the economy also opens up other options for domestic investors to invest. Thus, we
forecast that the highest peak of VN Index in 2022 may reach 1,580 – 1,600 points, equivalent to an increase of
6-8% compared to the peak of 2021.
The new trading system of HSX has been officially put into commission since July 2021, which has helped remove
the "bottleneck" in order-matching liquidity on the HSX. It is difficult to record an "explosive" increase like in the
second half of 2021. However, we forecast that the upward trend in liquidity will continue in 2022. In specific,
2022’s average trading volume is forecasted to increase slightly compared to 2021’s, reaching over 1 billion
shares per session on all three exchanges, equivalent to an increase of about 8-10% yoy. The average trading
value in 2022 is expected to increase by 17-20% compared to 2021, corresponding to about 28,000-30,000
billion VND per session on all three exchanges.
FORECAST OF VN INDEX IN 2022
29
MACROECONOMY EQUITY MARKET INDUSTRY & STOCK PICKS FIXED INCOME
INVESTMENT SUGGESTIONS IN 2022
30
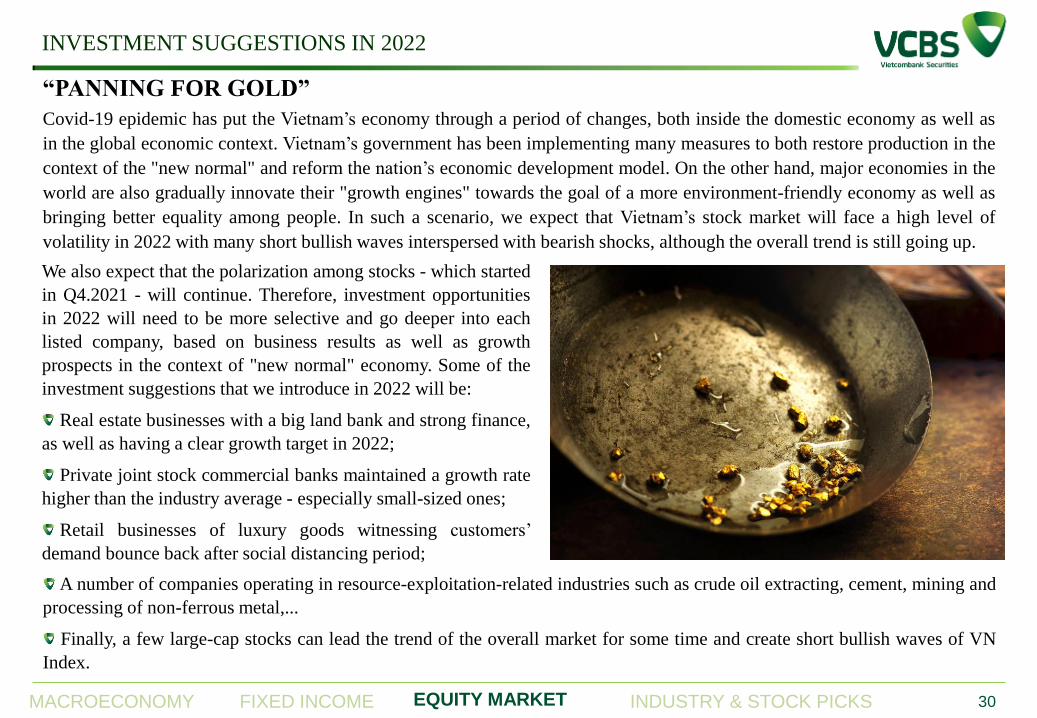
“PANNING FOR GOLD”
Covid-19 epidemic has put the Vietnam’s economy through a period of changes, both inside the domestic economy as well as
in the global economic context. Vietnam’s government has been implementing many measures to both restore production in the
context of the "new normal" and reform the nation’s economic development model. On the other hand, major economies in the
world are also gradually innovate their "growth engines" towards the goal of a more environment-friendly economy as well as
bringing better equality among people. In such a scenario, we expect that Vietnam’s stock market will face a high level of
volatility in 2022 with many short bullish waves interspersed with bearish shocks, although the overall trend is still going up.
We also expect that the polarization among stocks - which started
in Q4.2021 - will continue. Therefore, investment opportunities
in 2022 will need to be more selective and go deeper into each
listed company, based on business results as well as growth
prospects in the context of "new normal" economy. Some of the
investment suggestions that we introduce in 2022 will be:
Real estate businesses with a big land bank and strong finance,
as well as having a clear growth target in 2022;
Private joint stock commercial banks maintained a growth rate
higher than the industry average - especially small-sized ones;
Retail businesses of luxury goods witnessing customers’
demand bounce back after social distancing period;
A number of companies operating in resource-exploitation-related industries such as crude oil extracting, cement, mining and
processing of non-ferrous metal,...
Finally, a few large-cap stocks can lead the trend of the overall market for some time and create short bullish waves of VN
Index.
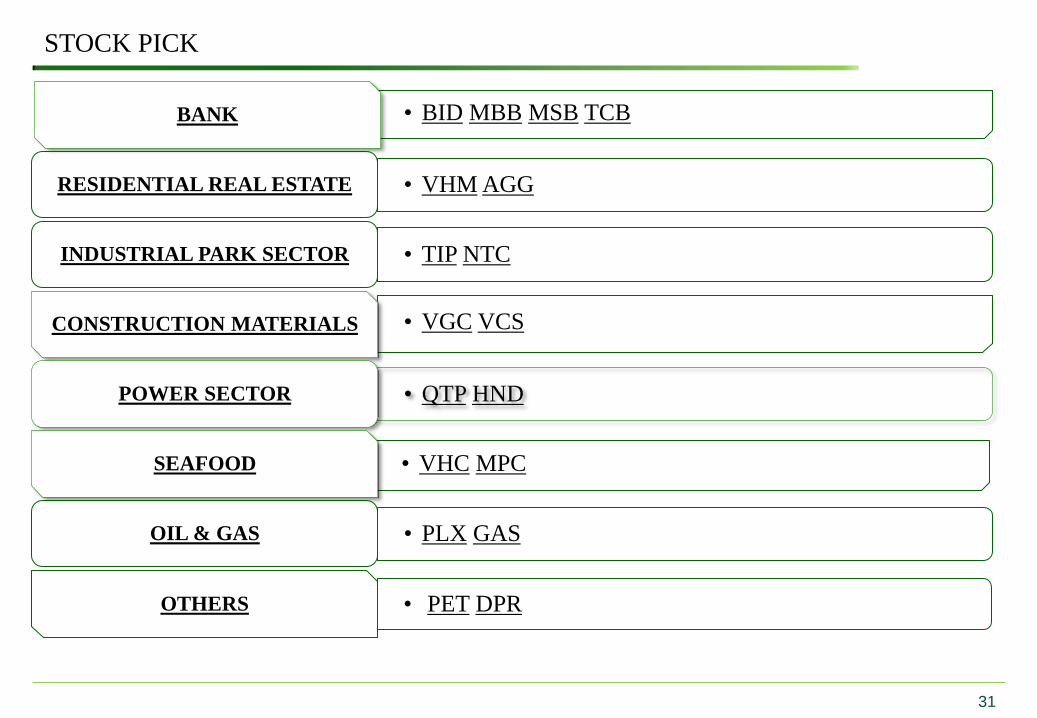
STOCK PICK
31
• BID MBB MSB TCB BANK
• VHM AGG RESIDENTIAL REAL ESTATE
• TIP NTC INDUSTRIAL PARK SECTOR
• VGC VCS CONSTRUCTION MATERIALS
• QTP HND POWER SECTOR
• VHC MPC SEAFOOD
• PLX GAS OIL & GAS
• PET DPR OTHERS
BANKING SECTOR
MACROECONOMY EQUITY MARKET INDUSTRY & STOCK PICKS FIXED INCOME Back
BANKING SECTOR – CREDIT
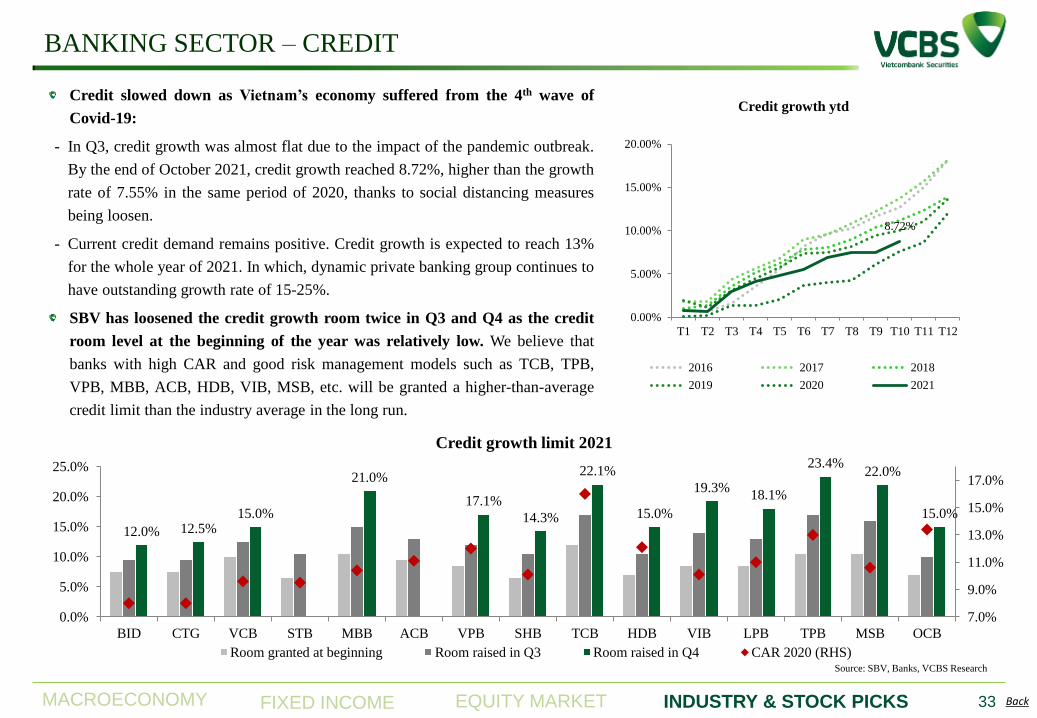
Credit slowed down as Vietnam’s economy suffered from the 4th wave of
Covid-19:
- In Q3, credit growth was almost flat due to the impact of the pandemic outbreak.
By the end of October 2021, credit growth reached 8.72%, higher than the growth
rate of 7.55% in the same period of 2020, thanks to social distancing measures
being loosen.
- Current credit demand remains positive. Credit growth is expected to reach 13%
for the whole year of 2021. In which, dynamic private banking group continues to
have outstanding growth rate of 15-25%.
SBV has loosened the credit growth room twice in Q3 and Q4 as the credit
room level at the beginning of the year was relatively low. We believe that
banks with high CAR and good risk management models such as TCB, TPB,
VPB, MBB, ACB, HDB, VIB, MSB, etc. will be granted a higher-than-average
credit limit than the industry average in the long run.
8.72%
0.00%
5.00%
10.00%
15.00%
20.00%
T1 T2 T3 T4 T5 T6 T7 T8 T9 T10 T11 T12
Credit growth ytd
2016 2017 2018
2019 2020 2021
Source: SBV, Banks, VCBS Research
12.0% 12.5% 15.0%
21.0%
17.1%
14.3%
22.1%
15.0%
19.3% 18.1%
23.4% 22.0%
15.0%
7.0%
9.0%
11.0%
13.0%
15.0%
17.0%
0.0%
5.0%
10.0%
15.0%
20.0%
25.0%
BID CTG VCB STB MBB ACB VPB SHB TCB HDB VIB LPB TPB MSB OCB
Credit growth limit 2021
Room granted at beginning Room raised in Q3 Room raised in Q4 CAR 2020 (RHS)
33
MACROECONOMY EQUITY MARKET INDUSTRY & STOCK PICKS FIXED INCOME Back
BANKING SECTOR – CREDIT
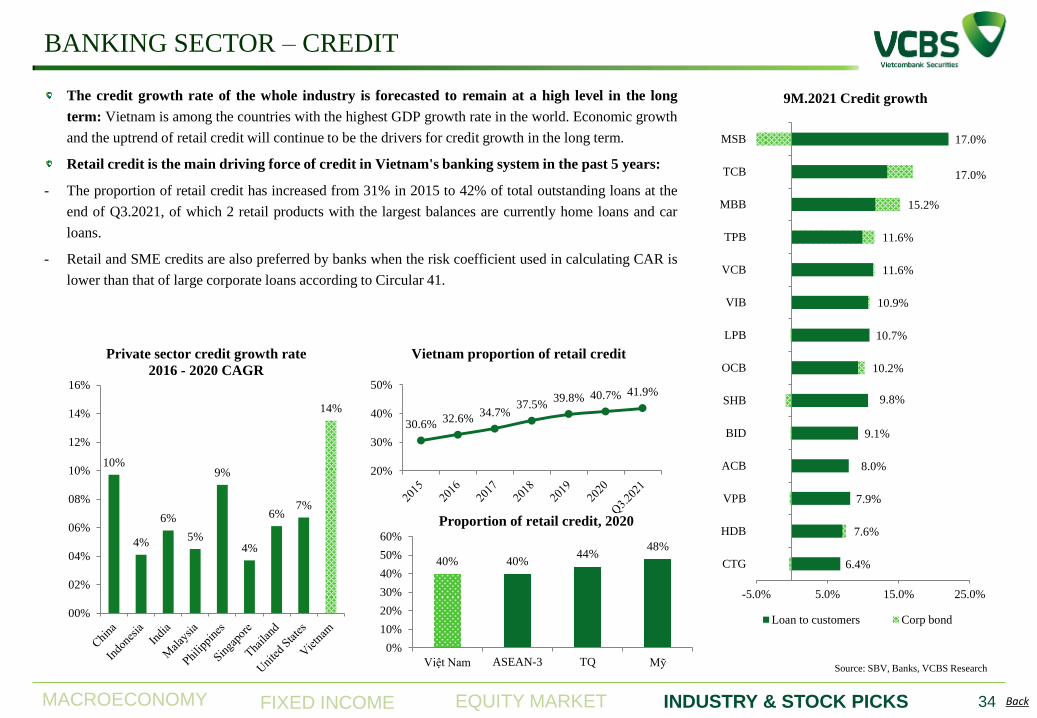
The credit growth rate of the whole industry is forecasted to remain at a high level in the long
term: Vietnam is among the countries with the highest GDP growth rate in the world. Economic growth
and the uptrend of retail credit will continue to be the drivers for credit growth in the long term.
Retail credit is the main driving force of credit in Vietnam's banking system in the past 5 years:
- The proportion of retail credit has increased from 31% in 2015 to 42% of total outstanding loans at the
end of Q3.2021, of which 2 retail products with the largest balances are currently home loans and car
loans.
- Retail and SME credits are also preferred by banks when the risk coefficient used in calculating CAR is
lower than that of large corporate loans according to Circular 41.
10%
4%
6%
5%
9%
4%
6% 7%
14%
00%
02%
04%
06%
08%
10%
12%
14%
16%
Private sector credit growth rate
2016 - 2020 CAGR
30.6% 32.6%
34.7% 37.5%
39.8% 40.7% 41.9%
20%
30%
40%
50%
Vietnam proportion of retail credit
Source: SBV, Banks, VCBS Research
6.4%
7.6%
7.9%
8.0%
9.1%
9.8%
10.2%
10.7%
10.9%
11.6%
11.6%
15.2%
17.0%
17.0%
-5.0% 5.0% 15.0% 25.0%
CTG
HDB
VPB
ACB
BID
SHB
OCB
LPB
VIB
VCB
TPB
MBB
TCB
MSB
9M.2021 Credit growth
Loan to customers Corp bond
40% 40% 44%
48%
0%
10%
20%
30%
40%
50%
60%
Việt Nam ASEAN-3 TQ Mỹ
Proportion of retail credit, 2020
34
MACROECONOMY EQUITY MARKET INDUSTRY & STOCK PICKS FIXED INCOME Back
BANKING SECTOR – CREDIT
35
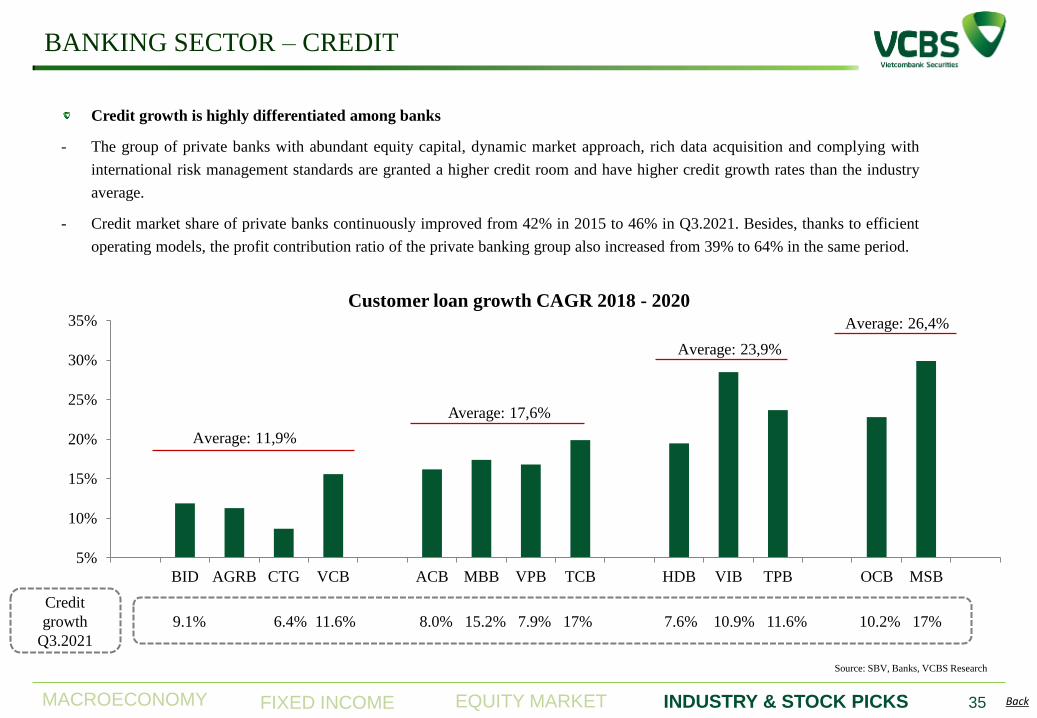
9.1% 6.4% 11.6% 8.0% 15.2% 7.9% 17% 7.6% 10.9% 11.6% 10.2% 17%
Credit
growth
Q3.2021
Source: SBV, Banks, VCBS Research
5%
10%
15%
20%
25%
30%
35%
BID AGRB CTG VCB ACB MBB VPB TCB HDB VIB TPB OCB MSB
Customer loan growth CAGR 2018 - 2020
Average: 17,6%
Average: 23,9%
Average: 26,4%
Average: 11,9%
Credit growth is highly differentiated among banks
- The group of private banks with abundant equity capital, dynamic market approach, rich data acquisition and complying with
international risk management standards are granted a higher credit room and have higher credit growth rates than the industry
average.
- Credit market share of private banks continuously improved from 42% in 2015 to 46% in Q3.2021. Besides, thanks to efficient
operating models, the profit contribution ratio of the private banking group also increased from 39% to 64% in the same period.
MACROECONOMY EQUITY MARKET INDUSTRY & STOCK PICKS FIXED INCOME Back
BANKING SECTOR – CREDIT
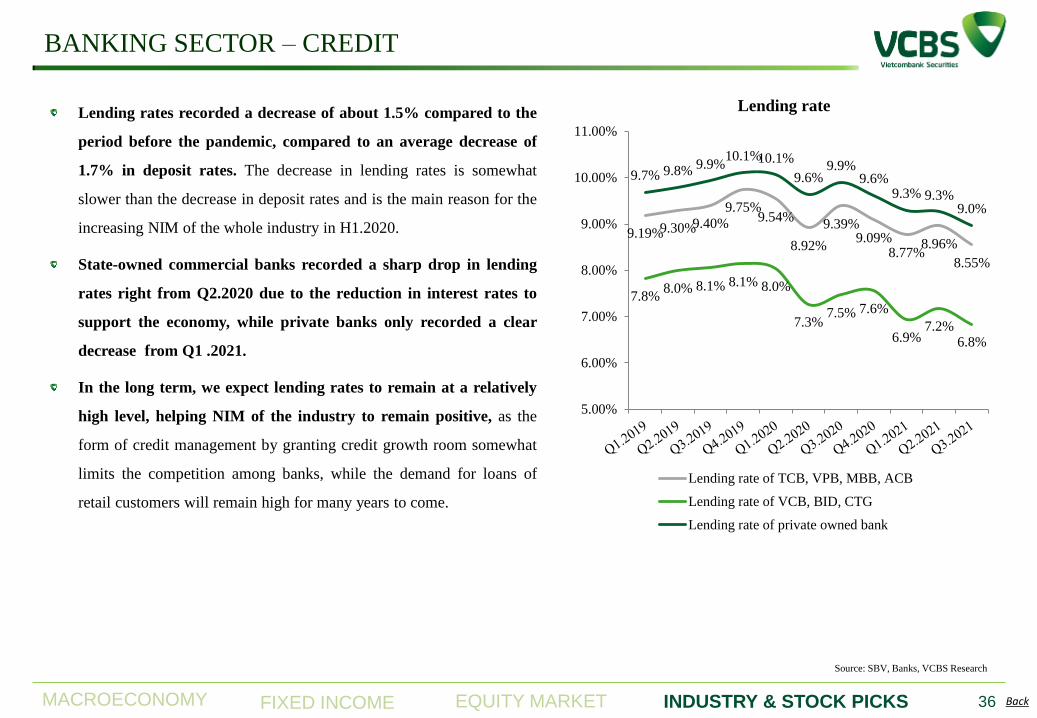
Lending rates recorded a decrease of about 1.5% compared to the
period before the pandemic, compared to an average decrease of
1.7% in deposit rates. The decrease in lending rates is somewhat
slower than the decrease in deposit rates and is the main reason for the
increasing NIM of the whole industry in H1.2020.
State-owned commercial banks recorded a sharp drop in lending
rates right from Q2.2020 due to the reduction in interest rates to
support the economy, while private banks only recorded a clear
decrease from Q1 .2021.
In the long term, we expect lending rates to remain at a relatively
high level, helping NIM of the industry to remain positive, as the
form of credit management by granting credit growth room somewhat
limits the competition among banks, while the demand for loans of
retail customers will remain high for many years to come.
Source: SBV, Banks, VCBS Research
9.19% 9.30% 9.40%
9.75% 9.54%
8.92%
9.39% 9.09%
8.77% 8.96%
8.55%
7.8% 8.0% 8.1% 8.1% 8.0%
7.3% 7.5% 7.6%
6.9% 7.2%
6.8%
9.7% 9.8% 9.9%
10.1% 10.1%
9.6% 9.9%
9.6% 9.3% 9.3%
9.0%
5.00%
6.00%
7.00%
8.00%
9.00%
10.00%
11.00%
Lending rate
Lending rate of TCB, VPB, MBB, ACB
Lending rate of VCB, BID, CTG
Lending rate of private owned bank
36
MACROECONOMY EQUITY MARKET INDUSTRY & STOCK PICKS FIXED INCOME Back
BANKING SECTOR – DEPOSIT
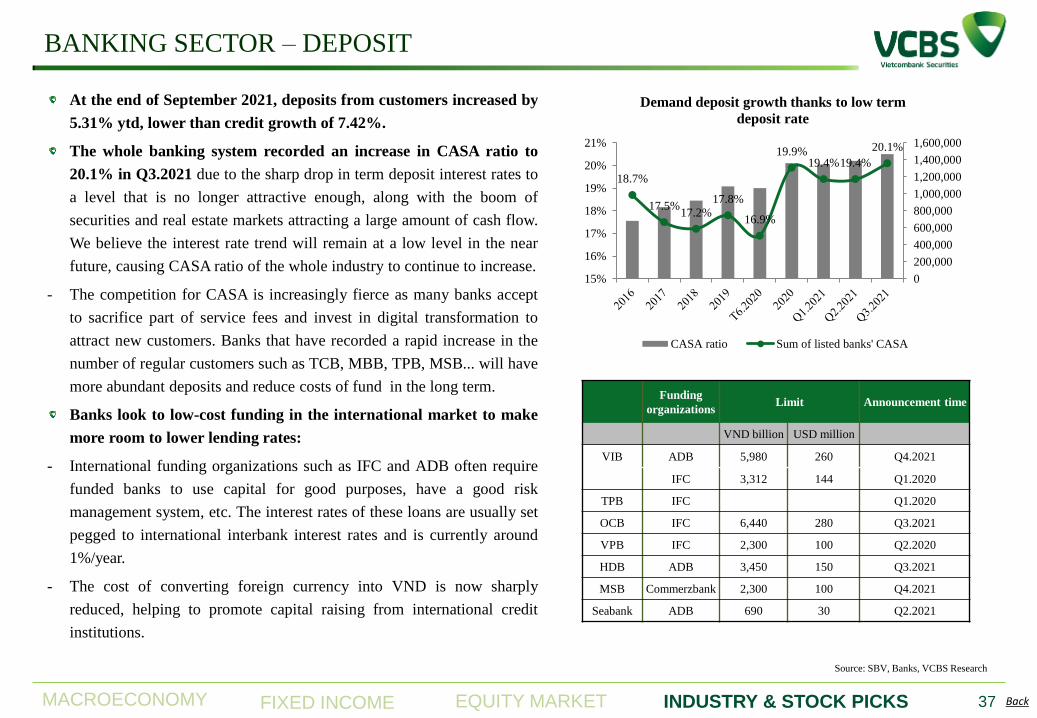
At the end of September 2021, deposits from customers increased by
5.31% ytd, lower than credit growth of 7.42%.
The whole banking system recorded an increase in CASA ratio to
20.1% in Q3.2021 due to the sharp drop in term deposit interest rates to
a level that is no longer attractive enough, along with the boom of
securities and real estate markets attracting a large amount of cash flow.
We believe the interest rate trend will remain at a low level in the near
future, causing CASA ratio of the whole industry to continue to increase.
- The competition for CASA is increasingly fierce as many banks accept
to sacrifice part of service fees and invest in digital transformation to
attract new customers. Banks that have recorded a rapid increase in the
number of regular customers such as TCB, MBB, TPB, MSB... will have
more abundant deposits and reduce costs of fund in the long term.
Banks look to low-cost funding in the international market to make
more room to lower lending rates:
- International funding organizations such as IFC and ADB often require
funded banks to use capital for good purposes, have a good risk
management system, etc. The interest rates of these loans are usually set
pegged to international interbank interest rates and is currently around
1%/year.
- The cost of converting foreign currency into VND is now sharply
reduced, helping to promote capital raising from international credit
institutions.
Funding
organizations Limit Announcement time
VND billion USD million
VIB ADB 5,980 260 Q4.2021
IFC 3,312 144 Q1.2020
TPB IFC Q1.2020
OCB IFC 6,440 280 Q3.2021
VPB IFC 2,300 100 Q2.2020
HDB ADB 3,450 150 Q3.2021
MSB Commerzbank 2,300 100 Q4.2021
Seabank ADB 690 30 Q2.2021
Source: SBV, Banks, VCBS Research
18.7%
17.5% 17.2%
17.8%
16.9%
19.9% 19.4% 19.4%
20.1%
0
200,000
400,000
600,000
800,000
1,000,000
1,200,000
1,400,000
1,600,000
15%
16%
17%
18%
19%
20%
21%
Demand deposit growth thanks to low term
deposit rate
CASA ratio Sum of listed banks' CASA
37
MACROECONOMY EQUITY MARKET INDUSTRY & STOCK PICKS FIXED INCOME Back
BANKING SECTOR – DEPOSIT
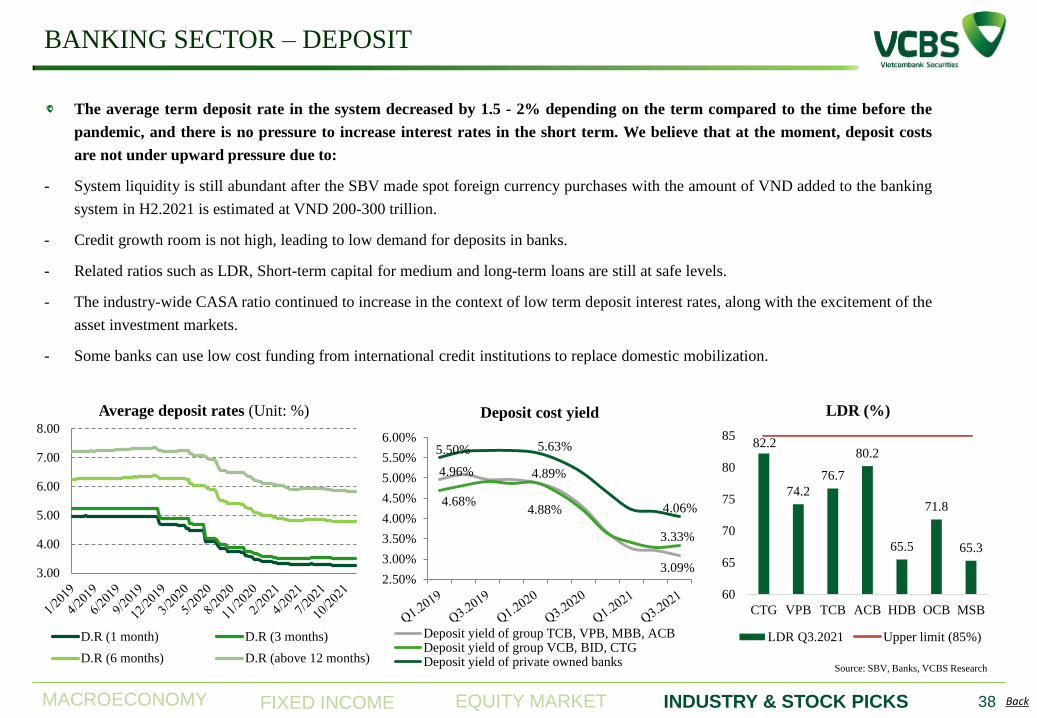
The average term deposit rate in the system decreased by 1.5 - 2% depending on the term compared to the time before the
pandemic, and there is no pressure to increase interest rates in the short term. We believe that at the moment, deposit costs
are not under upward pressure due to:
- System liquidity is still abundant after the SBV made spot foreign currency purchases with the amount of VND added to the banking
system in H2.2021 is estimated at VND 200-300 trillion.
- Credit growth room is not high, leading to low demand for deposits in banks.
- Related ratios such as LDR, Short-term capital for medium and long-term loans are still at safe levels.
- The industry-wide CASA ratio continued to increase in the context of low term deposit interest rates, along with the excitement of the
asset investment markets.
- Some banks can use low cost funding from international credit institutions to replace domestic mobilization.
Source: SBV, Banks, VCBS Research
3.00
4.00
5.00
6.00
7.00
8.00
Average deposit rates (Unit: %)
D.R (1 month) D.R (3 months)
D.R (6 months) D.R (above 12 months)
4.96% 4.89%
3.09%
4.68% 4.88%
3.33%
5.50% 5.63%
4.06%
2.50%
3.00%
3.50%
4.00%
4.50%
5.00%
5.50%
6.00%
Deposit cost yield
Deposit yield of group TCB, VPB, MBB, ACBDeposit yield of group VCB, BID, CTGDeposit yield of private owned banks
82.2
74.2
76.7
80.2
65.5
71.8
65.3
60
65
70
75
80
85
CTG VPB TCB ACB HDB OCB MSB
LDR (%)
LDR Q3.2021 Upper limit (85%)
38
MACROECONOMY EQUITY MARKET INDUSTRY & STOCK PICKS FIXED INCOME Back
BANKING SECTOR – NIM
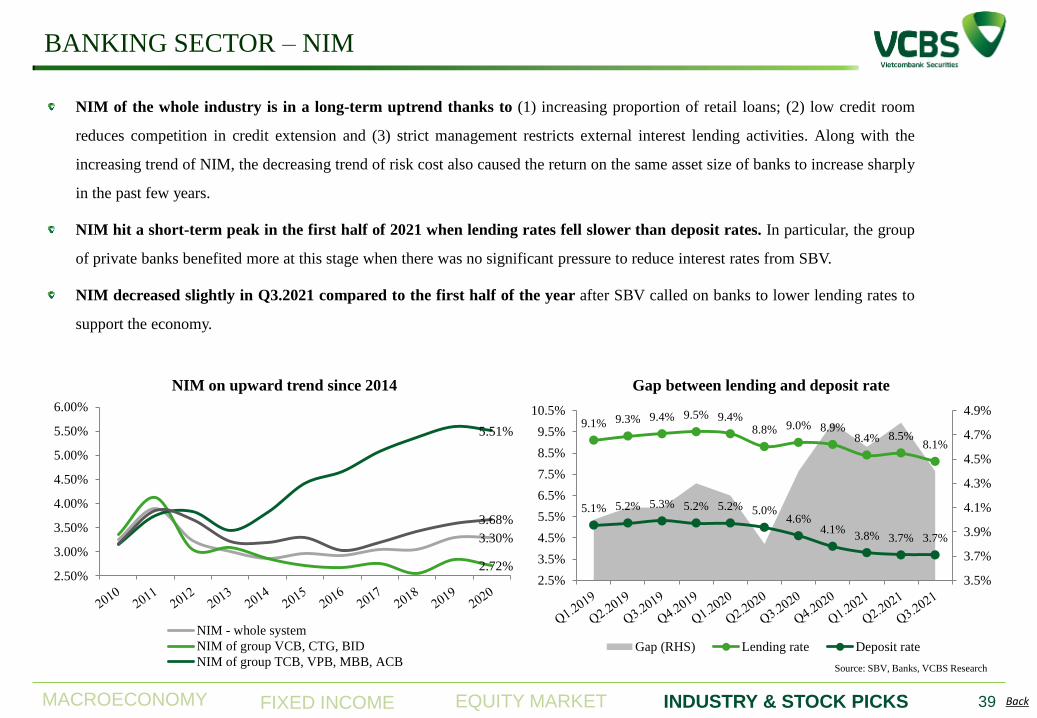
NIM of the whole industry is in a long-term uptrend thanks to (1) increasing proportion of retail loans; (2) low credit room
reduces competition in credit extension and (3) strict management restricts external interest lending activities. Along with the
increasing trend of NIM, the decreasing trend of risk cost also caused the return on the same asset size of banks to increase sharply
in the past few years.
NIM hit a short-term peak in the first half of 2021 when lending rates fell slower than deposit rates. In particular, the group
of private banks benefited more at this stage when there was no significant pressure to reduce interest rates from SBV.
NIM decreased slightly in Q3.2021 compared to the first half of the year after SBV called on banks to lower lending rates to
support the economy.
Source: SBV, Banks, VCBS Research
3.30%
2.72%
5.51%
3.68%
2.50%
3.00%
3.50%
4.00%
4.50%
5.00%
5.50%
6.00%
NIM on upward trend since 2014
NIM - whole system
NIM of group VCB, CTG, BID
NIM of group TCB, VPB, MBB, ACB
9.1% 9.3% 9.4% 9.5% 9.4% 8.8% 9.0% 8.9%
8.4% 8.5% 8.1%
5.1% 5.2% 5.3% 5.2% 5.2% 5.0% 4.6%
4.1% 3.8% 3.7% 3.7%
3.5%
3.7%
3.9%
4.1%
4.3%
4.5%
4.7%
4.9%
2.5%
3.5%
4.5%
5.5%
6.5%
7.5%
8.5%
9.5%
10.5%
Gap between lending and deposit rate
Gap (RHS) Lending rate Deposit rate
39
MACROECONOMY EQUITY MARKET INDUSTRY & STOCK PICKS FIXED INCOME Back
BANKING SECTOR – NON-INTEREST INCOME
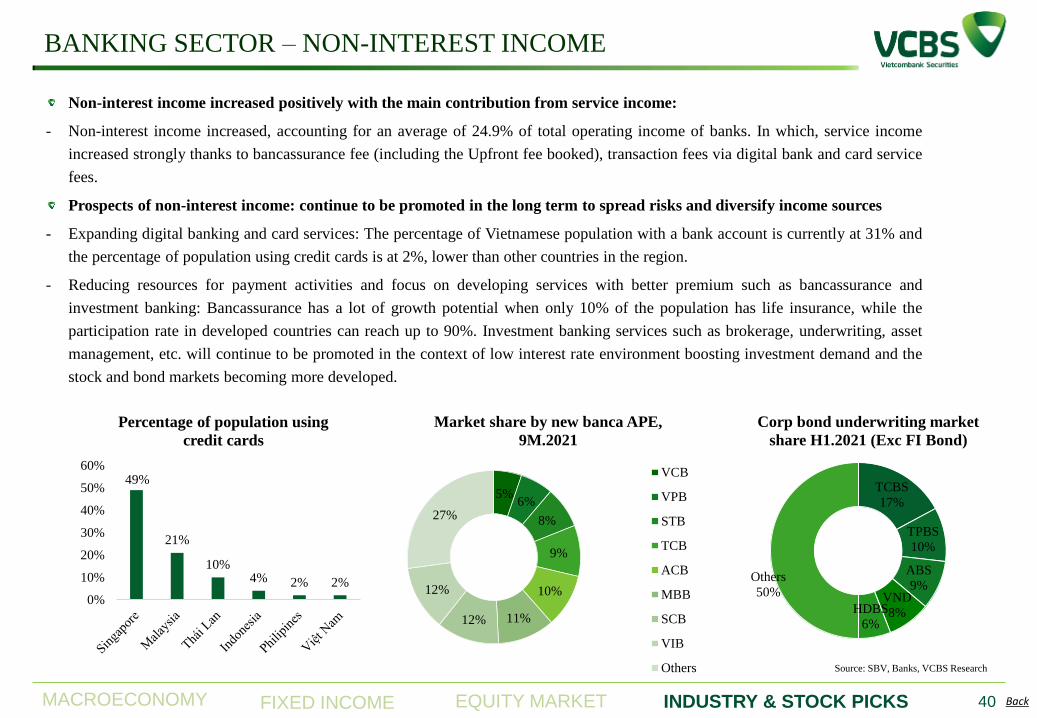
Non-interest income increased positively with the main contribution from service income:
- Non-interest income increased, accounting for an average of 24.9% of total operating income of banks. In which, service income
increased strongly thanks to bancassurance fee (including the Upfront fee booked), transaction fees via digital bank and card service
fees.
Prospects of non-interest income: continue to be promoted in the long term to spread risks and diversify income sources
- Expanding digital banking and card services: The percentage of Vietnamese population with a bank account is currently at 31% and
the percentage of population using credit cards is at 2%, lower than other countries in the region.
- Reducing resources for payment activities and focus on developing services with better premium such as bancassurance and
investment banking: Bancassurance has a lot of growth potential when only 10% of the population has life insurance, while the
participation rate in developed countries can reach up to 90%. Investment banking services such as brokerage, underwriting, asset
management, etc. will continue to be promoted in the context of low interest rate environment boosting investment demand and the
stock and bond markets becoming more developed.
49%
21%
10% 4% 2% 2%
0%
10%
20%
30%
40%
50%
60%
Percentage of population using
credit cards
Source: SBV, Banks, VCBS Research
5% 6%
8%
9%
10%
11% 12%
12%
27%
Market share by new banca APE,
9M.2021
VCB
VPB
STB
TCB
ACB
MBB
SCB
VIB
Others
TCBS
17%
TPBS
10%
ABS
9% VND
8% HDBS
6%
Others
50%
Corp bond underwriting market
share H1.2021 (Exc FI Bond)
40
MACROECONOMY EQUITY MARKET INDUSTRY & STOCK PICKS FIXED INCOME Back
BANKING SECTOR – DIGITIZATION & OPERATING COSTS
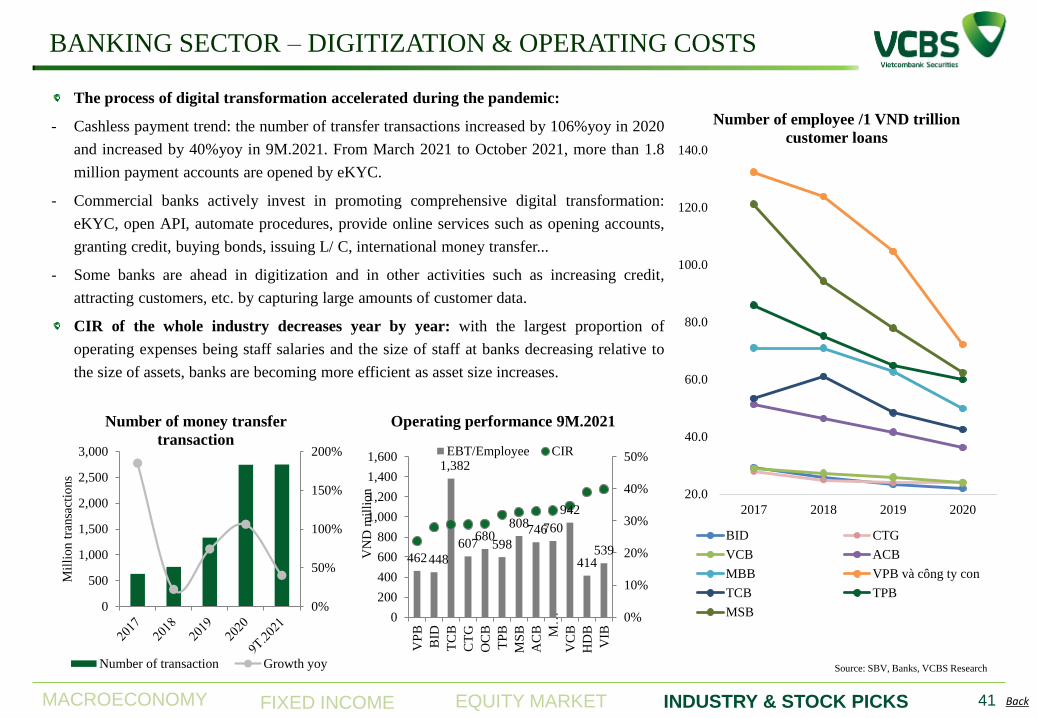
The process of digital transformation accelerated during the pandemic:
- Cashless payment trend: the number of transfer transactions increased by 106%yoy in 2020
and increased by 40%yoy in 9M.2021. From March 2021 to October 2021, more than 1.8
million payment accounts are opened by eKYC.
- Commercial banks actively invest in promoting comprehensive digital transformation:
eKYC, open API, automate procedures, provide online services such as opening accounts,
granting credit, buying bonds, issuing L/ C, international money transfer...
- Some banks are ahead in digitization and in other activities such as increasing credit,
attracting customers, etc. by capturing large amounts of customer data.
CIR of the whole industry decreases year by year: with the largest proportion of
operating expenses being staff salaries and the size of staff at banks decreasing relative to
the size of assets, banks are becoming more efficient as asset size increases.
20.0
40.0
60.0
80.0
100.0
120.0
140.0
2017 2018 2019 2020
Number of employee /1 VND trillion
customer loans
BID CTG
VCB ACB
MBB VPB và công ty con
TCB TPB
MSB
Source: SBV, Banks, VCBS Research
462 448
1,382
607 680
598
808 746 760
942
414 539
0%
10%
20%
30%
40%
50%
0
200
400
600
800
1,000
1,200
1,400
1,600
VP
B
BID
TC
B
CT
G
OC
B
TP
B
MS
B
AC
B M…
VC
B
HD
B
VIB
VN
D m
illi
on
Operating performance 9M.2021
EBT/Employee CIR
0%
50%
100%
150%
200%
0
500
1,000
1,500
2,000
2,500
3,000
Mil
lio
n t
ransa
ctio
ns
Number of money transfer
transaction
Number of transaction Growth yoy
41
MACROECONOMY EQUITY MARKET INDUSTRY & STOCK PICKS FIXED INCOME Back
BANKING SECTOR – ASSET QUALITY
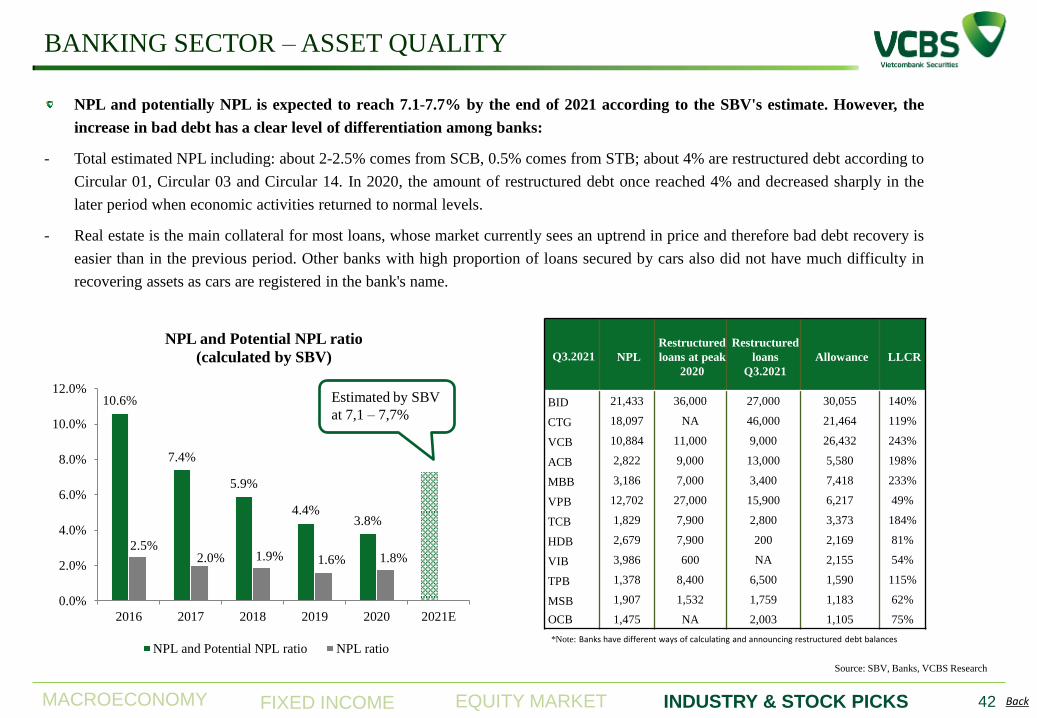
NPL and potentially NPL is expected to reach 7.1-7.7% by the end of 2021 according to the SBV's estimate. However, the
increase in bad debt has a clear level of differentiation among banks:
- Total estimated NPL including: about 2-2.5% comes from SCB, 0.5% comes from STB; about 4% are restructured debt according to
Circular 01, Circular 03 and Circular 14. In 2020, the amount of restructured debt once reached 4% and decreased sharply in the
later period when economic activities returned to normal levels.
- Real estate is the main collateral for most loans, whose market currently sees an uptrend in price and therefore bad debt recovery is
easier than in the previous period. Other banks with high proportion of loans secured by cars also did not have much difficulty in
recovering assets as cars are registered in the bank's name.
Q3.2021 NPL
Restructured
loans at peak
2020
Restructured
loans
Q3.2021
Allowance LLCR
BID 21,433 36,000 27,000 30,055 140%
CTG 18,097 NA 46,000 21,464 119%
VCB 10,884 11,000 9,000 26,432 243%
ACB 2,822 9,000 13,000 5,580 198%
MBB 3,186 7,000 3,400 7,418 233%
VPB 12,702 27,000 15,900 6,217 49%
TCB 1,829 7,900 2,800 3,373 184%
HDB 2,679 7,900 200 2,169 81%
VIB 3,986 600 NA 2,155 54%
TPB 1,378 8,400 6,500 1,590 115%
MSB 1,907 1,532 1,759 1,183 62%
OCB 1,475 NA 2,003 1,105 75%
*Note: Banks have different ways of calculating and announcing restructured debt balances
Source: SBV, Banks, VCBS Research
10.6%
7.4%
5.9%
4.4% 3.8%
2.5% 2.0% 1.9% 1.6% 1.8%
0.0%
2.0%
4.0%
6.0%
8.0%
10.0%
12.0%
2016 2017 2018 2019 2020 2021E
NPL and Potential NPL ratio
(calculated by SBV)
NPL and Potential NPL ratio NPL ratio
Estimated by SBV
at 7,1 – 7,7%
42
MACROECONOMY EQUITY MARKET INDUSTRY & STOCK PICKS FIXED INCOME Back
BANKING SECTOR – OUTLOOK 2022
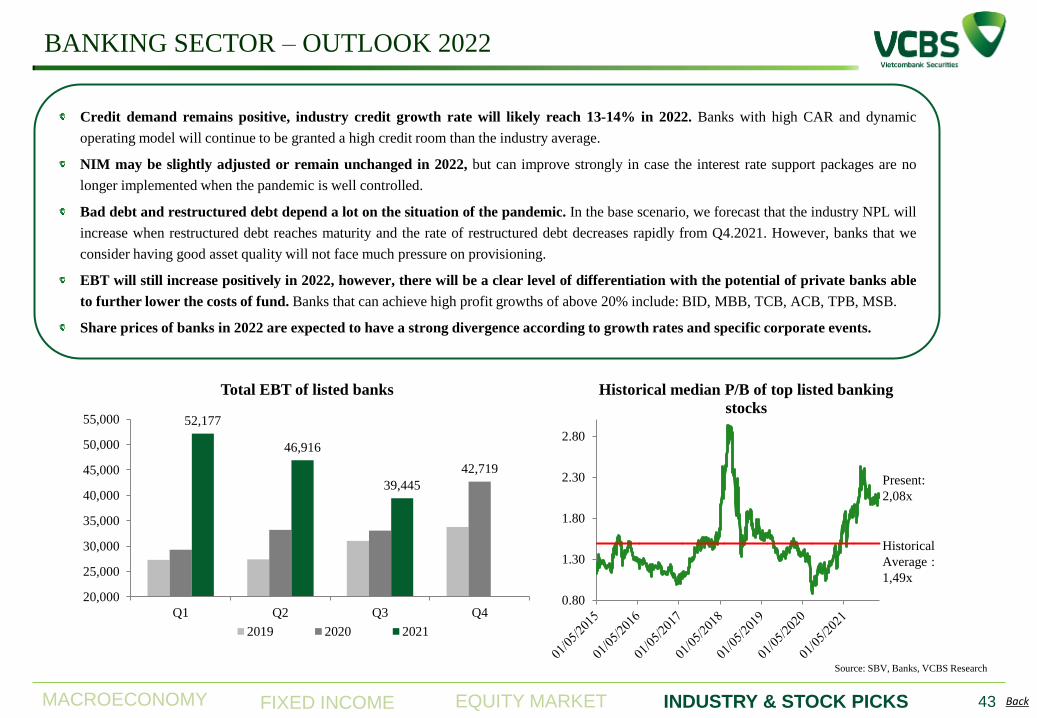
Credit demand remains positive, industry credit growth rate will likely reach 13-14% in 2022. Banks with high CAR and dynamic
operating model will continue to be granted a high credit room than the industry average.
NIM may be slightly adjusted or remain unchanged in 2022, but can improve strongly in case the interest rate support packages are no
longer implemented when the pandemic is well controlled.
Bad debt and restructured debt depend a lot on the situation of the pandemic. In the base scenario, we forecast that the industry NPL will
increase when restructured debt reaches maturity and the rate of restructured debt decreases rapidly from Q4.2021. However, banks that we
consider having good asset quality will not face much pressure on provisioning.
EBT will still increase positively in 2022, however, there will be a clear level of differentiation with the potential of private banks able
to further lower the costs of fund. Banks that can achieve high profit growths of above 20% include: BID, MBB, TCB, ACB, TPB, MSB.
Share prices of banks in 2022 are expected to have a strong divergence according to growth rates and specific corporate events.
0.80
1.30
1.80
2.30
2.80
Historical median P/B of top listed banking
stocks
Present:
2,08x
Historical
Average :
1,49x
42,719
52,177
46,916
39,445
20,000
25,000
30,000
35,000
40,000
45,000
50,000
55,000
Q1 Q2 Q3 Q4
Total EBT of listed banks
2019 2020 2021
Source: SBV, Banks, VCBS Research
43
MACROECONOMY EQUITY MARKET INDUSTRY & STOCK PICKS FIXED INCOME Back
2022 BANKING STOCKS RECOMENDATION
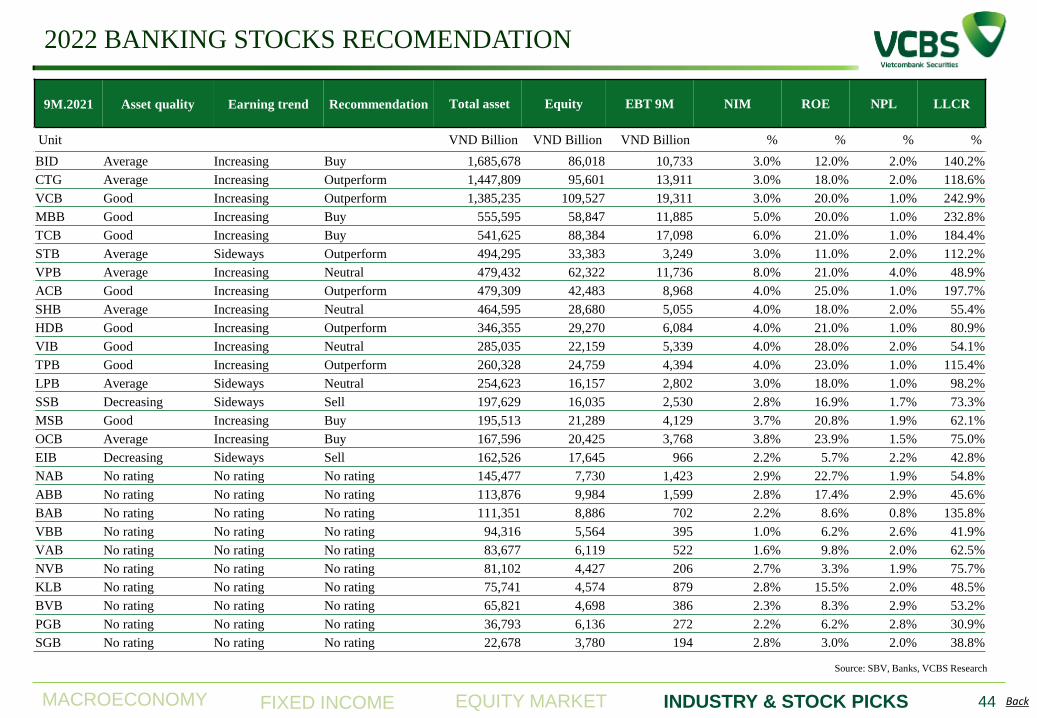
9M.2021 Asset quality Earning trend Recommendation Total asset Equity EBT 9M NIM ROE NPL LLCR
Unit VND Billion VND Billion VND Billion % % % %
BID Average Increasing Buy 1,685,678 86,018 10,733 3.0% 12.0% 2.0% 140.2%
CTG Average Increasing Outperform 1,447,809 95,601 13,911 3.0% 18.0% 2.0% 118.6%
VCB Good Increasing Outperform 1,385,235 109,527 19,311 3.0% 20.0% 1.0% 242.9%
MBB Good Increasing Buy 555,595 58,847 11,885 5.0% 20.0% 1.0% 232.8%
TCB Good Increasing Buy 541,625 88,384 17,098 6.0% 21.0% 1.0% 184.4%
STB Average Sideways Outperform 494,295 33,383 3,249 3.0% 11.0% 2.0% 112.2%
VPB Average Increasing Neutral 479,432 62,322 11,736 8.0% 21.0% 4.0% 48.9%
ACB Good Increasing Outperform 479,309 42,483 8,968 4.0% 25.0% 1.0% 197.7%
SHB Average Increasing Neutral 464,595 28,680 5,055 4.0% 18.0% 2.0% 55.4%
HDB Good Increasing Outperform 346,355 29,270 6,084 4.0% 21.0% 1.0% 80.9%
VIB Good Increasing Neutral 285,035 22,159 5,339 4.0% 28.0% 2.0% 54.1%
TPB Good Increasing Outperform 260,328 24,759 4,394 4.0% 23.0% 1.0% 115.4%
LPB Average Sideways Neutral 254,623 16,157 2,802 3.0% 18.0% 1.0% 98.2%
SSB Decreasing Sideways Sell 197,629 16,035 2,530 2.8% 16.9% 1.7% 73.3%
MSB Good Increasing Buy 195,513 21,289 4,129 3.7% 20.8% 1.9% 62.1%
OCB Average Increasing Buy 167,596 20,425 3,768 3.8% 23.9% 1.5% 75.0%
EIB Decreasing Sideways Sell 162,526 17,645 966 2.2% 5.7% 2.2% 42.8%
NAB No rating No rating No rating 145,477 7,730 1,423 2.9% 22.7% 1.9% 54.8%
ABB No rating No rating No rating 113,876 9,984 1,599 2.8% 17.4% 2.9% 45.6%
BAB No rating No rating No rating 111,351 8,886 702 2.2% 8.6% 0.8% 135.8%
VBB No rating No rating No rating 94,316 5,564 395 1.0% 6.2% 2.6% 41.9%
VAB No rating No rating No rating 83,677 6,119 522 1.6% 9.8% 2.0% 62.5%
NVB No rating No rating No rating 81,102 4,427 206 2.7% 3.3% 1.9% 75.7%
KLB No rating No rating No rating 75,741 4,574 879 2.8% 15.5% 2.0% 48.5%
BVB No rating No rating No rating 65,821 4,698 386 2.3% 8.3% 2.9% 53.2%
PGB No rating No rating No rating 36,793 6,136 272 2.2% 6.2% 2.8% 30.9%
SGB No rating No rating No rating 22,678 3,780 194 2.8% 3.0% 2.0% 38.8%
Source: SBV, Banks, VCBS Research
44
MACROECONOMY EQUITY MARKET INDUSTRY & STOCK PICKS FIXED INCOME Back
JSC BANK FOR INVESTMENT AND DEVELOPMENT OF
VIETNAM (BID)
Source: SBV, BID, VCBS Research
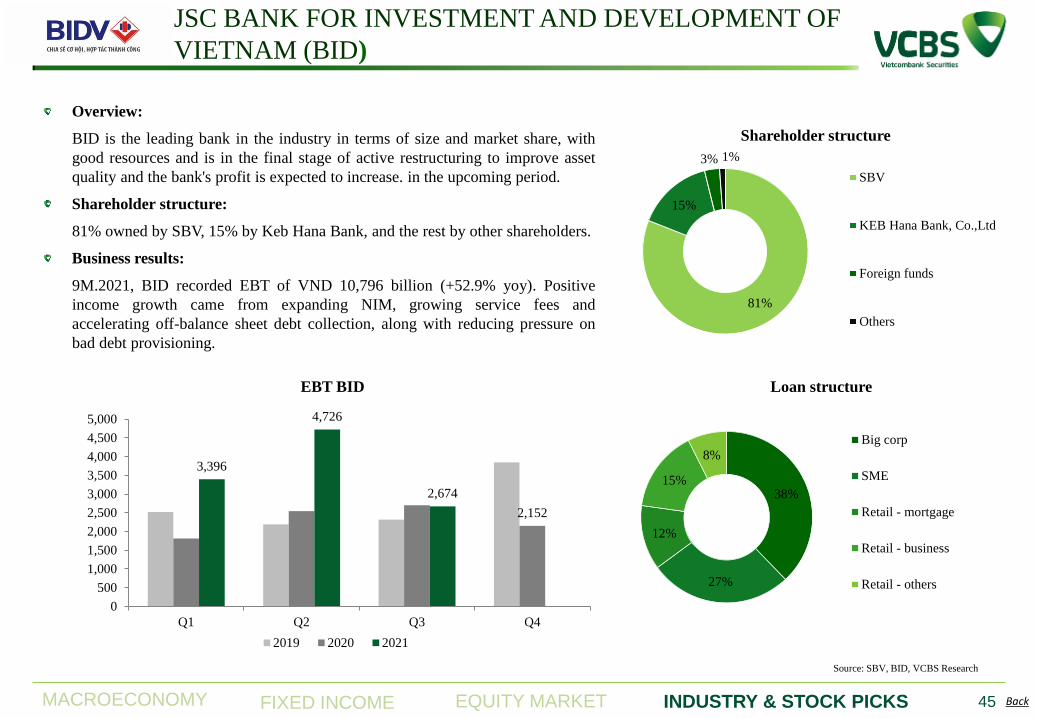
Overview:
BID is the leading bank in the industry in terms of size and market share, with
good resources and is in the final stage of active restructuring to improve asset
quality and the bank's profit is expected to increase. in the upcoming period.
Shareholder structure:
81% owned by SBV, 15% by Keb Hana Bank, and the rest by other shareholders.
Business results:
9M.2021, BID recorded EBT of VND 10,796 billion (+52.9% yoy). Positive
income growth came from expanding NIM, growing service fees and
accelerating off-balance sheet debt collection, along with reducing pressure on
bad debt provisioning.
45
38%
27%
12%
15%
8%
Loan structure
Big corp
SME
Retail - mortgage
Retail - business
Retail - others
81%
15%
3% 1%
Shareholder structure
SBV
KEB Hana Bank, Co.,Ltd
Foreign funds
Others
2,152
3,396
4,726
2,674
0
500
1,000
1,500
2,000
2,500
3,000
3,500
4,000
4,500
5,000
Q1 Q2 Q3 Q4
EBT BID
2019 2020 2021
MACROECONOMY EQUITY MARKET INDUSTRY & STOCK PICKS FIXED INCOME Back
Source: SBV, BID, VCBS Research
46
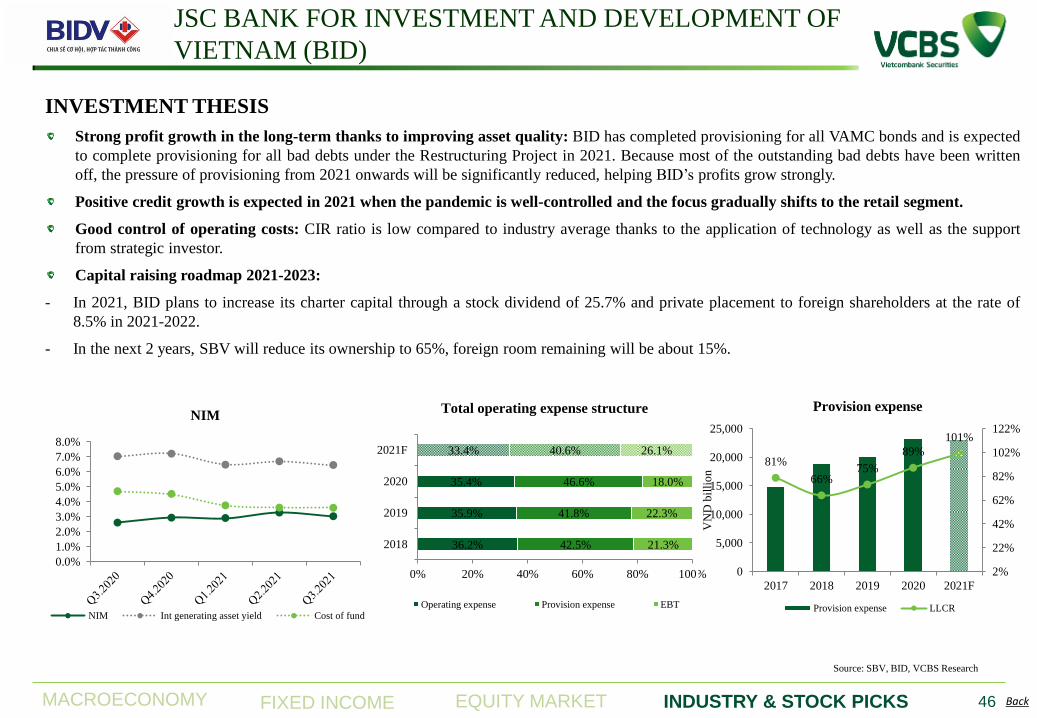
INVESTMENT THESIS
Strong profit growth in the long-term thanks to improving asset quality: BID has completed provisioning for all VAMC bonds and is expected
to complete provisioning for all bad debts under the Restructuring Project in 2021. Because most of the outstanding bad debts have been written
off, the pressure of provisioning from 2021 onwards will be significantly reduced, helping BID’s profits grow strongly.
Positive credit growth is expected in 2021 when the pandemic is well-controlled and the focus gradually shifts to the retail segment.
Good control of operating costs: CIR ratio is low compared to industry average thanks to the application of technology as well as the support
from strategic investor.
Capital raising roadmap 2021-2023:
- In 2021, BID plans to increase its charter capital through a stock dividend of 25.7% and private placement to foreign shareholders at the rate of
8.5% in 2021-2022.
- In the next 2 years, SBV will reduce its ownership to 65%, foreign room remaining will be about 15%.
JSC BANK FOR INVESTMENT AND DEVELOPMENT OF
VIETNAM (BID)
0.0%
1.0%
2.0%
3.0%
4.0%
5.0%
6.0%
7.0%
8.0%
NIM
NIM Int generating asset yield Cost of fund
36.2%
35.9%
35.4%
33.4%
42.5%
41.8%
46.6%
40.6%
21.3%
22.3%
18.0%
26.1%
0% 20% 40% 60% 80% 100%
2018
2019
2020
2021F
Total operating expense structure
Operating expense Provision expense EBT
81%
66% 75%
89%
101%
2%
22%
42%
62%
82%
102%
122%
0
5,000
10,000
15,000
20,000
25,000
2017 2018 2019 2020 2021F
VN
D b
illi
on
Provision expense
Provision expense LLCR
MACROECONOMY EQUITY MARKET INDUSTRY & STOCK PICKS FIXED INCOME Back
Source: SBV, BID, VCBS Research
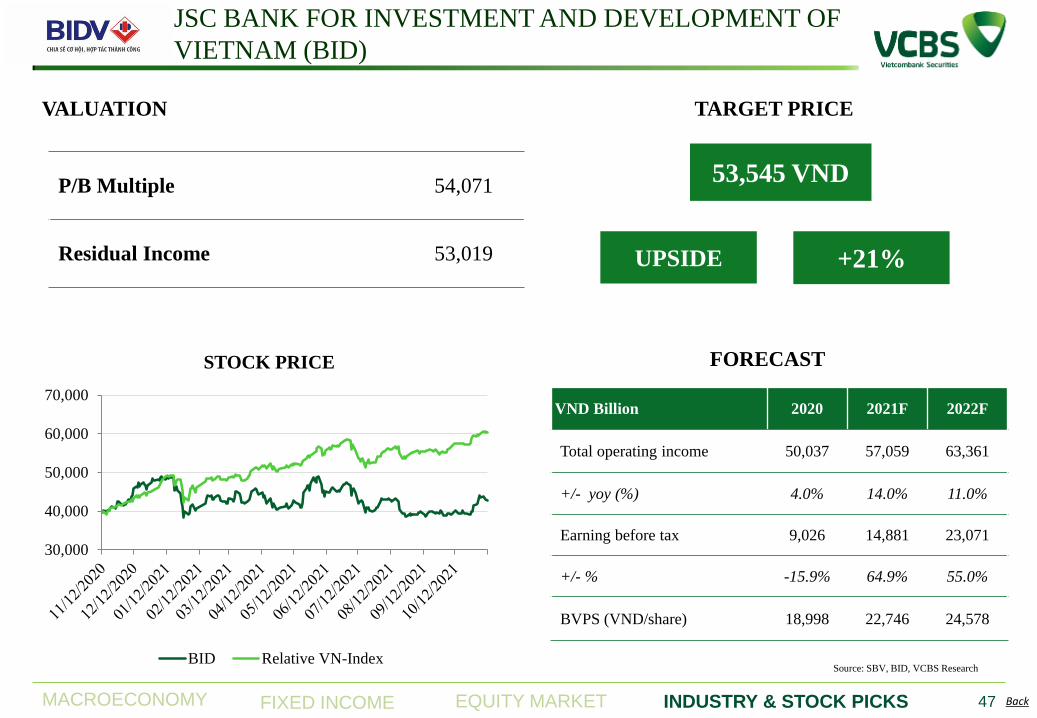
FORECAST
53,545 VND
TARGET PRICE
+21% UPSIDE
VND Billion 2020 2021F 2022F
Total operating income 50,037 57,059 63,361
+/- yoy (%) 4.0% 14.0% 11.0%
Earning before tax 9,026 14,881 23,071
+/- % -15.9% 64.9% 55.0%
BVPS (VND/share) 18,998 22,746 24,578
47
VALUATION
P/B Multiple 54,071
Residual Income 53,019
JSC BANK FOR INVESTMENT AND DEVELOPMENT OF
VIETNAM (BID)
30,000
40,000
50,000
60,000
70,000
STOCK PRICE
BID Relative VN-Index
MACROECONOMY EQUITY MARKET INDUSTRY & STOCK PICKS FIXED INCOME Back
MILITARY COMMERCIAL JOINT STOCK BANK (MBB)
Source: SBV, MBB, VCBS Research
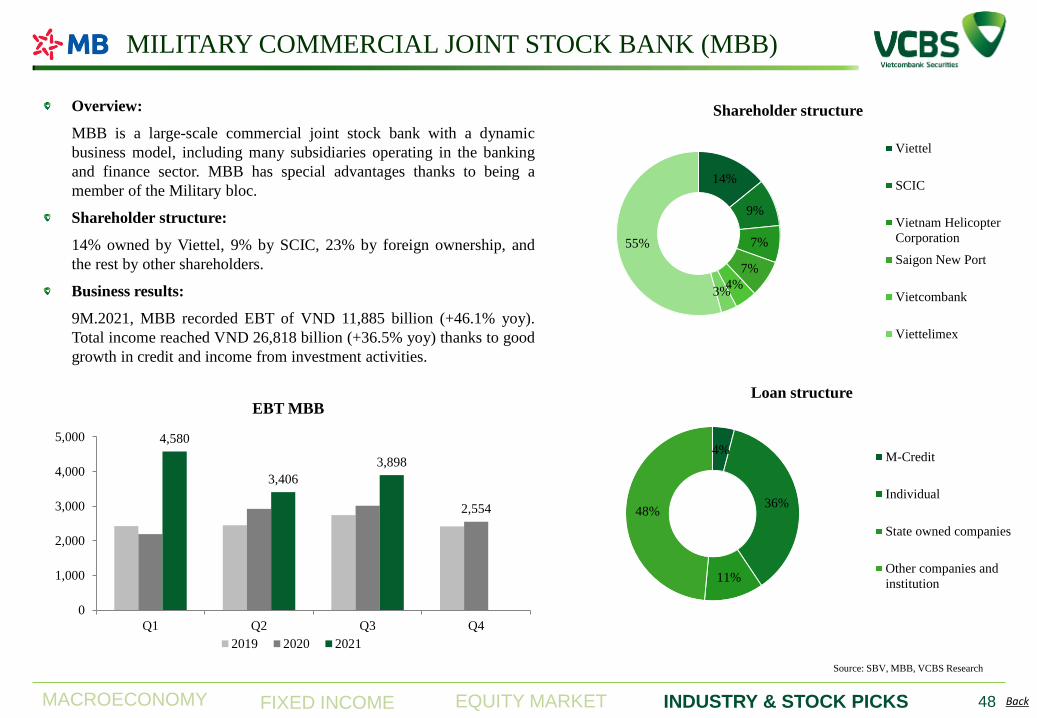
Overview:
MBB is a large-scale commercial joint stock bank with a dynamic
business model, including many subsidiaries operating in the banking
and finance sector. MBB has special advantages thanks to being a
member of the Military bloc.
Shareholder structure:
14% owned by Viettel, 9% by SCIC, 23% by foreign ownership, and
the rest by other shareholders.
Business results:
9M.2021, MBB recorded EBT of VND 11,885 billion (+46.1% yoy).
Total income reached VND 26,818 billion (+36.5% yoy) thanks to good
growth in credit and income from investment activities.
48
14%
9%
7%
7%
4% 3%
55%
Shareholder structure
Viettel
SCIC
Vietnam Helicopter
Corporation
Saigon New Port
Vietcombank
Viettelimex
4%
36%
11%
48%
Loan structure
M-Credit
Individual
State owned companies
Other companies and
institution
2,554
4,580
3,406
3,898
0
1,000
2,000
3,000
4,000
5,000
Q1 Q2 Q3 Q4
EBT MBB
2019 2020 2021
MACROECONOMY EQUITY MARKET INDUSTRY & STOCK PICKS FIXED INCOME Back
Source: SBV, MBB, VCBS Research
INVESTMENT THESIS
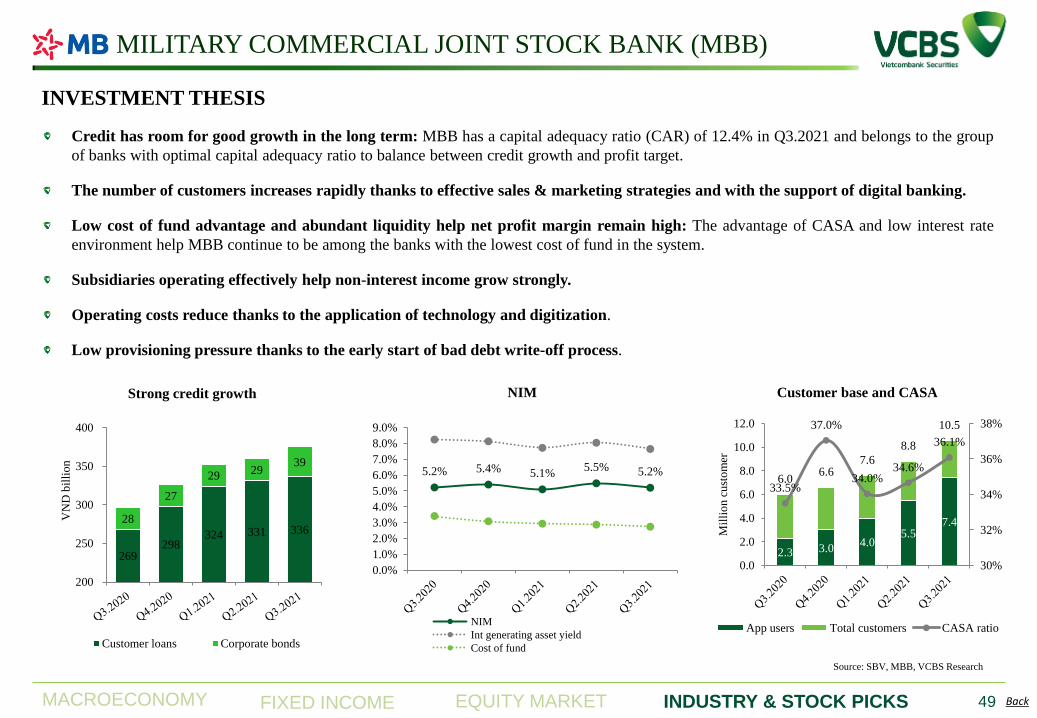
Credit has room for good growth in the long term: MBB has a capital adequacy ratio (CAR) of 12.4% in Q3.2021 and belongs to the group
of banks with optimal capital adequacy ratio to balance between credit growth and profit target.
The number of customers increases rapidly thanks to effective sales & marketing strategies and with the support of digital banking.
Low cost of fund advantage and abundant liquidity help net profit margin remain high: The advantage of CASA and low interest rate
environment help MBB continue to be among the banks with the lowest cost of fund in the system.
Subsidiaries operating effectively help non-interest income grow strongly.
Operating costs reduce thanks to the application of technology and digitization.
Low provisioning pressure thanks to the early start of bad debt write-off process.
49
MILITARY COMMERCIAL JOINT STOCK BANK (MBB)
5.2% 5.4% 5.1% 5.5% 5.2%
0.0%
1.0%
2.0%
3.0%
4.0%
5.0%
6.0%
7.0%
8.0%
9.0%
NIM
NIM
Int generating asset yield
Cost of fund
2.3 3.0 4.0
5.5 7.4
6.0 6.6
7.6
8.8
10.5
33.5%
37.0%
34.0% 34.6%
36.1%
30%
32%
34%
36%
38%
0.0
2.0
4.0
6.0
8.0
10.0
12.0
Mil
lio
n c
ust
om
er
Customer base and CASA
App users Total customers CASA ratio
269 298
324 331 336 28
27
29 29
39
200
250
300
350
400
VN
D b
illi
on
Strong credit growth
Customer loans Corporate bonds
MACROECONOMY EQUITY MARKET INDUSTRY & STOCK PICKS FIXED INCOME Back
Source: SBV, MBB, VCBS Research
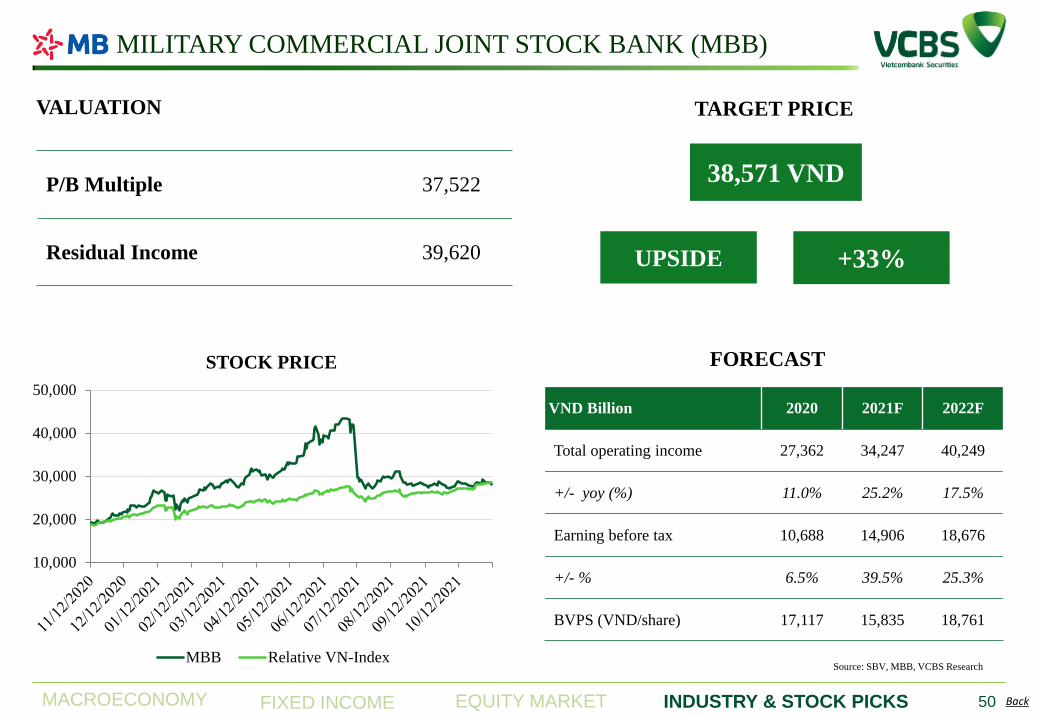
P/B Multiple 37,522
Residual Income 39,620
FORECAST
VALUATION
38,571 VND
TARGET PRICE
+33% UPSIDE
VND Billion 2020 2021F 2022F
Total operating income 27,362 34,247 40,249
+/- yoy (%) 11.0% 25.2% 17.5%
Earning before tax 10,688 14,906 18,676
+/- % 6.5% 39.5% 25.3%
BVPS (VND/share) 17,117 15,835 18,761
50
MILITARY COMMERCIAL JOINT STOCK BANK (MBB)
10,000
20,000
30,000
40,000
50,000
STOCK PRICE
MBB Relative VN-Index
MACROECONOMY EQUITY MARKET INDUSTRY & STOCK PICKS FIXED INCOME Back
Overview:
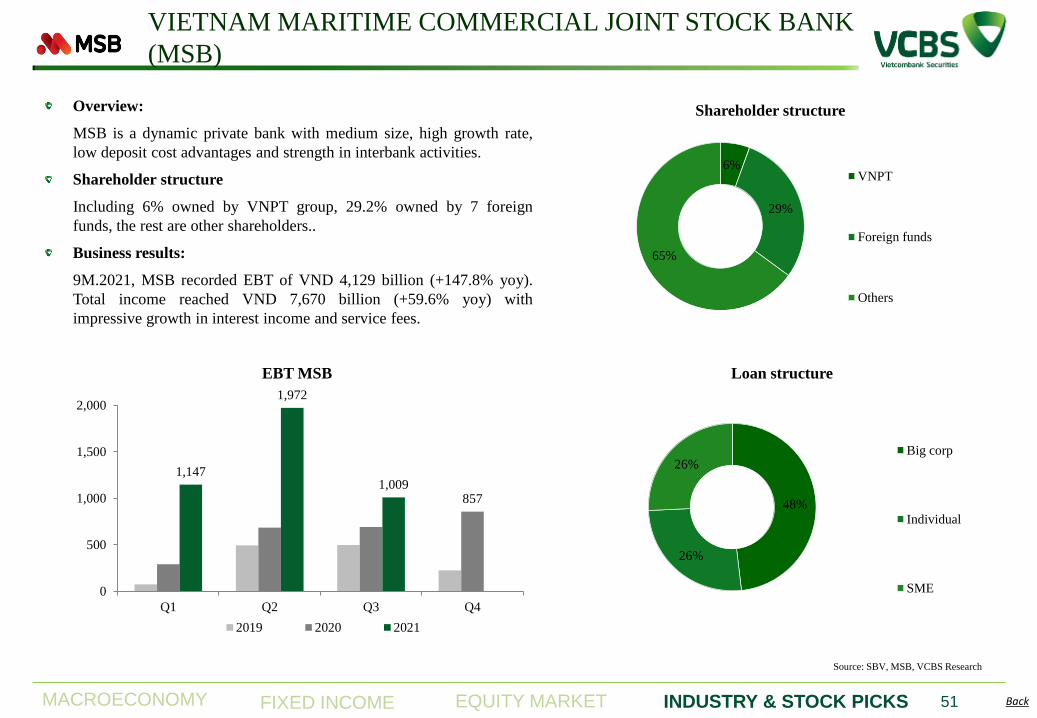
MSB is a dynamic private bank with medium size, high growth rate,
low deposit cost advantages and strength in interbank activities.
Shareholder structure
Including 6% owned by VNPT group, 29.2% owned by 7 foreign
funds, the rest are other shareholders..
Business results:
9M.2021, MSB recorded EBT of VND 4,129 billion (+147.8% yoy).
Total income reached VND 7,670 billion (+59.6% yoy) with
impressive growth in interest income and service fees.
51
Source: SBV, MSB, VCBS Research
VIETNAM MARITIME COMMERCIAL JOINT STOCK BANK
(MSB)
48%
26%
26%
Loan structure
Big corp
Individual
SME
857
1,147
1,972
1,009
0
500
1,000
1,500
2,000
Q1 Q2 Q3 Q4
EBT MSB
2019 2020 2021
6%
29%
65%
Shareholder structure
VNPT
Foreign funds
Others
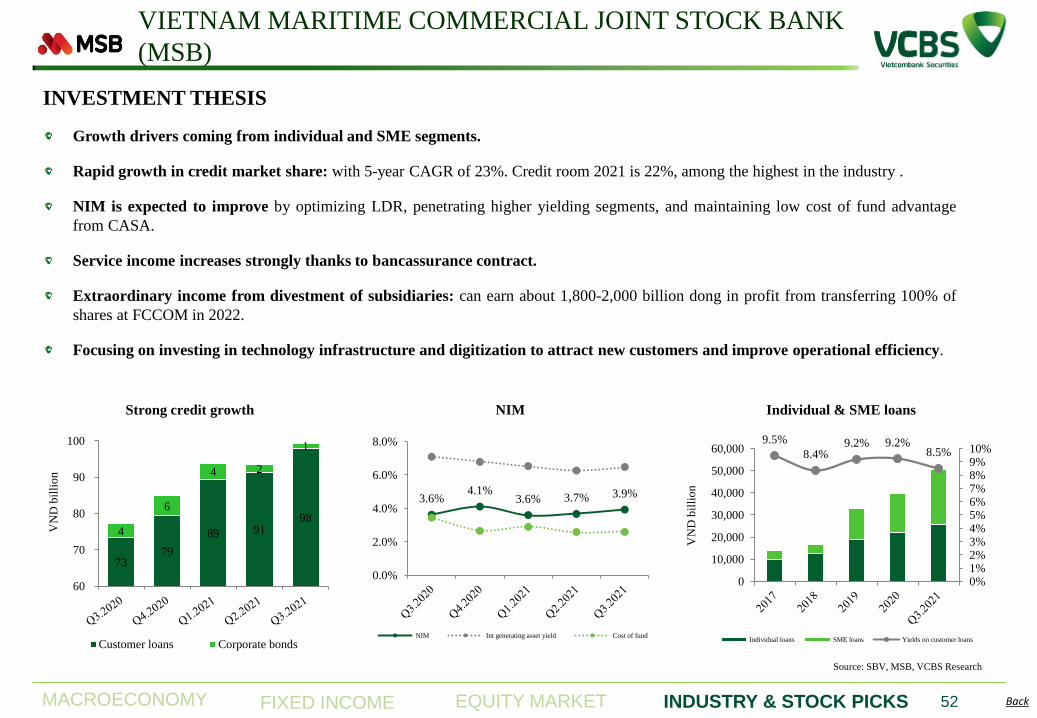
MACROECONOMY EQUITY MARKET INDUSTRY & STOCK PICKS FIXED INCOME Back
VIETNAM MARITIME COMMERCIAL JOINT STOCK BANK
(MSB)
INVESTMENT THESIS
Growth drivers coming from individual and SME segments.
Rapid growth in credit market share: with 5-year CAGR of 23%. Credit room 2021 is 22%, among the highest in the industry .
NIM is expected to improve by optimizing LDR, penetrating higher yielding segments, and maintaining low cost of fund advantage
from CASA.
Service income increases strongly thanks to bancassurance contract.
Extraordinary income from divestment of subsidiaries: can earn about 1,800-2,000 billion dong in profit from transferring 100% of
shares at FCCOM in 2022.
Focusing on investing in technology infrastructure and digitization to attract new customers and improve operational efficiency.
52
Source: SBV, MSB, VCBS Research
9.5%
8.4% 9.2% 9.2%
8.5%
0%1%2%3%4%5%6%7%8%9%10%
0
10,000
20,000
30,000
40,000
50,000
60,000
VN
D b
illi
on
Individual & SME loans
Individual loans SME loans Yields on customer loans
3.6% 4.1%
3.6% 3.7% 3.9%
0.0%
2.0%
4.0%
6.0%
8.0%
NIM
NIM Int generating asset yield Cost of fund
73 79
89 91 98
4
6
4 2
1
60
70
80
90
100
VN
D b
illi
on
Strong credit growth
Customer loans Corporate bonds
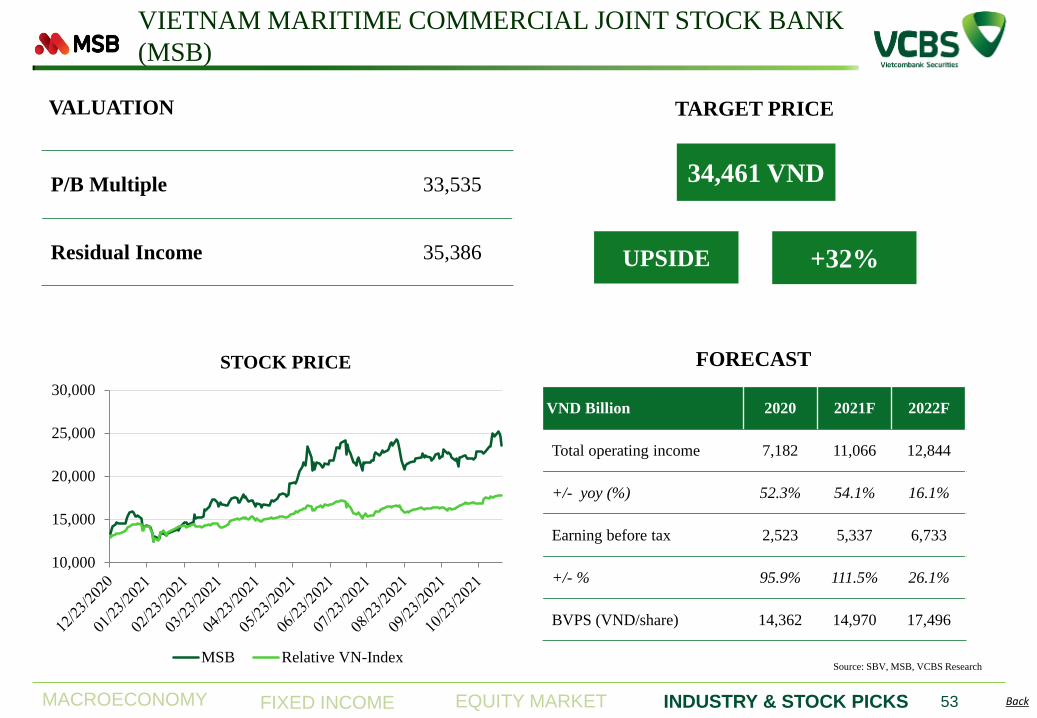
MACROECONOMY EQUITY MARKET INDUSTRY & STOCK PICKS FIXED INCOME Back
P/B Multiple 33,535
Residual Income 35,386
FORECAST
VALUATION
34,461 VND
TARGET PRICE
+32% UPSIDE
VND Billion 2020 2021F 2022F
Total operating income 7,182 11,066 12,844
+/- yoy (%) 52.3% 54.1% 16.1%
Earning before tax 2,523 5,337 6,733
+/- % 95.9% 111.5% 26.1%
BVPS (VND/share) 14,362 14,970 17,496
53
10,000
15,000
20,000
25,000
30,000
STOCK PRICE
MSB Relative VN-IndexSource: SBV, MSB, VCBS Research
VIETNAM MARITIME COMMERCIAL JOINT STOCK BANK
(MSB)
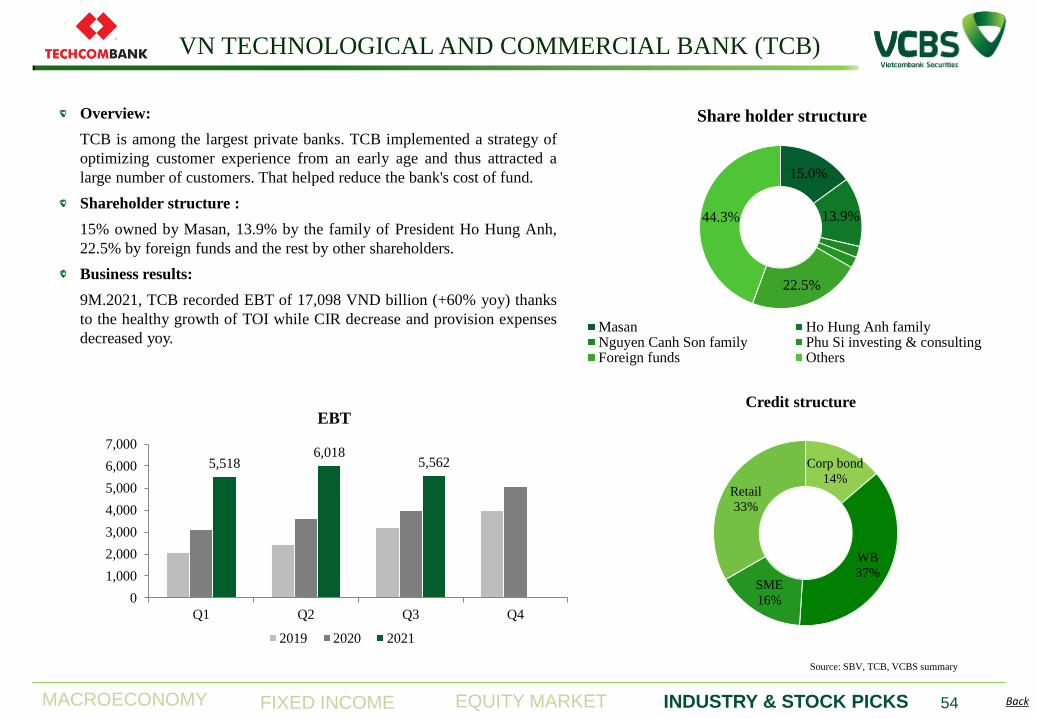
MACROECONOMY EQUITY MARKET INDUSTRY & STOCK PICKS FIXED INCOME Back
VN TECHNOLOGICAL AND COMMERCIAL BANK (TCB)
Overview:
TCB is among the largest private banks. TCB implemented a strategy of
optimizing customer experience from an early age and thus attracted a
large number of customers. That helped reduce the bank's cost of fund.
Shareholder structure :
15% owned by Masan, 13.9% by the family of President Ho Hung Anh,
22.5% by foreign funds and the rest by other shareholders.
Business results:
9M.2021, TCB recorded EBT of 17,098 VND billion (+60% yoy) thanks
to the healthy growth of TOI while CIR decrease and provision expenses
decreased yoy.
5,518 6,018
5,562
0
1,000
2,000
3,000
4,000
5,000
6,000
7,000
Q1 Q2 Q3 Q4
EBT
2019 2020 2021
15.0%
13.9%
22.5%
44.3%
Share holder structure
Masan Ho Hung Anh familyNguyen Canh Son family Phu Si investing & consultingForeign funds Others
Corp bond
14%
WB
37% SME
16%
Retail
33%
Credit structure
Source: SBV, TCB, VCBS summary
54
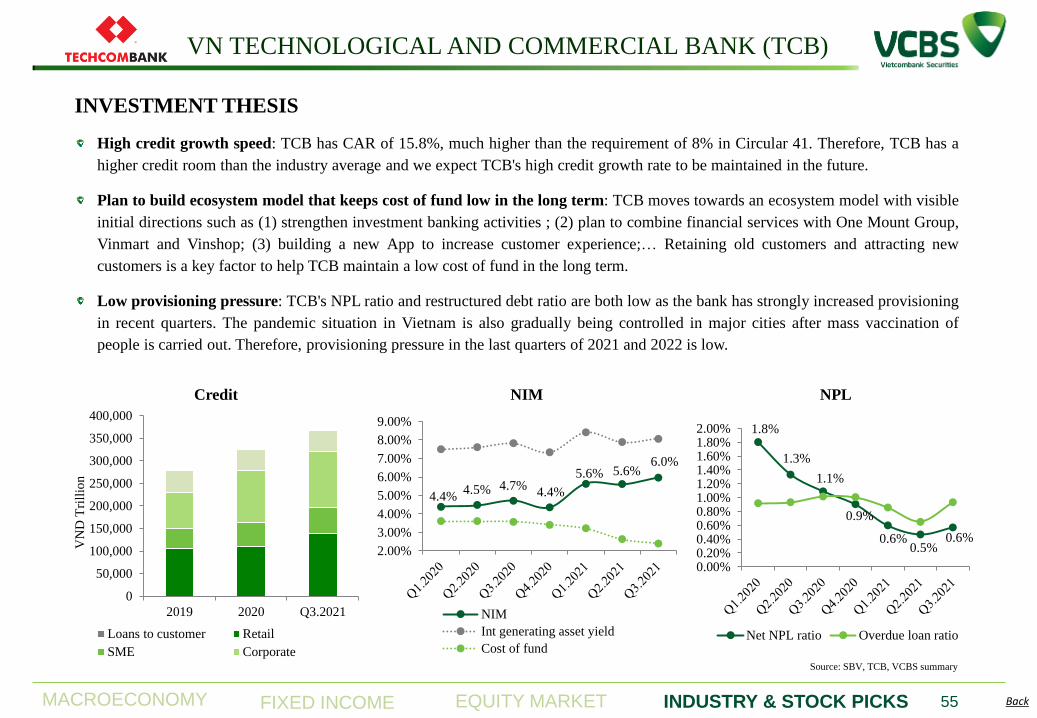
MACROECONOMY EQUITY MARKET INDUSTRY & STOCK PICKS FIXED INCOME Back
INVESTMENT THESIS
High credit growth speed: TCB has CAR of 15.8%, much higher than the requirement of 8% in Circular 41. Therefore, TCB has a
higher credit room than the industry average and we expect TCB's high credit growth rate to be maintained in the future.
Plan to build ecosystem model that keeps cost of fund low in the long term: TCB moves towards an ecosystem model with visible
initial directions such as (1) strengthen investment banking activities ; (2) plan to combine financial services with One Mount Group,
Vinmart and Vinshop; (3) building a new App to increase customer experience;… Retaining old customers and attracting new
customers is a key factor to help TCB maintain a low cost of fund in the long term.
Low provisioning pressure: TCB's NPL ratio and restructured debt ratio are both low as the bank has strongly increased provisioning
in recent quarters. The pandemic situation in Vietnam is also gradually being controlled in major cities after mass vaccination of
people is carried out. Therefore, provisioning pressure in the last quarters of 2021 and 2022 is low.
Source: SBV, TCB, VCBS summary
VN TECHNOLOGICAL AND COMMERCIAL BANK (TCB)
0
50,000
100,000
150,000
200,000
250,000
300,000
350,000
400,000
2019 2020 Q3.2021
VN
D T
rill
ion
Credit
Loans to customer Retail
SME Corporate
4.4% 4.5% 4.7%
4.4%
5.6% 5.6% 6.0%
2.00%
3.00%
4.00%
5.00%
6.00%
7.00%
8.00%
9.00%
NIM
NIM
Int generating asset yield
Cost of fund
1.8%
1.3%
1.1%
0.9%
0.6% 0.5%
0.6%
0.00%0.20%0.40%0.60%0.80%1.00%1.20%1.40%1.60%1.80%2.00%
NPL
Net NPL ratio Overdue loan ratio
55
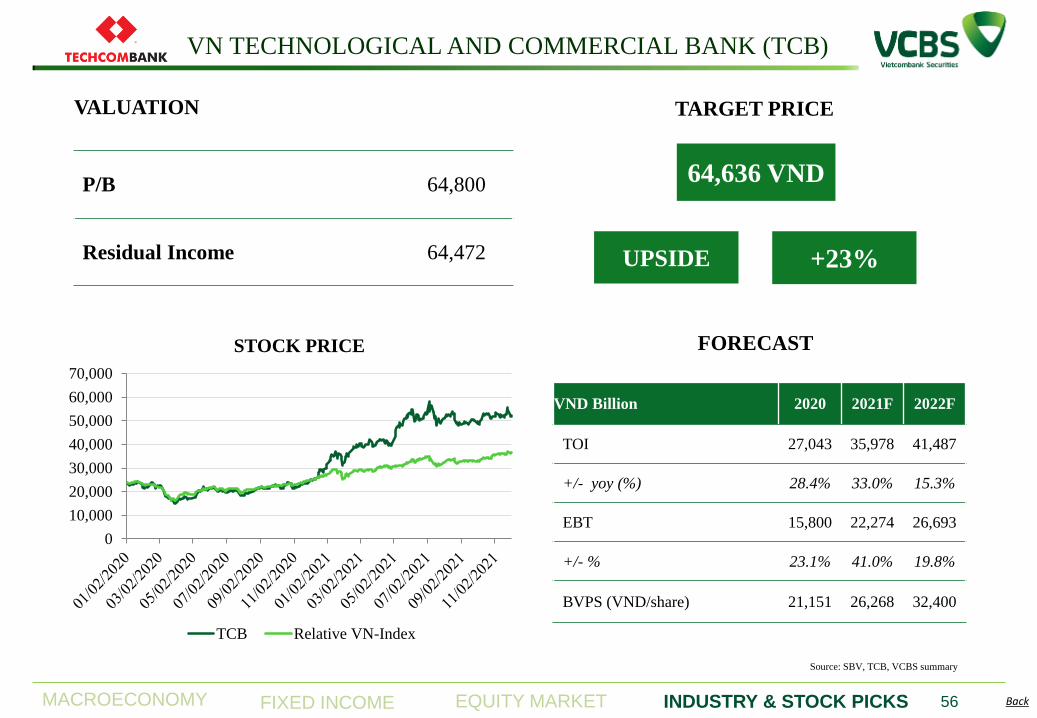
MACROECONOMY EQUITY MARKET INDUSTRY & STOCK PICKS FIXED INCOME Back
FORECAST
P/B 64,800
Residual Income 64,472
64,636 VND
TARGET PRICE
+23% UPSIDE
VALUATION
Source: SBV, TCB, VCBS summary
0
10,000
20,000
30,000
40,000
50,000
60,000
70,000
STOCK PRICE
TCB Relative VN-Index
VN TECHNOLOGICAL AND COMMERCIAL BANK (TCB)
VND Billion 2020 2021F 2022F
TOI 27,043 35,978 41,487
+/- yoy (%) 28.4% 33.0% 15.3%
EBT 15,800 22,274 26,693
+/- % 23.1% 41.0% 19.8%
BVPS (VND/share) 21,151 26,268 32,400
56

RESIDENTIAL
REAL ESTATE
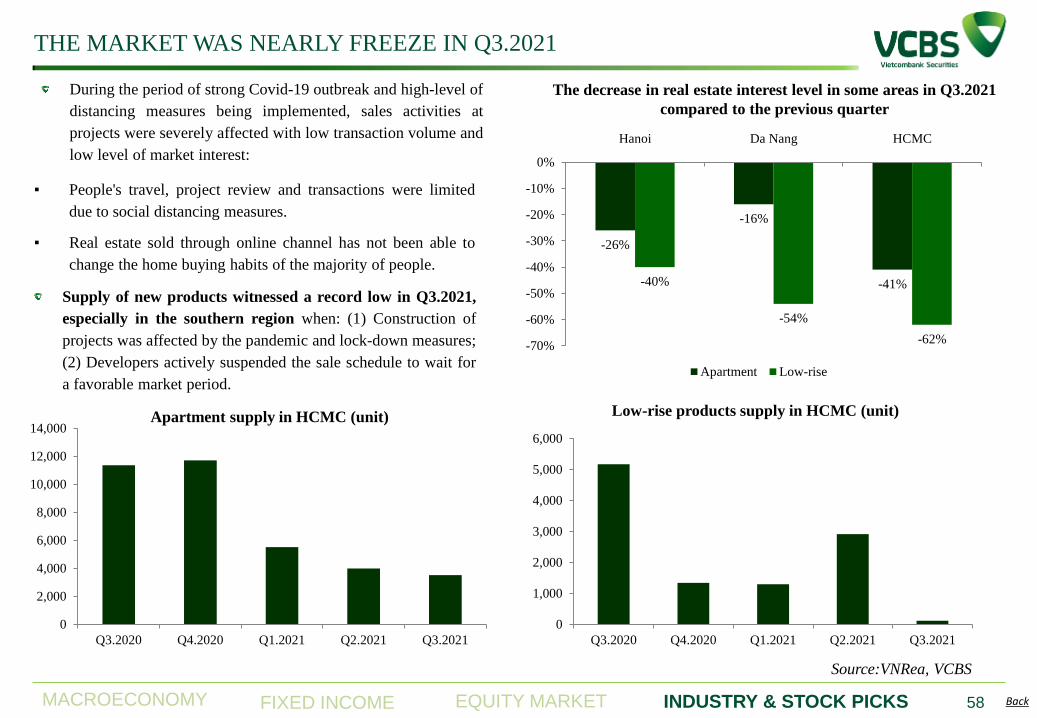
MACROECONOMY EQUITY MARKET INDUSTRY & STOCK PICKS FIXED INCOME Back 58
Source:VNRea, VCBS
THE MARKET WAS NEARLY FREEZE IN Q3.2021
During the period of strong Covid-19 outbreak and high-level of
distancing measures being implemented, sales activities at
projects were severely affected with low transaction volume and
low level of market interest:
Supply of new products witnessed a record low in Q3.2021,
especially in the southern region when: (1) Construction of
projects was affected by the pandemic and lock-down measures;
(2) Developers actively suspended the sale schedule to wait for
a favorable market period.
▪ People's travel, project review and transactions were limited
due to social distancing measures.
▪ Real estate sold through online channel has not been able to
change the home buying habits of the majority of people.
0
2,000
4,000
6,000
8,000
10,000
12,000
14,000
Q3.2020 Q4.2020 Q1.2021 Q2.2021 Q3.2021
0
1,000
2,000
3,000
4,000
5,000
6,000
Q3.2020 Q4.2020 Q1.2021 Q2.2021 Q3.2021
Apartment supply in HCMC (unit) Low-rise products supply in HCMC (unit)
-26%
-16%
-41% -40%
-54%
-62% -70%
-60%
-50%
-40%
-30%
-20%
-10%
0%
Hanoi Da Nang HCMC
Apartment Low-rise
The decrease in real estate interest level in some areas in Q3.2021
compared to the previous quarter
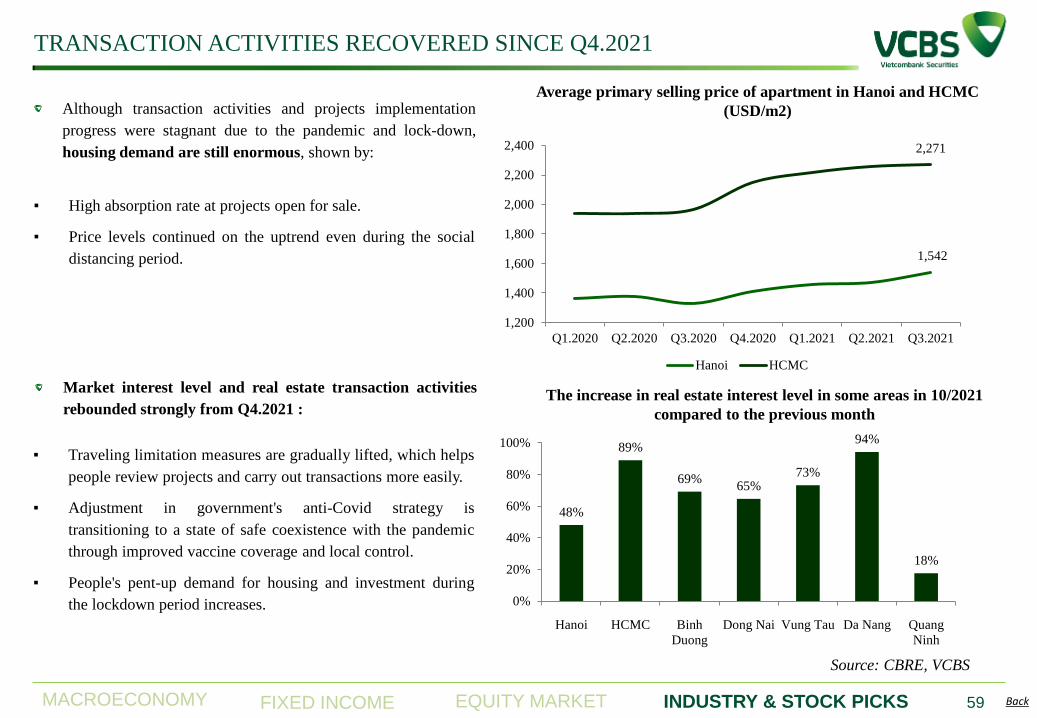
MACROECONOMY EQUITY MARKET INDUSTRY & STOCK PICKS FIXED INCOME Back 59
Source: CBRE, VCBS
TRANSACTION ACTIVITIES RECOVERED SINCE Q4.2021
▪ Traveling limitation measures are gradually lifted, which helps
people review projects and carry out transactions more easily.
▪ Adjustment in government's anti-Covid strategy is
transitioning to a state of safe coexistence with the pandemic
through improved vaccine coverage and local control.
▪ People's pent-up demand for housing and investment during
the lockdown period increases.
Although transaction activities and projects implementation
progress were stagnant due to the pandemic and lock-down,
housing demand are still enormous, shown by:
Market interest level and real estate transaction activities
rebounded strongly from Q4.2021 :
▪ High absorption rate at projects open for sale.
▪ Price levels continued on the uptrend even during the social
distancing period.
1,542
2,271
1,200
1,400
1,600
1,800
2,000
2,200
2,400
Q1.2020 Q2.2020 Q3.2020 Q4.2020 Q1.2021 Q2.2021 Q3.2021
Hanoi HCMC
Average primary selling price of apartment in Hanoi and HCMC
(USD/m2)
48%
89%
69% 65%
73%
94%
18%
0%
20%
40%
60%
80%
100%
Hanoi HCMC Binh
Duong
Dong Nai Vung Tau Da Nang Quang
Ninh
The increase in real estate interest level in some areas in 10/2021
compared to the previous month
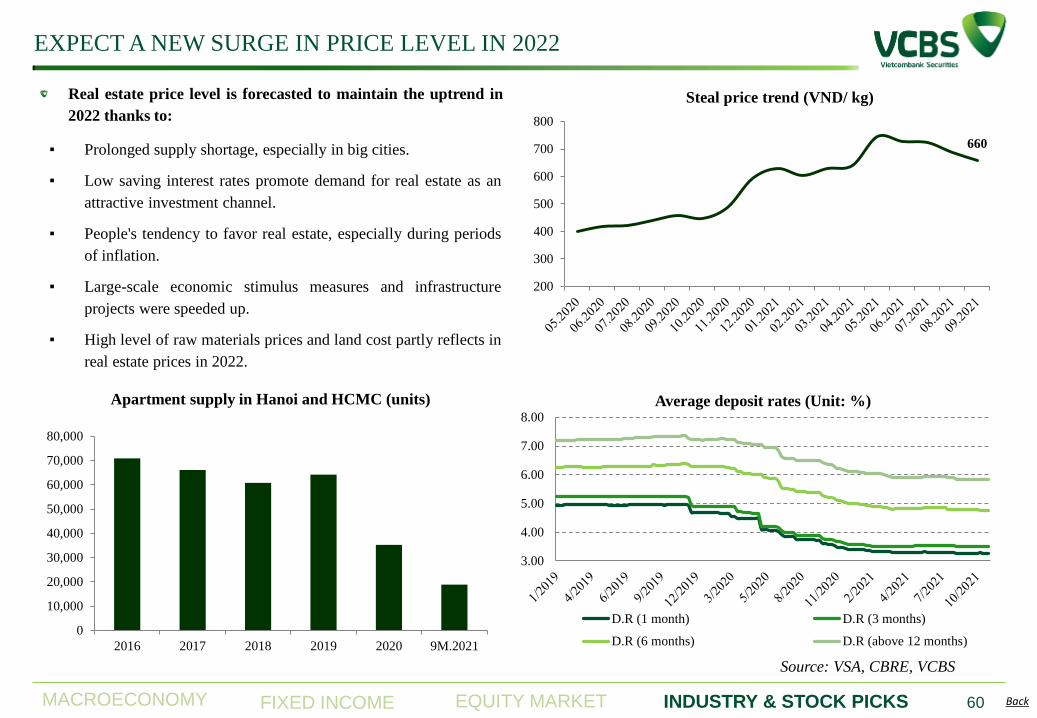
MACROECONOMY EQUITY MARKET INDUSTRY & STOCK PICKS FIXED INCOME Back 60
Source: VSA, CBRE, VCBS
EXPECT A NEW SURGE IN PRICE LEVEL IN 2022
▪ Prolonged supply shortage, especially in big cities.
▪ Low saving interest rates promote demand for real estate as an
attractive investment channel.
▪ People's tendency to favor real estate, especially during periods
of inflation.
▪ Large-scale economic stimulus measures and infrastructure
projects were speeded up.
▪ High level of raw materials prices and land cost partly reflects in
real estate prices in 2022.
Real estate price level is forecasted to maintain the uptrend in
2022 thanks to:
0
10,000
20,000
30,000
40,000
50,000
60,000
70,000
80,000
2016 2017 2018 2019 2020 9M.2021
Apartment supply in Hanoi and HCMC (units)
Steal price trend (VND/ kg)
660
200
300
400
500
600
700
800
3.00
4.00
5.00
6.00
7.00
8.00
Average deposit rates (Unit: %)
D.R (1 month) D.R (3 months)
D.R (6 months) D.R (above 12 months)
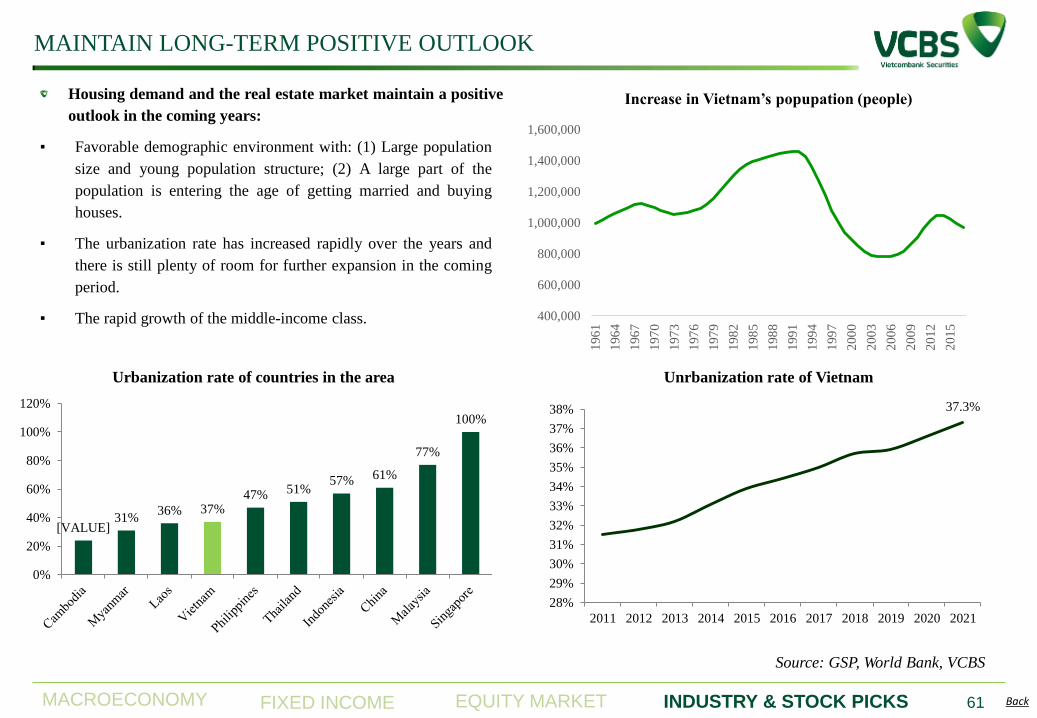
MACROECONOMY EQUITY MARKET INDUSTRY & STOCK PICKS FIXED INCOME Back 61
Source: GSP, World Bank, VCBS
MAINTAIN LONG-TERM POSITIVE OUTLOOK
▪ Favorable demographic environment with: (1) Large population
size and young population structure; (2) A large part of the
population is entering the age of getting married and buying
houses.
▪ The urbanization rate has increased rapidly over the years and
there is still plenty of room for further expansion in the coming
period.
▪ The rapid growth of the middle-income class.
Housing demand and the real estate market maintain a positive
outlook in the coming years:
Urbanization rate of countries in the area
[VALUE] 31%
36% 37% 47% 51%
57% 61%
77%
100%
0%
20%
40%
60%
80%
100%
120%
Increase in Vietnam’s popupation (people)
Unrbanization rate of Vietnam
400,000
600,000
800,000
1,000,000
1,200,000
1,400,000
1,600,000
196
1
196
4
196
7
197
0
197
3
197
6
197
9
198
2
198
5
198
8
199
1
199
4
199
7
200
0
200
3
200
6
200
9
201
2
201
5
37.3%
28%
29%
30%
31%
32%
33%
34%
35%
36%
37%
38%
2011 2012 2013 2014 2015 2016 2017 2018 2019 2020 2021
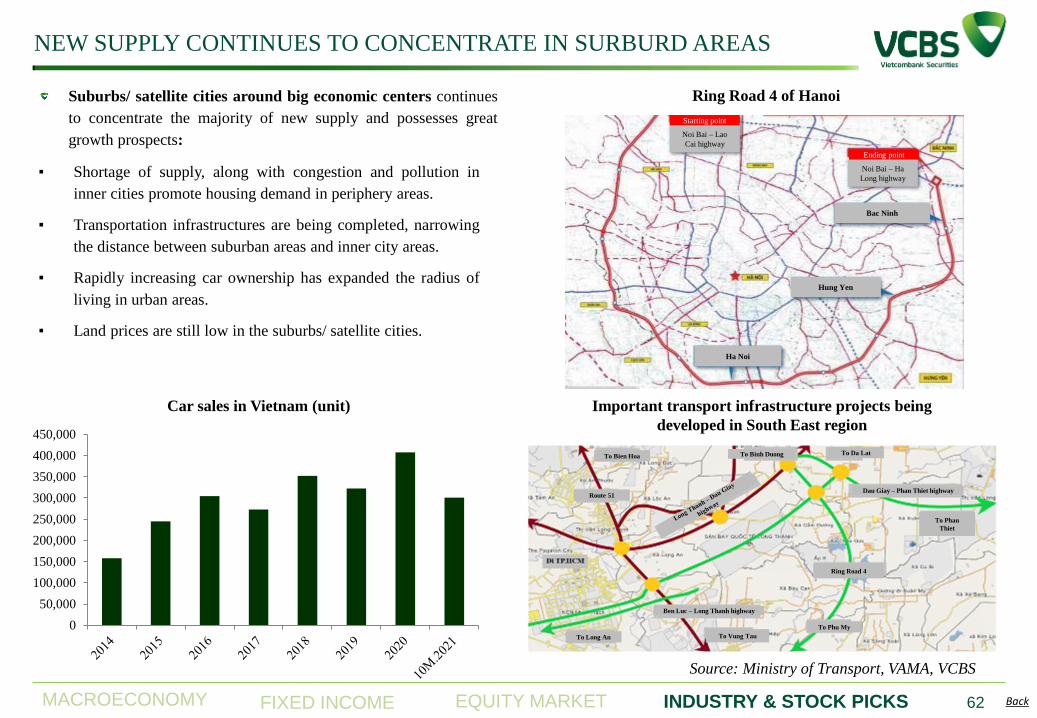
MACROECONOMY EQUITY MARKET INDUSTRY & STOCK PICKS FIXED INCOME Back 62
Source: Ministry of Transport, VAMA, VCBS
NEW SUPPLY CONTINUES TO CONCENTRATE IN SURBURD AREAS
Suburbs/ satellite cities around big economic centers continues
to concentrate the majority of new supply and possesses great
growth prospects:
▪ Shortage of supply, along with congestion and pollution in
inner cities promote housing demand in periphery areas.
▪ Transportation infrastructures are being completed, narrowing
the distance between suburban areas and inner city areas.
▪ Rapidly increasing car ownership has expanded the radius of
living in urban areas.
▪ Land prices are still low in the suburbs/ satellite cities.
Important transport infrastructure projects being
developed in South East region
Ring Road 4 of Hanoi
Noi Bai – Lao
Cai highway
Starting point
Noi Bai – Ha
Long highway
Ending point
Ha Noi
Hung Yen
Bac Ninh
To Bien Hoa
Route 51
To Binh Duong To Da Lat
Dau Giay – Phan Thiet highway
To Phan
Thiet
Ring Road 4
To Phu My
To Long An To Vung Tau
Ben Luc – Long Thanh highway
0
50,000
100,000
150,000
200,000
250,000
300,000
350,000
400,000
450,000
Car sales in Vietnam (unit)
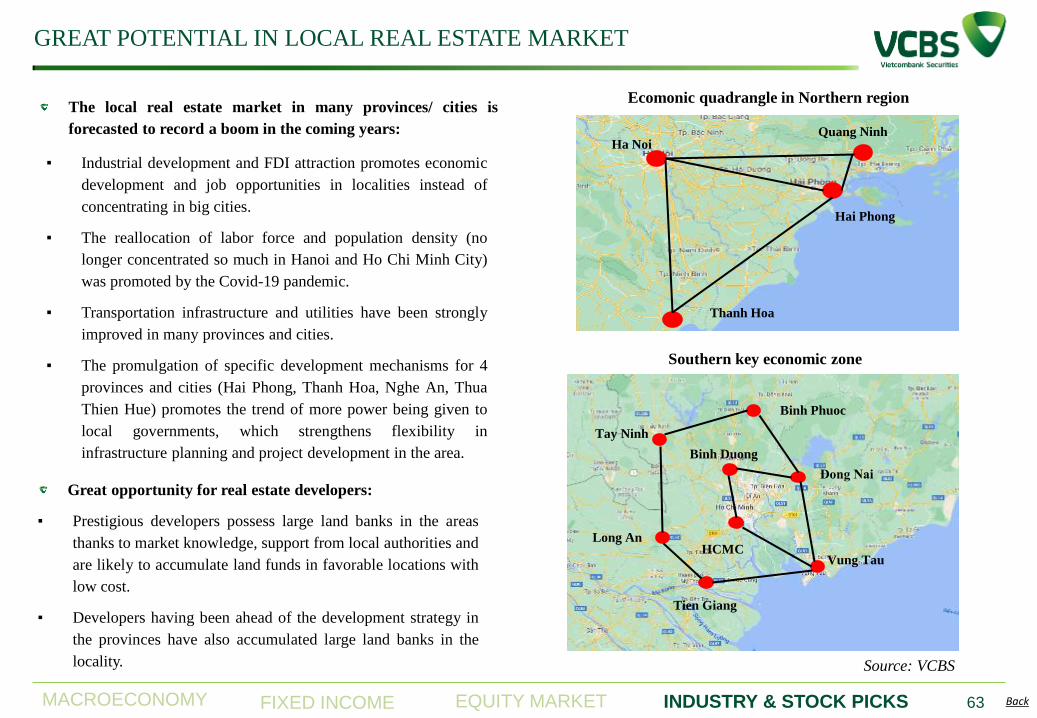
MACROECONOMY EQUITY MARKET INDUSTRY & STOCK PICKS FIXED INCOME Back 63
Source: VCBS
Ha Noi Quang Ninh
Hai Phong
Thanh Hoa
Binh Phuoc
Tay Ninh
Long An
Tien Giang
Vung Tau
Đong Nai
GREAT POTENTIAL IN LOCAL REAL ESTATE MARKET
Binh Duong
HCMC
Ecomonic quadrangle in Northern region
Southern key economic zone
The local real estate market in many provinces/ cities is
forecasted to record a boom in the coming years:
▪ Industrial development and FDI attraction promotes economic
development and job opportunities in localities instead of
concentrating in big cities.
▪ The reallocation of labor force and population density (no
longer concentrated so much in Hanoi and Ho Chi Minh City)
was promoted by the Covid-19 pandemic.
▪ Transportation infrastructure and utilities have been strongly
improved in many provinces and cities.
▪ The promulgation of specific development mechanisms for 4
provinces and cities (Hai Phong, Thanh Hoa, Nghe An, Thua
Thien Hue) promotes the trend of more power being given to
local governments, which strengthens flexibility in
infrastructure planning and project development in the area.
Great opportunity for real estate developers:
▪ Prestigious developers possess large land banks in the areas
thanks to market knowledge, support from local authorities and
are likely to accumulate land funds in favorable locations with
low cost.
▪ Developers having been ahead of the development strategy in
the provinces have also accumulated large land banks in the
locality.
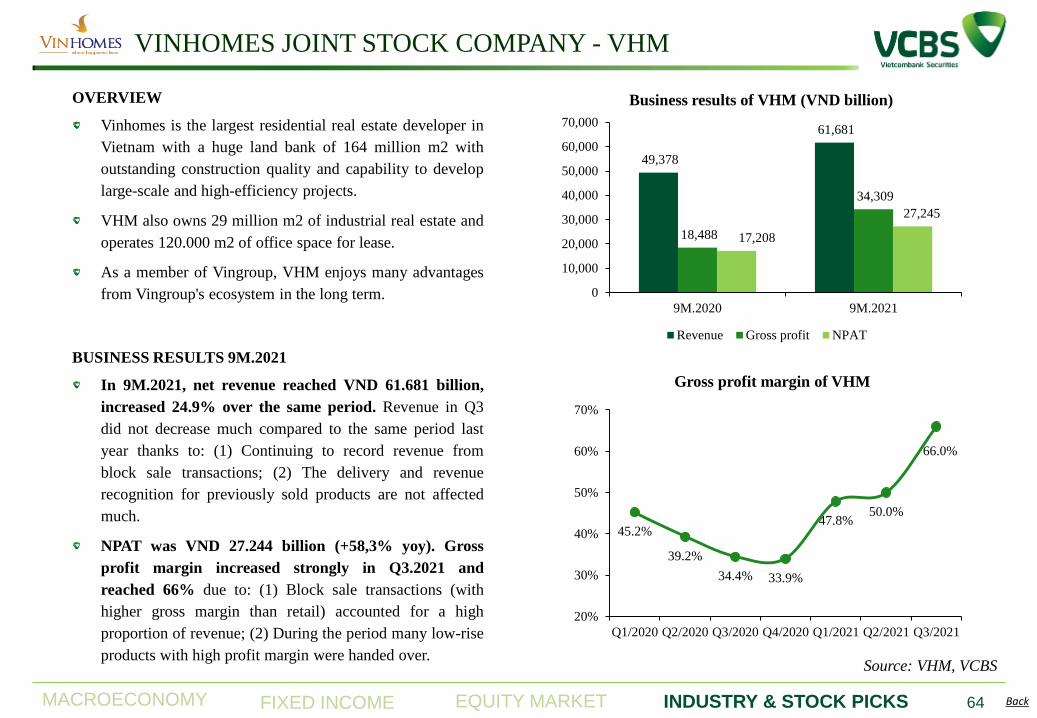
MACROECONOMY EQUITY MARKET INDUSTRY & STOCK PICKS FIXED INCOME Back 64
Source: VHM, VCBS
OVERVIEW
Vinhomes is the largest residential real estate developer in
Vietnam with a huge land bank of 164 million m2 with
outstanding construction quality and capability to develop
large-scale and high-efficiency projects.
VHM also owns 29 million m2 of industrial real estate and
operates 120.000 m2 of office space for lease.
As a member of Vingroup, VHM enjoys many advantages
from Vingroup's ecosystem in the long term.
BUSINESS RESULTS 9M.2021
In 9M.2021, net revenue reached VND 61.681 billion,
increased 24.9% over the same period. Revenue in Q3
did not decrease much compared to the same period last
year thanks to: (1) Continuing to record revenue from
block sale transactions; (2) The delivery and revenue
recognition for previously sold products are not affected
much.
NPAT was VND 27.244 billion (+58,3% yoy). Gross
profit margin increased strongly in Q3.2021 and
reached 66% due to: (1) Block sale transactions (with
higher gross margin than retail) accounted for a high
proportion of revenue; (2) During the period many low-rise
products with high profit margin were handed over.
VINHOMES JOINT STOCK COMPANY - VHM
Business results of VHM (VND billion)
49,378
61,681
18,488
34,309
17,208
27,245
0
10,000
20,000
30,000
40,000
50,000
60,000
70,000
9M.2020 9M.2021
Revenue Gross profit NPAT
Gross profit margin of VHM
45.2%
39.2%
34.4% 33.9%
47.8% 50.0%
66.0%
20%
30%
40%
50%
60%
70%
Q1/2020 Q2/2020 Q3/2020 Q4/2020 Q1/2021 Q2/2021 Q3/2021
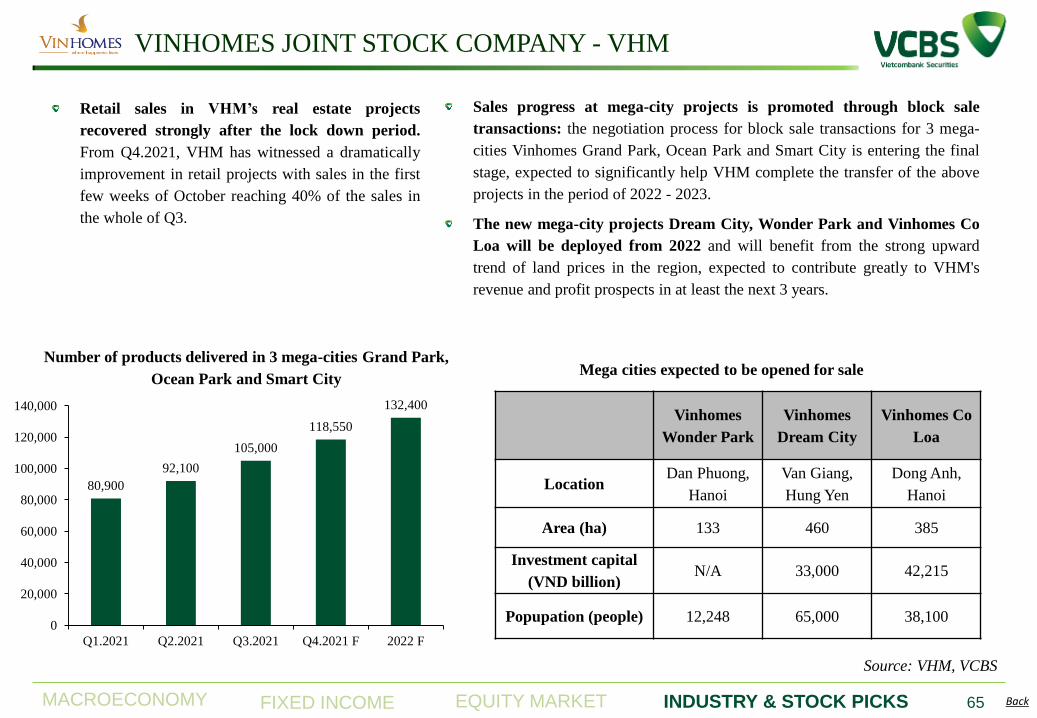
MACROECONOMY EQUITY MARKET INDUSTRY & STOCK PICKS FIXED INCOME Back 65
Source: VHM, VCBS
Sales progress at mega-city projects is promoted through block sale
transactions: the negotiation process for block sale transactions for 3 mega-
cities Vinhomes Grand Park, Ocean Park and Smart City is entering the final
stage, expected to significantly help VHM complete the transfer of the above
projects in the period of 2022 - 2023.
The new mega-city projects Dream City, Wonder Park and Vinhomes Co
Loa will be deployed from 2022 and will benefit from the strong upward
trend of land prices in the region, expected to contribute greatly to VHM's
revenue and profit prospects in at least the next 3 years.
VINHOMES JOINT STOCK COMPANY - VHM
Retail sales in VHM’s real estate projects
recovered strongly after the lock down period.
From Q4.2021, VHM has witnessed a dramatically
improvement in retail projects with sales in the first
few weeks of October reaching 40% of the sales in
the whole of Q3.
Mega cities expected to be opened for sale
Vinhomes
Wonder Park
Vinhomes
Dream City
Vinhomes Co
Loa
Location Dan Phuong,
Hanoi
Van Giang,
Hung Yen
Dong Anh,
Hanoi
Area (ha) 133 460 385
Investment capital
(VND billion) N/A 33,000 42,215
Popupation (people) 12,248 65,000 38,100
80,900
92,100
105,000
118,550
132,400
0
20,000
40,000
60,000
80,000
100,000
120,000
140,000
Q1.2021 Q2.2021 Q3.2021 Q4.2021 F 2022 F
Number of products delivered in 3 mega-cities Grand Park,
Ocean Park and Smart City
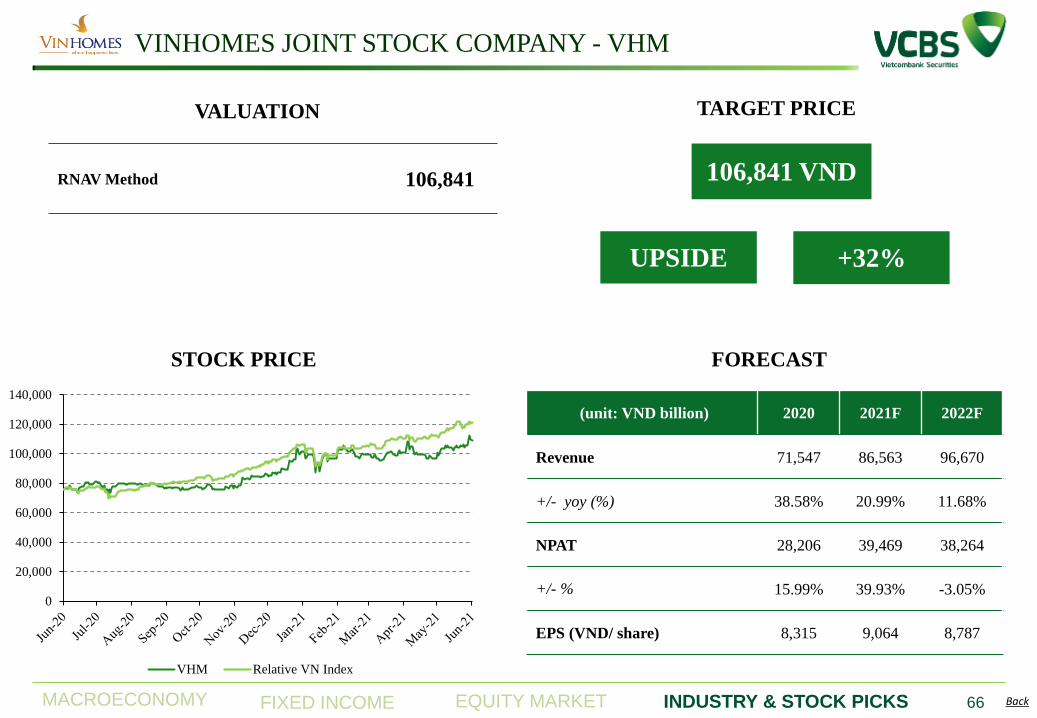
MACROECONOMY EQUITY MARKET INDUSTRY & STOCK PICKS FIXED INCOME Back 66
(unit: VND billion) 2020 2021F 2022F
Revenue 71,547 86,563 96,670
+/- yoy (%) 38.58% 20.99% 11.68%
NPAT 28,206 39,469 38,264
+/- % 15.99% 39.93% -3.05%
EPS (VND/ share) 8,315 9,064 8,787
FORECAST STOCK PRICE
106,841 VND
TARGET PRICE
+32% UPSIDE
VINHOMES JOINT STOCK COMPANY - VHM
RNAV Method 106,841
VALUATION
0
20,000
40,000
60,000
80,000
100,000
120,000
140,000
VHM Relative VN Index
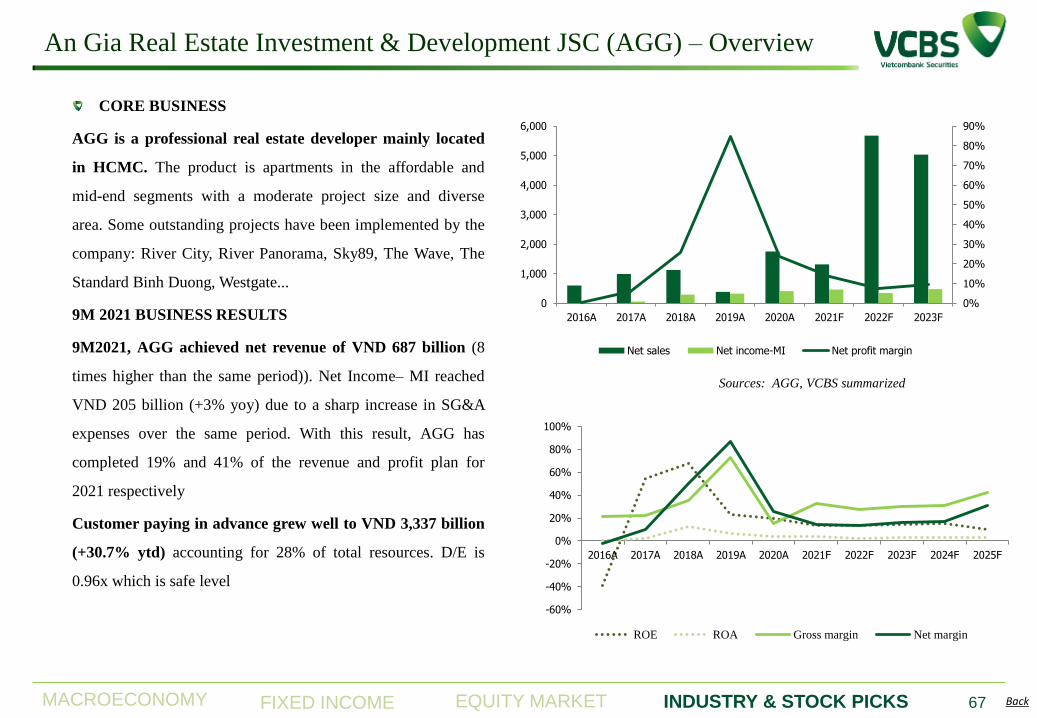
MACROECONOMY EQUITY MARKET INDUSTRY & STOCK PICKS FIXED INCOME Back
An Gia Real Estate Investment & Development JSC (AGG) – Overview
67
CORE BUSINESS
AGG is a professional real estate developer mainly located
in HCMC. The product is apartments in the affordable and
mid-end segments with a moderate project size and diverse
area. Some outstanding projects have been implemented by the
company: River City, River Panorama, Sky89, The Wave, The
Standard Binh Duong, Westgate...
9M 2021 BUSINESS RESULTS
9M2021, AGG achieved net revenue of VND 687 billion (8
times higher than the same period)). Net Income– MI reached
VND 205 billion (+3% yoy) due to a sharp increase in SG&A
expenses over the same period. With this result, AGG has
completed 19% and 41% of the revenue and profit plan for
2021 respectively
Customer paying in advance grew well to VND 3,337 billion
(+30.7% ytd) accounting for 28% of total resources. D/E is
0.96x which is safe level
Sources: AGG, VCBS summarized
-60%
-40%
-20%
0%
20%
40%
60%
80%
100%
2016A 2017A 2018A 2019A 2020A 2021F 2022F 2023F 2024F 2025F
ROE ROA Gross margin Net margin
0%
10%
20%
30%
40%
50%
60%
70%
80%
90%
0
1,000
2,000
3,000
4,000
5,000
6,000
2016A 2017A 2018A 2019A 2020A 2021F 2022F 2023F
Net sales Net income-MI Net profit margin
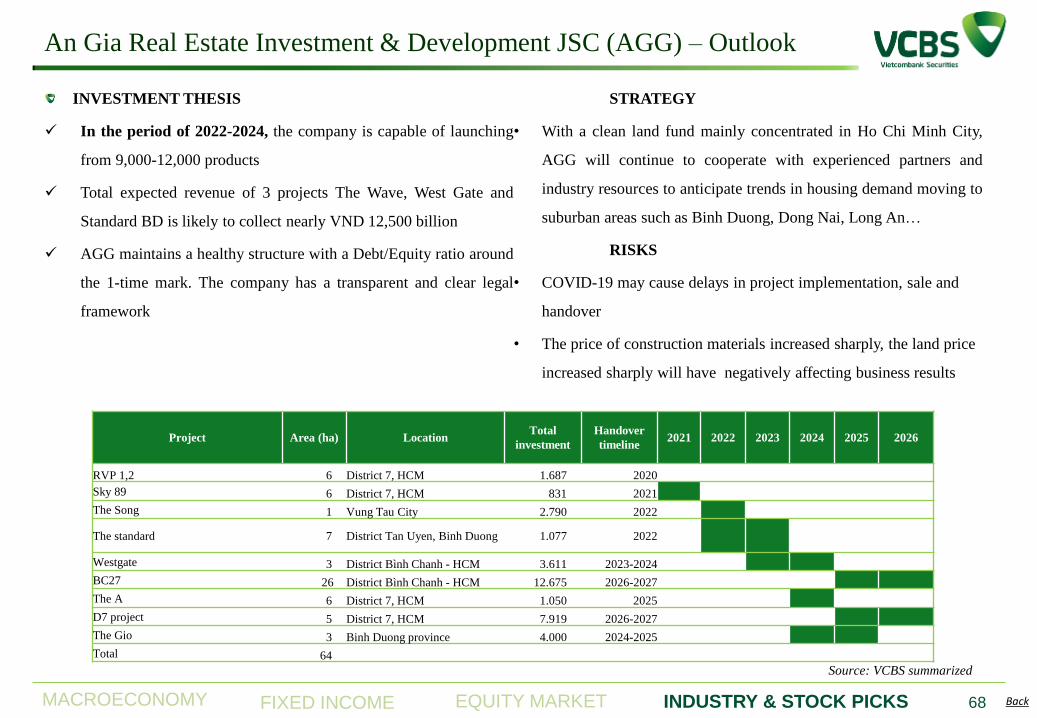
MACROECONOMY EQUITY MARKET INDUSTRY & STOCK PICKS FIXED INCOME Back
An Gia Real Estate Investment & Development JSC (AGG) – Outlook
68
INVESTMENT THESIS
In the period of 2022-2024, the company is capable of launching
from 9,000-12,000 products
Total expected revenue of 3 projects The Wave, West Gate and
Standard BD is likely to collect nearly VND 12,500 billion
AGG maintains a healthy structure with a Debt/Equity ratio around
the 1-time mark. The company has a transparent and clear legal
framework
STRATEGY
• With a clean land fund mainly concentrated in Ho Chi Minh City,
AGG will continue to cooperate with experienced partners and
industry resources to anticipate trends in housing demand moving to
suburban areas such as Binh Duong, Dong Nai, Long An…
RISKS
• COVID-19 may cause delays in project implementation, sale and
handover
• The price of construction materials increased sharply, the land price
increased sharply will have negatively affecting business results
7.128 3.693
4.100 4.300
1.987 1.222 1.623
3.240 4.661
Source: VCBS summarized
Project Area (ha) Location Total
investment
Handover
timeline 2021 2022 2023 2024 2025 2026
RVP 1,2 6 District 7, HCM 1.687 2020
Sky 89 6 District 7, HCM 831 2021
The Song 1 Vung Tau City 2.790 2022
The standard 7 District Tan Uyen, Binh Duong 1.077 2022
Westgate 3 District Bình Chanh - HCM 3.611 2023-2024
BC27 26 District Bình Chanh - HCM 12.675 2026-2027
The A 6 District 7, HCM 1.050 2025
D7 project 5 District 7, HCM 7.919 2026-2027
The Gio 3 Binh Duong province 4.000 2024-2025
Total 64
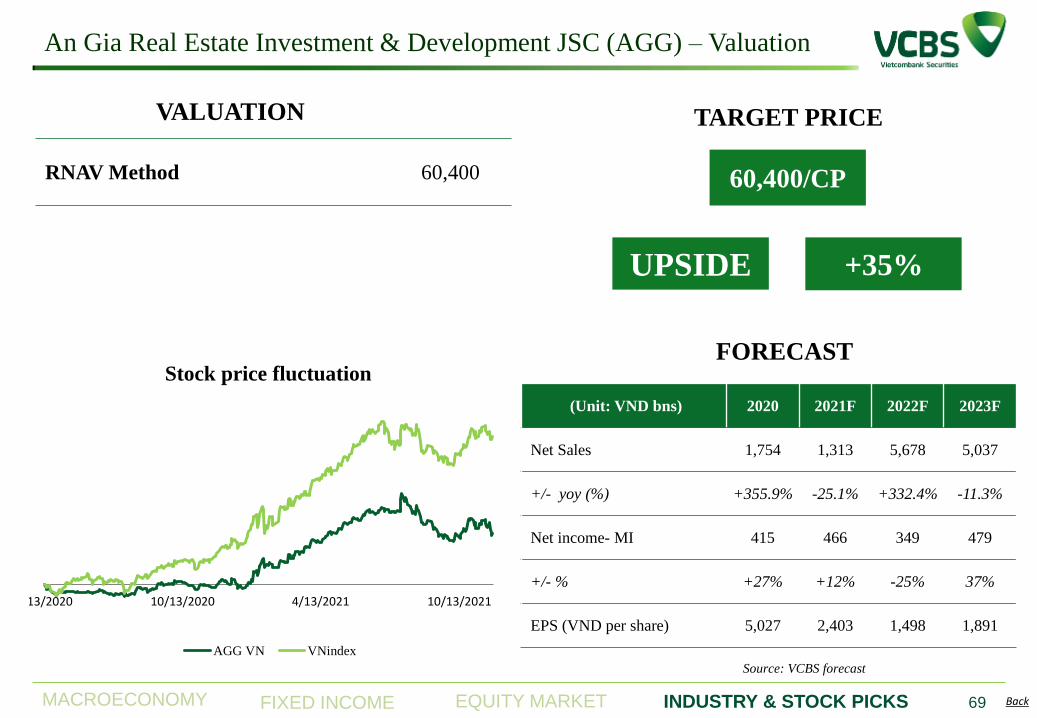
MACROECONOMY EQUITY MARKET INDUSTRY & STOCK PICKS FIXED INCOME Back
An Gia Real Estate Investment & Development JSC (AGG) – Valuation
69
VALUATION
RNAV Method 60,400 60,400/CP
TARGET PRICE
+35% UPSIDE
FORECAST
(Unit: VND bns) 2020 2021F 2022F 2023F
Net Sales 1,754 1,313 5,678 5,037
+/- yoy (%) +355.9% -25.1% +332.4% -11.3%
Net income- MI 415 466 349 479
+/- % +27% +12% -25% 37%
EPS (VND per share) 5,027 2,403 1,498 1,891
4/13/2020 10/13/2020 4/13/2021 10/13/2021
Stock price fluctuation
AGG VN VNindex
Source: VCBS forecast
INDUSTRIAL PARK
SECTOR
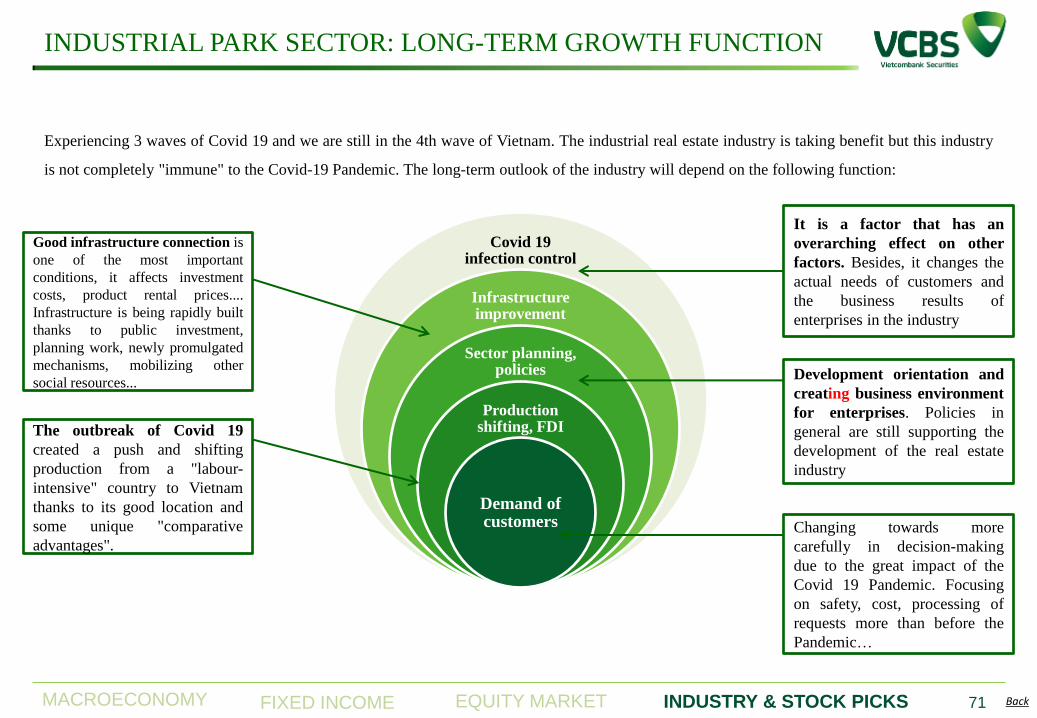
MACROECONOMY EQUITY MARKET INDUSTRY & STOCK PICKS FIXED INCOME Back
INDUSTRIAL PARK SECTOR: LONG-TERM GROWTH FUNCTION
71
Experiencing 3 waves of Covid 19 and we are still in the 4th wave of Vietnam. The industrial real estate industry is taking benefit but this industry
is not completely "immune" to the Covid-19 Pandemic. The long-term outlook of the industry will depend on the following function:
Covid 19 infection control
Infrastructure improvement
Sector planning, policies
Production shifting, FDI
Demand of customers
Good infrastructure connection is
one of the most important
conditions, it affects investment
costs, product rental prices....
Infrastructure is being rapidly built
thanks to public investment,
planning work, newly promulgated
mechanisms, mobilizing other
social resources...
It is a factor that has an
overarching effect on other
factors. Besides, it changes the
actual needs of customers and
the business results of
enterprises in the industry
Development orientation and
creating business environment
for enterprises. Policies in
general are still supporting the
development of the real estate
industry
Changing towards more
carefully in decision-making
due to the great impact of the
Covid 19 Pandemic. Focusing
on safety, cost, processing of
requests more than before the
Pandemic…
The outbreak of Covid 19
created a push and shifting
production from a "labour-
intensive" country to Vietnam
thanks to its good location and
some unique "comparative
advantages".
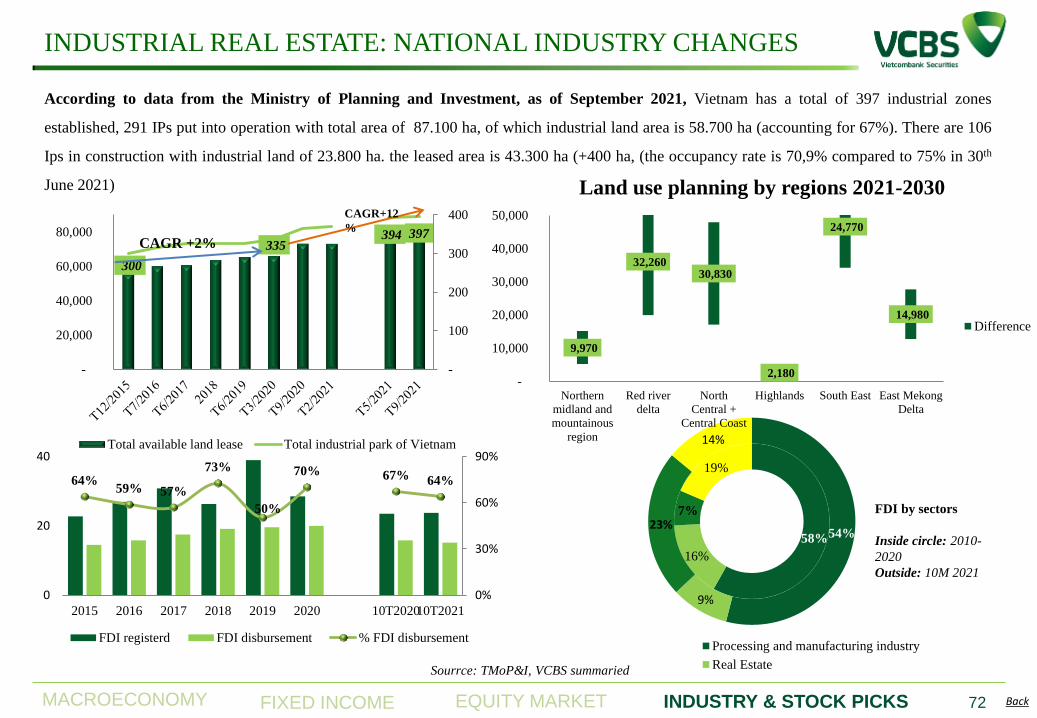
MACROECONOMY EQUITY MARKET INDUSTRY & STOCK PICKS FIXED INCOME Back
INDUSTRIAL REAL ESTATE: NATIONAL INDUSTRY CHANGES
72
According to data from the Ministry of Planning and Investment, as of September 2021, Vietnam has a total of 397 industrial zones
established, 291 IPs put into operation with total area of 87.100 ha, of which industrial land area is 58.700 ha (accounting for 67%). There are 106
Ips in construction with industrial land of 23.800 ha. the leased area is 43.300 ha (+400 ha, (the occupancy rate is 70,9% compared to 75% in 30th
June 2021)
300
335 394 397
-
100
200
300
400
-
20,000
40,000
60,000
80,000
Total available land lease Total industrial park of Vietnam
CAGR +2%
CAGR+12
%
58%
16%
7%
19%
54%
9%
23%
14%
Processing and manufacturing industry
Real Estate
FDI by sectors
Inside circle: 2010-
2020
Outside: 10M 2021
9,970
32,260 30,830
2,180
24,770
14,980
-
10,000
20,000
30,000
40,000
50,000
Northern
midland and
mountainous
region
Red river
delta
North
Central +
Central Coast
Highlands South East East Mekong
Delta
Land use planning by regions 2021-2030
Difference
Sourrce: TMoP&I, VCBS summaried
64% 59% 57%
73%
50%
70% 67% 64%
0%
30%
60%
90%
0
20
40
2015 2016 2017 2018 2019 2020 10T202010T2021
FDI registerd FDI disbursement % FDI disbursement
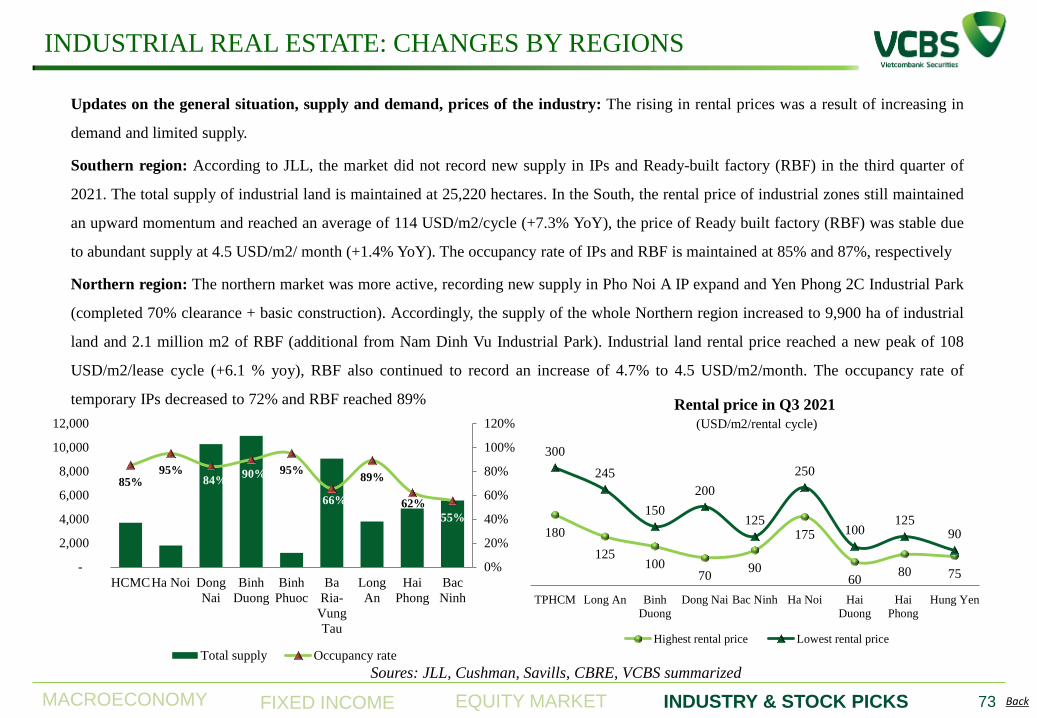
MACROECONOMY EQUITY MARKET INDUSTRY & STOCK PICKS FIXED INCOME Back
INDUSTRIAL REAL ESTATE: CHANGES BY REGIONS
73
Updates on the general situation, supply and demand, prices of the industry: The rising in rental prices was a result of increasing in
demand and limited supply.
Southern region: According to JLL, the market did not record new supply in IPs and Ready-built factory (RBF) in the third quarter of
2021. The total supply of industrial land is maintained at 25,220 hectares. In the South, the rental price of industrial zones still maintained
an upward momentum and reached an average of 114 USD/m2/cycle (+7.3% YoY), the price of Ready built factory (RBF) was stable due
to abundant supply at 4.5 USD/m2/ month (+1.4% YoY). The occupancy rate of IPs and RBF is maintained at 85% and 87%, respectively
Northern region: The northern market was more active, recording new supply in Pho Noi A IP expand and Yen Phong 2C Industrial Park
(completed 70% clearance + basic construction). Accordingly, the supply of the whole Northern region increased to 9,900 ha of industrial
land and 2.1 million m2 of RBF (additional from Nam Dinh Vu Industrial Park). Industrial land rental price reached a new peak of 108
USD/m2/lease cycle (+6.1 % yoy), RBF also continued to record an increase of 4.7% to 4.5 USD/m2/month. The occupancy rate of
temporary IPs decreased to 72% and RBF reached 89%
Soures: JLL, Cushman, Savills, CBRE, VCBS summarized
85% 95%
84% 90% 95%
66%
89%
62%
55%
0%
20%
40%
60%
80%
100%
120%
-
2,000
4,000
6,000
8,000
10,000
12,000
HCMCHa Noi Dong
Nai
Binh
Duong
Binh
Phuoc
Ba
Ria-
Vung
Tau
Long
An
Hai
Phong
Bac
Ninh
Total supply Occupancy rate
180
125 100
70 90
175
60 80 75
300
245
150
200
125
250
100 125
90
TPHCM Long An Binh
Duong
Dong Nai Bac Ninh Ha Noi Hai
Duong
Hai
Phong
Hung Yen
Rental price in Q3 2021
(USD/m2/rental cycle)
Highest rental price Lowest rental price
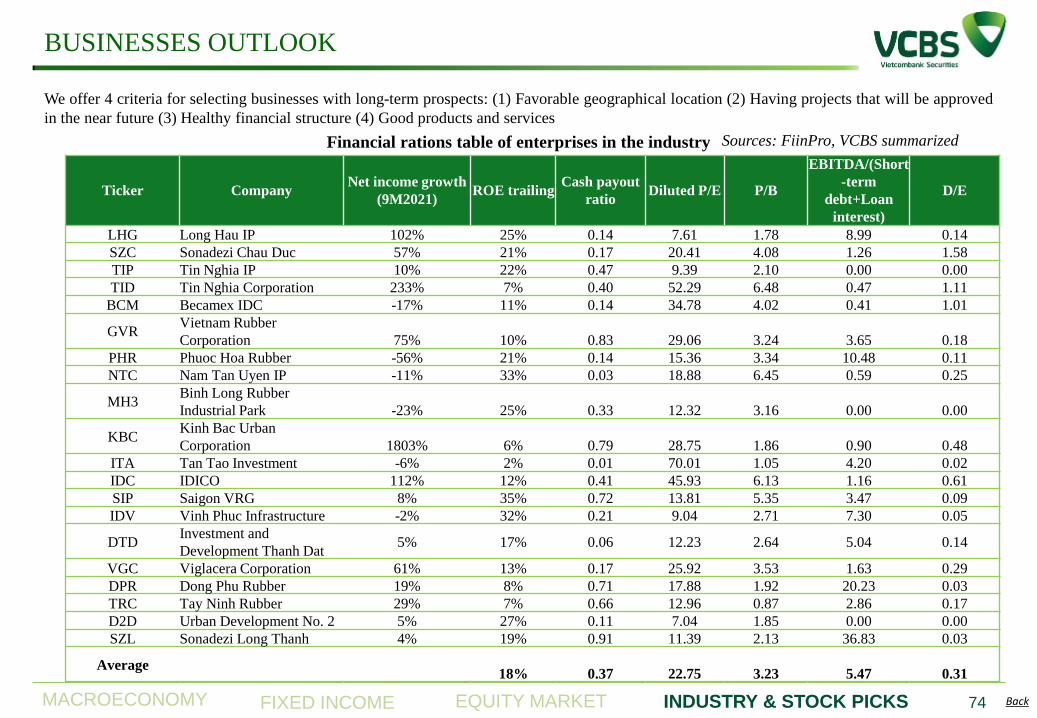
MACROECONOMY EQUITY MARKET INDUSTRY & STOCK PICKS FIXED INCOME Back
BUSINESSES OUTLOOK
74
We offer 4 criteria for selecting businesses with long-term prospects: (1) Favorable geographical location (2) Having projects that will be approved
in the near future (3) Healthy financial structure (4) Good products and services
Financial rations table of enterprises in the industry Sources: FiinPro, VCBS summarized
Ticker Company Net income growth
(9M2021) ROE trailing
Cash payout
ratio Diluted P/E P/B
EBITDA/(Short
-term
debt+Loan
interest)
D/E
LHG Long Hau IP 102% 25% 0.14 7.61 1.78 8.99 0.14
SZC Sonadezi Chau Duc 57% 21% 0.17 20.41 4.08 1.26 1.58
TIP Tin Nghia IP 10% 22% 0.47 9.39 2.10 0.00 0.00
TID Tin Nghia Corporation 233% 7% 0.40 52.29 6.48 0.47 1.11
BCM Becamex IDC -17% 11% 0.14 34.78 4.02 0.41 1.01
GVR Vietnam Rubber
Corporation 75% 10% 0.83 29.06 3.24 3.65 0.18
PHR Phuoc Hoa Rubber -56% 21% 0.14 15.36 3.34 10.48 0.11
NTC Nam Tan Uyen IP -11% 33% 0.03 18.88 6.45 0.59 0.25
MH3 Binh Long Rubber
Industrial Park -23% 25% 0.33 12.32 3.16 0.00 0.00
KBC Kinh Bac Urban
Corporation 1803% 6% 0.79 28.75 1.86 0.90 0.48
ITA Tan Tao Investment -6% 2% 0.01 70.01 1.05 4.20 0.02
IDC IDICO 112% 12% 0.41 45.93 6.13 1.16 0.61
SIP Saigon VRG 8% 35% 0.72 13.81 5.35 3.47 0.09
IDV Vinh Phuc Infrastructure -2% 32% 0.21 9.04 2.71 7.30 0.05
DTD Investment and
Development Thanh Dat 5% 17% 0.06 12.23 2.64 5.04 0.14
VGC Viglacera Corporation 61% 13% 0.17 25.92 3.53 1.63 0.29
DPR Dong Phu Rubber 19% 8% 0.71 17.88 1.92 20.23 0.03
TRC Tay Ninh Rubber 29% 7% 0.66 12.96 0.87 2.86 0.17
D2D Urban Development No. 2 5% 27% 0.11 7.04 1.85 0.00 0.00
SZL Sonadezi Long Thanh 4% 19% 0.91 11.39 2.13 36.83 0.03
Average
18%
0.37
22.75
3.23
5.47
0.31
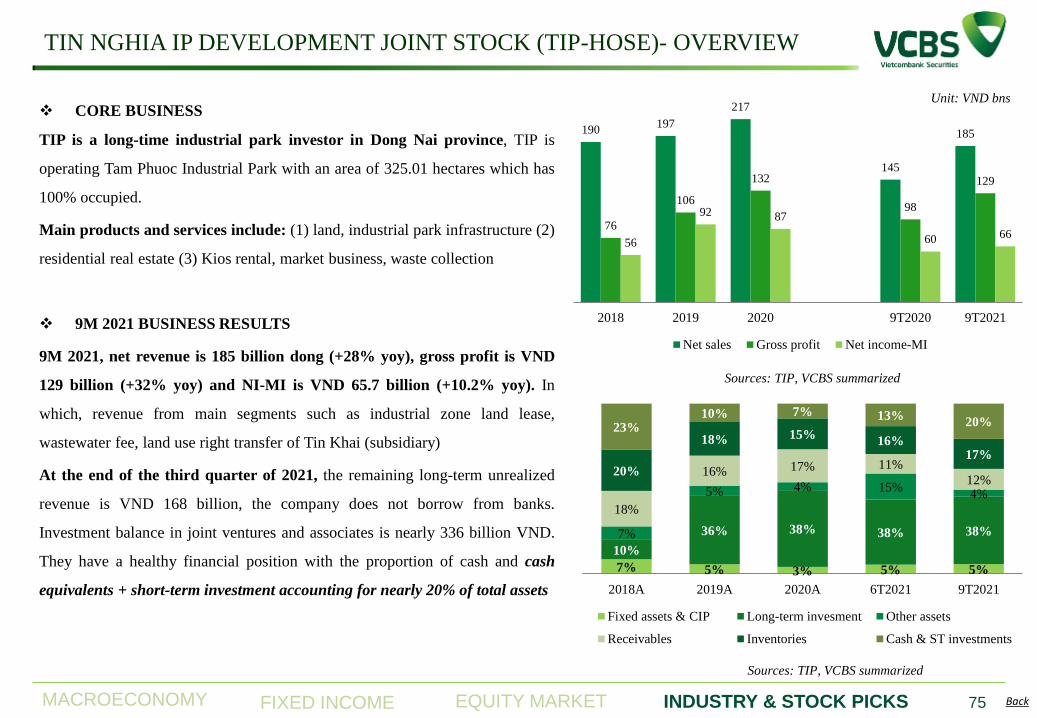
MACROECONOMY EQUITY MARKET INDUSTRY & STOCK PICKS FIXED INCOME Back
TIN NGHIA IP DEVELOPMENT JOINT STOCK (TIP-HOSE)- OVERVIEW
75
CORE BUSINESS
TIP is a long-time industrial park investor in Dong Nai province, TIP is
operating Tam Phuoc Industrial Park with an area of 325.01 hectares which has
100% occupied.
Main products and services include: (1) land, industrial park infrastructure (2)
residential real estate (3) Kios rental, market business, waste collection
9M 2021 BUSINESS RESULTS
9M 2021, net revenue is 185 billion dong (+28% yoy), gross profit is VND
129 billion (+32% yoy) and NI-MI is VND 65.7 billion (+10.2% yoy). In
which, revenue from main segments such as industrial zone land lease,
wastewater fee, land use right transfer of Tin Khai (subsidiary)
At the end of the third quarter of 2021, the remaining long-term unrealized
revenue is VND 168 billion, the company does not borrow from banks.
Investment balance in joint ventures and associates is nearly 336 billion VND.
They have a healthy financial position with the proportion of cash and cash
equivalents + short-term investment accounting for nearly 20% of total assets
Sources: TIP, VCBS summarized
7% 5% 3% 5% 5%
10%
36% 38% 38% 38% 7%
5% 4% 15% 4%
18%
16% 17% 11%
12% 20%
18% 15% 16%
17%
23% 10% 7% 13%
20%
2018A 2019A 2020A 6T2021 9T2021
Fixed assets & CIP Long-term invesment Other assets
Receivables Inventories Cash & ST investments
Sources: TIP, VCBS summarized
190 197
217
145
185
76
106
132
98
129
56
92 87
60 66
2018 2019 2020 9T2020 9T2021
Net sales Gross profit Net income-MI
Unit: VND bns
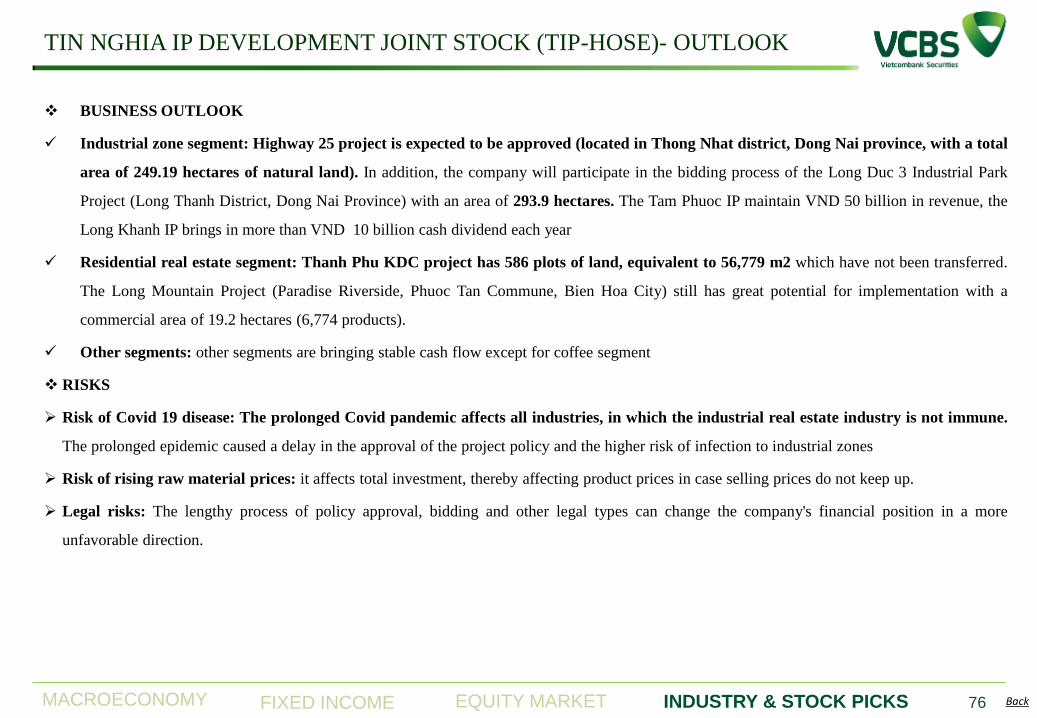
MACROECONOMY EQUITY MARKET INDUSTRY & STOCK PICKS FIXED INCOME Back
TIN NGHIA IP DEVELOPMENT JOINT STOCK (TIP-HOSE)- OUTLOOK
76
BUSINESS OUTLOOK
Industrial zone segment: Highway 25 project is expected to be approved (located in Thong Nhat district, Dong Nai province, with a total
area of 249.19 hectares of natural land). In addition, the company will participate in the bidding process of the Long Duc 3 Industrial Park
Project (Long Thanh District, Dong Nai Province) with an area of 293.9 hectares. The Tam Phuoc IP maintain VND 50 billion in revenue, the
Long Khanh IP brings in more than VND 10 billion cash dividend each year
Residential real estate segment: Thanh Phu KDC project has 586 plots of land, equivalent to 56,779 m2 which have not been transferred.
The Long Mountain Project (Paradise Riverside, Phuoc Tan Commune, Bien Hoa City) still has great potential for implementation with a
commercial area of 19.2 hectares (6,774 products).
Other segments: other segments are bringing stable cash flow except for coffee segment
RISKS
Risk of Covid 19 disease: The prolonged Covid pandemic affects all industries, in which the industrial real estate industry is not immune.
The prolonged epidemic caused a delay in the approval of the project policy and the higher risk of infection to industrial zones
Risk of rising raw material prices: it affects total investment, thereby affecting product prices in case selling prices do not keep up.
Legal risks: The lengthy process of policy approval, bidding and other legal types can change the company's financial position in a more
unfavorable direction.
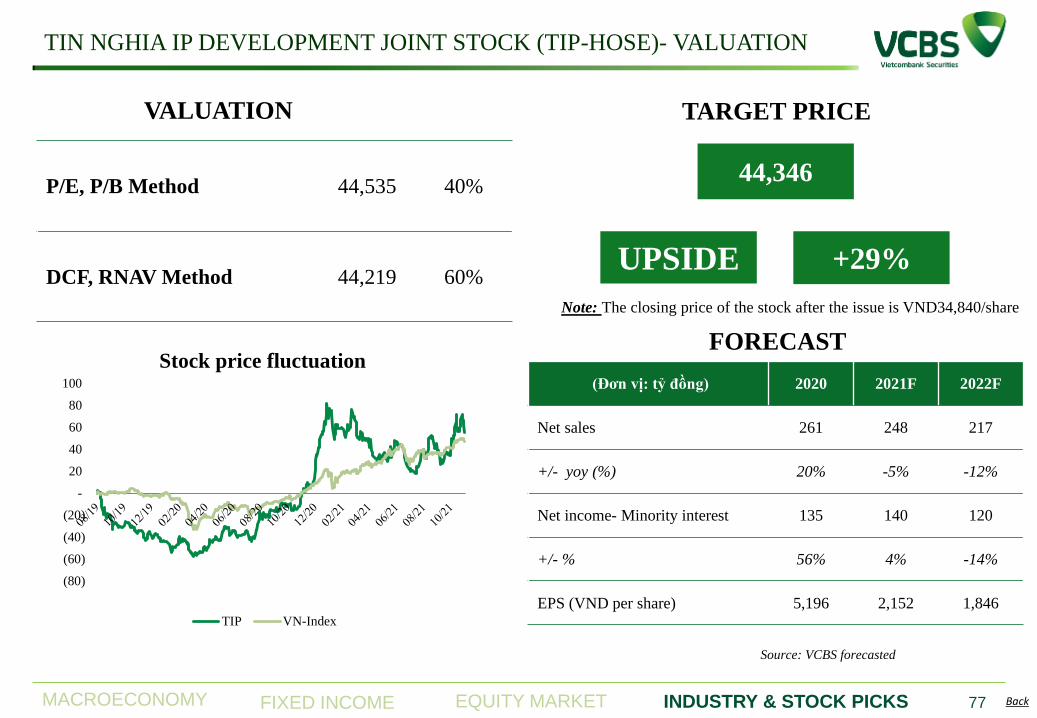
MACROECONOMY EQUITY MARKET INDUSTRY & STOCK PICKS FIXED INCOME Back
TIN NGHIA IP DEVELOPMENT JOINT STOCK (TIP-HOSE)- VALUATION
77
VALUATION
P/E, P/B Method 44,535 40%
DCF, RNAV Method 44,219 60%
44,346
TARGET PRICE
+29% UPSIDE
FORECAST
(Đơn vị: tỷ đồng) 2020 2021F 2022F
Net sales 261 248 217
+/- yoy (%) 20% -5% -12%
Net income- Minority interest 135 140 120
+/- % 56% 4% -14%
EPS (VND per share) 5,196 2,152 1,846
Source: VCBS forecasted
(80)
(60)
(40)
(20)
-
20
40
60
80
100
Stock price fluctuation
TIP VN-Index
Note: The closing price of the stock after the issue is VND34,840/share
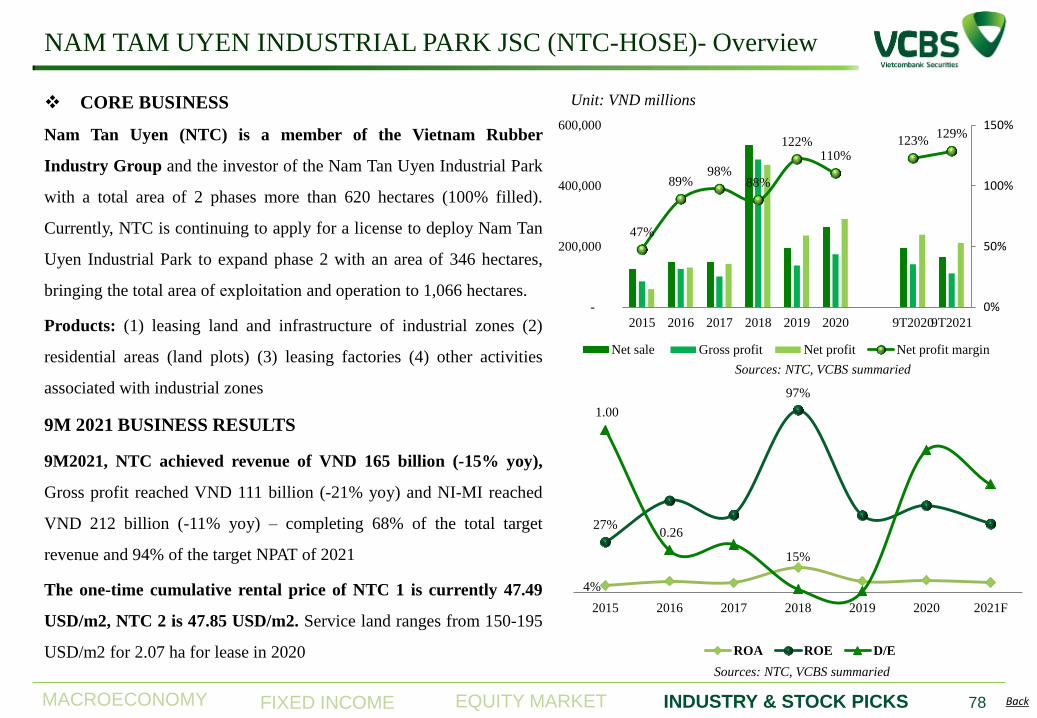
MACROECONOMY EQUITY MARKET INDUSTRY & STOCK PICKS FIXED INCOME Back
NAM TAM UYEN INDUSTRIAL PARK JSC (NTC-HOSE)- Overview
78
CORE BUSINESS
Nam Tan Uyen (NTC) is a member of the Vietnam Rubber
Industry Group and the investor of the Nam Tan Uyen Industrial Park
with a total area of 2 phases more than 620 hectares (100% filled).
Currently, NTC is continuing to apply for a license to deploy Nam Tan
Uyen Industrial Park to expand phase 2 with an area of 346 hectares,
bringing the total area of exploitation and operation to 1,066 hectares.
Products: (1) leasing land and infrastructure of industrial zones (2)
residential areas (land plots) (3) leasing factories (4) other activities
associated with industrial zones
9M 2021 BUSINESS RESULTS
9M2021, NTC achieved revenue of VND 165 billion (-15% yoy),
Gross profit reached VND 111 billion (-21% yoy) and NI-MI reached
VND 212 billion (-11% yoy) – completing 68% of the total target
revenue and 94% of the target NPAT of 2021
The one-time cumulative rental price of NTC 1 is currently 47.49
USD/m2, NTC 2 is 47.85 USD/m2. Service land ranges from 150-195
USD/m2 for 2.07 ha for lease in 2020
Sources: NTC, VCBS summaried
4%
15%
27%
97%
1.00
0.26
2015 2016 2017 2018 2019 2020 2021F
ROA ROE D/E
Sources: NTC, VCBS summaried
47%
89% 98%
88%
122% 110%
123% 129%
0%
50%
100%
150%
-
200,000
400,000
600,000
2015 2016 2017 2018 2019 2020 9T20209T2021
Unit: VND millions
Net sale Gross profit Net profit Net profit margin
MACROECONOMY EQUITY MARKET INDUSTRY & STOCK PICKS FIXED INCOME Back
NAM TAM UYEN INDUSTRIAL PARK JSC (NTC-HOSE)- Outlook
79
INVESTMENT THESIS
The growth engine in the next 5 years will come from NTC Industrial Park expanding phase 2 with a commercial area
of 259 hectares. Expected rental price is in the range of 110-150 USD/m2/cycle
NTC2 residential area with an area of 19.5 hectares has been approved for 1/500 planning and is in the process of applying for a
policy
Revenues from 2 existing IPs remain stable
Good cash dividend in 2021 at 8,000 VND/share
The company plans to move the exchange to HOSE and divest from GVR and its members
INVESTMENT RISKS
Slow progress of land allocation: The application for land lease has been submitted to the Department of Natural Resources and
Environment since September 4, 2020 but has not been approved so far. In the context of the remaining land for lease is no longer
available. The delay in land allocation will affect NTC's business result
Covid19 epidemic: the outbreak may affect the investment attraction of NTC
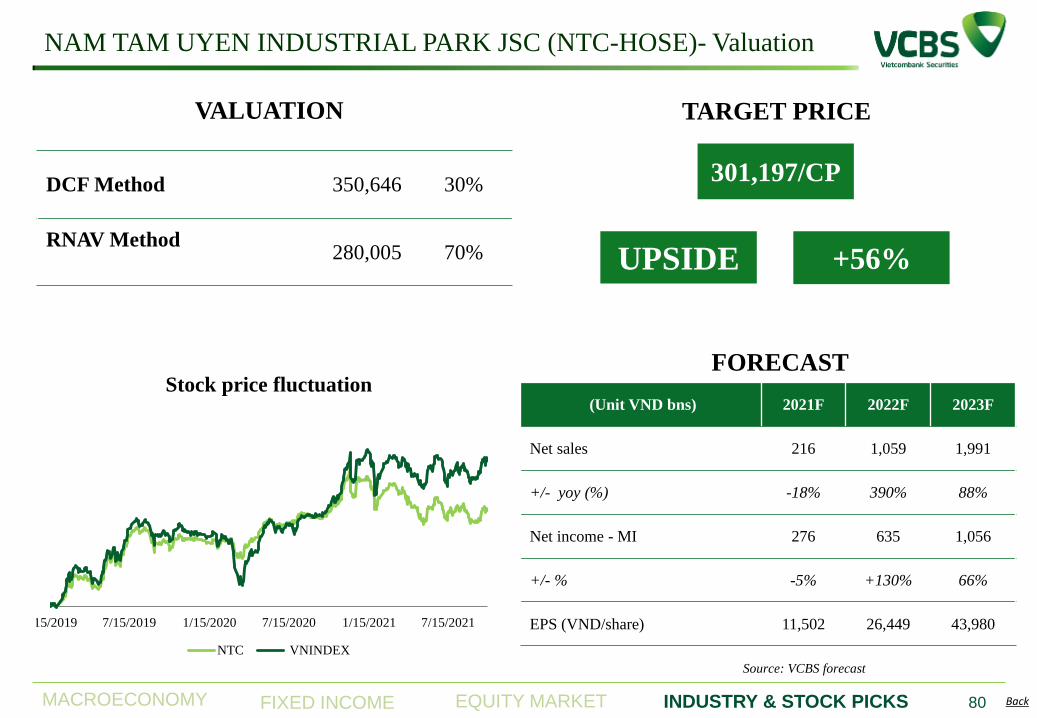
MACROECONOMY EQUITY MARKET INDUSTRY & STOCK PICKS FIXED INCOME Back
NAM TAM UYEN INDUSTRIAL PARK JSC (NTC-HOSE)- Valuation
80
VALUATION
DCF Method 350,646 30%
RNAV Method
280,005 70%
301,197/CP
TARGET PRICE
+56% UPSIDE
FORECAST
(Unit VND bns) 2021F 2022F 2023F
Net sales 216 1,059 1,991
+/- yoy (%) -18% 390% 88%
Net income - MI 276 635 1,056
+/- % -5% +130% 66%
EPS (VND/share) 11,502 26,449 43,980
Source: VCBS forecast
1/15/2019 7/15/2019 1/15/2020 7/15/2020 1/15/2021 7/15/2021
Stock price fluctuation
NTC VNINDEX
CONSTRUCTION
MATERIALS
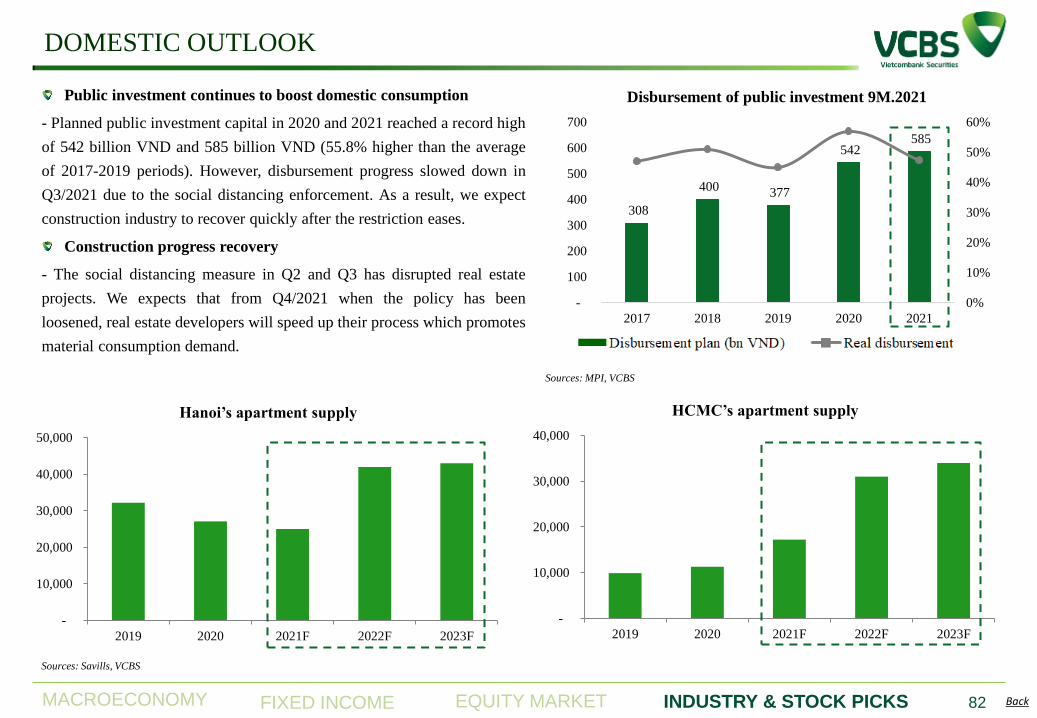
MACROECONOMY EQUITY MARKET INDUSTRY & STOCK PICKS FIXED INCOME Back
DOMESTIC OUTLOOK
82
Public investment continues to boost domestic consumption
- Planned public investment capital in 2020 and 2021 reached a record high
of 542 billion VND and 585 billion VND (55.8% higher than the average
of 2017-2019 periods). However, disbursement progress slowed down in
Q3/2021 due to the social distancing enforcement. As a result, we expect
construction industry to recover quickly after the restriction eases.
Construction progress recovery
- The social distancing measure in Q2 and Q3 has disrupted real estate
projects. We expects that from Q4/2021 when the policy has been
loosened, real estate developers will speed up their process which promotes
material consumption demand.
308
400 377
542 585
0%
10%
20%
30%
40%
50%
60%
-
100
200
300
400
500
600
700
2017 2018 2019 2020 2021
Disbursement of public investment 9M.2021
Kế hoạch giải ngân cả năm (tỷ đồng) Tỷ lệ giải ngân 9T (%)
-
10,000
20,000
30,000
40,000
50,000
2019 2020 2021F 2022F 2023F
Hanoi’s apartment supply
-
10,000
20,000
30,000
40,000
2019 2020 2021F 2022F 2023F
HCMC’s apartment supply
Sources: Savills, VCBS
Sources: MPI, VCBS
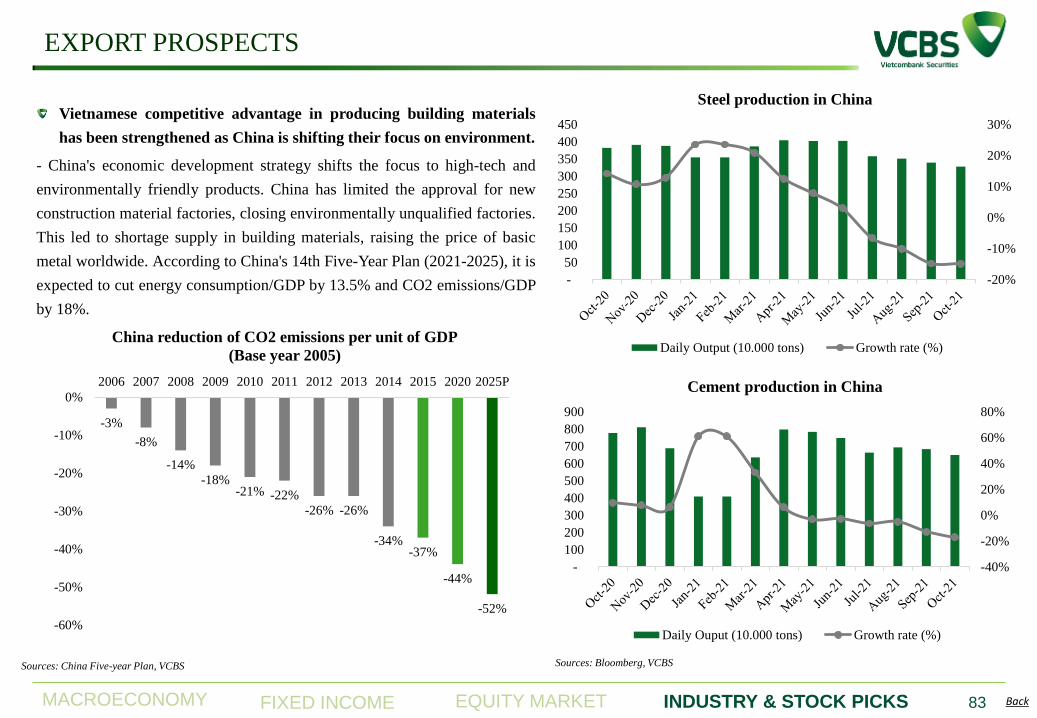
MACROECONOMY EQUITY MARKET INDUSTRY & STOCK PICKS FIXED INCOME Back
EXPORT PROSPECTS
83
-40%
-20%
0%
20%
40%
60%
80%
-
100
200
300
400
500
600
700
800
900
Cement production in China
Daily Ouput (10.000 tons) Growth rate (%)
-20%
-10%
0%
10%
20%
30%
-
50
100
150
200
250
300
350
400
450
Steel production in China
Daily Output (10.000 tons) Growth rate (%)
Sources: Bloomberg, VCBS
Vietnamese competitive advantage in producing building materials
has been strengthened as China is shifting their focus on environment.
- China's economic development strategy shifts the focus to high-tech and
environmentally friendly products. China has limited the approval for new
construction material factories, closing environmentally unqualified factories.
This led to shortage supply in building materials, raising the price of basic
metal worldwide. According to China's 14th Five-Year Plan (2021-2025), it is
expected to cut energy consumption/GDP by 13.5% and CO2 emissions/GDP
by 18%.
-3%
-8%
-14%
-18% -21% -22%
-26% -26%
-34% -37%
-44%
-52%
-60%
-50%
-40%
-30%
-20%
-10%
0%
2006 2007 2008 2009 2010 2011 2012 2013 2014 2015 2020 2025P
China reduction of CO2 emissions per unit of GDP
(Base year 2005)
Sources: China Five-year Plan, VCBS
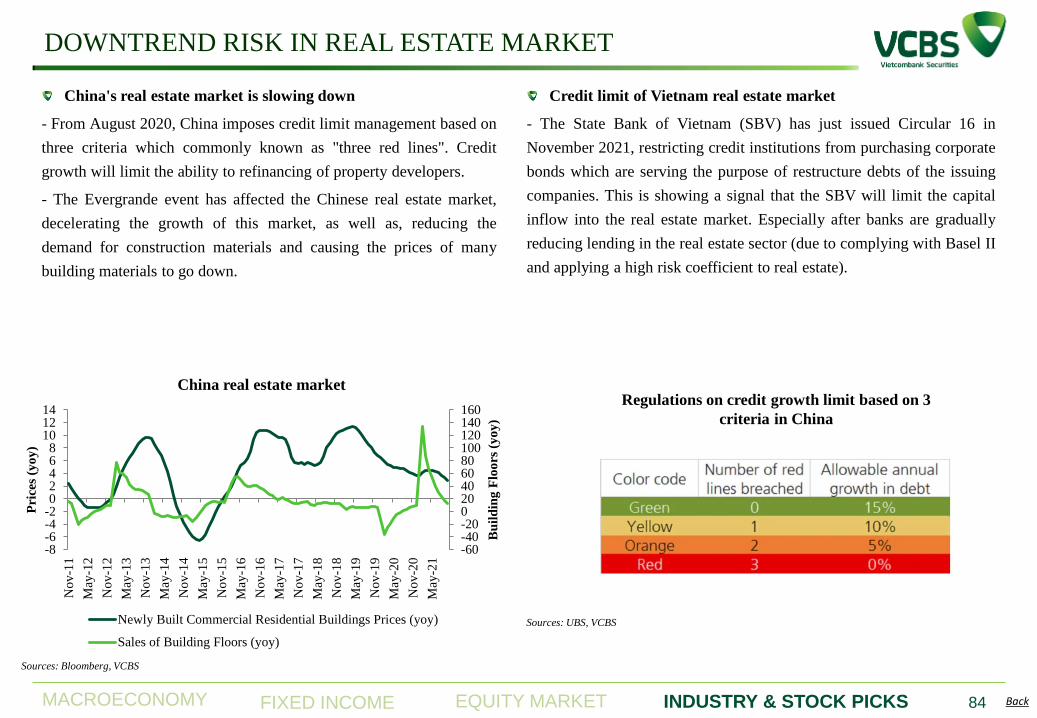
MACROECONOMY EQUITY MARKET INDUSTRY & STOCK PICKS FIXED INCOME Back
DOWNTREND RISK IN REAL ESTATE MARKET
84
China's real estate market is slowing down
- From August 2020, China imposes credit limit management based on
three criteria which commonly known as "three red lines". Credit
growth will limit the ability to refinancing of property developers.
- The Evergrande event has affected the Chinese real estate market,
decelerating the growth of this market, as well as, reducing the
demand for construction materials and causing the prices of many
building materials to go down.
-60-40-20020406080100120140160
-8-6-4-202468
101214
No
v-1
1
May
-12
No
v-1
2
May
-13
No
v-1
3
May
-14
No
v-1
4
May
-15
No
v-1
5
May
-16
No
v-1
6
May
-17
No
v-1
7
May
-18
No
v-1
8
May
-19
No
v-1
9
May
-20
No
v-2
0
May
-21
Bu
ild
ing
Flo
ors
(y
oy
)
Pri
ces
(yo
y)
China real estate market
Newly Built Commercial Residential Buildings Prices (yoy)
Sales of Building Floors (yoy)
Sources: UBS, VCBS
Regulations on credit growth limit based on 3
criteria in China
Credit limit of Vietnam real estate market
- The State Bank of Vietnam (SBV) has just issued Circular 16 in
November 2021, restricting credit institutions from purchasing corporate
bonds which are serving the purpose of restructure debts of the issuing
companies. This is showing a signal that the SBV will limit the capital
inflow into the real estate market. Especially after banks are gradually
reducing lending in the real estate sector (due to complying with Basel II
and applying a high risk coefficient to real estate).
Sources: Bloomberg, VCBS
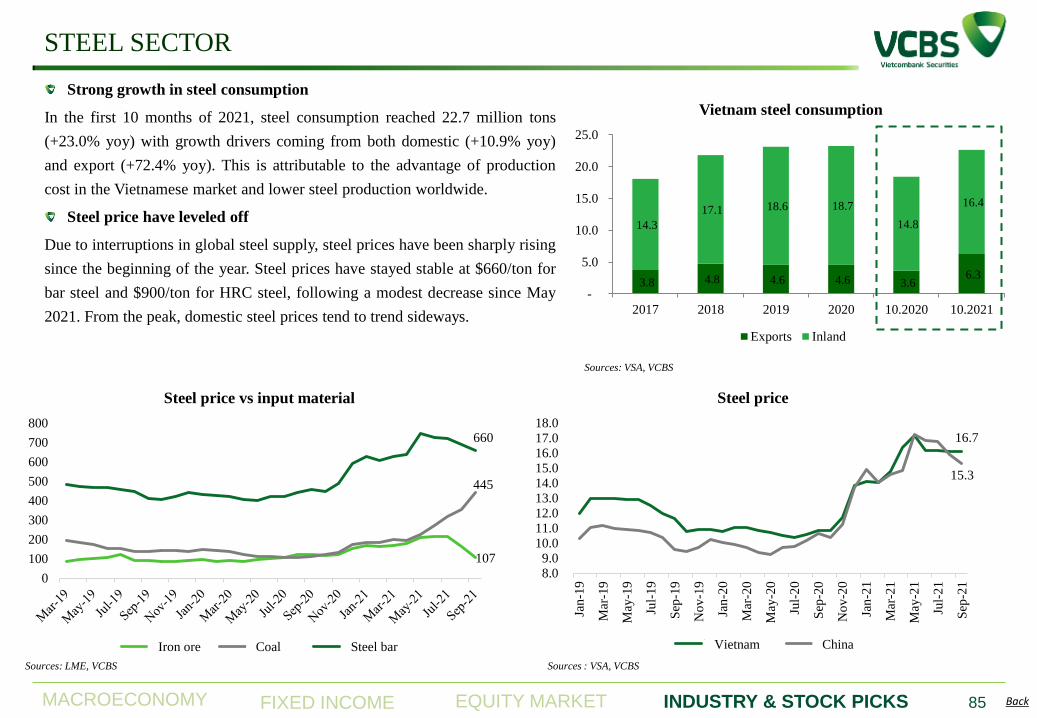
MACROECONOMY EQUITY MARKET INDUSTRY & STOCK PICKS FIXED INCOME Back
STEEL SECTOR
85
Strong growth in steel consumption
In the first 10 months of 2021, steel consumption reached 22.7 million tons
(+23.0% yoy) with growth drivers coming from both domestic (+10.9% yoy)
and export (+72.4% yoy). This is attributable to the advantage of production
cost in the Vietnamese market and lower steel production worldwide.
Steel price have leveled off
Due to interruptions in global steel supply, steel prices have been sharply rising
since the beginning of the year. Steel prices have stayed stable at $660/ton for
bar steel and $900/ton for HRC steel, following a modest decrease since May
2021. From the peak, domestic steel prices tend to trend sideways.
Sources: LME, VCBS Sources : VSA, VCBS
Sources: VSA, VCBS
107
445
660
0
100
200
300
400
500
600
700
800
Steel price vs input material
Quặng sắt Than cốc Thép thanh
16.7
15.3
8.0 9.0
10.0 11.0 12.0 13.0 14.0 15.0 16.0 17.0 18.0
Jan
-19
Mar
-19
May
-19
Jul-
19
Sep
-19
No
v-1
9
Jan
-20
Mar
-20
May
-20
Jul-
20
Sep
-20
No
v-2
0
Jan
-21
Mar
-21
May
-21
Jul-
21
Sep
-21
Steel price
Việt Nam Trung Quốc
3.8 4.8 4.6 4.6 3.6 6.3
14.3
17.1 18.6 18.7
14.8
16.4
-
5.0
10.0
15.0
20.0
25.0
2017 2018 2019 2020 10.2020 10.2021
Vietnam steel consumption
Exports Inland
Iron ore Coal Steel bar Vietnam China
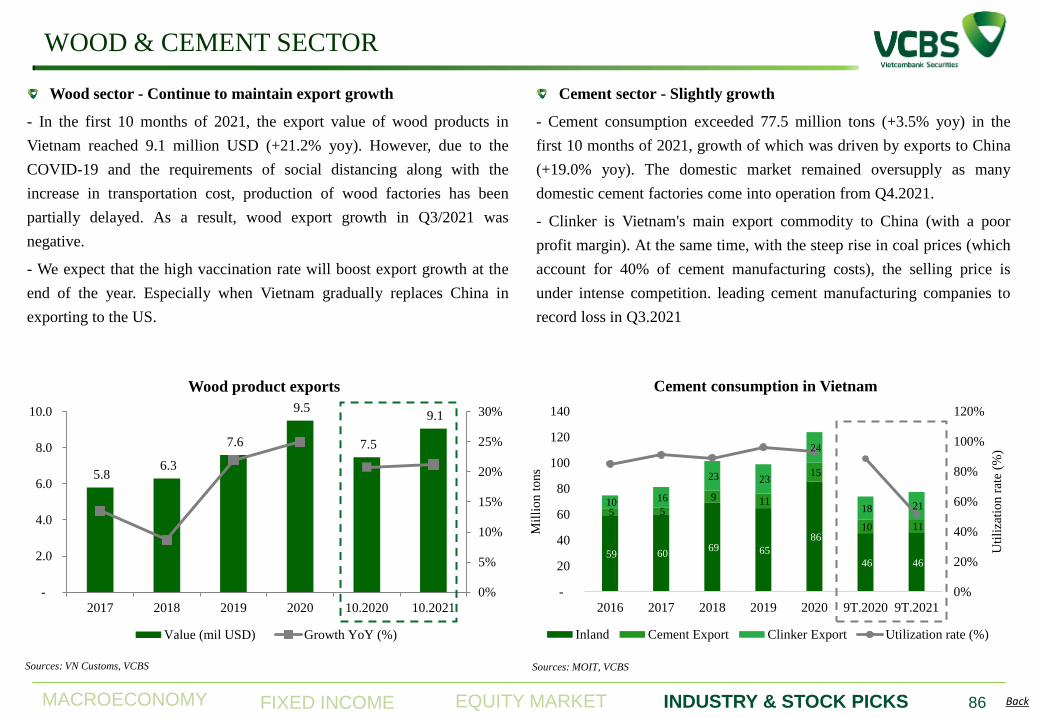
MACROECONOMY EQUITY MARKET INDUSTRY & STOCK PICKS FIXED INCOME Back
WOOD & CEMENT SECTOR
86
Wood sector - Continue to maintain export growth
- In the first 10 months of 2021, the export value of wood products in
Vietnam reached 9.1 million USD (+21.2% yoy). However, due to the
COVID-19 and the requirements of social distancing along with the
increase in transportation cost, production of wood factories has been
partially delayed. As a result, wood export growth in Q3/2021 was
negative.
- We expect that the high vaccination rate will boost export growth at the
end of the year. Especially when Vietnam gradually replaces China in
exporting to the US.
Sources: VN Customs, VCBS
5.8 6.3
7.6
9.5
7.5
9.1
0%
5%
10%
15%
20%
25%
30%
-
2.0
4.0
6.0
8.0
10.0
2017 2018 2019 2020 10.2020 10.2021
Wood product exports
Value (mil USD) Growth YoY (%)
Cement sector - Slightly growth
- Cement consumption exceeded 77.5 million tons (+3.5% yoy) in the
first 10 months of 2021, growth of which was driven by exports to China
(+19.0% yoy). The domestic market remained oversupply as many
domestic cement factories come into operation from Q4.2021.
- Clinker is Vietnam's main export commodity to China (with a poor
profit margin). At the same time, with the steep rise in coal prices (which
account for 40% of cement manufacturing costs), the selling price is
under intense competition. leading cement manufacturing companies to
record loss in Q3.2021
Sources: MOIT, VCBS
59 60 69 65
86
46 46
5 5
9 11
15
10 11
10 16
23 23
24
18 21
0%
20%
40%
60%
80%
100%
120%
-
20
40
60
80
100
120
140
2016 2017 2018 2019 2020 9T.2020 9T.2021
Uti
liza
tio
n r
ate
(%)
Mil
lio
n t
ons
Cement consumption in Vietnam
Inland Cement Export Clinker Export Utilization rate (%)
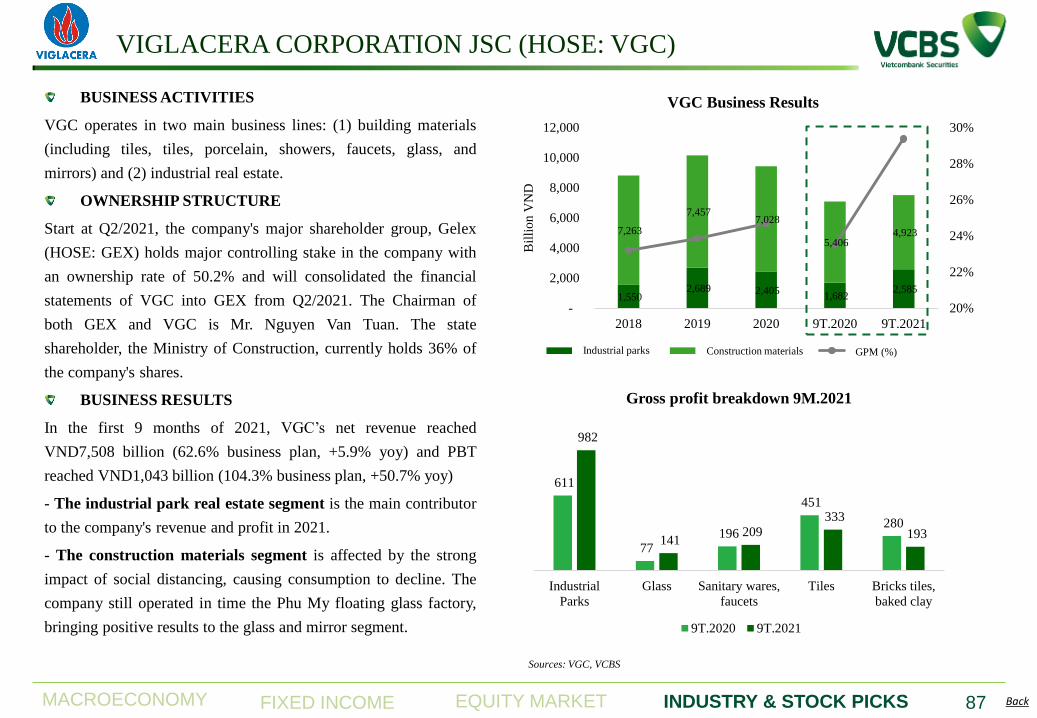
MACROECONOMY EQUITY MARKET INDUSTRY & STOCK PICKS FIXED INCOME Back
VIGLACERA CORPORATION JSC (HOSE: VGC)
87
BUSINESS ACTIVITIES
VGC operates in two main business lines: (1) building materials
(including tiles, tiles, porcelain, showers, faucets, glass, and
mirrors) and (2) industrial real estate.
OWNERSHIP STRUCTURE
Start at Q2/2021, the company's major shareholder group, Gelex
(HOSE: GEX) holds major controlling stake in the company with
an ownership rate of 50.2% and will consolidated the financial
statements of VGC into GEX from Q2/2021. The Chairman of
both GEX and VGC is Mr. Nguyen Van Tuan. The state
shareholder, the Ministry of Construction, currently holds 36% of
the company's shares.
BUSINESS RESULTS
In the first 9 months of 2021, VGC’s net revenue reached
VND7,508 billion (62.6% business plan, +5.9% yoy) and PBT
reached VND1,043 billion (104.3% business plan, +50.7% yoy)
- The industrial park real estate segment is the main contributor
to the company's revenue and profit in 2021.
- The construction materials segment is affected by the strong
impact of social distancing, causing consumption to decline. The
company still operated in time the Phu My floating glass factory,
bringing positive results to the glass and mirror segment.
Sources: VGC, VCBS
1,550 2,689 2,405
1,682 2,585
7,263
7,457 7,028
5,406 4,923
20%
22%
24%
26%
28%
30%
-
2,000
4,000
6,000
8,000
10,000
12,000
2018 2019 2020 9T.2020 9T.2021
Bil
lio
n V
ND
VGC Business Results
Bất động sản Vật liệu xây dựng Biên LNG (%)Industrial parks Construction materials GPM (%)
611
77 196
451
280
982
141 209
333
193
Industrial
Parks
Glass Sanitary wares,
faucets
Tiles Bricks tiles,
baked clay
Gross profit breakdown 9M.2021
9T.2020 9T.2021
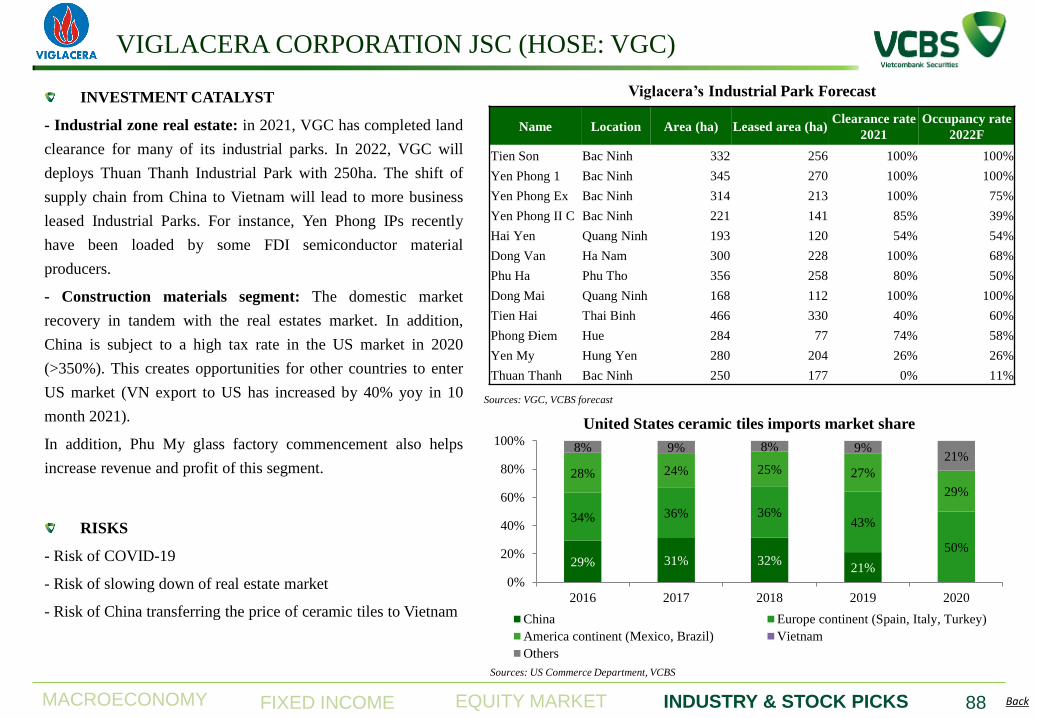
MACROECONOMY EQUITY MARKET INDUSTRY & STOCK PICKS FIXED INCOME Back
VIGLACERA CORPORATION JSC (HOSE: VGC)
88
INVESTMENT CATALYST
- Industrial zone real estate: in 2021, VGC has completed land
clearance for many of its industrial parks. In 2022, VGC will
deploys Thuan Thanh Industrial Park with 250ha. The shift of
supply chain from China to Vietnam will lead to more business
leased Industrial Parks. For instance, Yen Phong IPs recently
have been loaded by some FDI semiconductor material
producers.
- Construction materials segment: The domestic market
recovery in tandem with the real estates market. In addition,
China is subject to a high tax rate in the US market in 2020
(>350%). This creates opportunities for other countries to enter
US market (VN export to US has increased by 40% yoy in 10
month 2021).
In addition, Phu My glass factory commencement also helps
increase revenue and profit of this segment.
RISKS
- Risk of COVID-19
- Risk of slowing down of real estate market
- Risk of China transferring the price of ceramic tiles to Vietnam
Name Location Area (ha) Leased area (ha) Clearance rate
2021
Occupancy rate
2022F
Tien Son Bac Ninh 332 256 100% 100%
Yen Phong 1 Bac Ninh 345 270 100% 100%
Yen Phong Ex Bac Ninh 314 213 100% 75%
Yen Phong II C Bac Ninh 221 141 85% 39%
Hai Yen Quang Ninh 193 120 54% 54%
Dong Van Ha Nam 300 228 100% 68%
Phu Ha Phu Tho 356 258 80% 50%
Dong Mai Quang Ninh 168 112 100% 100%
Tien Hai Thai Binh 466 330 40% 60%
Phong Điem Hue 284 77 74% 58%
Yen My Hung Yen 280 204 26% 26%
Thuan Thanh Bac Ninh 250 177 0% 11%
Viglacera’s Industrial Park Forecast
29% 31% 32% 21%
34% 36% 36% 43%
50%
28% 24% 25% 27%
29%
8% 9% 8% 9% 21%
0%
20%
40%
60%
80%
100%
2016 2017 2018 2019 2020
United States ceramic tiles imports market share
China Europe continent (Spain, Italy, Turkey)
America continent (Mexico, Brazil) Vietnam
Others
Sources: VGC, VCBS forecast
Sources: US Commerce Department, VCBS
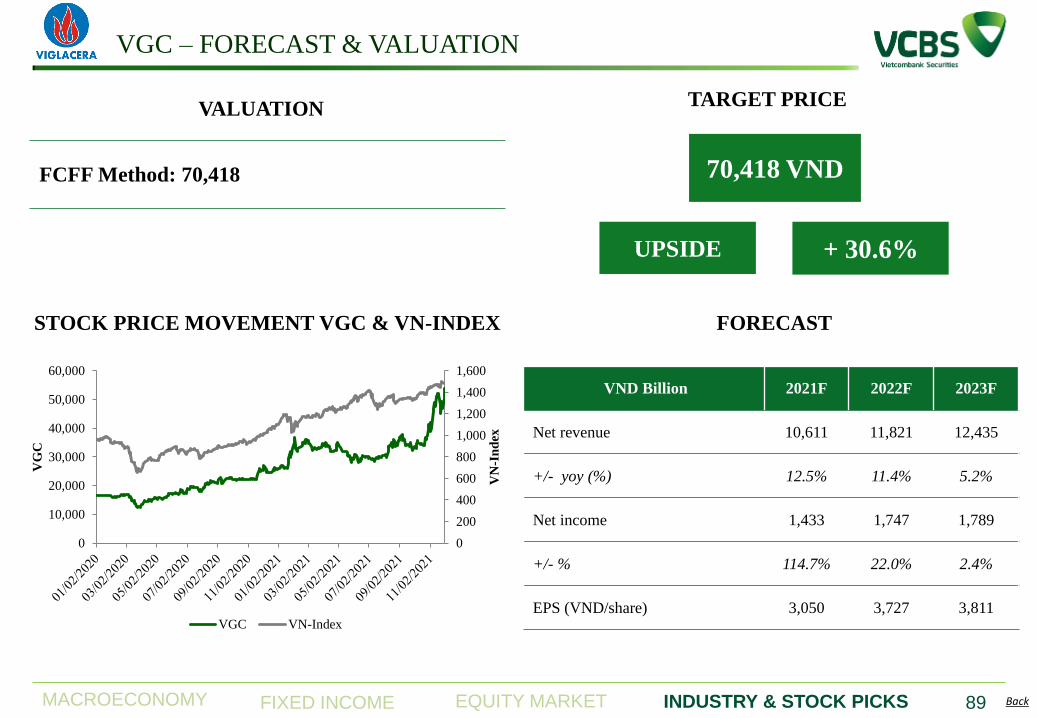
MACROECONOMY EQUITY MARKET INDUSTRY & STOCK PICKS FIXED INCOME Back
VGC – FORECAST & VALUATION
89
70,418 VND
TARGET PRICE
+ 30.6% UPSIDE
STOCK PRICE MOVEMENT VGC & VN-INDEX
FCFF Method: 70,418
VALUATION
VND Billion 2021F 2022F 2023F
Net revenue 10,611 11,821 12,435
+/- yoy (%) 12.5% 11.4% 5.2%
Net income 1,433 1,747 1,789
+/- % 114.7% 22.0% 2.4%
EPS (VND/share) 3,050 3,727 3,811
0
200
400
600
800
1,000
1,200
1,400
1,600
0
10,000
20,000
30,000
40,000
50,000
60,000
VN
-In
dex
VG
C
VGC VN-Index
FORECAST
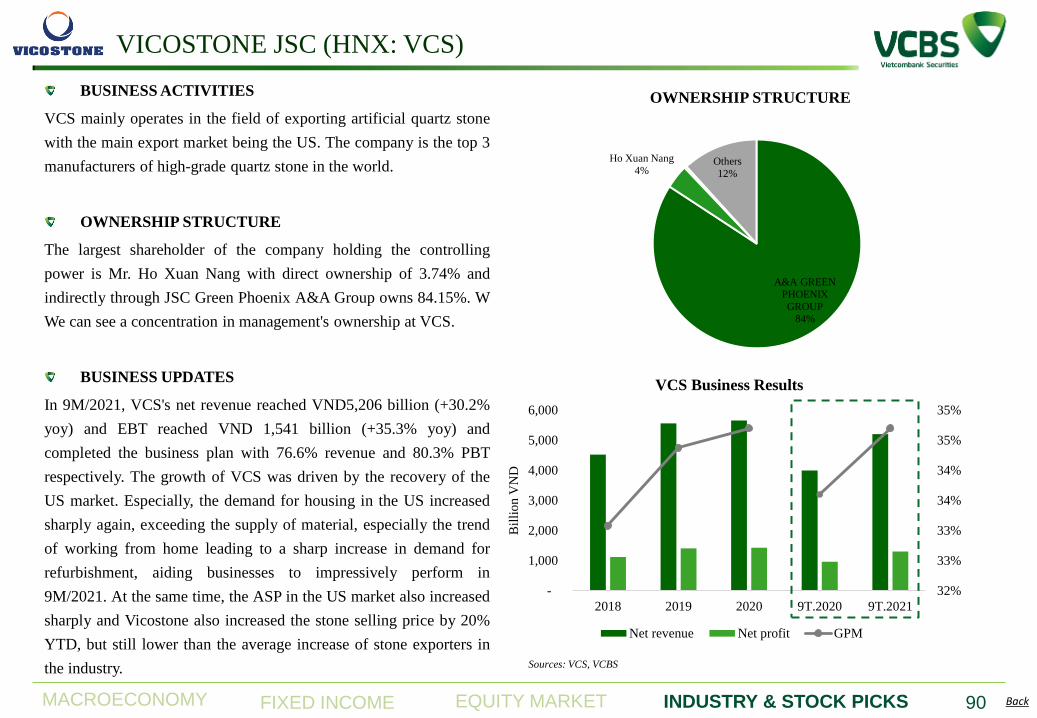
MACROECONOMY EQUITY MARKET INDUSTRY & STOCK PICKS FIXED INCOME Back
VICOSTONE JSC (HNX: VCS)
90
BUSINESS ACTIVITIES
VCS mainly operates in the field of exporting artificial quartz stone
with the main export market being the US. The company is the top 3
manufacturers of high-grade quartz stone in the world.
OWNERSHIP STRUCTURE
The largest shareholder of the company holding the controlling
power is Mr. Ho Xuan Nang with direct ownership of 3.74% and
indirectly through JSC Green Phoenix A&A Group owns 84.15%. W
We can see a concentration in management's ownership at VCS.
BUSINESS UPDATES
In 9M/2021, VCS's net revenue reached VND5,206 billion (+30.2%
yoy) and EBT reached VND 1,541 billion (+35.3% yoy) and
completed the business plan with 76.6% revenue and 80.3% PBT
respectively. The growth of VCS was driven by the recovery of the
US market. Especially, the demand for housing in the US increased
sharply again, exceeding the supply of material, especially the trend
of working from home leading to a sharp increase in demand for
refurbishment, aiding businesses to impressively perform in
9M/2021. At the same time, the ASP in the US market also increased
sharply and Vicostone also increased the stone selling price by 20%
YTD, but still lower than the average increase of stone exporters in
the industry.
Sources: VCS, VCBS
A&A GREEN
PHOENIX
GROUP 84%
Ho Xuan Nang
4% Others
12%
OWNERSHIP STRUCTURE
32%
33%
33%
34%
34%
35%
35%
-
1,000
2,000
3,000
4,000
5,000
6,000
2018 2019 2020 9T.2020 9T.2021
Bil
lio
n V
ND
VCS Business Results
Net revenue Net profit GPM
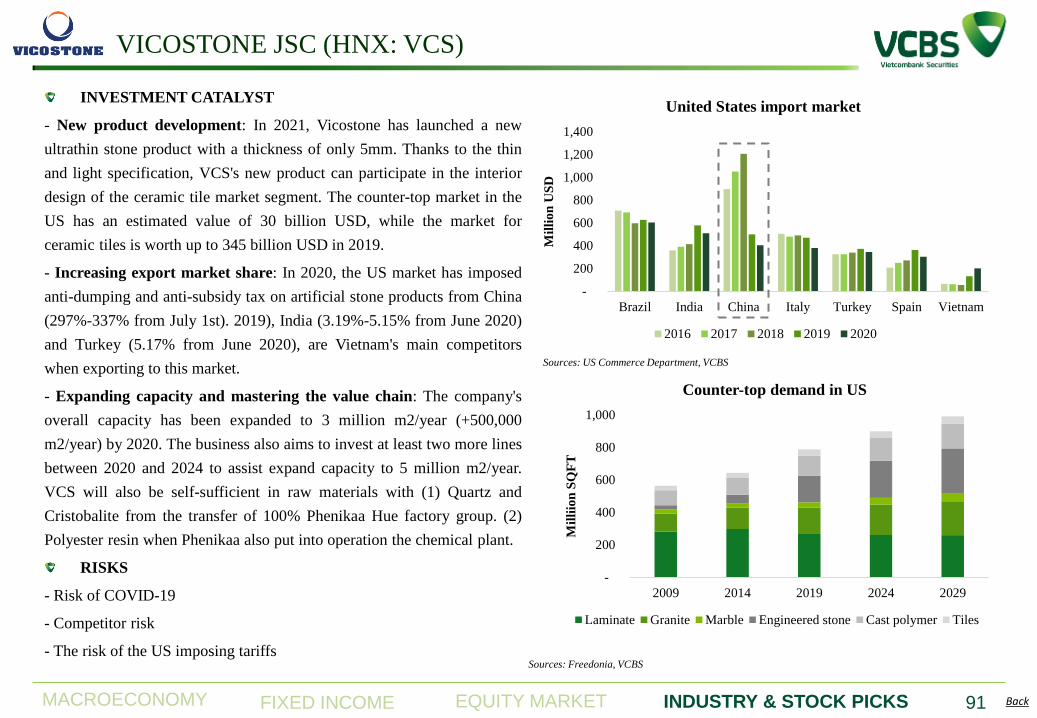
MACROECONOMY EQUITY MARKET INDUSTRY & STOCK PICKS FIXED INCOME Back
VICOSTONE JSC (HNX: VCS)
91
INVESTMENT CATALYST
- New product development: In 2021, Vicostone has launched a new
ultrathin stone product with a thickness of only 5mm. Thanks to the thin
and light specification, VCS's new product can participate in the interior
design of the ceramic tile market segment. The counter-top market in the
US has an estimated value of 30 billion USD, while the market for
ceramic tiles is worth up to 345 billion USD in 2019.
- Increasing export market share: In 2020, the US market has imposed
anti-dumping and anti-subsidy tax on artificial stone products from China
(297%-337% from July 1st). 2019), India (3.19%-5.15% from June 2020)
and Turkey (5.17% from June 2020), are Vietnam's main competitors
when exporting to this market.
- Expanding capacity and mastering the value chain: The company's
overall capacity has been expanded to 3 million m2/year (+500,000
m2/year) by 2020. The business also aims to invest at least two more lines
between 2020 and 2024 to assist expand capacity to 5 million m2/year.
VCS will also be self-sufficient in raw materials with (1) Quartz and
Cristobalite from the transfer of 100% Phenikaa Hue factory group. (2)
Polyester resin when Phenikaa also put into operation the chemical plant.
RISKS
- Risk of COVID-19
- Competitor risk
- The risk of the US imposing tariffs
-
200
400
600
800
1,000
1,200
1,400
Brazil India China Italy Turkey Spain Vietnam
Mil
lio
n U
SD
United States import market
2016 2017 2018 2019 2020
-
200
400
600
800
1,000
2009 2014 2019 2024 2029
Mil
liio
n S
QF
T
Counter-top demand in US
Laminate Granite Marble Engineered stone Cast polymer Tiles
Sources: Freedonia, VCBS
Sources: US Commerce Department, VCBS
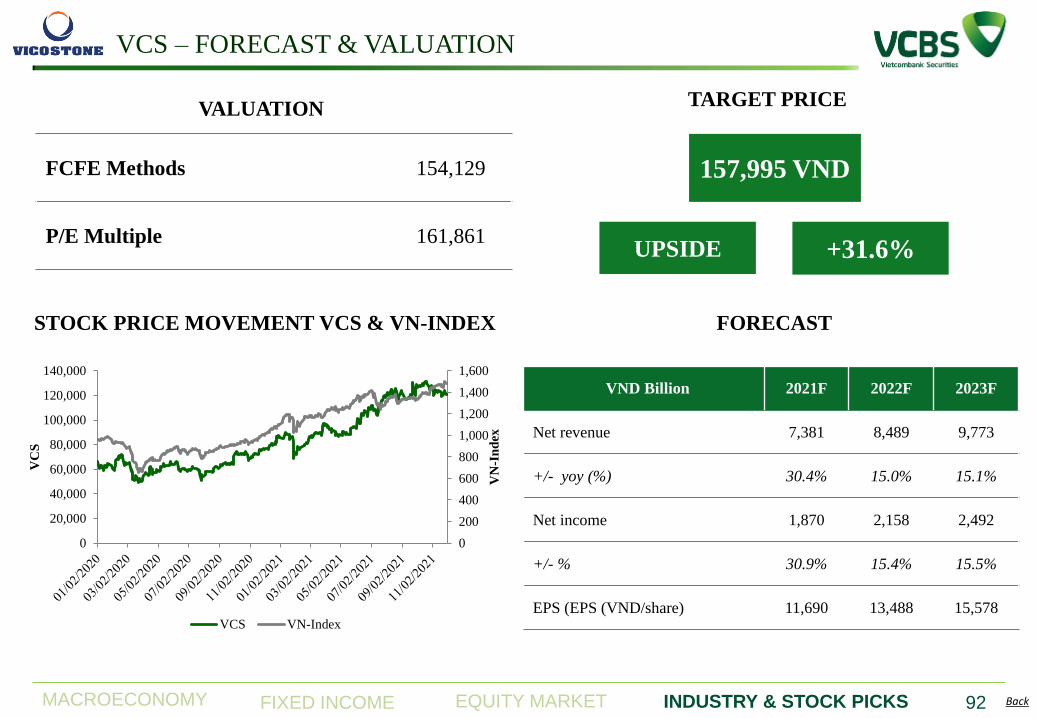
MACROECONOMY EQUITY MARKET INDUSTRY & STOCK PICKS FIXED INCOME Back
VCS – FORECAST & VALUATION
92
157,995 VND
TARGET PRICE
+31.6% UPSIDE
STOCK PRICE MOVEMENT VCS & VN-INDEX
VND Billion 2021F 2022F 2023F
Net revenue 7,381 8,489 9,773
+/- yoy (%) 30.4% 15.0% 15.1%
Net income 1,870 2,158 2,492
+/- % 30.9% 15.4% 15.5%
EPS (EPS (VND/share) 11,690 13,488 15,578
FCFE Methods 154,129
P/E Multiple 161,861
0
200
400
600
800
1,000
1,200
1,400
1,600
0
20,000
40,000
60,000
80,000
100,000
120,000
140,000
VN
-In
dex
VC
S
VCS VN-Index
VALUATION
FORECAST
POWER SECTOR
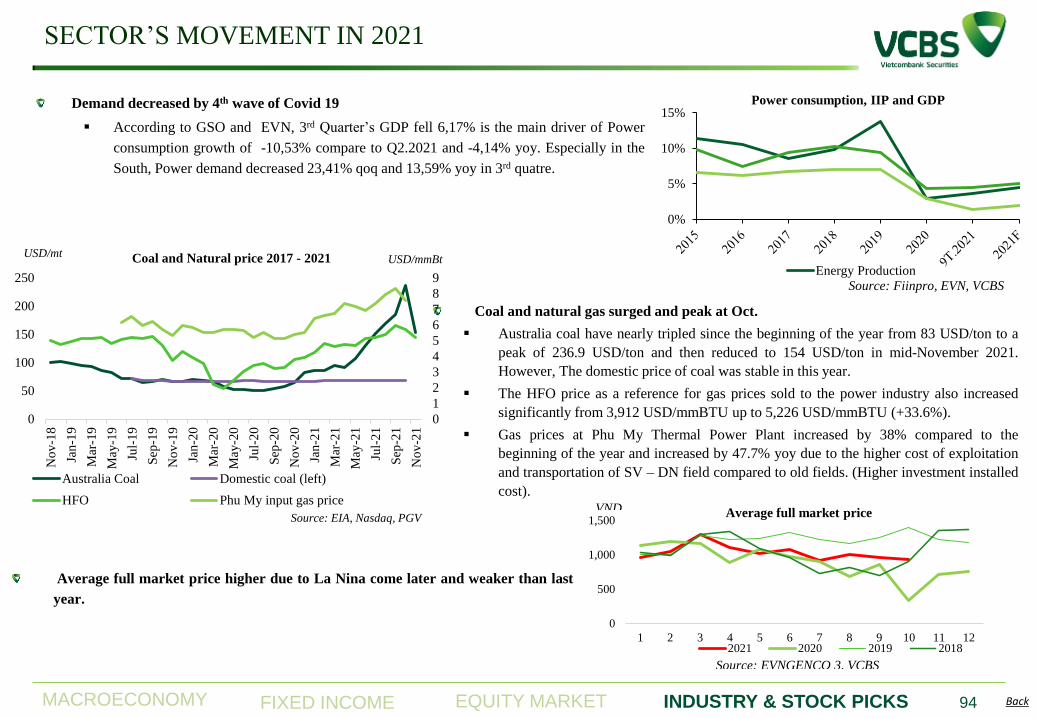
MACROECONOMY EQUITY MARKET INDUSTRY & STOCK PICKS FIXED INCOME Back
Demand decreased by 4th wave of Covid 19
According to GSO and EVN, 3rd Quarter’s GDP fell 6,17% is the main driver of Power
consumption growth of -10,53% compare to Q2.2021 and -4,14% yoy. Especially in the
South, Power demand decreased 23,41% qoq and 13,59% yoy in 3rd quatre.
SECTOR’S MOVEMENT IN 2021
94
Coal and natural gas surged and peak at Oct.
Australia coal have nearly tripled since the beginning of the year from 83 USD/ton to a
peak of 236.9 USD/ton and then reduced to 154 USD/ton in mid-November 2021.
However, The domestic price of coal was stable in this year.
The HFO price as a reference for gas prices sold to the power industry also increased
significantly from 3,912 USD/mmBTU up to 5,226 USD/mmBTU (+33.6%).
Gas prices at Phu My Thermal Power Plant increased by 38% compared to the
beginning of the year and increased by 47.7% yoy due to the higher cost of exploitation
and transportation of SV – DN field compared to old fields. (Higher investment installed
cost).
Average full market price higher due to La Nina come later and weaker than last
year.
0
500
1,000
1,500
1 2 3 4 5 6 7 8 9 10 11 12
Average full market price
2021 2020 2019 2018
Source: EVNGENCO 3, VCBS
VND
0%
5%
10%
15%Power consumption, IIP and GDP
Energy Production
Source: Fiinpro, EVN, VCBS
0
1
2
3
4
5
6
7
8
9
0
50
100
150
200
250
No
v-1
8
Jan
-19
Mar
-19
May
-19
Jul-
19
Sep
-19
No
v-1
9
Jan
-20
Mar
-20
May
-20
Jul-
20
Sep
-20
No
v-2
0
Jan
-21
Mar
-21
May
-21
Jul-
21
Sep
-21
No
v-2
1
Coal and Natural price 2017 - 2021
Australia Coal Domestic coal (left)
HFO Phu My input gas price
USD/mt USD/mmBt
Source: EIA, Nasdaq, PGV
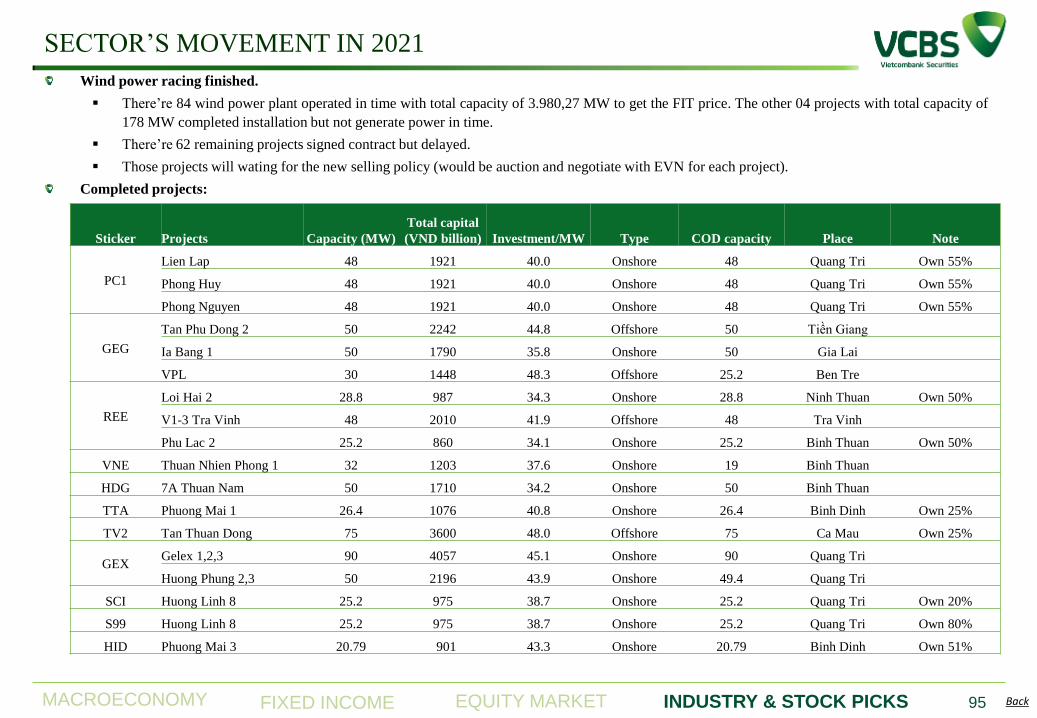
MACROECONOMY EQUITY MARKET INDUSTRY & STOCK PICKS FIXED INCOME Back
SECTOR’S MOVEMENT IN 2021
95
Wind power racing finished.
There’re 84 wind power plant operated in time with total capacity of 3.980,27 MW to get the FIT price. The other 04 projects with total capacity of
178 MW completed installation but not generate power in time.
There’re 62 remaining projects signed contract but delayed.
Those projects will wating for the new selling policy (would be auction and negotiate with EVN for each project).
Completed projects:
Sticker Projects Capacity (MW)
Total capital
(VND billion) Investment/MW Type COD capacity Place Note
PC1
Lien Lap 48 1921 40.0 Onshore 48 Quang Tri Own 55%
Phong Huy 48 1921 40.0 Onshore 48 Quang Tri Own 55%
Phong Nguyen 48 1921 40.0 Onshore 48 Quang Tri Own 55%
GEG
Tan Phu Dong 2 50 2242 44.8 Offshore 50 Tiền Giang
Ia Bang 1 50 1790 35.8 Onshore 50 Gia Lai
VPL 30 1448 48.3 Offshore 25.2 Ben Tre
REE
Loi Hai 2 28.8 987 34.3 Onshore 28.8 Ninh Thuan Own 50%
V1-3 Tra Vinh 48 2010 41.9 Offshore 48 Tra Vinh
Phu Lac 2 25.2 860 34.1 Onshore 25.2 Binh Thuan Own 50%
VNE Thuan Nhien Phong 1 32 1203 37.6 Onshore 19 Binh Thuan
HDG 7A Thuan Nam 50 1710 34.2 Onshore 50 Binh Thuan
TTA Phuong Mai 1 26.4 1076 40.8 Onshore 26.4 Binh Dinh Own 25%
TV2 Tan Thuan Dong 75 3600 48.0 Offshore 75 Ca Mau Own 25%
GEX Gelex 1,2,3 90 4057 45.1 Onshore 90 Quang Tri
Huong Phung 2,3 50 2196 43.9 Onshore 49.4 Quang Tri
SCI Huong Linh 8 25.2 975 38.7 Onshore 25.2 Quang Tri Own 20%
S99 Huong Linh 8 25.2 975 38.7 Onshore 25.2 Quang Tri Own 80%
HID Phuong Mai 3 20.79 901 43.3 Onshore 20.79 Binh Dinh Own 51%
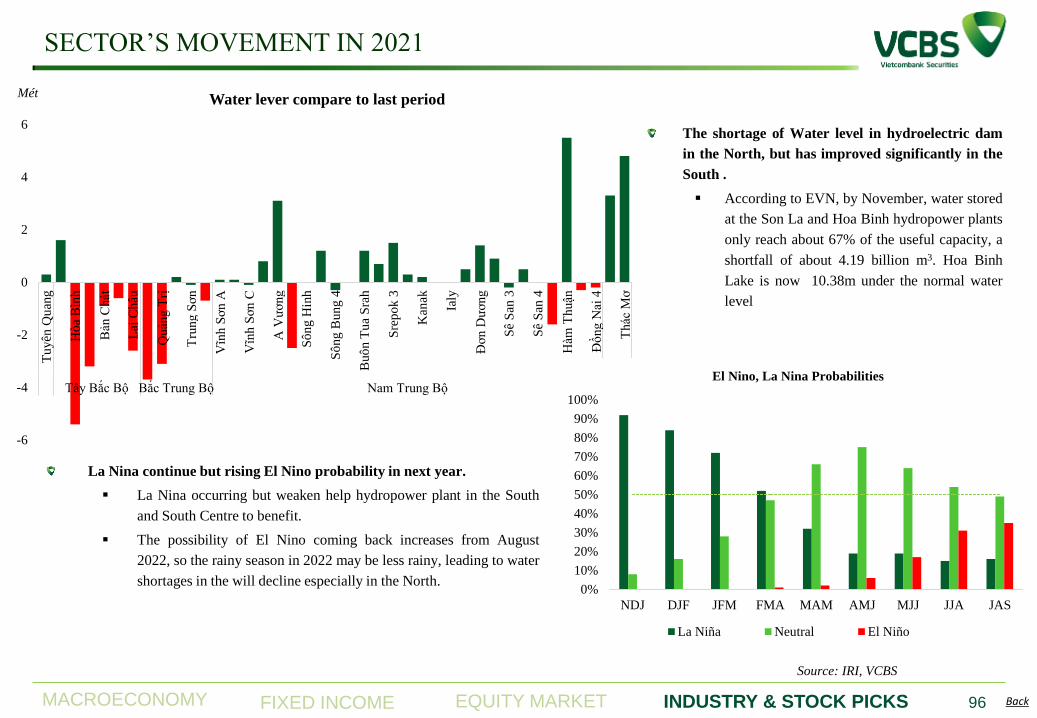
MACROECONOMY EQUITY MARKET INDUSTRY & STOCK PICKS FIXED INCOME Back
SECTOR’S MOVEMENT IN 2021
96
The shortage of Water level in hydroelectric dam
in the North, but has improved significantly in the
South .
According to EVN, by November, water stored
at the Son La and Hoa Binh hydropower plants
only reach about 67% of the useful capacity, a
shortfall of about 4.19 billion m3. Hoa Binh
Lake is now 10.38m under the normal water
level
-6
-4
-2
0
2
4
6
Tu
yên
Qu
ang
Hò
a B
ình
Bản
Chát
Lai
Châu
Quản
g T
rị
Tru
ng S
ơn
Vĩn
h S
ơn A
Vĩn
h S
ơn C
A V
ƣơ
ng
Sô
ng H
inh
Sô
ng B
un
g 4
Buô
n T
ua
Sra
h
Sre
pok
3
Kan
ak
Ialy
Đơ
n D
ƣơ
ng
Sê
San
3
Sê
San
4
Hàm
Thuận
Đồ
ng N
ai 4
Thác
Mơ
Tây Bắc Bộ Bắc Trung Bộ Nam Trung Bộ Đông Nam Bộ
Water lever compare to last period Mét
La Nina continue but rising El Nino probability in next year.
La Nina occurring but weaken help hydropower plant in the South
and South Centre to benefit.
The possibility of El Nino coming back increases from August
2022, so the rainy season in 2022 may be less rainy, leading to water
shortages in the will decline especially in the North.
Source: IRI, VCBS
0%
10%
20%
30%
40%
50%
60%
70%
80%
90%
100%
NDJ DJF JFM FMA MAM AMJ MJJ JJA JAS
El Nino, La Nina Probabilities
La Niña Neutral El Niño
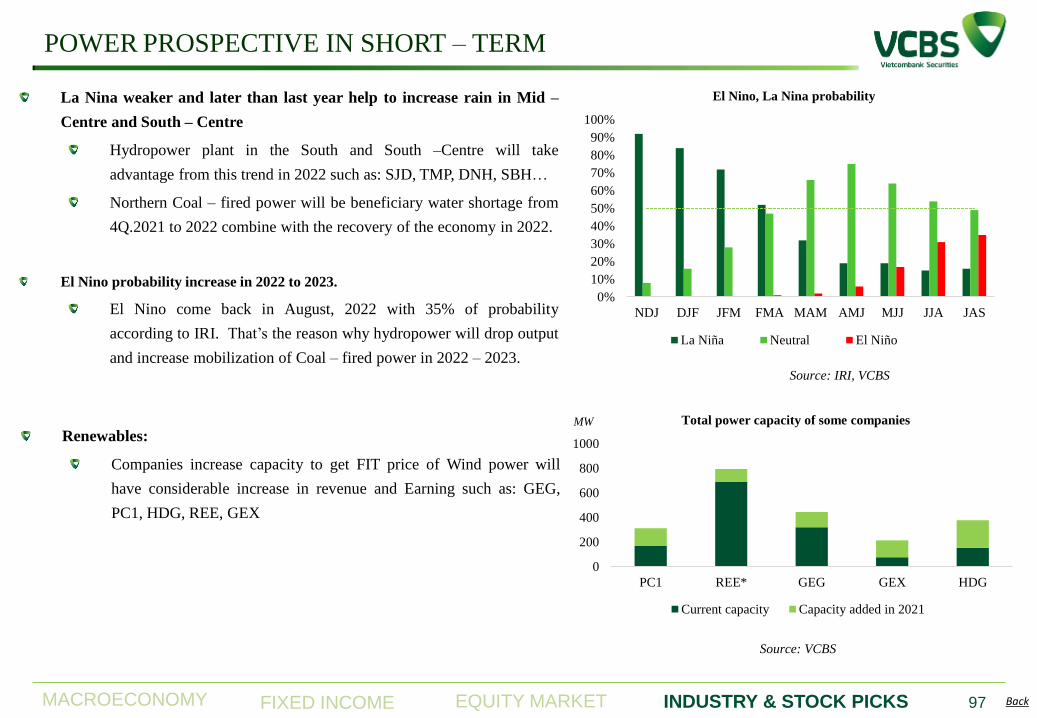
MACROECONOMY EQUITY MARKET INDUSTRY & STOCK PICKS FIXED INCOME Back
La Nina weaker and later than last year help to increase rain in Mid –
Centre and South – Centre
Hydropower plant in the South and South –Centre will take
advantage from this trend in 2022 such as: SJD, TMP, DNH, SBH…
Northern Coal – fired power will be beneficiary water shortage from
4Q.2021 to 2022 combine with the recovery of the economy in 2022.
El Nino probability increase in 2022 to 2023.
El Nino come back in August, 2022 with 35% of probability
according to IRI. That’s the reason why hydropower will drop output
and increase mobilization of Coal – fired power in 2022 – 2023.
POWER PROSPECTIVE IN SHORT – TERM
97
Renewables:
Companies increase capacity to get FIT price of Wind power will
have considerable increase in revenue and Earning such as: GEG,
PC1, HDG, REE, GEX
Source: IRI, VCBS
0%
10%
20%
30%
40%
50%
60%
70%
80%
90%
100%
NDJ DJF JFM FMA MAM AMJ MJJ JJA JAS
El Nino, La Nina probability
La Niña Neutral El Niño
Source: VCBS
0
200
400
600
800
1000
PC1 REE* GEG GEX HDG
Total power capacity of some companies
Current capacity Capacity added in 2021
MW
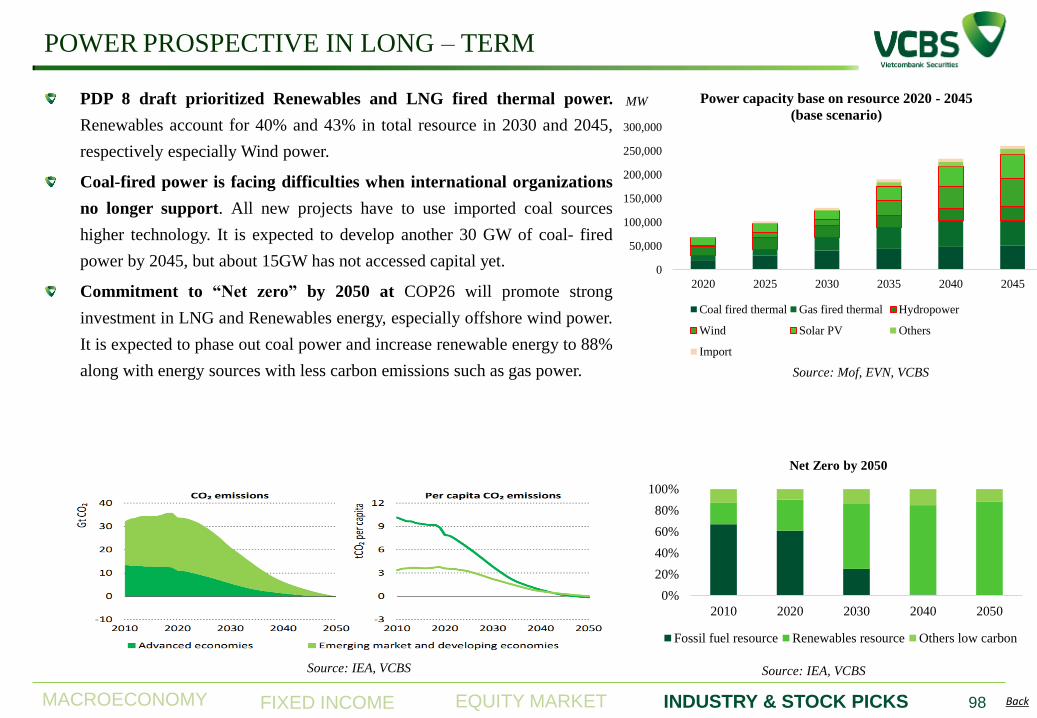
MACROECONOMY EQUITY MARKET INDUSTRY & STOCK PICKS FIXED INCOME Back
POWER PROSPECTIVE IN LONG – TERM
98
PDP 8 draft prioritized Renewables and LNG fired thermal power.
Renewables account for 40% and 43% in total resource in 2030 and 2045,
respectively especially Wind power.
Coal-fired power is facing difficulties when international organizations
no longer support. All new projects have to use imported coal sources
higher technology. It is expected to develop another 30 GW of coal- fired
power by 2045, but about 15GW has not accessed capital yet.
Commitment to “Net zero” by 2050 at COP26 will promote strong
investment in LNG and Renewables energy, especially offshore wind power.
It is expected to phase out coal power and increase renewable energy to 88%
along with energy sources with less carbon emissions such as gas power.
Source: IEA, VCBS Source: IEA, VCBS
Source: Mof, EVN, VCBS
0
50,000
100,000
150,000
200,000
250,000
300,000
2020 2025 2030 2035 2040 2045
Power capacity base on resource 2020 - 2045
(base scenario)
Coal fired thermal Gas fired thermal Hydropower
Wind Solar PV Others
Import
MW
0%
20%
40%
60%
80%
100%
2010 2020 2030 2040 2050
Net Zero by 2050
Fossil fuel resource Renewables resource Others low carbon
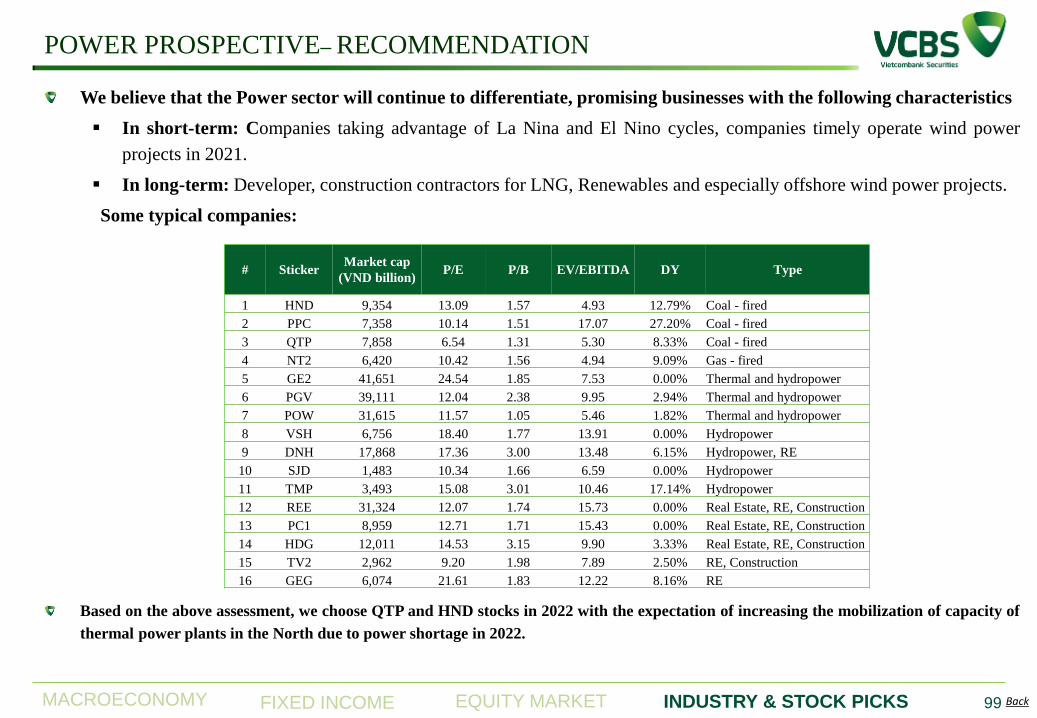
MACROECONOMY EQUITY MARKET INDUSTRY & STOCK PICKS FIXED INCOME Back
POWER PROSPECTIVE– RECOMMENDATION
99
We believe that the Power sector will continue to differentiate, promising businesses with the following characteristics
In short-term: Companies taking advantage of La Nina and El Nino cycles, companies timely operate wind power
projects in 2021.
In long-term: Developer, construction contractors for LNG, Renewables and especially offshore wind power projects.
Some typical companies:
Based on the above assessment, we choose QTP and HND stocks in 2022 with the expectation of increasing the mobilization of capacity of
thermal power plants in the North due to power shortage in 2022.
# Sticker Market cap
(VND billion) P/E P/B EV/EBITDA DY Type
1 HND 9,354 13.09 1.57 4.93 12.79% Coal - fired
2 PPC 7,358 10.14 1.51 17.07 27.20% Coal - fired
3 QTP 7,858 6.54 1.31 5.30 8.33% Coal - fired
4 NT2 6,420 10.42 1.56 4.94 9.09% Gas - fired
5 GE2 41,651 24.54 1.85 7.53 0.00% Thermal and hydropower
6 PGV 39,111 12.04 2.38 9.95 2.94% Thermal and hydropower
7 POW 31,615 11.57 1.05 5.46 1.82% Thermal and hydropower
8 VSH 6,756 18.40 1.77 13.91 0.00% Hydropower
9 DNH 17,868 17.36 3.00 13.48 6.15% Hydropower, RE
10 SJD 1,483 10.34 1.66 6.59 0.00% Hydropower
11 TMP 3,493 15.08 3.01 10.46 17.14% Hydropower
12 REE 31,324 12.07 1.74 15.73 0.00% Real Estate, RE, Construction
13 PC1 8,959 12.71 1.71 15.43 0.00% Real Estate, RE, Construction
14 HDG 12,011 14.53 3.15 9.90 3.33% Real Estate, RE, Construction
15 TV2 2,962 9.20 1.98 7.89 2.50% RE, Construction
16 GEG 6,074 21.61 1.83 12.22 8.16% RE
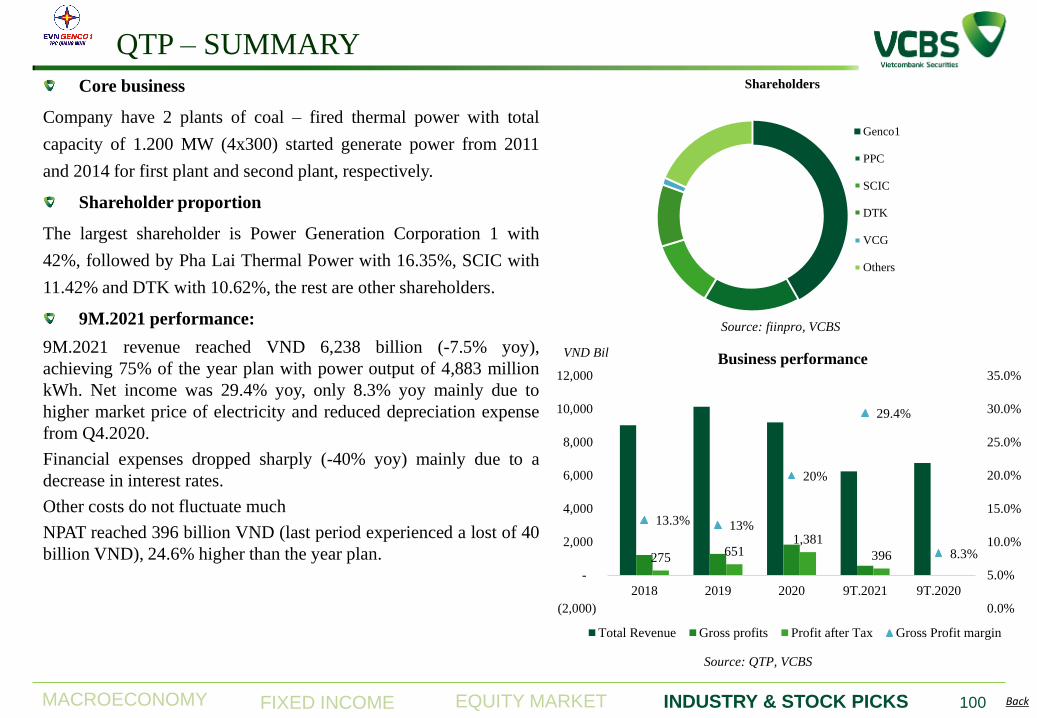
MACROECONOMY EQUITY MARKET INDUSTRY & STOCK PICKS FIXED INCOME Back
QTP – SUMMARY
100
Core business
Company have 2 plants of coal – fired thermal power with total
capacity of 1.200 MW (4x300) started generate power from 2011
and 2014 for first plant and second plant, respectively.
Shareholder proportion
The largest shareholder is Power Generation Corporation 1 with
42%, followed by Pha Lai Thermal Power with 16.35%, SCIC with
11.42% and DTK with 10.62%, the rest are other shareholders.
9M.2021 performance:
9M.2021 revenue reached VND 6,238 billion (-7.5% yoy),
achieving 75% of the year plan with power output of 4,883 million
kWh. Net income was 29.4% yoy, only 8.3% yoy mainly due to
higher market price of electricity and reduced depreciation expense
from Q4.2020.
Financial expenses dropped sharply (-40% yoy) mainly due to a
decrease in interest rates.
Other costs do not fluctuate much
NPAT reached 396 billion VND (last period experienced a lost of 40
billion VND), 24.6% higher than the year plan.
Shareholders
Genco1
PPC
SCIC
DTK
VCG
Others
Source: fiinpro, VCBS
275 651
1,381
396
13.3% 13%
20%
29.4%
8.3%
0.0%
5.0%
10.0%
15.0%
20.0%
25.0%
30.0%
35.0%
(2,000)
-
2,000
4,000
6,000
8,000
10,000
12,000
2018 2019 2020 9T.2021 9T.2020
Business performance
Total Revenue Gross profits Profit after Tax Gross Profit margin
VND Bil
Source: QTP, VCBS
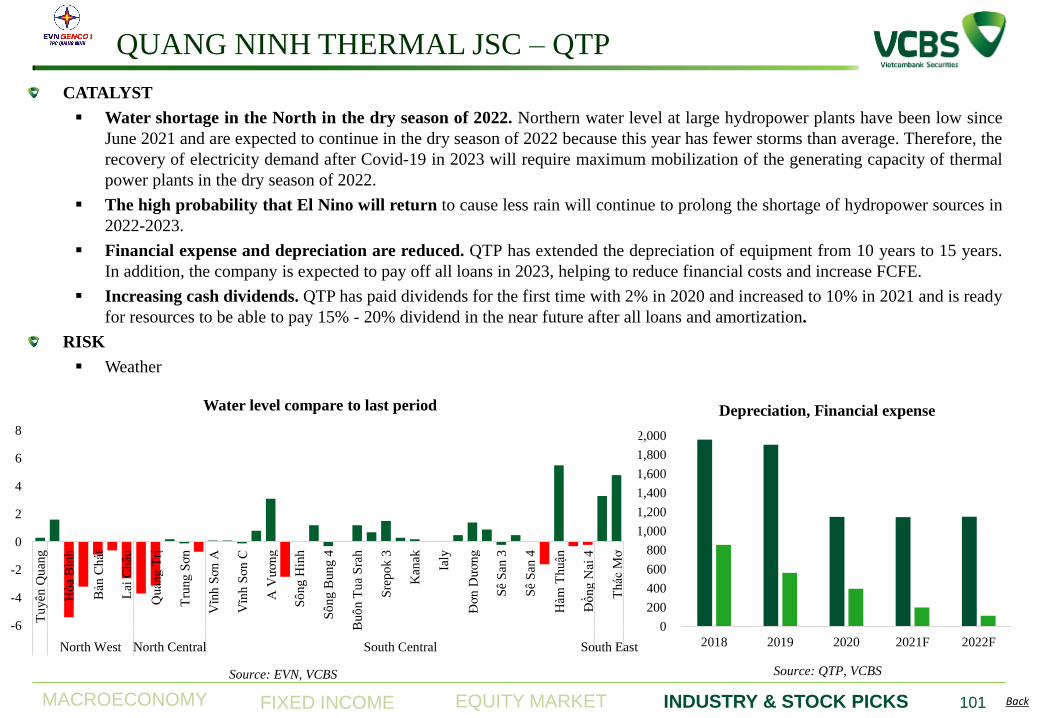
MACROECONOMY EQUITY MARKET INDUSTRY & STOCK PICKS FIXED INCOME Back
QUANG NINH THERMAL JSC – QTP
101
CATALYST
Water shortage in the North in the dry season of 2022. Northern water level at large hydropower plants have been low since
June 2021 and are expected to continue in the dry season of 2022 because this year has fewer storms than average. Therefore, the
recovery of electricity demand after Covid-19 in 2023 will require maximum mobilization of the generating capacity of thermal
power plants in the dry season of 2022.
The high probability that El Nino will return to cause less rain will continue to prolong the shortage of hydropower sources in
2022-2023.
Financial expense and depreciation are reduced. QTP has extended the depreciation of equipment from 10 years to 15 years.
In addition, the company is expected to pay off all loans in 2023, helping to reduce financial costs and increase FCFE.
Increasing cash dividends. QTP has paid dividends for the first time with 2% in 2020 and increased to 10% in 2021 and is ready
for resources to be able to pay 15% - 20% dividend in the near future after all loans and amortization.
RISK
Weather
0
200
400
600
800
1,000
1,200
1,400
1,600
1,800
2,000
2018 2019 2020 2021F 2022F
Depreciation, Financial expense
Source: QTP, VCBS Source: EVN, VCBS
-6
-4
-2
0
2
4
6
8
Tu
yên
Qu
ang
Hò
a B
ình
Bản
Chát
Lai
Châu
Quản
g T
rị
Tru
ng S
ơn
Vĩn
h S
ơn A
Vĩn
h S
ơn C
A V
ƣơ
ng
Sô
ng H
inh
Sô
ng B
un
g 4
Buô
n T
ua
Sra
h
Sre
pok
3
Kan
ak
Ialy
Đơ
n D
ƣơ
ng
Sê
San
3
Sê
San
4
Hàm
Thuận
Đồ
ng N
ai 4
Thác
Mơ
North West North Central South Central South East
Water level compare to last period
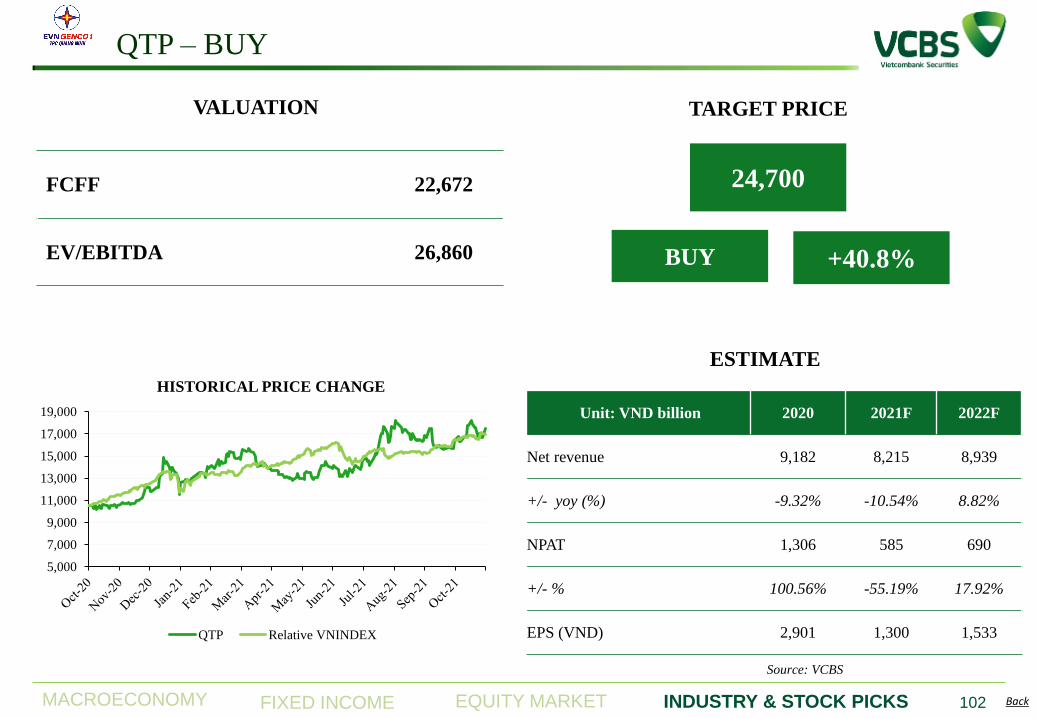
MACROECONOMY EQUITY MARKET INDUSTRY & STOCK PICKS FIXED INCOME Back
QTP – BUY
102
Unit: VND billion 2020 2021F 2022F
Net revenue 9,182 8,215 8,939
+/- yoy (%) -9.32% -10.54% 8.82%
NPAT 1,306 585 690
+/- % 100.56% -55.19% 17.92%
EPS (VND) 2,901 1,300 1,533
FCFF 22,672
EV/EBITDA 26,860
ESTIMATE
VALUATION
24,700
TARGET PRICE
+40.8% BUY
5,000
7,000
9,000
11,000
13,000
15,000
17,000
19,000
HISTORICAL PRICE CHANGE
QTP Relative VNINDEX
Source: VCBS
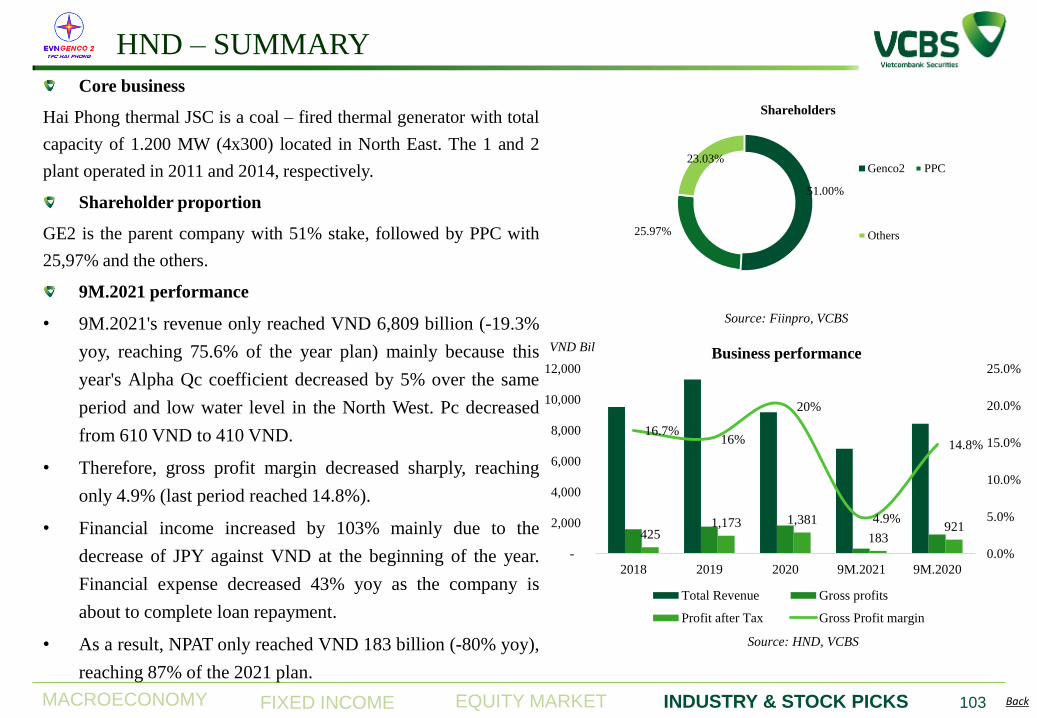
MACROECONOMY EQUITY MARKET INDUSTRY & STOCK PICKS FIXED INCOME Back
HND – SUMMARY
103
Core business
Hai Phong thermal JSC is a coal – fired thermal generator with total
capacity of 1.200 MW (4x300) located in North East. The 1 and 2
plant operated in 2011 and 2014, respectively.
Shareholder proportion
GE2 is the parent company with 51% stake, followed by PPC with
25,97% and the others.
9M.2021 performance
• 9M.2021's revenue only reached VND 6,809 billion (-19.3%
yoy, reaching 75.6% of the year plan) mainly because this
year's Alpha Qc coefficient decreased by 5% over the same
period and low water level in the North West. Pc decreased
from 610 VND to 410 VND.
• Therefore, gross profit margin decreased sharply, reaching
only 4.9% (last period reached 14.8%).
• Financial income increased by 103% mainly due to the
decrease of JPY against VND at the beginning of the year.
Financial expense decreased 43% yoy as the company is
about to complete loan repayment.
• As a result, NPAT only reached VND 183 billion (-80% yoy),
reaching 87% of the 2021 plan.
Source: Fiinpro, VCBS
Source: HND, VCBS
51.00%
25.97%
23.03%
Shareholders
Genco2 PPC
Others
425 1,173 1,381
183 921
16.7% 16%
20%
4.9%
14.8%
0.0%
5.0%
10.0%
15.0%
20.0%
25.0%
-
2,000
4,000
6,000
8,000
10,000
12,000
2018 2019 2020 9M.2021 9M.2020
Business performance
Total Revenue Gross profits
Profit after Tax Gross Profit margin
VND Bil
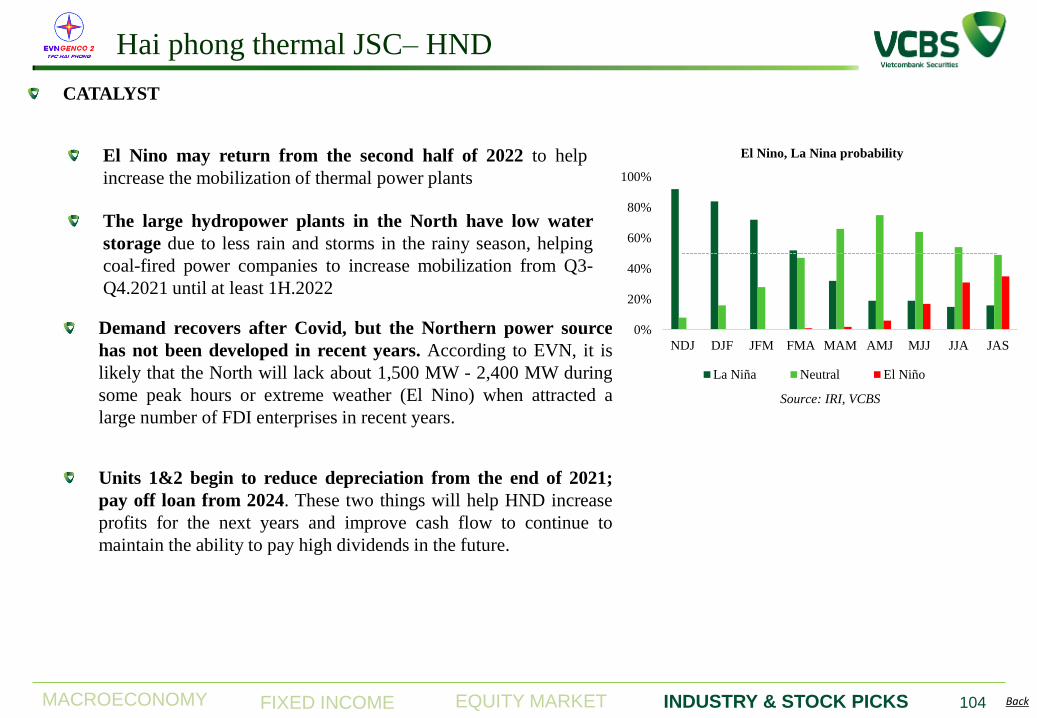
MACROECONOMY EQUITY MARKET INDUSTRY & STOCK PICKS FIXED INCOME Back
Hai phong thermal JSC– HND
104
CATALYST
El Nino may return from the second half of 2022 to help
increase the mobilization of thermal power plants
The large hydropower plants in the North have low water
storage due to less rain and storms in the rainy season, helping
coal-fired power companies to increase mobilization from Q3-
Q4.2021 until at least 1H.2022
Demand recovers after Covid, but the Northern power source
has not been developed in recent years. According to EVN, it is
likely that the North will lack about 1,500 MW - 2,400 MW during
some peak hours or extreme weather (El Nino) when attracted a
large number of FDI enterprises in recent years.
Units 1&2 begin to reduce depreciation from the end of 2021;
pay off loan from 2024. These two things will help HND increase
profits for the next years and improve cash flow to continue to
maintain the ability to pay high dividends in the future.
0%
20%
40%
60%
80%
100%
NDJ DJF JFM FMA MAM AMJ MJJ JJA JAS
El Nino, La Nina probability
La Niña Neutral El Niño
Source: IRI, VCBS
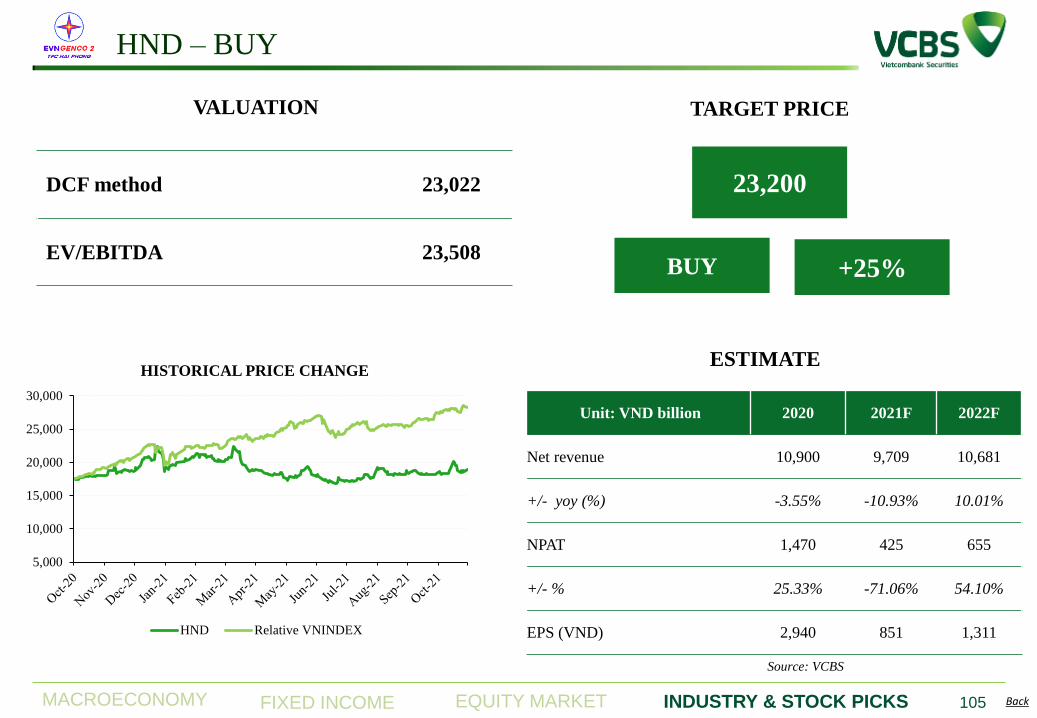
MACROECONOMY EQUITY MARKET INDUSTRY & STOCK PICKS FIXED INCOME Back
HND – BUY
105
Unit: VND billion 2020 2021F 2022F
Net revenue 10,900 9,709 10,681
+/- yoy (%) -3.55% -10.93% 10.01%
NPAT 1,470 425 655
+/- % 25.33% -71.06% 54.10%
EPS (VND) 2,940 851 1,311
DCF method 23,022
EV/EBITDA 23,508
ESTIMATE
VALUATION
23,200
TARGET PRICE
+25% BUY
5,000
10,000
15,000
20,000
25,000
30,000
HISTORICAL PRICE CHANGE
HND Relative VNINDEX
Source: VCBS
SEAFOOD
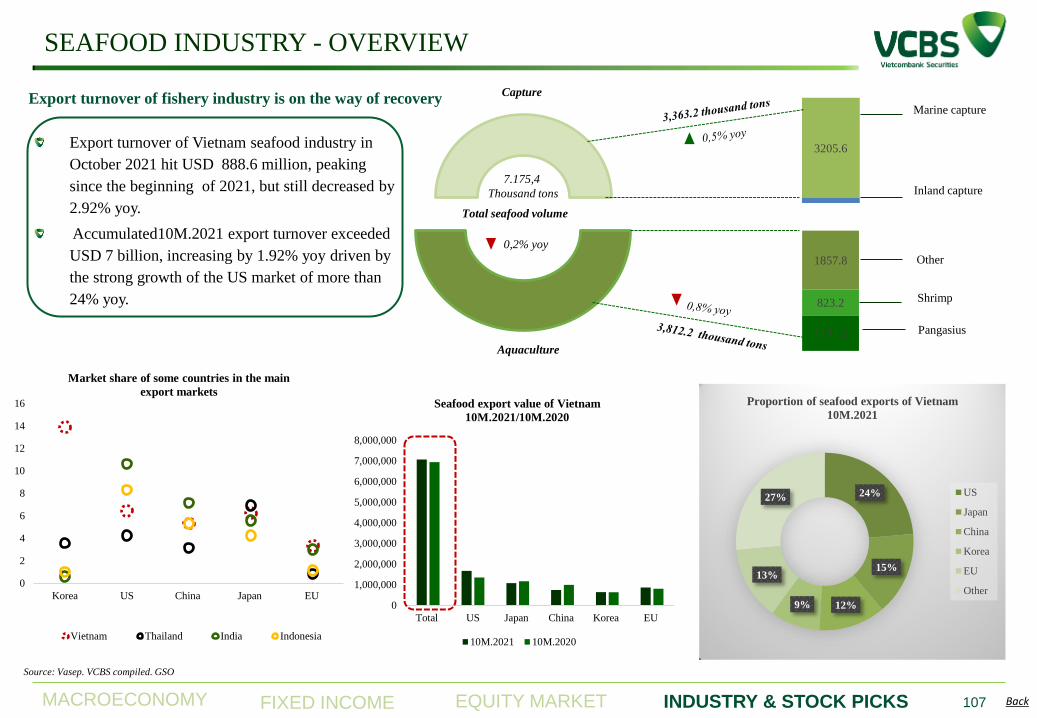
MACROECONOMY EQUITY MARKET INDUSTRY & STOCK PICKS FIXED INCOME Back
SEAFOOD INDUSTRY - OVERVIEW
107
Source: Vasep. VCBS compiled. GSO
3205.6
1131.2
823.2
1857.8
Total seafood volume
Aquaculture
Capture
7.175,4
Thousand tons
0,2% yoy
Other
Marine capture
Inland capture
Shrimp
Pangasius
Export turnover of Vietnam seafood industry in
October 2021 hit USD 888.6 million, peaking
since the beginning of 2021, but still decreased by
2.92% yoy.
Accumulated10M.2021 export turnover exceeded
USD 7 billion, increasing by 1.92% yoy driven by
the strong growth of the US market of more than
24% yoy.
Export turnover of fishery industry is on the way of recovery
24%
15%
12% 9%
13%
27%
Proportion of seafood exports of Vietnam
10M.2021
US
Japan
China
Korea
EU
Other
0
1,000,000
2,000,000
3,000,000
4,000,000
5,000,000
6,000,000
7,000,000
8,000,000
Total US Japan China Korea EU
Seafood export value of Vietnam
10M.2021/10M.2020
10M.2021 10M.2020
0
2
4
6
8
10
12
14
16
Korea US China Japan EU
Market share of some countries in the main
export markets
Vietnam Thailand India Indonesia
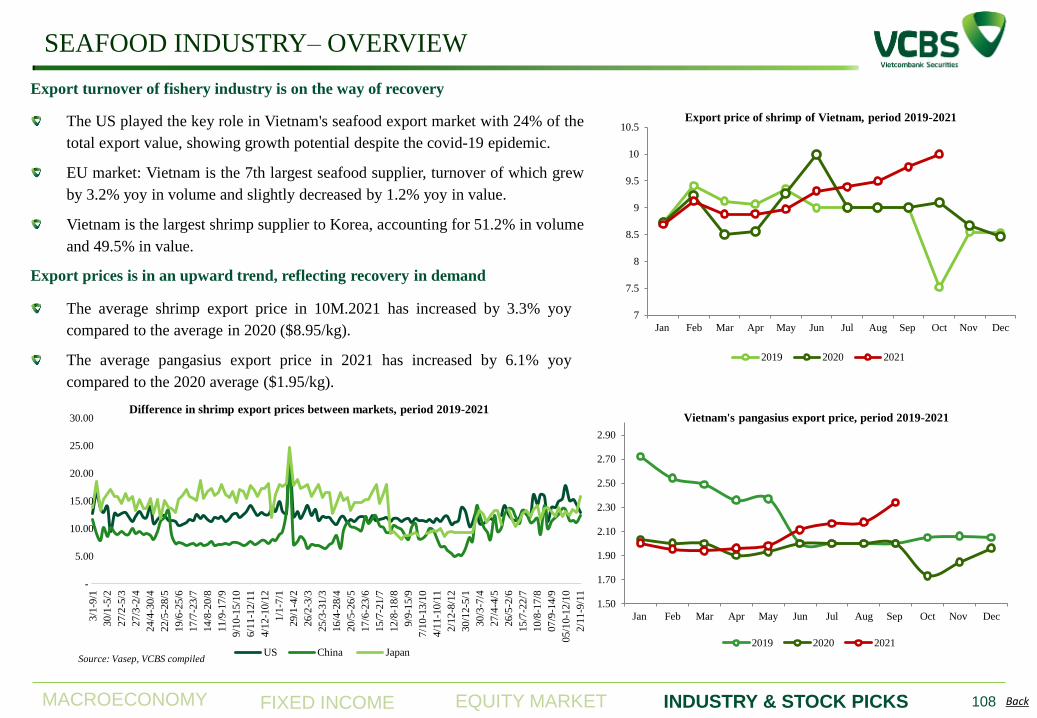
MACROECONOMY EQUITY MARKET INDUSTRY & STOCK PICKS FIXED INCOME Back
SEAFOOD INDUSTRY– OVERVIEW
108
The US played the key role in Vietnam's seafood export market with 24% of the
total export value, showing growth potential despite the covid-19 epidemic.
EU market: Vietnam is the 7th largest seafood supplier, turnover of which grew
by 3.2% yoy in volume and slightly decreased by 1.2% yoy in value.
Vietnam is the largest shrimp supplier to Korea, accounting for 51.2% in volume
and 49.5% in value.
Export turnover of fishery industry is on the way of recovery
The average shrimp export price in 10M.2021 has increased by 3.3% yoy
compared to the average in 2020 ($8.95/kg).
The average pangasius export price in 2021 has increased by 6.1% yoy
compared to the 2020 average ($1.95/kg).
Export prices is in an upward trend, reflecting recovery in demand
7
7.5
8
8.5
9
9.5
10
10.5
Jan Feb Mar Apr May Jun Jul Aug Sep Oct Nov Dec
Export price of shrimp of Vietnam, period 2019-2021
2019 2020 2021
1.50
1.70
1.90
2.10
2.30
2.50
2.70
2.90
Jan Feb Mar Apr May Jun Jul Aug Sep Oct Nov Dec
Vietnam's pangasius export price, period 2019-2021
2019 2020 2021
-
5.00
10.00
15.00
20.00
25.00
30.00
3/1
-9/1
30
/1-5
/2
27
/2-5
/3
27
/3-2
/4
24
/4-3
0/4
22
/5-2
8/5
19
/6-2
5/6
17
/7-2
3/7
14
/8-2
0/8
11
/9-1
7/9
9/1
0-1
5/1
0
6/1
1-1
2/1
1
4/1
2-1
0/1
2
1/1
-7/1
29
/1-4
/2
26
/2-3
/3
25
/3-3
1/3
16
/4-2
8/4
20
/5-2
6/5
17
/6-2
3/6
15
/7-2
1/7
12
/8-1
8/8
9/9
-15/9
7/1
0-1
3/1
0
4/1
1-1
0/1
1
2/1
2-8
/12
30
/12-5
/1
30
/3-7
/4
27
/4-4
/5
26
/5-2
/6
15
/7-2
2/7
10
/8-1
7/8
07
/9-1
4/9
05
/10-1
2/1
0
2/1
1-9
/11
Difference in shrimp export prices between markets, period 2019-2021
US China JapanSource: Vasep, VCBS compiled
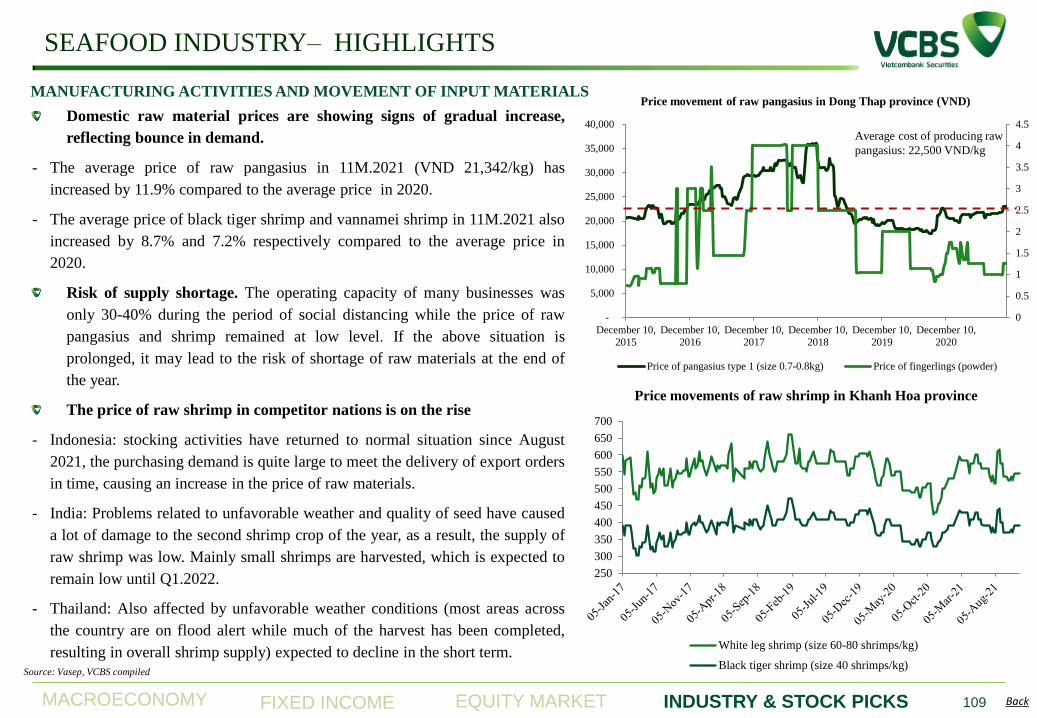
MACROECONOMY EQUITY MARKET INDUSTRY & STOCK PICKS FIXED INCOME Back
SEAFOOD INDUSTRY– HIGHLIGHTS
109
MANUFACTURING ACTIVITIES AND MOVEMENT OF INPUT MATERIALS
Domestic raw material prices are showing signs of gradual increase,
reflecting bounce in demand.
- The average price of raw pangasius in 11M.2021 (VND 21,342/kg) has
increased by 11.9% compared to the average price in 2020.
- The average price of black tiger shrimp and vannamei shrimp in 11M.2021 also
increased by 8.7% and 7.2% respectively compared to the average price in
2020.
Risk of supply shortage. The operating capacity of many businesses was
only 30-40% during the period of social distancing while the price of raw
pangasius and shrimp remained at low level. If the above situation is
prolonged, it may lead to the risk of shortage of raw materials at the end of
the year.
The price of raw shrimp in competitor nations is on the rise
- Indonesia: stocking activities have returned to normal situation since August
2021, the purchasing demand is quite large to meet the delivery of export orders
in time, causing an increase in the price of raw materials.
- India: Problems related to unfavorable weather and quality of seed have caused
a lot of damage to the second shrimp crop of the year, as a result, the supply of
raw shrimp was low. Mainly small shrimps are harvested, which is expected to
remain low until Q1.2022.
- Thailand: Also affected by unfavorable weather conditions (most areas across
the country are on flood alert while much of the harvest has been completed,
resulting in overall shrimp supply) expected to decline in the short term.
Source: Vasep, VCBS compiled
Average cost of producing raw
pangasius: 22,500 VND/kg
0
0.5
1
1.5
2
2.5
3
3.5
4
4.5
-
5,000
10,000
15,000
20,000
25,000
30,000
35,000
40,000
December 10,
2015
December 10,
2016
December 10,
2017
December 10,
2018
December 10,
2019
December 10,
2020
Price movement of raw pangasius in Dong Thap province (VND)
Price of pangasius type 1 (size 0.7-0.8kg) Price of fingerlings (powder)
250
300
350
400
450
500
550
600
650
700
Price movements of raw shrimp in Khanh Hoa province
White leg shrimp (size 60-80 shrimps/kg)
Black tiger shrimp (size 40 shrimps/kg)
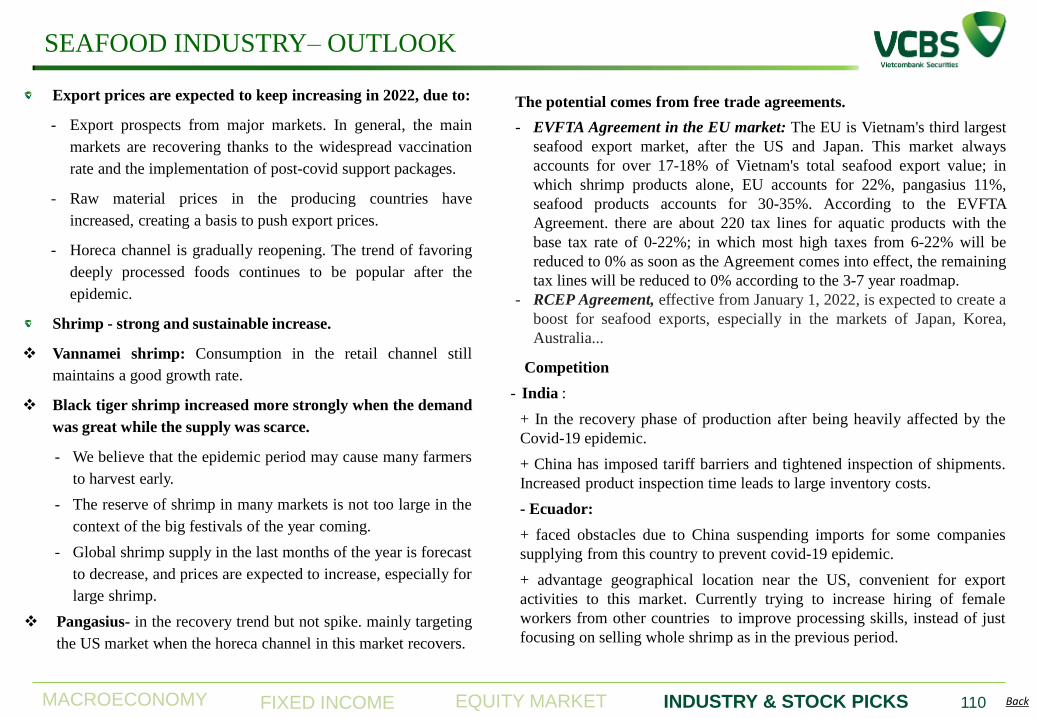
MACROECONOMY EQUITY MARKET INDUSTRY & STOCK PICKS FIXED INCOME Back
SEAFOOD INDUSTRY– OUTLOOK
110
Export prices are expected to keep increasing in 2022, due to:
- Export prospects from major markets. In general, the main
markets are recovering thanks to the widespread vaccination
rate and the implementation of post-covid support packages.
- Raw material prices in the producing countries have
increased, creating a basis to push export prices.
- Horeca channel is gradually reopening. The trend of favoring
deeply processed foods continues to be popular after the
epidemic.
Shrimp - strong and sustainable increase.
Vannamei shrimp: Consumption in the retail channel still
maintains a good growth rate.
Black tiger shrimp increased more strongly when the demand
was great while the supply was scarce..
- We believe that the epidemic period may cause many farmers
to harvest early.
- The reserve of shrimp in many markets is not too large in the
context of the big festivals of the year coming.
- Global shrimp supply in the last months of the year is forecast
to decrease, and prices are expected to increase, especially for
large shrimp.
Pangasius- in the recovery trend but not spike. mainly targeting
the US market when the horeca channel in this market recovers.
The potential comes from free trade agreements.
- EVFTA Agreement in the EU market: The EU is Vietnam's third largest
seafood export market, after the US and Japan. This market always
accounts for over 17-18% of Vietnam's total seafood export value; in
which shrimp products alone, EU accounts for 22%, pangasius 11%,
seafood products accounts for 30-35%. According to the EVFTA
Agreement. there are about 220 tax lines for aquatic products with the
base tax rate of 0-22%; in which most high taxes from 6-22% will be
reduced to 0% as soon as the Agreement comes into effect, the remaining
tax lines will be reduced to 0% according to the 3-7 year roadmap.
- RCEP Agreement, effective from January 1, 2022, is expected to create a
boost for seafood exports, especially in the markets of Japan, Korea,
Australia...
Competition
- India :
+ In the recovery phase of production after being heavily affected by the
Covid-19 epidemic.
+ China has imposed tariff barriers and tightened inspection of shipments.
Increased product inspection time leads to large inventory costs.
- Ecuador:
+ faced obstacles due to China suspending imports for some companies
supplying from this country to prevent covid-19 epidemic.
+ advantage geographical location near the US, convenient for export
activities to this market. Currently trying to increase hiring of female
workers from other countries to improve processing skills, instead of just
focusing on selling whole shrimp as in the previous period.
MACROECONOMY EQUITY MARKET INDUSTRY & STOCK PICKS FIXED INCOME Back 111
• The demand for shrimp from Vietnam has been quite stable since the
outbreak of the Covid-19 epidemic in the world. In the fourth epidemic
wave in Vietnam, exports to the US only decreased in September and
recovered quickly in September. 2021
• Demand for large shrimp is recovering. In October. 2021, Vietnam's
shrimp exports to the US reached 117.7 million USD, increased by
19% yoy.
• Accumulated in the first 10 months of this year, Vietnam's shrimp
exports to this market reached $892.7 million, increased by 22% yoy.
EU Market
• In October 2021, Vietnam's shrimp exports to the US
reached nearly $74 million, up 13% compared to October
2020. Accumulated 10M.2021, Vietnam's shrimp exports to
this market reached nearly 482 million USD, increased by
10.4% yoy.
• The three main import markets for Vietnamese shrimp in
the EU are Germany. Netherlands and Belgium. As of
October 2021, shrimp exports to Germany and the
Netherlands increased by 17% and 0.6%, respectively.
Exports to Belgium increased by 7%. We think that after
the EVFTA agreement, Vietnam will gradually gain market
share from the EU market.
• The last months of this year, many supply partners for the
EU are struggling with the covid-19 epidemic, leading to
limited supply, along with sea freight rates, although they
have cooled down, they are still high compared to the
previous year while consumer demand in the last months of
the year usually remains high.
China Market
• In October.2021, Vietnam's shrimp exports to China reached USD 43.5
million, decreased by 36.5% yoy.
• Accumulated 10M.2021, Vietnam's shrimp exports to this market
reached USD 341.5 million, decreased by 25% yoy. Vietnam's shrimp
exports to China have decreased continuously since the beginning of
the year until now. The reason is due to the strict control policy of
corona virus on imported seafood, causing congestion at ports in
China.
• China's seafood production and export industry has been negatively
affected by the Covid epidemic, so it seems that their government also
wants to protect domestic seafood product, should find ways to limit
imports.
US Market
SEAFOOD INDUSTRY– OUTLOOK
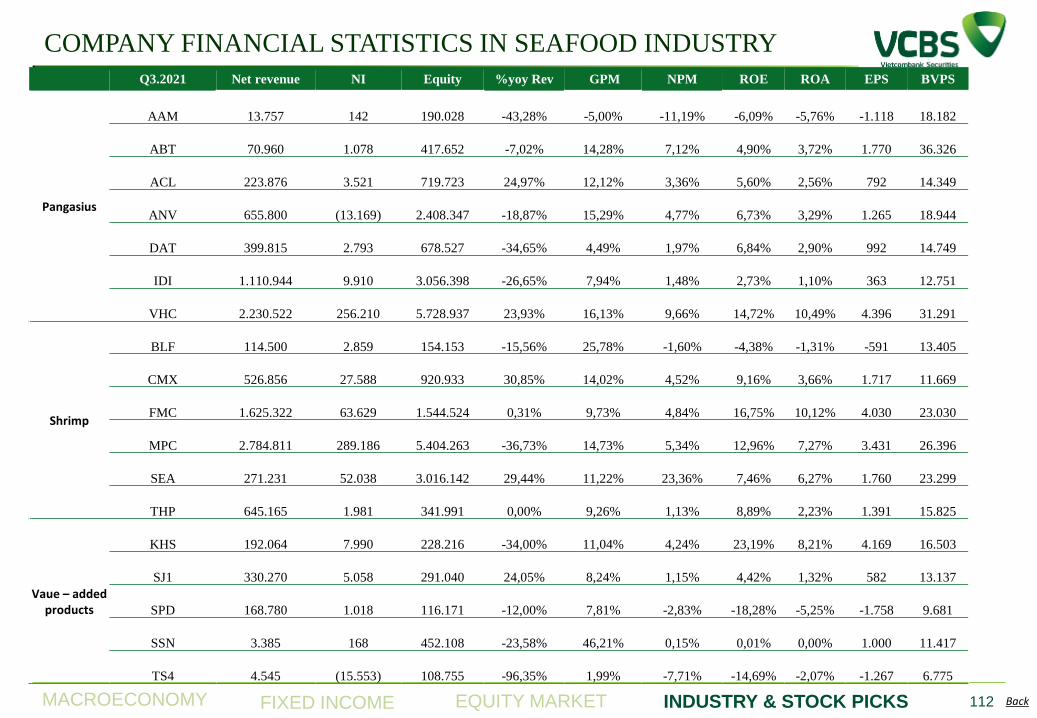
MACROECONOMY EQUITY MARKET INDUSTRY & STOCK PICKS FIXED INCOME Back 112
Q3.2021 Net revenue NI Equity %yoy Rev GPM NPM ROE ROA EPS BVPS
Pangasius
AAM
13.757
142
190.028 -43,28% -5,00% -11,19% -6,09% -5,76% -1.118 18.182
ABT
70.960
1.078
417.652 -7,02% 14,28% 7,12% 4,90% 3,72% 1.770 36.326
ACL
223.876
3.521
719.723 24,97% 12,12% 3,36% 5,60% 2,56% 792 14.349
ANV
655.800
(13.169)
2.408.347 -18,87% 15,29% 4,77% 6,73% 3,29% 1.265 18.944
DAT
399.815
2.793
678.527 -34,65% 4,49% 1,97% 6,84% 2,90% 992 14.749
IDI
1.110.944
9.910
3.056.398 -26,65% 7,94% 1,48% 2,73% 1,10% 363 12.751
VHC
2.230.522
256.210
5.728.937 23,93% 16,13% 9,66% 14,72% 10,49% 4.396 31.291
Shrimp
BLF
114.500
2.859
154.153 -15,56% 25,78% -1,60% -4,38% -1,31% -591 13.405
CMX
526.856
27.588
920.933 30,85% 14,02% 4,52% 9,16% 3,66% 1.717 11.669
FMC
1.625.322
63.629
1.544.524 0,31% 9,73% 4,84% 16,75% 10,12% 4.030 23.030
MPC
2.784.811
289.186
5.404.263 -36,73% 14,73% 5,34% 12,96% 7,27% 3.431 26.396
SEA
271.231
52.038
3.016.142 29,44% 11,22% 23,36% 7,46% 6,27% 1.760 23.299
THP
645.165
1.981
341.991 0,00% 9,26% 1,13% 8,89% 2,23% 1.391 15.825
Vaue – added products
KHS
192.064
7.990
228.216 -34,00% 11,04% 4,24% 23,19% 8,21% 4.169 16.503
SJ1
330.270
5.058
291.040 24,05% 8,24% 1,15% 4,42% 1,32% 582 13.137
SPD
168.780
1.018
116.171 -12,00% 7,81% -2,83% -18,28% -5,25% -1.758 9.681
SSN
3.385
168
452.108 -23,58% 46,21% 0,15% 0,01% 0,00% 1.000 11.417
TS4
4.545
(15.553)
108.755 -96,35% 1,99% -7,71% -14,69% -2,07% -1.267 6.775
COMPANY FINANCIAL STATISTICS IN SEAFOOD INDUSTRY
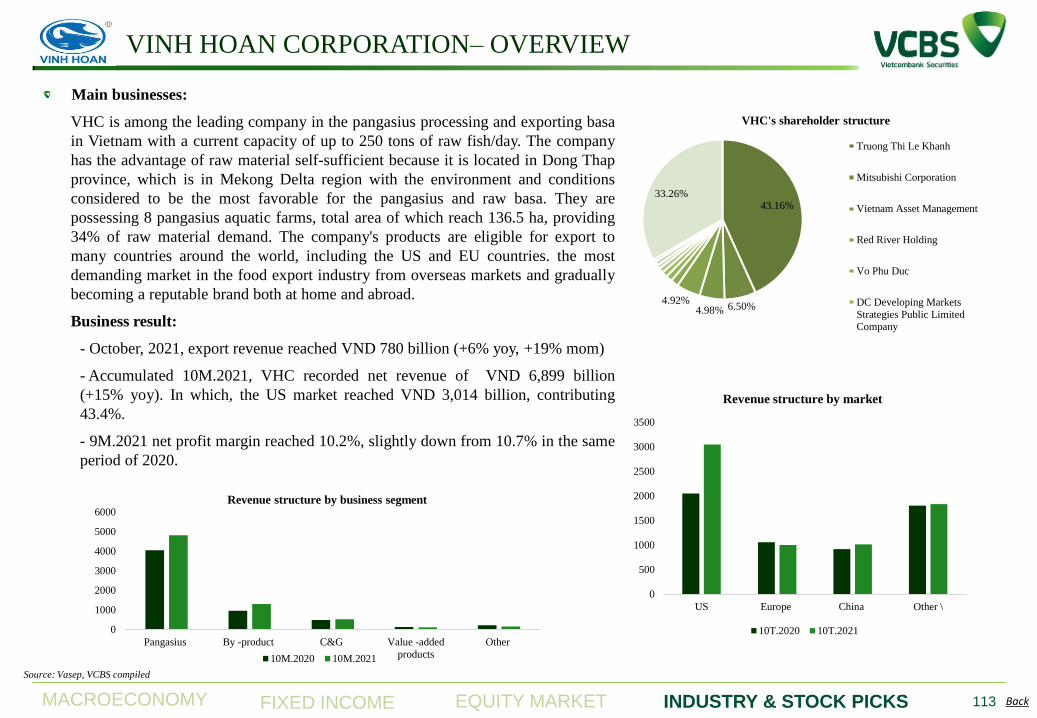
MACROECONOMY EQUITY MARKET INDUSTRY & STOCK PICKS FIXED INCOME Back
VINH HOAN CORPORATION– OVERVIEW
Main businesses:
VHC is among the leading company in the pangasius processing and exporting basa
in Vietnam with a current capacity of up to 250 tons of raw fish/day. The company
has the advantage of raw material self-sufficient because it is located in Dong Thap
province, which is in Mekong Delta region with the environment and conditions
considered to be the most favorable for the pangasius and raw basa. They are
possessing 8 pangasius aquatic farms, total area of which reach 136.5 ha, providing
34% of raw material demand. The company's products are eligible for export to
many countries around the world, including the US and EU countries. the most
demanding market in the food export industry from overseas markets and gradually
becoming a reputable brand both at home and abroad.
Business result:
- October, 2021, export revenue reached VND 780 billion (+6% yoy, +19% mom)
- Accumulated 10M.2021, VHC recorded net revenue of VND 6,899 billion
(+15% yoy). In which, the US market reached VND 3,014 billion, contributing
43.4%.
- 9M.2021 net profit margin reached 10.2%, slightly down from 10.7% in the same
period of 2020.
113
0
1000
2000
3000
4000
5000
6000
Pangasius By -product C&G Value -added
products
Other
Revenue structure by business segment
10M.2020 10M.2021
0
500
1000
1500
2000
2500
3000
3500
US Europe China Other \
Revenue structure by market
10T.2020 10T.2021
43.16%
6.50% 4.98% 4.92%
33.26%
VHC's shareholder structure
Truong Thi Le Khanh
Mitsubishi Corporation
Vietnam Asset Management
Red River Holding
Vo Phu Duc
DC Developing Markets
Strategies Public Limited
Company
Source: Vasep, VCBS compiled
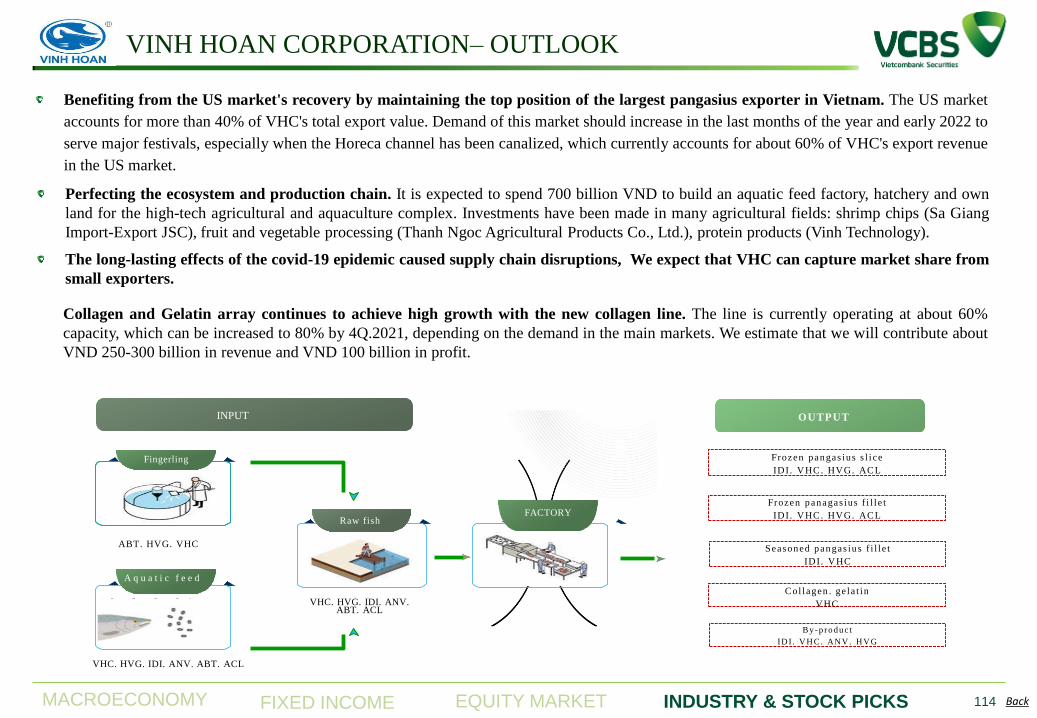
MACROECONOMY EQUITY MARKET INDUSTRY & STOCK PICKS FIXED INCOME Back
VINH HOAN CORPORATION– OUTLOOK
114
Benefiting from the US market's recovery by maintaining the top position of the largest pangasius exporter in Vietnam. The US market
accounts for more than 40% of VHC's total export value. Demand of this market should increase in the last months of the year and early 2022 to
serve major festivals, especially when the Horeca channel has been canalized, which currently accounts for about 60% of VHC's export revenue
in the US market.
Perfecting the ecosystem and production chain. It is expected to spend 700 billion VND to build an aquatic feed factory, hatchery and own
land for the high-tech agricultural and aquaculture complex. Investments have been made in many agricultural fields: shrimp chips (Sa Giang
Import-Export JSC), fruit and vegetable processing (Thanh Ngoc Agricultural Products Co., Ltd.), protein products (Vinh Technology).
The long-lasting effects of the covid-19 epidemic caused supply chain disruptions, We expect that VHC can capture market share from
small exporters.
Collagen and Gelatin array continues to achieve high growth with the new collagen line. The line is currently operating at about 60%
capacity, which can be increased to 80% by 4Q.2021, depending on the demand in the main markets. We estimate that we will contribute about
VND 250-300 billion in revenue and VND 100 billion in profit.
Fingerling
A q u a t i c f e e d
Raw fish FACTORY
INPUT
ABT. HVG. VHC
VHC. HVG. IDI. ANV. ABT. ACL
VHC. HVG. IDI. ANV. ABT. ACL
Frozen pangas ius s l i ce
IDI. VHC. HVG. ACL
Frozen panagas ius f i l l e t
IDI. VHC. HVG. ACL
Seasoned pangas ius f i l l e t
IDI. VHC
Col lagen . ge la t in
VHC
B y - p r o d u c t
ID I . V H C . AN V . H V G
OUTPUT
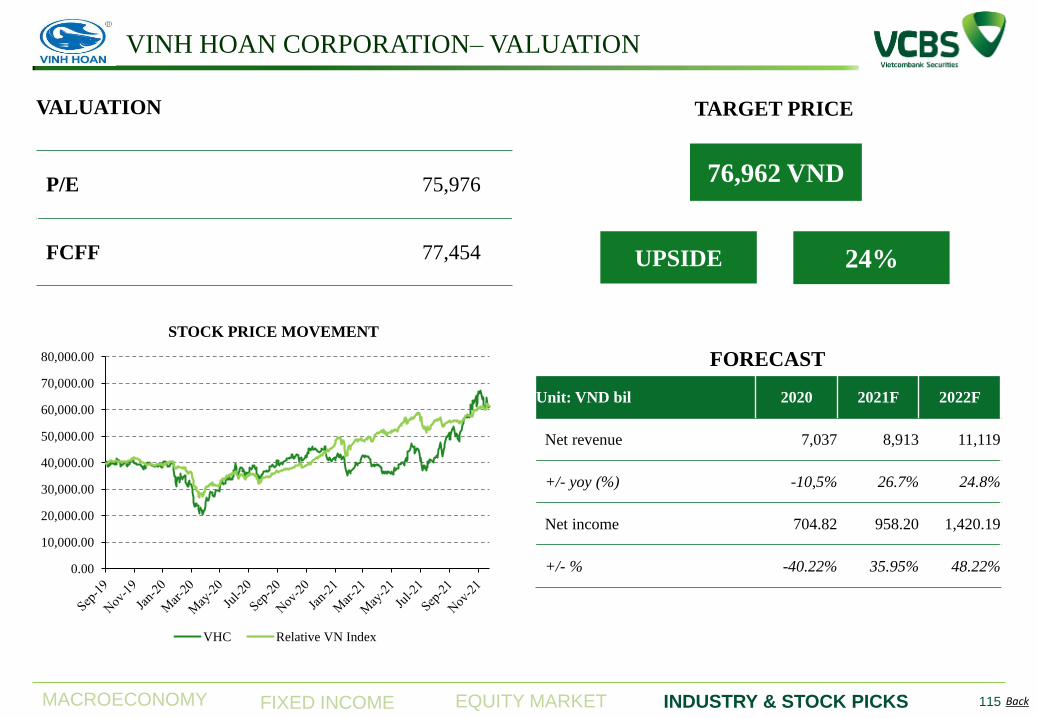
MACROECONOMY EQUITY MARKET INDUSTRY & STOCK PICKS FIXED INCOME Back 115
P/E 75,976
FCFF 77,454
FORECAST
VALUATION
76,962 VND
TARGET PRICE
24% UPSIDE
Unit: VND bil 2020 2021F 2022F
Net revenue 7,037 8,913 11,119
+/- yoy (%) -10,5% 26.7% 24.8%
Net income 704.82 958.20 1,420.19
+/- % -40.22% 35.95% 48.22%
VINH HOAN CORPORATION– VALUATION
0.00
10,000.00
20,000.00
30,000.00
40,000.00
50,000.00
60,000.00
70,000.00
80,000.00
STOCK PRICE MOVEMENT
VHC Relative VN Index
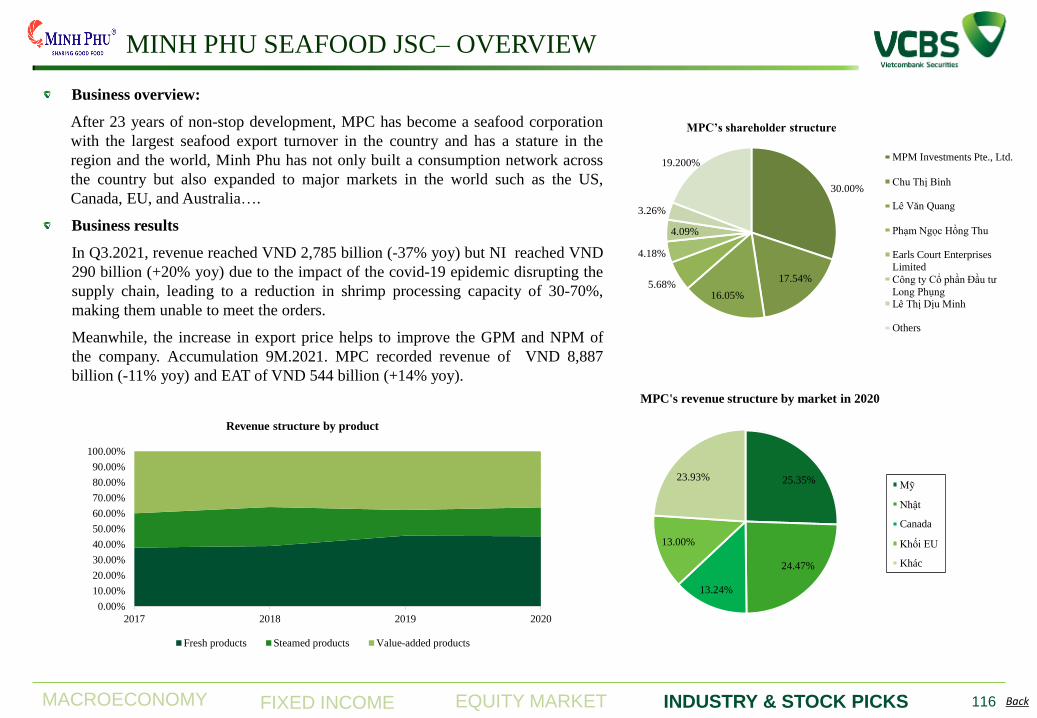
MACROECONOMY EQUITY MARKET INDUSTRY & STOCK PICKS FIXED INCOME Back
MINH PHU SEAFOOD JSC– OVERVIEW
Business overview:
After 23 years of non-stop development, MPC has become a seafood corporation
with the largest seafood export turnover in the country and has a stature in the
region and the world, Minh Phu has not only built a consumption network across
the country but also expanded to major markets in the world such as the US,
Canada, EU, and Australia….
Business results
In Q3.2021, revenue reached VND 2,785 billion (-37% yoy) but NI reached VND
290 billion (+20% yoy) due to the impact of the covid-19 epidemic disrupting the
supply chain, leading to a reduction in shrimp processing capacity of 30-70%,
making them unable to meet the orders.
Meanwhile, the increase in export price helps to improve the GPM and NPM of
the company. Accumulation 9M.2021. MPC recorded revenue of VND 8,887
billion (-11% yoy) and EAT of VND 544 billion (+14% yoy).
116
30.00%
17.54%
16.05% 5.68%
4.18%
4.09%
3.26%
19.200%
MPC’s shareholder structure
MPM Investments Pte., Ltd.
Chu Thị Bình
Lê Văn Quang
Phạm Ngọc Hồng Thu
Earls Court Enterprises
Limited
Công ty Cổ phần Đầu tƣ
Long Phụng Lê Thị Dịu Minh
Others
0.00%
10.00%
20.00%
30.00%
40.00%
50.00%
60.00%
70.00%
80.00%
90.00%
100.00%
2017 2018 2019 2020
Revenue structure by product
Fresh products Steamed products Value-added products
25.35%
24.47%
13.24%
13.00%
23.93%
MPC's revenue structure by market in 2020
Mỹ
Nhật
Canada
Khối EU
Khác
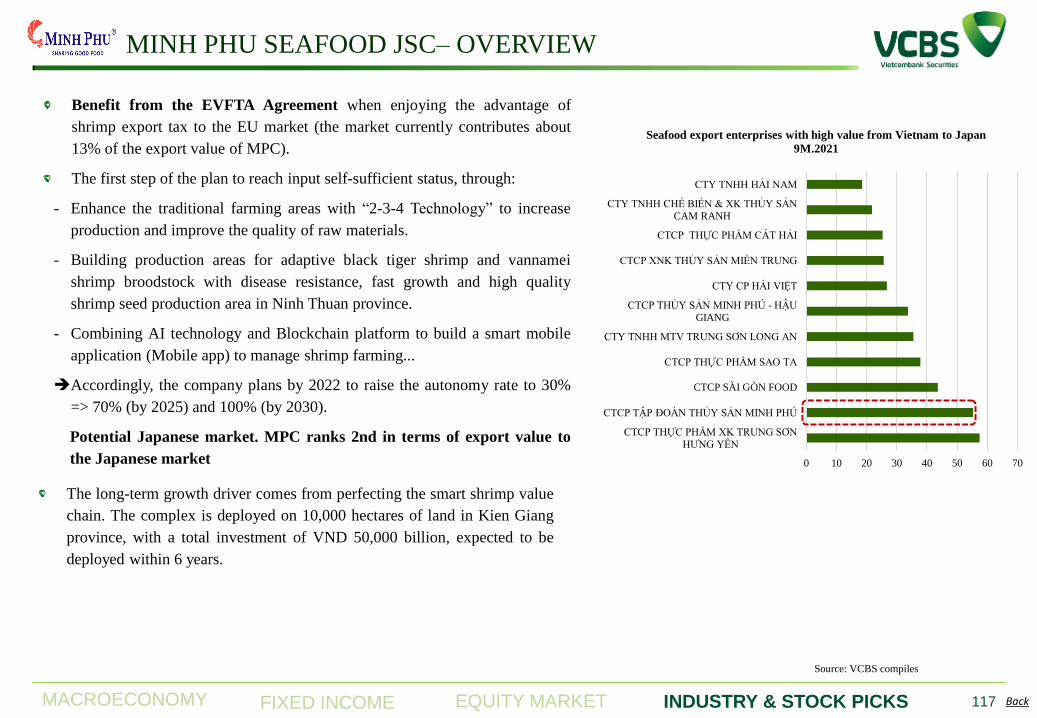
MACROECONOMY EQUITY MARKET INDUSTRY & STOCK PICKS FIXED INCOME Back
Source: VCBS compiles
117
Benefit from the EVFTA Agreement when enjoying the advantage of
shrimp export tax to the EU market (the market currently contributes about
13% of the export value of MPC).
The first step of the plan to reach input self-sufficient status, through:
- Enhance the traditional farming areas with “2-3-4 Technology” to increase
production and improve the quality of raw materials.
- Building production areas for adaptive black tiger shrimp and vannamei
shrimp broodstock with disease resistance, fast growth and high quality
shrimp seed production area in Ninh Thuan province.
- Combining AI technology and Blockchain platform to build a smart mobile
application (Mobile app) to manage shrimp farming...
Accordingly, the company plans by 2022 to raise the autonomy rate to 30%
=> 70% (by 2025) and 100% (by 2030).
Potential Japanese market. MPC ranks 2nd in terms of export value to
the Japanese market
The long-term growth driver comes from perfecting the smart shrimp value
chain. The complex is deployed on 10,000 hectares of land in Kien Giang
province, with a total investment of VND 50,000 billion, expected to be
deployed within 6 years.
0 10 20 30 40 50 60 70
CTCP THỰC PHẨM XK TRUNG SƠN
HƢNG YÊN
CTCP TẬP ĐOÀN THỦY SẢN MINH PHÚ
CTCP SÀI GÒN FOOD
CTCP THỰC PHẨM SAO TA
CTY TNHH MTV TRUNG SƠN LONG AN
CTCP THỦY SẢN MINH PHÚ - HẬU
GIANG
CTY CP HẢI VIỆT
CTCP XNK THỦY SẢN MIỀN TRUNG
CTCP THỰC PHẨM CÁT HẢI
CTY TNHH CHẾ BIẾN & XK THỦY SẢN
CAM RANH
CTY TNHH HẢI NAM
Seafood export enterprises with high value from Vietnam to Japan
9M.2021
MINH PHU SEAFOOD JSC– OVERVIEW
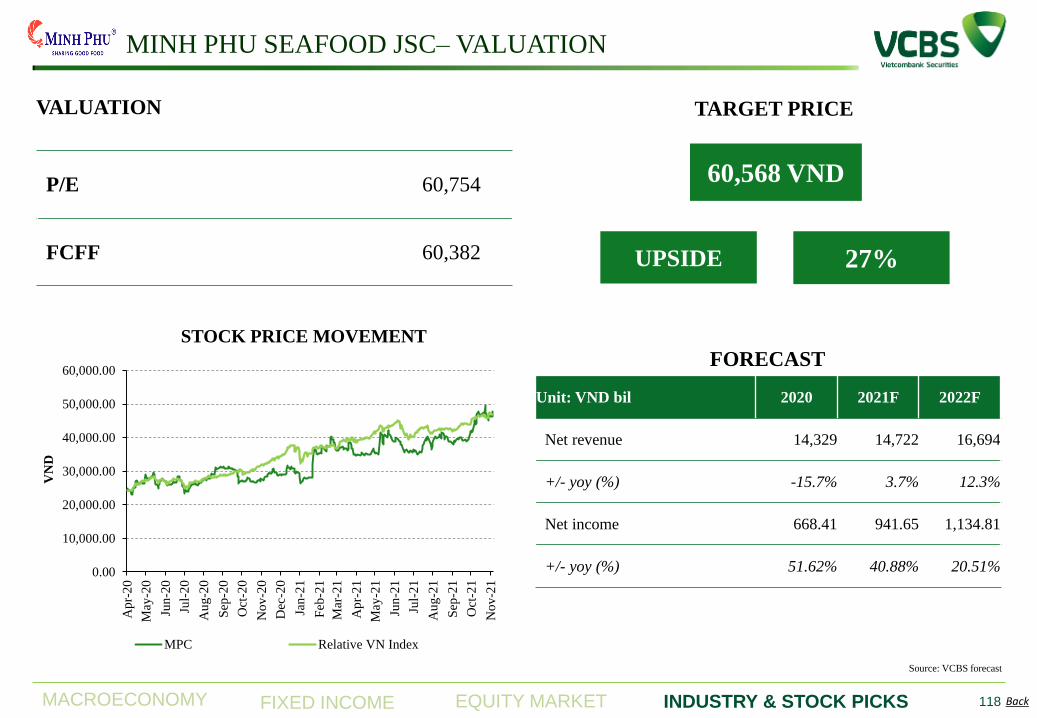
MACROECONOMY EQUITY MARKET INDUSTRY & STOCK PICKS FIXED INCOME Back 118
P/E 60,754
FCFF 60,382
FORECAST
VALUATION
60,568 VND
TARGET PRICE
27% UPSIDE
Unit: VND bil 2020 2021F 2022F
Net revenue 14,329 14,722 16,694
+/- yoy (%) -15.7% 3.7% 12.3%
Net income 668.41 941.65 1,134.81
+/- yoy (%) 51.62% 40.88% 20.51%
MINH PHU SEAFOOD JSC– VALUATION
0.00
10,000.00
20,000.00
30,000.00
40,000.00
50,000.00
60,000.00
Ap
r-2
0
May
-20
Jun
-20
Jul-
20
Au
g-2
0
Sep
-20
Oct
-20
No
v-2
0
Dec
-20
Jan
-21
Feb
-21
Mar
-21
Ap
r-2
1
May
-21
Jun
-21
Jul-
21
Au
g-2
1
Sep
-21
Oct
-21
No
v-2
1
VN
D
STOCK PRICE MOVEMENT
MPC Relative VN Index
Source: VCBS forecast
OIL & GAS
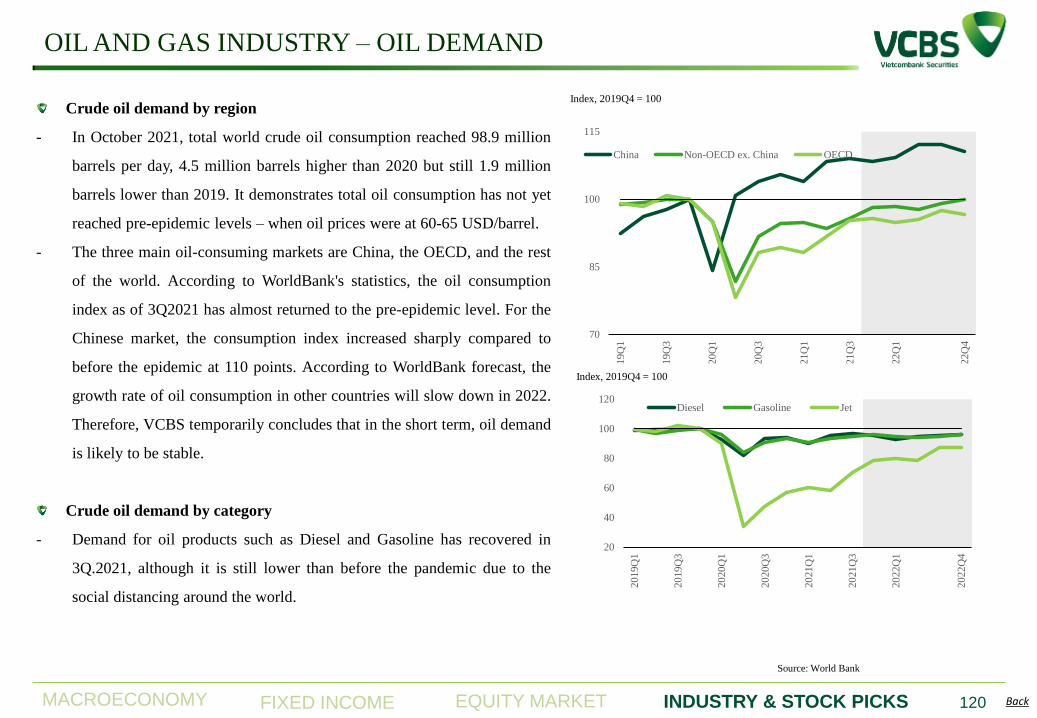
MACROECONOMY EQUITY MARKET INDUSTRY & STOCK PICKS FIXED INCOME Back
OIL AND GAS INDUSTRY – OIL DEMAND
120
Source: World Bank
Crude oil demand by region
- In October 2021, total world crude oil consumption reached 98.9 million
barrels per day, 4.5 million barrels higher than 2020 but still 1.9 million
barrels lower than 2019. It demonstrates total oil consumption has not yet
reached pre-epidemic levels – when oil prices were at 60-65 USD/barrel.
- The three main oil-consuming markets are China, the OECD, and the rest
of the world. According to WorldBank's statistics, the oil consumption
index as of 3Q2021 has almost returned to the pre-epidemic level. For the
Chinese market, the consumption index increased sharply compared to
before the epidemic at 110 points. According to WorldBank forecast, the
growth rate of oil consumption in other countries will slow down in 2022.
Therefore, VCBS temporarily concludes that in the short term, oil demand
is likely to be stable.
Crude oil demand by category
- Demand for oil products such as Diesel and Gasoline has recovered in
3Q.2021, although it is still lower than before the pandemic due to the
social distancing around the world.
70
85
100
115
20
19Q
1
20
19Q
3
20
20Q
1
20
20Q
3
20
21Q
1
20
21Q
3
20
22Q
1
20
22Q
4
China Non-OECD ex. China OECD
Index, 2019Q4 = 100
20
40
60
80
100
120
20
19Q
1
20
19Q
3
20
20Q
1
20
20Q
3
20
21Q
1
20
21Q
3
20
22Q
1
20
22Q
4
Diesel Gasoline Jet
Index, 2019Q4 = 100
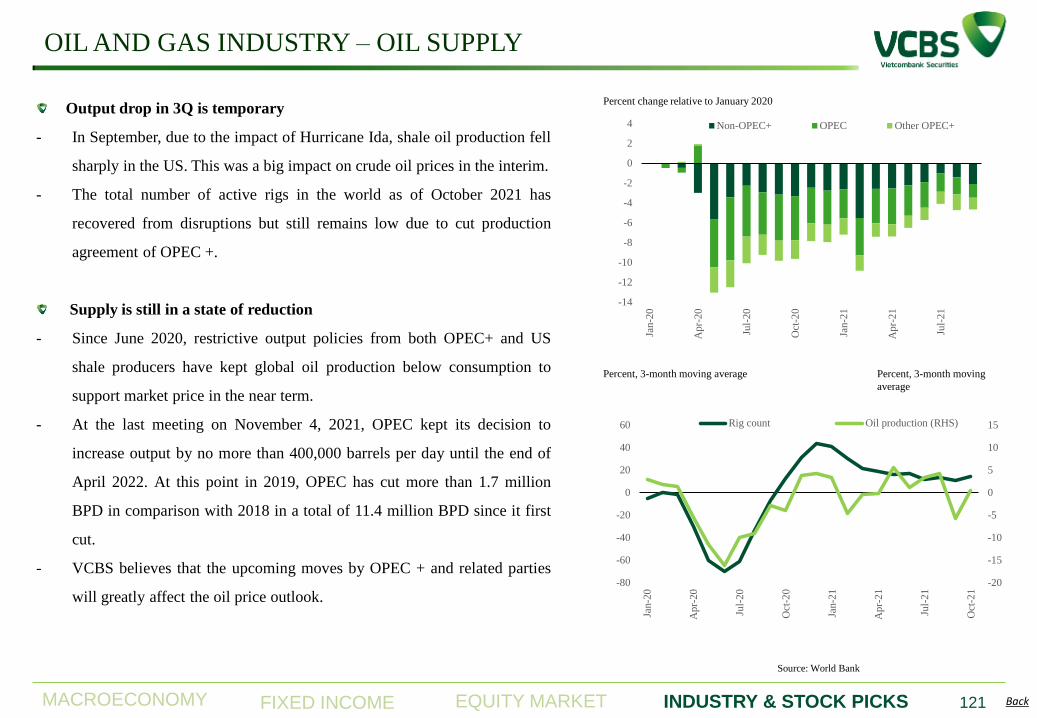
MACROECONOMY EQUITY MARKET INDUSTRY & STOCK PICKS FIXED INCOME Back
OIL AND GAS INDUSTRY – OIL SUPPLY
121
Source: World Bank
Output drop in 3Q is temporary
- In September, due to the impact of Hurricane Ida, shale oil production fell
sharply in the US. This was a big impact on crude oil prices in the interim.
- The total number of active rigs in the world as of October 2021 has
recovered from disruptions but still remains low due to cut production
agreement of OPEC +.
Supply is still in a state of reduction
- Since June 2020, restrictive output policies from both OPEC+ and US
shale producers have kept global oil production below consumption to
support market price in the near term.
- At the last meeting on November 4, 2021, OPEC kept its decision to
increase output by no more than 400,000 barrels per day until the end of
April 2022. At this point in 2019, OPEC has cut more than 1.7 million
BPD in comparison with 2018 in a total of 11.4 million BPD since it first
cut.
- VCBS believes that the upcoming moves by OPEC + and related parties
will greatly affect the oil price outlook.
-14
-12
-10
-8
-6
-4
-2
0
2
4
Jan-2
0
Apr-
20
Jul-
20
Oct
-20
Jan-2
1
Apr-
21
Jul-
21
Non-OPEC+ OPEC Other OPEC+
Percent change relative to January 2020
-20
-15
-10
-5
0
5
10
15
-80
-60
-40
-20
0
20
40
60
Jan-2
0
Apr-
20
Jul-
20
Oct
-20
Jan-2
1
Apr-
21
Jul-
21
Oct
-21
Rig count Oil production (RHS)
Percent, 3-month moving average Percent, 3-month moving
average
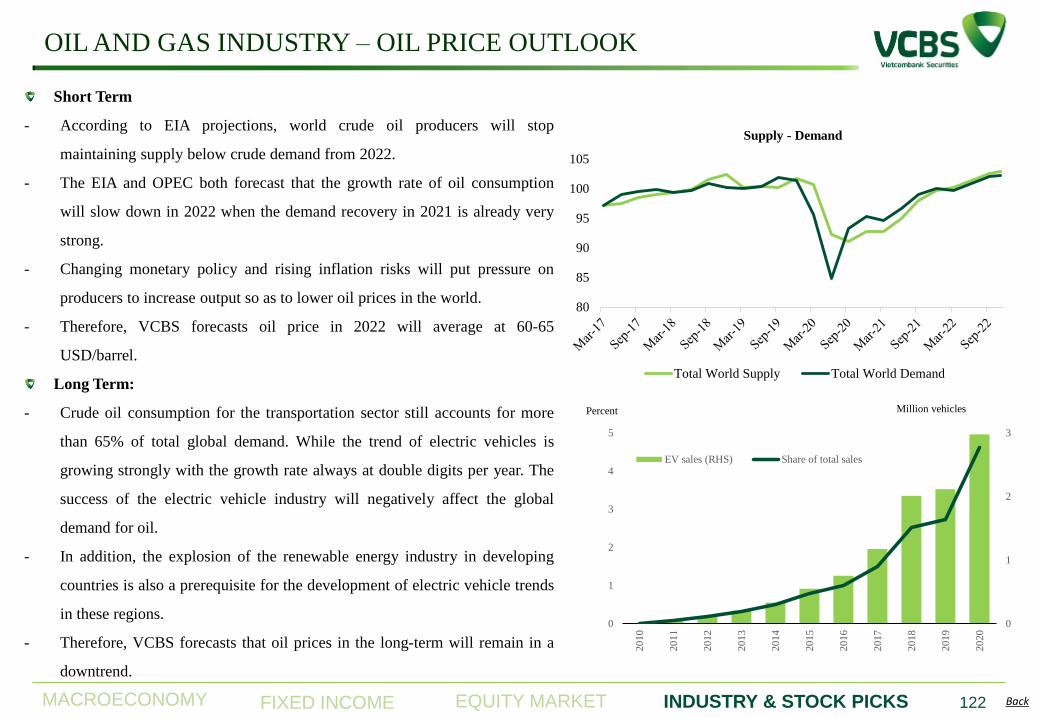
MACROECONOMY EQUITY MARKET INDUSTRY & STOCK PICKS FIXED INCOME Back
OIL AND GAS INDUSTRY – OIL PRICE OUTLOOK
122
Short Term
- According to EIA projections, world crude oil producers will stop
maintaining supply below crude demand from 2022.
- The EIA and OPEC both forecast that the growth rate of oil consumption
will slow down in 2022 when the demand recovery in 2021 is already very
strong.
- Changing monetary policy and rising inflation risks will put pressure on
producers to increase output so as to lower oil prices in the world.
- Therefore, VCBS forecasts oil price in 2022 will average at 60-65
USD/barrel.
Long Term:
- Crude oil consumption for the transportation sector still accounts for more
than 65% of total global demand. While the trend of electric vehicles is
growing strongly with the growth rate always at double digits per year. The
success of the electric vehicle industry will negatively affect the global
demand for oil.
- In addition, the explosion of the renewable energy industry in developing
countries is also a prerequisite for the development of electric vehicle trends
in these regions.
- Therefore, VCBS forecasts that oil prices in the long-term will remain in a
downtrend.
80
85
90
95
100
105
Supply - Demand
Total World Supply Total World Demand
0
1
2
3
0
1
2
3
4
5
20
10
20
11
20
12
20
13
20
14
20
15
20
16
20
17
20
18
20
19
20
20
EV sales (RHS) Share of total sales
Percent Million vehicles
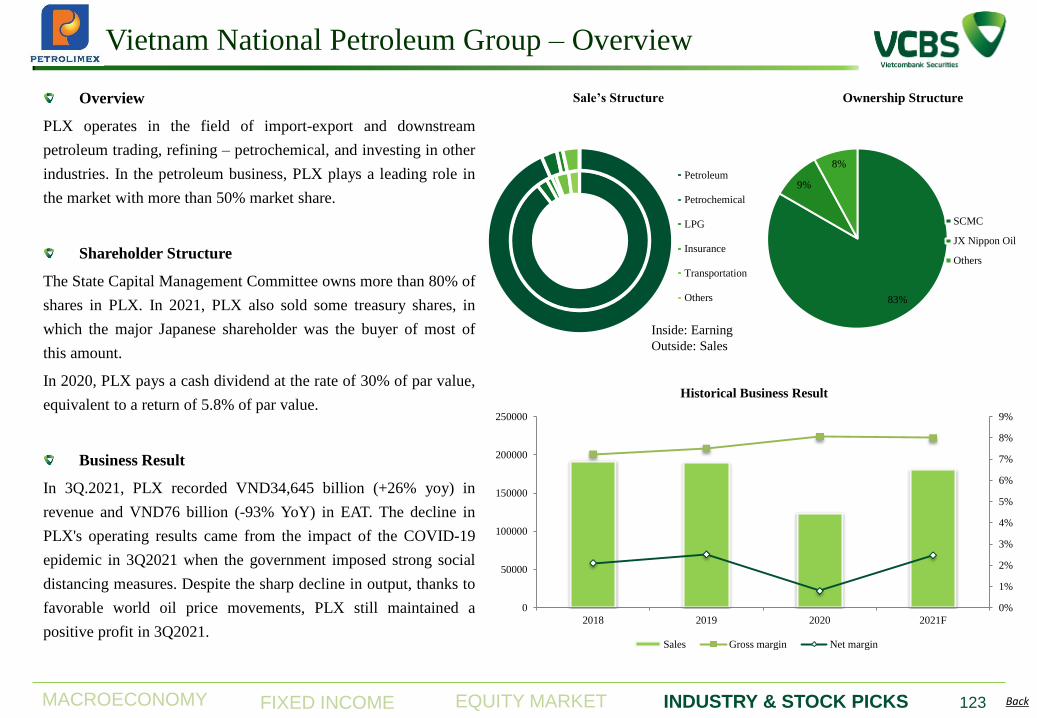
MACROECONOMY EQUITY MARKET INDUSTRY & STOCK PICKS FIXED INCOME Back
Vietnam National Petroleum Group – Overview
123
Overview
PLX operates in the field of import-export and downstream
petroleum trading, refining – petrochemical, and investing in other
industries. In the petroleum business, PLX plays a leading role in
the market with more than 50% market share.
Shareholder Structure
The State Capital Management Committee owns more than 80% of
shares in PLX. In 2021, PLX also sold some treasury shares, in
which the major Japanese shareholder was the buyer of most of
this amount.
In 2020, PLX pays a cash dividend at the rate of 30% of par value,
equivalent to a return of 5.8% of par value.
Business Result
In 3Q.2021, PLX recorded VND34,645 billion (+26% yoy) in
revenue and VND76 billion (-93% YoY) in EAT. The decline in
PLX's operating results came from the impact of the COVID-19
epidemic in 3Q2021 when the government imposed strong social
distancing measures. Despite the sharp decline in output, thanks to
favorable world oil price movements, PLX still maintained a
positive profit in 3Q2021.
Logo DN
Sale’s Structure
Petroleum
Petrochemical
LPG
Insurance
Transportation
Others
Inside: Earning
Outside: Sales
83%
9%
8%
Ownership Structure
SCMC
JX Nippon Oil
Others
0%
1%
2%
3%
4%
5%
6%
7%
8%
9%
0
50000
100000
150000
200000
250000
2018 2019 2020 2021F
Historical Business Result
Sales Gross margin Net margin
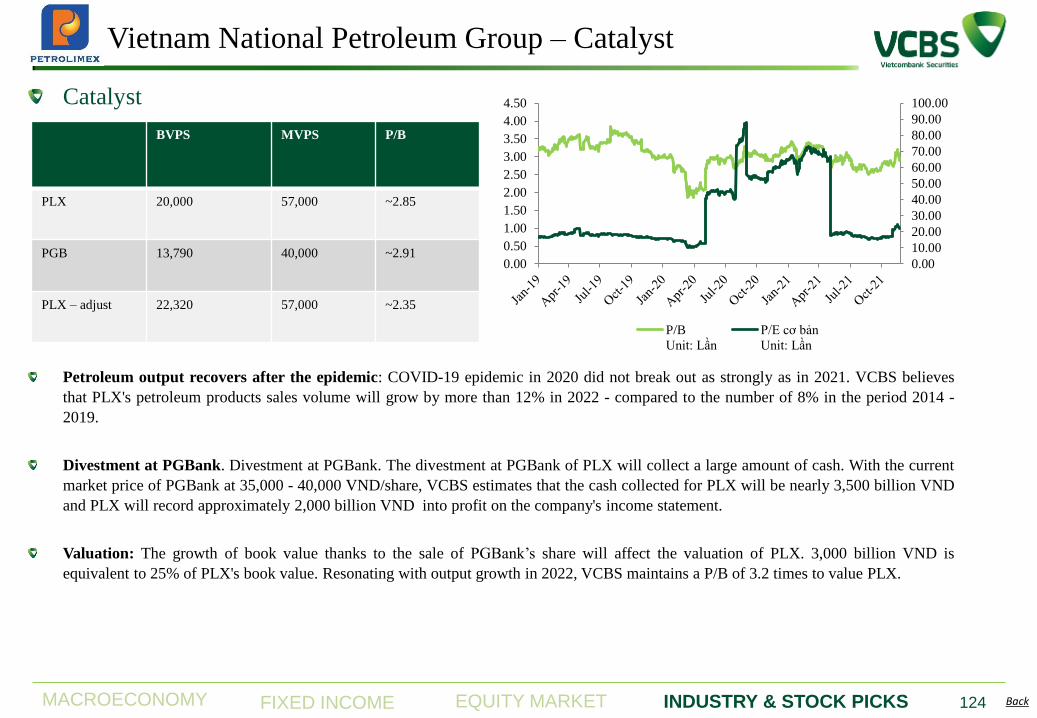
MACROECONOMY EQUITY MARKET INDUSTRY & STOCK PICKS FIXED INCOME Back 124
Catalyst
Petroleum output recovers after the epidemic: COVID-19 epidemic in 2020 did not break out as strongly as in 2021. VCBS believes
that PLX's petroleum products sales volume will grow by more than 12% in 2022 - compared to the number of 8% in the period 2014 -
2019.
Divestment at PGBank. Divestment at PGBank. The divestment at PGBank of PLX will collect a large amount of cash. With the current
market price of PGBank at 35,000 - 40,000 VND/share, VCBS estimates that the cash collected for PLX will be nearly 3,500 billion VND
and PLX will record approximately 2,000 billion VND into profit on the company's income statement.
Valuation: The growth of book value thanks to the sale of PGBank’s share will affect the valuation of PLX. 3,000 billion VND is
equivalent to 25% of PLX's book value. Resonating with output growth in 2022, VCBS maintains a P/B of 3.2 times to value PLX.
Logo DN Vietnam National Petroleum Group – Catalyst
BVPS MVPS P/B
PLX 20,000 57,000 ~2.85
PGB 13,790 40,000 ~2.91
PLX – adjust 22,320 57,000 ~2.35
0.00
10.00
20.00
30.00
40.00
50.00
60.00
70.00
80.00
90.00
100.00
0.00
0.50
1.00
1.50
2.00
2.50
3.00
3.50
4.00
4.50
P/B
Unit: Lần
P/E cơ bản
Unit: Lần
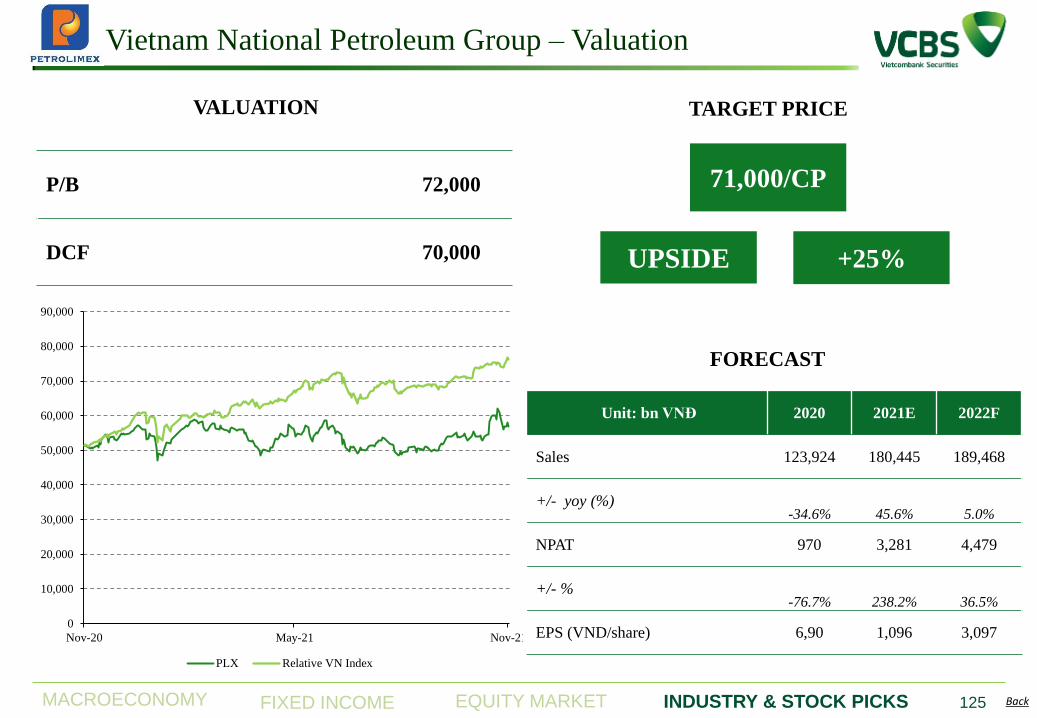
MACROECONOMY EQUITY MARKET INDUSTRY & STOCK PICKS FIXED INCOME Back 125
Logo DN
Unit: bn VNĐ 2020 2021E 2022F
Sales 123,924 180,445 189,468
+/- yoy (%) -34.6% 45.6% 5.0%
NPAT 970 3,281 4,479
+/- % -76.7% 238.2% 36.5%
EPS (VND/share) 6,90 1,096 3,097
P/B 72,000
DCF 70,000
FORECAST
VALUATION
71,000/CP
TARGET PRICE
+25% UPSIDE
Vietnam National Petroleum Group – Valuation
0
10,000
20,000
30,000
40,000
50,000
60,000
70,000
80,000
90,000
Nov-20 May-21 Nov-21
PLX Relative VN Index
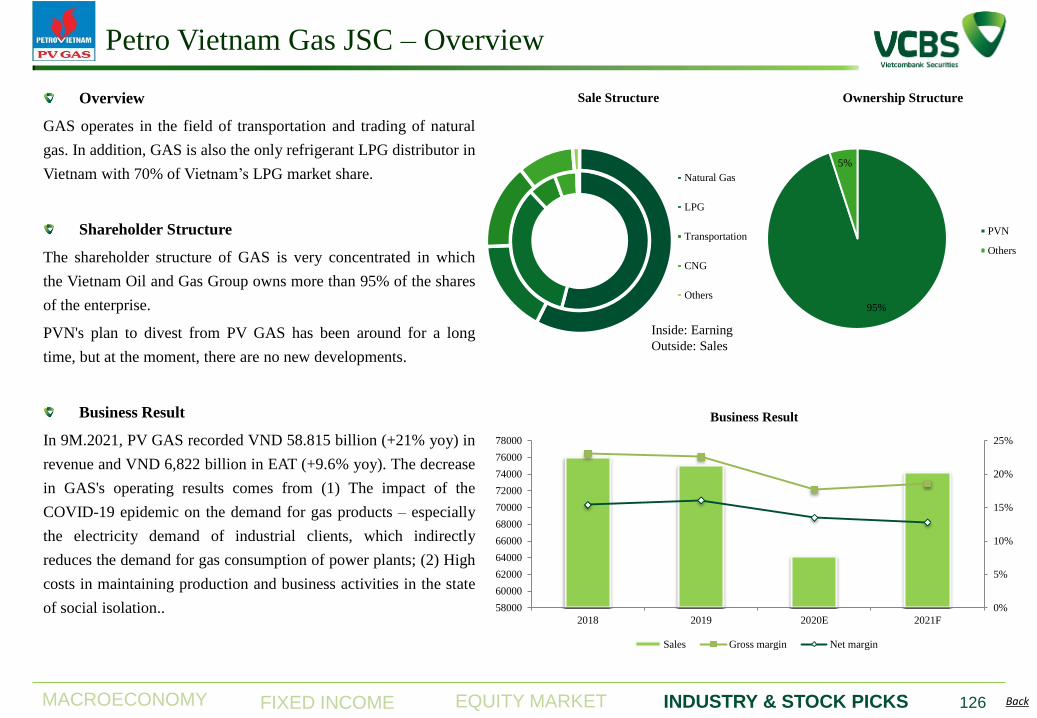
MACROECONOMY EQUITY MARKET INDUSTRY & STOCK PICKS FIXED INCOME Back
Petro Vietnam Gas JSC – Overview
126
Overview
GAS operates in the field of transportation and trading of natural
gas. In addition, GAS is also the only refrigerant LPG distributor in
Vietnam with 70% of Vietnam’s LPG market share.
Shareholder Structure
The shareholder structure of GAS is very concentrated in which
the Vietnam Oil and Gas Group owns more than 95% of the shares
of the enterprise.
PVN's plan to divest from PV GAS has been around for a long
time, but at the moment, there are no new developments.
Business Result
In 9M.2021, PV GAS recorded VND 58.815 billion (+21% yoy) in
revenue and VND 6,822 billion in EAT (+9.6% yoy). The decrease
in GAS's operating results comes from (1) The impact of the
COVID-19 epidemic on the demand for gas products – especially
the electricity demand of industrial clients, which indirectly
reduces the demand for gas consumption of power plants; (2) High
costs in maintaining production and business activities in the state
of social isolation..
Logo DN
Sale Structure
Natural Gas
LPG
Transportation
CNG
Others
Inside: Earning
Outside: Sales
95%
5%
Ownership Structure
PVN
Others
0%
5%
10%
15%
20%
25%
58000
60000
62000
64000
66000
68000
70000
72000
74000
76000
78000
2018 2019 2020E 2021F
Business Result
Sales Gross margin Net margin
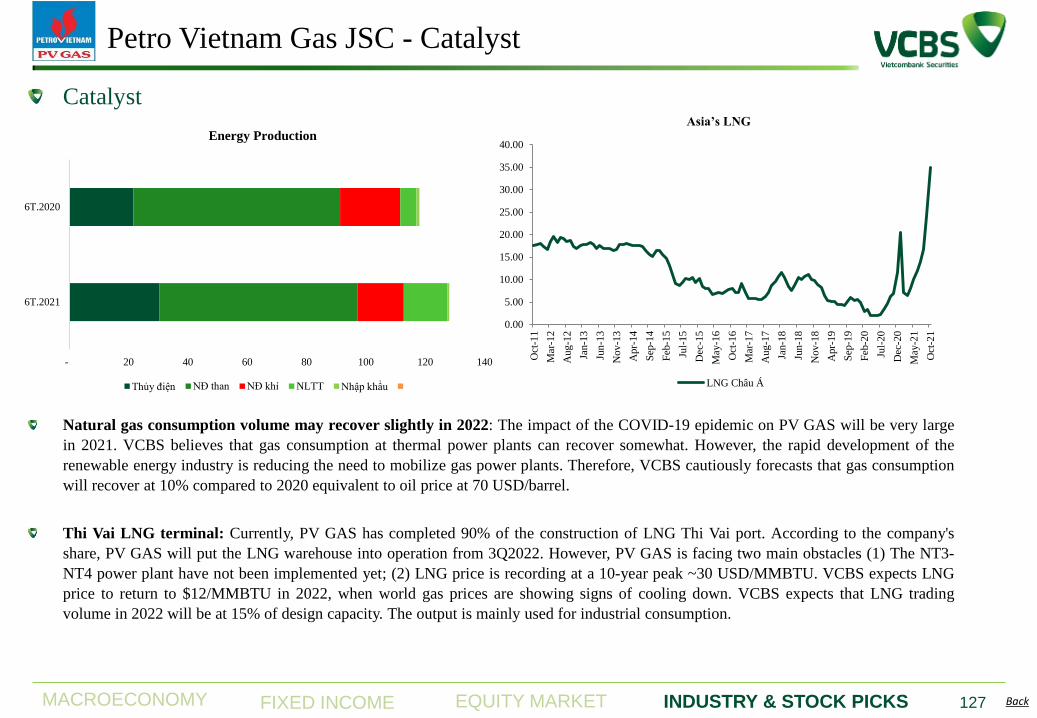
MACROECONOMY EQUITY MARKET INDUSTRY & STOCK PICKS FIXED INCOME Back 127
Catalyst
Natural gas consumption volume may recover slightly in 2022: The impact of the COVID-19 epidemic on PV GAS will be very large
in 2021. VCBS believes that gas consumption at thermal power plants can recover somewhat. However, the rapid development of the
renewable energy industry is reducing the need to mobilize gas power plants. Therefore, VCBS cautiously forecasts that gas consumption
will recover at 10% compared to 2020 equivalent to oil price at 70 USD/barrel.
Thi Vai LNG terminal: Currently, PV GAS has completed 90% of the construction of LNG Thi Vai port. According to the company's
share, PV GAS will put the LNG warehouse into operation from 3Q2022. However, PV GAS is facing two main obstacles (1) The NT3-
NT4 power plant have not been implemented yet; (2) LNG price is recording at a 10-year peak ~30 USD/MMBTU. VCBS expects LNG
price to return to $12/MMBTU in 2022, when world gas prices are showing signs of cooling down. VCBS expects that LNG trading
volume in 2022 will be at 15% of design capacity. The output is mainly used for industrial consumption.
Logo DN Petro Vietnam Gas JSC - Catalyst
- 20 40 60 80 100 120 140
6T.2021
6T.2020
Energy Production
Thủy điện NĐ than NĐ khí NLTT Nhập khẩu
0.00
5.00
10.00
15.00
20.00
25.00
30.00
35.00
40.00
Oct
-11
Mar
-12
Aug
-12
Jan-1
3
Jun
-13
Nov
-13
Apr-
14
Sep
-14
Feb
-15
Jul-
15
Dec
-15
May
-16
Oct
-16
Mar
-17
Aug
-17
Jan-1
8
Jun
-18
Nov
-18
Apr-
19
Sep
-19
Feb
-20
Jul-
20
Dec
-20
May
-21
Oct
-21
Asia’s LNG
LNG Châu Á
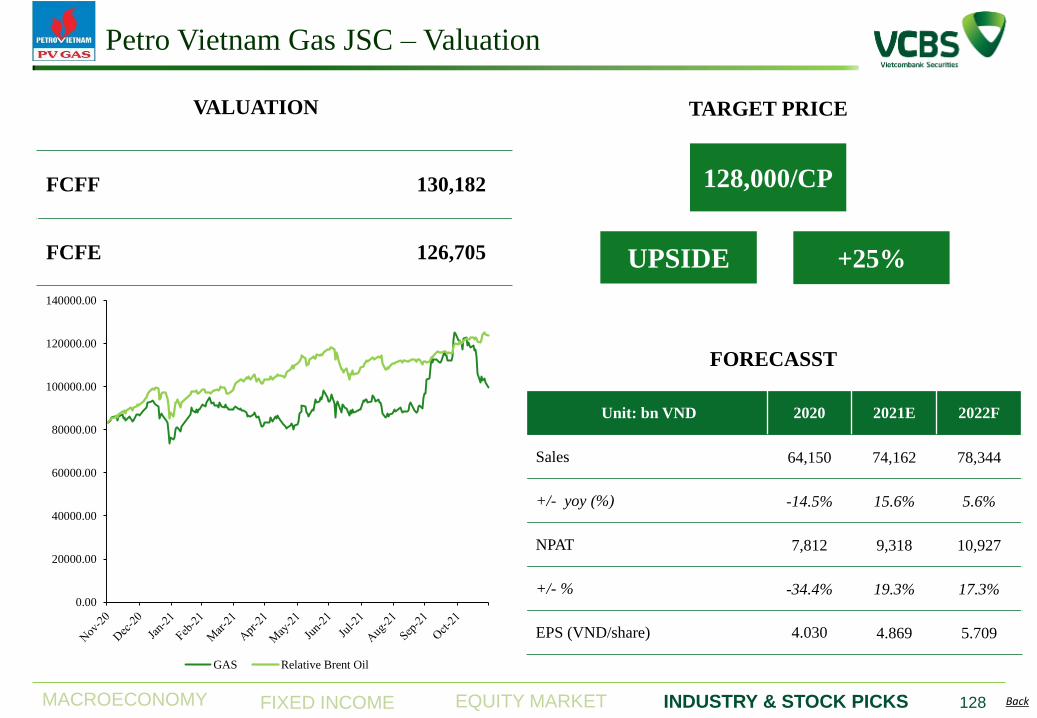
MACROECONOMY EQUITY MARKET INDUSTRY & STOCK PICKS FIXED INCOME Back 128
Logo DN
Unit: bn VND 2020 2021E 2022F
Sales 64,150 74,162 78,344
+/- yoy (%) -14.5% 15.6% 5.6%
NPAT 7,812 9,318 10,927
+/- % -34.4% 19.3% 17.3%
EPS (VND/share) 4.030 4.869 5.709
FCFF 130,182
FCFE 126,705
FORECASST
VALUATION
128,000/CP
TARGET PRICE
+25% UPSIDE
Petro Vietnam Gas JSC – Valuation
0.00
20000.00
40000.00
60000.00
80000.00
100000.00
120000.00
140000.00
GAS Relative Brent Oil

OTHERS
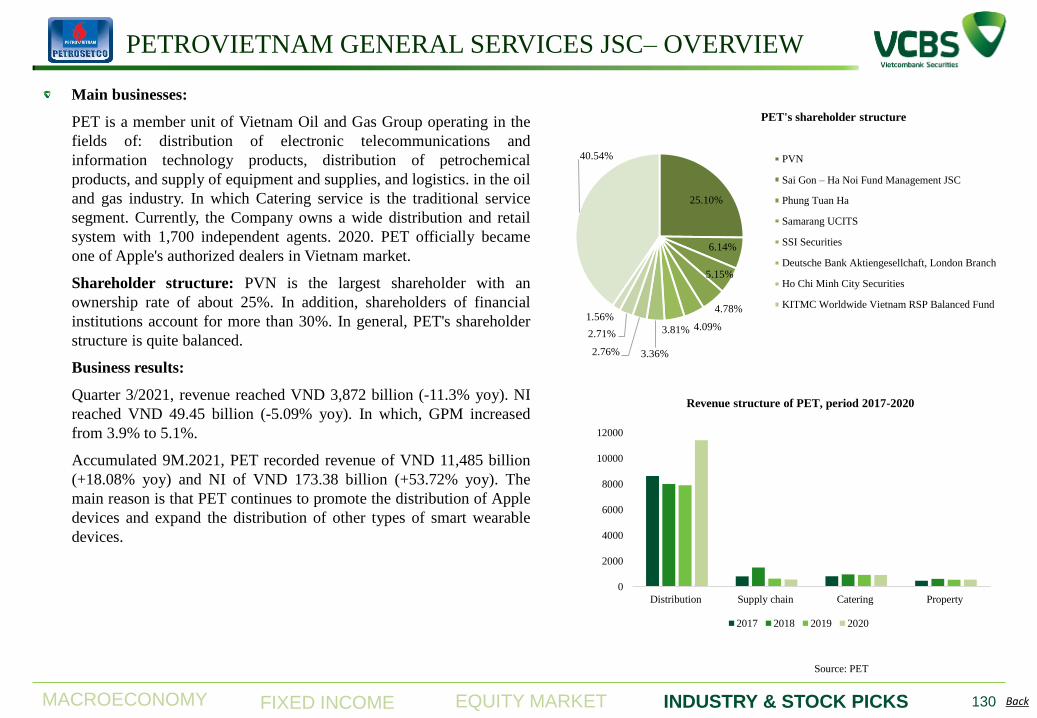
MACROECONOMY EQUITY MARKET INDUSTRY & STOCK PICKS FIXED INCOME Back
PETROVIETNAM GENERAL SERVICES JSC– OVERVIEW
Source: PET
Main businesses:
PET is a member unit of Vietnam Oil and Gas Group operating in the
fields of: distribution of electronic telecommunications and
information technology products, distribution of petrochemical
products, and supply of equipment and supplies, and logistics. in the oil
and gas industry. In which Catering service is the traditional service
segment. Currently, the Company owns a wide distribution and retail
system with 1,700 independent agents. 2020. PET officially became
one of Apple's authorized dealers in Vietnam market.
Shareholder structure: PVN is the largest shareholder with an
ownership rate of about 25%. In addition, shareholders of financial
institutions account for more than 30%. In general, PET's shareholder
structure is quite balanced.
Business results:
Quarter 3/2021, revenue reached VND 3,872 billion (-11.3% yoy). NI
reached VND 49.45 billion (-5.09% yoy). In which, GPM increased
from 3.9% to 5.1%.
Accumulated 9M.2021, PET recorded revenue of VND 11,485 billion
(+18.08% yoy) and NI of VND 173.38 billion (+53.72% yoy). The
main reason is that PET continues to promote the distribution of Apple
devices and expand the distribution of other types of smart wearable
devices.
130
0
2000
4000
6000
8000
10000
12000
Distribution Supply chain Catering Property
Revenue structure of PET, period 2017-2020
2017 2018 2019 2020
25.10%
6.14%
5.15%
4.78%
4.09% 3.81%
3.36% 2.76%
2.71%
1.56%
40.54%
PET's shareholder structure
PVN
Sai Gon – Ha Noi Fund Management JSC
Phung Tuan Ha
Samarang UCITS
SSI Securities
Deutsche Bank Aktiengesellchaft, London Branch
Ho Chi Minh City Securities
KITMC Worldwide Vietnam RSP Balanced Fund
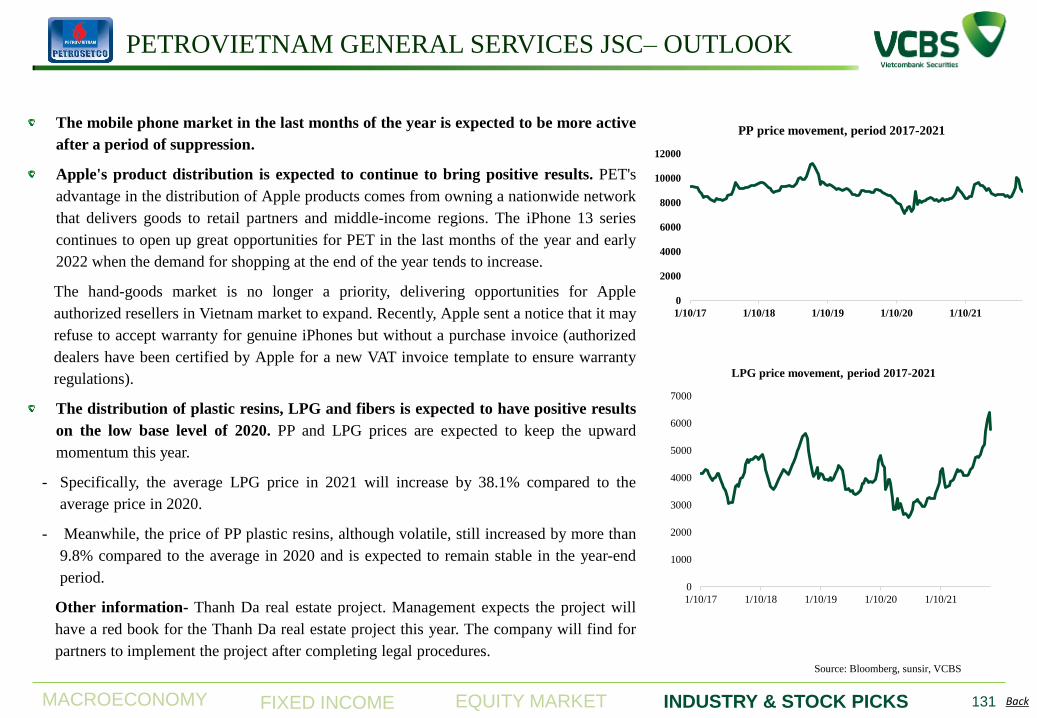
MACROECONOMY EQUITY MARKET INDUSTRY & STOCK PICKS FIXED INCOME Back
PETROVIETNAM GENERAL SERVICES JSC– OUTLOOK
Source: Bloomberg, sunsir, VCBS
131
The mobile phone market in the last months of the year is expected to be more active
after a period of suppression.
Apple's product distribution is expected to continue to bring positive results. PET's
advantage in the distribution of Apple products comes from owning a nationwide network
that delivers goods to retail partners and middle-income regions. The iPhone 13 series
continues to open up great opportunities for PET in the last months of the year and early
2022 when the demand for shopping at the end of the year tends to increase.
The hand-goods market is no longer a priority, delivering opportunities for Apple
authorized resellers in Vietnam market to expand. Recently, Apple sent a notice that it may
refuse to accept warranty for genuine iPhones but without a purchase invoice (authorized
dealers have been certified by Apple for a new VAT invoice template to ensure warranty
regulations).
The distribution of plastic resins, LPG and fibers is expected to have positive results
on the low base level of 2020. PP and LPG prices are expected to keep the upward
momentum this year.
- Specifically, the average LPG price in 2021 will increase by 38.1% compared to the
average price in 2020.
- Meanwhile, the price of PP plastic resins, although volatile, still increased by more than
9.8% compared to the average in 2020 and is expected to remain stable in the year-end
period.
Other information- Thanh Da real estate project. Management expects the project will
have a red book for the Thanh Da real estate project this year. The company will find for
partners to implement the project after completing legal procedures.
0
2000
4000
6000
8000
10000
12000
1/10/17 1/10/18 1/10/19 1/10/20 1/10/21
PP price movement, period 2017-2021
0
1000
2000
3000
4000
5000
6000
7000
1/10/17 1/10/18 1/10/19 1/10/20 1/10/21
LPG price movement, period 2017-2021
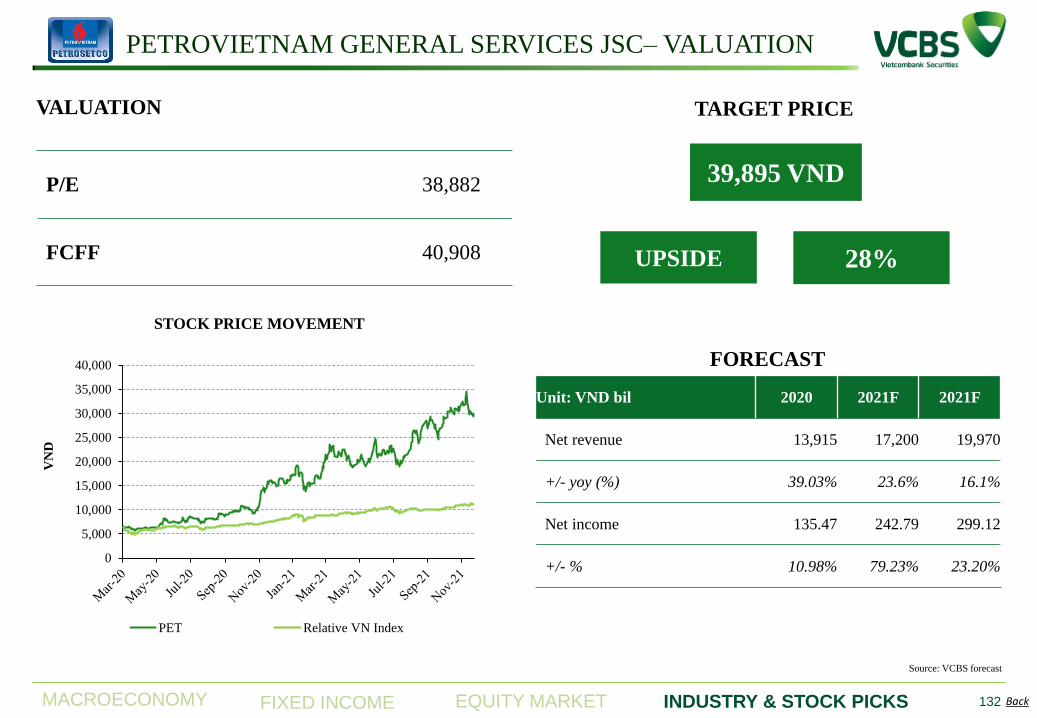
MACROECONOMY EQUITY MARKET INDUSTRY & STOCK PICKS FIXED INCOME Back 132
P/E 38,882
FCFF 40,908
FORECAST
VALUATION
39,895 VND
TARGET PRICE
28% UPSIDE
Unit: VND bil 2020 2021F 2021F
Net revenue 13,915 17,200 19,970
+/- yoy (%) 39.03% 23.6% 16.1%
Net income 135.47 242.79 299.12
+/- % 10.98% 79.23% 23.20%
Source: VCBS forecast
PETROVIETNAM GENERAL SERVICES JSC– VALUATION
0
5,000
10,000
15,000
20,000
25,000
30,000
35,000
40,000
VN
D
STOCK PRICE MOVEMENT
PET Relative VN Index
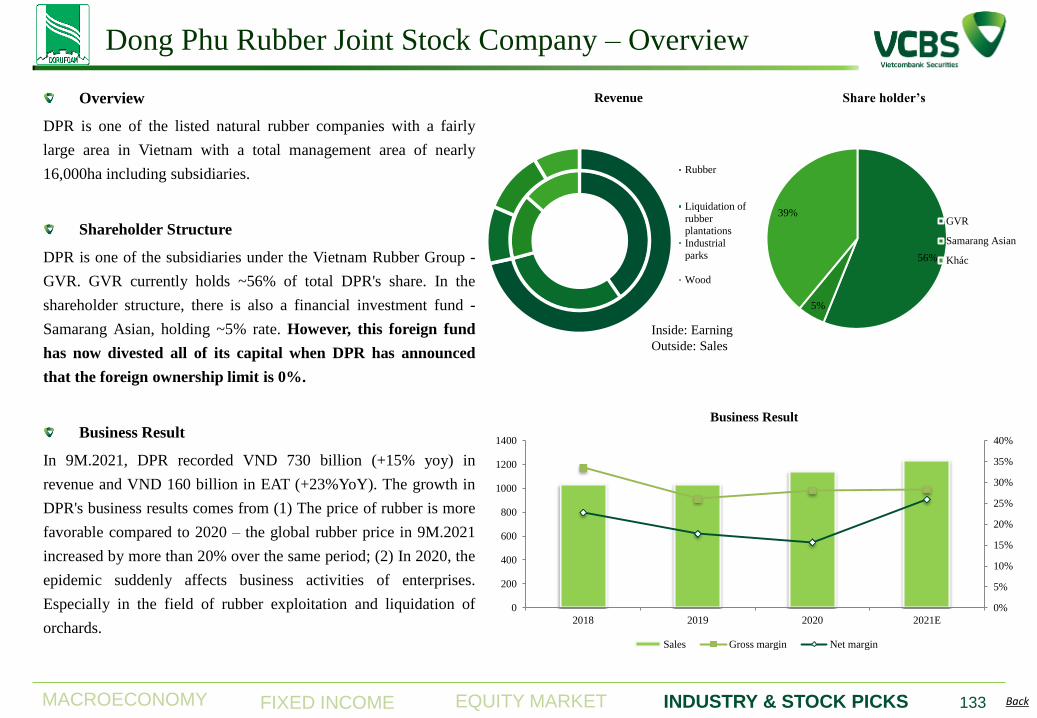
MACROECONOMY EQUITY MARKET INDUSTRY & STOCK PICKS FIXED INCOME Back
Dong Phu Rubber Joint Stock Company – Overview
133
Overview
DPR is one of the listed natural rubber companies with a fairly
large area in Vietnam with a total management area of nearly
16,000ha including subsidiaries.
Shareholder Structure
DPR is one of the subsidiaries under the Vietnam Rubber Group -
GVR. GVR currently holds ~56% of total DPR's share. In the
shareholder structure, there is also a financial investment fund -
Samarang Asian, holding ~5% rate. However, this foreign fund
has now divested all of its capital when DPR has announced
that the foreign ownership limit is 0%.
Business Result
In 9M.2021, DPR recorded VND 730 billion (+15% yoy) in
revenue and VND 160 billion in EAT (+23%YoY). The growth in
DPR's business results comes from (1) The price of rubber is more
favorable compared to 2020 – the global rubber price in 9M.2021
increased by more than 20% over the same period; (2) In 2020, the
epidemic suddenly affects business activities of enterprises.
Especially in the field of rubber exploitation and liquidation of
orchards.
Logo DN
Revenue
Rubber
Liquidation of
rubberplantations
Industrial
parks
Wood
Inside: Earning
Outside: Sales
56%
5%
39%
Share holder’s
GVR
Samarang Asian
Khác
0%
5%
10%
15%
20%
25%
30%
35%
40%
0
200
400
600
800
1000
1200
1400
2018 2019 2020 2021E
Business Result
Sales Gross margin Net margin
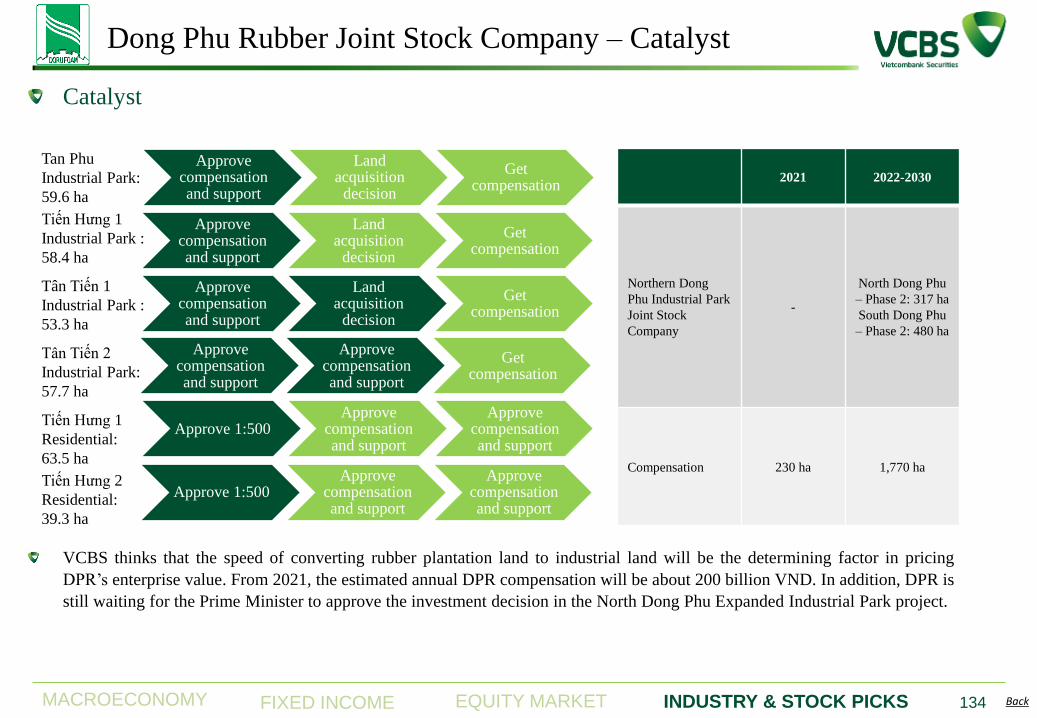
MACROECONOMY EQUITY MARKET INDUSTRY & STOCK PICKS FIXED INCOME Back 134
Catalyst
VCBS thinks that the speed of converting rubber plantation land to industrial land will be the determining factor in pricing
DPR’s enterprise value. From 2021, the estimated annual DPR compensation will be about 200 billion VND. In addition, DPR is
still waiting for the Prime Minister to approve the investment decision in the North Dong Phu Expanded Industrial Park project.
Logo DN Dong Phu Rubber Joint Stock Company – Catalyst
2021 2022-2030
Northern Dong
Phu Industrial Park
Joint Stock
Company
-
North Dong Phu
– Phase 2: 317 ha
South Dong Phu
– Phase 2: 480 ha
Compensation 230 ha 1,770 ha
Approve compensation and support
Land acquisition
decision
Get compensation
Tan Phu
Industrial Park:
59.6 ha
Tiến Hƣng 1
Industrial Park :
58.4 ha
Tân Tiến 2
Industrial Park:
57.7 ha
Tân Tiến 1
Industrial Park :
53.3 ha
Approve compensation and support
Land acquisition
decision
Get compensation
Approve compensation and support
Land acquisition
decision
Get compensation
Approve compensation and support
Approve compensation and support
Get compensation
Tiến Hƣng 1
Residential:
63.5 ha
Tiến Hƣng 2
Residential:
39.3 ha
Approve 1:500 Approve
compensation and support
Approve compensation and support
Approve 1:500 Approve
compensation and support
Approve compensation and support
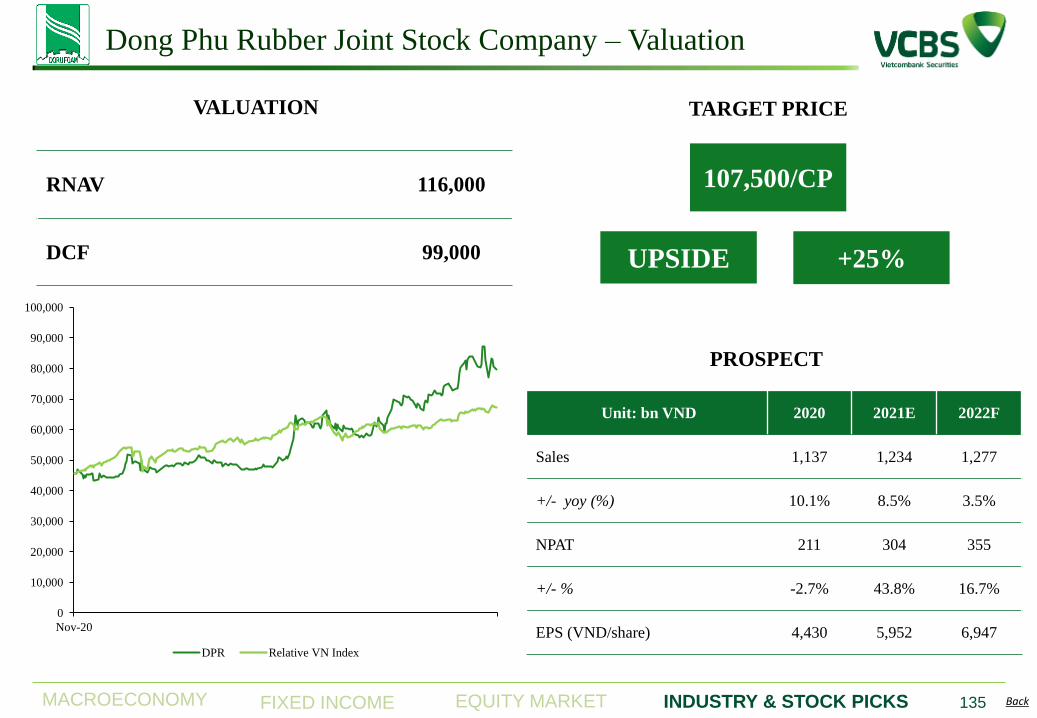
MACROECONOMY EQUITY MARKET INDUSTRY & STOCK PICKS FIXED INCOME Back 135
Logo DN
Unit: bn VND 2020 2021E 2022F
Sales 1,137 1,234 1,277
+/- yoy (%) 10.1% 8.5% 3.5%
NPAT 211 304 355
+/- % -2.7% 43.8% 16.7%
EPS (VND/share) 4,430 5,952 6,947
RNAV 116,000
DCF 99,000
PROSPECT
VALUATION
107,500/CP
TARGET PRICE
+25% UPSIDE
Dong Phu Rubber Joint Stock Company – Valuation
0
10,000
20,000
30,000
40,000
50,000
60,000
70,000
80,000
90,000
100,000
Nov-20
DPR Relative VN Index
CONTACT INFORMATION
136
Tran Minh Hoang
Head of Research
Tran Minh Hoang
Head of Research
Ly Hoang Anh Thi
Deputy Head of Research
Mac Dinh Tuan
Research manager
Le Duc Quang
Research manager
Ngo Duy Tai
Research manager
Oil & gas, fertilizers,
Chemicals
Le Thu Ha
Senior analyst
Macro & fixed income
Nguyen Hoang Minh
Senior analyst
Market strategist
Luong Van Hoan
Banking
Nguyen Thi Thuy Dung
Fishery, Consumer
goods,
Trinh Van Ha
Utilities
Dang Khanh Linh
Macro & fixed income
Hoang Tung Vu
Equity market,
commodities
Pham Hong Quan
Real estate, Seaport
Hoang Anh Tuan
Construction materials
Nguyen Dai Hiep
Real estate
Phung Thi Quynh Lien
Textile, Securities
Nguyen Nam Anh
Equity market,
Derivatives
Nguyen Hanh Linh
Banking & insurance
Nguyen Thi Thu Hang
Consumer goods,
Berverage
ntthang-
Related Documents