United States Environmental Protection Agency Air Economic Impact Analysis of the Hydrochloric Acid (HCl) Production NESHAP Final Report

Welcome message from author
This document is posted to help you gain knowledge. Please leave a comment to let me know what you think about it! Share it to your friends and learn new things together.
Transcript

8/4/2019 Economic Impact Analysis of the HCL Production NESHAP
http://slidepdf.com/reader/full/economic-impact-analysis-of-the-hcl-production-neshap 1/15
United States
Environmental ProtectionAgency
Air
Economic Impact Analysis of the
Hydrochloric Acid (HCl) Production
NESHAP
Final Report

8/4/2019 Economic Impact Analysis of the HCL Production NESHAP
http://slidepdf.com/reader/full/economic-impact-analysis-of-the-hcl-production-neshap 2/15
EPA 453/R-03-001
February 2003
Economic Impact Analysis of the Hydrochloric Acid (HCl) Production NESHAP
Final Report
By:
U.S. Office of Air Quality Planning and Standards
Air Quality Strategies and Standards Division
Integrated Strategies and Economics GroupResearch Triangle Park, North Carolina

8/4/2019 Economic Impact Analysis of the HCL Production NESHAP
http://slidepdf.com/reader/full/economic-impact-analysis-of-the-hcl-production-neshap 3/15
1 Memora ndum. Maxwe ll, B., U.S. Environmen tal Protection Agency, to Hydroc hloric Acid Production
NESHAP Docket. Final List of Facilities Poten tially Subje ct to the Hydrochloric Acid Product ion NESHAP. June 24,
2002.
3
Introduction
This regulatory action issues final national emission standards for hazardous air pollutants
(NESHAP) for hydrochloric acid (HCl) production facilities, including HCl production at fume
silica facilities. The EPA has identified these facilities as major sources of hazardous air
pollutant (HAP) emissions, primarily HCl. Hydrochloric acid is associated with a variety of
adverse health effects. These adverse health effects include chronic health disorders (e.g., effects
on the central nervous system, blood, and heart) and acute health disorders (e.g., irritation of
eyes, throat, and mucous membranes and damage to the liver and kidneys).
These final NESHAP would implement section 112(d) of the Clean Air Act (CAA) by requiring
all HCl production facilities that are major sources to meet HAP emission standards reflecting
the application of the maximum achievable control technology (MACT). The EPA estimates thatthese NESHAP would reduce nationwide emissions of HCl by approximately 1,155 tons per year
(tpy). This amount of reduction is 46 percent of the baseline HCl emissions estimate of 2,510
tpy. The EPA also estimates that these NESHAP would reduce nationwide emissions of chlorine
(Cl) by approximately 430 tpy. This amount of reduction is 61 percent of the baseline HCl
emissions estimate of 700 tpy.
There are 65 HCl facilities that will be subject to this final rule, according to the estimates
prepared by the Agency.1 The production processes that this NESHAP will affect are processes
that routes a gaseous stream that contains HCl to an absorber, thereby creating a liquid HCl
product. Among these various processes are:
C organic and inorganic chemical manufacturing processes that produce HCl as a by-
product;
C the reaction of salts and sulfuric acid (Mannheim process);
C the reaction of a salt, sulfur dioxide, oxygen, and water (Hargreaves process);
C the combustion of chlorinated organic compounds;
C the direct synthesis of HCl through the burning of chlorine in the presence of hydrogen;
and
C fume silica production, including combustion of silicon tetrachloride in hydrogen-oxygen
furnaces.

8/4/2019 Economic Impact Analysis of the HCL Production NESHAP
http://slidepdf.com/reader/full/economic-impact-analysis-of-the-hcl-production-neshap 4/15
4
It is important to note that most HCl production is as a by-product of other processes such as
aliphatic and aromatic hydrocarbon chlorinations, the phosgenation of amines for isocyanates,
and halogenations for making chlorofluorocarbons. Only about 5 percent of HCl is produced as
primary product.
The fume silica sources affected by this final rule include any facility engaged in the productionof fume silica. Fume silica is a fine white powder used as a thickener or reinforcing agent in
inks, resins, rubber, paints, and cosmetics. Emissions of HCl and chlorine are the primary HAPs
released from fume silica production facilities and result from the HCl recovery/production
system. Because the largest HAP emission source at fume silica facilities is related to the HClrecovery/production system, we decided to combine fume silica sources and HCl production
sources under this final rule.
Background for Economic Impact Analysis
The Agency has prepared an economic impact analysis in support of this final NESHAP. Thelegal authority for this analysis is Section 317 of the CAA. As part of this analysis, the Agency
has prepared a small business analysis in order to comply with the Regulatory Flexibility Act
(RFA), as amended by the Small Business Regulatory Enforcement Fairness Act (SBREFA).
This economic impact analysis presents a short profile of the industries affected by this rule, a
short look at the firms that will be affected by this rule, and the impacts to these firms and their
consumers from implementation of the rule.
Table 1 lists the three industries that will be affected by the requirements of this final rule.
Table 1. Affected Industries
Category SICa NAICSb Name of industry
Industry 2819
2821
2869
325188
325211
325199
All Other Basic Inorganic Manufacturing
Plastic Materials, and Resin Manufacturing
All Other Basic Organic Manufacturing
a Standard Industrial Classification
b North American Industrial Classification System

8/4/2019 Economic Impact Analysis of the HCL Production NESHAP
http://slidepdf.com/reader/full/economic-impact-analysis-of-the-hcl-production-neshap 5/15
2 U.S. Department of the Commerce: Bureau of the Census, International Trade Association. Found on the
Internet at www.ita.doc.gov/td/industry/otea/usito98/tables_naics. Downloaded on September 7, 2001.
3U.S. Department of Commerce, Bureau of the Census. Current Industrial Reports, Series MA28A(97),
September, 1998.
5
These industries are all large with a substantial number of firms and employees that make up
their operations. Table 2 contains estimates of total employees and the value of shipments for
these industries as a whole.2
Production of HCl is but a small portion of output and activity in these industries. While the
production of output reaches many millions of tons for each of these industries, the total
Table 2
Value of Shipments and Employment Data on Affected Industries
(Millions of 1997 Dollars)
Industry Value of shipments Percentage
change from
1997 to 1999
Total employment
(thousands)
Percentage
change from
1997 to 1999
1997 1998 1999 1997 1998 1999
NAICS325188
17,275 22,760 23,279 34.7 53.4 56.2 53.8 1.2
NAICS
325199
52,405 48,989 47,151 -10.0 88.2 86.9 81.2 7.9
NAICS
325211
45,226 49,176 48,024 6.2 61.6 62.8 58.5 5.0
production from the U.S. HCl industry is roughly 4.2 million tons/year as of 1997. Most of the
production is captive capacity; that is, the HCl is produced as an intermediate product to be used
in final output. Given that about 5 percent of HCl produced in the U.S. is as primary product,
this means that only about 200,000 tons of primary HCl output is generated in a typical year.
The use of HCl in the production of other chemicals is the major way in which HCl is used in the
U.S. Thirty percent of HCl produced in the U.S. goes into production of other chemicals. The
next most common uses of HCl are steel pickling (20 percent), oil well acidizing (19 percent),
and food processing (17 percent). Other uses for HCl include semiconductor production and
regeneration of ion-exchange resins for water treatment.
The U.S. imports and exports very little HCl. In 1997, the U.S. imported 85,000 tons of HCl, or
only 2 percent of U.S. capacity. During that same year, the U.S. exported 60,000 tons of HCl, or
only 1.5 percent of U.S. production capacity.3 Hence, the U.S. imports as much or more HCl as

8/4/2019 Economic Impact Analysis of the HCL Production NESHAP
http://slidepdf.com/reader/full/economic-impact-analysis-of-the-hcl-production-neshap 6/15
4Chemical News and Intelligence, ChemExpo Chemical Profile: Hydrochloric Acid. November 22, 1999.
www.chemexpo.com/news/PROFILE991122.cfm.
5Memo randum. Deering , A. and Norwood, P., EC/R, Incorporated, to Maxwel l, B., U.S. Environmental
Prote ction Agency. Baseline Conditions and MACT Floor Impacts for Final Hydrochloric Acid Pro duction NESHAP .
July 2, 2002.
6
it exports, but the trade balance is negligible compared to the output consumed within the U.S.
Most of this trade is with Canada.
The growth in U.S. HCl production averaged about 4.2 percent per year from 1993 to 1998.
Growth has averaged roughly 3 percent per year from 1985 through 1998, so there has been some
increase in production growth in the decade of the 1990's.4
Prices for HCl have increasedconsiderably from 1992 to 1998. These prices generally ranged from $40/ton to $57/ton in 1992
and 1993, but rose to over $90/ton in 1998 due to railroad disruptions that occurred late in 1997
and continued into 1998. Projected growth is expected to be about 2.5 percent per year through
2003, though this amount could be an underestimate if continued strength in oil drilling leads to
additional demand for HCl.
Costs of the Final Rule
The estimated annual costs of the final rule are $5.9 million in 1999 dollars. These costs include
not only the costs of control but also those associated with monitoring, recordkeeping, andreporting. In fact, the costs of monitoring, recordkeeping, and reporting are $4.18 million, or 71
percent of the annual costs. The capital costs are estimated at $12.36 million. The costs are
estimated using ten model plants that are considered representative of the sources they are
applied to. The data taken to develop the linkage between the model plants and the actual
facilities are based on facility information taken from EPA permit applications and assumptions
of the applicability of control equipment. Estimates of what each of these 65 plants must do to
meet the final rule, which is the MACT floor, are listed in Table 4. The costs for each of the ten
model plants are in Table 5. The annual costs associated with each of these model facilities
includes annualized capital costs for control and monitoring equipment, annual operating and
maintenance (O&M) costs for control and monitoring equipment, and labor and O&M costs
associated with reporting and recordkeeping (R&R) requirements associated with the MACTfloor regulatory alternative.5
The equipment costs include annualized capital as well as O&M and were obtained from
calculations performed to estimate regulatory alternative impacts that are available in the docket.
The annual R&R costs were calculated using the template used to calculate annual R&R burden
in the Information Collection Request for HCl Production. The costs for the 4th year after
promulgation, which is the first year after the compliance date for existing sources, were
calculated for a single facility.

8/4/2019 Economic Impact Analysis of the HCL Production NESHAP
http://slidepdf.com/reader/full/economic-impact-analysis-of-the-hcl-production-neshap 7/15
7
In summary, the annual cost per facility for complying with the final MACT for HCl Production
ranges from $64,348 to $169,538.
As can be seen in Table 3, sources at 41 facilities, or 63 percent of the total, will have to install a
new water or caustic scrubber to meet the MACT floor requirements. As seen above, the costs
for any one facility should be no higher than $169,538 (in 1999 dollars).
Table 3. Model Facility Actions Needed To Comply With MACT Floor Alternative
Model
facility
#
Equipment needed to comply with MACT floor alternative
# of
FacilitiesProcess vents (PV) Storage tanks (ST) Transfer operations (TO)
Control
equipment
Monitoring
equipment?
Control
equipment
Monitoring
equipment?
Control
equipment
Monitoring
equipment?
1 None Yes None Yes None Yes 8
2 None Yes None Yes Scrubber Yes 5
3 Scrubber Yes Scrubber Yes Scrubber Yes 3
4 None Yes Scrubber Yes No TO No 7
5 None Yes No ST No No TO No 13
6 Scrubber Yes Scrubber Yes No TO No 8
7 Scrubber Yes No ST No No TO No 5
8 No PV No Scrubber Yes No TO No 6
9 No PV No None Yes No TO No 3
10 No PV No Scrubber Yes No TO No 7
Table 4. Annual Costs For Each Model Facility
Model facility
#
Annual costs per facility (1999$)
PV Equipment ST Equipment TO Equipment R&R Labor and
O&M
Total
1 $1,212 $1,212 $1,212 $64,348 $67,984
2 $1,212 $1,212 $6,383 $64,348 $73,155
3 $92,424 $6,383 $6,383 $64,348 $169,538
4 $1,212 $6,383 $0 $64,348 $71,943
5 $1,212 $0 $0 $64,348 $65,560

8/4/2019 Economic Impact Analysis of the HCL Production NESHAP
http://slidepdf.com/reader/full/economic-impact-analysis-of-the-hcl-production-neshap 8/15
8
6 $92,424 $6,383 $0 $64,348 $163,155
7 $92,424 $0 $0 $64,348 $156,772
8 $0 $6,383 $0 $64,348 $70,731
9 $0 $1,212 $0 $64,348 $65,560
10 $0 $0 $0 $64,348 $64,348
The annual costs shown in Table 4 can be considered reasonable representations of potentialfacility-level cost impacts associated with the MACT floor level of control. Appendix A
provides more specific information on the representation of facilities in the HCl cost analysis.
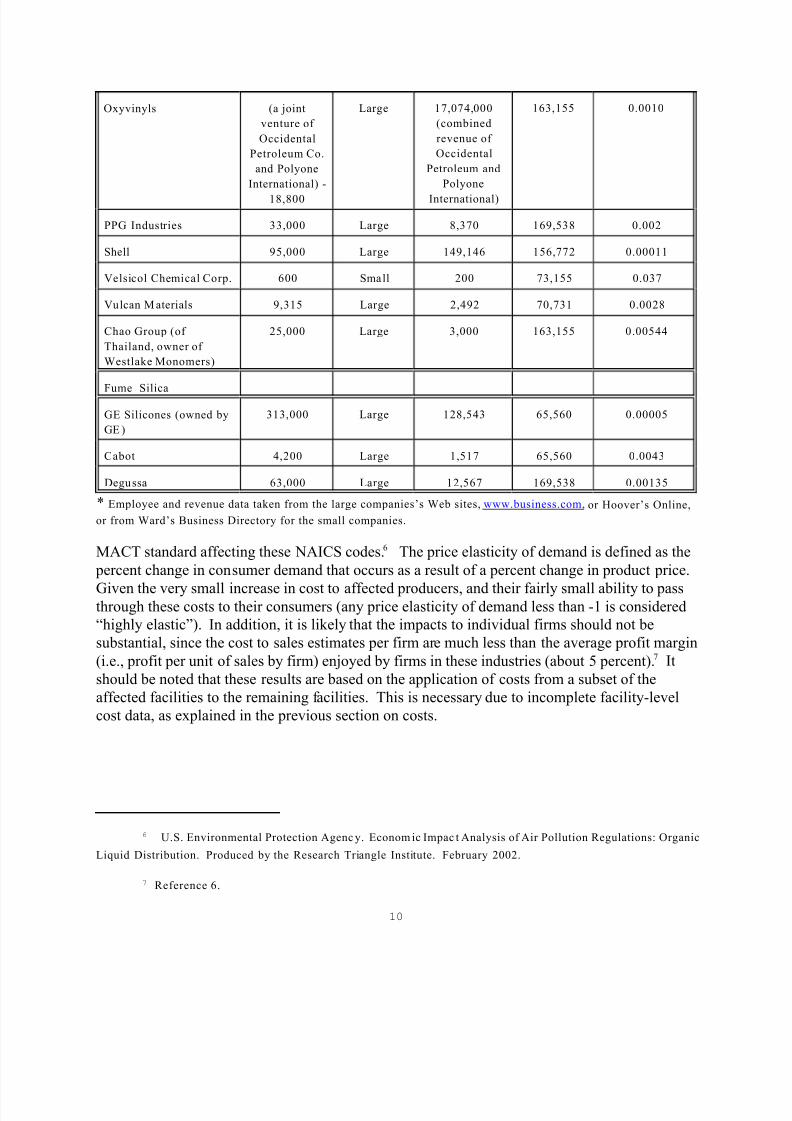
Cost and Economic Impact Results
Table 5 lists the compliance (control, monitoring, and R&R) costs of the MACT floor regulatory
alternative per affected parent company, and these costs as a percentage of the parentcompanies’s revenues. All data below are based on 1999 statistics, unless more recent data are
available.
The economic impact analysis, which is essentially a comparison of compliance costs for the
affected parent firms with their revenues, shows that the estimated costs associated with the
MACT floor option are no more than 1.0 percent of the revenues for any of the 33 affected firms.
It is important to note that most of the companies and facilities affected by this standard are large
U.S. companies or subsidiaries of large multinational companies. It is likely that the expected
reduction in affected HCl and fume silica output is no more than 0.0015 percent or less from that
industry, since the overall compliance costs are less than 0.001 percent of the revenues for the
affected parent firms, and a price elasticity of demand of -1.5 that is applicable to NAICS 325199and 325211 as prepared for another economic analysis done for a recently proposed
Table 5.
Economic Impacts for Parent Companies Affected by
the Final HCl/Fume Silica MACT*
Parent company Number of
employees
Large or
small
business?
Revenues
(million 1999$
unless stated
differently)
Annual
compliance
costs
(1999$)
Compliance
costs/revenues
(% )
Arch Chemicals 3,500 Large 900 67,984 0.0008
Ausimont USA
(subsidiary of
Montedison Group)
33,049 Large 11,266 (2000) 163,155 0.00145
Aventis CropScience 92,500 Large 20,021 70,731 0.0004

8/4/2019 Economic Impact Analysis of the HCL Production NESHAP
http://slidepdf.com/reader/full/economic-impact-analysis-of-the-hcl-production-neshap 9/15
9
BASF Corp. 100,000 Large 32,226 (2000) 67,984 0.00021
CIBA-GEIGY Corp.
(subsidiary of Novartis)
69,000 Large 17,200 156,772 0.0009
Crompton Corp. 8,300 Large 3,038 65,560 0.0020
Detrex Corp. 353 Small 96 71,943 0.08
Dover Chemical Corp.
(subsidiary of ICC
Industries Corp.)
3,200 Large 1,500 64,348 0.0043
Dow Chemical 41,943 Large 23,008 65,560 0.00029
DuPont 93,000 Large 28,268 169,538 0.0006
Elf Atochem (subsidiary
of TotalFinaElf)
127,252 Large 67,352 163,155 0.00024
Ferro Corp. 6,700 Large 1,360 70,731 0.0052
FMC Corp. 15,000 Large 3,900 67,984 0.0017
General Electric Co. 313,000 Large 129,500 318,927 0.00025
Honeywell Corp. 125,000 Large 23,735 163,155 0.0007
Huntsman Corp. 14,000 Large 7,000 65,560 0.00094
ICI Americas (part of
ICI Corp.)
45,130 Large 8,592 73,155 0.0085
Jones-Hamilton Co. 81 Small 27 67,984 0.25
Louisiana Pigment Co.
(owned by NL
Industries)
2,500 Large 908 70,731 0.008
MDA M anufacturing
(owned by Daitkin
Products, Inc.)
14,000 Large 3,799 163,155 0.00452
Metachem Products 110 Small 30 156,772 0.523
Miles Bayer (owned by
the Bayer Group)
120,400 Large 27,320 65,560 0.00024
Monsanto Co. 14,700 Large 5,500 67,984 0.00124
Occidental Chemical Co.
(owned by Occidental
Petroleum Co.)
8,800 Large 13,574 73,155 0.00054
Oxymar (owned by
Occidental Petroleum
Co. and Marubeni Co.)
13,851 Large 73,000 156,772 0.00021
8/4/2019 Economic Impact Analysis of the HCL Production NESHAP
http://slidepdf.com/reader/full/economic-impact-analysis-of-the-hcl-production-neshap 10/15
6 U.S. Environmental Protection Agenc y. Econom ic Impac t Analysis of Air Pollution Regulations: Organic
Liquid Distribution. Produced by the Research Triangle Institute. February 2002.
7 Reference 6.
10
Oxyvinyls (a joint
venture of
Occidental
Petroleum Co.
and Polyone
International) -
18,800
Large 17,074,000
(combined
revenue of
Occidental
Petroleum and
Polyone
International)
163,155 0.0010
PPG Industries 33,000 Large 8,370 169,538 0.002
Shell 95,000 Large 149,146 156,772 0.00011
Velsicol Chemical Corp. 600 Small 200 73,155 0.037
Vulcan M aterials 9,315 Large 2,492 70,731 0.0028
Chao Group (of
Thailand, owner of
Westlake Monomers)
25,000 Large 3,000 163,155 0.00544
Fume Silica
GE Silicones (owned by
GE )
313,000 Large 128,543 65,560 0.00005
Cabot 4,200 Large 1,517 65,560 0.0043
Degussa 63,000 Large 12,567 169,538 0.00135
* Employee and revenue data taken from the large companies’s Web sites, www.business.com, or Hoover’s Online,
or from Ward’s Business Directory for the small companies.
MACT standard affecting these NAICS codes.6 The price elasticity of demand is defined as the
percent change in consumer demand that occurs as a result of a percent change in product price.
Given the very small increase in cost to affected producers, and their fairly small ability to passthrough these costs to their consumers (any price elasticity of demand less than -1 is considered“highly elastic”). In addition, it is likely that the impacts to individual firms should not be
substantial, since the cost to sales estimates per firm are much less than the average profit margin
(i.e., profit per unit of sales by firm) enjoyed by firms in these industries (about 5 percent).7 It
should be noted that these results are based on the application of costs from a subset of the
affected facilities to the remaining facilities. This is necessary due to incomplete facility-level
cost data, as explained in the previous section on costs.
8/4/2019 Economic Impact Analysis of the HCL Production NESHAP
http://slidepdf.com/reader/full/economic-impact-analysis-of-the-hcl-production-neshap 11/15
8 Small Business Administration, Washington, D.C. Found on the Internet at www.sba.gov/size.
11
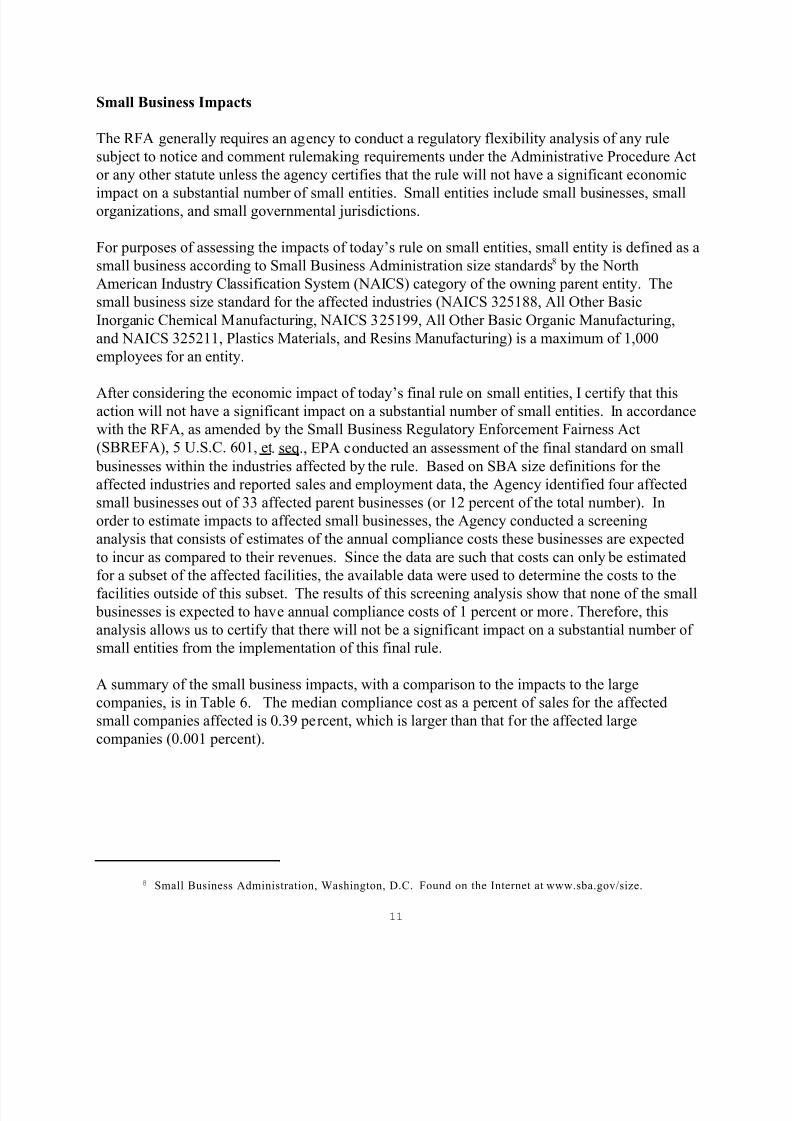
Small Business Impacts
The RFA generally requires an agency to conduct a regulatory flexibility analysis of any rule
subject to notice and comment rulemaking requirements under the Administrative Procedure Act
or any other statute unless the agency certifies that the rule will not have a significant economic
impact on a substantial number of small entities. Small entities include small businesses, smallorganizations, and small governmental jurisdictions.
For purposes of assessing the impacts of today’s rule on small entities, small entity is defined as a
small business according to Small Business Administration size standards8 by the North
American Industry Classification System (NAICS) category of the owning parent entity. The
small business size standard for the affected industries (NAICS 325188, All Other Basic
Inorganic Chemical Manufacturing, NAICS 325199, All Other Basic Organic Manufacturing,
and NAICS 325211, Plastics Materials, and Resins Manufacturing) is a maximum of 1,000
employees for an entity.
After considering the economic impact of today’s final rule on small entities, I certify that thisaction will not have a significant impact on a substantial number of small entities. In accordance
with the RFA, as amended by the Small Business Regulatory Enforcement Fairness Act
(SBREFA), 5 U.S.C. 601, et. seq., EPA conducted an assessment of the final standard on small
businesses within the industries affected by the rule. Based on SBA size definitions for the
affected industries and reported sales and employment data, the Agency identified four affected
small businesses out of 33 affected parent businesses (or 12 percent of the total number). In
order to estimate impacts to affected small businesses, the Agency conducted a screening
analysis that consists of estimates of the annual compliance costs these businesses are expected
to incur as compared to their revenues. Since the data are such that costs can only be estimated
for a subset of the affected facilities, the available data were used to determine the costs to the
facilities outside of this subset. The results of this screening analysis show that none of the small businesses is expected to have annual compliance costs of 1 percent or more. Therefore, this
analysis allows us to certify that there will not be a significant impact on a substantial number of
small entities from the implementation of this final rule.
A summary of the small business impacts, with a comparison to the impacts to the large
companies, is in Table 6. The median compliance cost as a percent of sales for the affected
small companies affected is 0.39 percent, which is larger than that for the affected large
companies (0.001 percent).

8/4/2019 Economic Impact Analysis of the HCL Production NESHAP
http://slidepdf.com/reader/full/economic-impact-analysis-of-the-hcl-production-neshap 12/15
12
Table 6
Summary of Small Business Impacts for HCl Production and Fume Silica
MACT Floor Option
Total number of companies 33
Total number of small companies 4
Total number of large companies 29
Average annual compliance cost per small company
(in 1999 dollars)
$92,463
Average annual compliance cost per large company
(in 1999 dollars)
$118,471
Compa rison of compliance costs to sales
Compliance costs of <1% of sales Small: 4 Share: 100%
Large: 29 Share: 100%
Compliance costs of >1% of sales Small: 0 Share: 0%
Large: 0 Share: 0%
Compliance cost to sales: Statistics (%) Average: 0.0288
For Small: 0.220
For Large: 0.0021
Median: 0.00145
For Small:0.165
For Large: 0.001
Maximum: 0.523
For Small: 0.523
For Large: 0.0085
Minimum: 0.0001
For Small: 0.037
For Large: 0.00005

8/4/2019 Economic Impact Analysis of the HCL Production NESHAP
http://slidepdf.com/reader/full/economic-impact-analysis-of-the-hcl-production-neshap 13/15
Appendix A
Summary of Representation of Actual Facilities in
HCl Production NESHAP Cost Analysis

8/4/2019 Economic Impact Analysis of the HCL Production NESHAP
http://slidepdf.com/reader/full/economic-impact-analysis-of-the-hcl-production-neshap 14/15
14
Summary of Representation of Actual Facilities in the HCl Production Impacts Analysis
Number of facilities
in MACT Floor
Data Set
Assumed
controls needed
Plant Names
No process vents 4 DuPont, KY; LaRoche, LA; PPG, WV; Vista, LA
Process vents 12
99+% 9 None Allied Signal, LA; Bayer, WV; Degussa, NY; Dow, LA;a DuPont, LA; DuPont, WV; Formosa,
TX; Georgia Gulf, LA; Louisiana Pigment
95% 3 New scrubber Dow, LA;a DuPont Dow, LA; Shell, LA
No storage tanks 6 Bayer, WV; Degussa, NY; DuPont, LA; Formosa, TX; Georgia Gulf, LA; Shell, LA;
Storage tanks 10
99+% 4 None Dow, LA;a DuPont, KY; PPG, WV; DuPont, WV
95% 3
New scrubber
Allied Signal, LA; DuPont Dow, LA; Vista, LA
0% 3 New scrubber Louisiana Pigment; Dow, LAa; LaRoche, LA
No transfer operations 12 Allied Signal,LA; Bayer, WV; Degussa, NY; Dow, LA; a DuPont, LA; DuPont Dow, LA;
DuPont, WV; Georgia Gulf, LA; LaRoche, LA; Louisiana Pigment; PPG, WV; Vista, LA
Transfer operations 4
99+% 2 None DuPont, KY; Formosa, TX
95% 1 Scrubber
Scrubber
Dow, LAa
0% 1
Scrubber
Shell, LA
a There are two facilities at this plant site. For process vents and storage tanks, the two facilities control at different levels. Only one of the two facilities has a
transfer operation.
8/4/2019 Economic Impact Analysis of the HCL Production NESHAP
http://slidepdf.com/reader/full/economic-impact-analysis-of-the-hcl-production-neshap 15/15
15
TECHNICAL REPORT DATA(Please read Instructions on reverse before completing)
1. REPORT NO.
EPA-452/R-03-0012. 3. RECIPIENT'S ACCESSION NO.
4. TITLE AND SUBTITLE
Economic Impact Analysis of the Hydrochloric Acid Production
NESHAP
5. REPORT DATE
February 2003
6. PERFORMING ORGANIZATION CODE
7. AUTHOR(S)
8. PERFORMING ORGANIZATION REPORT NO.
9. PERFORMING ORGANIZATION NAME AND ADDRESS
U.S. Environmental Protection Agency
Office of Air Quality Planning and Standards
Air Quality Strategies and Standards Division
Research Triangle Park, NC 27711
10. PROGRAM ELEMENT NO.
11. CONTRACT/GRANT NO.
12. SPONSORING AGENCY NAME AND ADDRESS
DirectorOffice of Air Quality Planning and Standards
Office of Air and RadiationU.S. Environmental Protection Agency
Research Triangle Park, NC 27711
13. TYPE OF REPORT AND PERIOD COVERED
14. SPONSORING AGENCY CODE
EPA/200/04
15. SUPPLEMENTARY NOTES
16. ABSTRACT
This document is an economic impact analysis for the industries and other entities subject to theHydrochloric Acid Production National Emission Standards for Hazardous Air Pollutants (NESHAP).
The analysis shows price and production changes for affected entities as a result of incurring the costs
of this rule, and provides some financial data for those entities and the industries they are in.
`17. KEY WORDS AND DOCUMENT ANALYSIS
a. DESCRIPTORS b. IDENTIFIERS/OPEN ENDED TERMS c. COSATI Field/Group
Control Costs
Industry Profile
Economic Impacts
Air Pollution control
18. DISTRIBUTION STATEMENT
Release Unlimited
19. SECURITY CLASS (Report)
Unclassified
21. NO. OF PAGES
1520. SECURITY CLASS (Page)
Unclassified22. PRICE
EPA Form 2220-1 (Rev. 4-77) PREVIOUS EDITION IS OBSOLETE
Related Documents