Economic Dynamics and Integration in Eastern Europe and Asia Lecture Winter semester 2017/18 Chair for Macroeconomic Theory and Politics Schumpeter School of Business and Economics Bergische Universität Wuppertal

Welcome message from author
This document is posted to help you gain knowledge. Please leave a comment to let me know what you think about it! Share it to your friends and learn new things together.
Transcript

Economic Dynamics and Integration in Eastern Europe and
Asia
LectureWinter semester 2017/18
Chair for Macroeconomic Theory and PoliticsSchumpeter School of Business and Economics
Bergische Universität Wuppertal

Prof. Paul J.J. Welfens
• Office: M-12.08
• Email: [email protected]
• Office hours: Monday 12:00-13:00 (During Semester)
Thursday 11:00-12:00 (During Semester break) at EIIW
• Chair for Macroeconomic Theory and Politics:
https://welfens.wiwi.uni-wuppertal.de/index.php?id=3314&L=0
11. 12. 2017 2

David Hanrahan
• Office: M-12.10
• Email: [email protected]
• Office hours: by appointment
• Chair for Macroeconomic Theory and Politics:
https://welfens.wiwi.uni-wuppertal.de/index.php?id=6194
311. 12. 2017

Tian Xiong
• Office: M-12.11
• Email: [email protected]
• Office hours: Tuesday 14:00-15:00
• Chair for Macroeconomic Theory and Politics:
https://welfens.wiwi.uni-wuppertal.de/index.php?id=6011
11. 12. 2017 4

•Economic Integration of Asia
▪Trade and investment
▪Money and Finance
▪ Infrastructure and Connectivity
▪Movement of People
▪ Institutional and Social Integration
Content
11. 12. 2017 5

Economic Integration of Asia
611. 12. 2017
Notes: For each region, maximum (upper line), average (dot), and minimum (lower line) values of
the overall index are reported. The horizontal line denotes global average of 0.484.
Source: ADB calculations using updated data from Huh and Park (2017)
RCI in Asia is behind the European Union, ranks above both Africa and Latin America.
Asia-Pacific Regional Cooperation and
Integration by Sub-regions

Within the region, RCI is most advanced in East Asia and Southeast Asia, drawing on the expansion of regional trade and FDI networks linked to global supply chains.
Economic Integration of Asia
711. 12. 2017
Notes: For each region, maximum (upper line), average (dot), and minimum (lower line) values of
the overall index are reported. The horizontal line denotes global average of 0.484.
Source: ADB calculations using updated data from Huh and Park (2017)
Regional Integration Indicators—Asia

Illustration
811. 12. 2017

Economic Integration of Asia
911. 12. 2017
Regional Integration Indicators—Asia
Source: ADB calculations using data from ASEAN Secretariat; Asia Regional Integration Centre,
Asian Development Bank; CEIC; International Monetary Fund

Trade
1011. 12. 2017PRC = People’s Republic of China
Source: ADB calculations using data from WTOs
Asia’s Trade Volume Growth

Trade
1111. 12. 2017
The Trade Value of Asia and the World
Source: ADB calculations using data from WTOs

Trade
1211. 12. 2017
Intraregional Trade Share_ Asia, European Union, North America (%)
Asia Trade Value Growth, Intraregional and Extraregional (%)
Source: ADB calculations using data from IMF

1311. 12. 2017
Asia Trade Value Growth, Intraregional and Extraregional (%)
Source: ADB calculations using data from IMF

• Trade intensity is the ratio of the trading partner j‘s share to a country/region i, and the share of world trade with the same trading partner.
• Trade intensity (AND trade bias) is an alternative to measure the level of trade integration.
• An intra-regional trade share is a common indicator that measures the level of trade integration.
• However, this indicator is not appropriate for trend analysis or cross-regionals comparison.
• WHY ?
• Because intra-regional share tend to be higher for a region that consists of large economies
Illustration
1411. 12. 2017

• How to calculate trade intensity?
• Region i‘s intraregional trade share = Tii / Ti
• Region i‘s intraregional trade intensity = (Tii / Ti)/(Ti / TW)
• Region i‘s trade bias toward region j = (Tij / Ti)/(Tj / TW)
• Where:
• Tii : exports of region i to region i plus import of region i from region i
• Tij : exports of region i to region j plus export of region j from region iplus imports of region i from region j plus import of region j from region i
• Ti : total exports of region i to the world plus total import of region ifrom the world Tj : total exports of region j to the world plus total import of region j from the world Tw: total world exports plus imports
Illustration
1511. 12. 2017
Trade
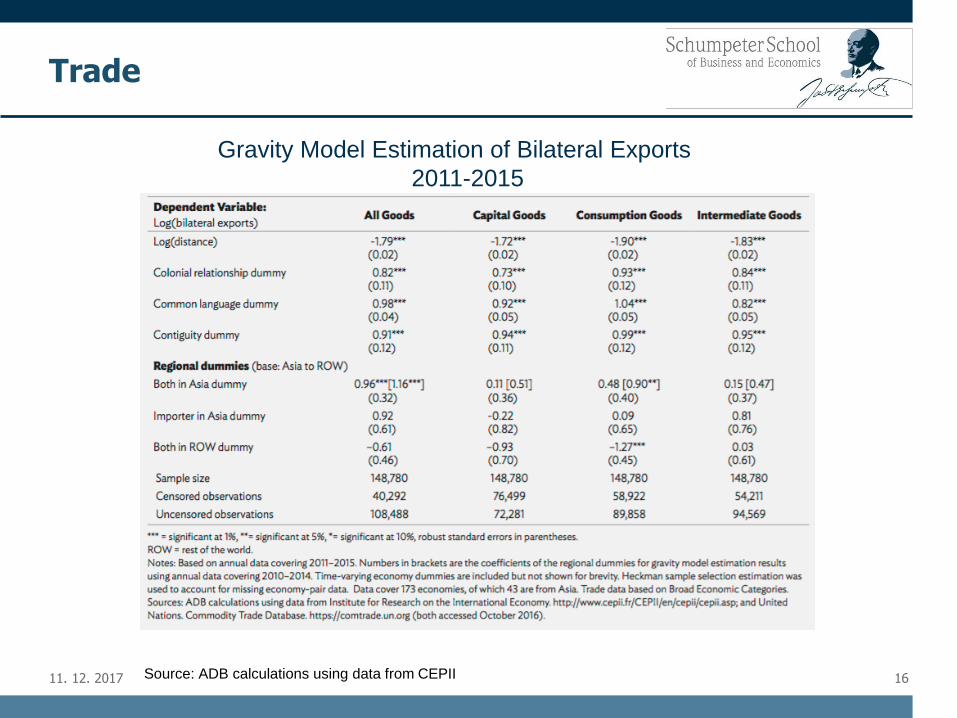
1611. 12. 2017
Gravity Model Estimation of Bilateral Exports
2011-2015
Source: ADB calculations using data from CEPII

Trade
1711. 12. 2017
Gravity Model Estimation of Bilateral Exports
2012-2016
Source: ADB calculations using data from CEPII

Trade
1811. 12. 2017
Gravity Model Estimation Results, 2012-2016:
Intra- and Inter-subregional Trade (All Goods)
Source: ADB calculations using data from CEPII
Notes: Base category (benchmark) is the subregion’s trade with economies outside Asia. The usual gravity model variables and
time-varying economy dummies are included but not shown for brevity. Heckman sample selection estimation was used to account
for missing bilateral economy-pair data.

Regional Trade Policy
1911. 12. 2017 Source: ADB. Asia Regional Integration Centre FAT database
Number of Newly Effective FTAs
Asia and World

Regional Trade Policy
2011. 12. 2017 Source: ADB. Asia Regional Integration Centre FAT database
Number of Signed FTAs, Intraregional and
Extraregional (cumulative since 2000)

Regional Trade Policy
2111. 12. 2017
Number of FTAs Proposed and Signed by Years
Asia
Source: ADB. Asia Regional Integration Centre FAT database

Investment
2211. 12. 2017
Asia’s FDI flows ($ billion)
Source: ADB calculations using data from Financial Times. fDi Markets; and Bureau van Dijk. Zephyr M&A Database

Investment
2311. 12. 2017
Global Outward FDI by Source ($ trillion)
Source: ADB calculations using data from Financial Times. fDi Markets; and Bureau van Dijk. Zephyr M&A Database

Investment
2411. 12. 2017
Regional FDI Flows Share (%)
Source: ADB calculations using data from Association of Southeast Nations Secretariat;
CEIC; Eurostat. Balance of Payments.

Investment
2511. 12. 2017 Source: ADB calculations using data from Financial Times. fDi Markets; and Bureau van Dijk. Zephyr M&A Database
Intraregional FDI Inflows

Investment
2611. 12. 2017
Asian Outward FDI Flows by Source ($billion)
Source: ADB calculations using data from Association of Southeast Nations Secretariat;
CEIC; Eurostat. Balance of Payments.

Investment
2711. 12. 2017 Source: ADB calculations using data from Financial Times. fDi Markets; and Bureau van Dijk. Zephyr M&A Database
Intra-Asia FDI by Sector ($ billion)

Investment
2811. 12. 2017
Inter-Asia FDI by Sector ($ billion)
Source: ADB calculations using data from Financial Times. fDi Markets; and Bureau van Dijk. Zephyr M&A Database

Thank You
for
Your Attention!
11. 12. 2017 29
Related Documents