WJAA #389456, VOL 21, ISS 2 Economic and Risk Analysis of Tilapia Production in Kenya IVANO NEIRA, CAROLE R. ENGLE, and CHARLES NGUGI QUERY SHEET This page lists questions we have about your paper. The numbers displayed at left can be found in the text of the paper for reference. In addition, please review your paper as a whole for correctness. Q1: Au: See note in reference. What fisheries dept. is this? Nairobi? Kenya? Q2: Au: Reference unclear. Is this an article? What is the article’s title? Publisher? Please revise according to Chicago style. Q3: Au: Change OK? What fisheries department is this? Kenya or Nairobi? Please clarify Q4: Au: Publisher? TABLE OF CONTENTS LISTING The table of contents for the journal will list your paper exactly as it appears below: Economic and Risk Analysis of Tilapia Production in Kenya Ivano Neira, Carole R. Engle, and Charles Ngugi

Welcome message from author
This document is posted to help you gain knowledge. Please leave a comment to let me know what you think about it! Share it to your friends and learn new things together.
Transcript
WJAA #389456, VOL 21, ISS 2
Economic and Risk Analysis of Tilapia Production in Kenya
IVANO NEIRA, CAROLE R. ENGLE, and CHARLES NGUGI
QUERY SHEET
This page lists questions we have about your paper. The numbers displayed at leftcan be found in the text of the paper for reference. In addition, please review yourpaper as a whole for correctness.
Q1: Au: See note in reference. What fisheries dept. is this? Nairobi? Kenya?Q2: Au: Reference unclear. Is this an article? What is the article’s title?
Publisher? Please revise according to Chicago style.Q3: Au: Change OK? What fisheries department is this? Kenya or Nairobi?
Please clarifyQ4: Au: Publisher?
TABLE OF CONTENTS LISTING
The table of contents for the journal will list your paper exactly as it appears below:
Economic and Risk Analysis of Tilapia Production in KenyaIvano Neira, Carole R. Engle, and Charles Ngugi

1
Journal of Applied Aquaculture, 21:1–23, 2009Copyright © Taylor & Francis Group, LLC ISSN: 1045-4438 print/1545-0805 onlineDOI: 10.1080/10454430902892842
WJAA1045-44381545-0805Journal of Applied Aquaculture, Vol. 21, No. 2, April 2009: pp. 1–43Journal of Applied Aquaculture
Economic and Risk Analysis of Tilapia Production in Kenya
Tilapia Production in KenyaI. Neira et al.
IVANO NEIRA1, CAROLE R. ENGLE1, and CHARLES NGUGI21Aquaculture/Fisheries Center, University of Arkansas at Pine Bluff,
Pine Bluff, Arkansas, USA 2Department of Fisheries, Moi University, Eldoret, Kenya
Commercial production of tilapia in Kenya has potential forexpansion, but growth and development of the tilapia industry inKenya will depend upon its profitability and the effect of associ-ated risks. Data from pond experiments, on-farm trials, and farmsurveys were used to develop enterprise budgets and a risk analysis fornine production scenarios. The nine scenarios include: 1) monocultureof sex-reversed male tilapia fed either rice bran, a pelleted experi-mental diet, or a pelleted pig finisher diet; 2) clarias monoculturefed with each of the three diets; and 3) tilapia-clarias (sex-reversedmale fingerlings) polyculture fed with each of the three diets. Netreturns/ha were highest for production with the pig finisher diet,with clarias in monoculture the highest followed by tilapia inmonoculture and then the polyculture system. The lowest netreturns/ha were obtained with clarias fed rice bran. Profitabilitywas affected by feed cost and tilapia survival. Tilapia monoculturesystems had lower probabilities of financial losses than either clariasmonoculture or the polyculture system. Use of the pelleted diets alsoresulted in lower probabilities of financial losses. Lower yields from
Use of a particular brand name does not imply endorsement.The authors thank the people who collaborated with the research and those who were
interviewed in Kenya. We acknowledge Enos and Judith for their introduction to fish farmers.Kwamena Quagrainie, Aloyce Kaliba, and Peter Perschbacher provided helpful comments on themanuscript. Financial support for this project came from USAID Grant No. 4023-6-00-0031-00through the Pond Dynamics/Aquaculture Collaborative Research Support Program and fromthe University of Arkansas at Pine Bluff. The accession number is 1249. The opinionsexpressed in this paper are those of the authors and do not necessarily reflect the views ofthe U.S. Agency of International Development.
Address correspondence to Carole R. Engle, Aquaculture/Fisheries Center, University ofArkansas at Pine Bluff, Mail Slot 4914, 1200 North University Drive, Pine Bluff, AR 71601,USA. E-mail: [email protected]
5
10
15
20
2 I. Neira et al.
the rice bran feed scenario resulted in its greater sensitivity to fluc-tuating costs of rice bran and survival of tilapia.
KEYWORDS financial risk, production variability, Kenya, tilapiafarming, economics, budgets
INTRODUCTION
Fish farming in Kenya dates back to the 1920s. Rural small-scale farmershave historically raised tilapia in small, earthen, freshwater ponds (less than300 m2) as a supplement to traditional agricultural crop production (Coche,Haight, & Vincke, 1994; Mbugua, 2002). In 2001, there were 7,688 fish farm-ers in Kenya with 16,244 ponds and a total area of 240 ha (Fisheries Depart-ment, 2002). Aquaculture contributed approximately 0.7% of the totalannual fish supply in Kenya from 1980–1998. Nearly all (98%) of the fishsupply in Kenya is freshwater fish.
Tilapia (Oreochromis niloticus; Tilapia zilii) is the principal fish raisedin Kenya, but some farmers polyculture tilapia with clarias (Clarias gariepi-nus). Fish production has been extensive, relying primarily upon organic orinorganic fertilizer as nutrients to produce yields that range from 0.05 to0.15 kg/m2/year. Some farmers supplement pond production by feedingrice, maize, wheat bran, vegetables, and fruit leaves. Supplemental feedingin these systems increases yields to between 0.5 and 1.5 kg/m2/year (Mbugua,2002). Most of the fish produced are consumed directly, bartered, or soldlocally as a cash crop. Kenya has weather conditions, water, and landresources conducive to greater aquaculture development (Mbugua, 2002);but fish farming in Kenya, as in many other countries, has focused primarilyon production with little attention to economics (Tacon, 1991). The lowaquaculture yields in Kenya have been attributed to farm managementproblems such as the lack of record keeping, a lack of capital and financialassistance, as well as an inadequate supply of quality seed stock and afford-able quality feed (Mbugua, 2002).
Enterprise budgets have been used in different studies for developingcountries such as Kenya, Kuwait, Panama, Peru, Philippines, and Rwanda toanalyze the profitability in different production systems for tilapia, clarias,freshwater and marine shrimp, colossoma, and common carp species(Engle, 1987; Engle, 1986; Hishamunda et al., 1998; Hopkins et al. 1986;Green & Engle, 2000; Sevilleja & McCoy, 1979; Kam et al., 2002; Valderrama& Engle, 2001; Veverica et al. 2002).
The Pond Dynamics/Aquaculture Collaborative Research Support Pro-gram (PD/A CRSP) is a research consortium focused on improving the effi-ciency of aquaculture production systems. Research conducted by the PD/ACRSP helps farmers improve income and alleviate hunger without depleting
Q1
30
35
40
45
50
55
60
65
Tilapia Production in Kenya 3
the natural resource base on which they depend for food, fuel, fiber, andshelter. Since 1982, the PD/A CRSP has brought together resources of devel-oping countries (Honduras, Indonesia, Panama, the Philippines, andRwanda until the 1994 war) and U.S. universities to increase the efficiencyof pond culture systems and to disseminate successful aquaculture strate-gies. New sites were established in Kenya and Peru in 1996 and in Mexicoin 1998.
The PD/A CRSP activities in Kenya were designed to stimulate develop-ment of viable small-scale aquaculture businesses. The overall goal of thisproject was to develop enterprise budgets and business plans for farmers,policy makers, lending agencies, and prospective investors in Kenya. PD/ACRSP Research at Sagana Fish Farm, Kenya, has identified alternative man-agement practices and technologies that may be suitable in the region. PD/A CRSP personnel trained fisheries extension officers through on-farm test-ing to complement formal classroom training. On-farm testing was used totransfer research-based technologies to the farm, to assist farmers to assesscosts and benefits under local conditions, and to receive training in basicpond management skills.
While tilapia have been raised for over 80 years in Kenya, commercialproduction has been slow to emerge. The primary objective of this studywas to analyze the profitability and risk associated with small-scale, com-mercial tilapia farming in Kenya. Specifically, enterprise budgets weredeveloped for farm situations and management options judged to havepotential for use on a small, but commercial scale. Results of this analysisprovide a basis for developing guidelines for establishing small-scale com-mercial tilapia ventures in Kenya.
METHODS AND MATERIALS
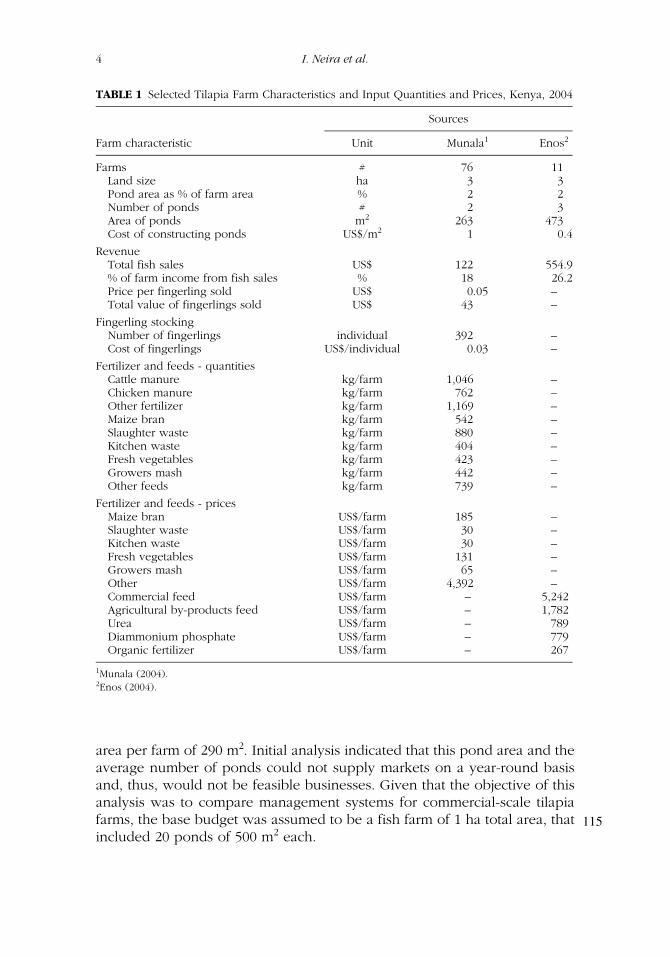
Surveys conducted in 2003 (Munala, 2003; Enos, 2003) provided informationon tilapia farm characteristics and input quantities and prices (Table 1).Veverica et al. (2002) reported results of on-farm trials conducted on52 ponds at a variety of management intensity levels and stocking combina-tions. Experimental data from Liti and colleagues (2001) and Veverica andcolleagues (2000) provided more formal comparisons of the effects onproduction characteristics resulting from tilapia fed either rice bran or pigfinisher pellets. In addition, direct personal interviews were conducted of 16tilapia farmers in Kenya in 2004 to corroborate price data and current farmproduction practices.
The survey data showed that the land area owned by Kenyans raisingtilapia averaged about 3 ha (Table 1). This land was used to grow livestock,tea, sugar cane, and other grain and vegetable crops, as well as tilapia.Average farms had two to three ponds per farm with an average total pond
70
75
80
85
90
95
100
105
110
4 I. Neira et al.
area per farm of 290 m2. Initial analysis indicated that this pond area and theaverage number of ponds could not supply markets on a year-round basisand, thus, would not be feasible businesses. Given that the objective of thisanalysis was to compare management systems for commercial-scale tilapiafarms, the base budget was assumed to be a fish farm of 1 ha total area, thatincluded 20 ponds of 500 m2 each.
TABLE 1 Selected Tilapia Farm Characteristics and Input Quantities and Prices, Kenya, 2004
Sources
Farm characteristic Unit Munala1 Enos2
Farms # 76 11Land size ha 3 3Pond area as % of farm area % 2 2Number of ponds # 2 3Area of ponds m2 263 473Cost of constructing ponds US$/m2 1 0.4
RevenueTotal fish sales US$ 122 554.9% of farm income from fish sales % 18 26.2Price per fingerling sold US$ 0.05 –Total value of fingerlings sold US$ 43 –
Fingerling stockingNumber of fingerlings individual 392 –Cost of fingerlings US$/individual 0.03 –
Fertilizer and feeds - quantitiesCattle manure kg/farm 1,046 –Chicken manure kg/farm 762 –Other fertilizer kg/farm 1,169 –Maize bran kg/farm 542 –Slaughter waste kg/farm 880 –Kitchen waste kg/farm 404 –Fresh vegetables kg/farm 423 –Growers mash kg/farm 442 –Other feeds kg/farm 739 –
Fertilizer and feeds - pricesMaize bran US$/farm 185 –Slaughter waste US$/farm 30 –Kitchen waste US$/farm 30 –Fresh vegetables US$/farm 131 –Growers mash US$/farm 65 –Other US$/farm 4,392 –Commercial feed US$/farm – 5,242Agricultural by-products feed US$/farm – 1,782Urea US$/farm – 789Diammonium phosphate US$/farm – 779Organic fertilizer US$/farm – 267
1Munala (2004).2Enos (2004).
115
Tilapia Production in Kenya 5
Farmers raised either tilapia (Oreochromis niloticus) or clarias (Clariasgariepinus) in monoculture or raised both species together in polyculture.Veverica and colleagues (2002) demonstrated that tilapia monoculture hadgreater profit potential as a commercial business venture and that the morecommon tilapia-clarias production system was more suitable for small-scale,near-subsistence farming. Farmers harvested ponds twice a year on average,with partial harvests as needed to restock ponds.
Spreadsheet models were built to simulate farm-wide yields. This wasnecessary because available data were for individual ponds only. A com-mercial farm would need to supply markets on a year-round basis bystaggering stocking and harvesting throughout the year. The model wasbuilt by stocking two ponds at a time so that marketable fish would beavailable year-round. Models were developed for three types of produc-tion (tilapia monoculture, clarias monoculture, and tilapia and clariaspolyculture) using three different types of feed (rice bran, experimentalpellet, and pig finisher pellet). For tilapia in monoculture, the stockingand harvesting events resulted in the following yields: 1) 5,880 kg/ha/yrfed with rice bran; 2) 7,800 kg/ha/yr fed with experimental pellets; and3) 7, 968 kg/ha/yr fed with the pig finisher pellets. For clarias raised inmonoculture, yields were: 1) 3,140 kg/ha/yr fed rice bran; 2) 7,440 kg/ha/yr fed with experimental pellets; and 3) 8,616 kg/ha/yr fed the pelletedpig finisher diet. Polyculture systems resulted in: 1) 5,460 kg/ha/yr of totalfish production (5,160 kg/ha/yr tilapia and 300 kg/ha/yr clarias) fed ricebran; 2) 7,416 kg/ha/yr fed with experimental pellets (6,624 kg/ha/yr oftilapia and 792 kg/ha/yr of clarias); and 3) 7,416 kg/ha/yr of total fish pro-duction (6,456 kg/ha/yr tilapia and 960 kg/ha/yr clarias) fed the pig fin-isher pellets. The yields estimated with the simulation spreadsheet areconsistent with those obtained in both experimental and farm trials undersimilar production conditions.
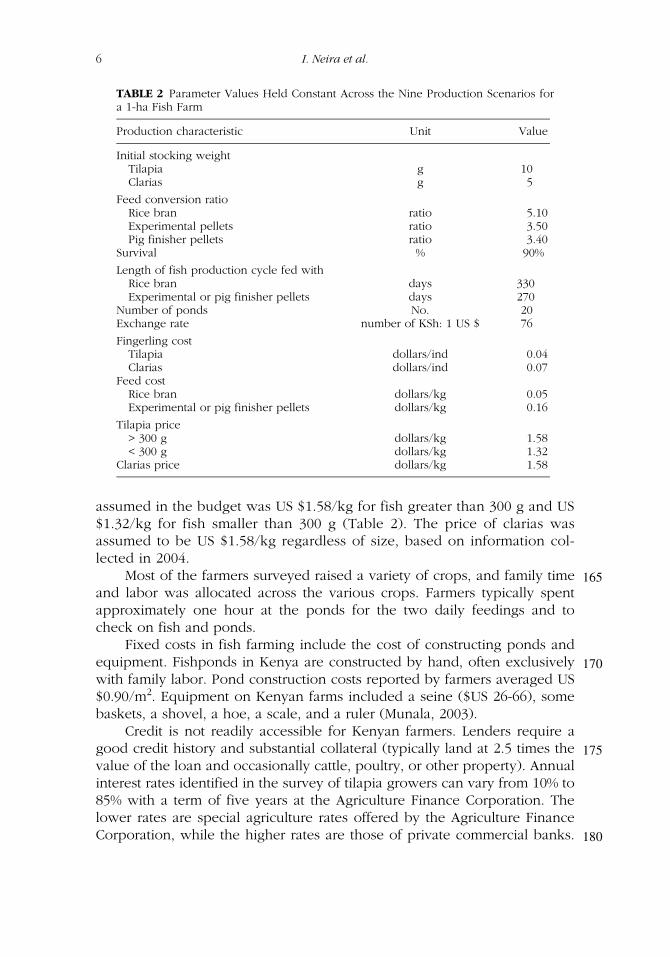
Base enterprise budgets for each of the nine production scenarios con-sidered were then developed as new worksheets in the spreadsheet models.Yields used in the revenue line of the budgets were generated as describedabove. Standard budgeting techniques were used (Kay & Edwards, 1999).Table 2 presents the mean parameter values that were held constant acrossthe nine production systems, and Table 3 presents the production parame-ter values that varied across production scenarios. Stocking rates used in theanalysis were 2 tilapia/m2 for monoculture and polyculture with clarias,while clarias were stocked at 1.5/m2 for monoculture and 0.2/m2 for poly-culture systems (Veverica et al., 2002; Liti et al., 2001). Sex-reversed maletilapia fingerlings were used because of the well-known technology to pro-duce and supply them (Green & Engle, 2000).
The survey data showed that the commercial size of tilapia in Kenyavaried between 200 and 350 g per fish, and the most common productform sold was whole-dressed, fresh tilapia. The average tilapia price
120
125
130
135
140
145
150
155
160
6 I. Neira et al.
assumed in the budget was US $1.58/kg for fish greater than 300 g and US$1.32/kg for fish smaller than 300 g (Table 2). The price of clarias wasassumed to be US $1.58/kg regardless of size, based on information col-lected in 2004.
Most of the farmers surveyed raised a variety of crops, and family timeand labor was allocated across the various crops. Farmers typically spentapproximately one hour at the ponds for the two daily feedings and tocheck on fish and ponds.
Fixed costs in fish farming include the cost of constructing ponds andequipment. Fishponds in Kenya are constructed by hand, often exclusivelywith family labor. Pond construction costs reported by farmers averaged US$0.90/m2. Equipment on Kenyan farms included a seine ($US 26-66), somebaskets, a shovel, a hoe, a scale, and a ruler (Munala, 2003).
Credit is not readily accessible for Kenyan farmers. Lenders require agood credit history and substantial collateral (typically land at 2.5 times thevalue of the loan and occasionally cattle, poultry, or other property). Annualinterest rates identified in the survey of tilapia growers can vary from 10% to85% with a term of five years at the Agriculture Finance Corporation. Thelower rates are special agriculture rates offered by the Agriculture FinanceCorporation, while the higher rates are those of private commercial banks.
TABLE 2 Parameter Values Held Constant Across the Nine Production Scenarios fora 1-ha Fish Farm
Production characteristic Unit Value
Initial stocking weightTilapia g 10Clarias g 5
Feed conversion ratioRice bran ratio 5.10Experimental pellets ratio 3.50Pig finisher pellets ratio 3.40
Survival % 90%
Length of fish production cycle fed withRice bran days 330Experimental or pig finisher pellets days 270
Number of ponds No. 20Exchange rate number of KSh: 1 US $ 76
Fingerling costTilapia dollars/ind 0.04Clarias dollars/ind 0.07
Feed costRice bran dollars/kg 0.05Experimental or pig finisher pellets dollars/kg 0.16
Tilapia price> 300 g dollars/kg 1.58< 300 g dollars/kg 1.32
Clarias price dollars/kg 1.58
165
170
175
180

7
TA
BLE
3Pro
duct
ion P
aram
eter
Val
ues
that
Var
ied A
cross
the
Nin
e Pro
duct
ion S
cenar
ios
for
a 1-
ha
Fish
Far
m, K
enya
Ric
e bra
nExp
erim
enta
l pel
lets
Pig
fin
isher
pel
lets
Par
amet
ers
Monocu
lture
Poly
cultu
reM
onocu
lture
Poly
cultu
reM
onocu
lture
Poly
cultu
re
Tila
pia
Stock
ing
den
sity
(til
apia
m−2
)2
22
22
2G
row
th r
ate
(g d
−1)
0.96
0.84
1.3
1.1
1.33
1.07
Har
vest
wei
ght (g
)32
6.8
287.
236
130
736
9.1
298.
9Y
ield
(kg
/ha)
5,88
05,
160
7,80
06,
624
7,96
86,
456
Cla
rias
Stock
ing
den
sity
(Cla
rias
m−2
)1.
50.
21.
50.
21.
50.
2G
row
th r
ate
(g d
−1)
0.69
0.48
1.68
1.36
1.95
1.63
Har
vest
wei
ght (g
)23
2.7
163.
445
8.6
372.
253
1.5
445.
1Y
ield
(kg
/ha)
3,14
030
07,
440
792
8,61
696
0
8 I. Neira et al.
Several lenders and governmental agencies expressed interest in providingassistance and favorable credit terms for aquaculture. Thus, an annualinterest rate of 12% was used initially for this analysis, but was followed bya sensitivity analysis that varied interest rates up to 85%.
On-farm trials showed a wide range of tilapia yields, from 1,525–11,531kg/ha/yr for male tilapia and clarias in polyculture (Veverica et al. 2002);4,242-11,644 kg/ha/yr for clarias in monoculture; and 4,211-8,317 for tilapiain monoculture. The effect of yield risk on profitability was evaluated byincorporating production variability in the enterprise budgets and conduct-ing repeated Monte Carlo simulations. The risk analysis was conducted as astochastic simulation using Crystal BallTM software (Decisioneering Inc.,Denver, CO), a spreadsheet add-on program to Microsoft Excel that allowsthe incorporation of uncertainty in risk analysis models. This program hasbeen used previously for bio-economic modeling of aquaculture firms(Valderrama & Engle 2001; Zucker & Anderson, 1999). Monte Carlo simula-tion techniques (500 iterations per simulation) were used to generate valuesfor individual cost and quantity items based on the probability distributions.Results include the entire range of possible outcomes for parameters suchas gross receipts, total costs, and net returns, as well as their associatedprobability.
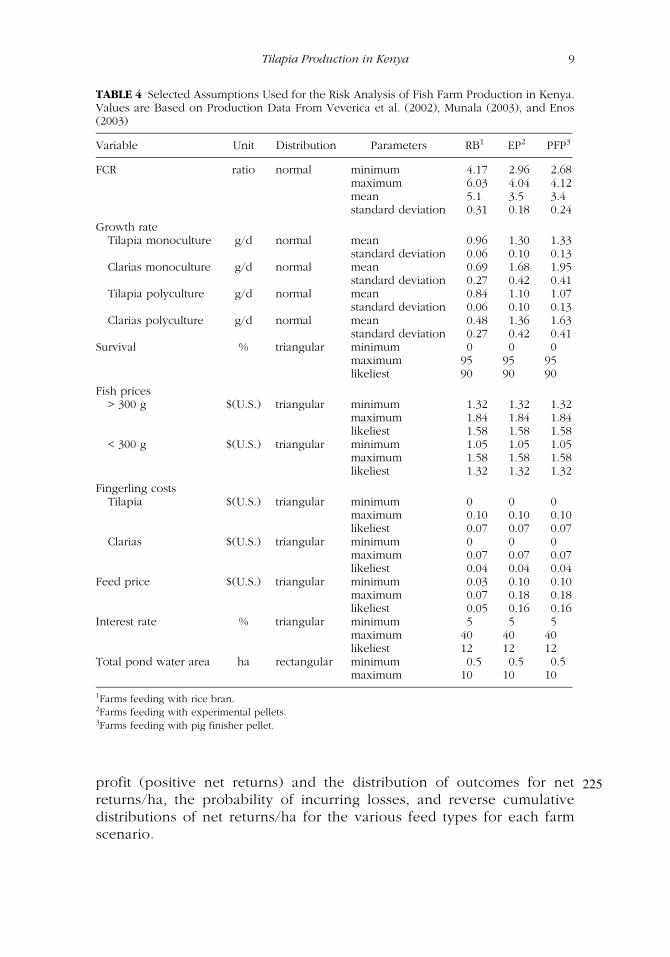
Probability distributions for random variable budget componentswere selected based on availability of data and with input from profes-sionals familiar with fish farming in Kenya. Table 4 summarizes the choiceof distributions for each random variable included in the risk analysis andthe corresponding distribution-parameter values. The selection of distribu-tions followed the conventions used by Valderrama and Engle (2001) andZucker and Anderson (1999). Thus, a normal distribution was used todefine the feed conversion ratio of tilapia. This parameter is determinedby the type of feed, metabolism, and weather patterns that fluctuate ran-domly. Survival rate, farm prices, and production cost were described bytriangular distributions based on the most likely value (means included inthe enterprise budgets) and minimum and maximum values determinedfrom the original data for each scenario. Tilapia price depends on averagetilapia size, marketing strategies, and supply-demand interactions with thewild-caught tilapia likely supplied from Lake Victoria and other impound-ments at the moment of harvest. Triangular distributions were selected forthese parameters given the low number of observations available for eachfarm scenario. Triangular distributions are considered to provide the bestrepresentation of estimates when only a small amount of data can beobtained (Taha, 1988).
The Monte Carlo simulations conducted with Crystal BallTM gener-ated probability distributions for the recalculated FCR, survival rate,tilapia price, fingerling cost, feed price, and interest rate for eachfarm scenario. These were used to calculate the likelihood of achieving
185
190
195
200
205
210
215
220
Tilapia Production in Kenya 9
profit (positive net returns) and the distribution of outcomes for netreturns/ha, the probability of incurring losses, and reverse cumulativedistributions of net returns/ha for the various feed types for each farmscenario.
TABLE 4 Selected Assumptions Used for the Risk Analysis of Fish Farm Production in Kenya.Values are Based on Production Data From Veverica et al. (2002), Munala (2003), and Enos(2003)
Variable Unit Distribution Parameters RB1 EP2 PFP3
FCR ratio normal minimum 4.17 2.96 2.68maximum 6.03 4.04 4.12mean 5.1 3.5 3.4standard deviation 0.31 0.18 0.24
Growth rateTilapia monoculture g/d normal mean 0.96 1.30 1.33
standard deviation 0.06 0.10 0.13Clarias monoculture g/d normal mean 0.69 1.68 1.95
standard deviation 0.27 0.42 0.41Tilapia polyculture g/d normal mean 0.84 1.10 1.07
standard deviation 0.06 0.10 0.13Clarias polyculture g/d normal mean 0.48 1.36 1.63
standard deviation 0.27 0.42 0.41Survival % triangular minimum 0 0 0
maximum 95 95 95likeliest 90 90 90
Fish prices> 300 g $(U.S.) triangular minimum 1.32 1.32 1.32
maximum 1.84 1.84 1.84likeliest 1.58 1.58 1.58
< 300 g $(U.S.) triangular minimum 1.05 1.05 1.05maximum 1.58 1.58 1.58likeliest 1.32 1.32 1.32
Fingerling costsTilapia $(U.S.) triangular minimum 0 0 0
maximum 0.10 0.10 0.10likeliest 0.07 0.07 0.07
Clarias $(U.S.) triangular minimum 0 0 0maximum 0.07 0.07 0.07likeliest 0.04 0.04 0.04
Feed price $(U.S.) triangular minimum 0.03 0.10 0.10maximum 0.07 0.18 0.18likeliest 0.05 0.16 0.16
Interest rate % triangular minimum 5 5 5maximum 40 40 40likeliest 12 12 12
Total pond water area ha rectangular minimum 0.5 0.5 0.5maximum 10 10 10
1Farms feeding with rice bran.2Farms feeding with experimental pellets.3Farms feeding with pig finisher pellet.
225
10 I. Neira et al.
RESULTS AND DISCUSSION
Tilapia Monoculture
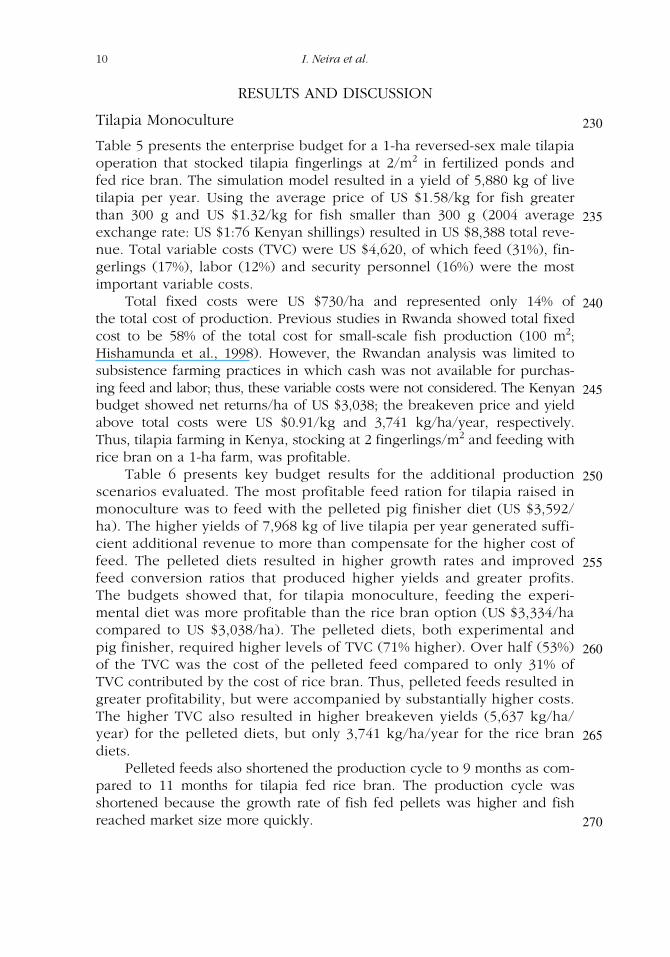
Table 5 presents the enterprise budget for a 1-ha reversed-sex male tilapiaoperation that stocked tilapia fingerlings at 2/m2 in fertilized ponds andfed rice bran. The simulation model resulted in a yield of 5,880 kg of livetilapia per year. Using the average price of US $1.58/kg for fish greaterthan 300 g and US $1.32/kg for fish smaller than 300 g (2004 averageexchange rate: US $1:76 Kenyan shillings) resulted in US $8,388 total reve-nue. Total variable costs (TVC) were US $4,620, of which feed (31%), fin-gerlings (17%), labor (12%) and security personnel (16%) were the mostimportant variable costs.
Total fixed costs were US $730/ha and represented only 14% ofthe total cost of production. Previous studies in Rwanda showed total fixedcost to be 58% of the total cost for small-scale fish production (100 m2;Hishamunda et al., 1998). However, the Rwandan analysis was limited tosubsistence farming practices in which cash was not available for purchas-ing feed and labor; thus, these variable costs were not considered. The Kenyanbudget showed net returns/ha of US $3,038; the breakeven price and yieldabove total costs were US $0.91/kg and 3,741 kg/ha/year, respectively.Thus, tilapia farming in Kenya, stocking at 2 fingerlings/m2 and feeding withrice bran on a 1-ha farm, was profitable.
Table 6 presents key budget results for the additional productionscenarios evaluated. The most profitable feed ration for tilapia raised inmonoculture was to feed with the pelleted pig finisher diet (US $3,592/ha). The higher yields of 7,968 kg of live tilapia per year generated suffi-cient additional revenue to more than compensate for the higher cost offeed. The pelleted diets resulted in higher growth rates and improvedfeed conversion ratios that produced higher yields and greater profits.The budgets showed that, for tilapia monoculture, feeding the experi-mental diet was more profitable than the rice bran option (US $3,334/hacompared to US $3,038/ha). The pelleted diets, both experimental andpig finisher, required higher levels of TVC (71% higher). Over half (53%)of the TVC was the cost of the pelleted feed compared to only 31% ofTVC contributed by the cost of rice bran. Thus, pelleted feeds resulted ingreater profitability, but were accompanied by substantially higher costs.The higher TVC also resulted in higher breakeven yields (5,637 kg/ha/year) for the pelleted diets, but only 3,741 kg/ha/year for the rice brandiets.
Pelleted feeds also shortened the production cycle to 9 months as com-pared to 11 months for tilapia fed rice bran. The production cycle wasshortened because the growth rate of fish fed pellets was higher and fishreached market size more quickly.
230
235
240
245
250
255
260
265
270

11
TA
BLE
5B
ase
Annual
Ente
rprise
Budge
t fo
r a
1-ha
Tila
pia
Far
m R
aisi
ng
Sex-
Rev
erse
d M
ale
Tila
pia
in M
onocu
lture
with
Ric
e B
ran in K
enya
. 1
US
dolla
r = 7
6 K
enya
n S
hill
ings
Item
Des
crip
tion
Unit
Quan
tity
Price
Tota
l
Gro
ss r
even
ue
Tila
pia
Live
who
le d
ress
ed 4
1% >
300
gkg
2,41
11.
583,
809
Live
who
le d
ress
ed 5
9% <
300
gkg
3,46
91.
324,
579
Tota
l gr
oss
rev
enue
8,38
8
Var
iable
cost
s (V
C)
Tila
pia
fin
gerlin
gs1
10 g
/indiv
idual
indiv
idual
20,0
000.
0480
0Ric
e bra
nkg
29,0
400.
051,
452
Fertili
zer
Ure
akg
528
0.26
137
Dia
mm
oniu
m p
hosp
hat
ekg
252
0.29
73A
gric
ultu
ral lim
eK
g2,
500
0.05
125
Labor
Stoc
k, fee
d, fer
tiliz
e, a
nd h
arve
st$(
U.S
.)36
51.
5857
7Pond m
anag
emen
tLe
vee
repai
rs$(
U.S
.)15
21.
5723
8Se
curity
per
sonnel
$(U
.S.)
365
1.98
723
Inte
rest
on o
per
atin
g ca
pita
l$(
U.S
.)4,
125
0.12
495
Tota
l V
aria
ble
Cost
$(U
.S.)
4,62
0Fi
xed c
ost
sD
epre
ciat
ion
Equip
men
t$(
U.S
.)11
8Ponds
$(U
.S.)
237
Inte
rest
on inve
stm
ent
$(U
.S.)
375
Tota
l Fi
xed C
ost
$(U
.S.)
730
Tota
l Cost
s$(
U.S
.)5,
350
(Con
tin
ued
)

12
TA
BLE
5(C
onti
nu
ed)
Item
Des
crip
tion
Unit
Quan
tity
Price
Tota
l
Net
ret
urn
s ab
ove
TVC
$(U
.S.)
3,76
8N
et r
eturn
s ab
ove
TC
$(U
.S.)
3,03
8N
et r
eturn
s/ha
$(U
.S.)/h
a3,
038
Bre
akev
en p
rice
(BEP)
above
TVC
$(U
.S.)/k
g0.
79ab
ove
TC
$(U
.S.)/k
g0.
91B
reak
even
yie
ld (
BEY
)2
above
TVC
kg/h
a/ye
ar3,
231
above
TC
kg/h
a/ye
ar3,
741
1 Sto
cked
at 2
tilap
ia/m
2 .2 T
he
wei
ghte
d a
vera
ge fis
h p
rice
($1
.43/
kg)
was
use
d to e
stim
ate
bre
akev
en y
ield
s.

13
TA
BLE
6Su
mm
ary
of
Annual
Cost
s an
d R
eturn
s fo
r th
e A
dditi
onal
Pro
duct
ion S
cenar
ios
for
a 1-
ha
Fish
Far
m i
n K
enya
fro
m t
he
Bas
e B
udge
tsD
evel
oped
for
Eac
h S
cenar
io. 1
US
dolla
r = 7
6 K
enya
n S
hill
ings
Tila
pia
monocu
lture
Cla
rias
monocu
lture
Poly
cultu
re
Ente
rprise
budge
tsU
nit
RB
1EP
2PFP
3RB
1EP
2PFP
3RB
1EP
2PFP
3
Gro
ss r
ecei
pts
$/ha
8,38
811
,959
12,2
174,
961
11,7
5513
,613
7,83
511
,407
11,4
16V
aria
ble
cost
s$/
ha
4,62
07,
895
7,89
54,
148
8,11
68,
696
4,56
77,
386
7,15
5Fi
xed c
ost
s$/
ha
730
730
730
730
730
730
730
730
730
Tota
l co
sts
$/ha
5,35
08,
625
8,62
54,
878
8,84
69,
426
5,29
78,
116
7,88
5N
et r
eturn
s/ha
$/ha
3,03
83,
334
3,59
283
2,90
94,
187
2,53
83,
291
3,53
1B
reak
even
price
$/kg
0.91
1.11
1.08
1.55
1.19
1.09
1.03
1.23
1.22
Bre
akev
en y
ield
kg/h
a3,
741
5,63
75,
637
3,08
75,
599
5,96
63,
704
5,27
05,
120
1 Far
ms
feed
ing
with
ric
e bra
n.
2 Far
ms
feed
ing
with
exp
erim
enta
l pel
let.
3 Far
ms
feed
ing
with
pig
fin
isher
pel
let.
14 I. Neira et al.
Clarias Monoculture
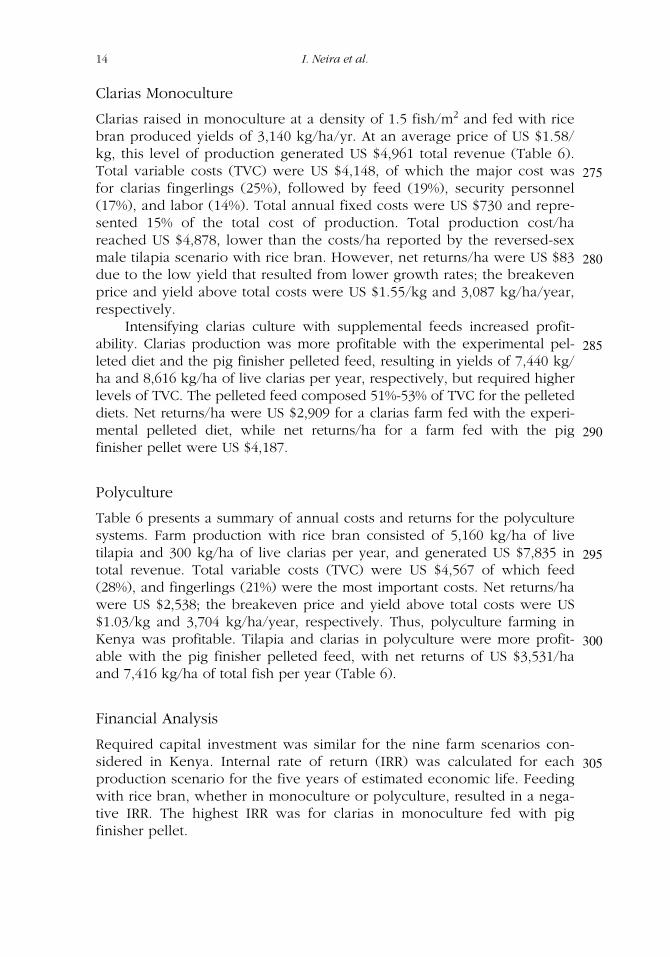
Clarias raised in monoculture at a density of 1.5 fish/m2 and fed with ricebran produced yields of 3,140 kg/ha/yr. At an average price of US $1.58/kg, this level of production generated US $4,961 total revenue (Table 6).Total variable costs (TVC) were US $4,148, of which the major cost wasfor clarias fingerlings (25%), followed by feed (19%), security personnel(17%), and labor (14%). Total annual fixed costs were US $730 and repre-sented 15% of the total cost of production. Total production cost/hareached US $4,878, lower than the costs/ha reported by the reversed-sexmale tilapia scenario with rice bran. However, net returns/ha were US $83due to the low yield that resulted from lower growth rates; the breakevenprice and yield above total costs were US $1.55/kg and 3,087 kg/ha/year,respectively.
Intensifying clarias culture with supplemental feeds increased profit-ability. Clarias production was more profitable with the experimental pel-leted diet and the pig finisher pelleted feed, resulting in yields of 7,440 kg/ha and 8,616 kg/ha of live clarias per year, respectively, but required higherlevels of TVC. The pelleted feed composed 51%-53% of TVC for the pelleteddiets. Net returns/ha were US $2,909 for a clarias farm fed with the experi-mental pelleted diet, while net returns/ha for a farm fed with the pigfinisher pellet were US $4,187.
Polyculture
Table 6 presents a summary of annual costs and returns for the polyculturesystems. Farm production with rice bran consisted of 5,160 kg/ha of livetilapia and 300 kg/ha of live clarias per year, and generated US $7,835 intotal revenue. Total variable costs (TVC) were US $4,567 of which feed(28%), and fingerlings (21%) were the most important costs. Net returns/hawere US $2,538; the breakeven price and yield above total costs were US$1.03/kg and 3,704 kg/ha/year, respectively. Thus, polyculture farming inKenya was profitable. Tilapia and clarias in polyculture were more profit-able with the pig finisher pelleted feed, with net returns of US $3,531/haand 7,416 kg/ha of total fish per year (Table 6).
Financial Analysis
Required capital investment was similar for the nine farm scenarios con-sidered in Kenya. Internal rate of return (IRR) was calculated for eachproduction scenario for the five years of estimated economic life. Feedingwith rice bran, whether in monoculture or polyculture, resulted in a nega-tive IRR. The highest IRR was for clarias in monoculture fed with pigfinisher pellet.
275
280
285
290
295
300
305
Tilapia Production in Kenya 15
Sensitivity Analysis
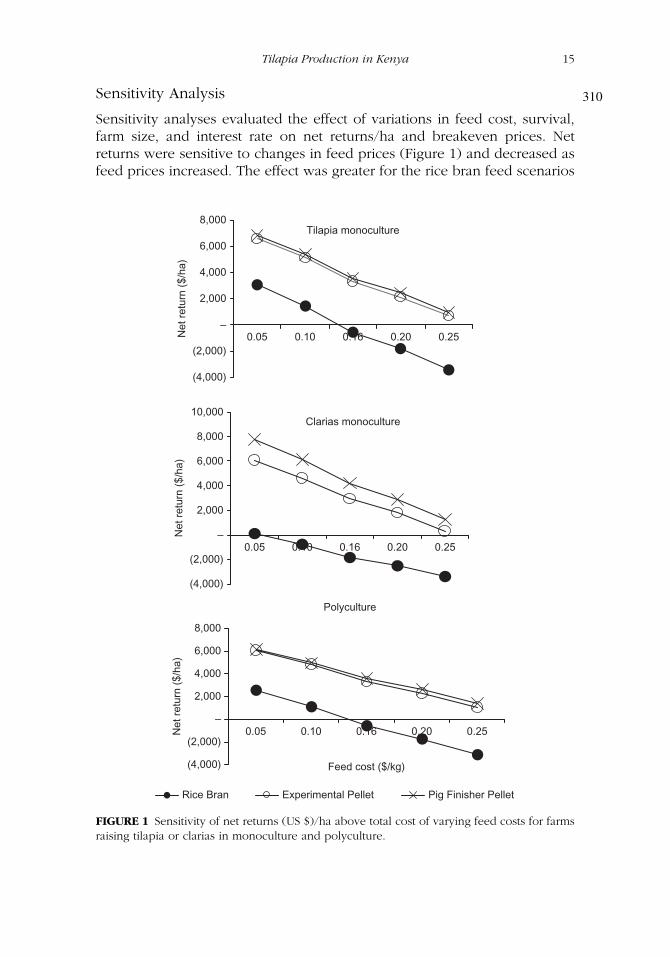
Sensitivity analyses evaluated the effect of variations in feed cost, survival,farm size, and interest rate on net returns/ha and breakeven prices. Netreturns were sensitive to changes in feed prices (Figure 1) and decreased asfeed prices increased. The effect was greater for the rice bran feed scenarios
FIGURE 1 Sensitivity of net returns (US $)/ha above total cost of varying feed costs for farmsraising tilapia or clarias in monoculture and polyculture.
Clarias monoculture
(4,000)
(2,000)
–
2,000
4,000
6,000
8,000
10,000
0.05 0.10 0.16 0.20 0.25
Net
ret
urn
($/h
a)
Polyculture
(4,000)
(2,000)
–
2,000
4,000
6,000
8,000
0.05 0.10 0.16 0.20 0.25
Feed cost ($/kg)
Net
ret
urn
($/h
a)
Rice Bran Experimental Pellet Pig Finisher Pellet
Tilapia monoculture
(4,000)
(2,000)
–
2,000
4,000
6,000
8,000
0.05 0.10 0.16 0.20 0.25Net
ret
urn
($/h
a)
310
16 I. Neira et al.
than for the pelleted feed scenarios. Net returns/ha became negative at ricebran prices of US $0.15/kg for tilapia monoculture, US $0.06/kg for clariasmonoculture, and US $0.14/kg for the polyculture system. There was littledifference in the effects between pelleted diets because yields from pellet-fed scenarios were similar.
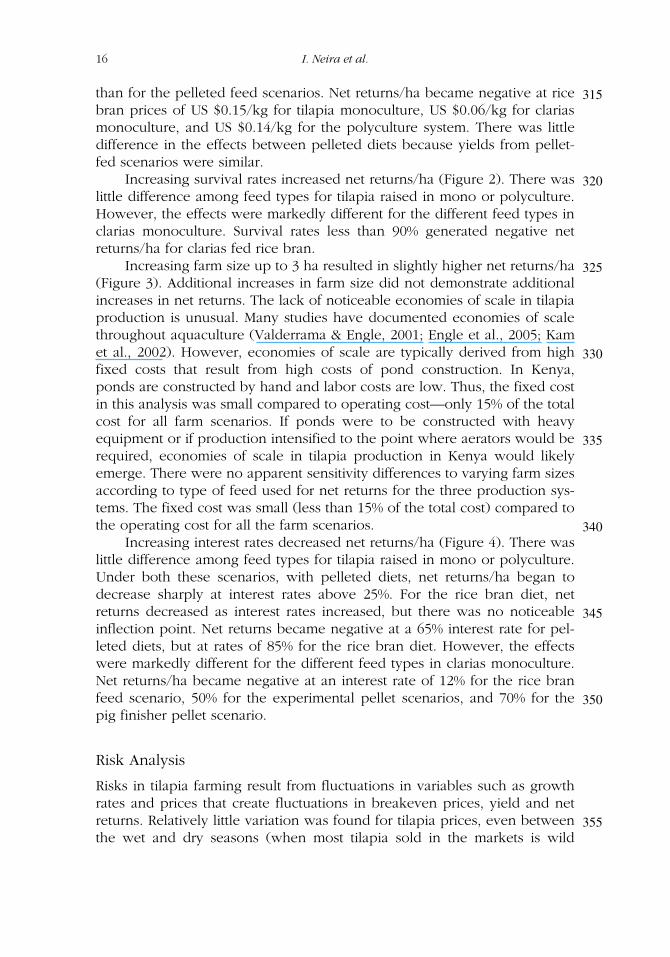
Increasing survival rates increased net returns/ha (Figure 2). There waslittle difference among feed types for tilapia raised in mono or polyculture.However, the effects were markedly different for the different feed types inclarias monoculture. Survival rates less than 90% generated negative netreturns/ha for clarias fed rice bran.
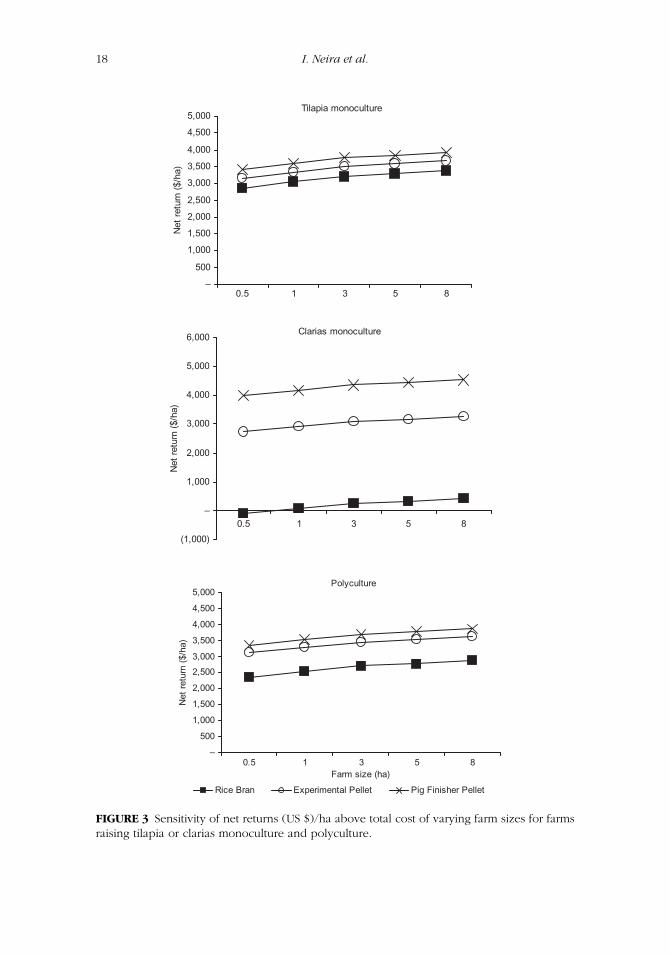
Increasing farm size up to 3 ha resulted in slightly higher net returns/ha(Figure 3). Additional increases in farm size did not demonstrate additionalincreases in net returns. The lack of noticeable economies of scale in tilapiaproduction is unusual. Many studies have documented economies of scalethroughout aquaculture (Valderrama & Engle, 2001; Engle et al., 2005; Kamet al., 2002). However, economies of scale are typically derived from highfixed costs that result from high costs of pond construction. In Kenya,ponds are constructed by hand and labor costs are low. Thus, the fixed costin this analysis was small compared to operating cost—only 15% of the totalcost for all farm scenarios. If ponds were to be constructed with heavyequipment or if production intensified to the point where aerators would berequired, economies of scale in tilapia production in Kenya would likelyemerge. There were no apparent sensitivity differences to varying farm sizesaccording to type of feed used for net returns for the three production sys-tems. The fixed cost was small (less than 15% of the total cost) compared tothe operating cost for all the farm scenarios.
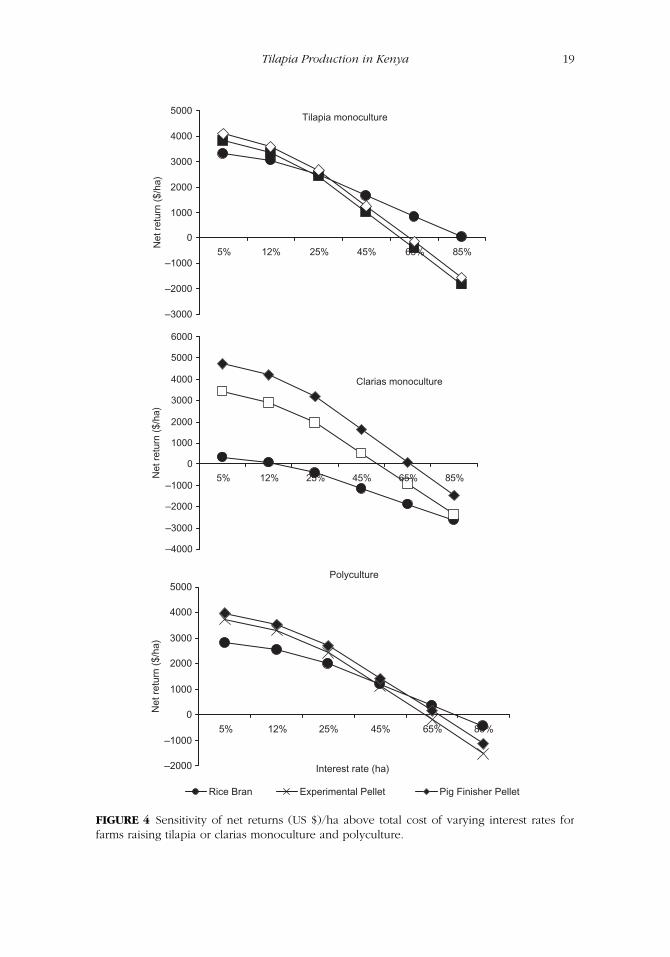
Increasing interest rates decreased net returns/ha (Figure 4). There waslittle difference among feed types for tilapia raised in mono or polyculture.Under both these scenarios, with pelleted diets, net returns/ha began todecrease sharply at interest rates above 25%. For the rice bran diet, netreturns decreased as interest rates increased, but there was no noticeableinflection point. Net returns became negative at a 65% interest rate for pel-leted diets, but at rates of 85% for the rice bran diet. However, the effectswere markedly different for the different feed types in clarias monoculture.Net returns/ha became negative at an interest rate of 12% for the rice branfeed scenario, 50% for the experimental pellet scenarios, and 70% for thepig finisher pellet scenario.
Risk Analysis
Risks in tilapia farming result from fluctuations in variables such as growthrates and prices that create fluctuations in breakeven prices, yield and netreturns. Relatively little variation was found for tilapia prices, even betweenthe wet and dry seasons (when most tilapia sold in the markets is wild
315
320
325
330
335
340
345
350
355

Tilapia Production in Kenya 17
FIGURE 2 Sensitivity of net returns (US $)/ha above total cost of varying survival rates forfarms raising tilapia or clarias monoculture and polyculture.
Tilapia monoculture
–
500
1,000
1,500
2,000
2,500
3,000
3,500
4,000
4,500
75% 80% 85% 90% 95%
Net
ret
urn
($/h
a)
Clarias monocultre
(1,000)
–
1,000
2,000
3,000
4,000
5,000
75% 80% 85% 90% 95%
Net
ret
urn
($/h
a)
Polyculture
–
500
1,000
1,500
2,000
2,500
3,000
3,500
4,000
4,500
75% 80% 85% 90% 95%Survival rate (%)
Net
ret
urn
($/h
a)
Rice Bran Experimental Pellet Pig Finisher Pellet
18 I. Neira et al.
FIGURE 3 Sensitivity of net returns (US $)/ha above total cost of varying farm sizes for farmsraising tilapia or clarias monoculture and polyculture.
Clarias monoculture
(1,000)
–
1,000
2,000
3,000
4,000
5,000
6,000
0.5 1 3 5 8
Net
ret
urn
($/h
a)
Polyculture
–
500
1,000
1,500
2,000
2,500
3,000
3,500
4,000
4,500
5,000
0.5 1 3 5 8Farm size (ha)
Net
ret
urn
($/h
a)
Rice Bran Experimental Pellet Pig Finisher Pellet
Tilapia monoculture
–
500
1,000
1,500
2,000
2,500
3,000
3,500
4,000
4,500
5,000
0.5 1 3 5 8
Net
ret
urn
($/h
a)
Tilapia Production in Kenya 19
FIGURE 4 Sensitivity of net returns (US $)/ha above total cost of varying interest rates forfarms raising tilapia or clarias monoculture and polyculture.
Tilapia monoculture
–3000
–2000
–1000
0
1000
2000
3000
4000
5000
5% 12% 25% 45% 65% 85%
Net
ret
urn
($/h
a)
Polyculture
–2000
–1000
0
1000
2000
3000
4000
5000
5% 12% 25% 45% 65% 85%
Interest rate (ha)
Net
ret
urn
($/h
a)
Rice Bran Experimental Pellet Pig Finisher Pellet
Clarias monoculture
–4000
–3000
–2000
–1000
0
1000
2000
3000
4000
5000
6000
5% 12% 25% 45% 65% 85%Net
ret
urn
($/h
a)
20 I. Neira et al.
caught from Lake Victoria). In contrast, variations in growth rates wereencountered due to quality of feed, stocking density, and productionsystem.
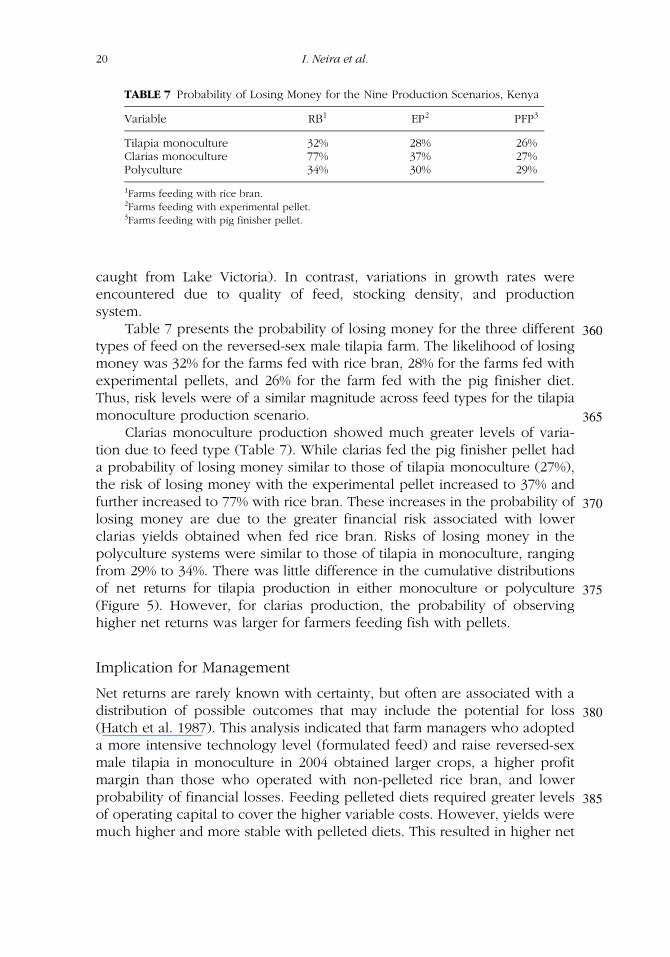
Table 7 presents the probability of losing money for the three differenttypes of feed on the reversed-sex male tilapia farm. The likelihood of losingmoney was 32% for the farms fed with rice bran, 28% for the farms fed withexperimental pellets, and 26% for the farm fed with the pig finisher diet.Thus, risk levels were of a similar magnitude across feed types for the tilapiamonoculture production scenario.
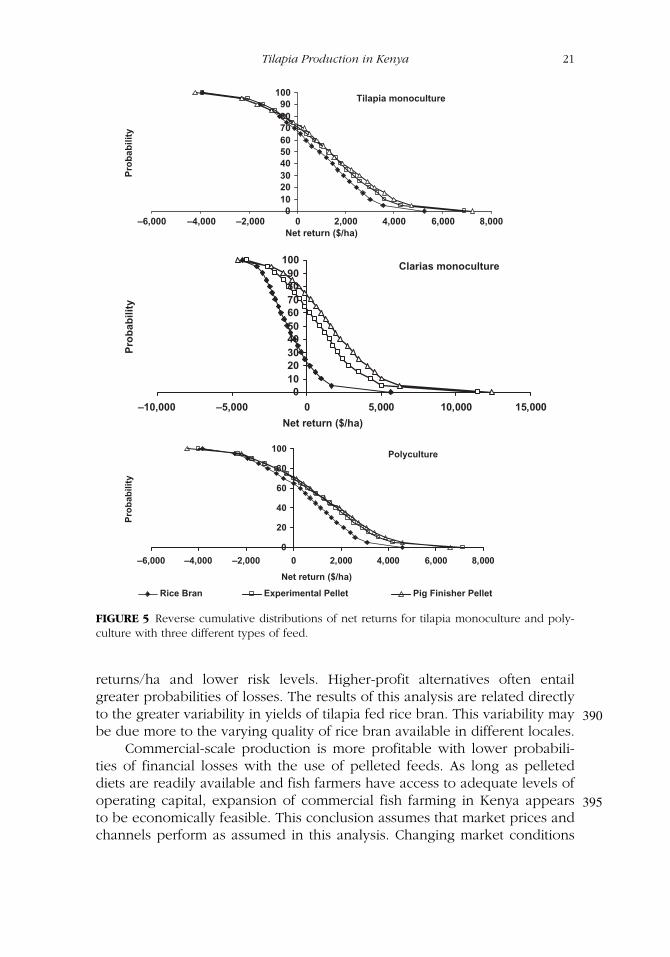
Clarias monoculture production showed much greater levels of varia-tion due to feed type (Table 7). While clarias fed the pig finisher pellet hada probability of losing money similar to those of tilapia monoculture (27%),the risk of losing money with the experimental pellet increased to 37% andfurther increased to 77% with rice bran. These increases in the probability oflosing money are due to the greater financial risk associated with lowerclarias yields obtained when fed rice bran. Risks of losing money in thepolyculture systems were similar to those of tilapia in monoculture, rangingfrom 29% to 34%. There was little difference in the cumulative distributionsof net returns for tilapia production in either monoculture or polyculture(Figure 5). However, for clarias production, the probability of observinghigher net returns was larger for farmers feeding fish with pellets.
Implication for Management
Net returns are rarely known with certainty, but often are associated with adistribution of possible outcomes that may include the potential for loss(Hatch et al. 1987). This analysis indicated that farm managers who adopteda more intensive technology level (formulated feed) and raise reversed-sexmale tilapia in monoculture in 2004 obtained larger crops, a higher profitmargin than those who operated with non-pelleted rice bran, and lowerprobability of financial losses. Feeding pelleted diets required greater levelsof operating capital to cover the higher variable costs. However, yields weremuch higher and more stable with pelleted diets. This resulted in higher net
TABLE 7 Probability of Losing Money for the Nine Production Scenarios, Kenya
Variable RB1 EP2 PFP3
Tilapia monoculture 32% 28% 26%Clarias monoculture 77% 37% 27%Polyculture 34% 30% 29%
1Farms feeding with rice bran.2Farms feeding with experimental pellet.3Farms feeding with pig finisher pellet.
360
365
370
375
380
385
Tilapia Production in Kenya 21
returns/ha and lower risk levels. Higher-profit alternatives often entailgreater probabilities of losses. The results of this analysis are related directlyto the greater variability in yields of tilapia fed rice bran. This variability maybe due more to the varying quality of rice bran available in different locales.
Commercial-scale production is more profitable with lower probabili-ties of financial losses with the use of pelleted feeds. As long as pelleteddiets are readily available and fish farmers have access to adequate levels ofoperating capital, expansion of commercial fish farming in Kenya appearsto be economically feasible. This conclusion assumes that market prices andchannels perform as assumed in this analysis. Changing market conditions
FIGURE 5 Reverse cumulative distributions of net returns for tilapia monoculture and poly-culture with three different types of feed.
0102030405060708090
100
–6,000 –4,000 –2,000 0 2,000 4,000 6,000 8,000Net return ($/ha)
Pro
bab
ility
Tilapia monoculture
0
20
40
60
80
100
–6,000 –4,000 –2,000 0 2,000 4,000 6,000 8,000
Net return ($/ha)
Pro
bab
ility
Rice Bran Experimental Pellet Pig Finisher Pellet
Polyculture
0102030405060708090
100
–10,000 –5,000 0 5,000 10,000 15,000
Net return ($/ha)
Pro
bab
ility
Clarias monoculture
390
395
22 I. Neira et al.
may alter the results of this analysis, but policy makers and lenders can referto the sensitivity results as guidance on probable effects of varying marketprices.
REFERENCES
Coche, G.A., B. Haight, and M. Vincke. 1994. Aquaculture development andresearch in sub-Saharan Africa: Synthesis of national reviews and indicativeaction plan for research. CIFA Technical Paper No. 23. Rome: FAO.
Decisioneering. 1996. Crystal Ball version 4.0 user manual. Denver, CO:Decisioneering.
Engle, C.R., S. Pomerleau, G. Fornshell, J.M. Hinshaw, D. Sloan, and S. Engle. 2005.The economic impact of proposed effluent treatment options for production oftrout Oncorhynchus mykiss in flow–through systems. Aquacult. Eng. 32(2005):303–323.
Engle, C.R. 1987. Economic analysis of the commercial production of tilapia, Colos-soma and Macrobrachium rosenbergii in mono and polyculture. RevistaLatinoamericana de Acuicultura 33:6–25.
Engle, C.R. 1986. Seed production costs in Panama. Revista Latinoamericana deAcuicultura 30:43–57.
Enos, 2003. Fisheries Department, Nairobi, Kenya.Green, B.W., and C.R. Engle, 2000. Commercial tilapia aquaculture in Honduras. In
Tilapia aquaculture in the Americas, vol. 2, eds. B.A. Costa-Pierce andJ.E. Rakocy, 252–264. Baton Rouge, LA: World Aquaculture Society.
Hatch, U., S. Sindelar, D. Rouse, and H. Perez. 1987. Demonstrating the use of riskprogramming for aquacultural farm management: The case of penaeid shrimpin Panama. J. World Aquaculture Soc. 18:260–269.
Hishamunda, N., M. Thomas, D. Brown, C. Engle, and C. Jolly. 1998. Small-scalefish farming in Rwanda: Economic characteristics. Technical Report. Corvallis,OR: Pond Dynamics/Aquaculture CRSP, Oregon State University.
Hopkins, K., M. Hopkins, D. Leclercq, and A.A. Al-Ameeri. 1986. Tilapia culture inKuwait: A preliminary economic analysis of production systems. Kuwait Bull.Marine Sci. 7:45–64.
Kam, L.E., P. Leung, A.C. Ostrowski, and A. Molnar. 2002. Size economies of apacific threadfin Polydactylus Sexfilis hatchery in Hawaii. J. World AquacultureSoc. 33(4): 410–424.
Kay, R.D., and W. M. Edwards. 1999. Farm management, 4th ed. New York:McGraw-Hill.
Liti, D.M., O.E. Mac’Were, and K.L. Veverica. 2001. Growth performance andeconomic benefits of Oreochromis niloticus/Clarias gariepinus polyculture fedon three supplementary feeds in fertilized tropical ponds: Pond Dynamics/Aquaculture CRSP Eighteenth Annual Technical Report. Corvallis, OR: OregonState University.
Mbugua, H.M. 2002. The role of fisheries department in aquaculture developmentin Kenya . Samaki News: A Magazine of the Department of Fisheries of Kenya1(1): 24–30.
Q2
400
405
410
415
420
425
430
435
440

Tilapia Production in Kenya 23
Munala, N.O. 2003. Socio-economic assessment of the factors determining structureand development of fish farming among small-scale operators in Kericho andKissi Districts, Kenya. Eldoret, Kenya: Moi University, Mimeo.
Nairobi Fisheries Department. 2002. Annual statistical bulletin. Nairobi, Kenya: Sevilleja, R.C., and E.W. McCoy. 1979. Fish marketing in Central Luzon, Philippines.
Res. Dev. Ser. Int. Cent. Aquacult. Maslennikova, N.V. 21(3): 23.Tacon A.G.J. 1991. Kenya: Development of tilapia feeds. A report for the project
small-scale fish farming in the Lake Basin. FAO field document project. KEN/86/027. Rome: FAO, Fisheries and Aquaculture Dept.
Taha, H.A. 1988. Simulation modeling and SIMNET. Englewood Cliffs, NJ: PrenticeHall.
Valderrama, D., and C.R. Engle. 2001. Risk analysis of shrimp farming in Honduras.Aquaculture Econ. Manage. 5(1/2): 49–68.
Veverica, K.L., C. Ngugi, G. Matolla, J. Amadaiva, and J.R. Bowman. 2002. On-farmtrials: Evaluation of alternative aquaculture technologies by local farmers inKenya. Technical Report. Corvallis, OR: Pond Dynamics/Aquaculture CRSP,Oregon State University.
Veverica, K., D. Liti, E. Were, and J. Bowman. 2000. Fish yields and economic bene-fits of tilapia/clarias polyculture in fertilized ponds receiving commercial feedsor pelleted agricultural by-products. Pond Dynamics/Aquaculture CRSPEighteenth Annual Technical Report. Corvallis, OR: Oregon State University.
Zucker, D.A., and J.L. Anderson. 1999. A dynamic, stochastic model of a land-basedsummer flounder Paralychtys dentatus aquaculture firm. J. World Aquacult.Soc. 30:219–235.
Q3Q4445
450
455
460
465
Related Documents