Econ 3790: Business and Economic Statistics Instructor: Yogesh Uppal Email: [email protected].
Dec 14, 2015
Welcome message from author
This document is posted to help you gain knowledge. Please leave a comment to let me know what you think about it! Share it to your friends and learn new things together.
Transcript


Chapter 11Inferences About Population Variances
Inference about a Population Variance
Chi-Square Distribution Interval Estimation of 2
Hypothesis Testing

Chi-Square Distribution
We will use the notation to denote the value for the chi-square distribution that provides an area of to the right of the stated value.
For example, Chi-squared value with 5 degrees of freedom (df) at =0.05 is 11.07.

95% of thepossible 2 values 95% of thepossible 2 values
22
00
.05.05
2.025 2.025
Interval Estimation of 2
= 11.07= 11.07

Interval Estimate of a Population Variance
Interval Estimation of 2
( ) ( )
/ ( / )
n s n s
1 12
22
22
1 22
( ) ( )
/ ( / )
n s n s
1 12
22
22
1 22
where the where the values are based on a chi-squarevalues are based on a chi-square
distribution with distribution with nn - 1 degrees of freedom and - 1 degrees of freedom and
1 - 1 - is the confidence coefficient. is the confidence coefficient.

Interval Estimation of Interval Estimate of a Population Standard Deviation
Taking the square root of the upper and lowerTaking the square root of the upper and lower
limits of the variance interval provides the confidencelimits of the variance interval provides the confidence
interval for the population standard deviation.interval for the population standard deviation.
2 2
2 2/ 2 (1 / 2)
( 1) ( 1)n s n s
2 2
2 2/ 2 (1 / 2)
( 1) ( 1)n s n s

Example: Buyer’s Digest (A): Buyer’s Digest rates thermostats manufactured for home temperature control. In a recent test, 10 thermostats manufactured by ThermoRite were selected and placed in a test room that was maintained at a temperature of 68oF. The temperature readings of the ten thermostats are shown on the next slide.
Interval Estimation of 2

Interval Estimation of 2
We will use the 10 readings below toWe will use the 10 readings below todevelop a 95% confidence intervaldevelop a 95% confidence intervalestimate of the population variance.estimate of the population variance.
Example: Buyer’s Digest (A)
Temperature Temperature 67.4 67.8 68.2 69.3 69.5 67.0 68.1 68.6 67.9 67.267.4 67.8 68.2 69.3 69.5 67.0 68.1 68.6 67.9 67.2
ThermostatThermostat 1 2 3 4 5 6 7 8 9 101 2 3 4 5 6 7 8 9 10

Degrees
of Freedom .99 .975 .95 .90 .10 .05 .025 .01
5 0.554 0.831 1.145 1.610 9.236 11.070 12.832 15.0866 0.872 1.237 1.635 2.204 10.645 12.592 14.449 16.8127 1.239 1.690 2.167 2.833 12.017 14.067 16.013 18.4758 1.647 2.180 2.733 3.490 13.362 15.507 17.535 20.0909 2.088 2.700 3.325 4.168 14.684 16.919 19.023 21.666
10 2.558 3.247 3.940 4.865 15.987 18.307 20.483 23.209
Area in Upper TailDegrees
of Freedom .99 .975 .95 .90 .10 .05 .025 .01
5 0.554 0.831 1.145 1.610 9.236 11.070 12.832 15.0866 0.872 1.237 1.635 2.204 10.645 12.592 14.449 16.8127 1.239 1.690 2.167 2.833 12.017 14.067 16.013 18.4758 1.647 2.180 2.733 3.490 13.362 15.507 17.535 20.0909 2.088 2.700 3.325 4.168 14.684 16.919 19.023 21.666
10 2.558 3.247 3.940 4.865 15.987 18.307 20.483 23.209
Area in Upper Tail
Interval Estimation of 2
Selected Values from the Chi-Square Distribution TableSelected Values from the Chi-Square Distribution Table
Our Our value value
Our Our value value
2.9752.975
For n - 1 = 10 - 1 = 9 d.f. and = .05

Sample variance s2 provides a point estimate of 2.
sx xni2
2
16 39
70
( ) .
.sx xni2
2
16 39
70
( ) .
.
( )..
( )..
10 1 7019 02
10 1 702 70
2 ( ).
.( ).
.10 1 70
19 0210 1 70
2 702
Interval Estimation of 2
.33 .33 << 2 2 << 2.33 2.33
A 95% confidence interval for the population variance is given by:

Hypothesis Testing about a Population Variance Left-Tailed Test
22
02
1 ( )n s
22
02
1 ( )n s
where is the hypothesized valuewhere is the hypothesized valuefor the population variancefor the population variance
20 20
•Test StatisticTest Statistic
•HypothesesHypotheses2 2
0: aH 2 20: aH
20
20 : H

Left-Tailed Test (continued)Left-Tailed Test (continued)
Hypothesis TestingHypothesis TestingAbout a Population VarianceAbout a Population Variance
Reject Reject HH00 if if pp-value -value << pp-Value approach:-Value approach:
Critical value approach:Critical value approach:•Rejection RuleRejection Rule
Reject Reject HH00 if if 2 2(1 ) 2 2(1 )
where is based on a chi-squarewhere is based on a chi-squaredistribution with distribution with nn - 1 d.f. - 1 d.f.
2(1 ) 2(1 )

Right-Tailed Test
Hypothesis TestingAbout a Population Variance
Ha : 202Ha : 202
22
02
1 ( )n s
22
02
1 ( )n s
where is the hypothesized valuewhere is the hypothesized valuefor the population variancefor the population variance
20 20
•Test StatisticTest Statistic
•HypothesesHypotheses 20
20 : H

Right-Tailed Test (continued)Right-Tailed Test (continued)
Hypothesis TestingHypothesis TestingAbout a Population VarianceAbout a Population Variance
Reject Reject HH00 if if 2 2 2 2
Reject Reject HH00 if if pp-value -value <<
22where is based on a chi-squarewhere is based on a chi-square
distribution with distribution with nn - 1 d.f. - 1 d.f.
pp-Value approach:-Value approach:
Critical value approach:Critical value approach:•Rejection RuleRejection Rule

Two-Tailed Test
Hypothesis TestingAbout a Population Variance
22
02
1 ( )n s
22
02
1 ( )n s
where is the hypothesized valuewhere is the hypothesized valuefor the population variancefor the population variance
20 20
•Test StatisticTest Statistic
•HypothesesHypotheses
Ha : 202Ha : 202
H02
02: H0
202:

Two-Tailed Test (continued)Two-Tailed Test (continued)
Hypothesis TestingHypothesis TestingAbout a Population VarianceAbout a Population Variance
Reject Reject HH00 if if pp-value -value <<
pp-Value approach:-Value approach:
Critical value approach:Critical value approach:•Rejection RuleRejection Rule
2 2 2 2(1 / 2) / 2 or 2 2 2 2(1 / 2) / 2 or Reject Reject HH00 if if
where are based on awhere are based on achi-square distribution with chi-square distribution with nn - 1 d.f. - 1 d.f.
2 2(1 / 2) / 2 and 2 2(1 / 2) / 2 and

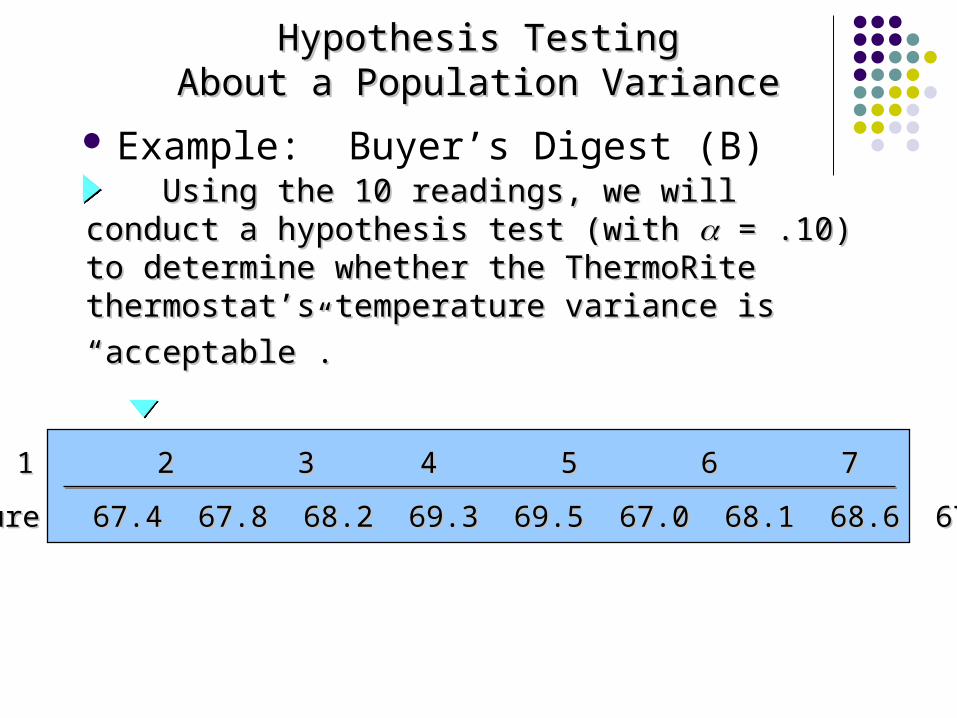
Example: Buyer’s Digest (B): Recall that Buyer’s Digest is rating ThermoRite thermostats. Buyer’s Digest gives an “acceptable” rating to a thermostat with a temperature variance of 0.5 or less.
Hypothesis TestingHypothesis TestingAbout a Population VarianceAbout a Population Variance
We will conduct a hypothesis test (with = .10) to determine whether the ThermoRite thermostat’s temperature variance is “acceptable”.
Hypothesis TestingHypothesis TestingAbout a Population VarianceAbout a Population Variance
Using the 10 readings, we will conduct a Using the 10 readings, we will conduct a hypothesis test (with hypothesis test (with = .10) to determine = .10) to determine whether the ThermoRite thermostat’s whether the ThermoRite thermostat’s temperature variance istemperature variance is
““acceptable”.acceptable”.
Example: Buyer’s Digest (B)
Temperature Temperature 67.4 67.8 68.2 69.3 69.5 67.0 68.1 68.6 67.9 67.267.4 67.8 68.2 69.3 69.5 67.0 68.1 68.6 67.9 67.2
ThermostatThermostat 1 2 3 4 5 6 7 8 9 101 2 3 4 5 6 7 8 9 10

Hypotheses
2: 0.5aH 2: 0.5aH
Hypothesis TestingHypothesis TestingAbout a Population VarianceAbout a Population Variance
Reject Reject HH00 if if 22 >> 14.684 14.684
Rejection Rule
5.0: 20 H

Degrees
of Freedom .99 .975 .95 .90 .10 .05 .025 .01
5 0.554 0.831 1.145 1.610 9.236 11.070 12.832 15.0866 0.872 1.237 1.635 2.204 10.645 12.592 14.449 16.8127 1.239 1.690 2.167 2.833 12.017 14.067 16.013 18.4758 1.647 2.180 2.733 3.490 13.362 15.507 17.535 20.0909 2.088 2.700 3.325 4.168 14.684 16.919 19.023 21.666
10 2.558 3.247 3.940 4.865 15.987 18.307 20.483 23.209
Area in Upper TailDegrees
of Freedom .99 .975 .95 .90 .10 .05 .025 .01
5 0.554 0.831 1.145 1.610 9.236 11.070 12.832 15.0866 0.872 1.237 1.635 2.204 10.645 12.592 14.449 16.8127 1.239 1.690 2.167 2.833 12.017 14.067 16.013 18.4758 1.647 2.180 2.733 3.490 13.362 15.507 17.535 20.0909 2.088 2.700 3.325 4.168 14.684 16.919 19.023 21.666
10 2.558 3.247 3.940 4.865 15.987 18.307 20.483 23.209
Area in Upper TailSelected Values from the Chi-Square Distribution TableSelected Values from the Chi-Square Distribution Table
For n - 1 = 10 - 1 = 9 d.f. and = .10
Hypothesis Testing About a Population Hypothesis Testing About a Population VarianceVariance
Our Our value value Our Our value value
2.10 2.10

22
00 14.68414.684
Area in UpperArea in UpperTail = .10Tail = .10Area in UpperArea in UpperTail = .10Tail = .10
Hypothesis TestingHypothesis TestingAbout a Population VarianceAbout a Population Variance
Rejection Region
2 22
2
( 1) 9.5
n s s
2 2
22
( 1) 9.5
n s s
Reject Reject HH00Reject Reject HH00

Test Statistic
2 9(.7)12.6
.5 2 9(.7)
12.6.5
Hypothesis TestingHypothesis TestingAbout a Population VarianceAbout a Population Variance
Because Because 22 = 12.6 is less than 14.684, we cannot = 12.6 is less than 14.684, we cannot
reject reject HH00. The sample variance . The sample variance ss22 = .7 is insufficient = .7 is insufficient
evidence to conclude that the temperature varianceevidence to conclude that the temperature variance
for ThermoRite thermostats is unacceptable.for ThermoRite thermostats is unacceptable.
Conclusion
The sample variance The sample variance s s 22 = 0.7 = 0.7
Related Documents