RESEARCH Open Access Ecological and network analyses identify four microbial species with potential significance for the diagnosis/treatment of ulcerative colitis (UC) Wendy Li 1,2† , Yang Sun 3† , Lin Dai 4 , Hongju Chen 1,2,5 , Bin Yi 5 , Junkun Niu 3 , Lan Wang 3 , Fengrui Zhang 3 , Juan Luo 3 , Kunhua Wang 6 , Rui Guo 3 , Lianwei Li 1,2 , Quan Zou 7 , Zhanshan (Sam) Ma 1,2,8* and Yinglei Miao 3* Abstract Background: Ulcerative colitis (UC) is one of the primary types of inflammatory bowel disease (IBD), the occurrence of which has been increasing worldwide. Although IBD is an intensively studied human microbiome-associated disease, research on Chinese populations remains relatively limited, particularly on the mucosal microbiome. The present study aimed to analyze the changes in the mucosal microbiome associated with UC from the perspectives of medical ecology and complex network analysis. Results: In total, 56 mucosal microbiome samples were collected from 28 Chinese UC patients and their healthy family partners, followed by amplicon sequencing. Based on sequencing data, we analyzed species diversity, shared species, and inter-species interactions at the whole community, main phyla, and core/periphery species levels. We identified four opportunistic “pathogens” (i.e., Clostridium tertium, Odoribacter splanchnicus, Ruminococcus gnavus, and Flavonifractor plautii ) with potential significance for the diagnosis and treatment of UC, which were inhibited in healthy individuals, but unrestricted in the UC patients. In addition, we also discovered in this study: ( i ) The positive-to-negative links (P/N) ratio, which measures the balance of species interactions or inhibition effects in microbiome networks, was significantly higher in UC patients, indicating loss of inhibition against potentially opportunistic “ pathogens” associated with dysbiosis. (ii ) Previous studies have reported conflicting evidence regarding species diversity and composition between UC patients and healthy controls. Here, significant differences were found at the major phylum and core/periphery scales, but not at the whole community level. Thus, we argue that the paradoxical results found in existing studies are due to the scale effect. (Continued on next page) © The Author(s). 2021 Open Access This article is licensed under a Creative Commons Attribution 4.0 International License, which permits use, sharing, adaptation, distribution and reproduction in any medium or format, as long as you give appropriate credit to the original author(s) and the source, provide a link to the Creative Commons licence, and indicate if changes were made. The images or other third party material in this article are included in the article's Creative Commons licence, unless indicated otherwise in a credit line to the material. If material is not included in the article's Creative Commons licence and your intended use is not permitted by statutory regulation or exceeds the permitted use, you will need to obtain permission directly from the copyright holder. To view a copy of this licence, visit http://creativecommons.org/licenses/by/4.0/. The Creative Commons Public Domain Dedication waiver (http://creativecommons.org/publicdomain/zero/1.0/) applies to the data made available in this article, unless otherwise stated in a credit line to the data. * Correspondence: [email protected]; [email protected] † Wendy Li and Yang Sun contributed equally to this work. 1 Computational Biology and Medical Ecology Lab, State Key Laboratory of Genetic Resources and Evolution, Kunming Institute of Zoology, Chinese Academy of Sciences, Kunming, China 3 Department of Gastroenterology, The First Affiliated Hospital of Kunming Medical University, Yunnan Institute of Digestive Disease, Kunming, Yunnan, China Full list of author information is available at the end of the article Li et al. BMC Microbiology (2021) 21:138 https://doi.org/10.1186/s12866-021-02201-6

Welcome message from author
This document is posted to help you gain knowledge. Please leave a comment to let me know what you think about it! Share it to your friends and learn new things together.
Transcript

RESEARCH Open Access
Ecological and network analyses identifyfour microbial species with potentialsignificance for the diagnosis/treatment ofulcerative colitis (UC)Wendy Li1,2†, Yang Sun3†, Lin Dai4, Hongju Chen1,2,5, Bin Yi5, Junkun Niu3, Lan Wang3, Fengrui Zhang3, Juan Luo3,Kunhua Wang6, Rui Guo3, Lianwei Li1,2, Quan Zou7, Zhanshan (Sam) Ma1,2,8* and Yinglei Miao3*
Abstract
Background: Ulcerative colitis (UC) is one of the primary types of inflammatory bowel disease (IBD), the occurrenceof which has been increasing worldwide. Although IBD is an intensively studied human microbiome-associateddisease, research on Chinese populations remains relatively limited, particularly on the mucosal microbiome. Thepresent study aimed to analyze the changes in the mucosal microbiome associated with UC from the perspectivesof medical ecology and complex network analysis.
Results: In total, 56 mucosal microbiome samples were collected from 28 Chinese UC patients and their healthy familypartners, followed by amplicon sequencing. Based on sequencing data, we analyzed species diversity, shared species, andinter-species interactions at the whole community, main phyla, and core/periphery species levels. We identified fouropportunistic “pathogens” (i.e., Clostridium tertium, Odoribacter splanchnicus, Ruminococcus gnavus, and Flavonifractor plautii)with potential significance for the diagnosis and treatment of UC, which were inhibited in healthy individuals, butunrestricted in the UC patients. In addition, we also discovered in this study: (i) The positive-to-negative links (P/N) ratio,which measures the balance of species interactions or inhibition effects in microbiome networks, was significantly higher inUC patients, indicating loss of inhibition against potentially opportunistic “pathogens” associated with dysbiosis. (ii) Previousstudies have reported conflicting evidence regarding species diversity and composition between UC patients and healthycontrols. Here, significant differences were found at the major phylum and core/periphery scales, but not at the wholecommunity level. Thus, we argue that the paradoxical results found in existing studies are due to the scale effect.
(Continued on next page)
© The Author(s). 2021 Open Access This article is licensed under a Creative Commons Attribution 4.0 International License,which permits use, sharing, adaptation, distribution and reproduction in any medium or format, as long as you giveappropriate credit to the original author(s) and the source, provide a link to the Creative Commons licence, and indicate ifchanges were made. The images or other third party material in this article are included in the article's Creative Commonslicence, unless indicated otherwise in a credit line to the material. If material is not included in the article's Creative Commonslicence and your intended use is not permitted by statutory regulation or exceeds the permitted use, you will need to obtainpermission directly from the copyright holder. To view a copy of this licence, visit http://creativecommons.org/licenses/by/4.0/.The Creative Commons Public Domain Dedication waiver (http://creativecommons.org/publicdomain/zero/1.0/) applies to thedata made available in this article, unless otherwise stated in a credit line to the data.
* Correspondence: [email protected]; [email protected]†Wendy Li and Yang Sun contributed equally to this work.1Computational Biology and Medical Ecology Lab, State Key Laboratory ofGenetic Resources and Evolution, Kunming Institute of Zoology, ChineseAcademy of Sciences, Kunming, China3Department of Gastroenterology, The First Affiliated Hospital of KunmingMedical University, Yunnan Institute of Digestive Disease, Kunming, Yunnan,ChinaFull list of author information is available at the end of the article
Li et al. BMC Microbiology (2021) 21:138 https://doi.org/10.1186/s12866-021-02201-6
(Continued from previous page)
Conclusions: Our results reveal changes in the ecology and network structure of the gut mucosal microbiome that mightbe associated with UC, and these changes might provide potential therapeutic mechanisms of UC. The four opportunisticpathogens that were identified in the present study deserve further investigation in future studies.
Keywords: Inflammatory bowel disease, Ulcerative colitis, Mucosal microbiome, Species diversity, Species co-occurrencenetwork, Core/periphery network
BackgroundInflammatory bowel disease (IBD) exhibits chronic and re-lapsing inflammation of the gastrointestinal tract. Crohn’sdisease (CD), ulcerative colitis (UC), and ileal CD are thethree most common phenotypes of IBD. The incidence ofIBD is increasing worldwide, with over 3.5 million suffers inthe United States and Europe [41]. However, the pathogen-esis of IBD remains unclear, although may be related to thedysregulation of the internal mucosal environment due tochanges in host genes, environmental factors, gut microbes,and immune responses [1, 28, 31, 35, 42, 45]. Studies haveidentified that variations in several genes are associated withIBD risk, including NOD2, ATG16L1, CARD9, and CLEC7A[28], with diet, medication, and geography also involved indisease development [1, 33].The human gut microbiome plays a key role in nutrient
metabolism, pathogen protection, and immune system devel-opment. Dysbiosis of the gut microbiome is also associatedwith IBD [31, 48]. Common gut microbiome changes in IBDpatients, for example, include a lower abundance of obligateanaerobic bacteria of short-chain fatty acids (SCFAs) and anincrease in abundance of facultative anaerobes [15, 30, 42,51, 59]. Through long-term continuous sampling of IBD pa-tients and healthy controls, Halfvarson et al. [18] reportedgreater fluctuation in the gut microbiome of the IBD cohortthan of healthy controls. Changes in the microbiome com-position are often accompanied by gut function disorders [5,16, 22, 35]. For example, the species and microbial metabo-lites associated with oxidative stress responses are signifi-cantly increased in the gastrointestinal tract of IBD patients[16]. IBD may also affect secondary bile acid metabolism inthe gut microbiome [22]. Moreover, core metabolic functionsare persistent and redundant across multiple gut microbialphyla, despite temporal variations in microbial taxa, ge-nomes, and proteomes [5]. Thus, the gut microbiome ap-pears to play a key role in the pathogenesis of IBD, althoughthe causal relationship between microbiome dysbiosis andIBD is still unclear. Therefore, correcting the gut microbiomeor its functions in patients has become a target for IBD ther-apy, and can be achieved through various strategies, such asantibiotics, probiotics, and fecal microbial transplantation(FMT) [11, 32, 56, 63, 64].The objective of the current study was to investigate the
influence of UC on the intestinal mucosal microbiome fromthe perspective of medical ecology and complex network
analysis. We analyzed 56 mucosal microbiomes from 28Chinese UC patients and their healthy family partners fromthree aspects, including species diversity, shared species, andinter-species relationships. All analyses were performed atthe whole community, main phylum, and core/peripheryspecies network scales.
Materials and methodsStudy design and sample collectionAll study procedures involving human subjects were ap-proved by the Medical Ethics Board of the First People’sHospital of Yunnan Province, China. Written and verbal in-formed consent were obtained from all participants. Micro-bial samples of intestinal mucosa were collected from 28couples. Each couple consisted of one UC patient and ahealthy control. All 56 participants were from Kunming,China, and were between the ages of 18 and 60 years old.Healthy volunteers were free of gastrointestinal illnesses anddid not use drugs during endoscopy, nor did they take antibi-otics during the year prior to sample collection. The diagno-sis of UC was based on standard endoscopic, radiographic,and histologic criteria. All patients had been under treatmentwith Mesalazine. Mucosal samples were collected in themorning from the participants without undergoing bowelcleansing preparation. The intestinal mucosal sample wastaken 10 cm from the anus using disposable biopsy forceps.After sampling, mucosal samples were immediately frozen inliquid nitrogen and stored at − 80 °C until DNA extraction.
DNA extraction, 16S rRNA sequencing, and taxonomicassignment of readsBacterial 16S rRNA genes were amplified by polymerasechain reaction (PCR) using barcoded primers flankingthe hypervariable regions V3 and V4. Amplicons weresequenced using the Illumina pyrosequencer platform.Raw data were filtered to eliminate adapter pollutionand low-quality reads to obtain high-quality clean reads.The overlapping paired-end reads were then merged totags. In total, we obtained 3,062,675 tags withoutprimers, with 27,345 tags per sample on average. Tagswere clustered into operational taxonomic units (OTUs)using scripts in USEARCH (v7.0.1090) at 97% sequencesimilarity [14]. OTU representative sequences were taxo-nomically classified using the Ribosomal Database
Li et al. BMC Microbiology (2021) 21:138 Page 2 of 12

Project (RDP) Classifier v.2.2 trained on the Greengenesdatabase.
Measuring microbiome diversity with Hill numbersMicrobiome diversity was quantified using Hill [24]numbers, which were reintroduced to ecology by Jost[27] and Chao et al. [8, 9], defined as:
qD ¼XS
i¼1
pqi
!1= 1−qð Þð1Þ
where D is the diversity, q is the order number of diver-sity, S is the number of species (or OTUs), and pi is therelative abundance of species i. Hill numbers at differentq orders correspond to special ecological diversity indi-ces, in which 0D is equal to species richness, 1D repre-sents the exponential of the Shannon index, and 2Drepresents the reciprocal of the Simpson index. The lar-ger the diversity order q, the more sensitive qD is to spe-cies with high abundance.We used effect size calculated with Cohen’s [10] d-
statistic to examine differences in diversity between twogroups. A p-value of < 0.05 indicated significant differ-ence in microbiome diversity between two groups.
Shared species analysisThe null hypothesis (H0) of shared species (OTUs) isthat the number of shared OTUs between the twogroups is no less than that between any two randomgroups. The alternative hypothesis (HA) is that the num-ber of shared OTUs between two groups is less than thatbetween any two random groups. We applied two algo-rithms to estimate the number of shared OTUs betweentwo random groups (expected number of shared OTUs).The first algorithm (A1) was applied to randomly re-assign OTUs and samples in the two groups, as follows:(i) Total number of reads (abundances) for each OTU inthe two groups was first computed. (ii) For each OTU,the reads from the two groups were pooled together.(iii) The number of reads of each OTU was randomlyreassigned into two new groups, and the number ofshared OTUs between these two new groups was com-puted. The total number of reads in each new groupshould remain the same as that in the corresponding ob-served group. (iv) Step (iii) was repeated 1000 times. (v)The pseudo p-value was finally calculated, as follows:
p ¼ D=1000
where D is the number of times the numbers of ex-pected shared OTUs from 1000 random reassignmentsexceeded the number of observed shared OTUs. A p-
value of < 0.05 indicated strong evidence to reject thenull hypothesis and accept the alternative hypothesis.The second algorithm (A2) was used to randomly re-
assign samples only, with the following steps: (i) Allsamples from the two groups were pooled together. (ii)The samples were randomly reassigned into two newgroups. The total number of samples in the two newgroups should remain the same as that in the corre-sponding observed groups. The number of shared OTUsbetween the two new groups was computed. (iii) Step(ii) was repeated 1000 times. (iv) The pseudo p-valuewas calculated as follows:
p ¼ D=1000
where D is the number of times that the number of ex-pected shared OTUs from 1000 random reassignmentsexceeded the number of observed shared OTUs. A p-value of < 0.05 indicated strong evidence to reject thenull hypothesis and accept the alternative hypothesis.
Species co-occurrence network (SCN) analysisTo reduce the noise of spurious OTUs, we filtered thoseOTUs with total reads from all samples of < 25. As thenumber of samples for each group was 28, the OTUs re-moved were equivalent to singletons with approximatelyone read per sample. Spearman’s correlation coefficientscomputed with the relative abundance of OTUs wereadjusted with the false discovery rate (FDR) control withp = 0.05. Cytoscape (v2.8.3) was used to visualize net-works [54] and the iGraph R-package [12] was used tocompute basic network properties. The MCODE plug-in[3] of Cytoscape was used to detect network clusters(modules). In addition, we also detected the positive-to-negative links (P/N) ratios in the SCNs, as introduced byMa [36].
Core/periphery network (CPN) analysisCore-periphery structures in a network consist of twoclasses of nodes, i.e., dense cohesive core nodes andsparse connected periphery nodes [6]. In an ideal core-periphery network, core nodes are fully connected toeach other and to some periphery nodes, whereas per-iphery nodes are not connected with other peripherynodes [13]. The objective function (ρ) is used to measurehow well the real structure approximates the ideal, de-fined as:
ρ ¼X
i; j
aijδij ð2Þ
In the equation, aij represents the presence or absenceof the link between node i and node j, where aij = 1 ifnode i and node j are linked, and 0 otherwise. δij indi-cates the presence or absence of a link between node i
Li et al. BMC Microbiology (2021) 21:138 Page 3 of 12
and node j in the ideal core/periphery network, whereδij = 1 if node i or/and node j are core, and 0 otherwise.Let A be the adjacency matrix of aij, and Δ be the adja-cency matrix of δij. When A and Δ are identical, themeasure ρ achieves its maximum value. When ρ is max-imum, we can classify the node into either core or per-iphery based on δ. We implemented the CPN analysis inPython using code provided by Ma & Ellison [37].
ResultsBioinformatics analysis of sequencing dataThe 28 UC patients included 11 females and 17 males,and 28 healthy controls included 17 females and 11males. There were 842 and 860 OTUs in the healthy andUC groups, respectively. Fifteen known phyla were iden-tified in the mucosal microbiome, with Firmicutes, Bac-teroidetes, and Proteobacteria found to be dominant.In addition, we built the SCNs based on the mucosal
microbiomes of the healthy and UC subjects, and di-vided the OTUs (species) in each network into core andperiphery groups using CPN analysis, which can revealglobal characteristics of network structure and stability.The results are listed in Table S1. In the microbiome ofhealthy individuals, there were 146 core species and 170periphery species. In the microbiome of UC patients,there were 190 core species and 206 periphery species.
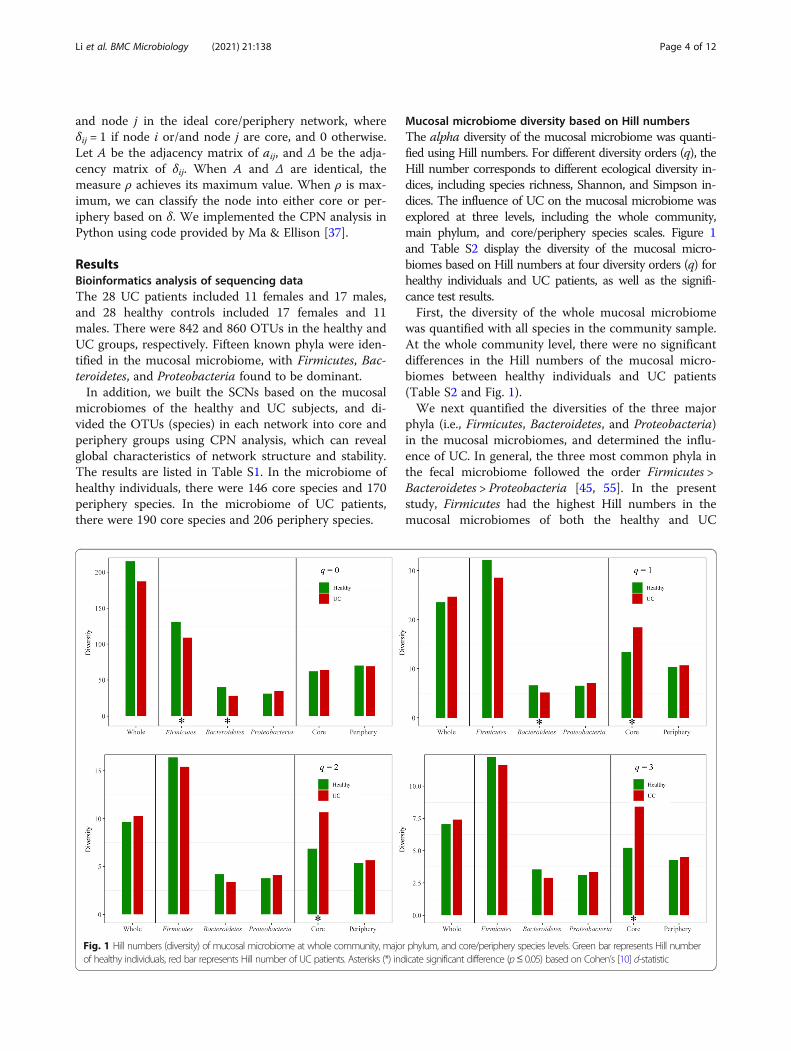
Mucosal microbiome diversity based on Hill numbersThe alpha diversity of the mucosal microbiome was quanti-fied using Hill numbers. For different diversity orders (q), theHill number corresponds to different ecological diversity in-dices, including species richness, Shannon, and Simpson in-dices. The influence of UC on the mucosal microbiome wasexplored at three levels, including the whole community,main phylum, and core/periphery species scales. Figure 1and Table S2 display the diversity of the mucosal micro-biomes based on Hill numbers at four diversity orders (q) forhealthy individuals and UC patients, as well as the signifi-cance test results.First, the diversity of the whole mucosal microbiome
was quantified with all species in the community sample.At the whole community level, there were no significantdifferences in the Hill numbers of the mucosal micro-biomes between healthy individuals and UC patients(Table S2 and Fig. 1).We next quantified the diversities of the three major
phyla (i.e., Firmicutes, Bacteroidetes, and Proteobacteria)in the mucosal microbiomes, and determined the influ-ence of UC. In general, the three most common phyla inthe fecal microbiome followed the order Firmicutes >Bacteroidetes > Proteobacteria [45, 55]. In the presentstudy, Firmicutes had the highest Hill numbers in themucosal microbiomes of both the healthy and UC
Fig. 1 Hill numbers (diversity) of mucosal microbiome at whole community, major phylum, and core/periphery species levels. Green bar represents Hill numberof healthy individuals, red bar represents Hill number of UC patients. Asterisks (*) indicate significant difference (p≤ 0.05) based on Cohen’s [10] d-statistic
Li et al. BMC Microbiology (2021) 21:138 Page 4 of 12
groups. In the mucosal microbiome of healthy individ-uals, the Bacteroidetes Hill number was significantlyhigher than that of Proteobacteria at the diversity orderq = 0 (Cohen’s d = 0.82, p < 0.05). However, in the muco-sal microbiome of UC patients, the Bacteroidetes Hillnumber was significantly lower than that of Proteobac-teria at the diversity order q = 0 (Cohen’s d = − 0.73, p ≤0.05). No significant differences were observed betweenthe Bacteroidetes and Proteobacteria Hill numbers at theother three diversity orders (q = 1, 2, and 3). At the di-versity order q = 0, the Firmicutes Hill number in themucosal microbiome of healthy individuals was signifi-cantly higher than that of UC patients (Table S2). At thediversity orders q = 0 and 1, the Bacteroidetes Hill num-ber in the mucosal microbiome of healthy individualswas significantly higher than that of UC patients. Therewas no significant difference in the Proteobacteria Hillnumber between healthy individuals and UC patients.Third, we quantified the diversities of core and periph-
ery species in the mucosal microbiome. At diversity or-ders q = 1, 2, and 3, the Hill numbers of the core speciesin the mucosal microbiome of the UC patients were sig-nificantly higher than that of the healthy individuals, al-though there was no significant difference in Hillnumbers at q = 0 between healthy and UC subjects (Fig.1 and Table S2). There were no significant differences inthe Hill numbers of periphery species between healthy
individuals and UC patients. This indicated that UCmainly affected core species with high abundance.
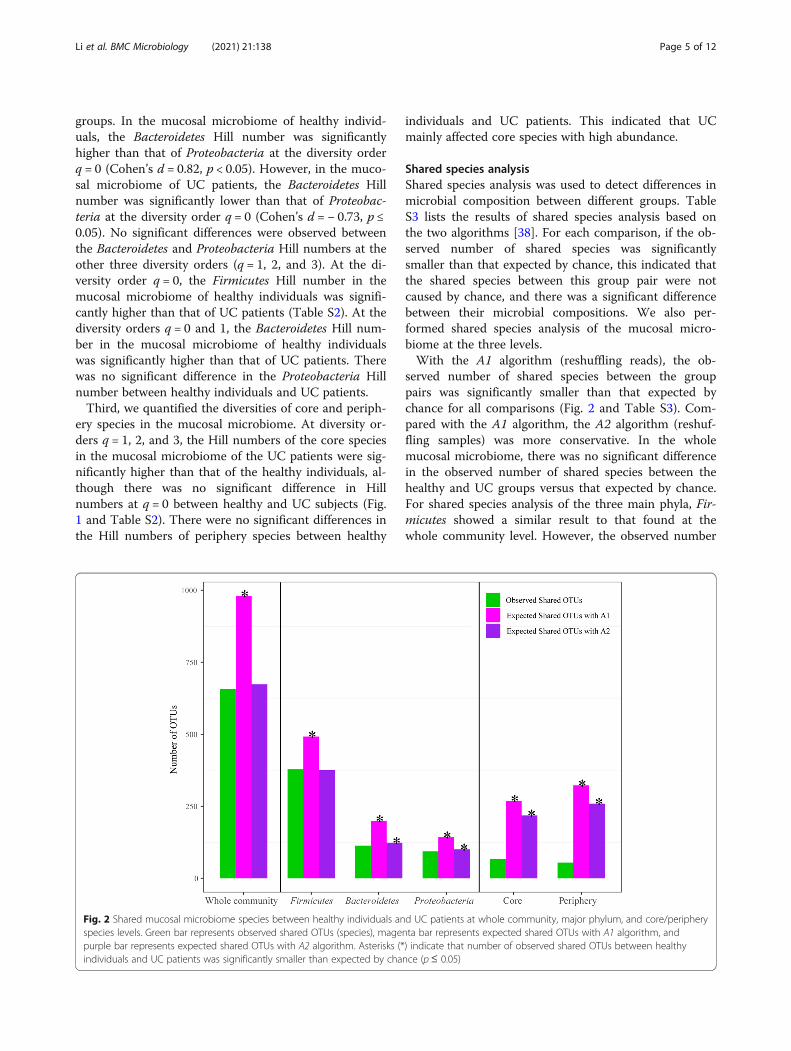
Shared species analysisShared species analysis was used to detect differences inmicrobial composition between different groups. TableS3 lists the results of shared species analysis based onthe two algorithms [38]. For each comparison, if the ob-served number of shared species was significantlysmaller than that expected by chance, this indicated thatthe shared species between this group pair were notcaused by chance, and there was a significant differencebetween their microbial compositions. We also per-formed shared species analysis of the mucosal micro-biome at the three levels.With the A1 algorithm (reshuffling reads), the ob-
served number of shared species between the grouppairs was significantly smaller than that expected bychance for all comparisons (Fig. 2 and Table S3). Com-pared with the A1 algorithm, the A2 algorithm (reshuf-fling samples) was more conservative. In the wholemucosal microbiome, there was no significant differencein the observed number of shared species between thehealthy and UC groups versus that expected by chance.For shared species analysis of the three main phyla, Fir-micutes showed a similar result to that found at thewhole community level. However, the observed number
Fig. 2 Shared mucosal microbiome species between healthy individuals and UC patients at whole community, major phylum, and core/peripheryspecies levels. Green bar represents observed shared OTUs (species), magenta bar represents expected shared OTUs with A1 algorithm, andpurple bar represents expected shared OTUs with A2 algorithm. Asterisks (*) indicate that number of observed shared OTUs between healthyindividuals and UC patients was significantly smaller than expected by chance (p≤ 0.05)
Li et al. BMC Microbiology (2021) 21:138 Page 5 of 12

of shared Bacteroidetes and Proteobacteria species be-tween healthy and UC subjects was significantly smallerthan that expected by chance. Furthermore, the observednumber of shared core/periphery OTUs was significantlysmaller than that expected by chance. As shown in TableS4, the SCNs of the healthy and UC groups shared 67core species and 54 periphery species. Table S5 showsthe shared and specific core/periphery species of eachgroup.Based on the diversity and shared species results, UC
appeared to have little effect on the mucosa microbiomeat the whole community level. However, we found thatUC was associated with dysbiosis of the mucosa micro-biome, characterized by changes in the main bacterialphyla, including a decrease in Firmicutes richness,change in Proteobacteria species composition, and vari-ation in both Bacteroidetes diversity and species com-position. In addition, UC was also associated withchanges in core and periphery species in the mucosalmicrobiome network. According to the Vellend-Hansonsynthesis [21, 61], CPN analysis can effectively detect in-equalities from a node perspective, which are caused bythe selection effects of the mucosa or host environment[34, 39]. Thus, the significant differences in the diversityand composition of the core/periphery species indicatedthat UC may influence the selection effects of the hostenvironment on the OTUs in the mucosal microbiome.
Species co-occurrence network (SCN) analysisWe first removed relatively sparse OTUs from the twomucosal microbiomes (as described in the Materials andMethods). The mucosal microbiome SCNs of thehealthy (healthy-SCN) and UC (UC-SCN) groups werethen constructed, as illustrated in Figs. 3 and 4, respect-ively. Table S6 shows the basic network properties of thetwo SCNs. The number of nodes in the two SCNs wassimilar, but the number of edges in the UC-SCN wastwo times that in the healthy-SCN, which resulted in ahigher average degree. The number of connected com-ponents in the healthy-SCN was nearly twice that of theUC-SCN, indicating that the fragmentation degree of thehealthy-SCN was higher than that of the UC-SCN.The MCODE algorithm was used to detect network
clusters (modules). Results are shown in Table S7, andinclude the cluster number, cluster score, number ofnodes, and number of edges for each cluster. The clusterscore is a measure of cluster density, with a higher clus-ter score indicating a stronger corresponding cluster.The healthy-SCN had only one strong cluster (#1 clus-ter, score > 5), whereas the UC-SCN had two strongclusters (#1 and #2 clusters, scores > 5). These threeclusters consisted of species from the phyla Firmicutesand Proteobacteria. As shown in Fig. 3b, 85% (22/26) ofOTUs (nodes) in the #1 cluster of the healthy-SCN
belonged to Firmicutes and Proteobacteria. As shown inFig. 4b and c, in the UC-SCN, 75% (18/24) of OTUs inthe #1 cluster and all OTUs in the #2 cluster were fromFirmicutes and Proteobacteria. Bacteroidetes specieswere scattered in both SCNs without forming a strongcluster. The healthy-SCN #1 cluster and UC-SCN #2cluster had similar species composition and networkstructure. For species composition, 15 OTUs wereshared between the two clusters (see Table S8). For net-work structure, all interactions within the two clusterswere positive/cooperative, and these clusters both con-tained more than half of the negative/inhibitive interac-tions of their SCNs (Figures S1 and S2). Thus, these twoclusters may play a similar role in their own mucosalmicrobiome.In addition, based on the P/N ratios in the SCNs, UC
was associated with a loss in mucosal microbiome bal-ance in patients. As shown in Table S9, the P/N ratio inthe UC-SCN was five times higher than that in thehealthy-SCN, indicating that the number of inhibitive in-teractions decreased in the mucosa microbiome of UCpatients. The negative links were mainly found withinthe three main phyla, i.e., Firmicutes, Bacteroidetes, andProteobacteria. In the healthy-SCN, 59% (45/76) of nega-tive links were found within Firmicutes and 22% (17/76)were found between Firmicutes and Proteobacteria. Inthe UC-SCN, the number of negative links decreased toless than half that in the healthy-SCN, which was mainlydue to the considerable reduction of negative linkswithin Firmicutes and between Firmicutes and Bacteroi-detes. Compared with the healthy-SCN, we identified amarked increase in the P/N ratios within and among thethree main phyla in the UC-SCN. As mentioned above,we used CPN analysis to divide the OTUs in the net-work into two groups, i.e., core and periphery. In boththe healthy- and UC-SCNs, more than 50% of positiveand negative links were found within the core species.Similar to the patterns observed at the whole communityand main phylum scales, the core, periphery, and core-periphery species in the UC-SCN had higher P/N ratiosthan those in the healthy-SCN.
Potential “pathogens” or research targets of UCThe five times higher P/N ratio in UC patients signaledloss of inhibition to certain potentially opportunisticpathogens. Based on the changes in abundance and P/Nratio of each OTU in UC patients, we set the followingselection criteria for potential pathogens: (i) significantdifferences in abundance between the healthy and UCgroups (Wilcoxon test p ≤ 0.05); (ii) five or more nega-tive links and a P/N ratio of < 0.5 in the healthy-SCN;but (iii) a significantly higher P/N ratio in the UC-SCN.In total, four OTUs or species met the selection cri-
teria, including Clostridium tertium (OTU ID: 175),
Li et al. BMC Microbiology (2021) 21:138 Page 6 of 12

Fig. 3 (See legend on next page.)
Li et al. BMC Microbiology (2021) 21:138 Page 7 of 12

Odoribacter splanchnicus (OTU ID: 221), Ruminococcusgnavus (OTU ID: 32), and Flavonifractor plautii (OTUID: 161) (see Table S10 for details). Results showed anincrease in C. tertium, R. gnavus, and F. plautii, but adecrease in O. splanchnicus in the mucosal microbiomeof UC patients. In addition, C. tertium had the greatestnumber of negative links in the healthy individuals, butonly one negative link in the UC patients. Both O.splanchnicus and F. plautii had 11 and nine negativelinks, respectively, in healthy individuals, but none inUC patients. In the healthy-SCN, R. gnavus only hadnegative links (no positive links), whereas, in the UC-SCN, R. gnavus had 1.5 times more positive links thannegative links. Furthermore, C. tertium and O. splanch-nicus were core species in both healthy and UC subjects,whereas, R. gnavus and F. plautii were core species inhealthy individuals but periphery species in UC subjects.
Discussion and conclusionsWe compared mucosal microbiome samples from 28UC patients and their healthy partners. Analyses fo-cused on species diversity, shared species, and speciesinteractions at three scales (i.e., whole community,major phylum, and core/periphery critical network).Our study revealed three major findings, as summa-rized below.First, the differences between UC patients and
healthy controls in diversity and shared species werescale dependent. At the whole community scale, thedifferences in species diversity and composition werenot obvious. However, at the major phylum and core/periphery species scales, significant differences werefound between the UC patients and healthy controls.Although a reduction in gut microbial diversity in UCpatients has been reported in multiple studies [31, 43,46, 65], other research has found there to be no sig-nificant differences between UC patients and healthyindividuals [7, 20, 52]. These inconsistencies are likelyrelated to differences in study design, subject status,and sample collection processes. Compared with thewhole gut mucosal microbiome, compositional alter-ations at the phylum level are more consistent acrossdifferent studies, e.g., decrease in Firmicutes and Bac-teroidetes [31, 45] and increase in Proteobacteria [16,44]. Moreover, the compositional variation at taxo-nomic scales plays an important role in explainingpathogenesis and assessing therapeutic efficacy. For
example, Ishikawa et al. [25, 26] found that FMT fol-lowing antibiotic pretreatment can effectively improvegut dysbiosis caused by loss of Bacteroidetes in UCpatients. The significance of our first finding rein-forces the critical importance of scale in studies onmicrobiome-associated diseases, and provides thecore/periphery network structure as a new scale formicrobiome research.Second, it is well recognized that UC is associated with
dysbiosis or loss of balance in the gut microbiome of pa-tients [11, 31, 44, 46, 51]. However, no existing studieshave offered quantitative measures to demonstrate theeffects of dysbiosis. In other words, the characterizationof dysbiosis is often presented in the form of qualitativedescription. Our study revealed a considerably higher(five times) P/N ratio in UC patients, signaling the lossof inhibition to certain potentially opportunistic patho-gens. It should be noted that we use the term “pathogen”somewhat differently from the traditional Koch’s postu-lates, i.e., certain bacterial species are responsible for dis-ease. Current research on microbiome-associateddiseases still cannot, in many cases, answer the simplequestion—what are the disease pathogens based on thetraditional Koch’s postulates?Third, the considerable change in P/N ratio not
only quantified the effects of dysbiosis but also helpedto detect the “culprits”. Based on the variations incomposition and P/N ratio, we identified four poten-tially opportunistic pathogens, i.e., C. tertium, O.splanchnicus, R. gnavus, and F. plautii. Clostridiumtertium is an anaerobic gram-positive bacterium inthe phylum Firmicutes. Although C. tertium has trad-itionally been considered non-pathogenic, variousstudies have reported it to be a significant cause ofbacteremia and other infections in neutropenia pa-tients [29, 49, 50, 53, 60]. In addition, C. tertium in-fections in non-neutropenic patients have also beenreported recently [57, 58, 62]. Odoribacter splanchni-cus (Bacteroides splanchnicus) is an anaerobic gram-negative bacterium in Bacteroidetes. Although it isfound in normal human colonic microbiomes, it hasthe potential to be an opportunistic pathogen [17]. Inthe present study, we found reduced abundance of O.splanchnicus in UC patients, consistent with that re-ported in CD patients [42]. Odoribacter splanchnicuscan produce acetate, propionate, and butyrate, whichare associated with the biosynthesis of SCFAs [17].
(See figure on previous page.)Fig. 3 Mucosa microbiome SCN of healthy group and strongest cluster (score > 5): a Mucosa microbiome SCN of healthy group; b Strongest cluster(#1 cluster). Nodes in cyan, OTUs of Firmicutes phylum; nodes in blue, OTUs of Proteobacteria phylum; nodes in purple, OTUs of Bacteroidetes phylum;nodes in gray, OTUs of other phyla; edges in green, positive correlations; edges in red, negative correlations
Li et al. BMC Microbiology (2021) 21:138 Page 8 of 12

The effect of O. splanchnicus variation on UC pa-tients may also be related to the reduction in SCFAs[17, 42]. Ruminococcus gnavus is an anaerobic gram-positive bacterium in the phylum Firmicutes. An in-crease in R. gnavus has been reported previously inthe gut microbiome of IBD patients [19, 46, 65], as
found in the present study. Henke et al. [23] recentlyreported that R. gnavus can produce an inflammatorypolysaccharide, revealing a possible relationship be-tween R. gnavus and IBD pathogenesis. Flavonifractor(Eubacterium) plautii is another anaerobic gram-positive member of Firmicutes. Compared with
Fig. 4 Mucosa microbiome SCN of UC group and top two strongest clusters (scores > 5): a Mucosa microbiome SCN of UC group; b strongestcluster (#1 cluster); c second strongest cluster (#2 cluster). Nodes in cyan, OTUs of Firmicutes phylum; nodes in blue, OTUs of Proteobacteriaphylum; nodes in purple, OTUs of Bacteroidetes phylum; nodes in gray, OTUs of other phyla; edges in green, positive correlations; edges in red,negative correlations
Li et al. BMC Microbiology (2021) 21:138 Page 9 of 12
healthy individuals, patients with IBD have signifi-cantly higher concentrations of mucosal IgG in theirgut, although corresponding antigens remain unclear[4, 40]. Recent studies have found that F. plautii isassociated with enhancement of host intestinal IgGlevels in IBD patients [2, 47]. In summary, our find-ings reinforce the potential importance of these fourspecies, which deserve further investigation in futurestudies.
Supplementary InformationThe online version contains supplementary material available at https://doi.org/10.1186/s12866-021-02201-6.
Additional file 1.
AcknowledgementsNot applicable.
Authors’ contributionsY.S., J.N., and W.L. collected the human specimens and data. W.L. performeddata analysis and drafted the manuscript. L.D., H.C., B.Y., F.Z., K.W., J.L., R.G.,L.L. & Q.Z. participated in the discussion and interpretations of the results;W.L., Y.S., Z.S.M. &Y.L.M. designed the study and revised the manuscript. Allauthors approved the submission.
FundingThis work was supported by National Natural Science Foundation of China(U1802282, 82060107, 81660100, 81670501), Applied Basic Research Projectsof Yunnan Province, China [202001AY070001–202], Open Grants (#GREKF18–14, #GREKF19–07) from “State Key Laboratory of Genetic Resources andEvolution”, Scientific Research Fund of Yunnan Provincial Department ofEducation (2017ZDX076, 2019 J0646).
Availability of data and materialsSequence data from this study were deposited in the GenBank SequenceRead Archive under accession SRA BioProject PRJNA600852.
Declarations
Ethics approval and consent to participateAll study procedures involving human subjects were approved by theMedical Ethics Board of the First People’s Hospital of Yunnan Province, China.Written and verbal informed consent was obtained from all participants. Allmethods were performed in accordance with the relevant guidelines andregulations by including a statement.
Consent for publicationNot applicable.
Competing interestsThere are no conflicts to interest.
Author details1Computational Biology and Medical Ecology Lab, State Key Laboratory ofGenetic Resources and Evolution, Kunming Institute of Zoology, ChineseAcademy of Sciences, Kunming, China. 2Kunming College of Life Sciences,University of Chinese Academy of Sciences, Kunming, China. 3Department ofGastroenterology, The First Affiliated Hospital of Kunming Medical University,Yunnan Institute of Digestive Disease, Kunming, Yunnan, China. 4Faculty ofScience, Kunming University of Science and Technology, Kunming, China.5College of Mathematics, Honghe University, Mengzi, Yunnan Province,China. 6Department of General Surgery, The First Affiliated Hospital ofKunming Medical University, Yunnan Institute of Digestive Disease, Kunming,Yunnan, China. 7Institute of Fundamental and Frontier Sciences, University ofElectronic Science and Technology of China, Chengdu, China. 8Center for
Excellence in Animal Evolution and Genetics, Chinese Academy of Sciences,Kunming, China.
Received: 3 November 2020 Accepted: 5 April 2021
References1. Ananthakrishnan AN. Environmental risk factors for inflammatory bowel
diseases: a review. Dig Dis Sci. 2015;60(2):290–8. https://doi.org/10.1007/s10620-014-3350-9.
2. Armstrong H, Alipour M, Valcheva R, Bording-Jorgensen M, Jovel J, Zaidi D,et al. Host immunoglobulin G selectively identifies pathobionts in pediatricinflammatory bowel diseases. Microbiome. 2019;7(1):1. https://doi.org/10.1186/s40168-018-0604-3.
3. Bader GD, Hogue CW. An automated method for finding molecularcomplexes in large protein interaction networks. Bmc Bioinformatics. 2003;4(1):2–0. https://doi.org/10.1186/1471-2105-4-2.
4. Benckert J, Schmolka N, Kreschel C, Zoller MJ, Sturm A, Wiedenmann B,et al. The majority of intestinal IgA+ and IgG+ plasmablasts in the humangut are antigen-specific. J Clin Investig. 2011;121(5):1946–55. https://doi.org/10.1172/JCI44447.
5. Blakeley-Ruiz JA, Erickson AR, Cantarel BL, Xiong W, Adams R, Jansson JK,et al. Metaproteomics reveals persistent and phylum-redundant metabolicfunctional stability in adult human gut microbiomes of Crohn’s remissionpatients despite temporal variations in microbial taxa, genomes, andproteomes. Microbiome. 2019;7(1):18. https://doi.org/10.1186/s40168-019-0631-8.
6. Borgatti SP, Everett MG. Models of core/periphery structures. Soc Networks.1999;21(4):375–95. https://doi.org/10.1016/S0378-8733(99)00019-2.
7. Bibiloni R, Mangold M, Madsen KL, Fedorak RN, Tannock GW. Thebacteriology of biopsies differs between newly diagnosed, untreated,Crohn's disease and ulcerative colitis patients. J Med Microbiol. 2006;55(8):1141–9. https://doi.org/10.1099/jmm.0.46498-0.
8. Chao A, Chiu CH, Hsieh TC. Proposing a resolution to debates on diversitypartitioning. Ecology. 2012;93(9):2037–51. https://doi.org/10.1890/11-1817.1.
9. Chao A, Chiu CH, Jost L. Unifying species diversity, phylogenetic diversity,functional diversity, and related similarity and differentiation measuresthrough Hill numbers. Annu Rev Ecol Evol Syst. 2014;45(1):297–324. https://doi.org/10.1146/annurev-ecolsys-120213-091540.
10. Cohen J. Statistical Power Analysis for the Behavioral Sciences (2nd).Hillsdale, NJ: Lawrence Erlbaum Associates; 1988.
11. Cohen LJ, Cho JH, Gevers D, Chu H. Genetic factors and the intestinalmicrobiome guide development of microbe-based therapies forinflammatory bowel diseases. Gastroenterology. 2019;156(8):2174–89.https://doi.org/10.1053/j.gastro.2019.03.017.
12. Csardi G, Nepusz T. The iGraph software package for complex networkresearch. Inter J Complex Syst. 2006;1695(1). https://doi.org/10.1186/1471-2105-12-455.
13. Csermely P, London A, Wu LY, Uzzi B. Structure and dynamics of core/periphery networks. J Complex Netw. 2013;1(2):93–123. https://doi.org/10.1093/comnet/cnt016.
14. Edgar RC. UPARSE: highly accurate OTU sequences from microbial ampliconreads. Nat Methods. 2013;10(10):996–8. https://doi.org/10.1038/NMETH.2604.
15. Forbes JD, Van Domselaar G, Bernstein CN. Microbiome survey of theinflamed and noninflamed gut at different compartments within thegastrointestinal tract of inflammatory bowel disease patients. InflammBowel Dis. 2016;22(4):817–25. https://doi.org/10.1097/MIB.0000000000000684.
16. Franzosa EA, Sirota-Madi A, Avila-Pacheco J, Fornelos N, Haiser HJ, Reinker S,et al. Gut microbiome structure and metabolic activity in inflammatorybowel disease. Nat Microbiol. 2019;4(2):293–305. https://doi.org/10.1038/s41564-018-0306-4.
17. Göker M, Gronow S, Zeytun A, Nolan M, Lucas S, Lapidus A, et al.Complete genome sequence of Odoribacter splanchnicus type strain(1651/6). Stand Genomic Sci. 2011;4(2):200–9. https://doi.org/10.4056/sigs.1714269.
18. Halfvarson J, Brislawn CJ, Lamendella R, Vázquez-Baeza Y, Walters WA,Bramer LM, et al. Dynamics of the human gut microbiome in inflammatorybowel disease. Nat Microbiol. 2017;24(6):489–96. https://doi.org/10.1038/nmicrobiol.2017.4.
Li et al. BMC Microbiology (2021) 21:138 Page 10 of 12

19. Hall AB, Yassour M, Sauk J, Garner A, Jiang X, Arthur T, et al. A novel Ruminococcusgnavus clade enriched in inflammatory bowel disease patients. Genome Med. 2017;9(1):103. https://doi.org/10.1186/s13073-017-0490-5.
20. Hansen R, Russell RK, Reiff C, Louis P, McIntosh F, Berry SH, et al. Microbiotaof de-novo pediatric IBD: increased Faecalibacterium prausnitzii andreduced bacterial diversity in Crohn's but not in ulcerative colitis. Am JGastroenterol. 2012;107(12):1913–22. https://doi.org/10.1038/ajg.2012.335.
21. Hanson CA, Fuhrman JA, Horner-Devine MC, Martiny JB. Beyondbiogeographic patterns: processes shaping the microbial landscape. Nat RevMicrobiol. 2012;10(7):497–506. https://doi.org/10.1038/nrmicro2795.
22. Heinken A, Ravcheev DA, Baldini F, Heirendt L, Fleming RMT, Thiele I.Systematic assessment of secondary bile acid metabolism in gut microbesreveals distinct metabolic capabilities in inflammatory bowel disease.Microbiome. 2019;7(1):75. https://doi.org/10.1186/s40168-019-0689-3.
23. Henke MT, Kenny DJ, Cassilly CD, Vlamakis H, Xavier RJ, Clardy J.Ruminococcus gnavus, a member of the human gut microbiome associatedwith Crohn's disease, produces an inflammatory polysaccharide. PNAS. 2019;116(26):12672–7. https://doi.org/10.1073/pnas.1904099116.
24. Hill MO. Diversity and evenness: a unifying notation and its consequences.Ecology. 1973;54(2):427–32. https://doi.org/10.2307/1934352.
25. Ishikawa D, Sasaki T, Osada T, Kuwahara-Arai K, Haga K, Shibuya T, et al.Changes in intestinal microbiota following combination therapy with fecalmicrobial transplantation and antibiotics for ulcerative colitis. InflammBowel Dis. 2017;23(1):116–25. https://doi.org/10.1097/MIB.0000000000000975.
26. Ishikawa D, Sasaki T, Takahashi M, Kuwahara-Arai K, Haga K, Ito S, et al. Themicrobial composition of Bacteroidetes species in ulcerative colitis iseffectively improved by combination therapy with fecal microbiotatransplantation and antibiotics. Inflamm Bowel Dis. 2018;24(12):2590–8.https://doi.org/10.1093/ibd/izy266.
27. Jost L. Partitioning diversity into independent alpha and beta components.Ecology. 2007;88(10):2427–39. https://doi.org/10.1890/06-1736.1.
28. Khor B, Gardet A, Xavier RJ. Genetics and pathogenesis of inflammatorybowel disease. Nature. 2011;474(7351):307–17. https://doi.org/10.1038/nature10209.
29. Kiu R, Caim S, Alcon-Giner C, Belteki G, Clarke P, Pickard D, et al. Preterminfant-associated Clostridium tertium, Clostridium cadaveris, and Clostridiumparaputrificum strains: genomic and evolutionary insights. Genome BiolEvol. 2017;9(10):2707–14. https://doi.org/10.1093/gbe/evx210.
30. Knights D, Silverberg MS, Weersma RK, Gevers D, Dijkstra G, Huang H, et al. Complexhost genetics influence the microbiome in inflammatory bowel disease. GenomeMed. 2014;6(12):107. https://doi.org/10.1186/s13073-014-0107-1.
31. Kostic AD, Xavier RJ, Gevers D. The microbiome in inflammatory boweldisease: current status and the future ahead. Gastroenterology. 2014;146(6):1489–99. https://doi.org/10.1053/j.gastro.2014.02.009.
32. Kump PK, Gröchenig HP, Lackner S, Trajanoski S, Reicht G, Hoffmann KM,et al. Alteration of intestinal dysbiosis by fecal microbiota transplantationdoes not induce remission in patients with chronic active ulcerative colitis.Inflamm Bowel Dis. 2013;19(10):2155–65. https://doi.org/10.1097/MIB.0b013e31829ea325.
33. Lee D, Albenberg L, Compher C, Baldassano R, Piccoli D, Lewis JD, et al. Dietin the pathogenesis and treatment of inflammatory bowel diseases.Gastroenterology. 2015;148(6):1087–106. https://doi.org/10.1053/j.gastro.
34. Li W, Ma ZS. Diversity scaling of human vaginal microbial communities. Zool Res.2019;40(6):587–94. https://doi.org/10.24272/j.issn.2095-8137.2019.068.
35. Lloyd-Price J, Arze C, Ananthakrishnan AN, et al. Multi-omics of the gutmicrobial ecosystem in inflammatory bowel diseases. Nature. 2019;569(7758):655–62. https://doi.org/10.1038/s41586-019-1237-9.
36. Ma ZS. The P/N (positive-to-negative links) ratio in complex networks-apromising in Silico biomarker for detecting changes occurring in thehuman microbiome. Microb Ecol. 2018;75(4):1063–73. https://doi.org/10.1007/s00248-017-1079-7.
37. Ma ZS, Ellison AM. Dominance network analysis provides a new frameworkfor studying the diversity-stability relationship. Ecol Monogr. 2019;89(2):e01358. https://doi.org/10.1002/ecm.1358.
38. Ma ZS, Li L, Gotelli NJ. Diversity-disease relationships and shared speciesanalyses for human microbiome-associated diseases. ISME J. 2019;13(8):1911–9. https://doi.org/10.1038/s41396-019-0395-y.
39. Ma ZS, Li W. How and why men and women differ in their microbiomes:medical ecology and network analyses of the Microgenderome. Adv Sci.2019;6(23):1902054. https://doi.org/10.1002/advs.201902054.
40. Macpherson A, Khoo UY, Forgacs I, Philpott-Howard J, Bjarnason I. Mucosalantibodies in inflammatory bowel disease are directed against intestinalbacteria. Gut. 1996;38(3):365–75. https://doi.org/10.1136/gut.38.3.365.
41. Miyoshi J, Chang EB. The gut microbiota and inflammatory bowel diseases.Transl Res. 2017;179:38–48. https://doi.org/10.1016/j.trsl.2016.06.002.
42. Morgan XC, Tickle TL, Sokol H, Gevers D, Devaney KL, Ward DV, et al.Dysfunction of the intestinal microbiome in inflammatory bowel diseaseand treatment. Genome Biol. 2012;13(9):R79. https://doi.org/10.1186/gb-2012-13-9-r79.
43. Nemoto H, Kataoka K, Ishikawa H, Ikata K, Arimochi H, Iwasaki T, et al.Reduced diversity and imbalance of fecal microbiota in patients withulcerative colitis. Dig Dis Sci. 2012;57(11):2955–64. https://doi.org/10.1007/s10620-012-2236-y.
44. Ni J, Wu GD, Albenberg L, Tomov VT. Gut microbiota and IBD: causation orcorrelation? Nat Rev Gastroenterol Hepatol. 2017;14(10):573–84. https://doi.org/10.1038/nrgastro.2017.88.
45. Nishida A, Inoue R, Inatomi O, Bamba S, Naito Y, Andoh A. Gut microbiotain the pathogenesis of inflammatory bowel disease. Clin J Gastroenterol.2018;11(1):1–10. https://doi.org/10.1007/s12328-017-0813-5.
46. Nishino K, Nishida A, Inoue R, Kawada Y, Ohno M, Sakai S, et al. Analysis ofendoscopic brush samples identified mucosa-associated dysbiosis ininflammatory bowel disease. J Gastroenterol. 2018;53(1):95–106. https://doi.org/10.1007/s00535-017-1384-4.
47. Pike BL, Paden KA, Alcala AN, Jaep KM, Gormley RP, Maue AC, et al.Immunological biomarkers in Postinfectious irritable bowel syndrome. JTravel Med. 2015;22(4):242–50. https://doi.org/10.1111/jtm.12218.
48. Rajca S, Grondin V, Louis E, Vernier-Massouille G, Grimaud JC, Bouhnik Y,et al. Alterations in the intestinal microbiome (dysbiosis) as a predictor ofrelapse after infliximab withdrawal in Crohn's disease. Inflamm Bowel Dis.2014;20(6):978–86. https://doi.org/10.1097/MIB.0000000000000036.
49. Ray P, Das A, Singh K, Bhansali A, Yadav TD. Clostridium tertium innecrotizing fasciitis and gangrene. Emerg Infect Dis. 2003;9(10):1347–8.https://doi.org/10.3201/eid0910.030287.
50. Salvador F, Porte L, Durán L, Marcotti A, Pérez J, Thompson L, et al.Breakthrough bacteremia due to Clostridium tertium in a patient withneutropenic fever, and identification by MALDI-TOF mass spectrometry. Int JInfect Dis. 2013;17(11):e1062–3. https://doi.org/10.1016/j.ijid.2013.03.005.
51. Sartor RB, Wu GD. Roles for Intestinal Bacteria, Viruses, and Fungi inPathogenesis of Inflammatory Bowel Diseases and TherapeuticApproaches. Gastroenterology. 2017;152(2):327–339.e4. https://doi.org/10.1053/j.gastro.
52. Shah R, Cope JL, Nagy-Szakal D, Dowd S, Versalovic J, Hollister EB, et al.Composition and function of the pediatric colonic mucosal microbiome inuntreated patients with ulcerative colitis. Gut Microbes. 2016;7(5):384–96.https://doi.org/10.1080/19490976.2016.1190073.
53. Shah S, Hankenson J, Pabbathi S, Greene J, Nanjappa S. Clostridium tertiumin neutropenic patients: case series at a cancer institute. Int J Infect Dis.2016;51(C):44–6. https://doi.org/10.1016/j.ijid.2016.08.013.
54. Shannon P, Markiel A, Ozier O, Baliga NS, Wang JT, Ramage D, et al.Cytoscape: a software environment for integrated models of biomolecularinteraction networks. Genome Res. 2003;13(11):2498–504. https://doi.org/10.1101/gr.1239303.
55. Sheehan D, Moran C, Shanahan F. The microbiota in inflammatory boweldisease. J Gastroenterol. 2015;50(5):495–507. https://doi.org/10.1007/s00535-015-1064-1.
56. Sokol H. Probiotics and antibiotics in IBD. Dig Dis. 2014;32(Suppl 1):10–7.https://doi.org/10.1159/000367820.
57. Steensma EA, Ertl CW, Burke LH. Clostridium tertium isolated from anecrotizing soft tissue infection in a diabetic but otherwisenonimmunocompromised patient. J Am Col Certif Wound Spec. 2011;3(2):42–4. https://doi.org/10.1016/j.jcws.2011.09.002.
58. Sutton SS, Jumper M, Shah A, Edun B. Clostridium tertium peritonitis andconcurrent bacteremia in a patient with a history of alcoholic cirrhosis. JInvestig Med High Impact Case Rep. 2017;5(3):2324709617731457. https://doi.org/10.1177/2324709617731457.
59. Takahashi K, Nishida A, Fujimoto T, Fujii M, Shioya M, Imaeda H, et al.Reduced abundance of butyrate-producing Bacteria species in the fecalmicrobial Community in Crohn's disease. Digestion. 2016;93(1):59–65.https://doi.org/10.1159/000441768.
60. Vanderhofstadt M, André M, Lonchay C, Levecque P, Holemans X, Canon JL,et al. Clostridium tertium bacteremia: contamination or true pathogen? A
Li et al. BMC Microbiology (2021) 21:138 Page 11 of 12

report of two cases and a review of the literature. Int J Infect Dis. 2010;14(Suppl 3):e335–7. https://doi.org/10.1016/j.ijid.2010.03.004.
61. Vellend M. Conceptual synthesis in community ecology. Q Rev Biol. 2010;85(2):183–206. https://doi.org/10.1086/652373.
62. Wazir M, Jain AG, Nadeem M, Ur Rahman A, Everett G. Clostridium tertiumbacteremia in a non-neutropenic patient with liver cirrhosis. Cureus. 2019;11(4):e4432. https://doi.org/10.7759/cureus.4432.
63. Wei Y, Zhu W, Gong J, Guo D, Gu L, Li N, et al. Fecal microbiotatransplantation improves the quality of life in patients with inflammatorybowel disease. Gastroenterol Res Pract. 2015;517597:1–5. https://doi.org/10.1155/2015/517597.
64. Weingarden AR, Vaughn BP. Intestinal microbiota, fecal microbiotatransplantation, and inflammatory bowel disease. Gut Microbes. 2017;8(3):238–52. https://doi.org/10.1080/19490976.
65. Willing BP, Dicksved J, Halfvarson J, Andersson AF, Lucio M, Zheng Z, et al.A pyrosequencing study in twins shows that gastrointestinal microbialprofiles vary with inflammatory bowel disease phenotypes.Gastroenterology. 2010;139(6):1844–1854.e1. https://doi.org/10.1053/j.gastro.2010.08.049.
Publisher’s NoteSpringer Nature remains neutral with regard to jurisdictional claims inpublished maps and institutional affiliations.
Li et al. BMC Microbiology (2021) 21:138 Page 12 of 12
Related Documents