Echocardiographic Phase Imaging to Predict Reverse Remodeling After Cardiac Resynchronization Therapy Sebastian J. Buss, MD,* Per M. Humpert, MD,† Raffi Bekeredjian, MD,* Stefan E. Hardt, MD,* Christian Zugck, MD,* Dieter Schellberg, PHD,‡§ Alexander Bauer, MD,* Arthur Filusch, MD,* Helmut Kuecherer, MD, Hugo A. Katus, MD,* Grigorios Korosoglou, MD* Heidelberg and Eichstätt, Germany OBJECTIVES The aim of our study was to investigate whether echocardiographic phase imaging (EPI) can predict response in patients who are considered for cardiac resynchronization therapy (CRT). BACKGROUND CRT improves quality of life, exercise capacity, and outcome in patients with bundle-branch block and advanced heart failure. Previous studies used QRS duration to select patients for CRT; the accuracy of this parameter to predict functional recovery, however, is controversial. METHODS We examined 42 patients with advanced heart failure (New York Heart Association [NYHA] functional class III to IV, QRS duration 130 ms, and ejection fraction 35%) before and 6 to 8 months after CRT. Left ventricular (LV) dyssynchrony was estimated by calculating the SD of time to peak velocities (Ts-SD) by conventional tissue Doppler imaging (TDI), and the mean phase index (mean EPI-Index) was calculated by EPI in 12 mid-ventricular and basal segments. Patients who were alive and had significant relative decrease in end-systolic LV volume of ∆ESV 15% at 6 to 8 months of follow-up were defined as responders. All others were classified as nonresponders. RESULTS The Ts-SD and the mean EPI-Index were related to ∆ESV (r 0.43 for Ts-SD and r 0.67 for mean EPI-Index, p 0.01 for both), and both parameters yielded similar accuracy for the prediction of LV remodeling (area under the curve of 0.87 for TDI vs. 0.90 for EPI, difference between areas 0.03, p NS) and ejection fraction (EF) improvement (area under the curve of 0.87 for TDI vs. 0.93 for EPI, difference between areas 0.06, p NS). Furthermore, patients classified as responders by EPI (mean EPI-Index 59%) showed significant improvement in NYHA functional class and in 6-min walk test (409 88 m at follow-up vs. 312 86 m initially, p 0.001). CONCLUSION Echocardiographic phase imaging can predict functional recovery, reverse LV remodeling, and clinical outcomes in patients who undergo CRT. EPI is a method that objectively and accurately quantifies LV dyssynchrony and seems to be noninferior to TDI for the prediction of reverse LV remodeling and functional recovery. (J Am Coll Cardiol Img 2009;2:535– 43) © 2009 by the American College of Cardiology Foundation From the Departments of *Cardiology, †Endocrinology, ‡Visceral and General Surgery, and §Psychosomatic and General Internal Medicine, University of Heidelberg, Heidelberg, Germany; and the Department of Cardiology, Kliniken im Naturpark Altmühltal, Eichstätt, Germany. This study was supported by grants from the German Society of Cardiology (to Dr. Korosoglou). Manuscript received July 2, 2008; revised manuscript received March 6, 2009, accepted March 10, 2009. JACC: CARDIOVASCULAR IMAGING VOL. 2, NO. 5, 2009 © 2009 BY THE AMERICAN COLLEGE OF CARDIOLOGY FOUNDATION ISSN 1936-878X/09/$36.00 PUBLISHED BY ELSEVIER INC. DOI:10.1016/j.jcmg.2009.03.003

Welcome message from author
This document is posted to help you gain knowledge. Please leave a comment to let me know what you think about it! Share it to your friends and learn new things together.
Transcript
J A C C : C A R D I O V A S C U L A R I M A G I N G V O L . 2 , N O . 5 , 2 0 0 9
© 2 0 0 9 B Y T H E A M E R I C A N C O L L E G E O F C A R D I O L O G Y F O U N D A T I O N I S S N 1 9 3 6 - 8 7 8 X / 0 9 / $ 3 6 . 0 0
P U B L I S H E D B Y E L S E V I E R I N C . D O I : 1 0 . 1 0 1 6 / j . j c m g . 2 0 0 9 . 0 3 . 0 0 3
Echocardiographic Phase Imaging to PredictReverse Remodeling After CardiacResynchronization Therapy
Sebastian J. Buss, MD,* Per M. Humpert, MD,† Raffi Bekeredjian, MD,*Stefan E. Hardt, MD,* Christian Zugck, MD,* Dieter Schellberg, PHD,‡§Alexander Bauer, MD,* Arthur Filusch, MD,* Helmut Kuecherer, MD,�Hugo A. Katus, MD,* Grigorios Korosoglou, MD*
Heidelberg and Eichstätt, Germany
O B J E C T I V E S The aim of our study was to investigate whether echocardiographic phase imaging
(EPI) can predict response in patients who are considered for cardiac resynchronization therapy (CRT).
B A C K G R O U N D CRT improves quality of life, exercise capacity, and outcome in patients with
bundle-branch block and advanced heart failure. Previous studies used QRS duration to select patients
for CRT; the accuracy of this parameter to predict functional recovery, however, is controversial.
M E T H O D S We examined 42 patients with advanced heart failure (New York Heart Association
[NYHA] functional class III to IV, QRS duration �130 ms, and ejection fraction �35%) before and 6 to 8
months after CRT. Left ventricular (LV) dyssynchrony was estimated by calculating the SD of time to peak
velocities (Ts-SD) by conventional tissue Doppler imaging (TDI), and the mean phase index (mean
EPI-Index) was calculated by EPI in 12 mid-ventricular and basal segments. Patients who were alive and
had significant relative decrease in end-systolic LV volume of ∆ESV �15% at 6 to 8 months of follow-up
were defined as responders. All others were classified as nonresponders.
R E S U L T S The Ts-SD and the mean EPI-Index were related to ∆ESV (r � 0.43 for Ts-SD and r � 0.67
for mean EPI-Index, p � 0.01 for both), and both parameters yielded similar accuracy for the prediction
of LV remodeling (area under the curve of 0.87 for TDI vs. 0.90 for EPI, difference between areas � 0.03,
p � NS) and ejection fraction (EF) improvement (area under the curve of 0.87 for TDI vs. 0.93 for EPI,
difference between areas � 0.06, p � NS). Furthermore, patients classified as responders by EPI (mean
EPI-Index �59%) showed significant improvement in NYHA functional class and in 6-min walk test (409
� 88 m at follow-up vs. 312 � 86 m initially, p � 0.001).
C O N C L U S I O N Echocardiographic phase imaging can predict functional recovery, reverse LV
remodeling, and clinical outcomes in patients who undergo CRT. EPI is a method that objectively and
accurately quantifies LV dyssynchrony and seems to be noninferior to TDI for the prediction of reverse
LV remodeling and functional recovery. (J Am Coll Cardiol Img 2009;2:535–43) © 2009 by the American
College of Cardiology Foundation
From the Departments of *Cardiology, †Endocrinology, ‡Visceral and General Surgery, and §Psychosomatic and GeneralInternal Medicine, University of Heidelberg, Heidelberg, Germany; and the �Department of Cardiology, Kliniken imNaturpark Altmühltal, Eichstätt, Germany. This study was supported by grants from the German Society of Cardiology (to Dr.Korosoglou).
Manuscript received July 2, 2008; revised manuscript received March 6, 2009, accepted March 10, 2009.
C(tpvtcc
Cam(r
u
M
PsCh[m1mafdmas
Eww4cMtrpabtebcCEO
T
aTa3fdssMcdsoHc
M
aiedifivwaBicaptW
A
A
C
t
E
E
i
E
L
N
A
T
T
velocities
J A C C : C A R D I O V A S C U L A R I M A G I N G , V O L . 2 , N O . 5 , 2 0 0 9
M A Y 2 0 0 9 : 5 3 5 – 4 3
Buss et al.
Echocardiographic Phase Imaging
536
ardiac resynchronization therapy (CRT)improves quality of life, exercise capacity,and outcome in patients with bundle-branch block and advanced heart failure
1–6). Although previous studies used QRS dura-ion to select patients for CRT, the accuracy of thisarameter to predict functional recovery is contro-ersial (2,4–6). Evidence is accumulating, however,hat mechanical left ventricular (LV) dyssyn-hrony—which is not necessarily related to electri-al dyssynchrony—is mandatory for response to
See page 544
RT (7,8). Echocardiographic tissue Doppler im-ging (TDI) is a technique that allows the assess-ent of intersegmental differences in the timing
8–10). However, in a multicenter trial performedecently (11), the diagnostic performance of TDI
was shown to be modest for the correctselection of patients considered for CRT,whereas the inter-observer variabilitieswere high. Therefore, the need for newechocardiographic methods that can ob-jectively quantify wall motion dyssyn-chrony is growing.
We have previously reported on theutility of the parametric echocardiographicphase imaging (EPI) for the objectiveevaluation of LV dyssynchrony in patientswith type 2 diabetes mellitus (12,13). Inthe present study we used EPI to predictreverse remodeling, functional LV recov-ery, improvement of heart failure symp-toms, and clinical outcome in patients who
ndergo CRT.
E T H O D S
atients. The study population consisted of 45 con-ecutive patients who underwent clinically indicatedRT due to the following criteria: 1) congestiveeart failure (New York Heart AssociationNYHA] functional class III/IV) for at least 12onths due to dilative (n � 24) or ischemic (n �
8) cardiomyopathy; 2) wide QRS complex (�130s) of left bundle branch block-like morphology;
nd 3) severely impaired LV function (ejectionraction �35%). Patients with acute ischemic syn-romes or revascularization within the previous 6onths were excluded. The study protocol was
pproved by the local ethics committee, and all
tion
ase
r
g
ubjects gave written informed consent. f
chocardiography. Three of 45 consecutive patientsere excluded from the study due to poor echogenicindows, so that our study population consisted of2 patients. Patients were studied with a commer-ially available ultrasound system (Acuson, Sequoia,
ountain View, California), with a 4.25-MHzransducer and simultaneous electrocardiographicecording. Imaging was performed in standardarasternal long- and short-axis and in apical 2-, 3-,nd 4-chamber view. All data were acquired duringreath-hold to minimize translation movement ofhe heart. Ejection fraction and end-systolic andnd-diastolic LV volumes were quantified with theiplane Simpson’s method (13). Follow-up echo-ardiography was performed 6 to 8 months afterRT.valuation of dyssynchrony. STANDARD DEVIATION
F TIME-TO-PEAK SYSTOLIC VELOCITIES BY
DI. The TDI was acquired from the apical 2-, 3-,nd 4-chamber views with high frame rate (�80/s).he TDI measurements were assessed in 12 basal-
nd mid-ventricular segments from the apical 2-,-, and 4-chamber view to evaluate longitudinalunction. Regions of interest were manually placeduring systole, and myocardial velocities were mea-ured with commercially available software (Re-earch Arena, TomTec Imaging Systems GmbH,
unich, Germany) (12,13). Myocardial velocityurves were obtained and the time to peak velocityuring ejection phase (Ts) was measured in eachegment. To assess global LV synchronicity, the SDf Ts of all 12 segments (Ts-SD) was computed (9).igh Ts-SD values correspond to high LV dyssyn-
hrony and vice versa.
EAN PHASE INDEX BY EPI. Ventricular contractionnd relaxation result in cyclic changes in gray levelntensities of picture elements (pixels) that arencompassed by the moving endocardial borderuring the cardiac cycle. These changes in signalntensity are mathematically transformed with arst harmonic Fourier algorithm. EPI has beenalidated in previous studies to evaluate regionalall dyssynergy, by displaying contraction sequence
nd magnitude with high reproducibility (12–14).y this algorithm time-intensity curves of each
ndividual image pixel are fitted to a first harmonicurve, which is characterized by its phase angle andmplitude. Hereby, the amplitudes are related toixel intensity, whereas the phase angles are relatedo the onset and timing of pixel intensity change.
ith EPI, phase angles are automatically trans-
B B R E V I A T I O N S
N D A C R O N YM S
RT � cardiac resynchroniza
herapy
F � ejection fraction
PI � echocardiographic ph
maging
SV � end-systolic volume
V � left ventricle/ventricula
YHA � New York Heart
ssociation
DI � tissue Doppler imagin
s-SD � SD of time to peak
ormed into intensity parameters and displayed in
stftecBt“edsasch(lodo
dpmowatems1(racifcmcpa(vici(cpi
srDddobavvltpvbDwrLvrficgfcbppNtLp6SSaEybntetcwriTii
J A C C : C A R D I O V A S C U L A R I M A G I N G , V O L . 2 , N O . 5 , 2 0 0 9
M A Y 2 0 0 9 : 5 3 5 – 4 3
Buss et al.
Echocardiographic Phase Imaging
537
hades of gray, which are related to the amplitude ofhe structure analyzed. Applied to endocardial sur-aces and chamber walls, the phase angle relates tohe sequence of wall thickening and motion of thendocardium. The spectrum of gray levels is thenolor encoded with a pre-defined cyclic scale (14).y that, the color phase image displays the relative
iming of intensity change of image pixels in acomposite” parametric format. Because maximalndocardial inward motion is expected to occururing the relatively early ejection period, normalystolic endocardial inward motion yields phasengles near the end 360° or start 0° (green colorhades), while inverted and triphasic displacementurves (e.g., with paradoxical septal wall motion)ave phase angles near (180°) of the cardiac cyclered color shades). Because 360° represent theength of a complete heart cycle, phase differencesf 0° or 360° indicate perfect synchrony, whereasifferences of 180° indicate maximal dyssynchronyf contraction.To quantify LV dyssynchrony, digitized echocar-
iographic loops were used, which were gated at theeak of the R-wave. Endocardial borders wereanually drawn in end-systolic frames, and regions
f interest were generated automatically with a fixedidth of 4 mm (Research Arena, TomTec), whichutomatically track the endocardial motionhroughout the whole cardiac cycle. Phase values forach image pixel were displayed in composite para-etric images (Figs. 1A, 1C, and 1E), and gray-
cale intensities were plotted versus time (Figs. 1B,D, and 1F). Echocardiographic phase indexesEPI-indexes) were computed for each segment, byelating the extent of local dyssynchrony to that ofll the other segments of the LV. To assess globalardiac synchronicity, the mean value of the EPI-ndexes of 12 basal- and mid-ventricular segmentsrom the apical 2-, 3-, and 4-chamber view wasalculated (mean EPI-index). Low values of theean EPI-Index correspond to high LV dyssyn-
hrony and vice versa. Figure 1 illustrates thearametric images of a healthy volunteer (Figs. 1And 1B) with relatively coordinated wall motionseptal and lateral segments coded green). Con-ersely, in a patient scheduled for CRT due toschemic cardiomyopathy, regional dyssynchrony inontraction can be appreciated in the correspondingmages (Figs. 1C and 1D). Thus, lateral wallsegments 3 and 4) occurs much later than septalontraction (segments 1 and 2, coded red in thearametric image) (Fig. 1C). Six months after CRT
n the same patient all septal and lateral myocardial aegments are coded green (Fig. 1E), implyinge-coordinated wall motion (Fig. 1F).evice implantation and optimization. Patients un-erwent implantation of a cardiac resynchronizationevice along with 3 pacing leads. Proper positioningf the coronary sinus lead was determined on theasis of visual inspection during right and leftnterior oblique views and a significant delay of theentricular signal during coronary sinus and rightentricular pacing. The sensed atrioventricular de-ay was initially programmed to 200 ms. Optimiza-ion of the atrioventricular delay was routinelyerformed before discharge to ensure the highestelocity time integral in the LV outflow, evaluatedy pulsed wave Doppler (15).efinition of CRT responders and end points. Patientsere divided into 2 groups according to their
esponse to CRT. Patients with significant reverseV remodeling (relative decrease of LV systolicolume [�ESV] of �15%) (16) were defined asesponders (primary end point). Patients were de-ned as nonresponders if they died due to cardiacauses or did not reach the pre-defined echocardio-raphic change in �ESV at 6 to 8 months ofollow-up. Furthermore, we used the absolute in-rease in LV ejection fraction of 0.08 (8%) versusaseline (�EF �8%) (17,18) as an additional endoint of our study. Functional assessment waserformed initially and at follow-up and includedYHA functional class and 6-min walk distance
est. These variables were associated with baselineV dyssynchrony and deemed as secondary endoints of our study. All end points were assessed atto 8 months of follow-up.tatistical analysis. Data are presented as mean �D. Intraobserver and interobserver variabilitynd time spent for the estimation of TDI andPI parameters were obtained by repeated anal-
sis of 20 representative images. Differences inaseline characteristics between responders andonresponders and differences in variables be-ween the initial and the follow-up visit werevaluated by unpaired and by paired Student tests, respectively. The extent of LV dyssyn-hrony by EPI was compared with that of TDI,ith the �EF, and with �ESV using linear
egression analysis. Receiver-operating character-stics were used to assess the predictive value ofDI and of EPI for the primary end points,
ncluding functional recovery and LV remodel-ng. Differences in sensitivities, specificities, and
ccuracies between EPI and TDI were evaluated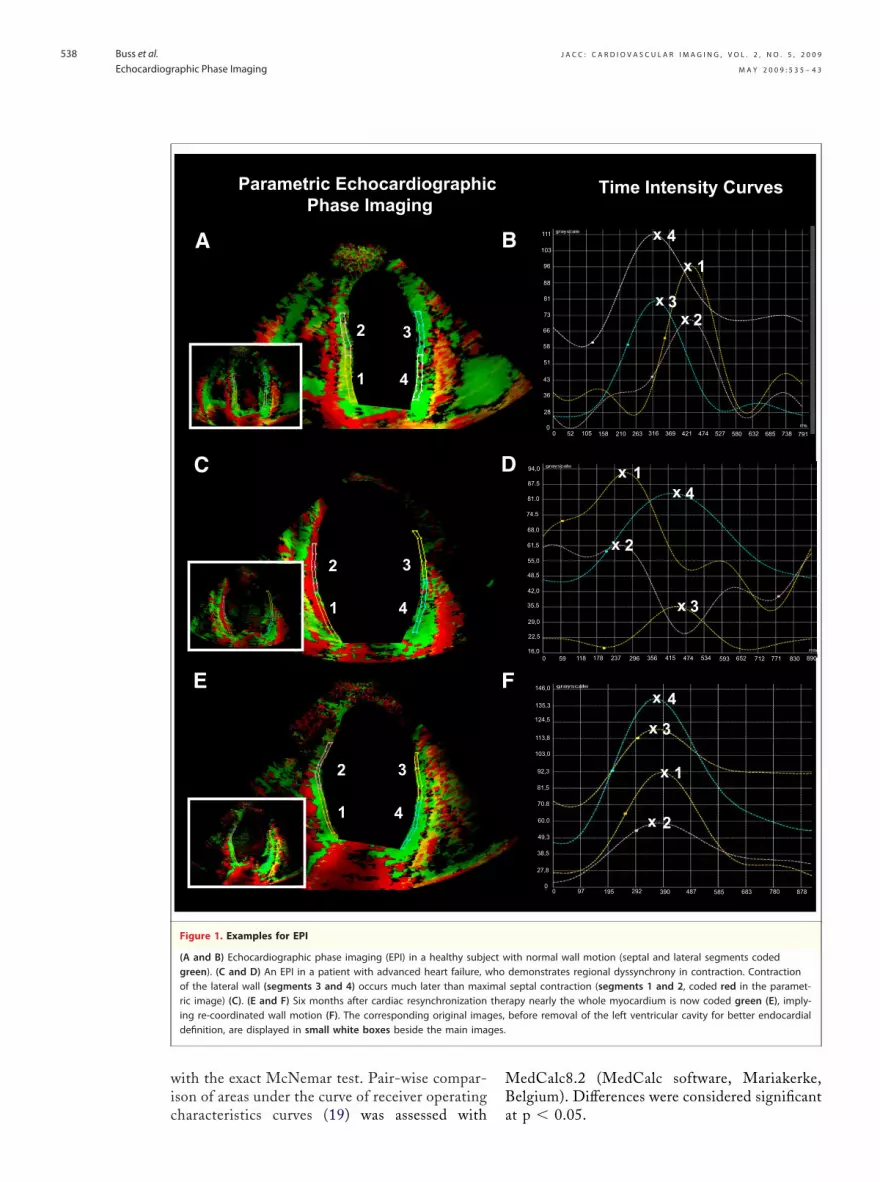
wic
MB
ges.
J A C C : C A R D I O V A S C U L A R I M A G I N G , V O L . 2 , N O . 5 , 2 0 0 9
M A Y 2 0 0 9 : 5 3 5 – 4 3
Buss et al.
Echocardiographic Phase Imaging
538
ith the exact McNemar test. Pair-wise compar-son of areas under the curve of receiver operating
A
2
1 4
3
Parametric EchocardiographicPhase Imaging
C
E
2
1 4
3
2
1 4
3
Figure 1. Examples for EPI
(A and B) Echocardiographic phase imaging (EPI) in a healthy subjegreen). (C and D) An EPI in a patient with advanced heart failure, wof the lateral wall (segments 3 and 4) occurs much later than maxiric image) (C). (E and F) Six months after cardiac resynchronizationing re-coordinated wall motion (F). The corresponding original imagdefinition, are displayed in small white boxes beside the main ima
haracteristics curves (19) was assessed with a
edCalc8.2 (MedCalc software, Mariakerke,elgium). Differences were considered significant
x
x
xx
1
23
4
Time Intensity Curves
xx
x
x
x
x
x
x
1
2
3
4
1
2
3
4
94,0
87.5
81.0
74.5
68,0
61,5
55,0
48,5
42,0
35,5
29,0
22,5
16,0
21
111
103
96
88
81
73
66
58
51
43
36
28
00 52 105 158 210 316 369 421 474 527 580 632 685 738 791263
0 59 118 178 237 296 356 415 474 534 593 652 712 771 830 890
17,0
146,0
135,3
124,5
113,8
103,0
92,3
81,5
70.8
60.0
49,3
38,5
27,8
00 97 195 292 390 487 585 683 780 878
ith normal wall motion (septal and lateral segments codeddemonstrates regional dyssynchrony in contraction. Contractionseptal contraction (segments 1 and 2, coded red in the paramet-apy nearly the whole myocardium is now coded green (E), imply-before removal of the left ventricular cavity for better endocardial
B
D
F
ct whomaltheres,
t p � 0.05.
R
PbtmtltecdnPTv2tdaLrEppfsasa
3Ldn0r(
i
ork H
J A C C : C A R D I O V A S C U L A R I M A G I N G , V O L . 2 , N O . 5 , 2 0 0 9
M A Y 2 0 0 9 : 5 3 5 – 4 3
Buss et al.
Echocardiographic Phase Imaging
539
E S U L T S
atient characteristics and response to CRT. Theaseline characteristics of 42 patients included inhe study are illustrated in Table 1. At 6 to 8onths of follow-up, 5 patients died due to intrac-
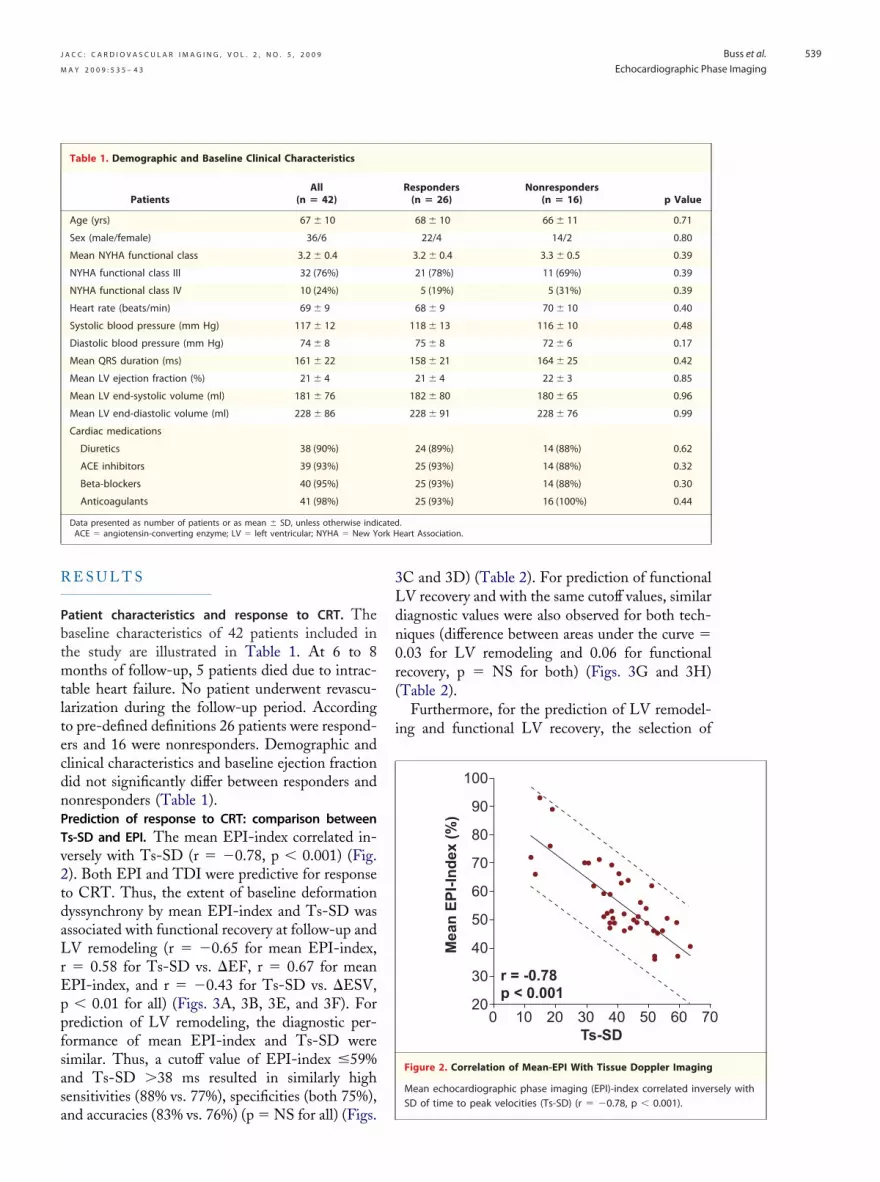
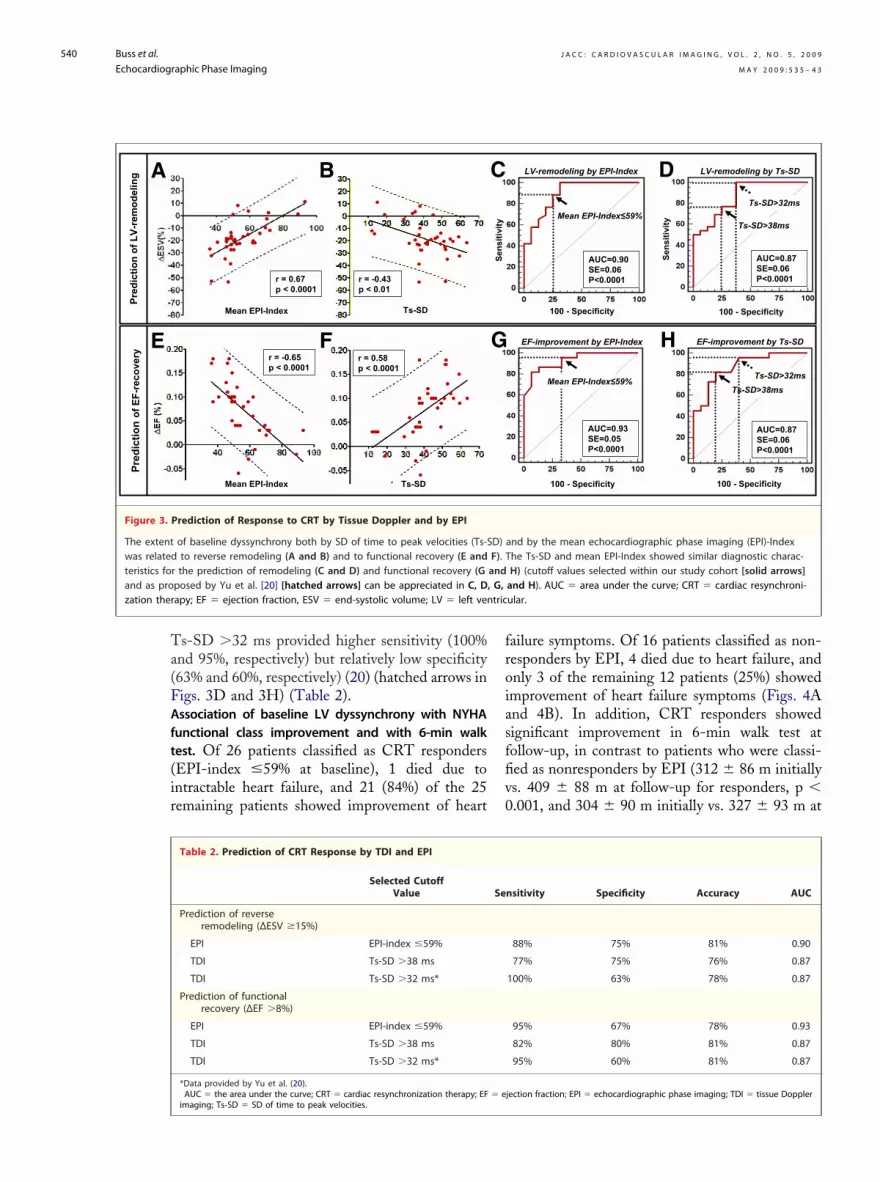
able heart failure. No patient underwent revascu-arization during the follow-up period. Accordingo pre-defined definitions 26 patients were respond-rs and 16 were nonresponders. Demographic andlinical characteristics and baseline ejection fractionid not significantly differ between responders andonresponders (Table 1).rediction of response to CRT: comparison betweens-SD and EPI. The mean EPI-index correlated in-ersely with Ts-SD (r � �0.78, p � 0.001) (Fig.). Both EPI and TDI were predictive for responseo CRT. Thus, the extent of baseline deformationyssynchrony by mean EPI-index and Ts-SD wasssociated with functional recovery at follow-up andV remodeling (r � �0.65 for mean EPI-index,� 0.58 for Ts-SD vs. �EF, r � 0.67 for meanPI-index, and r � �0.43 for Ts-SD vs. �ESV,� 0.01 for all) (Figs. 3A, 3B, 3E, and 3F). For
rediction of LV remodeling, the diagnostic per-ormance of mean EPI-index and Ts-SD wereimilar. Thus, a cutoff value of EPI-index �59%nd Ts-SD �38 ms resulted in similarly highensitivities (88% vs. 77%), specificities (both 75%),
Table 1. Demographic and Baseline Clinical Characteristics
PatientsAll
(n � 42)
Age (yrs) 67 � 10
Sex (male/female) 36/6
Mean NYHA functional class 3.2 � 0.4
NYHA functional class III 32 (76%)
NYHA functional class IV 10 (24%)
Heart rate (beats/min) 69 � 9
Systolic blood pressure (mm Hg) 117 � 12
Diastolic blood pressure (mm Hg) 74 � 8
Mean QRS duration (ms) 161 � 22
Mean LV ejection fraction (%) 21 � 4
Mean LV end-systolic volume (ml) 181 � 76
Mean LV end-diastolic volume (ml) 228 � 86
Cardiac medications
Diuretics 38 (90%)
ACE inhibitors 39 (93%)
Beta-blockers 40 (95%)
Anticoagulants 41 (98%)
Data presented as number of patients or as mean � SD, unless otherwise indiACE � angiotensin-converting enzyme; LV � left ventricular; NYHA � New Y
nd accuracies (83% vs. 76%) (p � NS for all) (Figs.
C and 3D) (Table 2). For prediction of functionalV recovery and with the same cutoff values, similariagnostic values were also observed for both tech-iques (difference between areas under the curve �.03 for LV remodeling and 0.06 for functionalecovery, p � NS for both) (Figs. 3G and 3H)Table 2).
Furthermore, for the prediction of LV remodel-ng and functional LV recovery, the selection of
2010 20
30
30
40
40
50
50
60
60
70
70
80
90
100
0Ts-SD
r = -0.78p < 0.001
Mea
n E
PI-
Ind
ex (
%)
Figure 2. Correlation of Mean-EPI With Tissue Doppler Imaging
Mean echocardiographic phase imaging (EPI)-index correlated inver
Responders(n � 26)
Nonresponders(n � 16) p Value
68 � 10 66 � 11 0.71
22/4 14/2 0.80
3.2 � 0.4 3.3 � 0.5 0.39
21 (78%) 11 (69%) 0.39
5 (19%) 5 (31%) 0.39
68 � 9 70 � 10 0.40
118 � 13 116 � 10 0.48
75 � 8 72 � 6 0.17
158 � 21 164 � 25 0.42
21 � 4 22 � 3 0.85
182 � 80 180 � 65 0.96
228 � 91 228 � 76 0.99
24 (89%) 14 (88%) 0.62
25 (93%) 14 (88%) 0.32
25 (93%) 14 (88%) 0.30
25 (93%) 16 (100%) 0.44
.eart Association.
sely with
cated
SD of time to peak velocities (Ts-SD) (r � �0.78, p � 0.001).
Ta(FAft(ir
froiasffiv0
zation ther tric
J A C C : C A R D I O V A S C U L A R I M A G I N G , V O L . 2 , N O . 5 , 2 0 0 9
M A Y 2 0 0 9 : 5 3 5 – 4 3
Buss et al.
Echocardiographic Phase Imaging
540
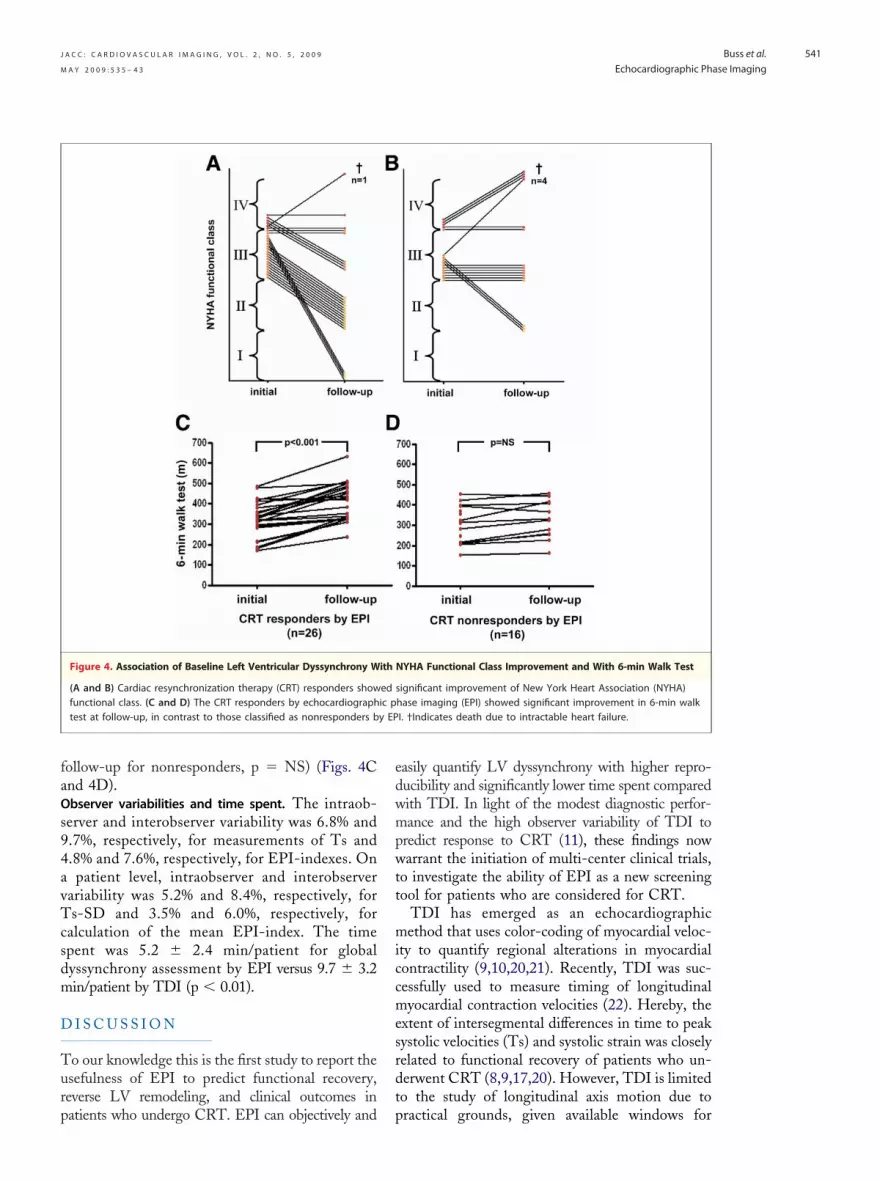
s-SD �32 ms provided higher sensitivity (100%nd 95%, respectively) but relatively low specificity63% and 60%, respectively) (20) (hatched arrows inigs. 3D and 3H) (Table 2).ssociation of baseline LV dyssynchrony with NYHAunctional class improvement and with 6-min walkest. Of 26 patients classified as CRT respondersEPI-index �59% at baseline), 1 died due tontractable heart failure, and 21 (84%) of the 25emaining patients showed improvement of heart
F
B
r = -0.65p < 0.0001
r = 0.58p < 0.0001
r = 0.67p < 0.0001
r = -0.43p < 0.01
Mean EPI-Index
Mean EPI-Index
Ts-SD
Ts-SD
Prediction of Response to CRT by Tissue Doppler and by EPI
of baseline dyssynchrony both by SD of time to peak velocities (Ts-Sto reverse remodeling (A and B) and to functional recovery (E and
r the prediction of remodeling (C and D) and functional recovery (Gposed by Yu et al. [20] [hatched arrows] can be appreciated in C, Dapy; EF � ejection fraction, ESV � end-systolic volume; LV � left ven
Table 2. Prediction of CRT Response by TDI and EPI
Selected CutoffValue
Prediction of reverseremodeling (∆ESV �15%)
EPI EPI-index �59%
TDI Ts-SD �38 ms
TDI Ts-SD �32 ms*
Prediction of functionalrecovery (∆EF �8%)
EPI EPI-index �59%
TDI Ts-SD �38 ms
TDI Ts-SD �32 ms*
*Data provided by Yu et al. (20).AUC � the area under the curve; CRT � cardiac resynchronization therapy; EF
imaging; Ts-SD � SD of time to peak velocities.ailure symptoms. Of 16 patients classified as non-esponders by EPI, 4 died due to heart failure, andnly 3 of the remaining 12 patients (25%) showedmprovement of heart failure symptoms (Figs. 4And 4B). In addition, CRT responders showedignificant improvement in 6-min walk test atollow-up, in contrast to patients who were classi-ed as nonresponders by EPI (312 � 86 m initiallys. 409 � 88 m at follow-up for responders, p �.001, and 304 � 90 m initially vs. 327 � 93 m at
Mean EPI-Index≤59%Ts-SD>38ms
AUC=0.90SE=0.06P<0.0001
100 - Specificity 100 - Specificity
LV-remodeling by EPI-Index
EF-improvement by EPI-Index
AUC=0.87SE=0.06P<0.0001
LV-remodeling by Ts-SDDTs-SD>32ms
100 - Specificity
AUC=0.93SE=0.05P<0.0001
Mean EPI-Index≤59%
100 - Specificity
AUC=0.87SE=0.06P<0.0001
Ts-SD>38ms
EF-improvement by Ts-SDHTs-SD>32ms
Sen
siti
vity
and by the mean echocardiographic phase imaging (EPI)-Indexhe Ts-SD and mean EPI-Index showed similar diagnostic charac-H) (cutoff values selected within our study cohort [solid arrows]and H). AUC � area under the curve; CRT � cardiac resynchroni-ular.
nsitivity Specificity Accuracy AUC
88% 75% 81% 0.90
77% 75% 76% 0.87
100% 63% 78% 0.87
95% 67% 78% 0.93
82% 80% 81% 0.87
95% 60% 81% 0.87
jection fraction; EPI � echocardiographic phase imaging; TDI � tissue Doppler
E G
A C
Sen
siti
vity
Pre
dic
tio
n o
f L
V-r
emo
del
ing
Pre
dic
tio
no
f E
F-r
eco
very
Figure 3.
The extent D)was related F). Tteristics fo andand as pro , G,
Se
� e
faOs94avTcsdm
D
Turp
edwmpwtt
miccmesrdt
y EP
J A C C : C A R D I O V A S C U L A R I M A G I N G , V O L . 2 , N O . 5 , 2 0 0 9
M A Y 2 0 0 9 : 5 3 5 – 4 3
Buss et al.
Echocardiographic Phase Imaging
541
ollow-up for nonresponders, p � NS) (Figs. 4Cnd 4D).bserver variabilities and time spent. The intraob-erver and interobserver variability was 6.8% and.7%, respectively, for measurements of Ts and.8% and 7.6%, respectively, for EPI-indexes. Onpatient level, intraobserver and interobserver
ariability was 5.2% and 8.4%, respectively, fors-SD and 3.5% and 6.0%, respectively, for
alculation of the mean EPI-index. The timepent was 5.2 � 2.4 min/patient for globalyssynchrony assessment by EPI versus 9.7 � 3.2in/patient by TDI (p � 0.01).
I S C U S S I O N
o our knowledge this is the first study to report thesefulness of EPI to predict functional recovery,everse LV remodeling, and clinical outcomes in
Figure 4. Association of Baseline Left Ventricular Dyssynchrony W
(A and B) Cardiac resynchronization therapy (CRT) responders showfunctional class. (C and D) The CRT responders by echocardiographtest at follow-up, in contrast to those classified as nonresponders b
atients who undergo CRT. EPI can objectively and p
asily quantify LV dyssynchrony with higher repro-ucibility and significantly lower time spent comparedith TDI. In light of the modest diagnostic perfor-ance and the high observer variability of TDI to
redict response to CRT (11), these findings nowarrant the initiation of multi-center clinical trials,
o investigate the ability of EPI as a new screeningool for patients who are considered for CRT.
TDI has emerged as an echocardiographicethod that uses color-coding of myocardial veloc-
ty to quantify regional alterations in myocardialontractility (9,10,20,21). Recently, TDI was suc-essfully used to measure timing of longitudinalyocardial contraction velocities (22). Hereby, the
xtent of intersegmental differences in time to peakystolic velocities (Ts) and systolic strain was closelyelated to functional recovery of patients who un-erwent CRT (8,9,17,20). However, TDI is limitedo the study of longitudinal axis motion due to
NYHA Functional Class Improvement and With 6-min Walk Test
significant improvement of New York Heart Association (NYHA)hase imaging (EPI) showed significant improvement in 6-min walkI. †Indicates death due to intractable heart failure.
ith
edic p
ractical grounds, given available windows for

tmrdt
amibsvntpbstwTbsmwhpcasitStsetsb
ctcgdsps(panpamacfoCaflm
C
EtoElcm
RBo
R
J A C C : C A R D I O V A S C U L A R I M A G I N G , V O L . 2 , N O . 5 , 2 0 0 9
M A Y 2 0 0 9 : 5 3 5 – 4 3
Buss et al.
Echocardiographic Phase Imaging
542
ransducer placement. For this reason and becauseyocardial contraction principally occurs in the
adial direction, TDI might be less sensitive for LVyssynchrony assessment compared with methodshat evaluate radial motion (23,24).
EPI is an echocardiographic technique that usesfirst harmonic Fourier algorithm to measure theagnitude and timing of myocardial deformation
n the circumferential direction. This technique haseen previously used to quantify wall motion dys-ynchrony in patients who undergo CRT for ad-anced heart failure (25), predicting acute hemody-amic benefits. However, to our knowledge this ishe first study to report the usefulness of EPI toredict functional recovery, reverse remodeling, andenefits on exercise capacity and on heart failureymptoms. The accuracy of EPI to predict func-ional recovery and reverse remodeling in patientsho undergo CRT was similar to that provided byDI. Thus, patients classified as CRT respondersy EPI had significant improvement of heart failureymptoms and of their functional capacity. Further-ore, the assessment of LV dyssynchrony by EPIas less time-consuming compared with TDI andad low observer variability, in agreement withrevious reports (13). The less time spent on EPIompared with conventional TDI techniques wasttributed to the automatic depiction of myocardialegments by EPI, whereas placement of regions ofnterest by TDI was assessed manually and was oftenechnically challenging in nonbasal LV segments.tudy limitations. The present study included a rela-ively small number of patients, which might havekewed the receiver operating curve analysis and thestimation of sensitivity and specificity parameters. Inhis regard, selecting a cutoff value of 32 ms, asuggested by Yu et al. (20), provided high sensitivityut relatively low specificity for the prediction of LV
nization on morbidity and mortality in lation between clin
lude larger numbers of patients in order to evaluatehe predictive value of this method on long-termlinical outcomes and mortality. EPI cannot distin-uish between active contraction and passive myocar-ial motion, which might prevent the identification ofcarred myocardium in the region of the tip of the LVacing lead with this technique. Conversely, withpeckle tracking (24) or tagged magnetic resonance23,26), 2-dimensional strain and radiofrequencyulses are used to track echocardiographic specklesnd tags of the myocardium, respectively. These tech-iques measure active myocardial contraction androvide the assessment of regional differences in radi-l/circumferential strain with high accuracy. Further-ore, EPI was not used to locate the area of latest
ctivation or to evaluate effects of immediate resyn-hronization in our study, although this is technicallyeasible. Matching the LV lead position with the sitef latest mechanical activation might be necessary forRT response, as recently reported by Van de Veire et
l. (27). This technique might therefore be useful inuture studies in order to guide positioning of the LVead, by assessing the sequence of wall thickening and
otion of the endocardium.
O N C L U S I O N S
chocardiographic phase imaging can predict func-ional recovery, reverse LV remodeling, and clinicalutcomes in patients who undergo CRT. Thus,PI can be implemented in busy echocardiographic
aboratories to quantify LV dyssynchrony and toorrectly select patients considered for CRT treat-ent with high accuracy.
eprint requests and correspondence: Dr. Sebastian J.uss, University of Heidelberg, Department of Cardiol-gy, Im Neuenheimer Feld 410, 69120 Heidelberg,
remodeling in our group. Future studies should in- Germany. E-mail: [email protected].
E F E R E N C E S
1. Cazeau S, Leclercq C, Lavergne T, etal. Effects of multisite biventricularpacing in patients with heart failureand intraventricular conduction delay.N Engl J Med 2001;344:873–80.
2. Abraham WT, Fisher WG, SmithAL, et al. Cardiac resynchronizationin chronic heart failure. N Engl J Med2002;346:1845–53.
3. Cleland JG, Daubert JC, Erdmann E,et al. The effect of cardiac resynchro-
heart failure. N Engl J Med 2005;352:1539–49.
4. Gras D, Leclercq C, Tang AS,Bucknal l C, Lutt ikhuis HO,Kirstein-Pedersen A. Cardiac resyn-chronization therapy in advancedheart failure the multicenter InSyncclinical study. Eur J Heart Fail 2002;4:311–20.
5. Reuter S, Garrigue S, Bordachar P, etal. Intermediate-term results of biven-tricular pacing in heart failure: corre-
ical and hemody-
namic data. Pacing Clin Electro-physiol 2000;23:1713–7.
6. Linde C, Leclercq C, Rex S, et al.Long-term benefits of biventricularpacing in congestive heart failure: re-sults from the MUltisite STimulationin cardiomyopathy (MUSTIC) study.J Am Coll Cardiol 2002;40:111–8.
7. Leclercq C, Faris O, Tunin R, et al.Systolic improvement and mechanicalresynchronization does not requireelectrical synchrony in the dilated fail-ing heart with left bundle-branch
block. Circulation 2002;106:1760–3.
1
1
1
1
1
1
2
2
2
2
2
Krceid
J A C C : C A R D I O V A S C U L A R I M A G I N G , V O L . 2 , N O . 5 , 2 0 0 9
M A Y 2 0 0 9 : 5 3 5 – 4 3
Buss et al.
Echocardiographic Phase Imaging
543
8. Sogaard P, Egeblad H, Kim WY, etal. Tissue Doppler imaging predictsimproved systolic performance and re-versed left ventricular remodeling dur-ing long-term cardiac resynchroniza-tion therapy. J Am Coll Cardiol 2002;40:723–30.
9. Yu CM, Chau E, Sanderson JE, et al.Tissue Doppler echocardiographic ev-idence of reverse remodeling and im-proved synchronicity by simulta-neously delaying regional contractionafter biventricular pacing therapy inheart failure. Circulation 2002;105:438–45.
0. Yu CM, Chan YS, Zhang Q, et al.Benefits of cardiac resynchronizationtherapy for heart failure patients withnarrow QRS complexes and coexist-ing systolic asynchrony by echocardi-ography. J Am Coll Cardiol 2006;48:2251–7.
1. Chung ES, Leon AR, Tavazzi L, etal. Results of the Predictors of Re-sponse to CRT (PROSPECT) trial.Circulation 2008;117:2608–16.
2. Humpert PM, Oikonomou D, Mor-cos M, et al. Impact of autonomicneuropathy on left ventricular func-tion in normotensive type 1 diabeticpatients: a tissue Doppler echocardio-graphic study. Diabetes Care 2008;31:e40, author reply e41.
3. Korosoglou G, Humpert PM, Halb-gewachs E, et al. Evidence of leftventricular contractile asynchrony byechocardiographic phase imaging inpatients with type 2 diabetes melli-tus and without clinically evidentheart disease. Am J Cardiol 2006;98:1525–30.
4. Kuecherer HF, Abbott JA, BotvinickEH, et al. Two-dimensional echocar-diographic phase analysis. Its potentialfor noninvasive localization of acces-sory pathways in patients with Wolff-Parkinson-White syndrome. Circula-tion 1992;85:130–42.
5. Hardt SE, Yazdi SH, Bauer A, et al.Immediate and chronic effects of AV-
delay optimization in patients withcardiac resynchronization therapy. IntJ Cardiol 2007;115:318–25.
16. Jansen AH, van Dantzig J, Bracke F,et al. Improvement in diastolic func-tion and left ventricular filling pres-sure induced by cardiac resynchroni-zation therapy. Am Heart J 2007;153:843–9.
17. Korosoglou G, Hansen A, Hoffend J,et al. Comparison of real-time myo-cardial contrast echocardiography forthe assessment of myocardial viabilitywith fluorodeoxyglucose-18 positronemission tomography and dobutaminestress echocardiography. Am J Cardiol2004;94:570–6.
18. Korosoglou G, Labadze N, GiannitsisE, et al. Usefulness of real-time myo-cardial perfusion imaging to evaluatetissue level reperfusion in patientswith non-ST-elevation myocardial in-farction. Am J Cardiol 2005;95:1033–8.
19. DeLong ER, DeLong DM, Clarke-Pearson DL. Comparing the areasunder two or more correlated receiveroperating characteristic curves: a non-parametric approach. Biometrics1988;44:837–45.
20. Yu CM, Fung JW, Zhang Q, et al.Tissue Doppler imaging is superior tostrain rate imaging and postsystolicshortening on the prediction of reverseremodeling in both ischemic andnonischemic heart failure after cardiacresynchronization therapy. Circula-tion 2004;110:66–73.
21. Gorcsan J III, Strum DP, MandarinoWA, Gulati VK, Pinsky MR. Quanti-tative assessment of alterations in re-gional left ventricular contractility withcolor-coded tissue Doppler echocardi-ography. Comparison with sonomi-crometry and pressure-volume relations.Circulation 1997;95:2423–33.
22. Zhang Y, Chan AK, Yu CM, et al.Left ventricular systolic asynchronyafter acute myocardial infarction inpatients with narrow QRS complexes.
Am Heart J 2005;149:497–503. i3. Helm RH, Leclercq C, Faris OP, etal. Cardiac dyssynchrony analysis us-ing circumferential versus longitudinalstrain: implications for assessing car-diac resynchronization. Circulation2005;111:2760–7.
4. Suffoletto MS, Dohi K, CannessonM, Saba S, Gorcsan J III. Novelspeckle-tracking radial strain fromroutine black-and-white echocardio-graphic images to quantify dyssyn-chrony and predict response to cardiacresynchronization therapy. Circula-tion 2006;113:960–8.
5. Breithardt OA, Stellbrink C, KramerAP, et al. Echocardiographic quanti-fication of left ventricular asynchronypredicts an acute hemodynamic bene-fit of cardiac resynchronization ther-apy. J Am Coll Cardiol 2002;40:536 – 45.
6. Westenberg JJ, Lamb HJ, van derGeest RJ, et al. Assessment of leftventricular dyssynchrony in patientswith conduction delay and idiopathicdilated cardiomyopathy: head-to-headcomparison between tissue Dopplerimaging and velocity-encoded mag-netic resonance imaging. J Am CollCardiol 2006;47:2042–8.
7. Van de Veire NR, Marsan NA,Schuijf JD, et al. Noninvasive imag-ing of cardiac venous anatomy with64-slice multi-slice computed tomog-raphy and noninvasive assessment ofleft ventricular dyssynchrony by3-dimensional tissue synchronizationimaging in patients with heart failurescheduled for cardiac resynchroniza-tion therapy. Am J Cardiol 2008;101:1023–9.
ey Words: cardiacesynchronization therapy yongestive heart failure ychocardiographic phasemaging y left ventricularyssynchrony y tissue Doppler
maging.
Related Documents