Copyright © 2005 John Wiley & Sons, Ltd. Earth Surface Processes and Landforms Earth Surf. Process. Landforms 30, 1283–1304 (2005) Published online 1 September 2005 in Wiley InterScience (www.interscience.wiley.com). DOI: 10.1002/esp.1201 Measurement and prediction of sediment production from unpaved roads, St John, US Virgin Islands Carlos E. Ramos-Scharrón 1 and Lee H. MacDonald 2 * 1 Department of Geosciences, Colorado State University, Fort Collins, CO 80523-1482, USA 2 Department of Forest, Rangeland, and Watershed Stewardship, Colorado State University, Fort Collins, CO 80523-1472, USA Abstract Excess delivery of land-based sediments is an important control on the overall condition of nearshore coral reef ecosystems. Unpaved roads have been identified as a dominant sedi- ment source on St John in the US Virgin Islands. An improved understanding of road sediment production rates is needed to guide future development and erosion control efforts. The main objectives of this study were to: (1) measure sediment production rates at the road segment scale; (2) evaluate the importance of precipitation, slope, contributing area, traffic, and grading on road sediment production; (3) develop an empirical road erosion predictive model; and (4) compare our measured erosion rates to other published data. Sediment production from 21 road segments was monitored with sediment traps from July 1998 to November 2001. The selected road segments had varying slopes, contributing areas, and traffic loads. Precipitation was measured by four recording rain gauges. Sediment production was related to total precipitation and road segment slope. After normalizing by precipitation and slope, the mean sediment production rate for roads that had been graded within the last two years was 0·96 kg m −2 cm −1 mm −1 or approximately 11 kg m −2 a −1 for a typical road with a 10 per cent slope and an annual rainfall of 115 cm a −1 . The mean erosion rate for ungraded roads was 42 per cent lower, or 0·56 kg m −2 cm −1 mm −1 . The normalized mean sediment production rate for road segments that had been abandoned for over fifteen years was only about 10 per cent of the mean value for ungraded roads. Sediment production was not related to traffic loads. Multiple regression analysis led to the development of an empirical model based on precipitation, slope to the 1·5 power, and a categorical grading variable. The measured and predicted erosion rates indicate that roads are capable of increasing hillslope-scale sediment production rates by up to four orders of magnitude relative to un- disturbed conditions. The values from St John are at the high end of reported road erosion rates, a finding that is consistent with the high rainfall erosivities and steep slopes of many of the unpaved roads on St John. Other than paving, the most practical methods to reduce current erosion rates are to minimize the frequency of grading and improve road drainage. Copyright © 2005 John Wiley & Sons, Ltd. Keywords: surface erosion; forest roads; dry tropics; US Virgin Islands; Caribbean Introduction Problem statement and objectives Unpaved roads have been shown to be a primary sediment source and cause of increased sediment yields in a wide range of forested areas (e.g. Megahan, 1987; Luce and Wemple, 2001). The disruption of geomorphologic and hydrologic processes by roads increases both surface erosion and the frequency of mass wasting (e.g. Gresswell et al., 1979; Sidle et al., 1985; Larsen and Parks, 1997; Gucinski et al., 2001). These increases are of particular concern in forested areas because natural erosion rates tend to be very low. Surface erosion from unpaved road surfaces has been shown to be an important sediment source in Australia (Grayson et al., 1993), New Zealand (Fahey and Coker, 1989; *Correspondence to: L. H. MacDonald, Department of Forest, Rangeland, and Watershed Stewardship, Colorado State University, Fort Collins, CO 80523-1472, USA. E-mail: [email protected] Received 11 May 2004; Revised 14 October 2004; Accepted 18 November 2004

Welcome message from author
This document is posted to help you gain knowledge. Please leave a comment to let me know what you think about it! Share it to your friends and learn new things together.
Transcript

Sediment production from unpaved roads 1283
Copyright © 2005 John Wiley & Sons, Ltd. Earth Surf. Process. Landforms 30, 1283–1304 (2005)
Earth Surface Processes and LandformsEarth Surf. Process. Landforms 30, 1283–1304 (2005)Published online 1 September 2005 in Wiley InterScience (www.interscience.wiley.com). DOI: 10.1002/esp.1201
Measurement and prediction of sediment productionfrom unpaved roads, St John, US Virgin IslandsCarlos E. Ramos-Scharrón1 and Lee H. MacDonald2*1 Department of Geosciences, Colorado State University, Fort Collins, CO 80523-1482, USA2 Department of Forest, Rangeland, and Watershed Stewardship, Colorado State University, Fort Collins, CO 80523-1472, USA
AbstractExcess delivery of land-based sediments is an important control on the overall condition ofnearshore coral reef ecosystems. Unpaved roads have been identified as a dominant sedi-ment source on St John in the US Virgin Islands. An improved understanding of roadsediment production rates is needed to guide future development and erosion control efforts.The main objectives of this study were to: (1) measure sediment production rates at the roadsegment scale; (2) evaluate the importance of precipitation, slope, contributing area, traffic,and grading on road sediment production; (3) develop an empirical road erosion predictivemodel; and (4) compare our measured erosion rates to other published data. Sedimentproduction from 21 road segments was monitored with sediment traps from July 1998 toNovember 2001. The selected road segments had varying slopes, contributing areas, andtraffic loads. Precipitation was measured by four recording rain gauges.
Sediment production was related to total precipitation and road segment slope. Afternormalizing by precipitation and slope, the mean sediment production rate for roads thathad been graded within the last two years was 0·96 kg m−−−−−2 cm−−−−−1 m m−−−−−1 or approximately11 kg m−−−−−2 a−−−−−1 for a typical road with a 10 per cent slope and an annual rainfall of 115 cm a−−−−−1.The mean erosion rate for ungraded roads was 42 per cent lower, or 0·56 kg m−−−−−2 cm−−−−−1 m m−−−−−1.The normalized mean sediment production rate for road segments that had been abandonedfor over fifteen years was only about 10 per cent of the mean value for ungraded roads.Sediment production was not related to traffic loads. Multiple regression analysis led to thedevelopment of an empirical model based on precipitation, slope to the 1·5 power, and acategorical grading variable.
The measured and predicted erosion rates indicate that roads are capable of increasinghillslope-scale sediment production rates by up to four orders of magnitude relative to un-disturbed conditions. The values from St John are at the high end of reported road erosionrates, a finding that is consistent with the high rainfall erosivities and steep slopes of many ofthe unpaved roads on St John. Other than paving, the most practical methods to reducecurrent erosion rates are to minimize the frequency of grading and improve road drainage.Copyright © 2005 John Wiley & Sons, Ltd.
Keywords: surface erosion; forest roads; dry tropics; US Virgin Islands; Caribbean
Introduction
Problem statement and objectivesUnpaved roads have been shown to be a primary sediment source and cause of increased sediment yields in a widerange of forested areas (e.g. Megahan, 1987; Luce and Wemple, 2001). The disruption of geomorphologic andhydrologic processes by roads increases both surface erosion and the frequency of mass wasting (e.g. Gresswell et al.,1979; Sidle et al., 1985; Larsen and Parks, 1997; Gucinski et al., 2001). These increases are of particular concern inforested areas because natural erosion rates tend to be very low. Surface erosion from unpaved road surfaces has beenshown to be an important sediment source in Australia (Grayson et al., 1993), New Zealand (Fahey and Coker, 1989;
*Correspondence to:L. H. MacDonald,Department of Forest,Rangeland, and WatershedStewardship, Colorado StateUniversity, Fort Collins,CO 80523-1472, USA.E-mail: [email protected]
Received 11 May 2004;Revised 14 October 2004;Accepted 18 November 2004

1284 C. E. Ramos-Scharrón and L. H. MacDonald
Copyright © 2005 John Wiley & Sons, Ltd. Earth Surf. Process. Landforms 30, 1283–1304 (2005)
Fransen et al., 2001), Malaysia (Douglas et al., 1993), the United States (e.g. Reid and Dunne, 1984; Burroughs et al.,1991), Poland (Froehlich and Walling, 1997; Froehlich, 1991), Ghana (Kumapley, 1987), and Kenya (Dunne, 1979).
Collaborative work among geomorphologists, hydrologists, and stream ecologists has helped document the adverseimpacts of excessive sediment inputs on freshwater fluvial systems (e.g. Everest et al., 1987; National ResearchCouncil, 1992; Waters, 1995). Marine ecosystems, such as nearshore coral reef communities, also can be adverselyaffected by excessive inputs of fine sediment following land disturbance (Hubbard, 1987; Hodgson, 1989, 1997;Rogers, 1990). The effects of increased erosion on reef communities is of particular concern in the Caribbean becauseof the high potential erosion rates following disturbance and the importance of coral reefs to the tourism-based localeconomies. In recent years marine ecologists have documented the effects of high sediment inputs on coral reefs in theDominican Republic (Torres et al., 2001), Puerto Rico (Acevedo et al., 1989; Torres, 2001) and the nearby island ofCulebra (Hernández-Delgado, 2001), Virgin Gorda in the British Virgin Islands (C. Rogers, USGS, pers. comm.,2001), as well as in St Croix (Hubbard, 1986), St Thomas (Nemeth and Nowlis, 2001) and St John (Rogers, 1998;Nemeth et al., 2001) in the US Virgin Islands.
Within the US Virgin Islands, the coral reefs near St John have received special attention because 23 km2 ofoffshore waters and 28 km2 or 56 per cent of the island form the Virgin Islands National Park (Figure 1) and have beendesignated as a Biosphere Reserve. In 2001 an additional 47 km2 of offshore waters were designated as the VirginIslands Coral Reef National Monument. Previous research showed that sediment production rates from unpaved roadsare several orders of magnitude higher than sediment production rates from undisturbed hillslopes, and that unpavedroads were probably the primary source of the fine sediment being delivered to the marine environment (MacDonaldet al., 2001). The cross-sectional area of rills on unpaved road surfaces was related to road segment area multipliedby slope, and this relationship formed the basis of an empirical road erosion model called ROADMOD (Andersonand MacDonald, 1998). The application of ROADMOD to two basins indicated that unpaved road erosion may beincreasing sediment yields by up to four times (MacDonald et al., 1997), but these studies did not directly measureroad erosion rates or assess the role of other factors that have been shown to affect road erosion rates (Ramos, 1997).
The development of improved predictive equations is needed to better estimate sediment production and deliveryfrom different road segments, identify erosion control strategies, and guide future development. Hence the specificobjectives of this study were to: (1) measure sediment production rates from unpaved road surfaces; (2) evaluate the
Figure 1. Map of St John showing the locations of the rain gauges and road segment sediment traps.

Sediment production from unpaved roads 1285
Copyright © 2005 John Wiley & Sons, Ltd. Earth Surf. Process. Landforms 30, 1283–1304 (2005)
effect of precipitation, slope, contributing area, traffic, and grading on sediment production rates; (3) develop anempirical model to predict road sediment production rates; and (4) compare the measured road sediment productionrates to published data from St John and elsewhere.
Modelling road sediment productionAn exposed soil surface is subject to two primary surface erosion processes: rainsplash and the shear stress ofoverland flow. Rainsplash energy is a function of precipitation intensity as well as the size and terminal velocity of theraindrops (Wischmeier and Smith, 1958; Carter et al., 1974). Flow hydraulics determine the shear stress of overlandflow, while the resistance to erosion is controlled by the size and cohesion of the underlying material. If one assumesthat rainsplash erosion is rapidly eliminated after surface runoff has begun (Moss and Green, 1983), the surfaceerosion rate (Et) is proportional to the difference between the shear stress applied by overland flow (τ) and theresistance of the material to erosion (τc):
Et ∝ k1(τ − τc)n (1)
where k1 is an index of the erodibility of the sediment and n is an exponent between 1 and 2 (Kirkby, 1980). The shearstress applied by overland flow is equal to:
τ = ρwghs (2)
where ρw is the density of water, g is the acceleration due to gravity, h is the depth of flow, and s is the water surfaceslope (Julien, 1995). τc is generally a function of the particle-size distribution, as this controls the exposure of particlesto hydraulic forces, the cohesive forces between particles, and the tractive force needed to detach individual particles(Knighton, 1998).
Infiltration rates on unpaved roads are typically very low (Bren and Leitch, 1985; Harden, 1992; Ziegler andGiambelluca, 1997). Hence, the frequency and magnitude of infiltration-excess (Horton) overland flow is much greaterfrom unpaved roads than undisturbed areas. On St John only 3–6 mm of precipitation are needed to initiate infiltration-excess overland flow on unpaved road surfaces (MacDonald et al., 2001; Ramos-Scharrón and MacDonald, in press).Equations 1 and 2 indicate that the surface erosion rate is directly proportional to flow depth. The continuity equationfor a road segment requires that the inflow rate [Qi(t)] must equal the sum of outflow rate [Qo(t)] plus temporary waterstorage [S(t)]:
Qi(t) = Qo(t) + S(t) (3)
For an isolated road segment, the inflow rate is determined by precipitation excess, which is the difference betweenprecipitation intensity [P(t)] and infiltration rate [I(t)] multiplied by the surface area of the road segment (A):
Qi(t) = [P(t) − I(t)]A (4)
Since storage and outflow rates are each a function of water depth, increasing inflow (precipitation excess or roadsurface area) increases flow depth and thus the potential for surface erosion (Equation 2).
The parent material affects the resistance of unpaved roads to surface erosion by controlling the surface particle-sizedistribution (Luce and Black, 1999). The particle-size distribution of the road surface is affected by the amount andtype of traffic (e.g. Wald, 1975; Reid, 1981; Grayson et al., 1993; MacDonald et al., 2001), the preferential erosion ofparticles in a given size class, and the time since construction or grading.
The amount and type of traffic affects road surface erodibility by particle attrition between storms (Bilby et al., 1989;Kahklen, 1993; Foltz, 1996; Ziegler et al., 2001a) and the pumping of fine particles onto the surface as the road tread iscompacted, especially during wet conditions (Reid, 1981; Bilby et al., 1989; Ziegler et al., 2001b). Gravel roads subjectedto more than four heavy truck passes per day had higher erosion rates than roads with less traffic (Reid and Dunne, 1984).
Newly constructed and freshly resurfaced roads typically have very high sediment production rates due to theabundance of easily erodible fine particles (Megahan and Kidd, 1972; Megahan et al., 1986). The rapid erosion of finesediment immediately after construction or regrading leads to a coarsening of the road surface, which increases itsresistance to erosion. Only a few studies have directly measured time trends in sediment production after regrading. Inthe Oregon Coast Range, blading of the ditch along gravel-surfaced roads increased sediment production rates morethan road surface grading alone (Black and Luce, 1999; Luce and Black 1999, 2001a, b). On St John, vehicle-inducedrutting and the absence of road ditches keeps much of the runoff on the road surface and this facilitates the detachment

1286 C. E. Ramos-Scharrón and L. H. MacDonald
Copyright © 2005 John Wiley & Sons, Ltd. Earth Surf. Process. Landforms 30, 1283–1304 (2005)
and transport of the loose, fine sediment applied during grading. The decline in road erosion rates after construction orgrading has been modelled using the equation:
E E k S k tt n e = + −
2 02 (5)
where Et is the erosion rate (in Mg km−2 day−1), En is the erosion rate approached after a long period without anydisturbance (Mg km−2 day−1), S0 is the total amount of material available for erosion immediately after construction orgrading (Mg km−2), k2 (in days−1) is an index of the rate of decline in erosion following the disturbance, and t is thetime after disturbance in days (Megahan, 1974).
The dependence of erosion rates on the interplay between the available energy and the erodibility of loose materialhas led to the development of a dynamic erodibility model for unpaved road surfaces (Ziegler et al., 2000, 2001a, b).These studies modelled the changes in surface erodibility over time as a function of traffic and the extent to which theroad surface has been depleted of highly erodible material.
Given this theoretical background, our study design, field measurements, and model development efforts focused onprecipitation characteristics, road slope, active road area, traffic, and time since grading. As documented above, thesefactors control the amount of runoff, the tractive forces applied by overland flow, and the resistance of the road surfaceto erosion.
Study Area
St John is the third largest island of the US Virgin Islands, and it lies in the eastern Caribbean approximately 80 kmeast of Puerto Rico (Figure 1). The topography is very rugged, as more than 80 per cent of the slopes are greater than30 per cent (CH2M Hill, 1979; Anderson, 1994). Bordeaux Mountain is the highest point of the island at an elevationof 387 m.
The lithology of St John is dominated by rocks originating from volcanic flows (Donnelly, 1966; Rankin, 2002) thathave undergone periods of deformation, magmatic intrusions, and hydrothermal alterations. Soils are dominated bygravelly loams and clay loams (USDA, 1995). They have a fine clayey to loamy matrix with abundant coarsefragments (Soil Conservation Service, 1970). The soils tend to be shallow, moderately permeable, well drained, andunderlain by nearly impervious bedrock (USDA, 1995).
The climate of St John is characterized as dry tropical. Bowden et al. (1970) identified five precipitation zonesranging from a low of 89–102 cm a−1 on the eastern end of the island to a high of 127–140 cm a−1 near BordeauxMountain. Easterly waves, which can develop into tropical storms and hurricanes, generate most of the rainfall fromMay to November, while cold fronts are important sources of rainfall from December to April (Calversbert, 1970).There are no sharply defined wet and dry seasons in the Virgin Islands, but a relatively dry season extends from aboutFebruary to July, and a relatively wet season lasts from August until January (Bowden, et al., 1970). Mean monthlypotential evapotranspiration (PET) exceeds mean monthly precipitation for most of the year (Bowden et al., 1970;Sampson, 2000), so there are no perennial streams on St John (MacDonald et al., 1997).
Precipitation in St John is highly erosive. The average annual erosivity at Caneel Bay was estimated to be13 500 MJ mm ha−1 h−1 (Sampson, 2000). The 15-minute precipitation intensity at Caneel Bay exceeded 100 mm h−1
sixteen times from 1979 to 1995.Dry evergreen forests and shrubs cover approximately 63 per cent of the total land area, moist forest and secondary
vegetation about 30 per cent, while urban, wetland, and pasture each cover about 2 per cent of the island (Woodburyand Weaver, 1987). Rapid development on privately owned lands over the past 30 years has resulted in a dense roadnetwork on St John.
Construction and maintenance standards of the unpaved roads on St John are generally very poor. The spacing ofroad drainage structures (i.e. ditches, culverts, or cross-drains) is very sparse, even on extremely steep road segments.As a result of the high rainfall erosivity and poor drainage design, deep rills commonly develop on the road surface,especially on the steeper road segments (Figure 2). On these segments regrading is done every year or so to facilitatethe passage of standard passenger cars.
Methods
Precipitation was measured with four recording rain gauges (Figure 1). Table I lists the type, resolution, and period ofrecord for each gauge. The measured precipitation at each location was compared to expected monthly and annual

Sediment production from unpaved roads 1287
Copyright © 2005 John Wiley & Sons, Ltd. Earth Surf. Process. Landforms 30, 1283–1304 (2005)
Figure 2. A typical steep road segment near Bordeaux Mountain with a deeply rilled travelway.
Table I. Type, resolution, and period of record for the rain gauges used in this study
Station
Bordeaux Mountain
Fish Bay
Lameshur Bay
Maho Bay
Time (min); anddepth (cm) resolution
15; 0·025
60; 0·25
15; 0·025
15; 0·25
60; 0·025
15; 0·025
Type of gauge
Tipping bucket
Weighing bucket
Tipping bucket
Tipping bucket
Weighing bucket
Tipping bucket
Period of record [Gaps in data]
14 Sep 98 to 2 Sep 99[28 Feb 99 to 28 Jun 99]
2 Sep 99 to 3 May 00[None]
20 Jul 98 to 3 May 00[8 Feb 99 to 8 Jul 99; 20 Oct 99 to 7 Nov 99]
19 Aug 98 to 3 May 00[8 Feb 99 to 12 Jul 99; 19 Oct 99 to 3 May 00]
13 Jul 98 to 2 Sep 99[20 Sep 98 to 28 Sep 98]
2 Sep 99 to 13 Apr 00[None]
precipitation totals defined by Bowden et al. (1970) and values measured at Caneel Bay from 1979 to 1995 (EarthInfo,1996). The precipitation data also were used to determine total storm precipitation and 15-minute erosivities followingRenard et al. (1997). An individual storm was defined as a precipitation event isolated from other events by at leastone hour with no precipitation. This definition was used because overland flow on road surfaces usually ceases within30–60 minutes after the end of a rainfall event (Ramos-Scharrón, 2004). Fifteen-minute erosivities were calculated forindividual storm events for the three gauges with sufficient temporal resolution.
1288 C. E. Ramos-Scharrón and L. H. MacDonald
Copyright © 2005 John Wiley & Sons, Ltd. Earth Surf. Process. Landforms 30, 1283–1304 (2005)
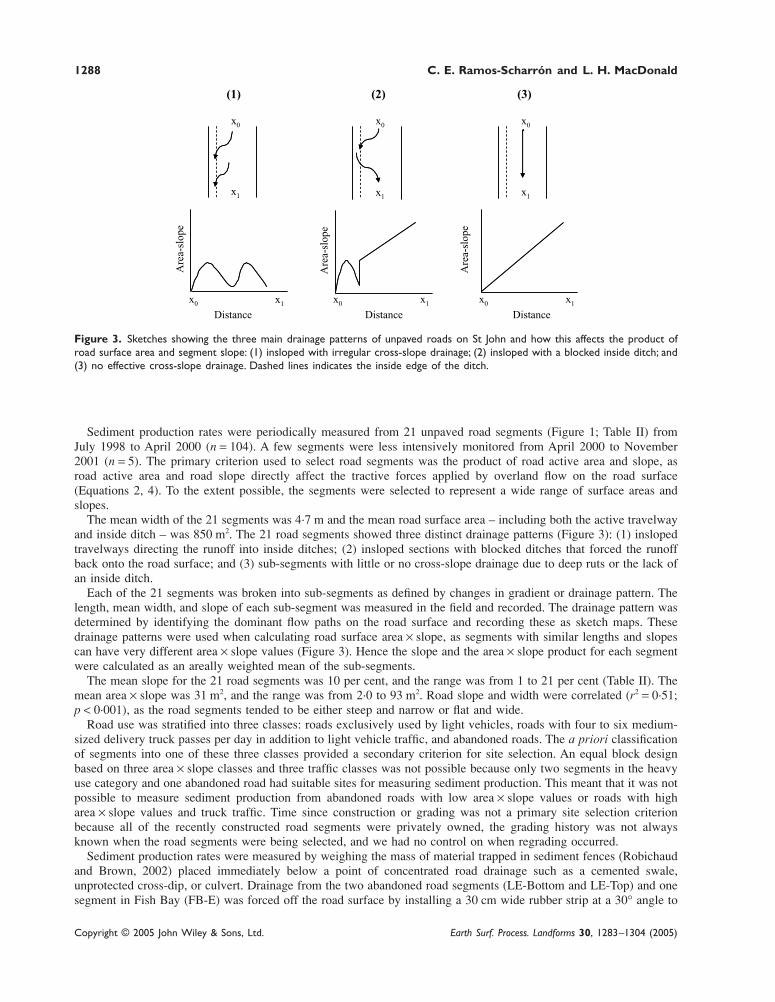
Figure 3. Sketches showing the three main drainage patterns of unpaved roads on St John and how this affects the product ofroad surface area and segment slope: (1) insloped with irregular cross-slope drainage; (2) insloped with a blocked inside ditch; and(3) no effective cross-slope drainage. Dashed lines indicates the inside edge of the ditch.
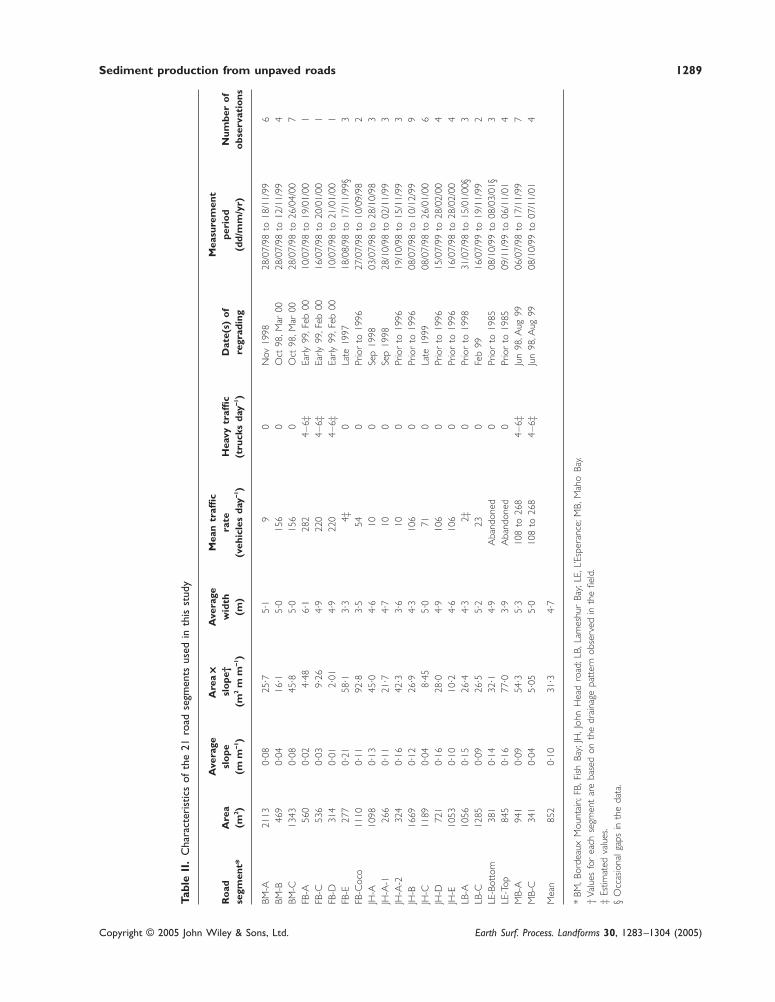
Sediment production rates were periodically measured from 21 unpaved road segments (Figure 1; Table II) fromJuly 1998 to April 2000 (n = 104). A few segments were less intensively monitored from April 2000 to November2001 (n = 5). The primary criterion used to select road segments was the product of road active area and slope, asroad active area and road slope directly affect the tractive forces applied by overland flow on the road surface(Equations 2, 4). To the extent possible, the segments were selected to represent a wide range of surface areas andslopes.
The mean width of the 21 segments was 4·7 m and the mean road surface area – including both the active travelwayand inside ditch – was 850 m2. The 21 road segments showed three distinct drainage patterns (Figure 3): (1) inslopedtravelways directing the runoff into inside ditches; (2) insloped sections with blocked ditches that forced the runoffback onto the road surface; and (3) sub-segments with little or no cross-slope drainage due to deep ruts or the lack ofan inside ditch.
Each of the 21 segments was broken into sub-segments as defined by changes in gradient or drainage pattern. Thelength, mean width, and slope of each sub-segment was measured in the field and recorded. The drainage pattern wasdetermined by identifying the dominant flow paths on the road surface and recording these as sketch maps. Thesedrainage patterns were used when calculating road surface area × slope, as segments with similar lengths and slopescan have very different area × slope values (Figure 3). Hence the slope and the area × slope product for each segmentwere calculated as an areally weighted mean of the sub-segments.
The mean slope for the 21 road segments was 10 per cent, and the range was from 1 to 21 per cent (Table II). Themean area × slope was 31 m2, and the range was from 2·0 to 93 m2. Road slope and width were correlated (r2 = 0·51;p < 0·001), as the road segments tended to be either steep and narrow or flat and wide.
Road use was stratified into three classes: roads exclusively used by light vehicles, roads with four to six medium-sized delivery truck passes per day in addition to light vehicle traffic, and abandoned roads. The a priori classificationof segments into one of these three classes provided a secondary criterion for site selection. An equal block designbased on three area × slope classes and three traffic classes was not possible because only two segments in the heavyuse category and one abandoned road had suitable sites for measuring sediment production. This meant that it was notpossible to measure sediment production from abandoned roads with low area × slope values or roads with higharea × slope values and truck traffic. Time since construction or grading was not a primary site selection criterionbecause all of the recently constructed road segments were privately owned, the grading history was not alwaysknown when the road segments were being selected, and we had no control on when regrading occurred.
Sediment production rates were measured by weighing the mass of material trapped in sediment fences (Robichaudand Brown, 2002) placed immediately below a point of concentrated road drainage such as a cemented swale,unprotected cross-dip, or culvert. Drainage from the two abandoned road segments (LE-Bottom and LE-Top) and onesegment in Fish Bay (FB-E) was forced off the road surface by installing a 30 cm wide rubber strip at a 30° angle to
Sediment production from unpaved roads 1289
Copyright © 2005 John Wiley & Sons, Ltd. Earth Surf. Process. Landforms 30, 1283–1304 (2005)
Tabl
e II
.C
hara
cter
istic
s of
the
21
road
seg
men
ts u
sed
in t
his
stud
y
Ave
rage
Are
a×××× ×
Ave
rage
Mea
n tr
affi
cM
easu
rem
ent
Ro
adA
rea
slo
pesl
ope
†w
idth
rate
Hea
vy t
raffi
cD
ate(
s) o
fpe
rio
dN
umbe
r o
fse
gmen
t*(m
2 )(m
m−−−− −1
)(m
2m
m−−−− −1
)(m
)(v
ehic
les
day−−−− −1
)(t
ruck
s da
y−−−− −1)
regr
adin
g(d
d/m
m/y
r)o
bser
vati
ons
BM-A
2113
0·08
25·7
5·1
90
Nov
199
828
/07/
98 t
o 18
/11/
996
BM-B
469
0·04
16·1
5·0
156
0O
ct 9
8, M
ar 0
028
/07/
98 t
o 12
/11/
994
BM-C
1343
0·08
45·8
5·0
156
0O
ct 9
8, M
ar 0
028
/07/
98 t
o 26
/04/
007
FB-A
560
0·02
4·48
6·1
282
4–
6‡Ea
rly 9
9, F
eb 0
010
/07/
98 t
o 19
/01/
001
FB-C
536
0·03
9·26
4·9
220
4–
6‡Ea
rly 9
9, F
eb 0
016
/07/
98 t
o 20
/01/
001
FB-D
314
0·01
2·01
4·9
220
4–
6‡Ea
rly 9
9, F
eb 0
010
/07/
98 t
o 21
/01/
001
FB-E
277
0·21
58·1
3·3
4‡0
Late
199
718
/08/
98 t
o 17
/11/
99§
3FB
-Coc
o11
100·
1192
·83·
554
0Pr
ior
to 1
996
27/0
7/98
to
10/0
9/98
2JH
-A10
980·
1345
·04·
610
0Se
p 19
9803
/07/
98 t
o 28
/10/
983
JH-A
-126
60·
1121
·74·
710
0Se
p 19
9828
/10/
98 t
o 02
/11/
993
JH-A
-232
40·
1642
·33·
610
0Pr
ior
to 1
996
19/1
0/98
to
15/1
1/99
3JH
-B16
690·
1226
·94·
310
60
Prio
r to
199
608
/07/
98 t
o 10
/12/
999
JH-C
1189
0·04
8·45
5·0
710
Late
199
908
/07/
98 t
o 26
/01/
006
JH-D
721
0·16
28·0
4·9
106
0Pr
ior
to 1
996
15/0
7/99
to
28/0
2/00
4JH
-E10
530·
1010
·24·
610
60
Prio
r to
199
616
/07/
98 t
o 28
/02/
004
LB-A
1056
0·15
26·4
4·3
2‡0
Prio
r to
199
831
/07/
98 t
o 15
/01/
00§
3LB
-C12
850·
0926
·55·
223
0Fe
b 99
16/0
7/99
to
19/1
1/99
2LE
-Bot
tom
381
0·14
32·1
4·9
Aba
ndon
ed0
Prio
r to
198
508
/10/
99 t
o 08
/03/
01§
3LE
-Top
845
0·16
77·0
3·9
Aba
ndon
ed0
Prio
r to
198
509
/11/
99 t
o 06
/11/
014
MB-
A94
10·
0954
·35·
310
8 to
268
4–
6‡Ju
n 98
, Aug
99
06/0
7/98
to
17/1
1/99
7M
B-C
341
0·04
5·05
5·0
108
to 2
684
–6‡
Jun
98, A
ug 9
908
/10/
99 t
o 07
/11/
014
Mea
n85
20·
1031
·34·
7
*BM
, Bor
deau
x M
ount
ain;
FB,
Fish
Bay
; JH
, Joh
n H
ead
road
; LB,
Lam
eshu
r Ba
y; LE
, L’E
sper
ance
; MB,
Mah
o Ba
y.†
Valu
es f
or e
ach
segm
ent
are
base
d on
the
dra
inag
e pa
tter
n ob
serv
ed in
the
fiel
d.‡
Estim
ated
val
ues.
§ O
ccas
iona
l gap
s in
the
dat
a.

1290 C. E. Ramos-Scharrón and L. H. MacDonald
Copyright © 2005 John Wiley & Sons, Ltd. Earth Surf. Process. Landforms 30, 1283–1304 (2005)
the general direction of the road. The rubber strip was set into a trench 15 cm deep that was backfilled and sealed withconcrete.
The sediment fences consisted of filter fabric attached to approximately 1 m long pieces of rebar hammeredvertically into the ground. This created a sediment trap about 50 cm high, and the remaining 50 cm of fabric wasplaced flat on the ground to serve as an apron and a base for removing the accumulated sediment. The leading edge ofthe apron was secured to the ground surface with rocks or U-shaped pieces of rebar to prevent underflow. The tightweave of the filter fabric did not readily allow water to flow through it, so the sediment fences acted more like damsthan filters.
The fences were regularly checked after storm events, and once a substantial amount of sediment had accumulated,the material was shovelled into buckets and weighed with a radial scale to the nearest 0·2 kg. One or two well-mixedsamples of 1–4 kg were collected and placed in watertight bags. Percentage moisture content was measured in thelaboratory (Gardner, 1986) and used to correct the field-measured wet weights to a dry mass. Twenty-nine of the 109measurements from sediment fences had to be discarded because precipitation data were not available or because thesediment production data were affected by overtopping of the sediment fences, clogged culverts, or vandalization ofthe sediment fences.
The particle-size distributions of 40 samples from different fences were determined by dry sieving (Bowles, 1992)for particles coarser than 0·075 mm, and the hydrometer method (Gee and Bauder, 1986) for particles smaller than0·075 mm. The 40 samples were selected to represent road segments with varying slopes, amounts of traffic, and timessince grading. The mean mass-weighted particle-size distribution of the eroded sediment was determined for 20 of the21 road segments. Multiple-comparison statistical procedures (F-protected LSD and Tukey’s HSD) were used todetermine if road grading and slope had any effect on the particle-size distribution of the material captured in thesediment fences.
For each road segment the effect of precipitation was evaluated by plotting sediment production against totalprecipitation and the sum of 15-minute rainfall erosivity values over the period of a given measurement. Afternormalizing by precipitation, the effect of road gradient was evaluated by plotting sediment production against slopefor roads with similar amounts of traffic and times since grading. The effect of traffic was determined by comparingmean sediment production rates – normalized by total precipitation and road segment slope – for two different trafficlevels. Heavy-traffic road segments were used by about four to six delivery trucks and 110–280 light vehicles per day(Table II), while those with light traffic were used by 2–160 vehicles per day and only rarely traversed by trucks.Similarly, the effect of grading was determined by plotting sediment production – normalized by precipitation andgradient – against time since grading. The results of this initial data analysis led to the formulation of several multipleregression models with the following general form:
Er = A × (precipitation or erosivity) + B × (slopei or area × slope) + C × (grading)+ Dj × (two and three-way interaction terms) + Intercept (6)
where Er is sediment production (kg m−2), capital letters are empirical parameters, precipitation denotes total rainfall(cm), erosivity refers to the sum of 15-minute erosivity values (MJ mm ha−1 h−1), slope is the areally weighted roadsegment slope (m m−1), i is an exponent with tested values ranging from 1·0 to 2·0 in 0·1 increments, area × slope isthe areally weighted road segment area times slope (m2), grading is a binary variable equal to one for graded roads andzero for ungraded roads, and j distinguishes the different coefficients when there is more than one interaction term.Each variable included in the model had to be significant at p ≤ 0·05.
Results
PrecipitationThe presentation of precipitation data will focus on the Maho Bay rain gauge, as this site had the longest continuousrecord (Table I). Precipitation data from the other three gauges generally follow the same trends as the Maho Baystation. The total rainfall at Maho Bay from 13 July 1998 to 13 April 2000 was 206 cm. An additional 5–10 cm ofrainfall fell during the eight-day gap in September 1998 when Hurricane Georges passed through. This total is only6 per cent more than the corresponding long-term mean for Caneel Bay, which lies within the same precipitation zoneas Maho Bay (Bowden et al., 1970).
Monthly precipitation generally followed the normal seasonal trends (Figure 4), but rainfall was lower than normalduring most of the drier months (February to July), and higher than normal during most of the wetter months

Sediment production from unpaved roads 1291
Copyright © 2005 John Wiley & Sons, Ltd. Earth Surf. Process. Landforms 30, 1283–1304 (2005)
Figure 4. Monthly precipitation over the study period at Maho Bay. Dashed lines show the expected range of monthly precipitationvalues defined by Bowden et al. (1970).
(approximately October to January). The below-normal rainfall in September 1998 is misleading because it doesnot include the rainfall from Hurricane Georges. The exceptionally high amount of precipitation in November 1999was due largely to Hurricane Lenny, which dropped 14 cm of rainfall over ten distinct storm events in a three-dayperiod.
The frequency distribution of storm precipitation shows that the study period had a larger proportion of smallstorms (<0·5 cm) relative to the long-term record at Caneel Bay (Figure 5). Part of this discrepancy may be due to thehigher resolution of the rain gauge used at Maho Bay (0·025 cm) compared to the Caneel Bay rain gauge (0·25 cm).The relative frequency of storms larger than 2·0 cm was very similar for both stations.
The maximum one-hour precipitation recorded at Maho Bay was 3·6 cm, and the largest erosivity for a singlestorm event was 2670 MJ mm ha−1 h−1. Storm precipitation was non-linearly related to the erosivity of individualstorm events (R2 = 0·95; p < 0·0001) (Ramos-Scharrón, 2004). Similar regressions were developed for the Fish Bay,Bordeaux Mountain, and Caneel Bay precipitation data, and they were used to estimate the total erosivity for stormswhen 15-minute data were not available.
Figure 5. Frequency distribution of storm precipitation from Maho Bay for the period of study (n = 614) versus the long-termaverage for Caneel Bay (n = 2921).

1292 C. E. Ramos-Scharrón and L. H. MacDonald
Copyright © 2005 John Wiley & Sons, Ltd. Earth Surf. Process. Landforms 30, 1283–1304 (2005)
Road Segment Sediment Production
Sediment production rates for most road segments showed a linear relationship to total precipitation, but the signifi-cance of this relationship varied widely among the 16 segments with three or more observations (Table III). Sedimentproduction from the two abandoned road segments was poorly correlated with total precipitation. For the remaining 14segments the median R2 between precipitation and sediment production was 0·71, but the range was from 0·13 to 0·99.Only five segments had a statistically significant relationship (p ≤ 0·05) between sediment production and precipita-tion, three showed borderline significance (p = 0·05–0·10), and six had p-values greater than 0·10.
The low significance of these regressions can be partly attributed to the small variation in total precipitation permeasurement period. Road segments with a statistically significant relationship had an average precipitation range ofapproximately 37 cm as compared to a range of 15 cm for segments with a non-significant relationship. Anotherimportant cause of the poor relationship between precipitation and sediment production is the fact that the fences weremore likely to be cleaned out shortly after the largest storm events. Hence large storm events in rapid successiontended to yield larger amounts of sediment per unit precipitation, while longer time periods with no large stormstended to have more cumulative precipitation but smaller amounts of trapped sediment. A more physically basedanalysis of the relationship between storm precipitation and sediment production is not possible given the resolution ofthe sediment fence data and the absence of runoff data, but storm-based measurements of runoff and suspendedsediment from one road segment show non-linear increases in runoff and suspended sediment yields with increasingstorm rainfall (Ramos-Scharron and MacDonald, in press).
The overall sediment production rate for the 21 road segments was approximately 7·4 kg m−2 a−1, or 0·064 kg m−2
per centimetre of precipitation. The median slope of the relationship between sediment production and precipitationwas 0·09 kg m−2 cm−1, and the range varied from 0·018 to 0·39 kg m−2 cm−1 (Table III). The highest sediment produc-tion rates per unit precipitation were associated with steep roads that had been graded at least once within the last twoyears. After stratifying by grading, there was no significant difference in sediment production per unit precipitationbetween the segments that had a significant relationship between precipitation and sediment production and those thatdid not.
Because sediment production was significantly related to storm precipitation for at least some segments, the datawere normalized by precipitation to better assess the relative effects of slope, road surface area, traffic, and grading.Figure 6 shows sediment production normalized by precipitation versus average slope for recently graded, lightly usedroad segments. For these road segments the sediment production rate per centimetre of precipitation tended toexponentially increase with increasing road slope (R2 = 0·44; p < 0·001). A comparable but slightly stronger trend wasobserved for road surface area times slope (R2 = 0·62; p < 0·001).
Table III. Values of R2, p and slope coefficients for the relationship between precipitation andsediment production (kg m−2) for each segment with at least three observations. Significantrelationships are in bold
Number of Slope coefficientRoad segment observations R2 p-value (kg m−−−−−2 cm−−−−−1)
BM-A 6 0·67 0·045 0·048BM-B 4 0·97 0·016 0·061BM-C 7 0·61 0·037 0·094FB-E 3 0·13 0·77 0·28JH-A 4 0·82 0·12 0·076JH-A1 3 0·73 0·34 0·11JH-A2 3 0·99 0·066 0·27JH-B 9 0·55 0·056 0·064JH-C 6 0·58 0·076 0·023JH-D 4 0·97 0·012 0·12JH-E 4 0·68 0·17 0·048LB-A 3 0·93 0·17 0·39LE-Bottom 3 0·007 >0·25 −0·0028LE-Top 4 0·11 >0·25 −0·0047MB-A 7 0·79 0·011 0·21MB-C 4 0·63 0·20 0·018

Sediment production from unpaved roads 1293
Copyright © 2005 John Wiley & Sons, Ltd. Earth Surf. Process. Landforms 30, 1283–1304 (2005)
A similar analysis indicated that traffic class was not a significant control on sediment production rates. Afternormalizing by precipitation and slope, the 59 measurements from the 14 road segments in the light-use categoryaveraged 0·81 kg m−2 cm−1 m m−1 (s.d. = 0·62) (Table IV). The five segments in the heavy-use class consisted ofthree segments in the Fish Bay basin (FB-A, C, and D segments) and two segments leading to the Maho Bay Eco-Resort (MB-A and C). The average sediment production rate for the 14 measurements from these segments was
Figure 6. Relationship between sediment production (Er) normalized by precipitation and slope (S) for seven recently graded,lightly used road segments.
Table IV. Sediment production rates by road segment normalized by precipitation and slope. The means and standard deviationsare listed for the different traffic and grading categories
Normalized sediment productionRoad segment Traffic category Grading category (kg m−−−−−2 cm−−−−−1 m m−−−−−1)
BM-A Light Graded 0·39BM-B Light Graded 1·50BM-C Light Graded 1·06FB-Coco Light Ungraded 0·60FB-A Heavy Graded 0·25FB-C Heavy Graded 0·52FB-D Heavy Graded 0·78FB-E Light Graded 2·11JH-A Light Graded 0·85JH-A1 Light Graded 1·08JH-A2 Light Ungraded 0·74JH-B Light Ungraded 0·60JH-C Light Graded 0·82JH-D Light Ungraded 0·39JH-E Light Ungraded 0·45LB-A Light Ungraded 0·59LB-C Light Graded 0·53LE-Bottom Abandoned Abandoned 0·10LE-Top Abandoned Abandoned 0·04MB-A Heavy Graded 2·18MB-C Heavy Graded 0·42
Mean heavy traffic (n = 14) 1·28 (s.d. = 1·24)Mean light traffic (n = 59) 0·81 (s.d. = 0·62)Mean graded (n = 48) 1·12 (s.d. = 0·87)Mean ungraded (n = 25) 0·56 (s.d. = 0·30)
1294 C. E. Ramos-Scharrón and L. H. MacDonald
Copyright © 2005 John Wiley & Sons, Ltd. Earth Surf. Process. Landforms 30, 1283–1304 (2005)
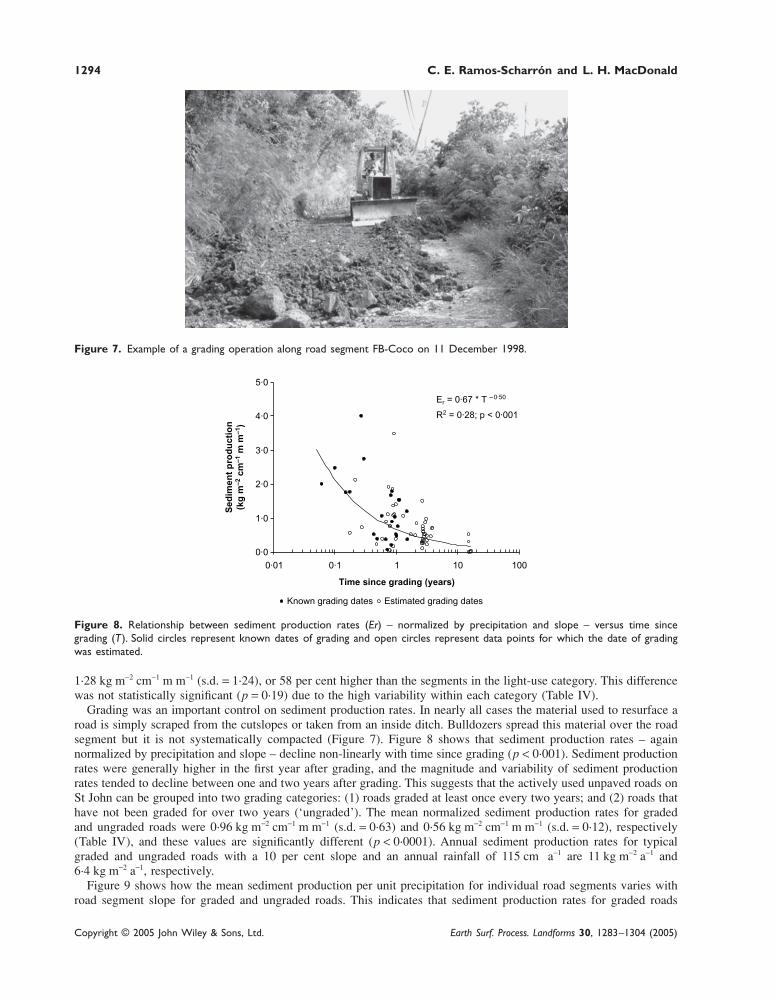
Figure 7. Example of a grading operation along road segment FB-Coco on 11 December 1998.
1·28 kg m−2 cm−1 m m−1 (s.d. = 1·24), or 58 per cent higher than the segments in the light-use category. This differencewas not statistically significant (p = 0·19) due to the high variability within each category (Table IV).
Grading was an important control on sediment production rates. In nearly all cases the material used to resurface aroad is simply scraped from the cutslopes or taken from an inside ditch. Bulldozers spread this material over the roadsegment but it is not systematically compacted (Figure 7). Figure 8 shows that sediment production rates – againnormalized by precipitation and slope – decline non-linearly with time since grading (p < 0·001). Sediment productionrates were generally higher in the first year after grading, and the magnitude and variability of sediment productionrates tended to decline between one and two years after grading. This suggests that the actively used unpaved roads onSt John can be grouped into two grading categories: (1) roads graded at least once every two years; and (2) roads thathave not been graded for over two years (‘ungraded’). The mean normalized sediment production rates for gradedand ungraded roads were 0·96 kg m−2 cm−1 m m−1 (s.d. = 0·63) and 0·56 kg m−2 cm−1 m m−1 (s.d. = 0·12), respectively(Table IV), and these values are significantly different (p < 0·0001). Annual sediment production rates for typicalgraded and ungraded roads with a 10 per cent slope and an annual rainfall of 115 cm a−1 are 11 kg m−2 a−1 and6·4 kg m−2 a−1, respectively.
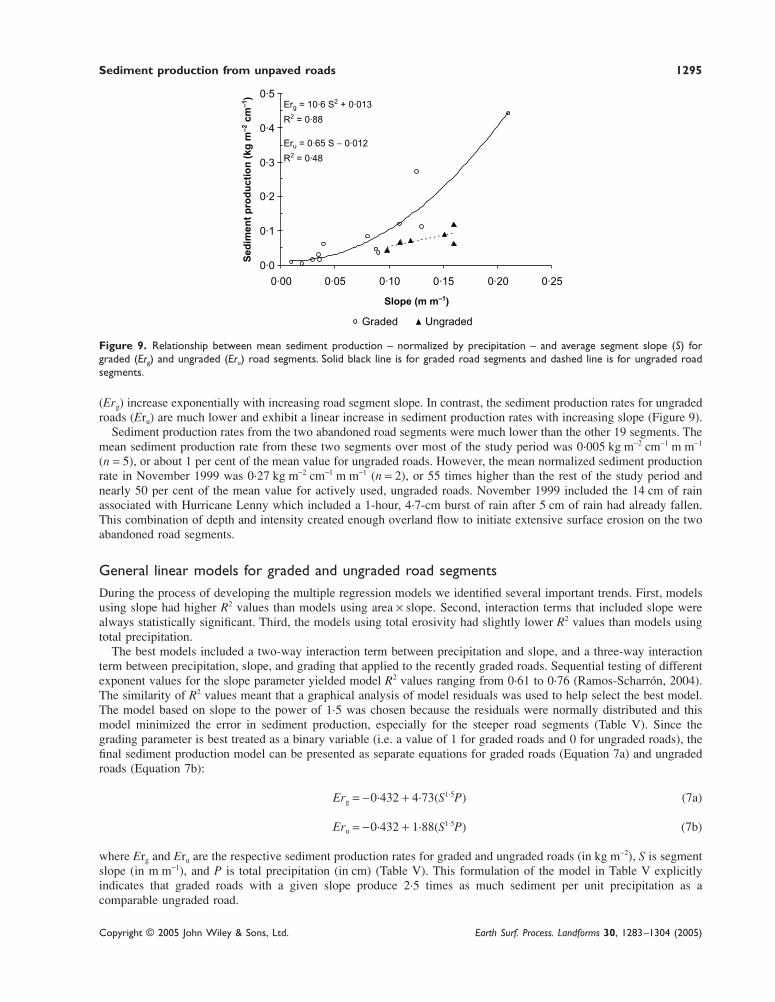
Figure 9 shows how the mean sediment production per unit precipitation for individual road segments varies withroad segment slope for graded and ungraded roads. This indicates that sediment production rates for graded roads
Figure 8. Relationship between sediment production rates (Er) – normalized by precipitation and slope – versus time sincegrading (T). Solid circles represent known dates of grading and open circles represent data points for which the date of gradingwas estimated.
Sediment production from unpaved roads 1295
Copyright © 2005 John Wiley & Sons, Ltd. Earth Surf. Process. Landforms 30, 1283–1304 (2005)
(Erg) increase exponentially with increasing road segment slope. In contrast, the sediment production rates for ungradedroads (Eru) are much lower and exhibit a linear increase in sediment production rates with increasing slope (Figure 9).
Sediment production rates from the two abandoned road segments were much lower than the other 19 segments. Themean sediment production rate from these two segments over most of the study period was 0·005 kg m−2 cm−1 m m−1
(n = 5), or about 1 per cent of the mean value for ungraded roads. However, the mean normalized sediment productionrate in November 1999 was 0·27 kg m−2 cm−1 m m−1 (n = 2), or 55 times higher than the rest of the study period andnearly 50 per cent of the mean value for actively used, ungraded roads. November 1999 included the 14 cm of rainassociated with Hurricane Lenny which included a 1-hour, 4·7-cm burst of rain after 5 cm of rain had already fallen.This combination of depth and intensity created enough overland flow to initiate extensive surface erosion on the twoabandoned road segments.
General linear models for graded and ungraded road segmentsDuring the process of developing the multiple regression models we identified several important trends. First, modelsusing slope had higher R2 values than models using area × slope. Second, interaction terms that included slope werealways statistically significant. Third, the models using total erosivity had slightly lower R2 values than models usingtotal precipitation.
The best models included a two-way interaction term between precipitation and slope, and a three-way interactionterm between precipitation, slope, and grading that applied to the recently graded roads. Sequential testing of differentexponent values for the slope parameter yielded model R2 values ranging from 0·61 to 0·76 (Ramos-Scharrón, 2004).The similarity of R2 values meant that a graphical analysis of model residuals was used to help select the best model.The model based on slope to the power of 1·5 was chosen because the residuals were normally distributed and thismodel minimized the error in sediment production, especially for the steeper road segments (Table V). Since thegrading parameter is best treated as a binary variable (i.e. a value of 1 for graded roads and 0 for ungraded roads), thefinal sediment production model can be presented as separate equations for graded roads (Equation 7a) and ungradedroads (Equation 7b):
Erg = −0·432 + 4·73(S1·5P) (7a)
Eru = −0·432 + 1·88(S1·5P) (7b)
where Erg and Eru are the respective sediment production rates for graded and ungraded roads (in kg m−2), S is segmentslope (in m m−1), and P is total precipitation (in cm) (Table V). This formulation of the model in Table V explicitlyindicates that graded roads with a given slope produce 2·5 times as much sediment per unit precipitation as acomparable ungraded road.
Figure 9. Relationship between mean sediment production – normalized by precipitation – and average segment slope (S) forgraded (Erg) and ungraded (Eru) road segments. Solid black line is for graded road segments and dashed line is for ungraded roadsegments.
1296 C. E. Ramos-Scharrón and L. H. MacDonald
Copyright © 2005 John Wiley & Sons, Ltd. Earth Surf. Process. Landforms 30, 1283–1304 (2005)
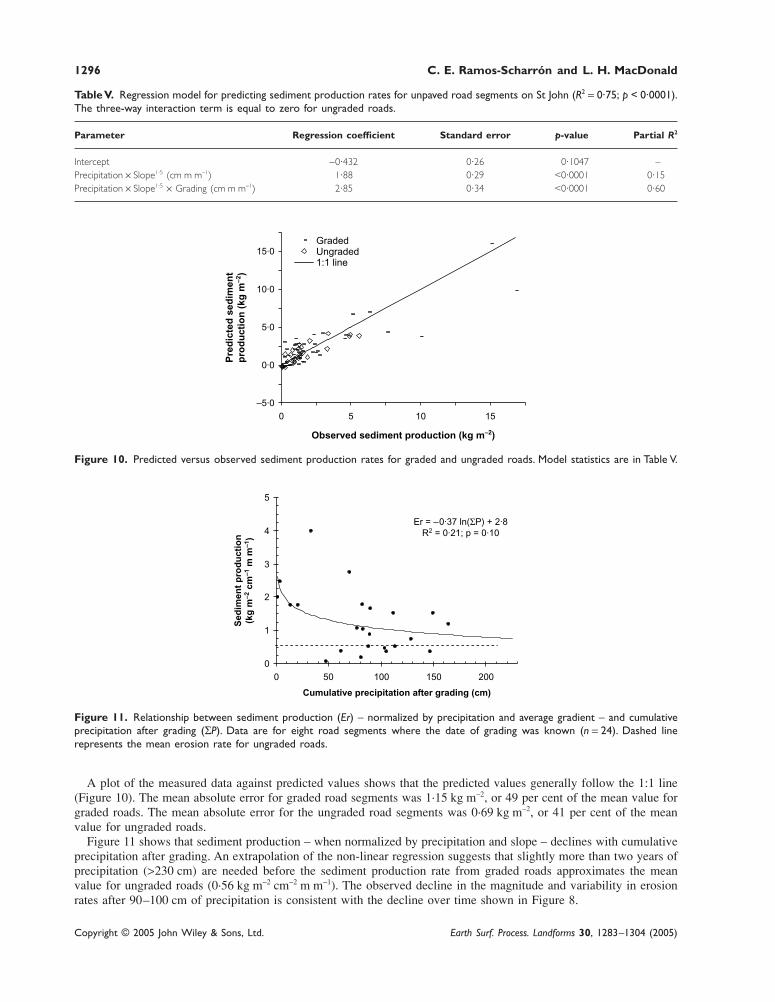
Table V. Regression model for predicting sediment production rates for unpaved road segments on St John (R2 = 0·75; p < 0·0001).The three-way interaction term is equal to zero for ungraded roads.
Parameter Regression coefficient Standard error p-value Partial R2
Intercept −0·432 0·26 0·1047 –Precipitation × Slope1·5 (cm m m−1) 1·88 0·29 <0·0001 0·15Precipitation × Slope1·5 × Grading (cm m m−1) 2·85 0·34 <0·0001 0·60
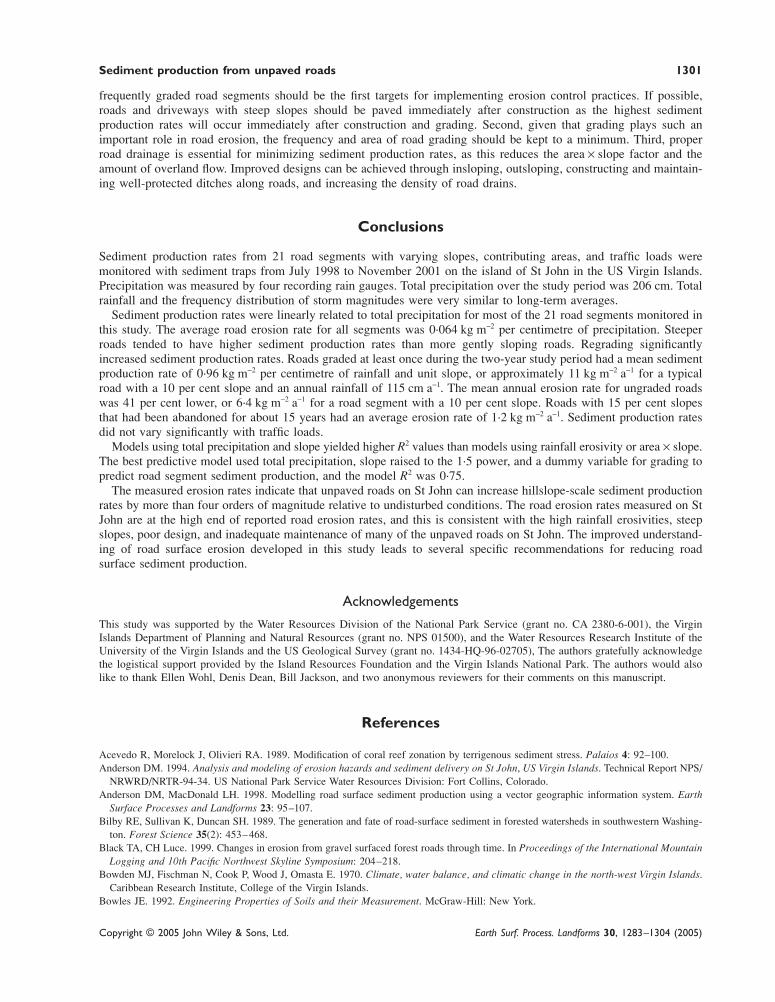
Figure 11. Relationship between sediment production (Er) – normalized by precipitation and average gradient – and cumulativeprecipitation after grading (ΣP). Data are for eight road segments where the date of grading was known (n = 24). Dashed linerepresents the mean erosion rate for ungraded roads.
A plot of the measured data against predicted values shows that the predicted values generally follow the 1:1 line(Figure 10). The mean absolute error for graded road segments was 1·15 kg m−2, or 49 per cent of the mean value forgraded roads. The mean absolute error for the ungraded road segments was 0·69 kg m−2, or 41 per cent of the meanvalue for ungraded roads.
Figure 11 shows that sediment production – when normalized by precipitation and slope – declines with cumulativeprecipitation after grading. An extrapolation of the non-linear regression suggests that slightly more than two years ofprecipitation (>230 cm) are needed before the sediment production rate from graded roads approximates the meanvalue for ungraded roads (0·56 kg m−2 cm−2 m m−1). The observed decline in the magnitude and variability in erosionrates after 90–100 cm of precipitation is consistent with the decline over time shown in Figure 8.
Figure 10. Predicted versus observed sediment production rates for graded and ungraded roads. Model statistics are in Table V.

Sediment production from unpaved roads 1297
Copyright © 2005 John Wiley & Sons, Ltd. Earth Surf. Process. Landforms 30, 1283–1304 (2005)
Table VI. Mass-weighted mean particle sizes by grading and slope classes. Values with different superscript letters aresignificantly different at p < 0·05
Grading and Number of road Silt and Mean D16 Mean D50 Mean D84
slope class segments per class Gravel (%) Sand (%) clay (%) (mm) (mm) (mm)
All samples 20 40 54 6 0·12 0·72 4·1Grading class
Graded 12 36a 58b 6c 0·08A 0·36B 2·5C
Ungraded 6 41a 53b 6c 0·11A 0·64B 4·8C
Abandoned 2 73 27 0·1 0·35 3·1 11
Slope classLow (<10%) 9 32d 60f 8h 0·08D 0·33E 2·5F
Moderate (10–15%) 7 43de 51fg 5hi 0·11D 0·79E 4·3FG
High (>15%) 4 51e 46g 3hi 0·20D 1·5E 7·2G
Particle-size distributionThe mass-weighted average particle-size distribution showed that the material eroded from the unpaved road surfaceswas 40 per cent gravel, 54 per cent sand, and 6 per cent silt and clay (Table VI). The median particle-size (D50) for theeroded sediment from all road segments was 0·72 mm or coarse sand, and the 16th (D16) and 84th (D84) percentileswere 0·12 and 4·1 mm, respectively. On average, the sediment from graded roads had slightly less gravel and moresand than the sediment from ungraded roads, but these differences were not statistically significant (Table VI). Thesediment collected from the two abandoned road segments was much coarser, as this consisted of 73 per cent gravel,27 per cent sand, and less than 1 per cent silt and clay. The particle-size distribution of the sediment from abandonedroads was not tested for significant differences as this class was represented by only two samples.
When sorted by slope class, the sediment eroded from the steepest road segments (>15 per cent) was significantlycoarser than the sediment from low-gradient roads (<10 per cent) (Table VI). There were no significant differences inthe particle sizes of the eroded sediments between the moderately sloped roads and the other two slope classes.
Discussion
Effects of precipitation, slope and grading on road sediment productionThe general linear regression model indicates that total precipitation, slope, and grading all affect road sedimentproduction rates on St John. The use of total precipitation as a predictive variable is a simplification of the erosionprocesses described by Equations 1–4, as this implicitly indicates that all rainfall events have the same erosivepotential per unit depth of rainfall. In reality, Equations 1–4 suggest that sediment production should be controlledmore by the intensity of rainfall than storm magnitude, as rainfall intensity controls the depth of infiltration-excessoverland flow and thus the magnitude of the shear stress applied to the road surface. One reason for this apparentsimplification is that the sediment trap data aggregate sediment production from numerous rainfall events over timeperiods extending from several weeks to many months. The effects of varying rainfall intensities are largely lost, andtotal precipitation emerges as the best predictor of road segment sediment production because this is a reasonableindex of the total amount of overland flow. If sediment production were measured over shorter time periods, rainfallintensity and rainfall erosivity should emerge as better predictors of sediment production rates.
Road segment slope was an important control on road sediment production. Model comparisons indicated thatsediment production per unit rainfall is best predicted by slope raised to the power of 1·5. The presence of slope asa two- and three-way interaction term in the general linear regression model (Table V) indicates that the effect ofsegment slope on road erosion rates varies with grading category. Road segment slope has a greater effect on sedimentproduction rates for graded roads than ungraded roads, as graded roads will have a much greater supply of availablesediment and are more likely to be transport-limited. Theory, field observations, and the particle-size data all suggestthat the ungraded roads become armoured over time. As the road surface becomes armoured the supply of readilyerodible material becomes more limiting, and this reduces the relative importance of segment slope compared to themore recently graded road segments.

1298 C. E. Ramos-Scharrón and L. H. MacDonald
Copyright © 2005 John Wiley & Sons, Ltd. Earth Surf. Process. Landforms 30, 1283–1304 (2005)
Multivariate regression showed that road segment slope was a better predictor of sediment production rates thanroad surface area × slope. The three-way interaction term of precipitation, area × slope, and grading was only margin-ally significant (p = 0·06) and produced a model with an overall R2 of 0·68 as compared to 0·75 for the model in TableV. The lower R2 of the models using area times slope may be due in part to the difficulty in accurately measuring thecontributing area. Errors of up to ±30 per cent are possible when the contributing areas of road segments are measuredduring dry periods (Montgomery, 1994). Another complication is that the area × slope factor depends on the routefollowed by runoff over the road surface. Field observations showed that surface microtopography and runoff pathschanged over time due to rilling, traffic, grading, and clogging of ditches, and this would alter the area × slopeproduct. In this study area × slope was only measured once and the values were not adjusted for changes in thedrainage pattern over the different measurement periods.
Time since grading also had an important effect on sediment production. Roads that were graded at least onceevery two years had significantly higher sediment production rates than ungraded roads (Table IV). When normal-ized by rainfall and slope, sediment production rates exponentially declined with both time since grading (Figure 8)and cumulative precipitation after grading (Figure 11). The large variability in sediment production rates andthe limited temporal resolution of the sediment data preclude a calibration of the parameters in Equation 5 or thedevelopment of a new exponential decay model. The data in Figure 11 suggest that sediment production rates are lessthan 2 kg m−2 cm−1 m m−1 after about 80 cm of total rainfall, but the regression equation from Figure 11 indicates thatapproximately 230 cm of rainfall are required before a graded road erodes at nearly the same rate as an ungraded road.Hence the road erosion model was simplified to a step function, in that Equation 7a applies to the first 230 cm ofcumulative precipitation after regrading and Equation 7b to all subsequent rainfall.
The predicted declines in sediment production through time are similar to or slightly less than those in pre-vious studies. Using Equation 7a, the predicted annual sediment production rates for graded roads are 1·1 and52 kg m−2 a−1 assuming an annual rainfall rate of 115 cm and road slopes of 2 per cent and 21 per cent, respectively.Using Equation 7b, the corresponding values are 0·18 and 20 kg m−2 a−1. These values suggest that sediment produc-tion rates should decline by 61–84 per cent within two years after grading.
This rate of decline is comparable to, or slightly slower than, the rate of decline reported in other studies. In Idaho,sediment production rates declined by 40–80 per cent one year after road construction (Vincent, 1979). A field-basedcalibration of Equation 5 in Idaho indicated that sediment production rates should decline by 95 per cent within oneyear after road construction (Megahan, 1974). In the Oregon Coast range, sediment production rates decreased by 70per cent within one year after disturbing both the travelway and the inside ditch, and by 90 per cent after two years(Luce and Black, 2001b). The slower decline in sediment production rates on St John may be due to the exceptionallyhigh runoff and erosion rates resulting from large storm events. Sediment production from these more extreme eventsappeared to be less sensitive to factors such as the time since grading or the amount of traffic.
Abandoned roads, subsurface stormflow and undisturbed hillslopesThe mean rate of sediment production for abandoned roads with a mean slope of 15 per cent was 0·010 kg m−2 per cmof precipitation, or approximately an order of magnitude lower than comparable ungraded roads. This indicates thatsediment production rates after grading continue to decline for the ungraded road segments beyond the three-yearperiod documented in this study (Figure 8). The low erosion rates for the abandoned road segments may be attributedto a well-armoured road surface and lower runoff rates for all but the most extreme storm events. A storm in February2000, for example, produced 9·5 cm of rainfall in 2·5 hours following a 24-hour period with no precipitation. Fieldobservations indicated that infiltration-excess overland flow was generated on the road surface, but there was nointerception of subsurface storm flow and the sediment traps had no measurable sediment.
Efforts to model sediment production rates from abandoned roads are hindered by the more than 5000 per centincrease in sediment production per unit rainfall observed during Hurricane Lenny as compared to the rest of thestudy period. The pattern of rainfall generated by Hurricane Lenny was unusual, as the maximum 1-hour intensity of4·7 cm h−1 occurred after 4·9 cm of rain had fallen in the previous 24 hours. The amount and timing of this rainfallprobably generated surface runoff from both infiltration-excess overland flow and the interception of subsurfacestormflow. Although detailed hydrometric data are not available, the greater antecedent precipitation and subsurfaceflow interception are probably why sediment production rates from these two abandoned road segments were somuch higher during Hurricane Lenny than the more isolated storm in February 1999 that had a similar 1-hourpeak rainfall intensity.
A similar comparison shows that the mean sediment production rate from ungraded roads increased by nearly50 per cent for the period that includes Hurricane Lenny, while the mean sediment production rate for graded roads forthis same period was slightly less than for the other monitoring periods. These differences in sediment production per

Sediment production from unpaved roads 1299
Copyright © 2005 John Wiley & Sons, Ltd. Earth Surf. Process. Landforms 30, 1283–1304 (2005)
unit precipitation support the inference that an increase in subsurface stormflow interception is critical to increasingsediment production rates on well-armoured roads, but has little effect on recently graded roads.
The estimated annual sediment production rate for abandoned roads is derived from the total sediment generatedfrom the two abandoned road segments over the two-year study period. As noted earlier, rainfall over the study periodwas very similar to the long-term pattern of precipitation recorded at Caneel Bay (Figure 5). If the monitoring periodis representative of the more extreme events like Hurricane Lenny, the sediment production rates for abandoned roadscan be normalized in the same manner as graded and ungraded roads. On this basis the sediment production rate fromabandoned roads is 0·071 kg m−2 per unit precipitation per unit slope, or about 13 per cent of the value for ungradedroads and only 7 per cent of the value for graded roads. This converts to an annual sediment production rate of 0·16and 1·7 kg m−2 a−1 for abandoned roads with slopes of 2 per cent and 21 per cent, respectively.
Measured surface erosion rates from undisturbed zero-order basins are on the order of 0·001 kg m−2 a−1 (Ramos-Scharrón, 2004; Ramos-Scharrón and MacDonald, unpublished work). This indicates that actively used roads canincrease sediment production rates by more than four orders of magnitude relative to undisturbed conditions. Thesediment production rate from the two abandoned road segments monitored in this study were almost three ordersof magnitude higher than the rates measured from undisturbed hillslopes.
Comparisons with previous studiesA previous study developed an empirical road erosion model for St John (ROADMOD) (Anderson, 1994). This modelwas based on a linear relationship between annual sediment production rate and the product of road surface drainagearea (A) and road slope (S):
E = 0·00057AS + 0·034 (8)
where E is the average annual road surface cross-sectional erosion (m2 a−1; A is in m2, and S is in m m−1). Annualsediment production rates at the road segment scale are predicted using the road drainage area at the midpoint of thesegment, the average road segment slope, and an assumed bulk density of 1·5 Mg m−3 (Anderson and MacDonald,1998).
The application of ROADMOD to the 21 monitored road segments yields a mean annual sediment production rateof 20 kg m−2 a−1, or about twice the measured mean value of 9·4 kg m−2 a−1. The predicted erosion rates using ROADMODwere poorly correlated with the values measured in this study (R2 = 0·04; p > 0·25), and only segments FB-E and MB-A had measured values that were higher than the values predicted by ROADMOD. The sediment production ratesmeasured in this study are also poorly correlated with the segment-scale area × slope product as defined by Anderson(1994) (R2 = 0·006; p > 0·25).
The poor correlation between the values predicted with ROADMOD and the measured data may be due to a bias inthe selection of the road segments used to develop Equation 8 and the way in which area × slope was measured. Thecross-sections used to develop Equation 8 were usually on severely rilled road segments lacking any cross-slopedrainage (type 3 in Figure 3). There is a stronger correlation between the predicted sediment production rates usingROADMOD and the values measured in this study when the area × slope product is adjusted for the different roaddrainage patterns as measured in the current study (Figure 3). If the area × slope values from Table II are used inEquation 8 instead of the total segment area × slope, the mean sediment production rate predicted by ROADMODdrops to 15 kg m−2 a−1 (Figure 12). Although this mean value is still 1·7 times higher than the measured mean value,the correlation between predicted and measured values is significant (R2 = 0·19; p < 0·001). These comparisons indi-cate that road surface area must be adjusted for the different drainage patterns, and that Equations 7a and 7b providea more accurate prediction of road sediment production rates on St John than ROADMOD.
Figure 13 compares the estimated annual sediment production rates for graded, ungraded, and abandoned roads onSt John to other published values, including an earlier study of sediment production from three 40 m2 road surfaceplots on St John (MacDonald et al., 2001). The three plots included two plots on an actively used road and one plot ona newly constructed but unused road, and the estimated sediment production rates of 0·9 to 15 kg m−2 a−1 (MacDonaldet al., 2001) are similar to the values measured in the current study.
On the other hand, the sediment production rates for actively used and recently graded roads on St John are higherthan the values reported for New Zealand (Fahey and Coker, 1989), Australia (Grayson et al., 1993), and the SouthernAppalachian Mountains (Swift, 1984) and central Idaho (Vincent, 1979) in the USA (Figure 13). The higher erosionrates for unpaved roads on St John are consistent with their relatively steep slopes and the high rainfall erosivity.
The only published study with higher road erosion rates was for a high-rainfall area in the northwestern USA (Reidand Dunne, 1984). The maximum rate of 100 kg m−2 a−1 was calculated for a road with a 10 per cent slope and an

1300 C. E. Ramos-Scharrón and L. H. MacDonald
Copyright © 2005 John Wiley & Sons, Ltd. Earth Surf. Process. Landforms 30, 1283–1304 (2005)
Figure 12. Relationship between the annual sediment production rates (Er) measured in this study using sediment traps and thepredicted sediment production values using ROADMOD and one-half of the area × slope values from Table II. Regression line is forthe sediment trap data.
Figure 13. Range of annual sediment production rates for graded, ungraded, and abandoned roads in St John as compared tovalues reported from other studies.
assumed mean traffic load of at least four fully loaded logging trucks per day. The estimated sediment production ratefor a typical road with only occasional heavy truck traffic was 8·5 kg m−2 a−1 (Reid and Dunne, 1984). The latter valueis about half of the calculated sediment production rate for a similar road segment on St John with a daily traffic loadof four to six delivery trucks and 100–250 light vehicles. The mean sediment production rate for the abandoned roadsegments in St John was 1·2 kg m−2 a−1, or 12 times the rate estimated for comparable roads in the northwestern USA(Reid, 1981). These comparisons confirm the exceptionally high road erosion rates on St John relative to most otherareas.
Recommendations for reducing road surface erosionThe improved understanding of road surface erosion developed here can be translated into specific recommendationsfor reducing road surface sediment production. First, given the importance of slope and grading (Figure 9), steep,
Sediment production from unpaved roads 1301
Copyright © 2005 John Wiley & Sons, Ltd. Earth Surf. Process. Landforms 30, 1283–1304 (2005)
frequently graded road segments should be the first targets for implementing erosion control practices. If possible,roads and driveways with steep slopes should be paved immediately after construction as the highest sedimentproduction rates will occur immediately after construction and grading. Second, given that grading plays such animportant role in road erosion, the frequency and area of road grading should be kept to a minimum. Third, properroad drainage is essential for minimizing sediment production rates, as this reduces the area × slope factor and theamount of overland flow. Improved designs can be achieved through insloping, outsloping, constructing and maintain-ing well-protected ditches along roads, and increasing the density of road drains.
Conclusions
Sediment production rates from 21 road segments with varying slopes, contributing areas, and traffic loads weremonitored with sediment traps from July 1998 to November 2001 on the island of St John in the US Virgin Islands.Precipitation was measured by four recording rain gauges. Total precipitation over the study period was 206 cm. Totalrainfall and the frequency distribution of storm magnitudes were very similar to long-term averages.
Sediment production rates were linearly related to total precipitation for most of the 21 road segments monitored inthis study. The average road erosion rate for all segments was 0·064 kg m−2 per centimetre of precipitation. Steeperroads tended to have higher sediment production rates than more gently sloping roads. Regrading significantlyincreased sediment production rates. Roads graded at least once during the two-year study period had a mean sedimentproduction rate of 0·96 kg m−2 per centimetre of rainfall and unit slope, or approximately 11 kg m−2 a−1 for a typicalroad with a 10 per cent slope and an annual rainfall of 115 cm a−1. The mean annual erosion rate for ungraded roadswas 41 per cent lower, or 6·4 kg m−2 a−1 for a road segment with a 10 per cent slope. Roads with 15 per cent slopesthat had been abandoned for about 15 years had an average erosion rate of 1·2 kg m−2 a−1. Sediment production ratesdid not vary significantly with traffic loads.
Models using total precipitation and slope yielded higher R2 values than models using rainfall erosivity or area × slope.The best predictive model used total precipitation, slope raised to the 1·5 power, and a dummy variable for grading topredict road segment sediment production, and the model R2 was 0·75.
The measured erosion rates indicate that unpaved roads on St John can increase hillslope-scale sediment productionrates by more than four orders of magnitude relative to undisturbed conditions. The road erosion rates measured on StJohn are at the high end of reported road erosion rates, and this is consistent with the high rainfall erosivities, steepslopes, poor design, and inadequate maintenance of many of the unpaved roads on St John. The improved understand-ing of road surface erosion developed in this study leads to several specific recommendations for reducing roadsurface sediment production.
Acknowledgements
This study was supported by the Water Resources Division of the National Park Service (grant no. CA 2380-6-001), the VirginIslands Department of Planning and Natural Resources (grant no. NPS 01500), and the Water Resources Research Institute of theUniversity of the Virgin Islands and the US Geological Survey (grant no. 1434-HQ-96-02705), The authors gratefully acknowledgethe logistical support provided by the Island Resources Foundation and the Virgin Islands National Park. The authors would alsolike to thank Ellen Wohl, Denis Dean, Bill Jackson, and two anonymous reviewers for their comments on this manuscript.
References
Acevedo R, Morelock J, Olivieri RA. 1989. Modification of coral reef zonation by terrigenous sediment stress. Palaios 4: 92–100.Anderson DM. 1994. Analysis and modeling of erosion hazards and sediment delivery on St John, US Virgin Islands. Technical Report NPS/
NRWRD/NRTR-94-34. US National Park Service Water Resources Division: Fort Collins, Colorado.Anderson DM, MacDonald LH. 1998. Modelling road surface sediment production using a vector geographic information system. Earth
Surface Processes and Landforms 23: 95–107.Bilby RE, Sullivan K, Duncan SH. 1989. The generation and fate of road-surface sediment in forested watersheds in southwestern Washing-
ton. Forest Science 35(2): 453–468.Black TA, CH Luce. 1999. Changes in erosion from gravel surfaced forest roads through time. In Proceedings of the International Mountain
Logging and 10th Pacific Northwest Skyline Symposium: 204–218.Bowden MJ, Fischman N, Cook P, Wood J, Omasta E. 1970. Climate, water balance, and climatic change in the north-west Virgin Islands.
Caribbean Research Institute, College of the Virgin Islands.Bowles JE. 1992. Engineering Properties of Soils and their Measurement. McGraw-Hill: New York.

1302 C. E. Ramos-Scharrón and L. H. MacDonald
Copyright © 2005 John Wiley & Sons, Ltd. Earth Surf. Process. Landforms 30, 1283–1304 (2005)
Bren LJ, Leitch CJ. 1985. Hydrologic effects of a stretch of forest road. Australian Forest Research 15(2): 183–194.Burroughs ER, Foltz RB, Robichaud PR. 1991. United States Forest Service research on sediment production from forest roads and timber
harvest areas. In Proceedings of the 10th World Forestry Congress: 187–193.Calvesbert RJ. 1970. Climate of Puerto Rico and the US Virgin Islands. Climatography of the United States No. 60–52. US Department of
Commerce.Carter CE, Greer JD, Braud HJ, Floyd JM. 1974. Raindrop characteristics in southcentral United States. Transactions of the ASAE 17(6):
1033–1037.CH2M Hill. 1979. A sediment reduction program. Report to the Department of Conservation and Cultural Affairs, Government of the US
Virgin Islands: St Thomas, USVI.Donnelly TW. 1966. Geology of St Thomas and St John. Geological Society of America, Memoir 98: 85–176.Douglas I, Greer T, Bidin K, Sinun W. 1993. Impact of roads and compacted ground on post-logging sediment yield in a small drainage
basin, Sabah, Malaysia. In Hydrology of Warm Humid Regions, Gladwell JS (ed.). IAHS Publication 216: 213–218.Dunne T. 1979. Sediment yield and land use in tropical catchments. Journal of Hydrology 42: 281–300.EarthInfo, Inc. 1996. NCDC 15-minute precipitation values. CD-ROM disk. Earth Info, Inc.: Boulder, CO.Everest FH, Beschta RL, Scrivener JC, Koski KV, Sedell JR, Cederholm CJ. 1987. Fine sediment and salmonid production: a paradox. In
Streamside Management: Forestry and Fishery Interactions, Salo EO, Cundy TW (eds). College of Forest Resources, University ofWashington: Seattle, WA; 98–142.
Fahey BD, Coker RJ. 1989. Forest road erosion in the granite terrain of southwest Nelson, New Zealand. Journal of Hydrology (NZ) 28(2):123–141.
Foltz RB. 1996. Traffic and no-traffic on an aggregate surfaced road: Sediment production differences. Paper presented Environmentallysound forest road and wood transport Conference, June 1996, Rome, Italy. FAO.
Fransen PJB, Phillips CJ, Fahey BD. 2001. Forest road erosion in New Zealand: Overview. Earth Surface Processes and Landforms 26:165–174.
Froehlich W. 1991. Sediment production from unmetalled road surfaces. In Sediment and Stream Water Quality in a Changing Environment:Trends and Explanation. IAHS Publication 203: 21–29.
Froelich W, Walling DE. 1997. The role of unmetalled roads as a sediment source in the fluvial systems of the Polish Flysch Carpathians. InHuman Impact on Erosion and Sedimentation. IAHS Publication 245: 159–168.
Gardner WH. 1986. Water content. In Methods of Soil Analysis Part 1: Physical and Mineralogical Methods (2nd edition), Klute A (ed.).Agronomy Series, No. 9, pt. 1. American Society of Agronomy: Madison, WI; 493–544.
Gee GW, Bauder JW 1986. Particle-size analysis. In Methods of Soil Analysis Part 1: Physical and Mineralogical Methods. (2nd edition)Klute A (ed.). Agronomy Series, No. 9, pt. 1. American Society of Agronomy: Madison, WI; 383–411.
Grayson RB, Haydon SR, Jayasuriya MDA, Finlayson BL. 1993. Water quality in mountain ash forests-separating the impacts of roads fromthose of logging operations. Journal of Hydrology 150: 459–480.
Gresswell S, Heller D, Swanston DN. 1979. Mass movement response to forest management in the central Oregon Coast Ranges. ResourceBulletin PNW-84. USDA Forest Service: Portland, OR.
Gucinski H, Furniss MJ, Ziemer RR, Brookes MH. 2001. Forest roads: A synthesis of scientific information. General Technical ReportPNW-GTR-509. USDA Forest Service: Portland, OR.
Harden CP. 1992. Incorporating roads and footpaths in watershed-scale hydrologic and soil erosion models. Physical Geography 13(4):368–385.
Hernández-Delgado EA. 2001. Enfermedades, competencia por sobrecrecimiento y otras causas de mortalidad en el coral (Monastreaannularis). Paper presented at XXIV Symposium of Natural Resources, Univ. Politécnica, San Juan-Puerto Rico, 16 November 2001.
Hodgson G. 1989. The effects of sedimentation on Indo-Pacific Reef Corals. PhD dissertation, University of Hawaii, Honolulu.Hodgson G. 1997. Resource use: Conflicts and management solutions. In Life and Death of Coral Reefs, Birkeland C (ed.). Chapman and
Hill: New York; 386–411.Hubbard DK. 1986. Sedimentation as a control of reef development: St Croix, USVI. Coral Reefs 5: 117–125.Hubbard DK. 1987. A general review of sedimentation as it relates to environmental stress in the Virgin Islands Biosphere Reserve and the
eastern Caribbean in general. Biosphere Reserve Report no. 20. Virgin Islands Resource Management Cooperative: St Thomas, VI.Julien PY. 1995. Erosion and Sedimentation. Cambridge University Press: Cambridge.Kahklen KF. 1993. Surface erosion from a forest road, Polk Inlet, Prince of Wales Island, Alaska. MS thesis, Oregon State University,
Corvauis, OR.Kirkby MJ. 1980. Modelling water erosion processes. In Soil Erosion, Kirkby MJ, Morgan RPC (eds). John Wiley: New York; 425–442.Knighton D. 1998. Fluvial Forms and Processes. E Arnold: London.Kumapley NK. 1987. Erosion of unsurfaced earth and gravel roads. In Proceedings of 9th Regional Conference for Africa on Soil Mechanics
and Foundation Engineering. Lagos, Nigeria; 397–404.Larsen MC, Parks JE. 1997. How wide is a road? The association of roads and mass-wasting in a forested montane environment. Earth
Surface Processes and Landforms 22: 835–848.Luce CH, Black TA. 1999. Sediment production from forest roads in western Washington. Water Resources Research 35(8): 2561–2570.Luce CH, Black TA. 2001a. Effects of traffic and ditch maintenance on forest road sediment production. In Proceedings of the Seventh
Federal Interagency Sedimentation Conference, Reno, Nevada.Luce CH, Black TA. 2001b. Spatial and temporal patterns in erosion from forest roads. In Influence of Urban and Forest Land Uses on the
Hydrologic-Geomorphic Responses of Watersheds, Wigmosta MS, Burges SJ (eds). Water Resources Monographs. American GeophysicalUnion: Washington, DC; 165–178.

Sediment production from unpaved roads 1303
Copyright © 2005 John Wiley & Sons, Ltd. Earth Surf. Process. Landforms 30, 1283–1304 (2005)
Luce CH, Wemple BC. 2001. Introduction to special issue on hydrologic and geomorphic effects of forest roads. Earth Surface Processesand Landforms 26:111–113.
MacDonald LH, Anderson DM, Dietrich WE. 1997. Paradise threatened: Land use and erosion on St John, US Virgin Islands. EnvironmentalManagement 21(6): 851–863.
MacDonald LH, Sampson RW, Anderson DM. 2001. Runoff and road erosion at the plot and road segment scales, St John, US VirginIslands. Earth Surface Processes and Landforms 26: 251–272.
Megahan WF. 1974. Erosion over time on severely disturbed granitic soils: A model. Research Paper INT-156. USDA Forest Service:Ogden, UT.
Megahan WF. 1987. Effects of forest roads on watershed function in mountainous areas. In Environmental Geotechnics and ProblematicSoils and Rocks, Balasubramiam et al. (eds). A.A. Balkema Publishing: Rotterdam; 335–347.
Megahan WF, Kidd WJ. 1972. Effects of logging roads on sediment production rates in the Idaho batholith. Research Paper INT-123. USDAForest Service: Ogden, UT.
Megahan WF, Seyedbagheri KA, Mosko, TL. 1986. Construction phase sediment budget for forest roads in granitic slopes in Idaho. InDrainage Basin Sediment Delivery, Hadley RF (ed.). IAHS Publication 159: 31–39.
Montgomery DR. 1994. Road surface drainage, channel initiation, and slope instability. Water Resources Research 30(6): 1925–1932.Moss AJ, Green P. 1983. Movement of solids in air and water by raindrop impact, effects of drop-size and water-depth variations. Australian
Journal of Soil Research 21: 257–269.National Research Council. 1992. Restoration of Aquatic Ecosystems. National Academy Press: Washington, DC.Nemeth RS, Nowlis JS. 2001. Monitoring the effects of land development on the near-shore marine environment of St Thomas, USVI.
Bulletin of Marine Science 69(2):759–775.Nemeth RS, MacDonald LH, Ramos-Scharrón CE. 2001. Delivery, deposition, and effects of land-based sediments on corals in St John,
US Virgin Islands. Report on Project No. VI99-2. Water Resources Research Institute, University of the Virgin Islands: St Thomas,USVI.
Ramos CE. 1997. Surface erosion from roads: A literature review and general recommendations for the development of a sedimentmonitoring strategy. Northwest Indian Fisheries Commission: Olympia, Washington.
Ramos-Scharrón CE. 2004. Measuring and predicting erosion and sediment yields on St John, US Virgin Islands. PhD dissertation, Depart-ment of Geosciences, Colorado State University, Fort Collins, CO.
Ramos-Scharrón CE, MacDonald LH. In press. Runoff and sediment yields from an unpaved road segment, St John, US Virgin Islands.Hydrological Processes.
Rankin DW. 2002. Geology of St John, US Virgin Islands. US Geological Survey Professional Paper 1631.Reid LM. 1981. Sediment production from gravel-surfaced roads, Clearwater basin, Washington. Publication FRI-UW-8108. University of
Washington Fisheries Research Institute: Seattle, WA.Reid LM, Dunne T. 1984. Sediment production from forest road surfaces. Water Resources Research 10(11): 1753–1761.Renard KG, Foster GR, Weesies GA, McCool DK, Yoder DC. 1997. Predicting Soil Erosion by Water: A Guide to Conservation Planning
with the Revised Soil Loss Equation (RUSLE). Agricultural Handbook No. 703. US Department of Agriculture.Robichaud PR, Brown RE. 2002. Silt fences: an economical technique for measuring hillslope soil erosion. General Technical Report
RMRS-GTR-94, USDA Forest Service: Fort Collins, CO.Rogers CS 1990. Responses of coral reefs and reef organisms to sedimentation. Marine Ecology Progress Series 62: 185–202.Rogers CS. 1998. Coral reefs of the US Virgin Islands. In Status and Trends of the Nation’s Biological Resources, Vol. I, Haeker P, Doran PD
(eds). US Department of the Interior, US Geological Survey: Reston, VA 322–324.Sampson RW. 2000. Road runoff and erosion at the plot and road segment scales on St John, US Virgin Islands. MS thesis, Department of
Earth Resources, Colorado State University, Fort Collins, CO.Sidle RC, Pearce AJ, O’Loughlin CL. 1985. Hillslope stability and land use. Water Resources Monograph Series No. 11. American
Geophysical Union.Soil Conservation Service. 1970. Soil Survey, Virgin Islands of the United States.Swift LW. 1984. Soil losses from roadbeds and cut and fillslopes in the Southern Appalachian Mountains. Southern Journal of Applied
Forestry 8: 209–216.Torres J. 2001. Impacts of sedimentation on the growth rates of Montastraea annularis in Southwest Puerto Rico. Bulletin of Marine Science
69(2): 631–637.Torres R, Chiappone M, Geraldes F, Rodríguez Y, Vega M. 2001. Sedimentation as an important environmental influence on Dominican
Republic reefs. Bulletin of Marine Science 69(2): 805–818.USDA. 1995. Classification and Correlation of the Soils of the Virgin Islands of the United States. US Department of Agriculture: Hato Rey,
Puerto Rico.Vincent KR. 1979. Runoff and erosion from a logging road in response to snowmelt and rainfall. MS thesis, University of California,
Berkeley, CA.Wald AR. 1975. The impact of truck traffic and road maintenance on suspended-sediment yield from a 14’ standard forest road. MS thesis,
University of Washington, Seattle.Waters TF. 1995. Sediment in Streams: Sources, Biological Effects and Control. Monograph 7. American Fisheries Society.Wischmeier WH, Smith DD. 1958. Rainfall energy and its relationship to soil loss. Transactions of the American Geophysical Union 39(3):
285–291.Woodbury RO, Weaver PL. 1987. The vegetation of St John and Hassel Island, US Virgin Islands. Research/Resources Management Report
SER-83. National Park Service, Southeast Region: Atlanta, GA.

1304 C. E. Ramos-Scharrón and L. H. MacDonald
Copyright © 2005 John Wiley & Sons, Ltd. Earth Surf. Process. Landforms 30, 1283–1304 (2005)
Ziegler AD, Giambelluca TW. 1997. Importance of rural roads as source areas for runoff in mountainous areas of northern Thailand. Journalof Hydrology 196: 204–229.
Ziegler AD, Sutherland RA, Giambelluca TW. 2000. Partitioning total erosion on unpaved roads into splash and hydraulic components: Theroles of interstorm surface preparation and dynamic erodibility. Water Resources Research 36(9): 2787–2791.
Ziegler AD, Sutherland RA, Giambelluca TW. 2001a. Interstorm surface preparation and sediment detachment by vehicle traffic on unpavedmountain roads. Earth Surface Processes and Landforms 26: 235–250.
Ziegler AD, Giambelluca TW, Sutherland RA. 2001b. Erosion prediction on unpaved mountain roads in northern Thailand: validation ofdynamic erodibility modelling using KINEROS2. Hydrological Processes 15: 337–358.
Related Documents