Early Holocene and Late Pleistocene slip rates of the southern Dead Sea Fault determined from 10 Be cosmogenic dating of offset alluvial deposits Maryline Le Béon, 1,2 Yann Klinger, 1 Mahmoud Al‐Qaryouti, 3 Anne‐Sophie Mériaux, 4 Robert C. Finkel, 5,6 Ata Elias, 7 Omar Mayyas, 3 Frederick J. Ryerson, 8 and Paul Tapponnier 1,9 Received 9 December 2009; revised 27 May 2010; accepted 13 July 2010; published 25 November 2010. [1] Two sites located along the Wadi Araba Fault (WAF) segment of the Dead Sea Fault are targeted for tectonic‐morphological analysis. 10 Be cosmogenic radionuclide (CRN) dating of embedded cobbles is used to constrain the age of offset alluvial surfaces. At the first site a 48 ± 7 m offset alluvial fan, for which 10 Be CRN model ages average 11.1 ± 4.3 ka, yield a slip rate of 5.4 ± 2.7 mm/a, with conservative bounds of 1.3–16.4 mm/a. At the second site the scattered distributions of the 10 Be CRN ages from an offset bajada attest to the complex processes involved in sediment transport and emplacement. There, two offsets were identified. The 160 ± 8 m offset of an incised alluvial fan dated at 37 ± 5 ka shows a slip rate of 4.5 ± 0.9 mm/a, with a conservative minimum value of 3.2 mm/a. A larger offset, 626 ± 37 m, is derived from a prominent channel incised into the bajada. Cobbles from the bajada surface have ages from 33 to 141 ka, with a mean of 87 ± 26 ka. A slip rate of 8.1 ± 2.9 mm/a is derived from the mean age, with conservative bounds of 3.8–22.1 mm/a. These results and other published slip rates along the linear WAF segment, from GPS to geological time scales, lack the resolution to fully resolve the question of temporal variations versus consistency of the fault slip rate of the WAF. Yet, given the uncertainties, they are not inconsistent with each other. Citation: Le Béon, M., Y. Klinger, M. Al‐Qaryouti, A.‐S. Mériaux, R. C. Finkel, A. Elias, O. Mayyas, F. J. Ryerson, and P. Tapponnier (2010), Early Holocene and Late Pleistocene slip rates of the southern Dead Sea Fault determined from 10 Be cosmogenic dating of offset alluvial deposits, J. Geophys. Res., 115, B11414, doi:10.1029/2009JB007198. 1. Introduction [2] Branching off the northern tip of the Red Sea spreading center, the Dead Sea Fault (DSF) is a 1000 km long left‐ lateral strike‐slip fault, allowing northward motion of Arabia relative to Africa and Sinai (Figure 1a). To the north the DSF links up with the East Anatolian Fault system at the collision zone between Arabia and Eurasia. Present‐day and long‐term slip rates of the southern DSF, south of Lebanon, seem to be fairly well agreed on. Recent GPS profiles across the fault and regional GPS data both point to a slip rate of 4–6 mm/a for the last ∼10 years [e.g., Reilinger et al., 2006; Le Béon et al., 2008]. Geological Miocene formations are offset 40 to 45 km and yield a slip rate of 3.3–6.4 mm/a [Quennell, 1958, 1959; Freund et al., 1968, 1970]. Finally, closing the 30 km pull‐apart basins of the Dead Sea and the Gulf of Aqaba, which formed during the Early Pliocene, yields a slip rate of 6 mm/a [Garfunkel, 1981; Garfunkel and Ben‐Avraham, 2001]. By contrast, Holocene and Late Pleistocene slip rates are still subject to large uncertainties, with values ranging from 2 to 10 mm/a [ Galli , 1999; Klinger et al. , 2000a; Niemi et al. , 2001; Marco et al. , 2005; Ferry et al. , 2007]. [3] This study provides new constraints on the Early Holocene and Late Pleistocene slip rates on the DSF, focusing on the Wadi Araba Fault (WAF) segment (Figure 1b). The WAF strikes N12°E for about 160 km, from the cities of Aqaba and Elat to the Dead Sea. The trace of the active fault is well expressed in the Quaternary morphology, owing to arid climatic conditions. Hence, numerous offset geomor- phic features such as channels and alluvial surfaces can be observed, as well as small push‐up and pull‐apart structures. [4] In this study, we targeted two sites, about 100 km apart (Figure 1b), where the WAF displaced numerous 1 Equipe de Tectonique, Institut de Physique du Globe de Paris, Paris, France. 2 Now at Department of Geosciences, National Taiwan University, Taipei, Taiwan. 3 Seismology Division, Natural Resources Authority, Amman, Jordan. 4 School of Geography, Politics and Sociology, Newcastle University, Newcastle upon Tyne, UK. 5 EPS Department, University of California Berkeley, Berkeley, California, USA. 6 Now at Centre Europeen de Recherche et d’Enseignement des Geosciences de l’Environnement, Europole Mediterraneen de l’Arbois, Aix‐en‐Provence, France. 7 Geology Department, American University of Beirut, Beirut, Lebanon. 8 Institute of Geophysics and Planetary Physics, Lawrence Livermore National Laboratory, Livermore, California, USA. 9 Now at Earth Observatory of Singapore, Nanyang Technological University, Singapore. Copyright 2010 by the American Geophysical Union. 0148‐0227/10/2009JB007198 JOURNAL OF GEOPHYSICAL RESEARCH, VOL. 115, B11414, doi:10.1029/2009JB007198, 2010 B11414 1 of 24

Welcome message from author
This document is posted to help you gain knowledge. Please leave a comment to let me know what you think about it! Share it to your friends and learn new things together.
Transcript
Early Holocene and Late Pleistocene slip rates of the southernDead Sea Fault determined from 10Be cosmogenic dating of offsetalluvial deposits
Maryline Le Béon,1,2 Yann Klinger,1 Mahmoud Al‐Qaryouti,3 Anne‐Sophie Mériaux,4
Robert C. Finkel,5,6 Ata Elias,7 Omar Mayyas,3 Frederick J. Ryerson,8
and Paul Tapponnier1,9
Received 9 December 2009; revised 27 May 2010; accepted 13 July 2010; published 25 November 2010.
[1] Two sites located along the Wadi Araba Fault (WAF) segment of the Dead Sea Faultare targeted for tectonic‐morphological analysis. 10Be cosmogenic radionuclide (CRN)dating of embedded cobbles is used to constrain the age of offset alluvial surfaces. At thefirst site a 48 ± 7 m offset alluvial fan, for which 10Be CRN model ages average 11.1 ± 4.3ka, yield a slip rate of 5.4 ± 2.7 mm/a, with conservative bounds of 1.3–16.4 mm/a.At the second site the scattered distributions of the 10Be CRN ages from an offset bajadaattest to the complex processes involved in sediment transport and emplacement. There,two offsets were identified. The 160 ± 8 m offset of an incised alluvial fan dated at37 ± 5 ka shows a slip rate of 4.5 ± 0.9 mm/a, with a conservative minimum value of3.2 mm/a. A larger offset, 626 ± 37 m, is derived from a prominent channel incised into thebajada. Cobbles from the bajada surface have ages from 33 to 141 ka, with a meanof 87 ± 26 ka. A slip rate of 8.1 ± 2.9 mm/a is derived from the mean age, withconservative bounds of 3.8–22.1 mm/a. These results and other published slip ratesalong the linear WAF segment, from GPS to geological time scales, lack the resolutionto fully resolve the question of temporal variations versus consistency of the fault slip rateof the WAF. Yet, given the uncertainties, they are not inconsistent with each other.
Citation: Le Béon, M., Y. Klinger, M. Al‐Qaryouti, A.‐S. Mériaux, R. C. Finkel, A. Elias, O. Mayyas, F. J. Ryerson, andP. Tapponnier (2010), Early Holocene and Late Pleistocene slip rates of the southern Dead Sea Fault determined from 10Becosmogenic dating of offset alluvial deposits, J. Geophys. Res., 115, B11414, doi:10.1029/2009JB007198.
1. Introduction
[2] Branching off the northern tip of the Red Sea spreadingcenter, the Dead Sea Fault (DSF) is a 1000 km long left‐lateral strike‐slip fault, allowing northward motion of Arabiarelative to Africa and Sinai (Figure 1a). To the north the DSFlinks up with the East Anatolian Fault system at the collisionzone between Arabia and Eurasia. Present‐day and long‐term
slip rates of the southern DSF, south of Lebanon, seem to befairly well agreed on. Recent GPS profiles across the fault andregional GPS data both point to a slip rate of 4–6 mm/a for thelast ∼10 years [e.g., Reilinger et al., 2006; Le Béon et al., 2008].Geological Miocene formations are offset 40 to 45 km and yielda slip rate of 3.3–6.4mm/a [Quennell, 1958, 1959;Freund et al.,1968, 1970]. Finally, closing the 30 km pull‐apart basins ofthe Dead Sea and the Gulf of Aqaba, which formed during theEarly Pliocene, yields a slip rate of 6 mm/a [Garfunkel, 1981;Garfunkel and Ben‐Avraham, 2001]. By contrast, Holocene andLate Pleistocene slip rates are still subject to large uncertainties,with values ranging from2 to 10mm/a [Galli, 1999;Klinger et al.,2000a; Niemi et al., 2001;Marco et al., 2005; Ferry et al., 2007].[3] This study provides new constraints on the Early
Holocene and Late Pleistocene slip rates on theDSF, focusingon the Wadi Araba Fault (WAF) segment (Figure 1b). TheWAF strikes N12°E for about 160 km, from the cities ofAqaba and Elat to the Dead Sea. The trace of the active faultis well expressed in the Quaternary morphology, owing toarid climatic conditions. Hence, numerous offset geomor-phic features such as channels and alluvial surfaces can beobserved, as well as small push‐up and pull‐apart structures.[4] In this study, we targeted two sites, about 100 km
apart (Figure 1b), where the WAF displaced numerous
1Equipe de Tectonique, Institut de Physique duGlobe de Paris, Paris, France.2Now at Department of Geosciences, National Taiwan University,
Taipei, Taiwan.3Seismology Division, Natural Resources Authority, Amman, Jordan.4School of Geography, Politics and Sociology, Newcastle University,
Newcastle upon Tyne, UK.5EPS Department, University of California Berkeley, Berkeley,
California, USA.6Now at Centre Europeen de Recherche et d’Enseignement des
Geosciences de l’Environnement, Europole Mediterraneen de l’Arbois,Aix‐en‐Provence, France.
7Geology Department, American University of Beirut, Beirut, Lebanon.8Institute of Geophysics and Planetary Physics, Lawrence Livermore
National Laboratory, Livermore, California, USA.9Now at Earth Observatory of Singapore, Nanyang Technological
University, Singapore.
Copyright 2010 by the American Geophysical Union.0148‐0227/10/2009JB007198
JOURNAL OF GEOPHYSICAL RESEARCH, VOL. 115, B11414, doi:10.1029/2009JB007198, 2010
B11414 1 of 24
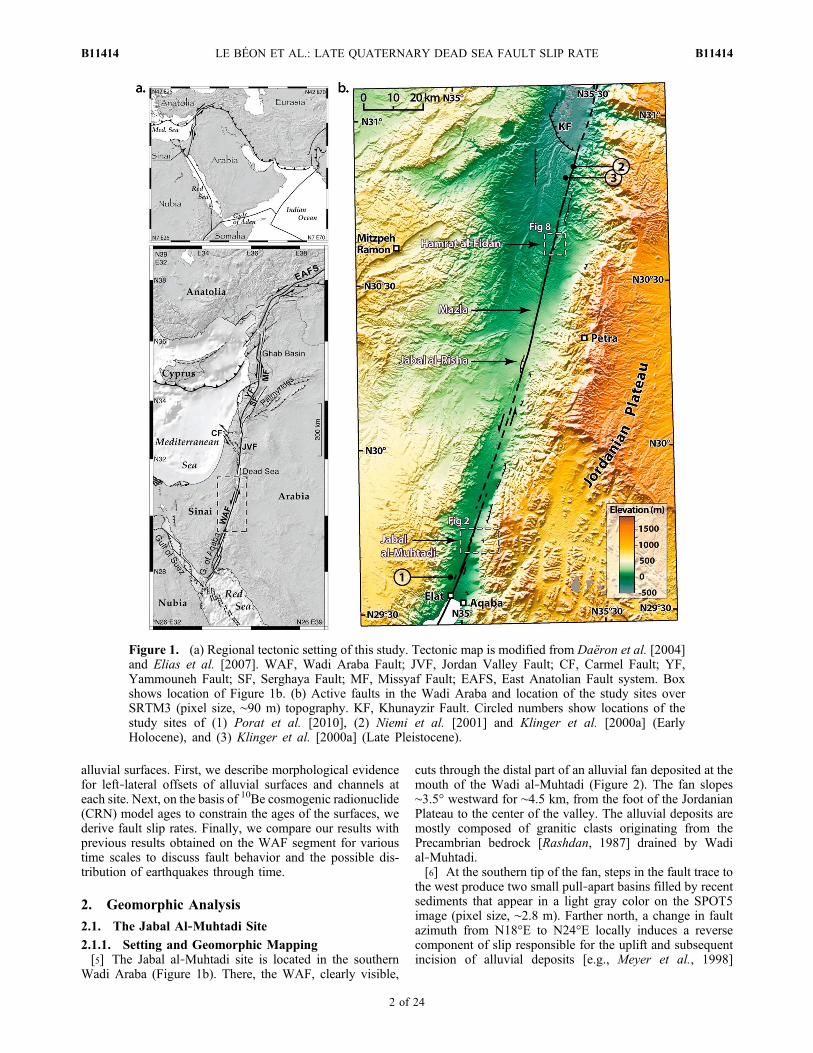
alluvial surfaces. First, we describe morphological evidencefor left‐lateral offsets of alluvial surfaces and channels ateach site. Next, on the basis of 10Be cosmogenic radionuclide(CRN) model ages to constrain the ages of the surfaces, wederive fault slip rates. Finally, we compare our results withprevious results obtained on the WAF segment for varioustime scales to discuss fault behavior and the possible dis-tribution of earthquakes through time.
2. Geomorphic Analysis
2.1. The Jabal Al‐Muhtadi Site
2.1.1. Setting and Geomorphic Mapping[5] The Jabal al‐Muhtadi site is located in the southern
Wadi Araba (Figure 1b). There, the WAF, clearly visible,
cuts through the distal part of an alluvial fan deposited at themouth of the Wadi al‐Muhtadi (Figure 2). The fan slopes∼3.5° westward for ∼4.5 km, from the foot of the JordanianPlateau to the center of the valley. The alluvial deposits aremostly composed of granitic clasts originating from thePrecambrian bedrock [Rashdan, 1987] drained by Wadial‐Muhtadi.[6] At the southern tip of the fan, steps in the fault trace to
the west produce two small pull‐apart basins filled by recentsediments that appear in a light gray color on the SPOT5image (pixel size, ∼2.8 m). Farther north, a change in faultazimuth from N18°E to N24°E locally induces a reversecomponent of slip responsible for the uplift and subsequentincision of alluvial deposits [e.g., Meyer et al., 1998]
Figure 1. (a) Regional tectonic setting of this study. Tectonic map is modified from Daëron et al. [2004]and Elias et al. [2007]. WAF, Wadi Araba Fault; JVF, Jordan Valley Fault; CF, Carmel Fault; YF,Yammouneh Fault; SF, Serghaya Fault; MF, Missyaf Fault; EAFS, East Anatolian Fault system. Boxshows location of Figure 1b. (b) Active faults in the Wadi Araba and location of the study sites overSRTM3 (pixel size, ∼90 m) topography. KF, Khunayzir Fault. Circled numbers show locations of thestudy sites of (1) Porat et al. [2010], (2) Niemi et al. [2001] and Klinger et al. [2000a] (EarlyHolocene), and (3) Klinger et al. [2000a] (Late Pleistocene).
LE BÉON ET AL.: LATE QUATERNARY DEAD SEA FAULT SLIP RATE B11414B11414
2 of 24
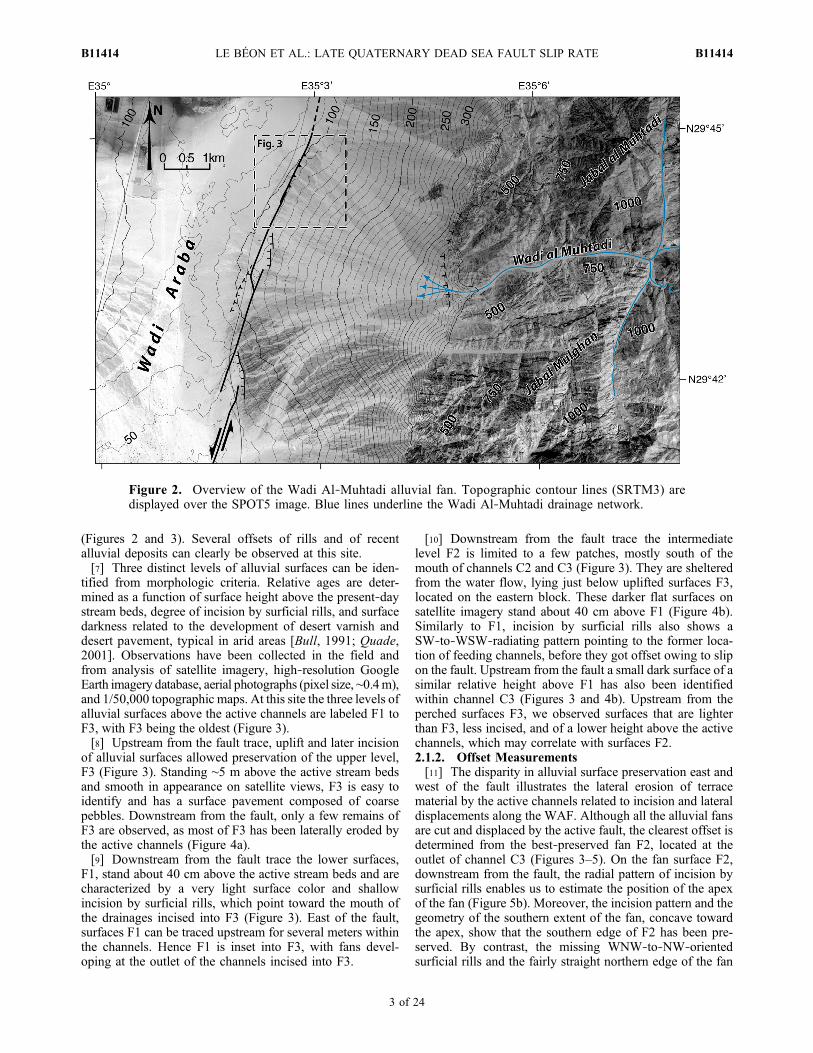
(Figures 2 and 3). Several offsets of rills and of recentalluvial deposits can clearly be observed at this site.[7] Three distinct levels of alluvial surfaces can be iden-
tified from morphologic criteria. Relative ages are deter-mined as a function of surface height above the present‐daystream beds, degree of incision by surficial rills, and surfacedarkness related to the development of desert varnish anddesert pavement, typical in arid areas [Bull, 1991; Quade,2001]. Observations have been collected in the field andfrom analysis of satellite imagery, high‐resolution GoogleEarth imagery database, aerial photographs (pixel size, ∼0.4m),and 1/50,000 topographic maps. At this site the three levels ofalluvial surfaces above the active channels are labeled F1 toF3, with F3 being the oldest (Figure 3).[8] Upstream from the fault trace, uplift and later incision
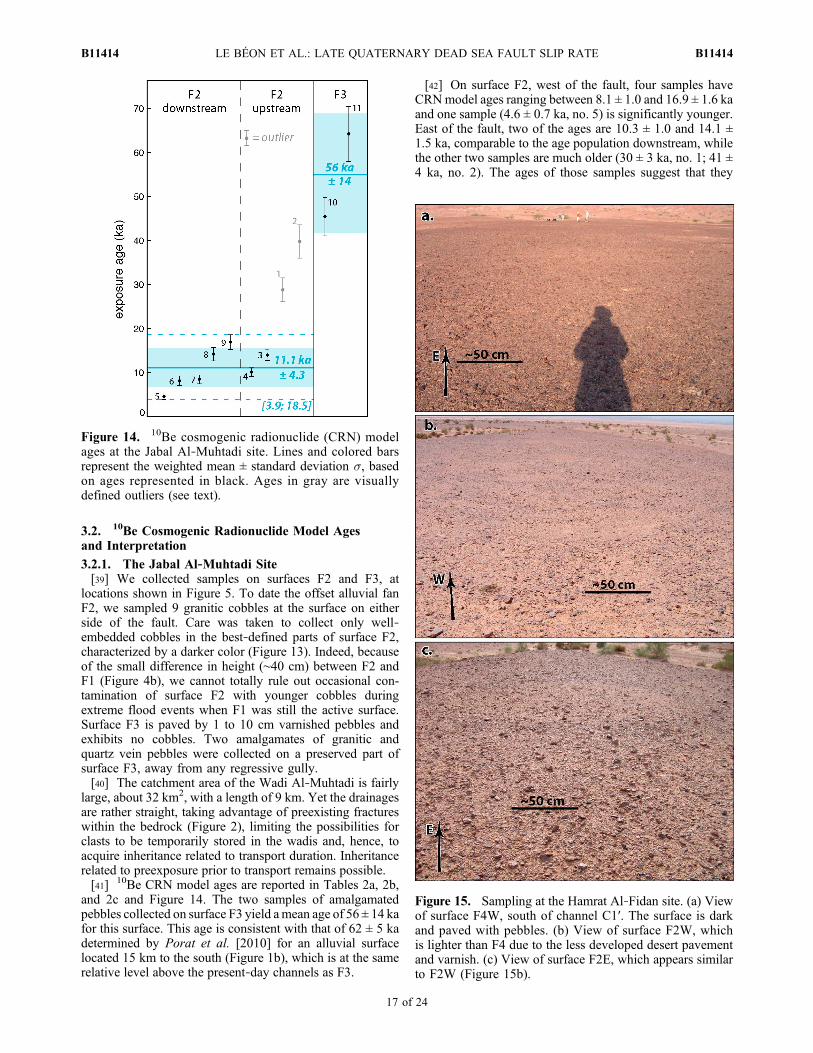
of alluvial surfaces allowed preservation of the upper level,F3 (Figure 3). Standing ∼5 m above the active stream bedsand smooth in appearance on satellite views, F3 is easy toidentify and has a surface pavement composed of coarsepebbles. Downstream from the fault, only a few remains ofF3 are observed, as most of F3 has been laterally eroded bythe active channels (Figure 4a).[9] Downstream from the fault trace the lower surfaces,
F1, stand about 40 cm above the active stream beds and arecharacterized by a very light surface color and shallowincision by surficial rills, which point toward the mouth ofthe drainages incised into F3 (Figure 3). East of the fault,surfaces F1 can be traced upstream for several meters withinthe channels. Hence F1 is inset into F3, with fans devel-oping at the outlet of the channels incised into F3.
[10] Downstream from the fault trace the intermediatelevel F2 is limited to a few patches, mostly south of themouth of channels C2 and C3 (Figure 3). They are shelteredfrom the water flow, lying just below uplifted surfaces F3,located on the eastern block. These darker flat surfaces onsatellite imagery stand about 40 cm above F1 (Figure 4b).Similarly to F1, incision by surficial rills also shows aSW‐to‐WSW‐radiating pattern pointing to the former loca-tion of feeding channels, before they got offset owing to slipon the fault. Upstream from the fault a small dark surface of asimilar relative height above F1 has also been identifiedwithin channel C3 (Figures 3 and 4b). Upstream from theperched surfaces F3, we observed surfaces that are lighterthan F3, less incised, and of a lower height above the activechannels, which may correlate with surfaces F2.2.1.2. Offset Measurements[11] The disparity in alluvial surface preservation east and
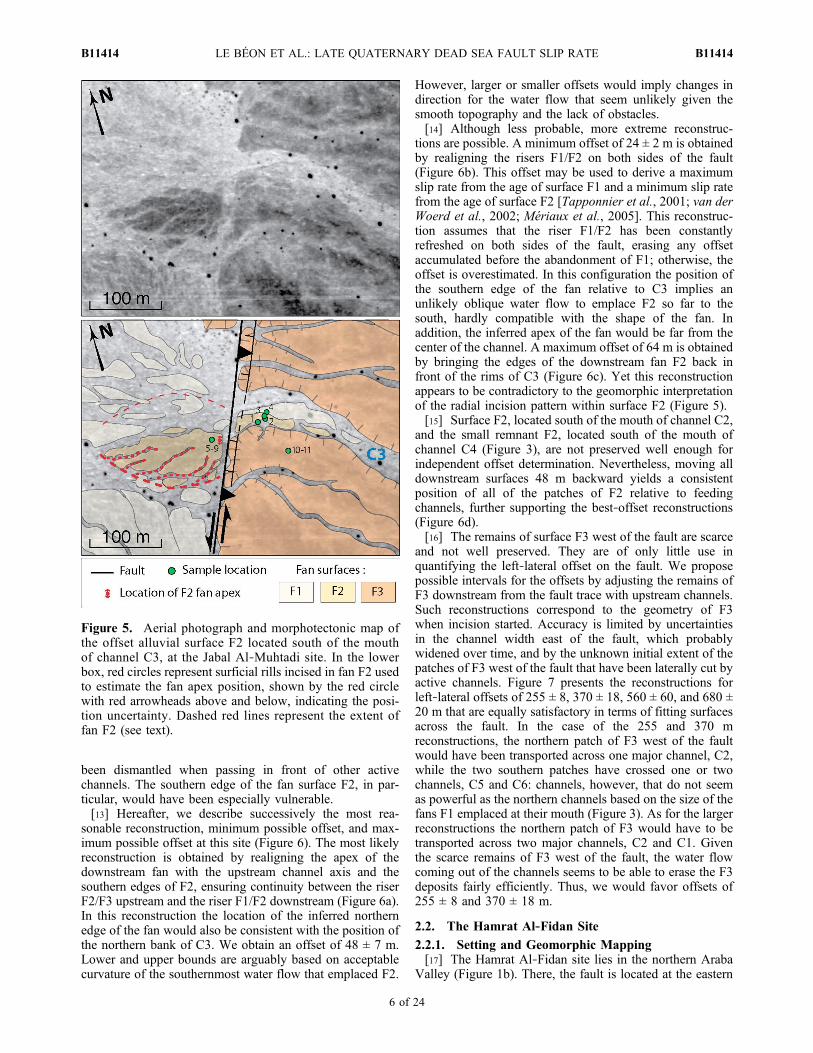
west of the fault illustrates the lateral erosion of terracematerial by the active channels related to incision and lateraldisplacements along the WAF. Although all the alluvial fansare cut and displaced by the active fault, the clearest offset isdetermined from the best‐preserved fan F2, located at theoutlet of channel C3 (Figures 3–5). On the fan surface F2,downstream from the fault, the radial pattern of incision bysurficial rills enables us to estimate the position of the apexof the fan (Figure 5b). Moreover, the incision pattern and thegeometry of the southern extent of the fan, concave towardthe apex, show that the southern edge of F2 has been pre-served. By contrast, the missing WNW‐to‐NW‐orientedsurficial rills and the fairly straight northern edge of the fan
Figure 2. Overview of the Wadi Al‐Muhtadi alluvial fan. Topographic contour lines (SRTM3) aredisplayed over the SPOT5 image. Blue lines underline the Wadi Al‐Muhtadi drainage network.
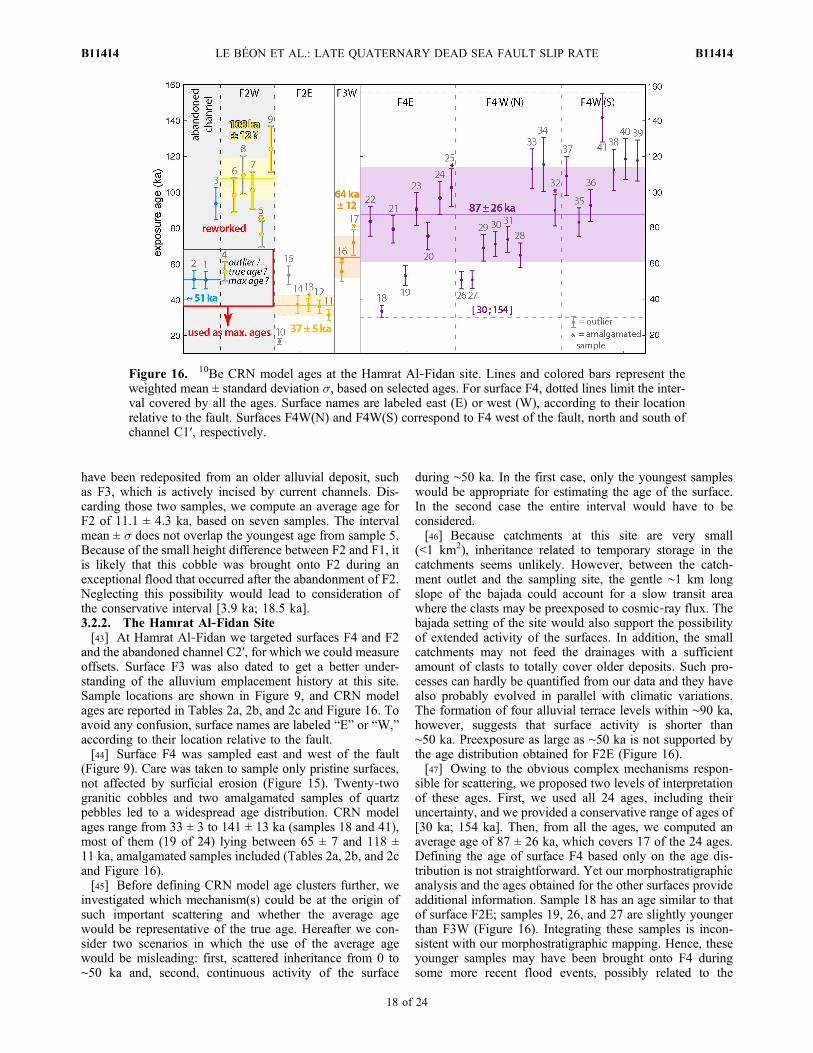
LE BÉON ET AL.: LATE QUATERNARY DEAD SEA FAULT SLIP RATE B11414B11414
3 of 24
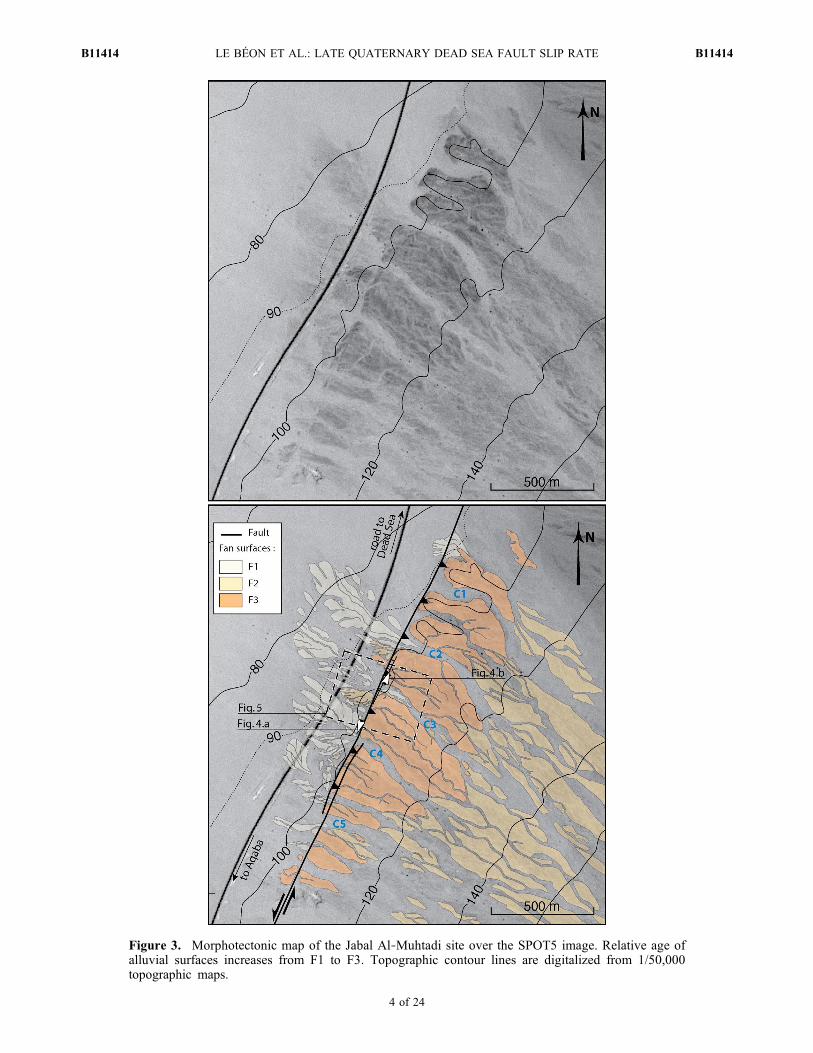
Figure 3. Morphotectonic map of the Jabal Al‐Muhtadi site over the SPOT5 image. Relative age ofalluvial surfaces increases from F1 to F3. Topographic contour lines are digitalized from 1/50,000topographic maps.
LE BÉON ET AL.: LATE QUATERNARY DEAD SEA FAULT SLIP RATE B11414B11414
4 of 24
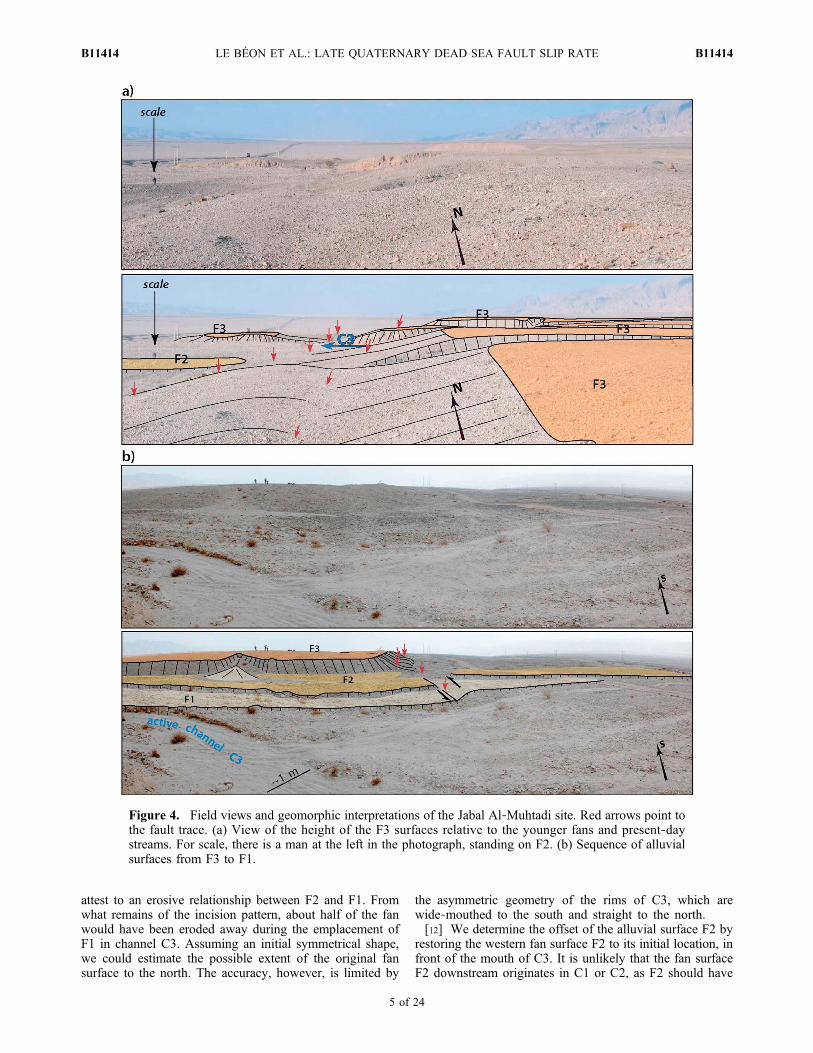
attest to an erosive relationship between F2 and F1. Fromwhat remains of the incision pattern, about half of the fanwould have been eroded away during the emplacement ofF1 in channel C3. Assuming an initial symmetrical shape,we could estimate the possible extent of the original fansurface to the north. The accuracy, however, is limited by
the asymmetric geometry of the rims of C3, which arewide‐mouthed to the south and straight to the north.[12] We determine the offset of the alluvial surface F2 by
restoring the western fan surface F2 to its initial location, infront of the mouth of C3. It is unlikely that the fan surfaceF2 downstream originates in C1 or C2, as F2 should have
Figure 4. Field views and geomorphic interpretations of the Jabal Al‐Muhtadi site. Red arrows point tothe fault trace. (a) View of the height of the F3 surfaces relative to the younger fans and present‐daystreams. For scale, there is a man at the left in the photograph, standing on F2. (b) Sequence of alluvialsurfaces from F3 to F1.
LE BÉON ET AL.: LATE QUATERNARY DEAD SEA FAULT SLIP RATE B11414B11414
5 of 24
been dismantled when passing in front of other activechannels. The southern edge of the fan surface F2, in par-ticular, would have been especially vulnerable.[13] Hereafter, we describe successively the most rea-
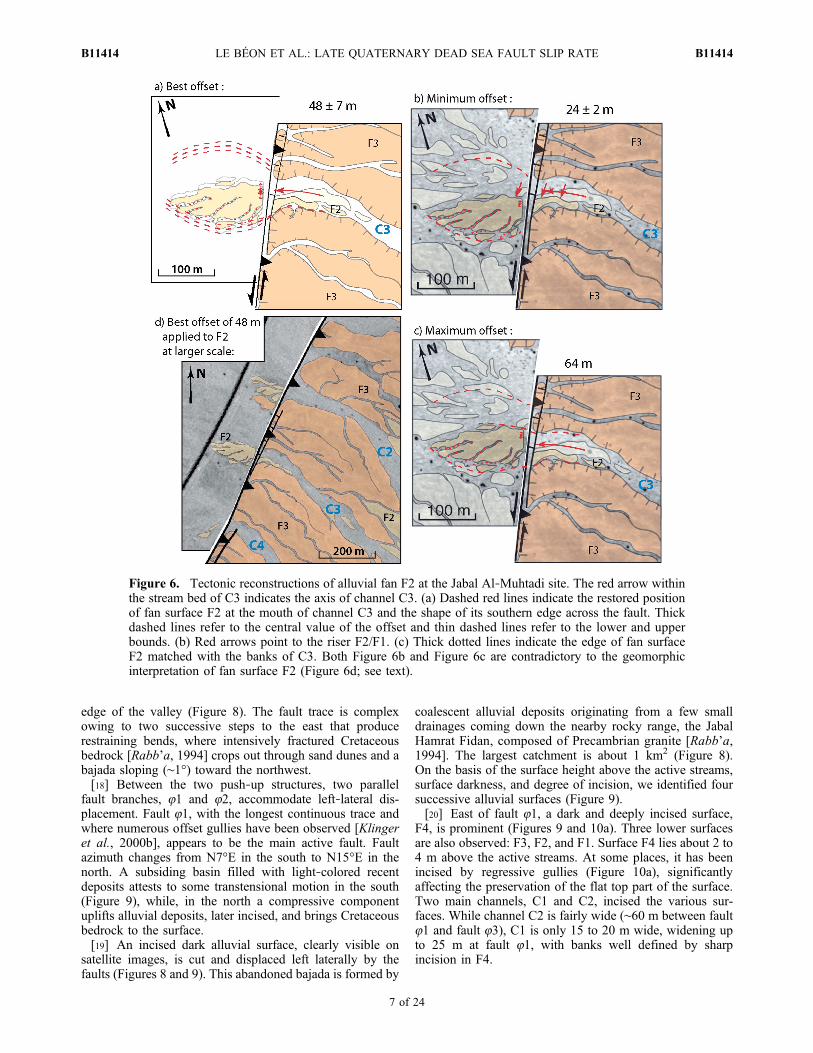
sonable reconstruction, minimum possible offset, and max-imum possible offset at this site (Figure 6). The most likelyreconstruction is obtained by realigning the apex of thedownstream fan with the upstream channel axis and thesouthern edges of F2, ensuring continuity between the riserF2/F3 upstream and the riser F1/F2 downstream (Figure 6a).In this reconstruction the location of the inferred northernedge of the fan would also be consistent with the position ofthe northern bank of C3. We obtain an offset of 48 ± 7 m.Lower and upper bounds are arguably based on acceptablecurvature of the southernmost water flow that emplaced F2.
However, larger or smaller offsets would imply changes indirection for the water flow that seem unlikely given thesmooth topography and the lack of obstacles.[14] Although less probable, more extreme reconstruc-
tions are possible. A minimum offset of 24 ± 2 m is obtainedby realigning the risers F1/F2 on both sides of the fault(Figure 6b). This offset may be used to derive a maximumslip rate from the age of surface F1 and a minimum slip ratefrom the age of surface F2 [Tapponnier et al., 2001; van derWoerd et al., 2002; Mériaux et al., 2005]. This reconstruc-tion assumes that the riser F1/F2 has been constantlyrefreshed on both sides of the fault, erasing any offsetaccumulated before the abandonment of F1; otherwise, theoffset is overestimated. In this configuration the position ofthe southern edge of the fan relative to C3 implies anunlikely oblique water flow to emplace F2 so far to thesouth, hardly compatible with the shape of the fan. Inaddition, the inferred apex of the fan would be far from thecenter of the channel. A maximum offset of 64 m is obtainedby bringing the edges of the downstream fan F2 back infront of the rims of C3 (Figure 6c). Yet this reconstructionappears to be contradictory to the geomorphic interpretationof the radial incision pattern within surface F2 (Figure 5).[15] Surface F2, located south of the mouth of channel C2,
and the small remnant F2, located south of the mouth ofchannel C4 (Figure 3), are not preserved well enough forindependent offset determination. Nevertheless, moving alldownstream surfaces 48 m backward yields a consistentposition of all of the patches of F2 relative to feedingchannels, further supporting the best‐offset reconstructions(Figure 6d).[16] The remains of surface F3 west of the fault are scarce
and not well preserved. They are of only little use inquantifying the left‐lateral offset on the fault. We proposepossible intervals for the offsets by adjusting the remains ofF3 downstream from the fault trace with upstream channels.Such reconstructions correspond to the geometry of F3when incision started. Accuracy is limited by uncertaintiesin the channel width east of the fault, which probablywidened over time, and by the unknown initial extent of thepatches of F3 west of the fault that have been laterally cut byactive channels. Figure 7 presents the reconstructions forleft‐lateral offsets of 255 ± 8, 370 ± 18, 560 ± 60, and 680 ±20 m that are equally satisfactory in terms of fitting surfacesacross the fault. In the case of the 255 and 370 mreconstructions, the northern patch of F3 west of the faultwould have been transported across one major channel, C2,while the two southern patches have crossed one or twochannels, C5 and C6: channels, however, that do not seemas powerful as the northern channels based on the size of thefans F1 emplaced at their mouth (Figure 3). As for the largerreconstructions the northern patch of F3 would have to betransported across two major channels, C2 and C1. Giventhe scarce remains of F3 west of the fault, the water flowcoming out of the channels seems to be able to erase the F3deposits fairly efficiently. Thus, we would favor offsets of255 ± 8 and 370 ± 18 m.
2.2. The Hamrat Al‐Fidan Site
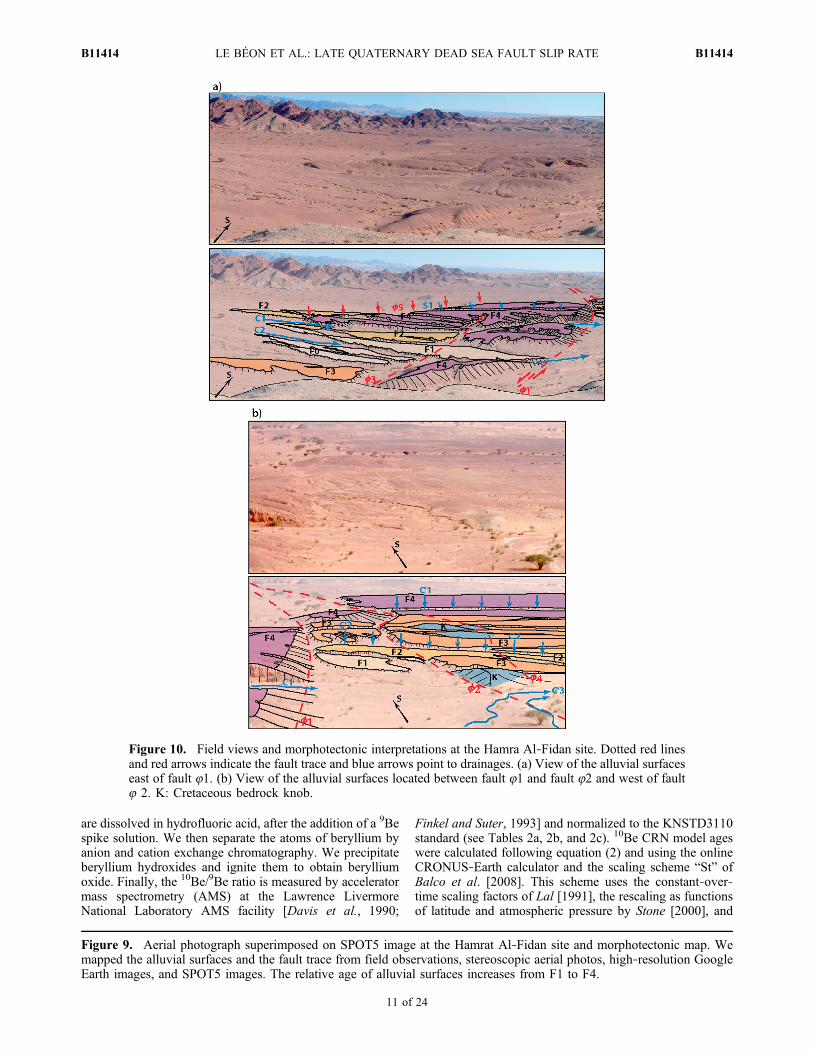
2.2.1. Setting and Geomorphic Mapping[17] The Hamrat Al‐Fidan site lies in the northern Araba
Valley (Figure 1b). There, the fault is located at the eastern
Figure 5. Aerial photograph and morphotectonic map ofthe offset alluvial surface F2 located south of the mouthof channel C3, at the Jabal Al‐Muhtadi site. In the lowerbox, red circles represent surficial rills incised in fan F2 usedto estimate the fan apex position, shown by the red circlewith red arrowheads above and below, indicating the posi-tion uncertainty. Dashed red lines represent the extent offan F2 (see text).
LE BÉON ET AL.: LATE QUATERNARY DEAD SEA FAULT SLIP RATE B11414B11414
6 of 24
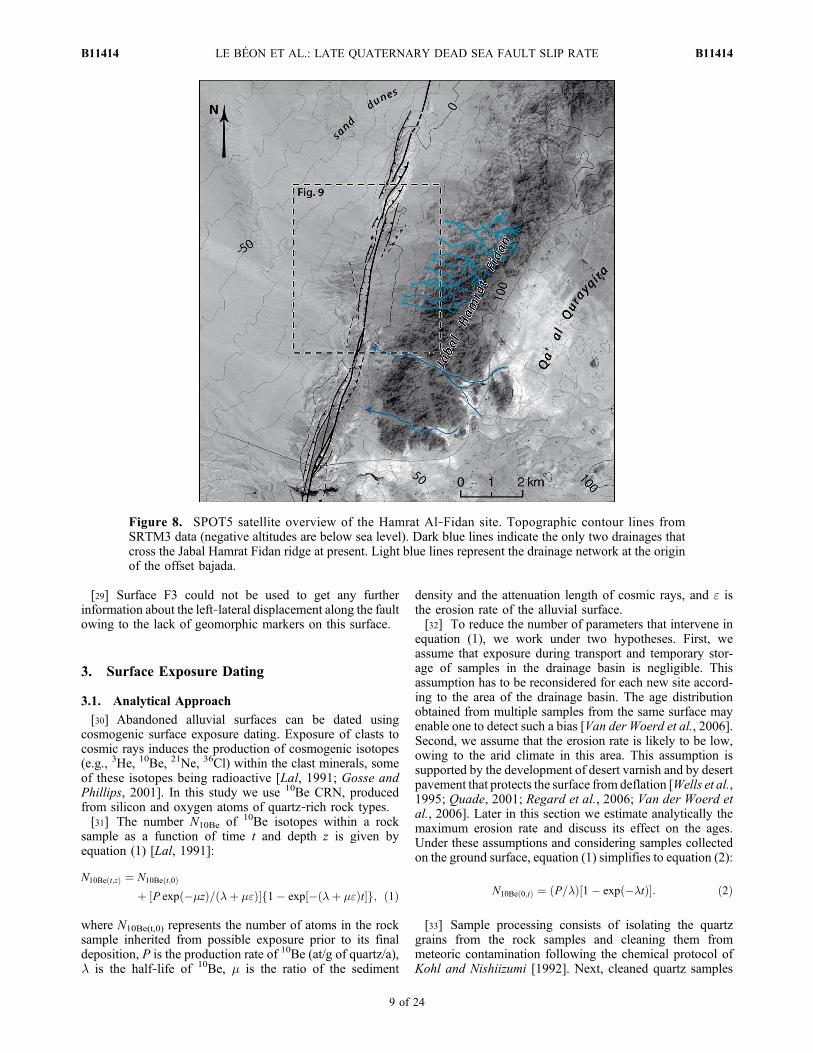
edge of the valley (Figure 8). The fault trace is complexowing to two successive steps to the east that producerestraining bends, where intensively fractured Cretaceousbedrock [Rabb’a, 1994] crops out through sand dunes and abajada sloping (∼1°) toward the northwest.[18] Between the two push‐up structures, two parallel
fault branches, 81 and 82, accommodate left‐lateral dis-placement. Fault 81, with the longest continuous trace andwhere numerous offset gullies have been observed [Klingeret al., 2000b], appears to be the main active fault. Faultazimuth changes from N7°E in the south to N15°E in thenorth. A subsiding basin filled with light‐colored recentdeposits attests to some transtensional motion in the south(Figure 9), while, in the north a compressive componentuplifts alluvial deposits, later incised, and brings Cretaceousbedrock to the surface.[19] An incised dark alluvial surface, clearly visible on
satellite images, is cut and displaced left laterally by thefaults (Figures 8 and 9). This abandoned bajada is formed by
coalescent alluvial deposits originating from a few smalldrainages coming down the nearby rocky range, the JabalHamrat Fidan, composed of Precambrian granite [Rabb’a,1994]. The largest catchment is about 1 km2 (Figure 8).On the basis of the surface height above the active streams,surface darkness, and degree of incision, we identified foursuccessive alluvial surfaces (Figure 9).[20] East of fault 81, a dark and deeply incised surface,
F4, is prominent (Figures 9 and 10a). Three lower surfacesare also observed: F3, F2, and F1. Surface F4 lies about 2 to4 m above the active streams. At some places, it has beenincised by regressive gullies (Figure 10a), significantlyaffecting the preservation of the flat top part of the surface.Two main channels, C1 and C2, incised the various sur-faces. While channel C2 is fairly wide (∼60 m between fault81 and fault 83), C1 is only 15 to 20 m wide, widening upto 25 m at fault 81, with banks well defined by sharpincision in F4.
Figure 6. Tectonic reconstructions of alluvial fan F2 at the Jabal Al‐Muhtadi site. The red arrow withinthe stream bed of C3 indicates the axis of channel C3. (a) Dashed red lines indicate the restored positionof fan surface F2 at the mouth of channel C3 and the shape of its southern edge across the fault. Thickdashed lines refer to the central value of the offset and thin dashed lines refer to the lower and upperbounds. (b) Red arrows point to the riser F2/F1. (c) Thick dotted lines indicate the edge of fan surfaceF2 matched with the banks of C3. Both Figure 6b and Figure 6c are contradictory to the geomorphicinterpretation of fan surface F2 (Figure 6d; see text).
LE BÉON ET AL.: LATE QUATERNARY DEAD SEA FAULT SLIP RATE B11414B11414
7 of 24
[21] West of fault 82, from north to south, the surfacesbecome darker and, thus, may be older (Figures 9 and 10b).The darkest surfaces have been mapped as F4, based ontheir similar color and relative level above the active chan-nels to surface F4 east of the fault. Surface F4 is incised by amain channel, C1′, similar in width (25 to 30m) to channel C1east of the fault. The surface located north of channel C1′looks smoother and lighter in the satellite views compared tothe southern one. In the field, however, we could not find anysignificant difference in surface appearance or in the height ofthe two surfaces across the channel. Hence, both surfaces areconsidered to be part of the same unit.[22] North of F4, west of the fault, a surface that is lighter
in color, mapped as F3, does not extend as far to the west asF4 and is separated from F4 by a straight channel, sug-gesting incision and lateral cutting of F4 prior to the depo-sition of F3. Contrary to F4, cobbles are sparse on surfaceF3, which is mostly composed of pebbles. F3‐like surfacesare observed continuously farther to the north, crossed onlyby a few minor channels. Fractured Cretaceous limestonelocally crops out along the secondary fault 84 (Figure 10b).[23] In the northern part of the site, west of the fault, an
alluvial surface, mapped F2, is inset in F3 (Figure 10b);surface F3 had been incised by a major channel later infilledby unit F2. The width of surface F2, ∼48 m at fault 82 and∼38 m at fault 84, provides constraints on the width of thefeeding channel. The inset surface F2 could be mappedcontinuously across fault 82 and up to the main left‐lateralfault 81. At present, F2 abuts onto surface F4 across thefault 81, showing that it has been disconnected from itssource owing to the fault activity. Similarly, the narrow
channel C2′, incised in F2, could be followed continuouslyacross 82 and up to 81, but it is beheaded east of 81 and it isnow abandoned. F2 and channel C2′ are not, or are barely,affected by fault motion along 82, or 84, confirming that 81is the main strike‐slip branch.[24] Lower and lighter surfaces, mapped as F1, could be
observed only at the mouth of channel C3′. Other F2 and F1types of surfaces can be identified in the distal part of thebajada.[25] Between the two sub‐parallel faults 81 and 82, we
observed four levels of alluvial deposits. Their height abovethe present‐day streams increases from north to south, aswell as their darkness (Figures 9 and 10b). The continuity ofF2 across fault 82 ensures surface correlation.2.2.2. Offset Measurements[26] As already described, the abrupt ending of surface F2
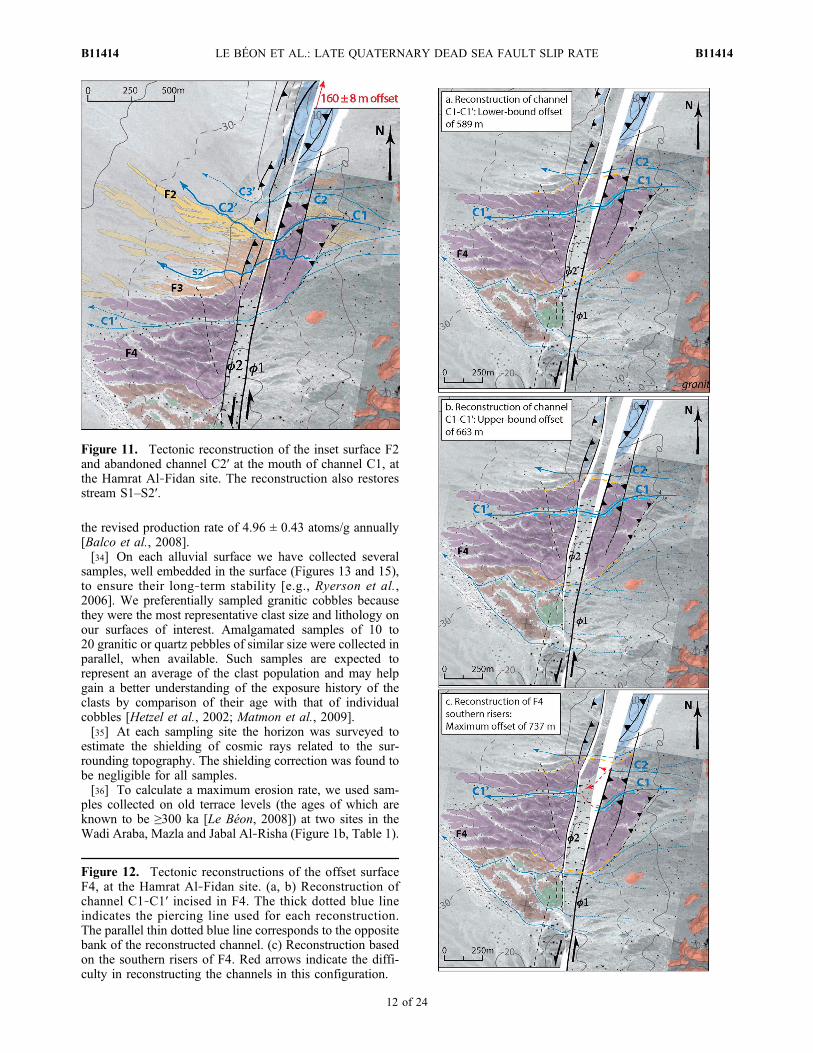
and channel C2′ against 81 and abutting onto F4 shows thatthey have been disconnected from their feeder, the width ofwhich should be ∼40 m or less, given the morphology ofF2. Only two sources are possible for F2: channels C1 andC2 (Figure 9). The width of C1 matches the width of F2 atfault 81, while channel C2 is too wide and can be discarded.Bringing the inset surface F2 back in front of the outlet ofchannel C1 yields an offset of 160 ± 8 m (Figure 11). Thisoffset applies to channel C2′ as well, showing that F2W wasalready incised when it was disconnected from its sourceand that the incision event occurred shortly after the surfacewas abandoned. This reconstruction also realigns twogullies, S1 and S2′, across 81.[27] To determine the offset of surface F4, we propose to
match channel C1 with channel C1′ (Figure 12), as theyhave very similar widths. The channel banks, well definedon both sides of the fault, are used as piercing lines toretrieve the original shape of the channel. At fault 81 thebanks of channel C1 are oriented E‐W, attesting to awestward orientation of the water flow. At fault 82 thesouthern bank of C1′ is oriented E‐W too, but the northernbank is oriented ENE‐WSW. This suggests a W to WSWorientation for the water flow that enters C1′. One shouldkeep in mind the possible modification in the geometry ofthe channel banks of C1′ close to fault 82, due to lateralerosion and displacement of C1′ toward the south relativeto its upstream sources. The lack of constraints betweenfault 81 and fault 82 also leaves some uncertainty in thereconstructions.[28] Considering a westward water flow at the mouth of C1
and a water flow varying between ENE‐WSW (Figure 12a)and E‐W (Figure 12b) at the head of C1′, the reconstructionof channel C1‐C1′ leads to an offset of 626 ± 37 m. Somefreedom remains regarding the position of the block locatedbetween faults 81 and 82. We chose to align the northernrisers of F4 on each block across the faults. This alignmentcould correspond to the incision of channel C2 in F4, syn-chronous with the incision of C1‐C1′. The two reconstruc-tions are also consistent with the general shape of surfaceF4. West of the fault, F4 extends more to the south than tothe east of the fault, which could be explained by the localslope oriented WSW. Eventually, a maximum bound of 737m for the offset is obtained by realigning the southern extentof the surface on both sides of the fault (Figure 12c). In thisconfiguration, however, the continuity of channel C1‐C1′could hardly be restored.
Figure 7. Four possible reconstructions of F3 at the JabalAl‐Muhtadi site. Reconstructions a and b are the most rea-sonable, while the larger offsets c and d are less likely, asthey require the northern patch of F3 to pass in front oftwo major channels (C1 and C2) that could have eroded itaway (see text).
LE BÉON ET AL.: LATE QUATERNARY DEAD SEA FAULT SLIP RATE B11414B11414
8 of 24
[29] Surface F3 could not be used to get any furtherinformation about the left‐lateral displacement along the faultowing to the lack of geomorphic markers on this surface.
3. Surface Exposure Dating
3.1. Analytical Approach
[30] Abandoned alluvial surfaces can be dated usingcosmogenic surface exposure dating. Exposure of clasts tocosmic rays induces the production of cosmogenic isotopes(e.g., 3He, 10Be, 21Ne, 36Cl) within the clast minerals, someof these isotopes being radioactive [Lal, 1991; Gosse andPhillips, 2001]. In this study we use 10Be CRN, producedfrom silicon and oxygen atoms of quartz‐rich rock types.[31] The number N10Be of 10Be isotopes within a rock
sample as a function of time t and depth z is given byequation (1) [Lal, 1991]:
N10Be t;zð Þ ¼ N10Be t;0ð Þþ P exp ��zð Þ= �þ �"ð Þ½ � 1� exp � �þ �"ð Þt½ �f g; ð1Þ
where N10Be(t,0) represents the number of atoms in the rocksample inherited from possible exposure prior to its finaldeposition, P is the production rate of 10Be (at/g of quartz/a),l is the half‐life of 10Be, m is the ratio of the sediment
density and the attenuation length of cosmic rays, and " isthe erosion rate of the alluvial surface.[32] To reduce the number of parameters that intervene in
equation (1), we work under two hypotheses. First, weassume that exposure during transport and temporary stor-age of samples in the drainage basin is negligible. Thisassumption has to be reconsidered for each new site accord-ing to the area of the drainage basin. The age distributionobtained from multiple samples from the same surface mayenable one to detect such a bias [Van der Woerd et al., 2006].Second, we assume that the erosion rate is likely to be low,owing to the arid climate in this area. This assumption issupported by the development of desert varnish and by desertpavement that protects the surface from deflation [Wells et al.,1995; Quade, 2001; Regard et al., 2006; Van der Woerd etal., 2006]. Later in this section we estimate analytically themaximum erosion rate and discuss its effect on the ages.Under these assumptions and considering samples collectedon the ground surface, equation (1) simplifies to equation (2):
N10Be 0;tð Þ ¼ P=�ð Þ 1� exp ��tð Þ½ �: ð2Þ
[33] Sample processing consists of isolating the quartzgrains from the rock samples and cleaning them frommeteoric contamination following the chemical protocol ofKohl and Nishiizumi [1992]. Next, cleaned quartz samples
Figure 8. SPOT5 satellite overview of the Hamrat Al‐Fidan site. Topographic contour lines fromSRTM3 data (negative altitudes are below sea level). Dark blue lines indicate the only two drainages thatcross the Jabal Hamrat Fidan ridge at present. Light blue lines represent the drainage network at the originof the offset bajada.
LE BÉON ET AL.: LATE QUATERNARY DEAD SEA FAULT SLIP RATE B11414B11414
9 of 24
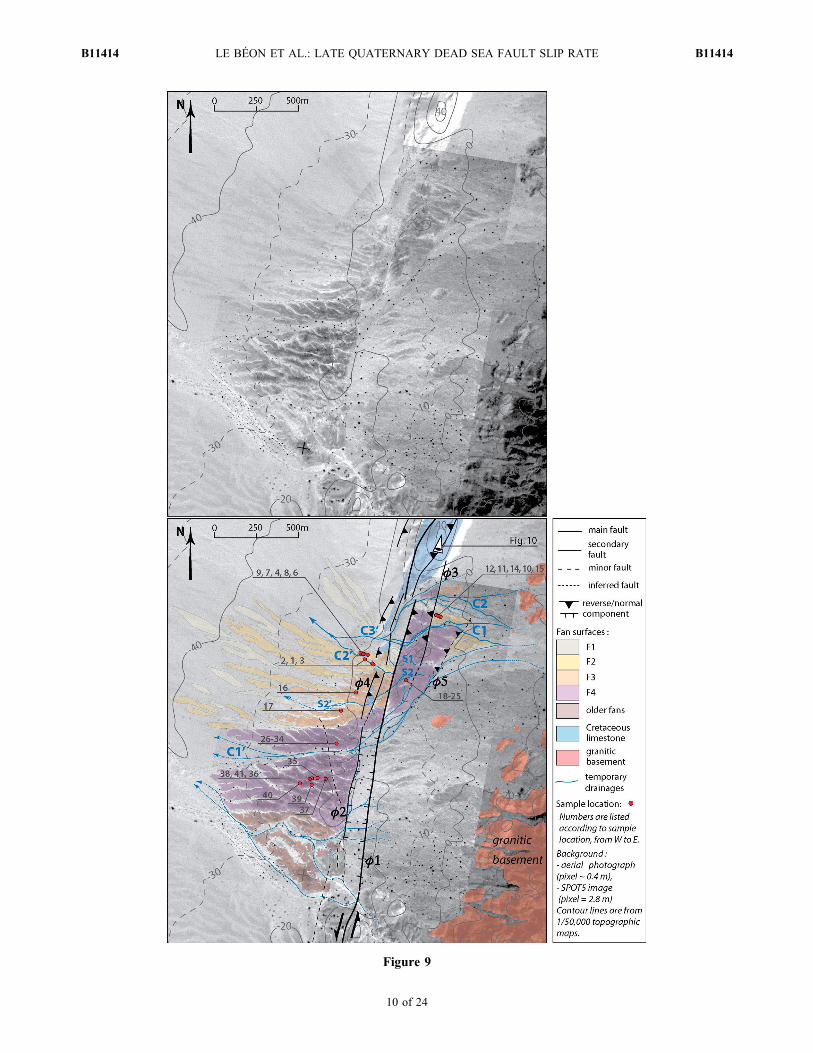
Figure 9
LE BÉON ET AL.: LATE QUATERNARY DEAD SEA FAULT SLIP RATE B11414B11414
10 of 24
are dissolved in hydrofluoric acid, after the addition of a 9Bespike solution. We then separate the atoms of beryllium byanion and cation exchange chromatography. We precipitateberyllium hydroxides and ignite them to obtain berylliumoxide. Finally, the 10Be/9Be ratio is measured by acceleratormass spectrometry (AMS) at the Lawrence LivermoreNational Laboratory AMS facility [Davis et al., 1990;
Finkel and Suter, 1993] and normalized to the KNSTD3110standard (see Tables 2a, 2b, and 2c). 10Be CRN model ageswere calculated following equation (2) and using the onlineCRONUS‐Earth calculator and the scaling scheme “St” ofBalco et al. [2008]. This scheme uses the constant‐over‐time scaling factors of Lal [1991], the rescaling as functionsof latitude and atmospheric pressure by Stone [2000], and
Figure 10. Field views and morphotectonic interpretations at the Hamra Al‐Fidan site. Dotted red linesand red arrows indicate the fault trace and blue arrows point to drainages. (a) View of the alluvial surfaceseast of fault 81. (b) View of the alluvial surfaces located between fault 81 and fault 82 and west of fault8 2. K: Cretaceous bedrock knob.
Figure 9. Aerial photograph superimposed on SPOT5 image at the Hamrat Al‐Fidan site and morphotectonic map. Wemapped the alluvial surfaces and the fault trace from field observations, stereoscopic aerial photos, high‐resolution GoogleEarth images, and SPOT5 images. The relative age of alluvial surfaces increases from F1 to F4.
LE BÉON ET AL.: LATE QUATERNARY DEAD SEA FAULT SLIP RATE B11414B11414
11 of 24
the revised production rate of 4.96 ± 0.43 atoms/g annually[Balco et al., 2008].[34] On each alluvial surface we have collected several
samples, well embedded in the surface (Figures 13 and 15),to ensure their long‐term stability [e.g., Ryerson et al.,2006]. We preferentially sampled granitic cobbles becausethey were the most representative clast size and lithology onour surfaces of interest. Amalgamated samples of 10 to20 granitic or quartz pebbles of similar size were collected inparallel, when available. Such samples are expected torepresent an average of the clast population and may helpgain a better understanding of the exposure history of theclasts by comparison of their age with that of individualcobbles [Hetzel et al., 2002; Matmon et al., 2009].[35] At each sampling site the horizon was surveyed to
estimate the shielding of cosmic rays related to the sur-rounding topography. The shielding correction was found tobe negligible for all samples.[36] To calculate a maximum erosion rate, we used sam-
ples collected on old terrace levels (the ages of which areknown to be ≥300 ka [Le Béon, 2008]) at two sites in theWadi Araba, Mazla and Jabal Al‐Risha (Figure 1b, Table 1).
Figure 11. Tectonic reconstruction of the inset surface F2and abandoned channel C2′ at the mouth of channel C1, atthe Hamrat Al‐Fidan site. The reconstruction also restoresstream S1–S2′.
Figure 12. Tectonic reconstructions of the offset surfaceF4, at the Hamrat Al‐Fidan site. (a, b) Reconstruction ofchannel C1‐C1′ incised in F4. The thick dotted blue lineindicates the piercing line used for each reconstruction.The parallel thin dotted blue line corresponds to the oppositebank of the reconstructed channel. (c) Reconstruction basedon the southern risers of F4. Red arrows indicate the diffi-culty in reconstructing the channels in this configuration.
LE BÉON ET AL.: LATE QUATERNARY DEAD SEA FAULT SLIP RATE B11414B11414
12 of 24
We assumed that enough terrace material has beenremoved by erosion to justify the steady‐state erosionmodel [Lal, 1991] (i.e., production is balanced by radio-active decay) for the samples with the highest 10Be con-centrations.We obtained an averagemaximum erosion rate of2.1 ± 0.1m/Ma (Table 1). Because the study area experiencesuniform climatic conditions and because the configurations
of the four sites are similar (gentle slopes, sites isolated fromthe relief), we can reasonably apply the same maximumerosion rate at the sites presented here. This clearly is aconservative approach, as an extremely low maximumerosion rate of 0.3 m/Ma has been measured in the neigh-boring Paran Plains of Israel by Matmon et al. [2009]. Wefound no evidence in the field of significant surface defla-tion (such as shallow‐rooted or uprooted cobbles or lightervarnish at the cobble base) or of erosion of the desert varnishon the cobbles.[37] Minimum and maximum ages (calculated assuming
no erosion and maximum erosion, respectively) are listed inTables 2a, 2b, and 2c. The effect of the maximum erosionrate remains negligible for most samples, confirming thezero‐erosion hypothesis [e.g., Ryerson et al., 2006]. Forages of the order of 100 ka, maximum erosion would leadto a 15% increase in age, which is barely larger thanuncertainty.[38] CRN dating of alluvial surfaces may be biased not
only by preexposure and erosion, but also by the complexityof alluvial processes (e.g., duration of surface activity,postdepositional contamination related to exceptional floodevents). All such processes may result in a scattered agedistribution. The definition of age clusters and the rejectionof outliers are often controversial, especially in small datasets, and depend in large part on the sample distribution,which may, or may not, appear Gaussian. Typically, outliersare defined by visual rejection [e.g., Van der Woerd et al.,1998] or by using Chauvenet’s criterion [Mériaux et al.,2004, 2009]. The age of each cluster is routinely reportedas the mean or the weighted mean of the cluster, althoughother authors have used the “oldest‐age method” [e.g.,Briner et al., 2005] or considered the interval covered by allof the ages [e.g., Ritz et al., 2006]. In this study, after pre-liminary statistical tests [Le Béon, 2008], we eventuallyrejected visually obvious outliers. For each surface we cal-culated, from the minimum CRN model ages, the weightedmean age, applying weights that depend on the normalizedinternal uncertainty, and the standard deviation s. We dis-cuss specific cases in which scattered data are not all cov-ered by the interval mean ± s and we propose using a widerinterval as a conservative age estimate.
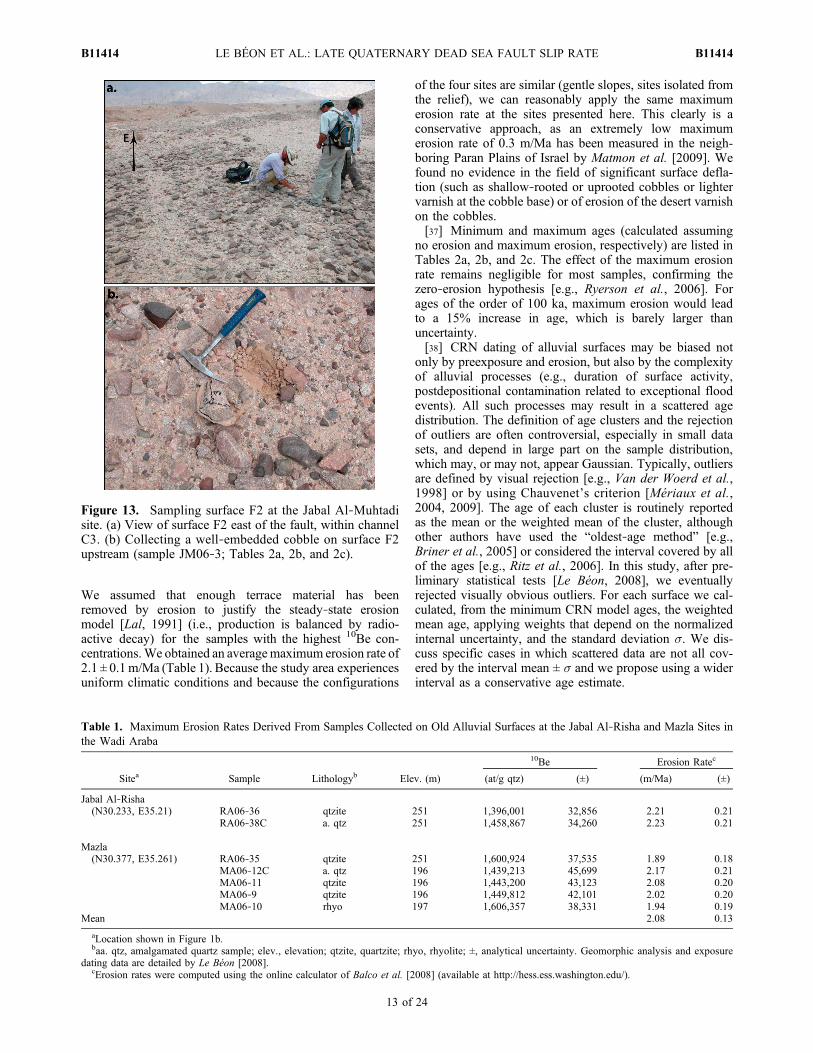
Figure 13. Sampling surface F2 at the Jabal Al‐Muhtadisite. (a) View of surface F2 east of the fault, within channelC3. (b) Collecting a well‐embedded cobble on surface F2upstream (sample JM06‐3; Tables 2a, 2b, and 2c).
Table 1. Maximum Erosion Rates Derived From Samples Collected on Old Alluvial Surfaces at the Jabal Al‐Risha and Mazla Sites inthe Wadi Araba
Sitea Sample Lithologyb Elev. (m)
10Be Erosion Ratec
(at/g qtz) (±) (m/Ma) (±)
Jabal Al‐Risha(N30.233, E35.21) RA06‐36 qtzite 251 1,396,001 32,856 2.21 0.21
RA06‐38C a. qtz 251 1,458,867 34,260 2.23 0.21
Mazla(N30.377, E35.261) RA06‐35 qtzite 251 1,600,924 37,535 1.89 0.18
MA06‐12C a. qtz 196 1,439,213 45,699 2.17 0.21MA06‐11 qtzite 196 1,443,200 43,123 2.08 0.20MA06‐9 qtzite 196 1,449,812 42,101 2.02 0.20MA06‐10 rhyo 197 1,606,357 38,331 1.94 0.19
Mean 2.08 0.13
aLocation shown in Figure 1b.baa. qtz, amalgamated quartz sample; elev., elevation; qtzite, quartzite; rhyo, rhyolite; ±, analytical uncertainty. Geomorphic analysis and exposure
dating data are detailed by Le Béon [2008].cErosion rates were computed using the online calculator of Balco et al. [2008] (available at http://hess.ess.washington.edu/).
LE BÉON ET AL.: LATE QUATERNARY DEAD SEA FAULT SLIP RATE B11414B11414
13 of 24
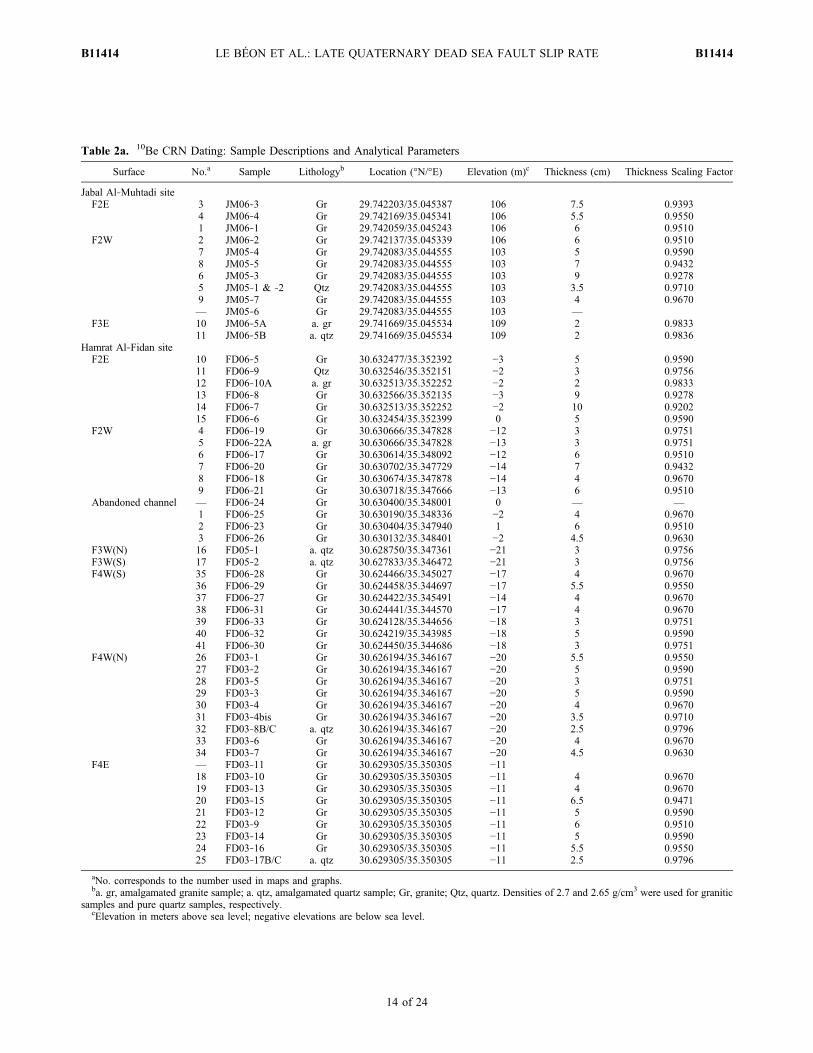
Table 2a. 10Be CRN Dating: Sample Descriptions and Analytical Parameters
Surface No.a Sample Lithologyb Location (°N/°E) Elevation (m)c Thickness (cm) Thickness Scaling Factor
Jabal Al‐Muhtadi siteF2E 3 JM06‐3 Gr 29.742203/35.045387 106 7.5 0.9393
4 JM06‐4 Gr 29.742169/35.045341 106 5.5 0.95501 JM06‐1 Gr 29.742059/35.045243 106 6 0.9510
F2W 2 JM06‐2 Gr 29.742137/35.045339 106 6 0.95107 JM05‐4 Gr 29.742083/35.044555 103 5 0.95908 JM05‐5 Gr 29.742083/35.044555 103 7 0.94326 JM05‐3 Gr 29.742083/35.044555 103 9 0.92785 JM05‐1 & ‐2 Qtz 29.742083/35.044555 103 3.5 0.97109 JM05‐7 Gr 29.742083/35.044555 103 4 0.9670— JM05‐6 Gr 29.742083/35.044555 103 —
F3E 10 JM06‐5A a. gr 29.741669/35.045534 109 2 0.983311 JM06‐5B a. qtz 29.741669/35.045534 109 2 0.9836
Hamrat Al‐Fidan siteF2E 10 FD06‐5 Gr 30.632477/35.352392 −3 5 0.9590
11 FD06‐9 Qtz 30.632546/35.352151 −2 3 0.975612 FD06‐10A a. gr 30.632513/35.352252 −2 2 0.983313 FD06‐8 Gr 30.632566/35.352135 −3 9 0.927814 FD06‐7 Gr 30.632513/35.352252 −2 10 0.920215 FD06‐6 Gr 30.632454/35.352399 0 5 0.9590
F2W 4 FD06‐19 Gr 30.630666/35.347828 −12 3 0.97515 FD06‐22A a. gr 30.630666/35.347828 −13 3 0.97516 FD06‐17 Gr 30.630614/35.348092 −12 6 0.95107 FD06‐20 Gr 30.630702/35.347729 −14 7 0.94328 FD06‐18 Gr 30.630674/35.347878 −14 4 0.96709 FD06‐21 Gr 30.630718/35.347666 −13 6 0.9510
Abandoned channel — FD06‐24 Gr 30.630400/35.348001 0 — —1 FD06‐25 Gr 30.630190/35.348336 −2 4 0.96702 FD06‐23 Gr 30.630404/35.347940 1 6 0.95103 FD06‐26 Gr 30.630132/35.348401 −2 4.5 0.9630
F3W(N) 16 FD05‐1 a. qtz 30.628750/35.347361 −21 3 0.9756F3W(S) 17 FD05‐2 a. qtz 30.627833/35.346472 −21 3 0.9756F4W(S) 35 FD06‐28 Gr 30.624466/35.345027 −17 4 0.9670
36 FD06‐29 Gr 30.624458/35.344697 −17 5.5 0.955037 FD06‐27 Gr 30.624422/35.345491 −14 4 0.967038 FD06‐31 Gr 30.624441/35.344570 −17 4 0.967039 FD06‐33 Gr 30.624128/35.344656 −18 3 0.975140 FD06‐32 Gr 30.624219/35.343985 −18 5 0.959041 FD06‐30 Gr 30.624450/35.344686 −18 3 0.9751
F4W(N) 26 FD03‐1 Gr 30.626194/35.346167 −20 5.5 0.955027 FD03‐2 Gr 30.626194/35.346167 −20 5 0.959028 FD03‐5 Gr 30.626194/35.346167 −20 3 0.975129 FD03‐3 Gr 30.626194/35.346167 −20 5 0.959030 FD03‐4 Gr 30.626194/35.346167 −20 4 0.967031 FD03‐4bis Gr 30.626194/35.346167 −20 3.5 0.971032 FD03‐8B/C a. qtz 30.626194/35.346167 −20 2.5 0.979633 FD03‐6 Gr 30.626194/35.346167 −20 4 0.967034 FD03‐7 Gr 30.626194/35.346167 −20 4.5 0.9630
F4E — FD03‐11 Gr 30.629305/35.350305 −1118 FD03‐10 Gr 30.629305/35.350305 −11 4 0.967019 FD03‐13 Gr 30.629305/35.350305 −11 4 0.967020 FD03‐15 Gr 30.629305/35.350305 −11 6.5 0.947121 FD03‐12 Gr 30.629305/35.350305 −11 5 0.959022 FD03‐9 Gr 30.629305/35.350305 −11 6 0.951023 FD03‐14 Gr 30.629305/35.350305 −11 5 0.959024 FD03‐16 Gr 30.629305/35.350305 −11 5.5 0.955025 FD03‐17B/C a. qtz 30.629305/35.350305 −11 2.5 0.9796
aNo. corresponds to the number used in maps and graphs.ba. gr, amalgamated granite sample; a. qtz, amalgamated quartz sample; Gr, granite; Qtz, quartz. Densities of 2.7 and 2.65 g/cm3 were used for granitic
samples and pure quartz samples, respectively.cElevation in meters above sea level; negative elevations are below sea level.
LE BÉON ET AL.: LATE QUATERNARY DEAD SEA FAULT SLIP RATE B11414B11414
14 of 24
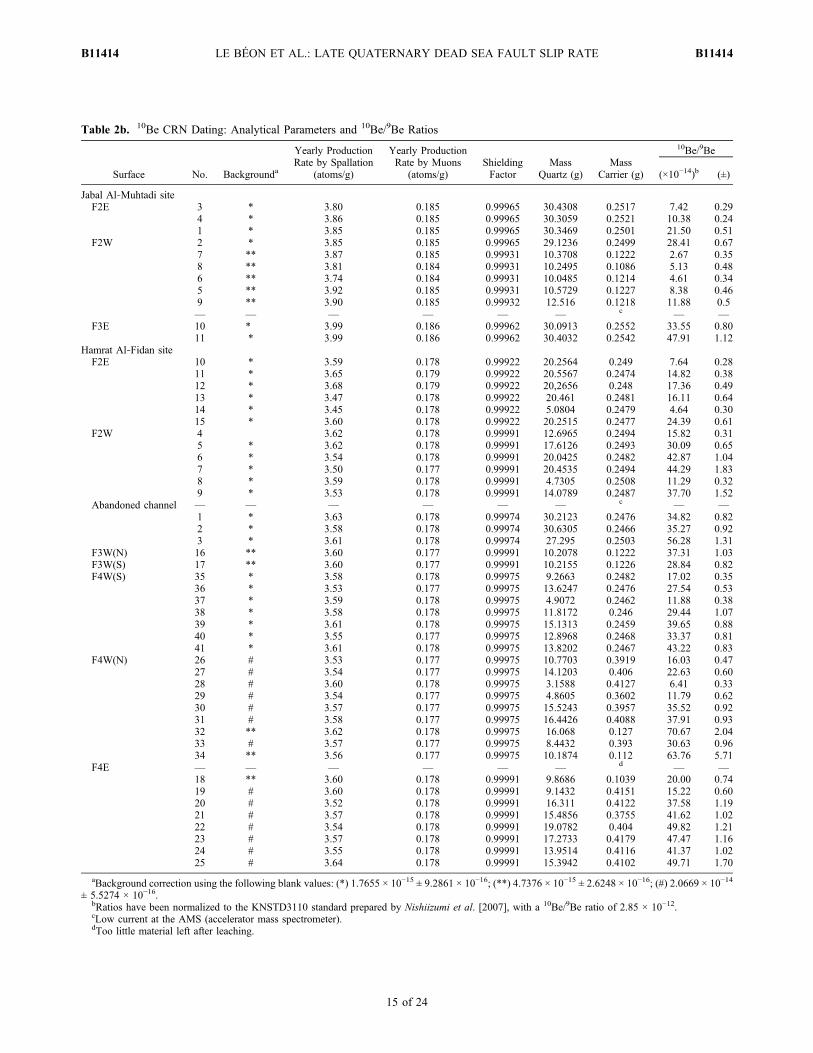
Table 2b. 10Be CRN Dating: Analytical Parameters and 10Be/9Be Ratios
Surface No. Backgrounda
Yearly ProductionRate by Spallation
(atoms/g)
Yearly ProductionRate by Muons
(atoms/g)ShieldingFactor
MassQuartz (g)
MassCarrier (g)
10Be/9Be
(×10−14)b (±)
Jabal Al‐Muhtadi siteF2E 3 * 3.80 0.185 0.99965 30.4308 0.2517 7.42 0.29
4 * 3.86 0.185 0.99965 30.3059 0.2521 10.38 0.241 * 3.85 0.185 0.99965 30.3469 0.2501 21.50 0.51
F2W 2 * 3.85 0.185 0.99965 29.1236 0.2499 28.41 0.677 ** 3.87 0.185 0.99931 10.3708 0.1222 2.67 0.358 ** 3.81 0.184 0.99931 10.2495 0.1086 5.13 0.486 ** 3.74 0.184 0.99931 10.0485 0.1214 4.61 0.345 ** 3.92 0.185 0.99931 10.5729 0.1227 8.38 0.469 ** 3.90 0.185 0.99932 12.516 0.1218 11.88 0.5— — — — — — c — —
F3E 10 * 3.99 0.186 0.99962 30.0913 0.2552 33.55 0.8011 * 3.99 0.186 0.99962 30.4032 0.2542 47.91 1.12
Hamrat Al‐Fidan siteF2E 10 * 3.59 0.178 0.99922 20.2564 0.249 7.64 0.28
11 * 3.65 0.179 0.99922 20.5567 0.2474 14.82 0.3812 * 3.68 0.179 0.99922 20,2656 0.248 17.36 0.4913 * 3.47 0.178 0.99922 20.461 0.2481 16.11 0.6414 * 3.45 0.178 0.99922 5.0804 0.2479 4.64 0.3015 * 3.60 0.178 0.99922 20.2515 0.2477 24.39 0.61
F2W 4 3.62 0.178 0.99991 12.6965 0.2494 15.82 0.315 * 3.62 0.178 0.99991 17.6126 0.2493 30.09 0.656 * 3.54 0.178 0.99991 20.0425 0.2482 42.87 1.047 * 3.50 0.177 0.99991 20.4535 0.2494 44.29 1.838 * 3.59 0.178 0.99991 4.7305 0.2508 11.29 0.329 * 3.53 0.178 0.99991 14.0789 0.2487 37.70 1.52
Abandoned channel — — — — — — c — —1 * 3.63 0.178 0.99974 30.2123 0.2476 34.82 0.822 * 3.58 0.178 0.99974 30.6305 0.2466 35.27 0.923 * 3.61 0.178 0.99974 27.295 0.2503 56.28 1.31
F3W(N) 16 ** 3.60 0.177 0.99991 10.2078 0.1222 37.31 1.03F3W(S) 17 ** 3.60 0.177 0.99991 10.2155 0.1226 28.84 0.82F4W(S) 35 * 3.58 0.178 0.99975 9.2663 0.2482 17.02 0.35
36 * 3.53 0.177 0.99975 13.6247 0.2476 27.54 0.5337 * 3.59 0.178 0.99975 4.9072 0.2462 11.88 0.3838 * 3.58 0.178 0.99975 11.8172 0.246 29.44 1.0739 * 3.61 0.178 0.99975 15.1313 0.2459 39.65 0.8840 * 3.55 0.177 0.99975 12.8968 0.2468 33.37 0.8141 * 3.61 0.178 0.99975 13.8202 0.2467 43.22 0.83
F4W(N) 26 # 3.53 0.177 0.99975 10.7703 0.3919 16.03 0.4727 # 3.54 0.177 0.99975 14.1203 0.406 22.63 0.6028 # 3.60 0.178 0.99975 3.1588 0.4127 6.41 0.3329 # 3.54 0.177 0.99975 4.8605 0.3602 11.79 0.6230 # 3.57 0.177 0.99975 15.5243 0.3957 35.52 0.9231 # 3.58 0.177 0.99975 16.4426 0.4088 37.91 0.9332 ** 3.62 0.178 0.99975 16.068 0.127 70.67 2.0433 # 3.57 0.177 0.99975 8.4432 0.393 30.63 0.9634 ** 3.56 0.177 0.99975 10.1874 0.112 63.76 5.71
F4E — — — — — — d — —18 ** 3.60 0.178 0.99991 9.8686 0.1039 20.00 0.7419 # 3.60 0.178 0.99991 9.1432 0.4151 15.22 0.6020 # 3.52 0.178 0.99991 16.311 0.4122 37.58 1.1921 # 3.57 0.178 0.99991 15.4856 0.3755 41.62 1.0222 # 3.54 0.178 0.99991 19.0782 0.404 49.82 1.2123 # 3.57 0.178 0.99991 17.2733 0.4179 47.47 1.1624 # 3.55 0.178 0.99991 13.9514 0.4116 41.37 1.0225 # 3.64 0.178 0.99991 15.3942 0.4102 49.71 1.70
aBackground correction using the following blank values: (*) 1.7655 × 10⁻¹⁵ ± 9.2861 × 10⁻¹⁶; (**) 4.7376 × 10⁻¹⁵ ± 2.6248 × 10⁻¹⁶; (#) 2.0669 × 10⁻¹⁴
± 5.5274 × 10⁻¹⁶.bRatios have been normalized to the KNSTD3110 standard prepared by Nishiizumi et al. [2007], with a 10Be/9Be ratio of 2.85 × 10⁻¹².cLow current at the AMS (accelerator mass spectrometer).dToo little material left after leaching.
LE BÉON ET AL.: LATE QUATERNARY DEAD SEA FAULT SLIP RATE B11414B11414
15 of 24
Table 2c. 10Be CRN Dating: 10Be Concentrations and Model Agesa
Surface No.
10Be Conc.
Min. Ageb Int. ±c Ext. ±d Max. Agee Ext. ±d(atoms/g SiO2 × 104) (±)
Jabal Al‐Muhtadi siteF2E 3 4.10 0.16 10.32 0.40 0.99 10.50 1.02
4 5.77 0.14 14.31 0.34 1.29 14.66 1.361 11.84 0.28 29.58 0.71 2.68 31.16 2.99
F2W 2 16.29 0.39 40.82 0.98 3.71 43.93 4.327 1.87 0.25 4.61 0.61 0.73 4.64 0.748 3.23 0.30 8.12 0.77 1.04 8.23 1.076 3.31 0.25 8.44 0.63 0.97 8.56 0.995 5.78 0.31 14.13 0.77 1.45 14.48 1.539 3.23 0.30 16.88 0.72 1.64 17.38 1.74— —
F3E 10 19.01 0.46 46.09 1.12 4.20 50.12 5,0011 26.77 0.63 65.19 1.55 5.96 73.51 7.68
Hamrat Al‐Fidan siteF2E 10 6.28 0.23 16.723 0.626 1.587 17.212 1.684
11 11.92 0.31 31.341 0.819 2.864 33.092 3.20512 14.20 0.40 37.109 1.065 3.424 39.652 3.92913 13.06 0.52 36.081 1.453 3.481 38.473 3.97714 15.14 0.99 42.214 2.787 4.637 45.54 5.43115 19.93 0.50 53.498 1.353 4.901 59.019 6.02
F2W 4 20.77 0.40 55.398 1.094 5.002 61.354 6.1945 28.46 0.61 76.354 1.67 6.966 88.385 9.4956 35.47 0.86 97.922 2.438 9.056 119.091 13.7767 36.09 1.49 100.652 4.267 9.934 123.212 15.3378 40.01 1.13 109.195 3.164 10.254 136.577 16.6189 44.50 1.80 123.72 5.165 12.236 160.735 21.646
Abandoned channel — —1 19.07 0.45 50.776 1.212 4.629 55.714 5.622 18.98 0.49 51.219 1.353 4.706 56.247 5.7243 34.49 0.81 93.236 2.231 8.589 112.153 12.746
F3W(N) 16 26.53 0.73 55.219 1.599 5.121 61.006 6.308F3W(S) 17 20.56 0.59 71.54 2.003 6.638 81.717 8.789F4W(S) 35 30.46 0.63 82.827 1.746 7.553 97.263 10.626
36 33.45 0.65 92.271 1.831 8.408 110.722 12.41237 39.83 1.26 108.721 3.549 10.338 135.82 16.70938 40.95 1.49 112.14 4.213 10.874 141.318 17.92839 43.06 0.96 117.251 2.682 10.832 149.756 18.41740 42.68 1.03 118.14 2.947 10.98 151.212 18.76341 51.55 0.99 141.231 2.801 13.025 192.968 25.934
F4W(N) 26 16.76 0.49 50.41 1.547 4.697 55.267 5.69327 18.70 0.50 50.96 1.367 4.688 55.932 5.69528 24.05 1.24 64.715 3.391 6.645 73.06 8.57729 25.10 1.32 68.714 3.668 7.096 78.226 9.32730 26.02 0.67 70.69 1.859 6.523 80.821 8.65431 27.08 0.67 73.339 1.842 6.747 84.333 9.06432 33.18 0.96 89.475 2.644 8.38 106.289 12.09433 40.97 1.28 112.505 3.625 10.691 141.908 17.66434 41.64 3.73 114.861 10.592 14.756 145.759 24.723
F4E — —18 12.51 0.46 33.412 1.241 3.179 35.452 3.59519 19.85 0.79 53.299 2.144 5.16 58.778 6.33220 27.29 0.87 75.134 2.43 7.083 86.724 9.59521 29,00 0.71 78.983 1.977 7.274 91.951 10.04122 30.31 0.74 83.311 2.064 7.675 97.929 10.82223 33.00 0.80 90.139 2.245 8.321 107.635 12.14924 35.07 0.86 96.32 2.432 8.914 116.7 13.44425 38.06 1.30 102.169 3.589 9.791 125.017 15.097
aModel ages were calculated with the CRONUS‐Earth online calculator, version 2.2 [Balco et al., 2008] (available at http://hess.ess.washington.edu/math).
bMinimum model age, calculated with no erosion.cInt. ±: internal (or analytical) uncertainty, which includes error from the blank and the AMS counting statistics.dExt. ±: external (or propagated) uncertainty, which takes into account uncertainty in the production rate and scaling factors.eMaximum model age, calculated with a maximum erosion rate of 2.08 m/Ma.
LE BÉON ET AL.: LATE QUATERNARY DEAD SEA FAULT SLIP RATE B11414B11414
16 of 24
3.2. 10Be Cosmogenic Radionuclide Model Agesand Interpretation
3.2.1. The Jabal Al‐Muhtadi Site[39] We collected samples on surfaces F2 and F3, at
locations shown in Figure 5. To date the offset alluvial fanF2, we sampled 9 granitic cobbles at the surface on eitherside of the fault. Care was taken to collect only well‐embedded cobbles in the best‐defined parts of surface F2,characterized by a darker color (Figure 13). Indeed, becauseof the small difference in height (∼40 cm) between F2 andF1 (Figure 4b), we cannot totally rule out occasional con-tamination of surface F2 with younger cobbles duringextreme flood events when F1 was still the active surface.Surface F3 is paved by 1 to 10 cm varnished pebbles andexhibits no cobbles. Two amalgamates of granitic andquartz vein pebbles were collected on a preserved part ofsurface F3, away from any regressive gully.[40] The catchment area of the Wadi Al‐Muhtadi is fairly
large, about 32 km2, with a length of 9 km. Yet the drainagesare rather straight, taking advantage of preexisting fractureswithin the bedrock (Figure 2), limiting the possibilities forclasts to be temporarily stored in the wadis and, hence, toacquire inheritance related to transport duration. Inheritancerelated to preexposure prior to transport remains possible.[41] 10Be CRN model ages are reported in Tables 2a, 2b,
and 2c and Figure 14. The two samples of amalgamatedpebbles collected on surface F3 yield amean age of 56 ± 14 kafor this surface. This age is consistent with that of 62 ± 5 kadetermined by Porat et al. [2010] for an alluvial surfacelocated 15 km to the south (Figure 1b), which is at the samerelative level above the present‐day channels as F3.
[42] On surface F2, west of the fault, four samples haveCRNmodel ages ranging between 8.1 ± 1.0 and 16.9 ± 1.6 kaand one sample (4.6 ± 0.7 ka, no. 5) is significantly younger.East of the fault, two of the ages are 10.3 ± 1.0 and 14.1 ±1.5 ka, comparable to the age population downstream, whilethe other two samples are much older (30 ± 3 ka, no. 1; 41 ±4 ka, no. 2). The ages of those samples suggest that they
Figure 14. 10Be cosmogenic radionuclide (CRN) modelages at the Jabal Al‐Muhtadi site. Lines and colored barsrepresent the weighted mean ± standard deviation s, basedon ages represented in black. Ages in gray are visuallydefined outliers (see text).
Figure 15. Sampling at the Hamrat Al‐Fidan site. (a) Viewof surface F4W, south of channel C1′. The surface is darkand paved with pebbles. (b) View of surface F2W, whichis lighter than F4 due to the less developed desert pavementand varnish. (c) View of surface F2E, which appears similarto F2W (Figure 15b).
LE BÉON ET AL.: LATE QUATERNARY DEAD SEA FAULT SLIP RATE B11414B11414
17 of 24
have been redeposited from an older alluvial deposit, suchas F3, which is actively incised by current channels. Dis-carding those two samples, we compute an average age forF2 of 11.1 ± 4.3 ka, based on seven samples. The intervalmean ± s does not overlap the youngest age from sample 5.Because of the small height difference between F2 and F1, itis likely that this cobble was brought onto F2 during anexceptional flood that occurred after the abandonment of F2.Neglecting this possibility would lead to consideration ofthe conservative interval [3.9 ka; 18.5 ka].3.2.2. The Hamrat Al‐Fidan Site[43] At Hamrat Al‐Fidan we targeted surfaces F4 and F2
and the abandoned channel C2′, for which we could measureoffsets. Surface F3 was also dated to get a better under-standing of the alluvium emplacement history at this site.Sample locations are shown in Figure 9, and CRN modelages are reported in Tables 2a, 2b, and 2c and Figure 16. Toavoid any confusion, surface names are labeled “E” or “W,”according to their location relative to the fault.[44] Surface F4 was sampled east and west of the fault
(Figure 9). Care was taken to sample only pristine surfaces,not affected by surficial erosion (Figure 15). Twenty‐twogranitic cobbles and two amalgamated samples of quartzpebbles led to a widespread age distribution. CRN modelages range from 33 ± 3 to 141 ± 13 ka (samples 18 and 41),most of them (19 of 24) lying between 65 ± 7 and 118 ±11 ka, amalgamated samples included (Tables 2a, 2b, and 2cand Figure 16).[45] Before defining CRN model age clusters further, we
investigated which mechanism(s) could be at the origin ofsuch important scattering and whether the average agewould be representative of the true age. Hereafter we con-sider two scenarios in which the use of the average agewould be misleading: first, scattered inheritance from 0 to∼50 ka and, second, continuous activity of the surface
during ∼50 ka. In the first case, only the youngest sampleswould be appropriate for estimating the age of the surface.In the second case the entire interval would have to beconsidered.[46] Because catchments at this site are very small
(<1 km2), inheritance related to temporary storage in thecatchments seems unlikely. However, between the catch-ment outlet and the sampling site, the gentle ∼1 km longslope of the bajada could account for a slow transit areawhere the clasts may be preexposed to cosmic‐ray flux. Thebajada setting of the site would also support the possibilityof extended activity of the surfaces. In addition, the smallcatchments may not feed the drainages with a sufficientamount of clasts to totally cover older deposits. Such pro-cesses can hardly be quantified from our data and they havealso probably evolved in parallel with climatic variations.The formation of four alluvial terrace levels within ∼90 ka,however, suggests that surface activity is shorter than∼50 ka. Preexposure as large as ∼50 ka is not supported bythe age distribution obtained for F2E (Figure 16).[47] Owing to the obvious complex mechanisms respon-
sible for scattering, we proposed two levels of interpretationof these ages. First, we used all 24 ages, including theiruncertainty, and we provided a conservative range of ages of[30 ka; 154 ka]. Then, from all the ages, we computed anaverage age of 87 ± 26 ka, which covers 17 of the 24 ages.Defining the age of surface F4 based only on the age dis-tribution is not straightforward. Yet our morphostratigraphicanalysis and the ages obtained for the other surfaces provideadditional information. Sample 18 has an age similar to thatof surface F2E; samples 19, 26, and 27 are slightly youngerthan F3W (Figure 16). Integrating these samples is incon-sistent with our morphostratigraphic mapping. Hence, theseyounger samples may have been brought onto F4 duringsome more recent flood events, possibly related to the
Figure 16. 10Be CRN model ages at the Hamrat Al‐Fidan site. Lines and colored bars represent theweighted mean ± standard deviation s, based on selected ages. For surface F4, dotted lines limit the inter-val covered by all the ages. Surface names are labeled east (E) or west (W), according to their locationrelative to the fault. Surfaces F4W(N) and F4W(S) correspond to F4 west of the fault, north and south ofchannel C1′, respectively.
LE BÉON ET AL.: LATE QUATERNARY DEAD SEA FAULT SLIP RATE B11414B11414
18 of 24
emplacement of F3 and F2. Thus, we favor the average ageof 87 ± 26 ka for surface F4.[48] A difference in the age distribution on F4W, north
and south of C1′, is worth noting. Samples 28 to 31 col-lected on F4W(N) exhibit slightly younger CRN model agesthan the youngest sample collected on F4W(S) (n°35). Thissuggests that the active drainage system could havemigrated from south to north, leaving the southern partinactive before the bajada was totally abandoned and laterincised. This would be consistent with left‐lateral offset ofthe western block relative to the feeding catchments.[49] On surface F3, west of the fault (F3W), we could
not find any cobbles. We collected amalgamated samplesof quartz pebbles from two distinct parts of the surface(Figure 9). We obtained model ages of 72 ± 7 ka (no. 17) tothe south and 55 ± 5 ka (no. 16) to the north (Table 2 andFigure 16). Averaging ages, we obtain 63 ± 12 ka for F3.Given the limited data for this surface and the fact that weused amalgamated samples, these results should be inter-preted with care. However, they would mean that thesouthern lobe was deposited before the northern one, inkeeping with the motion on the fault.[50] On the fan F2W, inset in the northern part of F3W
(Figure 9), we collected five cobbles and one amalgamatedsample of granitic pebbles. Four cobbles display CRNmodel ages between 98 and 124 ka and one is significantlyyounger, at 55 ± 5 ka (no. 4). The amalgamated sample(no. 5), which lies in between, at 76 ± 7 ka, reflects thescattering of the CRN model ages on this surface. We alsoinvestigated the abandoned channel C2′ incised into F2W(Figure 9). The stream bed of C2′ has probably been pre-served since it was disconnected from C1, as it passed infront of only one minor drainage, the gully S1. Narrow andwinding, S1 is probably not powerful enough to have sig-nificantly modified the stream bed of C2′, either by signifi-cant incision or by influx of clastic material. Care was takento collect well‐rooted cobbles from the best‐preserved areas,avoiding the shallow rill incised in the stream bed and thecolluvial material present along the drainage banks. Onecobble yields a model age of 93 ± 9 ka (no. 3) and two (nos. 1and 2) provide significantly younger ages, 51 ± 5 ka.[51] The CRN model ages from both F2W and C2′ appear
to be much older than expected from the surface appearanceof F2W (limited desert varnish and pavement) and from itsmorphologic position relative to F3 and F4. Actually, thegeneral age distribution of F2W, in addition to sample 3from C2′, is rather similar to the age distribution of F4. Theyoungest model age of F2W (55 ± 5 ka, sample 4) is similarto the model age of sample 16 (55 ± 5 ka), collected on thenorthern lobe of F3W. The 51 ka ages of channel C2′ areaccordingly slightly younger than the youngest sample ofF2W. We interpret these ages, or at least the older ones, asreworked material from F4 and, possibly, F3 types of allu-vium. This idea is supported by the incision within F4Eupstream of F2W and the required remobilization of F3Wprior to the emplacement of F2W. Regarding the youngestages (no. 4 on F2W and nos. 1 and 2 within C2′), either theycorrespond to the true ages of F2W and C2′ or they havealso been redeposited, in which case they would represent amaximum age.[52] Further information may be obtained by examining
the data from F2E, east of the fault, where we collected
five cobbles and one amalgamated sample of graniticpebbles (Figure 9). Figures 15b and 15c illustrate thesimilarity between the two surfaces F2, east and west ofthe fault: they are light in color, with few cobbles and littlesand between pebbles. Four of the ages (including that ofthe amalgamated sample) range between 31 ± 3 ka and 42± 5 ka; one is much younger (17 ± 2 ka, no. 10) and oneis significantly older (54 ± 5 ka, no. 15). Discardingsamples 10 and 15, we obtain an average age of 37 ± 5 kabased on four samples. If this surface truly correlates withF2W, as supported by their comparable appearance andsimilar relative height above the active channels, these agesattest that the samples of F2W are reworked from older de-posits. This would also confirm surface F4E to be a source ofmaterial for F2W, as F2E, located upstream from that source,has not been contaminated.
4. Slip Rate on the Fault
[53] The slip rate on the fault is obtained by dividing thecumulative lateral offset by the age of the offset feature. Thetype of exposure age to be considered depends on the natureof the marker used to determine the offset. In our study wematch both alluvial fans and channels. When the shape of afan is restored, the average exposure age should be used.When the marker is a channel incised in a specific terrace,one should refer to the timing of surface incision, usuallyestimated by the abandonment age of the incised surface (i.e.,a maximum age), assuming that incision shortly followsabandonment.[54] To compute fault slip rates we divided the lower‐
bound offset by the oldest age value and the upper‐boundoffset by the youngest age value. We then obtained theminimum and maximum fault slip rates, from which wecalculated the mean and associated uncertainty.
4.1. Slip Rate Derived From the Jabal Al‐MuhtadiOffset Alluvial Fans
[55] At Jabal Al‐Muhtadi an offset of 48 ± 7 m wasdetermined for surface F2 (Figure 6), in which configurationthe alluvial fan is restored to its initial geometry. Combiningthis offset with an average age of 11.1 ± 4.3 ka for thissurface yields a slip rate of 5.4 ± 2.7 mm/a. The minimumand maximum offsets of 24 and 64 m, which we argued tobe strictly under‐ and overestimated, together with theconservative age interval of [3.9 ka; 18.5 ka], yield slip ratebounds of 1.3 and 16.4 mm/a.[56] Owing to the scarce data for surface F3 at Jabal
Al‐Muhtadi west of the fault, we could propose only fourranges of possible offsets, the smallest two being the mostlikely (255 ± 8 and 370 ± 18 m; Figure 7). Using theseoffsets and the average age of F3 (56 ± 14 ka), we obtainslip rate ranges of 3.5–6.3 and 5.0–9.2 mm/a, respectively.These values, especially the first one, are in agreement withthe Early Holocene slip rate determined at the same site.Larger offsets would yield the significantly faster slip ratesof 7.1–14.8 and 9.4–16.7 mm/a.
4.2. Late Pleistocene Slip Rate DerivedFrom the Hamrat Al‐Fidan Site
[57] At the Hamrat Al‐Fidan site we could determine twodifferent offsets, for surface F2 and the abandoned channel
LE BÉON ET AL.: LATE QUATERNARY DEAD SEA FAULT SLIP RATE B11414B11414
19 of 24
C2′ incised within F2W and for surface F4 (Figures 9, 11,and 12). The offset of surface F2 and of the abandonedchannel C2′ is 160 ± 8 m (Figure 11). As detailed in section3.2.2, we interpreted the samples collected on F2 west of thefault and in the channel as being reworked from olderdeposits. Nevertheless, the youngest ages, if interpreted asmaximum ages, may be used to determine the minimum sliprate. Using maximum ages of 55 ± 5 ka (sample 4) for F2Wand of 51 ± 5 ka (samples 1 and 2) for C2′ (Tables 2a, 2b,and 2c), we obtain minimum slip rates of 2.9 ± 0.5 and 3.2 ±0.5 mm/a, respectively. Because the surface has been incisedbefore being offset (see section 2.2.2), dating from thechannel provides the best constraint. Provided appropriatesurface correlation across the fault, we propose to use theexposure age of F2E (37 ± 5 ka) to determine the minimumfault slip rate. We obtain 4.5 ± 0.9 mm/a. Because incisionshortly followed surface abandonment, the upper part of thisinterval is probably a closer estimate of the fault slip rate.[58] For surface F4, adjustment of channels C1 and C1′ on
both sides of the fault leads to an offset of 626 ± 37 m(Figure 12), also consistent with the shape of surface F4. Asdetailed in section 3.2.2, we favor an average exposure ageof 87 ± 26 ka. Combining the 626 ± 37 m offset with thisage, we obtain a slip rate of 8.1 ± 2.9 mm/a. Using theinterval of [30 ka; 154 ka] yields a conservative rangeof 3.8–22.1 mm/a, which accounts for any depositionalscenario for F4 itself. Yet the upper values are not consistentwith the chronology of surface emplacement at the scale ofthe site. Because the offset marker refers to an incision eventthat occurred after the abandonment of F4, this value is a
minimum. Competition between uplift and incision, espe-cially east of the fault, and appropriate reconstruction of theshape of F4 strongly suggest that incision shortly followedabandonment of the surface.We provide a conservative upperbound for the slip rate using the maximum offset of 737 m(Figure 12c), obtained by realigning the southern risers of F4and which we argue to be overestimated. We obtain 9.3 ±2.8 mm/a from the average age of 87 ± 26 ka and slip ratebounds of 4.8 and 24.6 mm/a when we consider the interval[30 ka; 154 ka].
5. Discussion and Conclusions
5.1. Comparison With Previous Slip Rates on the WadiAraba Fault Segment
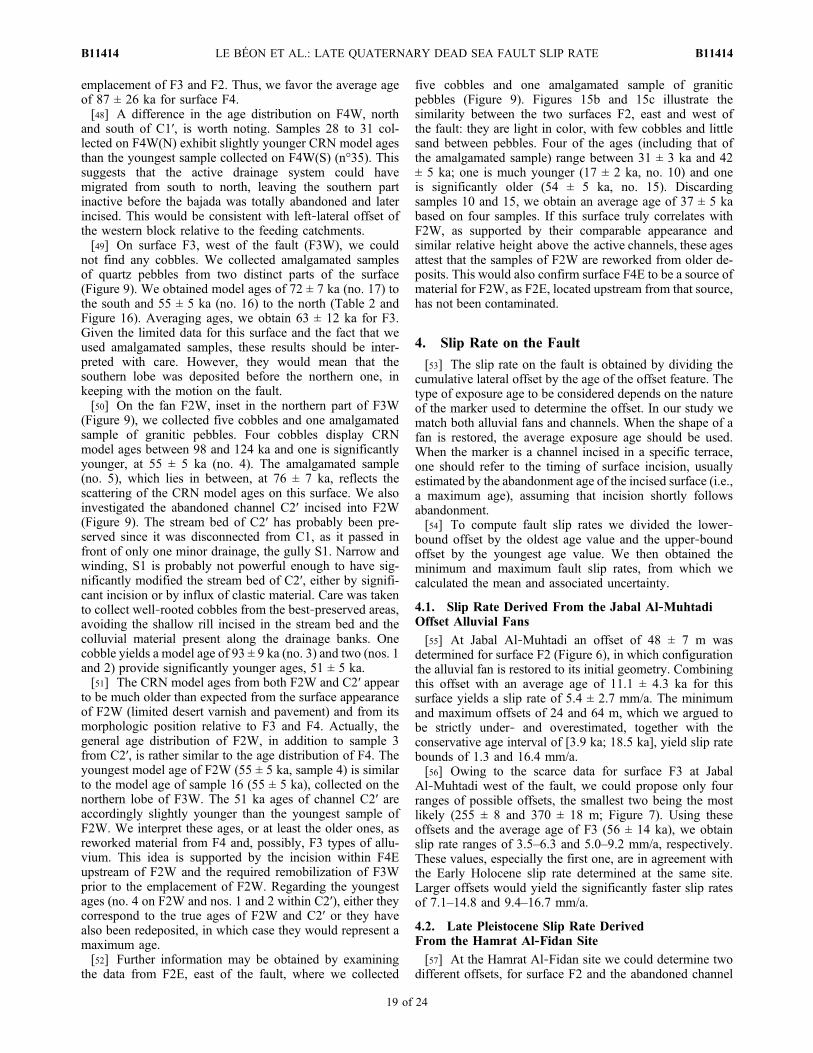
[59] Numerous studies have investigated the slip rate onthe WAF using various tools, such as spatial geodesy, geo-morphology, and geology (Figure 17). All studies mentionedhereafter focus on the same fault segment, allowing directcomparison.[60] On the short time scale of a few years, studies
investigated the present‐day slip rate of the southern DSFbased on GPS measurements. Earliest estimates used con-tinuous data from the Israeli permanent network [Pe’eri et al.,2002; Wdowinski et al., 2004], which has the weakness ofbeing located mostly on one side of the fault. The bestestimate on the WAF is 2.9 ± 1.1 mm/a [Wdowinski et al.,2004]. This result has been improved recently from adenser GPS campaign‐style network distributed on bothsides of the WAF [Le Béon et al., 2008]. This work yieldeda slip rate of 4.9 ± 1.4 mm/a over a 6 year time period, inagreement with regional block models [Reilinger et al.,2006].[61] The Early Holocene slip rate of WAF has been
investigated independently in two studies based on the samesite in the northern Wadi Araba (Figure 1b), where threesuccessive alluvial surfaces and gullies are offset by thefault. Klinger et al. [2000a] and Niemi et al. [2001] providea slip rate of 3.4–6.1 mm/a since ∼15 ka. The slip rate of5.4 ± 2.7 mm/a, which we determined over ∼11 ka in thesouthern Wadi Araba at the Jabal Al‐Muhtadi site, is in verygood agreement with these results. Previous studies at JabalAl‐Muhtadi led to offsets of 540–600 m [Zak and Freund,1966; Galli, 1999], much larger than those proposed here.These studies unfortunately lacked proper dating and ournew data set shows that the alluvial surfaces matched toeach other are actually characterized by different ages.[62] In the northern Wadi Araba, Klinger et al. [2000a]
investigated a Late Pleistocene alluvial fan (Figure 1b),dated between 70 ka and 140 ka using 10Be CRN modelages of chert cobbles and U‐series of overlying Lake Lisandeposits [Klinger et al., 2003]. Restoration of the fan to themouth of the feeding channel provides an offset of 300 to900 m, with a best value of 500 m. The resulting slip ratesrange from 2.1 to 12.9 mm/a, with a best interval of 3.6–7.1 mm/a. At a comparable time scale (87 ± 26 ka), our studyprovides a wide conservative interval of slip rates, from 4.2to 20.1 mm/a, with preferred values of 5.2–10.9 mm/a. Theunion of best intervals proposed by both studies suggeststhat slip rates of 5 to 8 mm/a are more likely.[63] At longer time scales Ginat et al. [1998] obtained a
slip rate of 3–7.5 mm/a since the Pliocene, based on the
Figure 17. Selected slip rates along theWadiAraba segmentof the Dead Sea fault. (1) This study; (2) Le Beon et al.[2008]; (3) Niemi et al. [2001]; (4) Klinger et al. [2000a];(5, 6) various studies based on geological offsets and faultstructure (see text). Dotted lines represent less likely values.Slip rates from these studies yield a mean slip rate of 5.1 ±0.9 mm/a.
LE BÉON ET AL.: LATE QUATERNARY DEAD SEA FAULT SLIP RATE B11414B11414
20 of 24
offset conglomerate of a paleoriver that ran across the WadiAraba and on the offset of undated large alluvial fans withinthe Wadi Araba. Garfunkel [1981] proposed a cumulativeoffset of 35–40 km, later reevaluated at 30 km [Garfunkeland Ben‐Avraham, 2001], by closing the pull‐apart struc-tures of the Dead Sea basin and of the Gulf of Aqaba.Assuming an Early Pliocene age for the Dead Sea basin[Garfunkel and Horowitz, 1966], this reconstruction leads toa slip rate of 6 mm/a since the last 5 Ma. Freund et al.[1968, 1970] reported a 40–45 km offset of numerousMiocene geological formations (7–12 Ma), which yields aslip rate of 3.3–6.4 mm/a. At longer time scales, a cumu-lative offset of 105 km, recorded by Precambrian to LateCretaceous rocks [Dubertret, 1932; Quennell, 1959; Freundet al., 1968, 1970], is generally accepted on the DSF. Yetthe timing of the initiation of the left‐lateral shear remainsdebated. Values of 18–22 Ma have been proposed based onextensive basaltic dykes along the Gulf of Aqaba [e.g.,
Bartov et al., 1980]. This would lead to an average slip rateof 5.3 ± 0.5 mm/a.
5.2. Slip Rate Evolution Through Time on the WadiAraba Fault Segment
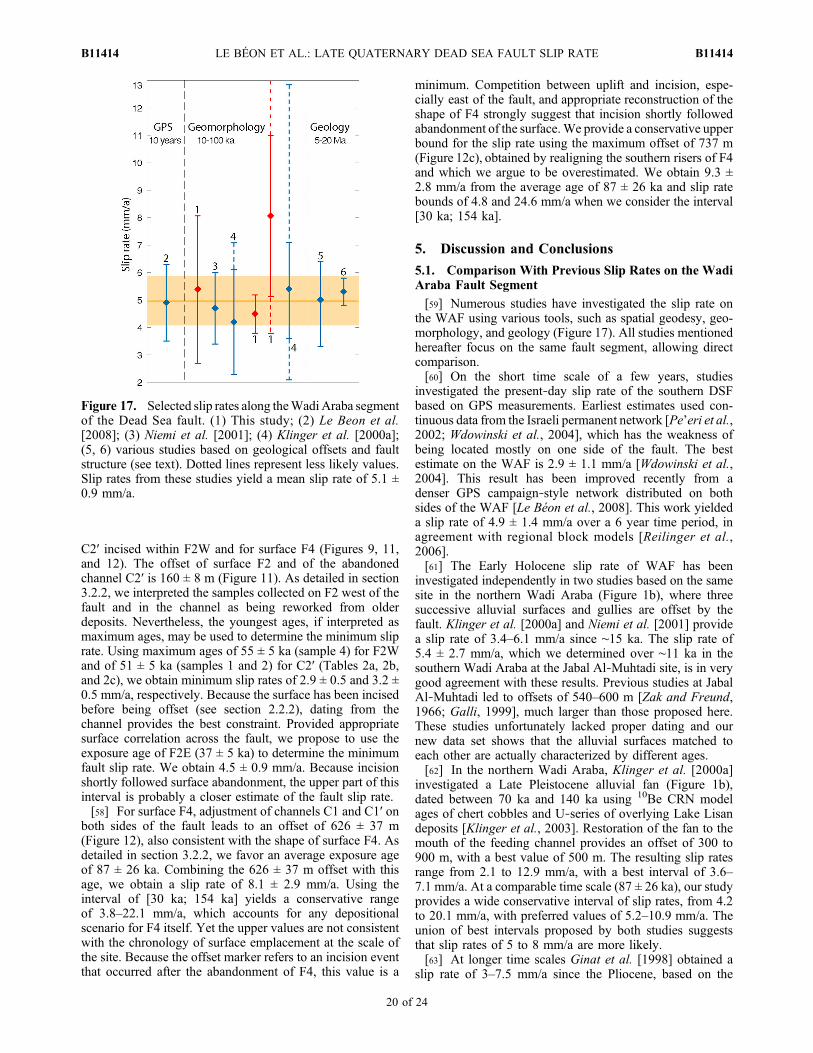
[64] The sites presented in this study provide slip ratesaveraged over three time scales: ∼11, ∼37, and ∼87 ka.Previous studies along the same fault segment of the DeadSea Fault provide slip rates at time scales ranging from afew years to several millions of years (Figure 17), offeringthe possibility to look at fault slip rate evolution throughtime.[65] Good agreement is found among the geodetic slip
rate, the Early Holocene slip rate, and the post‐Oligoceneslip rate along the WAF. The different techniques convergeto an average rate of 5.1 ± 0.9 mm/a (Figure 17). Despitelarger uncertainties, the best intervals proposed for the LatePleistocene slip rate also overlap this value. Figure 18
Figure 18. Possible scenarios of slip rate evolution over time based on offset and age constraints deter-mined in this study. Colored rectangles show the best age and offset constraints. The constraints that wejudged to be less likely are represented by dotted lines. Dark blue dotted trend lines represent lower andupper bounds for the fault slip rate (>3.2 mm/a and <12.7 mm/a, respectively). Dark blue shaded areacorresponds to a constant slip rate. Light blue dashed lines show examples of two possible scenariosof varying slip rate over time (see text). Yellow and green shaded areas represent and geodetic slip rates,respectively.
LE BÉON ET AL.: LATE QUATERNARY DEAD SEA FAULT SLIP RATE B11414B11414
21 of 24
summarizes the Early Holocene and Late Pleistocene datapresented in this study. Our data set may be fit with astraight line, the slope of which corresponds to a constantslip rate of 4.6–5.3 mm/a (Figure 18), similar to the GPS andgeologic slip rates. However, due to the large uncertainty inthe age of the Late Pleistocene geomorphic marker, sce-narios that include temporal variations in fault slip rate arealso possible. In Figure 18 we propose two alternativeexamples; any and all intermediate possibilities would bevalid as well. They show variations by a factor of 2 at thefairly long time scales of ∼30 to ∼50 ka, which wouldrepresent 30 to 50 earthquake cycles, considering the aver-age recurrence interval of large earthquakes observed on thenorthern DSF during the Holocene [Meghraoui et al., 2003;Daëron et al., 2005, 2007]. To summarize, we lack reso-lution to fully resolve the question of temporal variationsversus consistency of the fault slip rate of the WAF. Overall,the geodetic slip rate and slip rates at longer time scales arenot inconsistent with each other, given the uncertainties,which is not the case for all major strike‐slip faults (e.g., theAltyn Tagh Fault in Tibet [Bendick et al., 2000;Mériaux et al.,2004, 2005;Wright et al., 2004; Peltzer et al., 2006; Jolivet etal., 2008]). Millennial‐scale variations cannot be addressedowing to the shortest time window of ∼11 ka of our study.[66] The temporal distribution of large earthquakes on the
Dead Sea Fault may be used as a proxy of the slip rateevolution over time. Hamiel et al. [2009] concluded aconstant fault slip rate based on historical seismicity andpaleoseismological data from indirect records and observa-tions from secondary tectonic features, however. Anexceptional paleoseismic record exists within the LatePleistocene Lisan Lacustrine Formation in the southernDead Sea basin [Marco et al., 1996; Marco and Agnon,2005; Agnon et al., 2006; Begin et al., 2005]. During theperiod 15–70 ka, the distribution of breccia layers related tolocal M ≥ 5.5 earthquakes and of peculiar seismites relatedto local M > 7 earthquakes revealed periods of earthquakeclustering of ∼10 ka followed by periods of relative quies-cence of similar duration; a cluster of nine earthquakesoccurred between 50 and 55 ka. However, interpreting thisrecord as slip rate variations on a particular fault is notstraightforward. First, the source of these events cannot beidentified: any segments from Lebanon to the Gulf of Aqabaare candidates. Second, M5.5–M6 earthquakes are certainlytoo small to produce large displacement on the fault planeand contribute significantly to the slip rate.[67] Along the nearby fault segment of the Jordan Valley
Fault (Figure 1a), north of the Dead Sea, Ferry et al. [2007]observed millennial‐scale variations in fault slip rate duringthe Late Pleistocene. They report slip rate variations from3.5 to 11.0 mm/a at the time scale of 2 ka during theHolocene, which are smoothed when a time window of 4 kais considered, varying from ∼3.5 to ∼6 mm/a. The averageslip rate of ∼4.9 mm/a since 48 ka is in good agreement withthe results obtained south of the Dead Sea. Millennial‐scaleslip rate variations are also suggested along the northernDSF in Syria [Meghraoui et al., 2003]. On the basis of threeearthquakes that occurred during the last 2 ka, the authorsreport a slip rate of 6.9 ± 0.1 mm/a, which is significantlyhigher than the GPS slip rate along the same fault segment(1.8–3.3 mm/a [Alchalbi et al. [2010]) and the Holocene sliprates observed along the southern DSF.
[68] Weldon et al. [2004] also reported secular slip ratevariations by a factor of 3 along the San Andreas Fault, inrelation to earthquake clustering at a time scale of 200 years.These variations involve only a few earthquake cycles.Larger‐scale (≥10 ka) variations in fault slip rate have rarelybeen reported on large strike‐slip faults, with the exceptionof 10–100 ka variations observed along the San AndreasFault system since 1.5 Ma in the specific case of subparallelfault branches [Bennett et al., 2004], along which activitycould switch from one fault to the other. The KarakorumFault, in Tibet, or the North Anatolian Fault, for example,show fairly constant slip rates at time scales of 1 ka toseveral million years [Chevalier et al., 2005; Kozaci et al.,2009]. Regarding the WAF, complex fault interactions canbe ruled out due to its single‐strand geometry. Hence, withinthe limitation of the uncertainties currently available for thedifferent studies, including this work, it seems more likelythat the slip rate is fairly constant along the southern DSFover a period of at least 100 ka.
[69] Acknowledgments. We thank Jérôme Van der Woerd for fruit-ful discussion during this work and Anne‐Claire Laurent‐Morillon for dig-italization of landscape interpretations. Thoughtful reviews by G. Hilleyand an anonymous reviewer helped to improve the manuscript. Financialsupport was provided by the French INSU/CNRS programs DyETI andACI‐FNS “Aléas et changements globaux” and by the French Embassyin Jordan. This is IPGP contribution number 3045.
ReferencesAgnon, A., C. Migowski, and S. Marco (2006), Intraclast breccias inlaminated sequences reviewed: recorders of paleo‐earthquakes, in Newfrontiers in Dead Sea Paleoenvironmental Research: Geological Societyof America Special Paper 401, edited by Y. Enzel et al., pp. 195–214,doi:110.1130/2006.2401(1113).
Alchalbi, A., et al. (2010), Crustal deformation in northwestern Arabiafrom GPS measurements in Syria: Slow slip rate along the northern DeadSea Fault, Geophys. J. Int., 125–135, doi:110.1111/j.1365-1246X.2009.04431.x.
Balco, G., J. O. Stone, N. A. Lifton, and T. Dunai (2008), A completeand easily accessible means of calculating surface exposure ages or ero-sion rates from 10Be and 26Al measurements, Quat. Geochronol., 3,174–195.
Bartov, Y., G. Steinitz, M. Eyal, and Y. Eyal (1980), Sinistral movementalong the Gulf of Aqaba—its age and relation to the opening of theRed Sea, Nature, 285, 220–222.
Begin, Z. B., D. M. Steinberg, G. A. Ichinose, and S. Marco (2005), A40,000 year unchanging seismic regime in the Dead Sea rift, Geology,33(4), 257–260.
Bendick, R., R. Bilham, J. Freymueller, K. Larson, and G. Yin (2000),Geodetic evidence for a low slip rate in the Altyn Tagh fault system,Nature, 404, 69–72.
Bennett, R. A., A. M. Friedrich, and K. P. Furlong (2004), Codependenthistories of the San Andreas and San Jacinto fault zones from inversionof fault displacement rates, Geology, 32(11), 961–964.
Briner, J. P., D. S. Kaufman, W. F. Manley, R. C. Finkel, and M. W. Caffee(2005), Cosmogenic exposure dating of the late Pleistocene moraine stabi-lisation in Alaska, Geol. Soc. Am. Bull., 117, 1108–1120, doi:1110.1130/B25649.25641.
Bull, W. B. (1991), Geomorphic Responses to Climatic Change, OxfordUniversity Press, New York.
Chevalier, M. L., F. J. Ryerson, P. Tapponnier, R. C. Finkel, J. van derWoerd, H. B. Li, and Q. Liu (2005), Slip‐rate measurements on theKarakorum Fault may imply secular variations in fault motion, Science,307, 411–414.
Daëron, M., L. Benedetti, P. Tapponnier, A. Sursock, and R. Finkel (2004),Constraints on the post ∼25‐ka slip rate of the Yammouneh fault(Lebanon) using in‐situ cosmogenic Cl36 dating of offset limestone‐clastfans, Earth Planet. Sci. Lett., 227, 105–119.
Daëron, M., Y. Klinger, P. Tapponnier, A. Elias, E. Jacques, and A. Sursock(2005), Sources of the large AD1202 and 1759 Near East earthquakes,Geology, 53(7), 529–532.
LE BÉON ET AL.: LATE QUATERNARY DEAD SEA FAULT SLIP RATE B11414B11414
22 of 24
Daëron, M., Y. Klinger, P. Tapponnier, A. Elias, E. Jacques, and A. Sursock(2007), 12,000‐year‐long record of 10 to 13 paleo‐earthquakes on theYammoûneh fault (Levant fault system, Lebanon), Bull. Seism. Soc.Am., 97(3), 749–771.
Davis, J. C., I. D. Proctor, J. R. Southon, M. W. Caffee, D. W. Heikkinen,M. L. Roberts, K. W. Turteltaub, D. E. Nelson, D. H. Loyd, and J. S.Vogel (1990), LLNL/UC AMS facility and research program, Nucl.Instrum. Methods Phys. Res. Sect. B, 52, 269–272.
Dubertret, L. (1932), Les formes structurales de la Syrie et de la Palestine,C.R. Acad. Sci. Paris, 195, 65–67.
Elias, A., et al. (2007), Active thrusting offshore Mount Lebanon: sourceof the tsunamigenic A.D. 551 Beirut‐Tripoli earthquake, Geology, 35,755–758, doi:710.1130/G2363A.
Ferry, M., M. Meghraoui, N. Abou Karaki, M. Al‐Taj, H. Amoush, S.Al‐Dhaisat, and M. O. Barjous (2007), A 48‐kyr‐long slip rate historyfor the Jordan Valley segment of the Dead Sea Fault, Earth Planet.Sci. Lett., 260, 394–406.
Finkel, R. C., and M. Suter (1993), AMS in earth sciences: Technique andapplications, Adv. Anal. Geochem., 1, 1–114.
Freund, R., I. Zak, and Z. Garfunkel (1968), Age and rate of the sinistralmovement along the Dead Sea Rift, Nature, 220, 527–538.
Freund, R., Z. Garfunkel, I. Zak, M. Goldberg, T. Weisbrod, and B. Derin(1970), The shear along the Dead Sea rift, Philos. Trans. R. Soc. A, 267,107–130.
Galli, P. (1999), Active tectonics along the Wadi Araba‐Jordan Valleytransform fault, J. Geophys. Res., 104, 2777–2796.
Garfunkel, Z. (1981), Internal structure of the Dead Sea Leaky Transform(rift) in relation to plate kinematics, Tectonophysics, 80, 81–108.
Garfunkel, Z., and Z. Ben‐Avraham (2001), Basins along the Dead SeaTransform, in Peri‐Tethys Memoir 6: Peri‐Tethyan Rift/Wrench Basinsand Passive Margins, Mém. Mus. Natl. Hist. Nat., 186, edited by W. C.P. A. Ziegler, A. H. F. Robertson, and S. Crasquin‐Soleau, pp. 607–627,Mus. Natl. Hist. Nat., Paris, ISBN: 2‐85653‐528‐3.
Garfunkel, Z., and A. Horowitz (1966), The Upper Tertiary and Quaternarymorphology of the Negev, Israel, Isr. J. Earth Sci., 15, 101–117.
Ginat, H., T. Enzel, and Y. Avni (1998), Translocated Plio‐Pleistocenedrainage systems along the Arava fault of the Dead Sea Transform,Tectonophysics, 284, 151–160.
Gosse, J. C., and F. M. Phillips (2001), Terrestrial in situ cosmogenicnuclides: Theory and application, Quat. Sci. Rev., 20, 1475–1560.
Hamiel, Y., R. Amit, Z. B. Begin, S. Marco, O. Katz, A. Salamon,E. Zilberman, and N. Porat (2009), The Seismicity along the Dead SeaFault during the last 60,000 years, Bull. Seismol. Soc. Am., 99, 2020–2026, doi:2010.1785/0120080218.
Hetzel, R., S. Niedermann, S. Ivy‐Ochs, P. W. Kubik, M. Tao, and B. Gao(2002), 21Ne versus 10Be and 26Al exposure ages of fluvial terraces: Theinfluence of crustal Ne in quartz, Earth Planet. Sci. Lett., 201(3–4),575–591.
Jolivet, R., R. Cattin, N. Chamot‐Rooke, C. Lasserre, and G. Peltzer(2008), Thin‐plate modeling of interseismic deformation and asymetryacross the Altyn Tagh fault zone, Geophys. Res. Lett., 35, L02309,doi:10.1029/2007GL031511.
Klinger, Y., J. P. Avouac, N. Abou Karaki, L. Dorbath, D. Bourles, andJ. L. Reyss (2000a), Slip rate on the Dead Sea Transform Fault in north-ern Araba Valley (Jordan), Geophys. J. Int., 142, 755–768.
Klinger, Y., J. P. Avouac, L. Dorbath, N. Abou Karaki, and N. Tisnerat(2000b), Seismic behaviour of the Dead Sea Fault along Araba Valley,Jordan, Geophys. J. Int., 142, 769–782.
Klinger, Y., J.‐P. Avouac, D. Bourles, and N. Tisnerat (2003), Alluvialdeposition and lake‐level fluctuations forced by Late Quaternary climatechange: The Dead Sea case example, Sediment. Geol., 162, 119–139.
Kohl, C. P., and K. Nishiizumi (1992), Chemical isolation of quartzfor measurement of in situ‐produced cosmogenic nuclides, Geochim.Cosmochim. Acta, 56, 3583–3587.
Kozaci, Ö., J. F. Dolan, and R. C. Finkel (2009), A late Holocene slip ratefor the central North Anatolian fault, at Tahtaköprü, Turkey, fromcosmogenic 10Be geochronology: Implications for fault loading andstrain release rates, J. Geophys. Res., 114, B01405, doi:10.1029/2008JB005760.
Lal, D. (1991), Cosmic ray labeling of erosion surfaces: In situ productionrates and erosion models, Earth Planet. Sci. Lett., 104, 424–439.
Le Béon, M. (2008), Cinématique d’un segment de faille décrochante à dif-férentes échelles de temps: La faille du Wadi Araba, segment sud de lafaille transformante du Levant, Ph.D. thesis (in English), 304 pp., Institutde Physique du Globe, Paris.
Le Béon, M., Y. Klinger, A.‐Q. Amrat, A. Agnon, L. Dorbath, G. Baer,J.‐C. Ruegg, O. Charade, and O. Mayyas (2008), Slip rate and locking‐depth from GPS profiles across the southern Dead Sea Transform,J. Geophys. Res., 113, B11403, doi:10.1029/2007JB005280.
Marco, S., and A. Agnon (2005), High‐resolution stratigraphy revealsrepeated earthquake faulting in the Masada Fault Zone, Dead Sea Trans-form, Tectonophysics, 408, 101–112.
Marco, S., M. Stein, A. Agnon, and H. Ron (1996), Long‐term earthquakeclustering: A 50,000‐year paleoseismic record in the Dead Sea Graben,J. Geophys. Res., 101, 6179–6191.
Marco, S., T. Rockwell, A. Heimann, and U. Frieslander (2005), LateHolocene activity of the Dead Sea transform revealed in 3D paleoseismictrenches on the Jordan Gorge segment, Earth Planet. Sci. Lett., 234,189–205.
Matmon, A., O. Simhai, R. Amit, I. Haviv, N. Porat, E. McDonald,L. Benedetti, and R. Finkel (2009), Desert pavement‐coated surfaces inextreme deserts present the longest‐lived landforms on Earth, Geol.Soc. Am. Bull., 121, 688–697, doi:610.1130/B26422.26421.
Meghraoui, M., et al. (2003), Evidence for 830 years of seismic quiescencefrom palaeoseismology, archaeoseismology and historical seismicityalong the Dead Sea Fault in Syria, Earth Planet. Sci. Lett., 210, 35–52.
Meyer, B., P. Tapponnier, L. Bourjot, F. Metivier, Y. Gaudemer, G. Peltzer,G. Shunmin, and C. Zhitai (1998), Crustal thickening in Gansu‐Qinghai,litospherique mantle subduction, and oblique, strike‐slip controlledgrowth of the Tibet plateau, Geophys. J. Int., 135, 1–47.
Mériaux, A.‐S., F. J. Ryerson, P. Tapponnier, J. Van derWoerd, R. C. Finkel,X. Xu, Z. Xu, and M.W. Caffee (2004), Rapid slip along the central AltynTagh Fault: Morphochronologic evidence from Cherchen He and SulamuTagh, J. Geophys. Res., 109, B06401, doi:10.1029/2003JB002558.
Mériaux, A.‐S., K. Sieh, R. C. Finkel, C. M. Rubin, M. H. Taylor, A. J.Meltzner, and F. J. Ryerson (2009), Kinematic behavior of southernAlaska constrained by westward decreasing postglacial slip rates on theDenali Fault, Alaska, J. Geophys. Res., 114, B03404, doi:10.1029/2007JB005053.
Mériaux, A.‐S., et al. (2005), The Aksay segment of the northern AltynTagh fault: Tectonic geomorphology, landscape evolution, and Holoceneslip rate, J. Geophys. Res., 110, B04404, doi:10.1029/2004JB003210.
Niemi, T. M., H. W. Zhang, M. Atallah, and J. B. J. Harrison (2001), LatePleistocene and Holocene slip rate of the northern Wadi Araba fault,Dead Sea Transform, Jordan, J. Seismol., 5, 449–474.
Nishiizumi, K., M. Imamura, M. W. Caffee, J. R. Southon, R. C. Finkel,and J. McAninch (2007), Absolute calibration of 10Be AMS standards,Nucl. Instrum. Methods Phys. Res. Sect. B, 258, 403–413.
Pe’eri, S., S. Wdowinski, A. Shtibelman, N. Bechor, Y. Bock, R. Nikolaidis,and M. van Domselaar (2002), Current plate motion across the Dead SeaFault from three years of continuous GPS monitoring, Geophys. Res.Lett., 29(14), 1697, doi:10.1029/2001GL013879.
Peltzer, G., A. Socquet, C. Lasserre, A. Meriaux, P. Tapponnier, andR. Ryerson (2006), InSAR observations of interseismic strain along thecentral Altyn Tagh fault consistent with Holocene slip rate, Eos Trans.AGU, 87(52), Fall Meet. Suppl., Abstract T21E‐02.
Porat, N., R. Amit, Y. Enzel, E. Zilberman, Y. Avni, H. Ginat, andD. Gluck (2010), Abandonment ages of alluvial landforms in the hyper-arid Negev determined by luminescence, J. Arid. Environ., 74, 861–869,doi:810.1016/j.jaridenv.2009.1010.1018.
Quade, J. (2001), Desert pavements and associated rock varnish in theMojave Desert: How old can they be? Geology, 29(9), 855–858.
Quennell, A. M. (1958), The structural and geomorphic evolution of theDead Sea Rift, Q. J. Geol. S. London, 114, 1–24.
Quennell, A. (1959), Tectonics of the Dead Sea rift, paper presented at Int.Geol. Congr. Mex., XX Session, pp. 385–405.
Rabb’a, I. (1994), The geology of the Al‐Qurayqira (Jabal Hamra Faddan),Map sheet no. 3051 II, Natural Resources Authority of the HashemiteKingdom of Jordan, Amman.
Rashdan, M. (1987), Geological of Wadi Araba and Al‐Aqaba area, Mapsheet nos. 2949‐II and 3049‐III, 1:50;000, Natural Resources Authorityof the Hashemite Kingdom of Jordan, Amman.
Regard, V., O. Bellier, R. Braucher, F. Gasse, D. Bourlès, J. Mercier, J.‐C.Thomas, M. R. Abbassi, E. Shabanian, and S. Soleymani (2006), 10Bedating of alluvial deposits from southeastern Iran (the Hormoz Straitarea), Palaeogeogr., Palaeoclimatol. Palaeoecol., 242, 36–53.
Reilinger, R., et al. (2006), GPS constraints on continental deformation inthe Africa‐Arabia‐Eurasia continental collision zone and implications forthe dynamics of plate interactions, J. Geophys. Res., 111, B05411,doi:10.1029/2005JB004051.
Ritz, J.‐F., R. Vassallo, R. Braucher, E. T. Brown, S. Carretier, andD. Bourles (2006), Using in situ‐produced 10Be to quantify active tec-tonics in the Gurvan Bogd mountain range (Gobi‐Altay, Mongolia),Geol. Soc. Am. Spec. Pap., 415, 87–110.
Ryerson, F. J., P. Tapponnier, R. C. Finkel, A.‐S. Meriaux, J. Van DerWoerd, C. Lasserre, M.‐L. Chevalier, X. Xu, H. Li, and G. C. P. King(2006), Applications of morphochronology to the active tectonics ofTibet, in In Situ‐Produced Cosmogenic Nuclides and Quantification of
LE BÉON ET AL.: LATE QUATERNARY DEAD SEA FAULT SLIP RATE B11414B11414
23 of 24
Geological Processes, Geological Society of America Special Papers,Issue 415, edited by L. L. Siame et al., pp. 61–86, GSA, Denver, Colo.,doi:10.1130/2006.2415(1105).
Stone, J. O. (2000), Air pressure and cosmogenic isotope production,J. Geophys. Res., 105, 23,753–23,759.
Tapponnier, P., F. J. Ryerson, J. Van Der Woerd, A. S. Meriaux, andC. Lasserre (2001), Long‐term slip rates and characteristic slip: keys toactive fault behaviour and earthquake hazard, C. R. Acad. Sci., Ser.IIa, Sci. Terre Planetes Paris, 333, 483–494.
Van der Woerd, J., F. J. Ryerson, P. Tapponnier, Y. Gaudemer, R. Finkel,A. S. Mériaux, M. Caffee, G. Zao, and Q. He (1998), Holocene left slip‐rate determined by cosmogenic surface dating on the Xidatan segment ofthe Kunlun fault (Qinghai, China), Geology, 26, 695–698.
Van der Woerd, J., P. Tapponnier, F. J. Ryerson, A. S. Mériaux, B. Meyer,Y. Gaudemer, R. C. Finkel, M. W. Caffee, G. G. Zhao, and Z. Q. Xu(2002), Uniform postglacial slip‐rate along the central 600 km of theKunlun Fault (Tibet), from Al‐26, Be‐10, and C‐14 dating of riser off-sets, and climatic origin of the regional morphology, Geophys. J. Int.,148, 356–388.
Van der Woerd, J., Y. Klinger, K. Sieh, P. Tapponnier, F. J. Ryerson, andA.‐S. Mériaux (2006), Long‐term slip rate of the southern San AndreasFault from 10Be−26Al surface exposure dating of an offset alluvial fan,J. Geophys. Res., 111, B04407, doi:10.1029/2004JB003559.
Wdowinski, S., Y. Bock, G. Baer, L. Prawirodirdjo, N. Bechor, S. Naaman,R. Knafo, Y. Forrai, and Y. Melzer (2004), GPS measurements of currentcrustal movements along the Dead Sea Fault, J. Geophys. Res., 109,B05403, doi:10.1029/2003JB002640.
Weldon, R., T. Fumal, and G. Biasi (2004), Wrightwood and the earth-quake cycle: What a long recurrence record tells us about how faultswork, GSA Today, 14(9), 4–10.
Wells, S. G., L. D. McFadden, J. Poths, and C. T. Olinger (1995), Cosmo-genic 3He surface‐exposure dating of stone pavements: Implications forlandscape evolution in deserts, Geology, 23(7), 613–616.
Wright, T. J., B. Parsons, P. C. England, and E. J. Fielding (2004), InSARobservations of low slip rates on the major faults of western Tibet,Science, 305, 236–239.
Zak, I., and R. Freund (1966), Recent strike slip movements along the DeadSea Rift, Isr. J. Earth Sci., 15, 33–37.
M. Al‐Qaryouti and O. Mayyas, Geology Department, AmericanUniversity of Beirut, Beirut, Lebanon.A. Elias, Geology Department, American University of Beirut, Riad
el Solh, Beirut 1107‐2020, Lebanon.R. C. Finkel, EPS Department, University of California Berkeley,
Berkeley, CA 94720, USA.Y. Klinger, Equipe de Tectonique, Institut de Physique du Globe de
Paris, CNRS, 4 Place Jussieu, Box 89, F‐75252 Paris Cedex 05, France.([email protected])M. Le Béon, Department of Geosciences, National Taiwan University,
1 Roosevelt Rd. Sec. 4, 10617 Taipe, Taiwan.A.‐S. Mériaux, School of Geography, Politics and Sociology, Newcastle
University, Newcastle upon Tyne NE1 7RU, UK.F. J. Ryerson, Institute of Geophysics and Planetary Physics, Lawrence
Livermore National Laboratory, Livermore, CA 94550, USA.P. Tapponnier, Earth Observatory of Singapore, Nanyang Technological
University, 50 Nanyang Ave., Block N2‐01a‐15, Singapore 639798.
LE BÉON ET AL.: LATE QUATERNARY DEAD SEA FAULT SLIP RATE B11414B11414
24 of 24
Related Documents