ENCANA CORPORATION Eagle Ford Eric T. Greager Vice-President & General Manager, Western Operating Area

Welcome message from author
This document is posted to help you gain knowledge. Please leave a comment to let me know what you think about it! Share it to your friends and learn new things together.
Transcript
ENCANA CORPORATION
Eagle Ford
Eric T. GreagerVice-President & General Manager, Western Operating Area
2
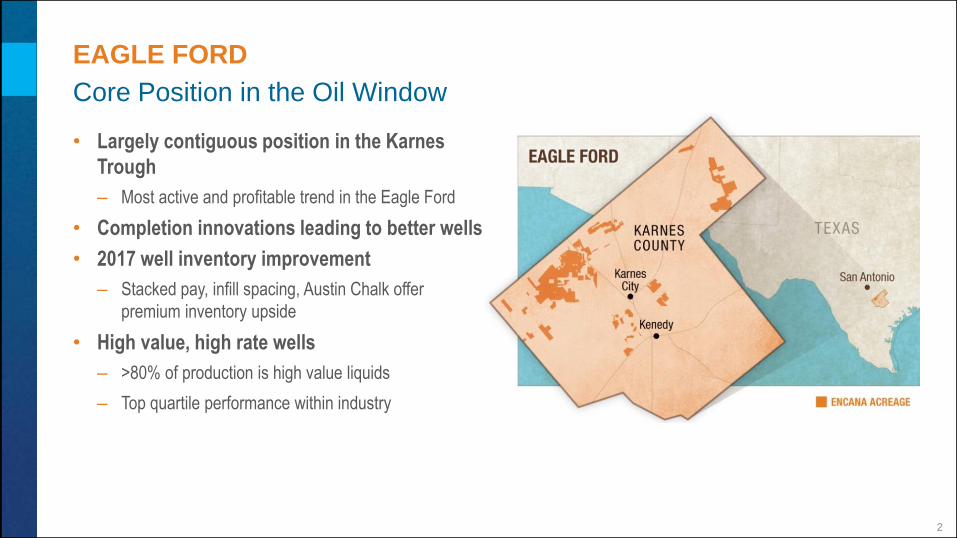
EAGLE FORD
Core Position in the Oil Window
• Largely contiguous position in the Karnes
Trough
– Most active and profitable trend in the Eagle Ford
• Completion innovations leading to better wells
• 2017 well inventory improvement
– Stacked pay, infill spacing, Austin Chalk offer
premium inventory upside
• High value, high rate wells
– >80% of production is high value liquids
– Top quartile performance within industry

3
LEADING OPERATOR
Top Karnes County Producers
0
20
40
60
80
MRO EOG ECA COP PXD MUR DVN
Gro
ss O
pera
ted
Oil
Pro
du
cti
on
(M
bb
ls/d
)
*Data sourced from Drilling Info, Inc. Gross operated production in April, 2017, for Karnes County, TX.
Eagle FordGross Encana Production vs Peers*

4
WELL PRODUCTIVITY
Top Performance vs Peers
Data sourced from IHS, Inc. Includes all data from August 2016 onward. Peers include DVN, COP, EOG, MRO, MUR, COG, CRZO, NBL, EPE, CHK, STO, SN and SM
• Leading well performance in the play since moving to advanced completions
– Driving best in class production efficiency in the Eagle Ford
0
50
100
150
200
Encana Peer 1 Peer 2 Peer 3 Peer 4 Peer 5 Peer 6 Peer 7 Peer 8 Peer 9 Peer 10 Peer 11 Peer 12 Peer 13
Oil P
rod
ucti
on
IP
180/1
,000ft
(b
bls
/d)
5
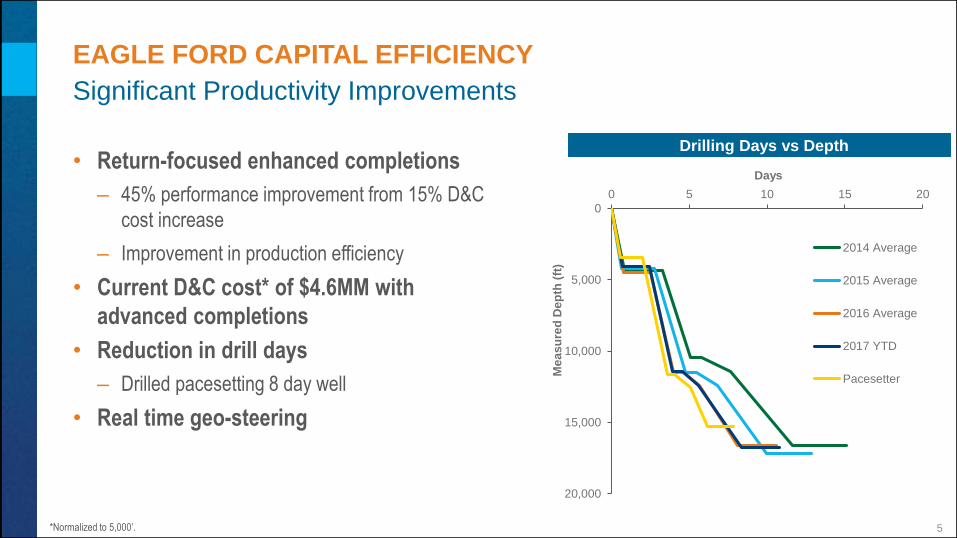
EAGLE FORD CAPITAL EFFICIENCY
Significant Productivity Improvements
*Normalized to 5,000’.
• Return-focused enhanced completions
– 45% performance improvement from 15% D&C
cost increase
– Improvement in production efficiency
• Current D&C cost* of $4.6MM with
advanced completions
• Reduction in drill days
– Drilled pacesetting 8 day well
• Real time geo-steering
Drilling Days vs Depth
0
5,000
10,000
15,000
20,000
0 5 10 15 20
Me
as
ure
d D
ep
th (
ft)
Days
2014 Average
2015 Average
2016 Average
2017 YTD
Pacesetter
6
0
50
100
150
200
250
300
0 30 60 90 120 150 180
Cu
mu
lati
ve P
rod
ucti
on
(M
BO
E)
Days on Production
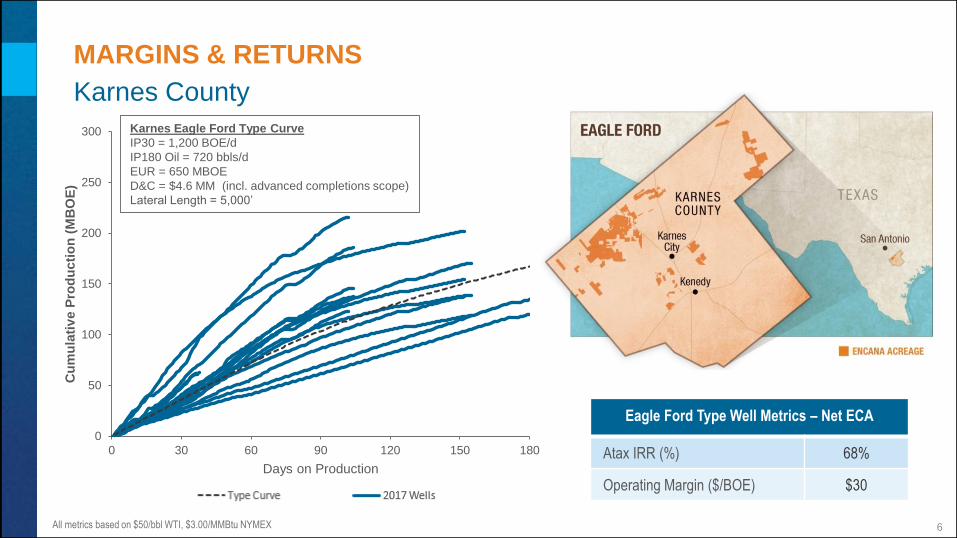
MARGINS & RETURNS
Eagle Ford Type Well Metrics – Net ECA
Atax IRR (%) 68%
Operating Margin ($/BOE) $30
All metrics based on $50/bbl WTI, $3.00/MMBtu NYMEX
Karnes County
Karnes Eagle Ford Type Curve
IP30 = 1,200 BOE/d
IP180 Oil = 720 bbls/d
EUR = 650 MBOE
D&C = $4.6 MM (incl. advanced completions scope)
Lateral Length = 5,000’

7
INNOVATION SUCCESS - FRAC COMPLEXITY
Thinner Fluids & Tighter Clusters
Early completions
× Bypassed pay
Parameters
• >60’ Clusters
• High Viscosity Fluid
Tight spacing
× Stress shadowing
× Overwhelmed interior
clusters
Parameters
• 25’ Clusters
• High Viscosity Fluid
Complex system
✓ Many thin propped
fractures
Parameters
• <20’ Clusters
• Low Viscosity Fluid
P A S T P R E S E N T
Fracture Complexity Leads to Improved Performance
Completions
Parameter
Historical
Standard
ECA Design
Complex
Fracture
Cluster Spacing (ft) >60 <20
Proppant (lbs/ft) <1,000 >2,000
Fluid System Viscosity High Low
7
0
100
200
300
400
0 100 200 300Cu
mu
lati
ve
Pro
du
cti
on
(M
BO
E)
Producing Days
Past Present
8
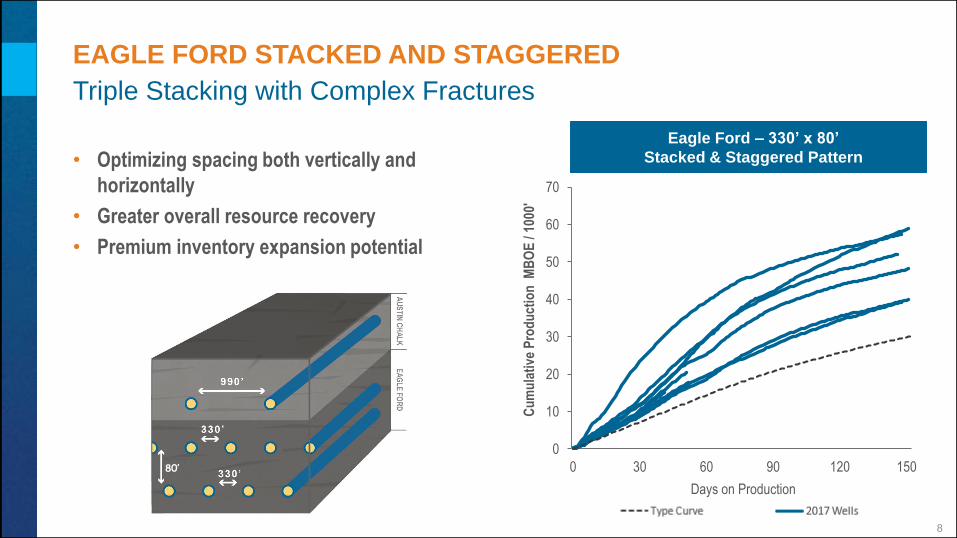
EAGLE FORD STACKED AND STAGGERED
Triple Stacking with Complex Fractures
• Optimizing spacing both vertically and
horizontally
• Greater overall resource recovery
• Premium inventory expansion potential
Eagle Ford – 330’ x 80’
Stacked & Staggered Pattern
0
10
20
30
40
50
60
70
0 30 60 90 120 150
Cu
mu
lati
ve P
rod
uct
ion
MB
OE
/ 10
00'
Days on Production
6H4H2H1H
80’
9
0
50
100
150
200
250
300
350
400
0 30 60 90 120 150 180
Cu
mu
lati
ve
Pro
du
cti
on
(M
BO
E)
Days on Production
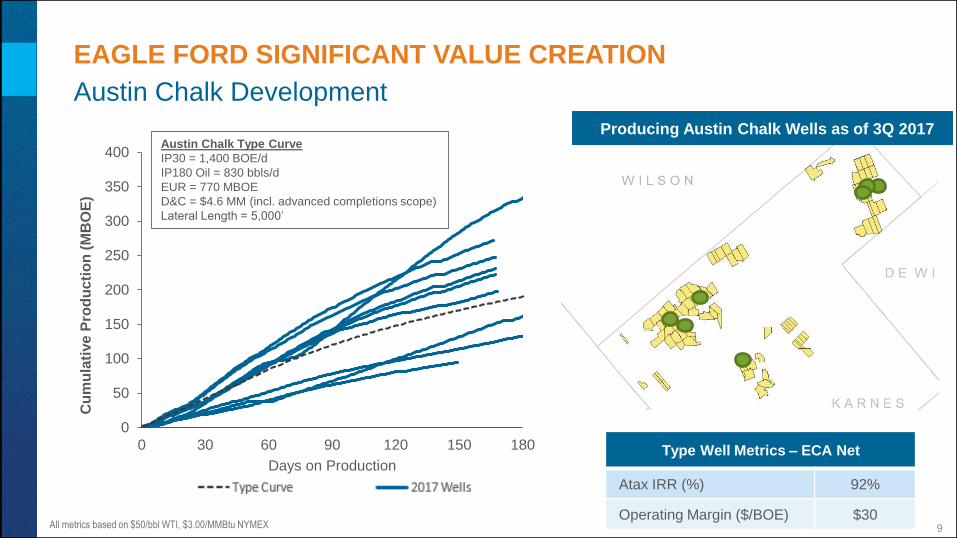
EAGLE FORD SIGNIFICANT VALUE CREATION
Austin Chalk Development
Austin Chalk Type Curve
IP30 = 1,400 BOE/d
IP180 Oil = 830 bbls/d
EUR = 770 MBOE
D&C = $4.6 MM (incl. advanced completions scope)
Lateral Length = 5,000’
Type Well Metrics – ECA Net
Atax IRR (%) 92%
Operating Margin ($/BOE) $30
Producing Austin Chalk Wells as of 3Q 2017
All metrics based on $50/bbl WTI, $3.00/MMBtu NYMEX

10
EXPANDING MARGINS
Reducing Operating Costs
Eagle Ford Direct Operating Cost
Reductions
$4
$5
$6
$7
$8
$9
$10
2015 2016 2017F
$/BOE
• Leveraging company-wide effort
• Optimized repairs, maintenance, and workovers
– Shifting work in-house
• Supply management gains
– Lower costs on chemicals, water hauling
• Improved artificial lift performance
~20%Improvement in
operating costs

11
Eagle Ford
MIDSTREAM AND MARKETING OVERVIEW
• Firm gas gathering and NGL processing
aligned with asset development program
• Infield gathering and extensive market
assets in place to ensure flow and
downstream connectivity
• Diverse physical marketing portfolio with
access to Gulf Coast refining markets
• Proximity to market minimizes
transportation cost and related
commitments while maximizing margins
Houston
Corpus Christi
Three Rivers
Close proximity to market and
well-developed infrastructure
Eagle Ford

12
ENCANA EAGLE FORD
Massive Value Creation
• ~50,000 BOE/d expected through the
5-year plan
• Free cash flow generator
• Focus on continuing to increase
returns by driving capital productivity
and margins

13
SAN JUAN BASIN
Evaluating Liquids Growth Potential
• 2017 operation highlights
– 6 well program
– 6,100’ average completed lateral length
• Evaluation Program
– Target best rock
– Advanced completion design
– Well spacing trial
– Stacked pay potential
2017 program2017 program
Related Documents