Center for Enterprise and Society (CES) University of Liberal Arts Bangladesh (ULAB) SHOPPER SURVEY ON E-COMMERCE IN BANGLADESH PERCEPTION, DEMAND & USAGE TRENDS Sajid Amit Ahmed S. Ishtiaque Abdul Baten Adib Sarwar

Welcome message from author
This document is posted to help you gain knowledge. Please leave a comment to let me know what you think about it! Share it to your friends and learn new things together.
Transcript
Center for Enterprise and Society (CES)University of Liberal Arts Bangladesh (ULAB)
SHOPPER SURVEY ON E-COMMERCE IN BANGLADESHPERCEPTION, DEMAND & USAGE TRENDS
Sajid Amit Ahmed S. Ishtiaque Abdul Baten Adib Sarwar
Shopper Survey on E-Commerce in Bangladesh
1
SURVEY REPORT
Shopper Survey on E-Commerce in Bangladesh:Perception, Demand & Usage Trends
November 29, 2016
Center for Enterprise and Society (CES)University of Liberal Arts Bangladesh (ULAB)
Shopper Survey on E-Commerce in Bangladesh
2
Introduction to Center for Enterprise and Society
The Center for Enterprise and Society (CES) at the University of Liberal Arts (ULAB) is Bangladesh’s first university-based research center dedicated to conducting research on entrepreneurship and business with a view towards ethical, environmental and social sustainability.
The mission of CES is to produce high-quality research and knowledge in order to bridge the theoretical and empirical interface between enterprises and society. Its vision is to enable an entrepreneurial society in Bangladesh, built on ethical foundations.
CES has a staff of full-time, part-time and affiliated researchers with deep experience in private sector research in industries such as financial services, consumer goods, energy and power, pharmaceuticals, textiles, leather, transportation, infrastructure, real estate, light engineering, information technology, and e-commerce. The Center’s research staff are also experienced in development sector research in areas such as skill development, financial inclusion, governance, regulatory reform, human rights, water sanitation and hygiene (WASH), health, and social enterprises.
With regard to capabilities, CES has a strong track record of economic research, policy research, social research, and survey research using both qualitative and quantitative techniques. Our survey research abilities are built on the deep experience of our staff in this field, many of whom have garnered research experience in leading global and Bangladesh-based universities and research organizations before joining CES.
Shopper Survey on E-Commerce in Bangladesh
3
Table of Contents
List of Tables 4
List of Graphs 5
EXECUTIVE SUMMARY 6
BACKGROUND & METHODOLOGY 8
SURVEY FINDINGS 9
Knowledge and Awareness 9
Technology Access & Usage 10
Buyer Behavior 12
Service Quality: Perceptions 15
Delivery/Communication Medium 22
Customer Satisfaction 23
RECOMMENDATIONS 26
Shopper Survey on E-Commerce in Bangladesh
4
List of Tables
Table 1 : Knowledge on E-commerce 9
Table 2 : Browsing Time by Location 11
Table 3 : Device Usage by Location 12
Table 4 : Frequency of Online Purchase 13
Table 5 : Products Bought Online 15
Table 6 : Frequency of Receiving After-sales Service 21
Table 7 : Timeliness of Product Delivery 22
Table 8 : Overall Satisfaction 23
Table 9 : Satisfaction across Parameters 24
Table 10 : Steps taken after facing Fraud 25
Shopper Survey on E-Commerce in Bangladesh
5
List of Graphs
Graph 1 : Level of Knowledge across Age Groups 10
Graph 2 : Access to Internet 11
Graph 3 : Preference between Malls and Online 12
Graph 4 : Frequency of Visits 13
Graph 5 : Days when Most Purchases Are Made 14
Graph 6 : Transaction Size Distribution 14
Graph 7 : Reasons for E-commerce Purchases 15
Graph 8 : FB & Website Use Comparison across High-usage Groups 16
Graph 9 : Ease of Navigation 16
Graph 10 : Product Availability Online 17
Graph 11 : Ease of Ordering 17
Graph 12 : Incidence of Requiring Customer Support 18
Graph 13 : Customer Support Demand by Income Group 18
Graph 14 : Incidence of Receiving Customer Service 19
Graph 15 : Frequency of Revisiting E-commerce Sites 19
Graph 16 : Likelihood of Clicking on Advertised Websites 20
Graph 17 : Likelihood of Finding the Right Product on the Advertised Site 21
Graph 18 : Incidence of Providing Customer Feedback 22
Graph 19 : Satisfaction with Delivery Charges 23
Graph 20 : Satisfaction with Product Bought 24
Graph 21 : Likelihood of Recommending Online Shopping 25
Shopper Survey on E-Commerce in Bangladesh
6
EXECUTIVE SUMMARY
In light of the exciting growth prospects of e-commerce in Bangladesh, the Center for Enterprise & Society (CES) conducted a research study to assess the existing state of perceptions, usage trends and demand among retail shoppers in Bangladesh. Select findings are as follows:
� About half the shopper respondents surveyed (49.3%) said that they possessed either somewhat high or very high level of knowledge on e-commerce. This is an encouraging statistic and even though the depth of this knowledge can be questioned, it points to very successful marketing efforts by the e-commerce industry in Bangladesh.
• Majority of the respondents (72.0%) go online using their or their family members’ mobile phone 3G connections rather than WiFi connections. Respondents in the age groups 19-24 and 25-40 spend the highest amount of time online. Respondents at Dhanmondi malls spend more time online than respondents in Uttara, Mirpur or Gulshan.
• Regarding device usage, level of education does not have a significant correlation with using mobile phones as the device of choice for browsing the web. However, income does have a correlation with laptops as a choice of device with which to browse the web.
• There appears to be a preference to shopping at malls rather than shopping online. When asked to compare, a higher percentage preferred shopping at malls rather than online.
• About 70.8% of respondents visit e-commerce sits between 1 to 5 times a month. Higher income groups and Dhanmondi respondents are the most likely to visit e-commerce sites compared to respondents in other locations. Moreover, 69.3% respondents reported to purchasing products online 1-2 times a month. It appears to be the case that the ratio of purchases to visits is relatively high for Bangladeshi e-commerce customers.
• Transaction sizes for e-commerce purchases are still relatively small. About 70.5% of e-commerce users spend less BDT 5,000 a month.
• Facebook-based e-commerce, otherwise known as F-commerce, has considerable momentum and potential in Bangladesh. About 29.3% reported using a website compared to 43.5% who said they used a Facebook Page for purchasing products online.
• Ease of navigation of online/FB sites, product availability, ease of ordering, customer support feedback point to areas of intervention and attention from e-commerce entrepreneurs. Among these parameters, product availability (44.0% reporting products are usually or always available) and frequency of receiving customer
Shopper Survey on E-Commerce in Bangladesh
7
service when sought (less than 25%) merit closer attention. The latter could be a perception problem but is an aspect of service that can hinder or promote business growth in the long-run.
• Re-visits and purchasing during re-visits did not generate sufficiently high statistics for e-commerce shoppers. It is possible that more needs to be done to render e-commerce sites more attractive to potential customers. However, digital marketing appears to be effective as a quarter of respondents click on websites advertised, which is high for online advertisements.
• Customers are generally satisfied with delivery charges. However, time taken to deliver appears to be another area for improvement. This is of course difficult given challenges to urban life in Bangladesh such as traffic jams.
• In terms of overall satisfaction, slightly less than half the respondents report to being either satisfied or very satisfied. A silver lining is that very few respondents (16%) reported to instances of encountering fraud. This is important as e-commerce and virtual transactions are inherently trust-based, particularly in a country like Bangladesh, with relatively low levels of IT and financial literacy.
Shopper Survey on E-Commerce in Bangladesh
8
BACKGROUND & METHODOLOGY
With recent growth of Internet usage, 3G roll-out in 2013, and the vigorous marketing and sales of smart phones, e-commerce usage continues at a rapid pace. Businesses have realized that Bangladeshis are quite enthusiastic about technology and at the same time, avid shoppers. However, with the numerous barriers to urban life in Dhaka city, citizens have increasingly resorted to online shopping, with an increasing supply of virtual businesses to match.
In light of the exciting growth prospects of e-commerce, the Center for Enterprise & Society (CES) conducted a research study to assess the existing state of perceptions, usage trends and demand among retail shoppers in Bangladesh. The survey was conducted among shoppers who purchase physically at malls. The concept behind conducted a shopper survey was to consider the most high-potential customers as respondents and to understand their buying behavior and expectations. This is in line with global surveys conducted by Nielsen, USNEWS, and McKinsey & Company.
The objective of the study was to arrive at data regarding customers’ perception, demand & usage, and strengths and weaknesses of the e-commerce sector.
The study deployed quantitative and qualitative survey techniques.
• The quantitative component consisted of 400 interviews of shoppers at 4 different locations of Dhaka city: Dhanmondi, Mirpur, Uttara & Gulshan. The sample size of 400 corresponds to 95% confidence interval and 4.8% error margin, which is acceptable.
• With regard to the qualitative survey component, Key-Informant Interviews (KIIs) were conducted with 15 industry experts representing various members of the E-Commerce Association of Bangladesh (ECAB).
• The field team was trained by CES staff regarding survey ethics and protocols as well as on effective comprehension and usage of the data collection tools
• Field Supervisors were deployed to ensure completion and accuracy of data collection.
• A team of data entry operators supervised by CES staff ensured accuracy of data entry.
• Data analysis and report generation were conducted by CES full-time researchers.
• The timeline for this research project spanned about 3.0 months notwithstanding the writing and publication of this report.
Shopper Survey on E-Commerce in Bangladesh
9
SURVEY FINDINGS
Knowledge and Awareness
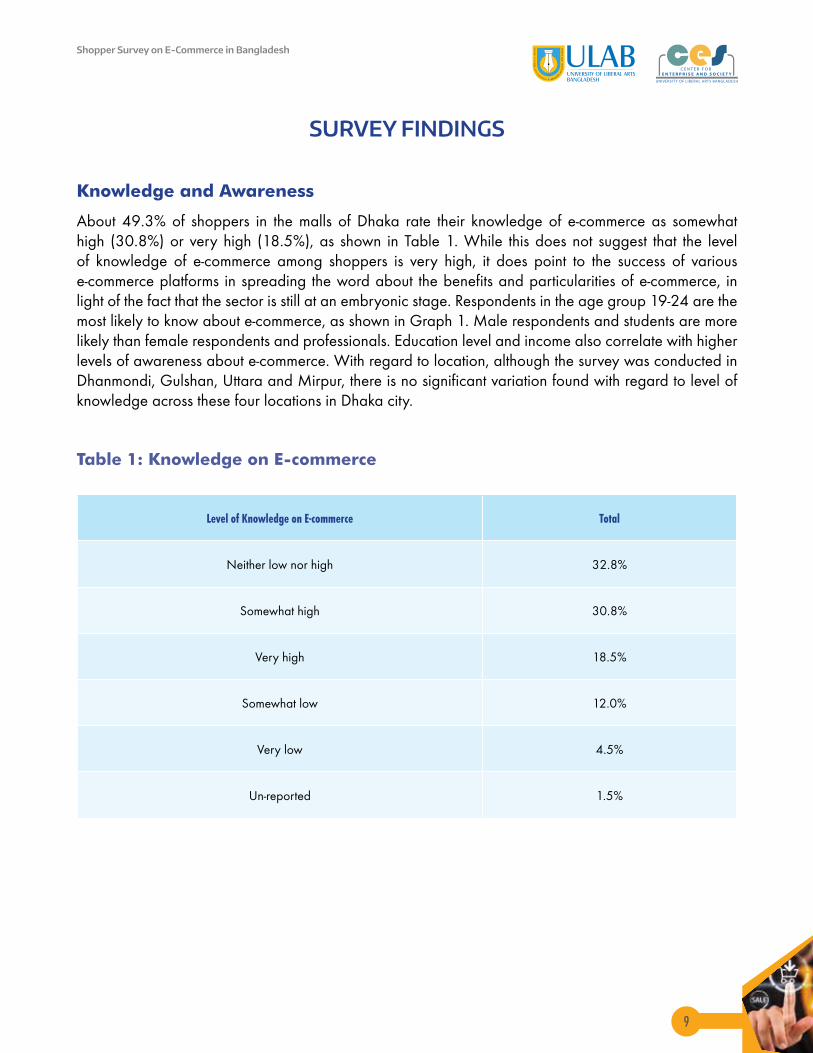
About 49.3% of shoppers in the malls of Dhaka rate their knowledge of e-commerce as somewhat high (30.8%) or very high (18.5%), as shown in Table 1. While this does not suggest that the level of knowledge of e-commerce among shoppers is very high, it does point to the success of various e-commerce platforms in spreading the word about the benefits and particularities of e-commerce, in light of the fact that the sector is still at an embryonic stage. Respondents in the age group 19-24 are the most likely to know about e-commerce, as shown in Graph 1. Male respondents and students are more likely than female respondents and professionals. Education level and income also correlate with higher levels of awareness about e-commerce. With regard to location, although the survey was conducted in Dhanmondi, Gulshan, Uttara and Mirpur, there is no significant variation found with regard to level of knowledge across these four locations in Dhaka city.
Table 1: Knowledge on E-commerce
Level of Knowledge on E-commerce Total
Neither low nor high 32.8%
Somewhat high 30.8%
Very high 18.5%
Somewhat low 12.0%
Very low 4.5%
Un-reported 1.5%
Shopper Survey on E-Commerce in Bangladesh
10
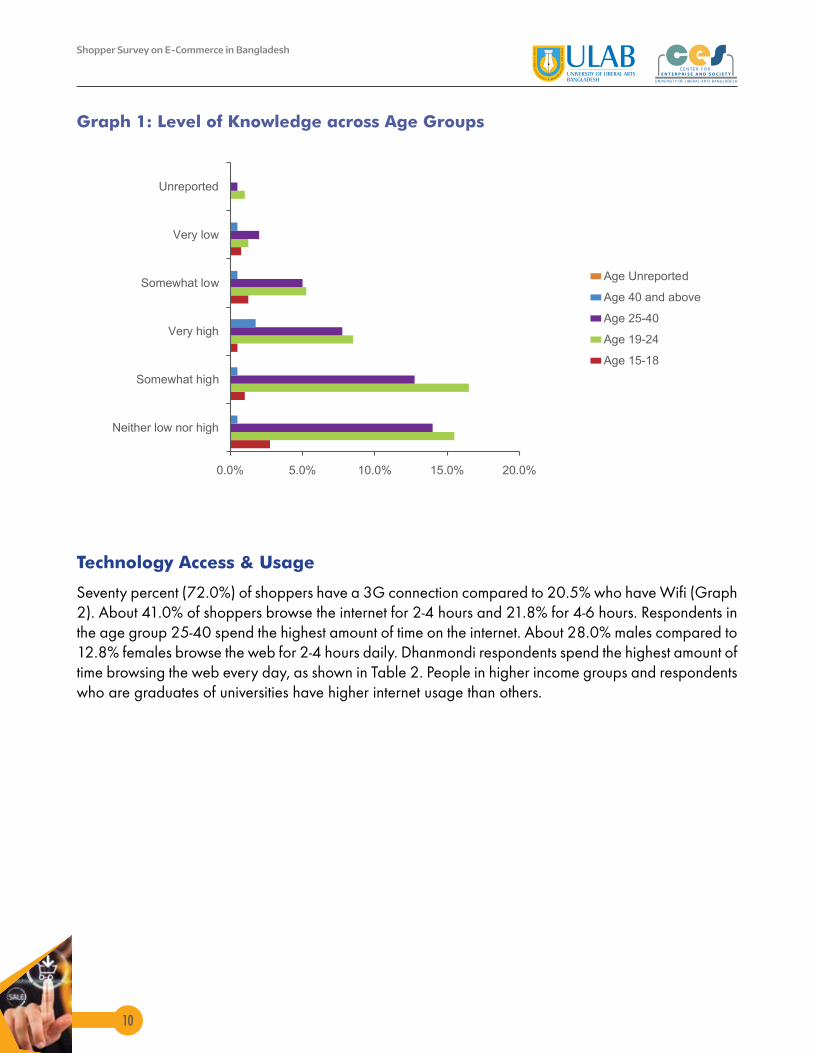
Graph 1: Level of Knowledge across Age Groups
0.0% 5.0% 10.0% 15.0% 20.0%
Neither low nor high
Somewhat high
Very high
Somewhat low
Very low
Unreported
Age Unreported
Age 40 and above
Age 25-40
Age 19-24
Age 15-18
Technology Access & Usage
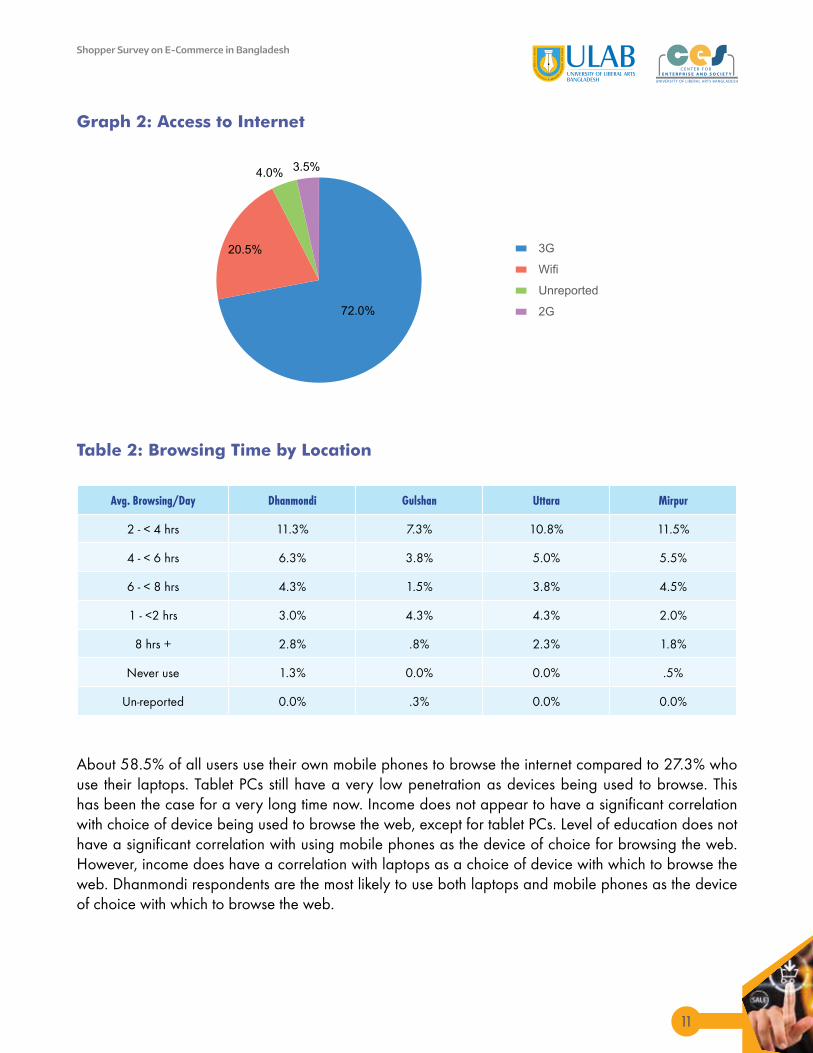
Seventy percent (72.0%) of shoppers have a 3G connection compared to 20.5% who have Wifi (Graph 2). About 41.0% of shoppers browse the internet for 2-4 hours and 21.8% for 4-6 hours. Respondents in the age group 25-40 spend the highest amount of time on the internet. About 28.0% males compared to 12.8% females browse the web for 2-4 hours daily. Dhanmondi respondents spend the highest amount of time browsing the web every day, as shown in Table 2. People in higher income groups and respondents who are graduates of universities have higher internet usage than others.
Shopper Survey on E-Commerce in Bangladesh
11
Graph 2: Access to Internet
72.0%
20.5%
4.0% 3.5%
3G
Wifi
Unreported
2G
Table 2: Browsing Time by Location
Avg. Browsing/Day Dhanmondi Gulshan Uttara Mirpur
2 - < 4 hrs 11.3% 7.3% 10.8% 11.5%
4 - < 6 hrs 6.3% 3.8% 5.0% 5.5%
6 - < 8 hrs 4.3% 1.5% 3.8% 4.5%
1 - <2 hrs 3.0% 4.3% 4.3% 2.0%
8 hrs + 2.8% .8% 2.3% 1.8%
Never use 1.3% 0.0% 0.0% .5%
Un-reported 0.0% .3% 0.0% 0.0%
About 58.5% of all users use their own mobile phones to browse the internet compared to 27.3% who use their laptops. Tablet PCs still have a very low penetration as devices being used to browse. This has been the case for a very long time now. Income does not appear to have a significant correlation with choice of device being used to browse the web, except for tablet PCs. Level of education does not have a significant correlation with using mobile phones as the device of choice for browsing the web. However, income does have a correlation with laptops as a choice of device with which to browse the web. Dhanmondi respondents are the most likely to use both laptops and mobile phones as the device of choice with which to browse the web.
Shopper Survey on E-Commerce in Bangladesh
12
Table 3: Device Usage by Location
Device Dhanmondi Gulshan Uttara Mirpur Unreported
Mobile Phone
18.5% 10.0% 14.0% 14.8% 1.3%
Laptop 8.0% 5.8% 8.0% 5.5% 0.0%
PC .5% 1.3% 2.8% 5.3% .3%
Unreported 1.5% .5% 0.0% .3% 0.0%
Tab .3% .3% 1.3% 0.0% .3%
Buyer Behavior
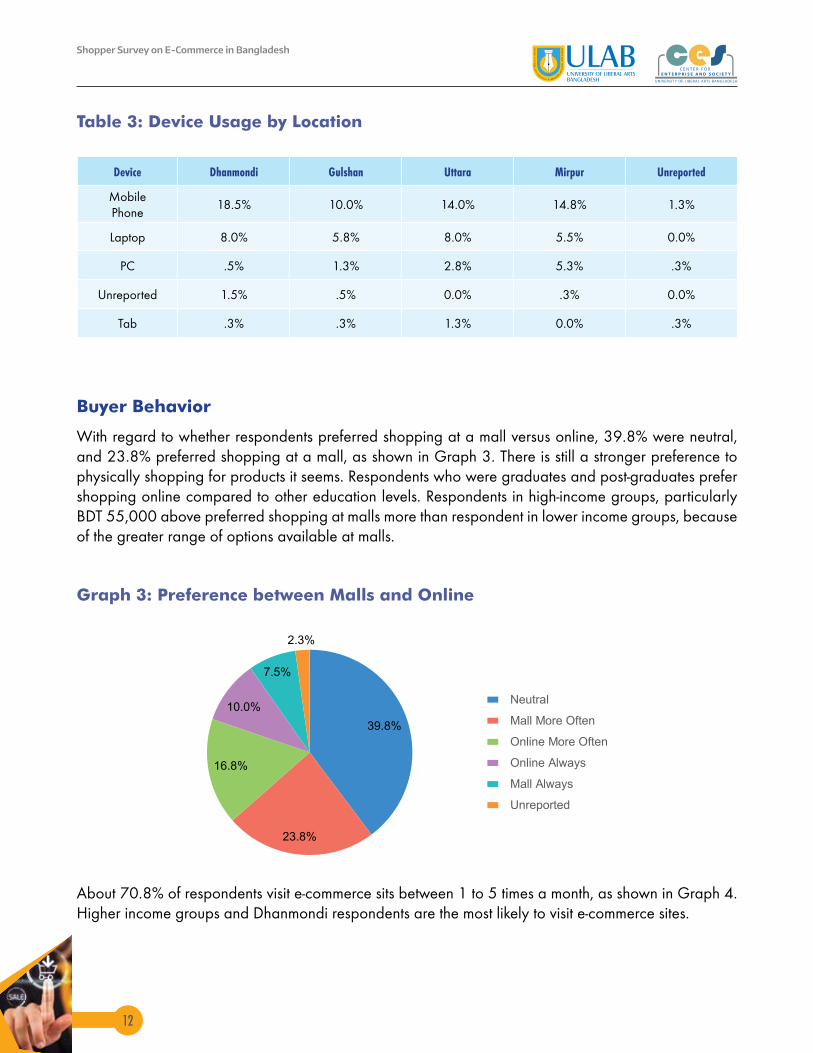
With regard to whether respondents preferred shopping at a mall versus online, 39.8% were neutral, and 23.8% preferred shopping at a mall, as shown in Graph 3. There is still a stronger preference to physically shopping for products it seems. Respondents who were graduates and post-graduates prefer shopping online compared to other education levels. Respondents in high-income groups, particularly BDT 55,000 above preferred shopping at malls more than respondent in lower income groups, because of the greater range of options available at malls.
Graph 3: Preference between Malls and Online
39.8%
23.8%
16.8%
10.0%
7.5%
2.3%
Neutral
Mall More Often
Online More Often
Online Always
Mall Always
Unreported
About 70.8% of respondents visit e-commerce sits between 1 to 5 times a month, as shown in Graph 4. Higher income groups and Dhanmondi respondents are the most likely to visit e-commerce sites.
Shopper Survey on E-Commerce in Bangladesh
13
Graph 4: Frequency of Visits
46.3%
24.5%
11.5%
11.5%
4.3% 2.0%
1-2 times a month
3-5 times a month
6-10 times a month
More than times a month
Never
Unreported
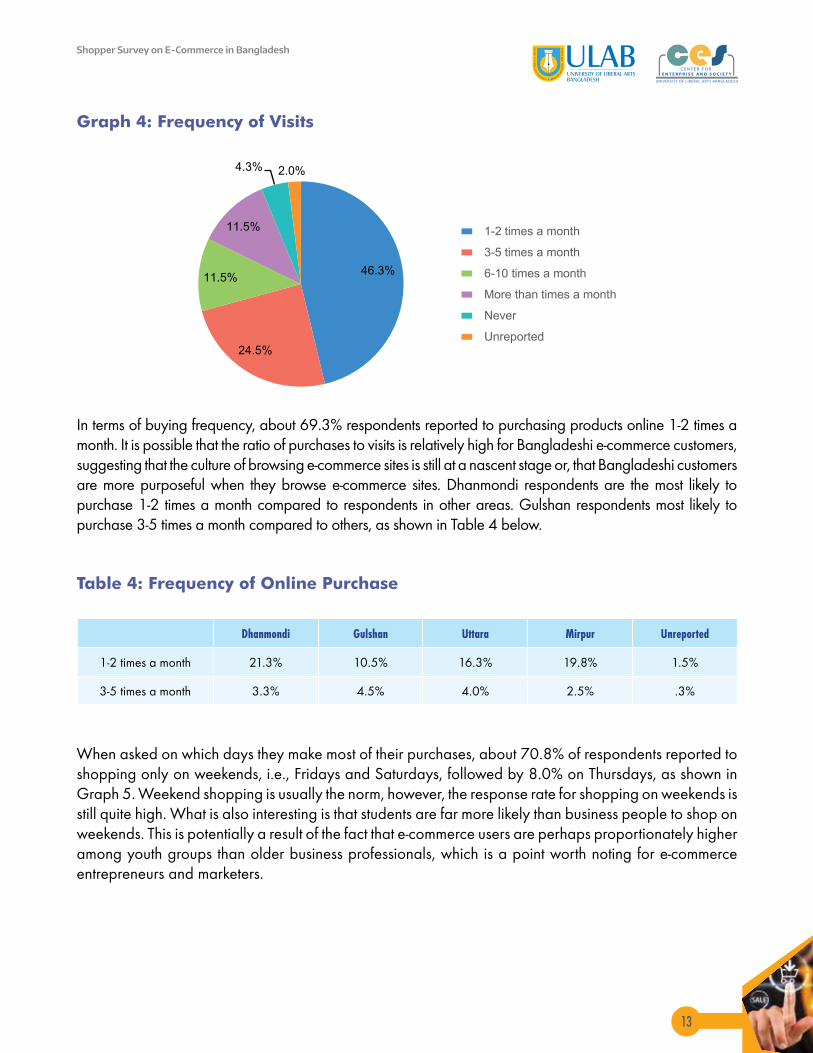
In terms of buying frequency, about 69.3% respondents reported to purchasing products online 1-2 times a month. It is possible that the ratio of purchases to visits is relatively high for Bangladeshi e-commerce customers, suggesting that the culture of browsing e-commerce sites is still at a nascent stage or, that Bangladeshi customers are more purposeful when they browse e-commerce sites. Dhanmondi respondents are the most likely to purchase 1-2 times a month compared to respondents in other areas. Gulshan respondents most likely to purchase 3-5 times a month compared to others, as shown in Table 4 below.
Table 4: Frequency of Online Purchase
Dhanmondi Gulshan Uttara Mirpur Unreported
1-2 times a month 21.3% 10.5% 16.3% 19.8% 1.5%
3-5 times a month 3.3% 4.5% 4.0% 2.5% .3%
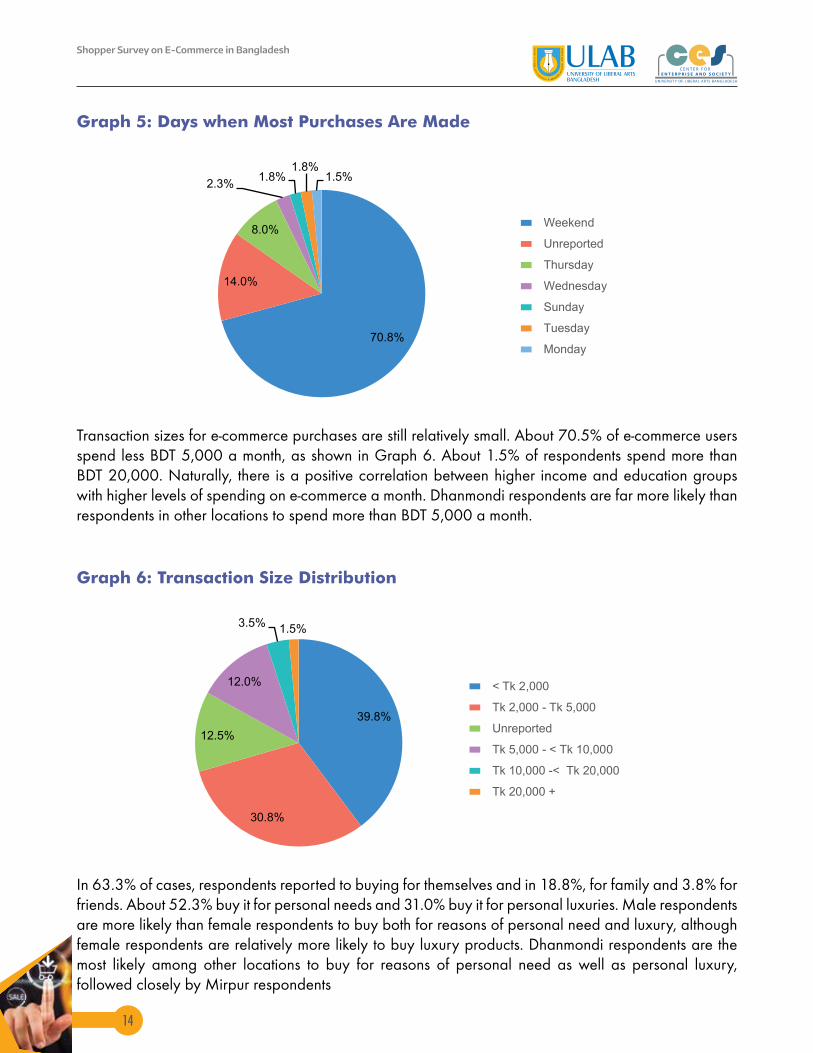
When asked on which days they make most of their purchases, about 70.8% of respondents reported to shopping only on weekends, i.e., Fridays and Saturdays, followed by 8.0% on Thursdays, as shown in Graph 5. Weekend shopping is usually the norm, however, the response rate for shopping on weekends is still quite high. What is also interesting is that students are far more likely than business people to shop on weekends. This is potentially a result of the fact that e-commerce users are perhaps proportionately higher among youth groups than older business professionals, which is a point worth noting for e-commerce entrepreneurs and marketers.
Shopper Survey on E-Commerce in Bangladesh
14
Graph 5: Days when Most Purchases Are Made
70.8%
14.0%
8.0%
2.3%1.8%
1.8%1.5%
Weekend
Unreported
Thursday
Wednesday
Sunday
Tuesday
Monday
Transaction sizes for e-commerce purchases are still relatively small. About 70.5% of e-commerce users spend less BDT 5,000 a month, as shown in Graph 6. About 1.5% of respondents spend more than BDT 20,000. Naturally, there is a positive correlation between higher income and education groups with higher levels of spending on e-commerce a month. Dhanmondi respondents are far more likely than respondents in other locations to spend more than BDT 5,000 a month.
Graph 6: Transaction Size Distribution
39.8%
30.8%
12.5%
12.0%
3.5% 1.5%
< Tk 2,000
Tk 2,000 - Tk 5,000
Unreported
Tk 5,000 - < Tk 10,000
Tk 10,000 -< Tk 20,000
Tk 20,000 +
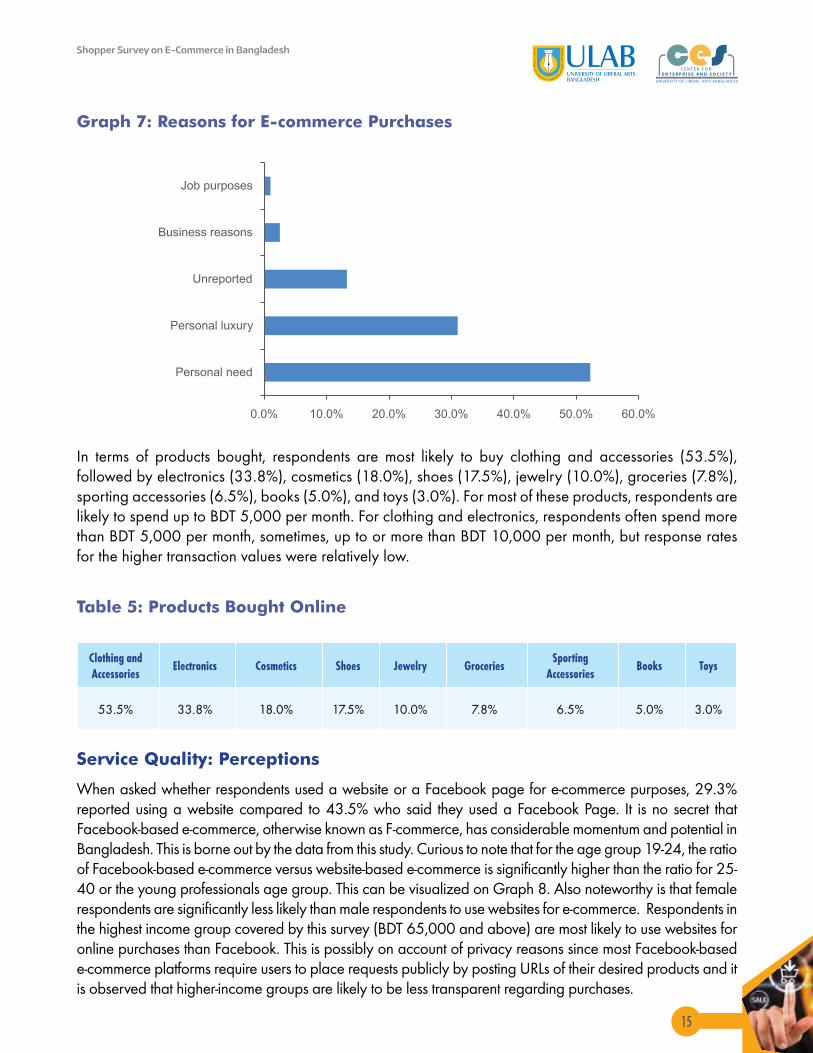
In 63.3% of cases, respondents reported to buying for themselves and in 18.8%, for family and 3.8% for friends. About 52.3% buy it for personal needs and 31.0% buy it for personal luxuries. Male respondents are more likely than female respondents to buy both for reasons of personal need and luxury, although female respondents are relatively more likely to buy luxury products. Dhanmondi respondents are the most likely among other locations to buy for reasons of personal need as well as personal luxury, followed closely by Mirpur respondents
Shopper Survey on E-Commerce in Bangladesh
15
Graph 7: Reasons for E-commerce Purchases
0.0% 10.0% 20.0% 30.0% 40.0% 50.0% 60.0%
Personal need
Personal luxury
Unreported
Business reasons
Job purposes
In terms of products bought, respondents are most likely to buy clothing and accessories (53.5%), followed by electronics (33.8%), cosmetics (18.0%), shoes (17.5%), jewelry (10.0%), groceries (7.8%), sporting accessories (6.5%), books (5.0%), and toys (3.0%). For most of these products, respondents are likely to spend up to BDT 5,000 per month. For clothing and electronics, respondents often spend more than BDT 5,000 per month, sometimes, up to or more than BDT 10,000 per month, but response rates for the higher transaction values were relatively low.
Table 5: Products Bought Online
Clothing and Accessories
Electronics Cosmetics Shoes Jewelry GroceriesSporting
AccessoriesBooks Toys
53.5% 33.8% 18.0% 17.5% 10.0% 7.8% 6.5% 5.0% 3.0%
Service Quality: Perceptions
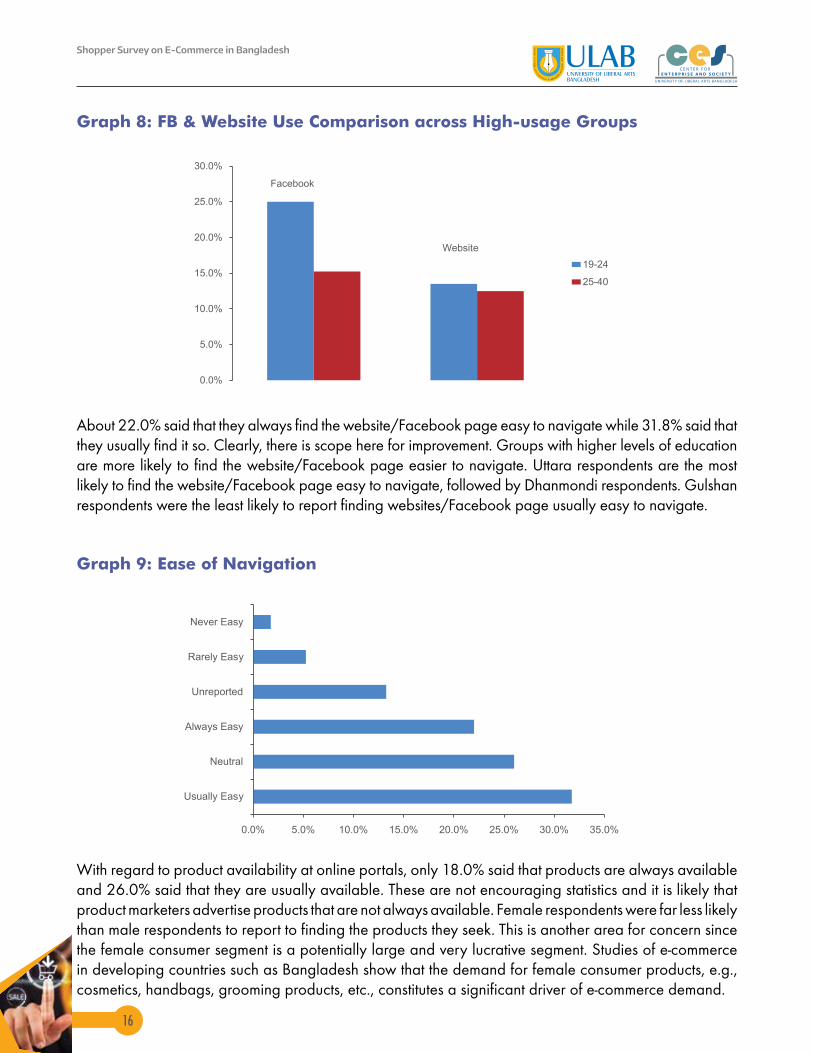
When asked whether respondents used a website or a Facebook page for e-commerce purposes, 29.3% reported using a website compared to 43.5% who said they used a Facebook Page. It is no secret that Facebook-based e-commerce, otherwise known as F-commerce, has considerable momentum and potential in Bangladesh. This is borne out by the data from this study. Curious to note that for the age group 19-24, the ratio of Facebook-based e-commerce versus website-based e-commerce is significantly higher than the ratio for 25-40 or the young professionals age group. This can be visualized on Graph 8. Also noteworthy is that female respondents are significantly less likely than male respondents to use websites for e-commerce. Respondents in the highest income group covered by this survey (BDT 65,000 and above) are most likely to use websites for online purchases than Facebook. This is possibly on account of privacy reasons since most Facebook-based e-commerce platforms require users to place requests publicly by posting URLs of their desired products and it is observed that higher-income groups are likely to be less transparent regarding purchases.
Shopper Survey on E-Commerce in Bangladesh
16
Graph 8: FB & Website Use Comparison across High-usage Groups
0.0%
5.0%
10.0%
15.0%
20.0%
25.0%
30.0%
19-24
25-40
Website
About 22.0% said that they always find the website/Facebook page easy to navigate while 31.8% said that they usually find it so. Clearly, there is scope here for improvement. Groups with higher levels of education are more likely to find the website/Facebook page easier to navigate. Uttara respondents are the most likely to find the website/Facebook page easy to navigate, followed by Dhanmondi respondents. Gulshan respondents were the least likely to report finding websites/Facebook page usually easy to navigate.
Graph 9: Ease of Navigation
0.0% 5.0% 10.0% 15.0% 20.0% 25.0% 30.0% 35.0%
Usually Easy
Neutral
Always Easy
Unreported
Rarely Easy
Never Easy
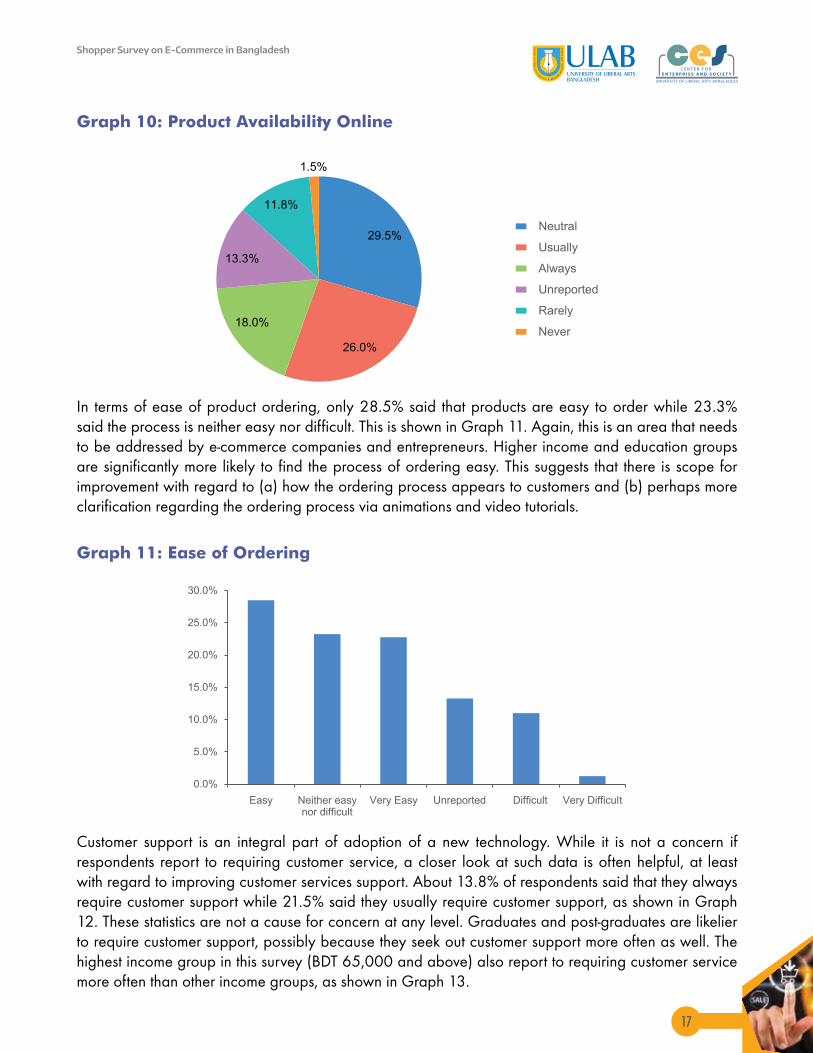
With regard to product availability at online portals, only 18.0% said that products are always available and 26.0% said that they are usually available. These are not encouraging statistics and it is likely that product marketers advertise products that are not always available. Female respondents were far less likely than male respondents to report to finding the products they seek. This is another area for concern since the female consumer segment is a potentially large and very lucrative segment. Studies of e-commerce in developing countries such as Bangladesh show that the demand for female consumer products, e.g., cosmetics, handbags, grooming products, etc., constitutes a significant driver of e-commerce demand.
Shopper Survey on E-Commerce in Bangladesh
17
Graph 10: Product Availability Online
29.5%
26.0%
18.0%
13.3%
11.8%
1.5%
Neutral
Usually
Always
Unreported
Rarely
Never
In terms of ease of product ordering, only 28.5% said that products are easy to order while 23.3% said the process is neither easy nor difficult. This is shown in Graph 11. Again, this is an area that needs to be addressed by e-commerce companies and entrepreneurs. Higher income and education groups are significantly more likely to find the process of ordering easy. This suggests that there is scope for improvement with regard to (a) how the ordering process appears to customers and (b) perhaps more clarification regarding the ordering process via animations and video tutorials.
Graph 11: Ease of Ordering
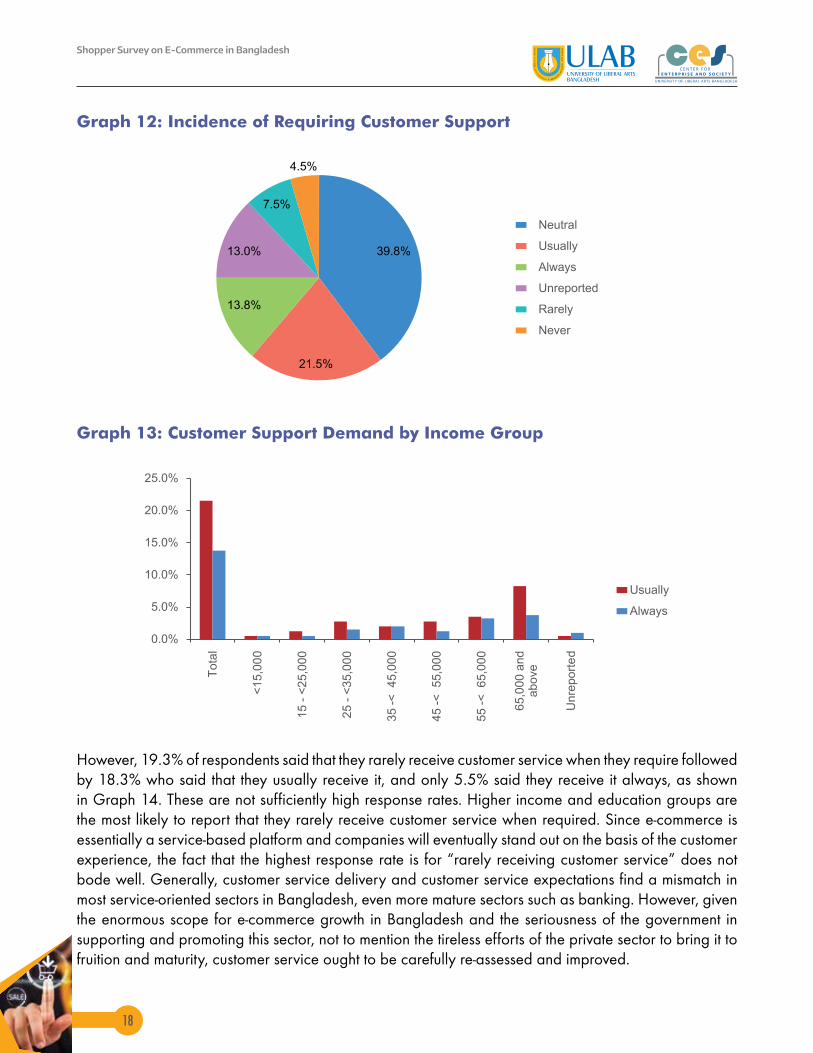
Customer support is an integral part of adoption of a new technology. While it is not a concern if respondents report to requiring customer service, a closer look at such data is often helpful, at least with regard to improving customer services support. About 13.8% of respondents said that they always require customer support while 21.5% said they usually require customer support, as shown in Graph 12. These statistics are not a cause for concern at any level. Graduates and post-graduates are likelier to require customer support, possibly because they seek out customer support more often as well. The highest income group in this survey (BDT 65,000 and above) also report to requiring customer service more often than other income groups, as shown in Graph 13.
0.0%
5.0%
10.0%
15.0%
20.0%
25.0%
30.0%
Easy Neither easy nor difficult
Very Easy Unreported Difficult Very Difficult
Shopper Survey on E-Commerce in Bangladesh
18
Graph 12: Incidence of Requiring Customer Support
39.8%
21.5%
13.8%
13.0%
7.5%
4.5%
Neutral
Usually
Always
Unreported
Rarely
Never
Graph 13: Customer Support Demand by Income Group
0.0%
5.0%
10.0%
15.0%
20.0%
25.0%
To
tal
<1
5,0
00
15
-<
25
,00
0
25
-<
35
,00
0
35
-<
45
,00
0
45
-<
55
,00
0
55
-<
65
,00
0
65
,00
0 a
nd
a
bo
ve
Un
rep
ort
ed
Usually
Always
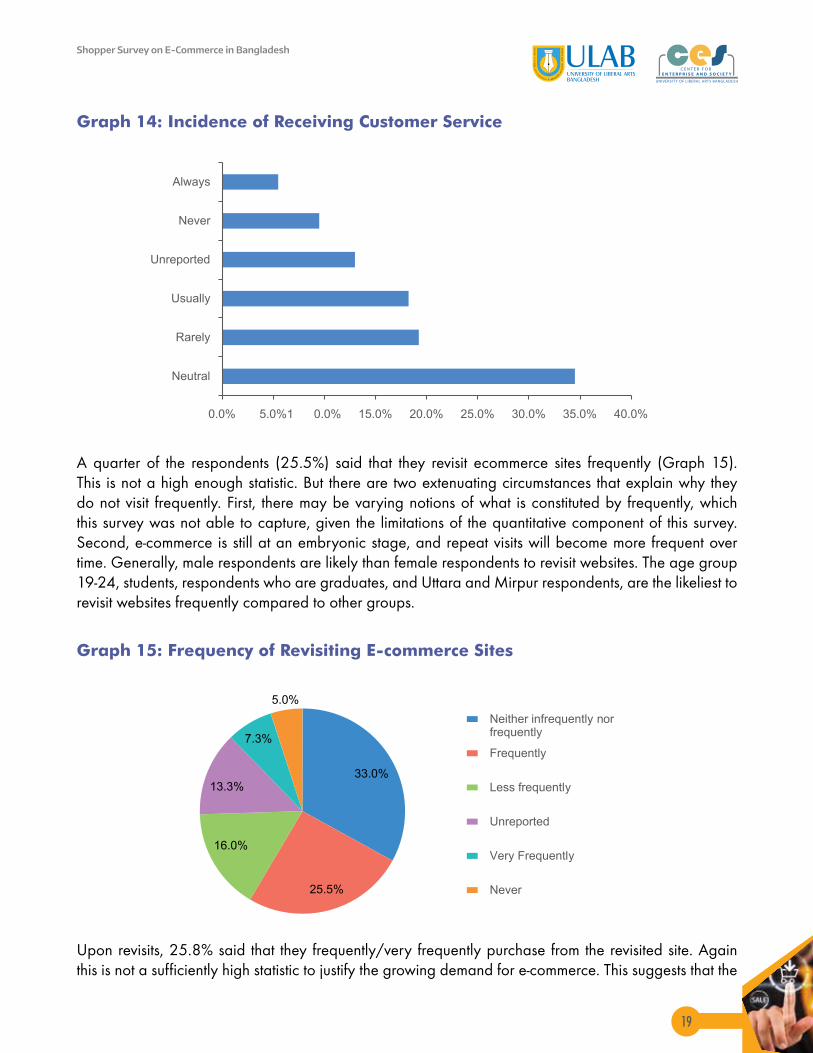
However, 19.3% of respondents said that they rarely receive customer service when they require followed by 18.3% who said that they usually receive it, and only 5.5% said they receive it always, as shown in Graph 14. These are not sufficiently high response rates. Higher income and education groups are the most likely to report that they rarely receive customer service when required. Since e-commerce is essentially a service-based platform and companies will eventually stand out on the basis of the customer experience, the fact that the highest response rate is for “rarely receiving customer service” does not bode well. Generally, customer service delivery and customer service expectations find a mismatch in most service-oriented sectors in Bangladesh, even more mature sectors such as banking. However, given the enormous scope for e-commerce growth in Bangladesh and the seriousness of the government in supporting and promoting this sector, not to mention the tireless efforts of the private sector to bring it to fruition and maturity, customer service ought to be carefully re-assessed and improved.
Shopper Survey on E-Commerce in Bangladesh
19
Graph 14: Incidence of Receiving Customer Service
0.0% 5.0%1 0.0% 15.0% 20.0% 25.0% 30.0% 35.0% 40.0%
Neutral
Rarely
Usually
Unreported
Never
Always
A quarter of the respondents (25.5%) said that they revisit ecommerce sites frequently (Graph 15). This is not a high enough statistic. But there are two extenuating circumstances that explain why they do not visit frequently. First, there may be varying notions of what is constituted by frequently, which this survey was not able to capture, given the limitations of the quantitative component of this survey. Second, e-commerce is still at an embryonic stage, and repeat visits will become more frequent over time. Generally, male respondents are likely than female respondents to revisit websites. The age group 19-24, students, respondents who are graduates, and Uttara and Mirpur respondents, are the likeliest to revisit websites frequently compared to other groups.
Graph 15: Frequency of Revisiting E-commerce Sites
Upon revisits, 25.8% said that they frequently/very frequently purchase from the revisited site. Again this is not a sufficiently high statistic to justify the growing demand for e-commerce. This suggests that the
33.0%
25.5%
16.0%
13.3%
7.3%
5.0%
Neither infrequently nor frequently
Frequently
Less frequently
Unreported
Very Frequently
Never
Shopper Survey on E-Commerce in Bangladesh
20
repeat customer base is small as suggested earlier, repeat visits will likely become more widespread over time.
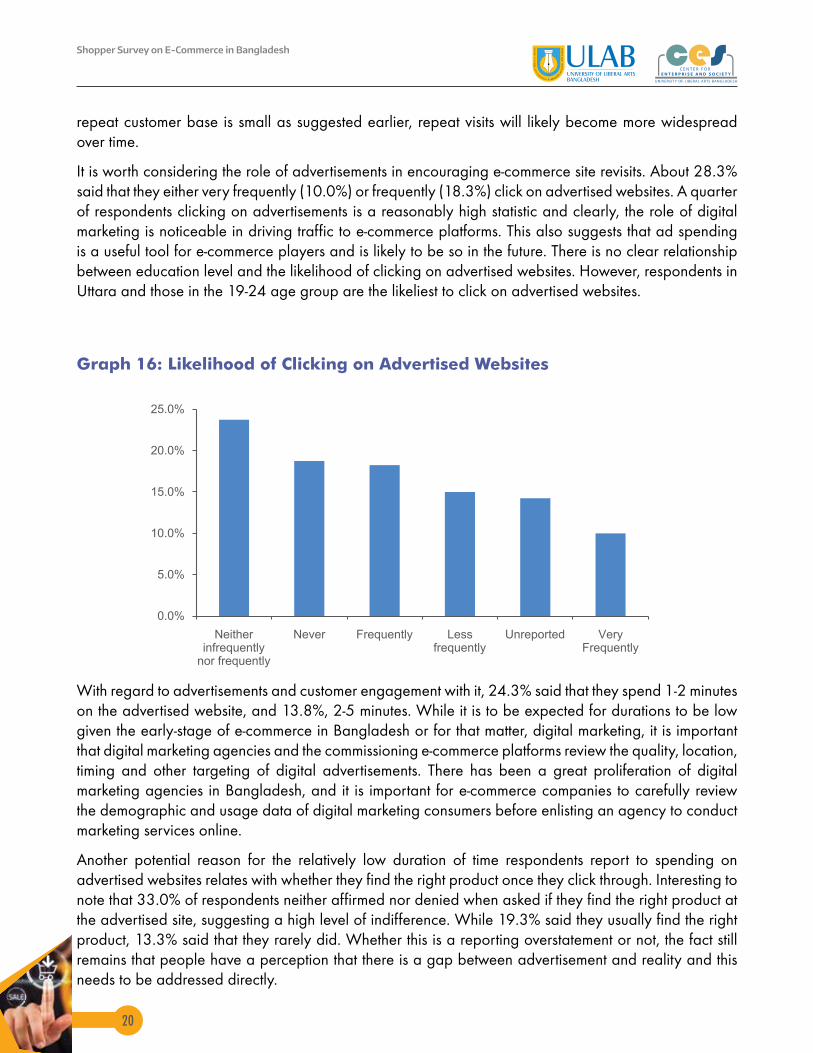
It is worth considering the role of advertisements in encouraging e-commerce site revisits. About 28.3% said that they either very frequently (10.0%) or frequently (18.3%) click on advertised websites. A quarter of respondents clicking on advertisements is a reasonably high statistic and clearly, the role of digital marketing is noticeable in driving traffic to e-commerce platforms. This also suggests that ad spending is a useful tool for e-commerce players and is likely to be so in the future. There is no clear relationship between education level and the likelihood of clicking on advertised websites. However, respondents in Uttara and those in the 19-24 age group are the likeliest to click on advertised websites.
Graph 16: Likelihood of Clicking on Advertised Websites
0.0%
5.0%
10.0%
15.0%
20.0%
25.0%
Neither infrequently
nor frequently
Never Frequently Less frequently
Unreported Very Frequently
With regard to advertisements and customer engagement with it, 24.3% said that they spend 1-2 minutes on the advertised website, and 13.8%, 2-5 minutes. While it is to be expected for durations to be low given the early-stage of e-commerce in Bangladesh or for that matter, digital marketing, it is important that digital marketing agencies and the commissioning e-commerce platforms review the quality, location, timing and other targeting of digital advertisements. There has been a great proliferation of digital marketing agencies in Bangladesh, and it is important for e-commerce companies to carefully review the demographic and usage data of digital marketing consumers before enlisting an agency to conduct marketing services online.
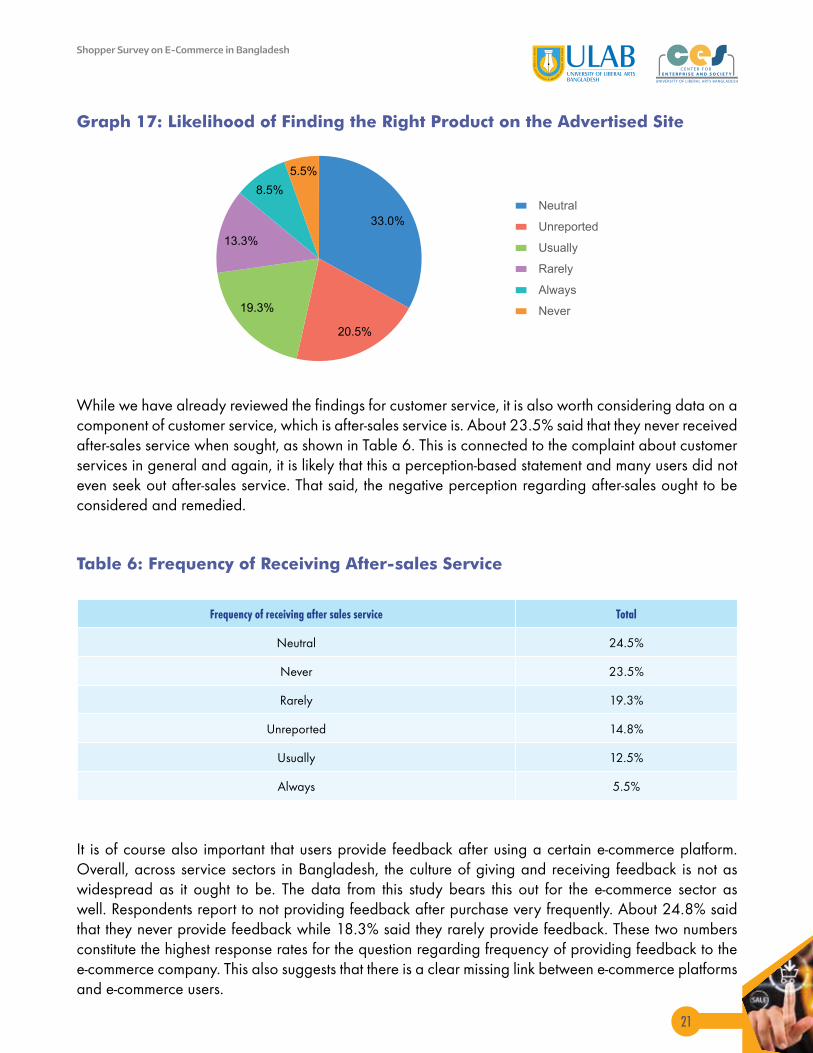
Another potential reason for the relatively low duration of time respondents report to spending on advertised websites relates with whether they find the right product once they click through. Interesting to note that 33.0% of respondents neither affirmed nor denied when asked if they find the right product at the advertised site, suggesting a high level of indifference. While 19.3% said they usually find the right product, 13.3% said that they rarely did. Whether this is a reporting overstatement or not, the fact still remains that people have a perception that there is a gap between advertisement and reality and this needs to be addressed directly.
Shopper Survey on E-Commerce in Bangladesh
21
Graph 17: Likelihood of Finding the Right Product on the Advertised Site
While we have already reviewed the findings for customer service, it is also worth considering data on a component of customer service, which is after-sales service is. About 23.5% said that they never received after-sales service when sought, as shown in Table 6. This is connected to the complaint about customer services in general and again, it is likely that this a perception-based statement and many users did not even seek out after-sales service. That said, the negative perception regarding after-sales ought to be considered and remedied.
Table 6: Frequency of Receiving After-sales Service
Frequency of receiving after sales service Total
Neutral 24.5%
Never 23.5%
Rarely 19.3%
Unreported 14.8%
Usually 12.5%
Always 5.5%
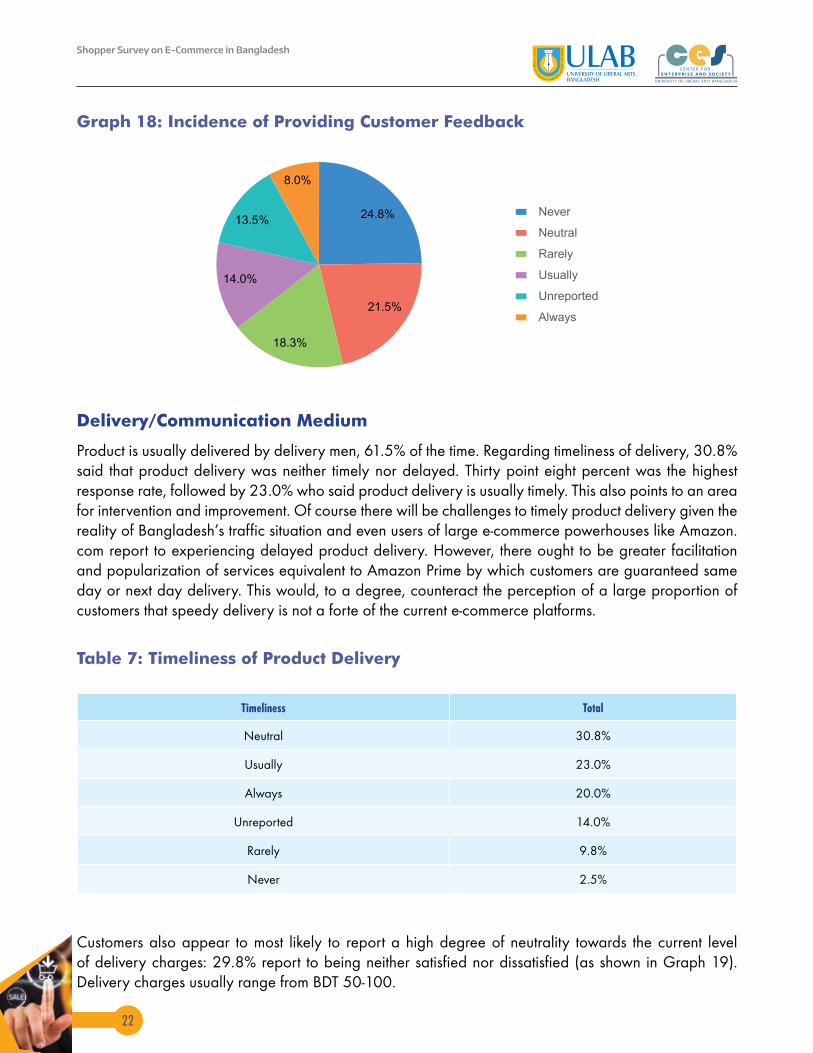
It is of course also important that users provide feedback after using a certain e-commerce platform. Overall, across service sectors in Bangladesh, the culture of giving and receiving feedback is not as widespread as it ought to be. The data from this study bears this out for the e-commerce sector as well. Respondents report to not providing feedback after purchase very frequently. About 24.8% said that they never provide feedback while 18.3% said they rarely provide feedback. These two numbers constitute the highest response rates for the question regarding frequency of providing feedback to the e-commerce company. This also suggests that there is a clear missing link between e-commerce platforms and e-commerce users.
33.0%
20.5%
19.3%
13.3%
8.5%
5.5%
Neutral
Unreported
Usually
Rarely
Always
Never
Shopper Survey on E-Commerce in Bangladesh
22
Graph 18: Incidence of Providing Customer Feedback
24.8%
21.5%
18.3%
14.0%
13.5%
8.0%
Never
Neutral
Rarely
Usually
Unreported
Always
Delivery/Communication Medium
Product is usually delivered by delivery men, 61.5% of the time. Regarding timeliness of delivery, 30.8% said that product delivery was neither timely nor delayed. Thirty point eight percent was the highest response rate, followed by 23.0% who said product delivery is usually timely. This also points to an area for intervention and improvement. Of course there will be challenges to timely product delivery given the reality of Bangladesh’s traffic situation and even users of large e-commerce powerhouses like Amazon.com report to experiencing delayed product delivery. However, there ought to be greater facilitation and popularization of services equivalent to Amazon Prime by which customers are guaranteed same day or next day delivery. This would, to a degree, counteract the perception of a large proportion of customers that speedy delivery is not a forte of the current e-commerce platforms.
Table 7: Timeliness of Product Delivery
Timeliness Total
Neutral 30.8%
Usually 23.0%
Always 20.0%
Unreported 14.0%
Rarely 9.8%
Never 2.5%
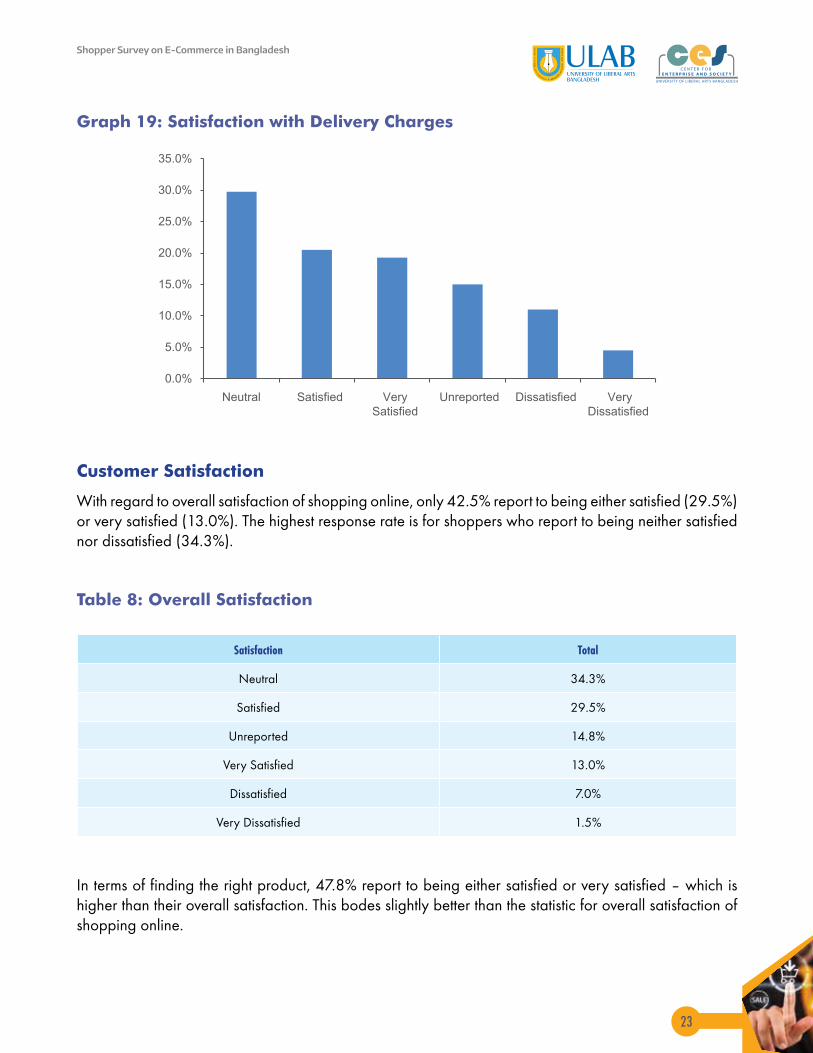
Customers also appear to most likely to report a high degree of neutrality towards the current level of delivery charges: 29.8% report to being neither satisfied nor dissatisfied (as shown in Graph 19). Delivery charges usually range from BDT 50-100.
Shopper Survey on E-Commerce in Bangladesh
23
Graph 19: Satisfaction with Delivery Charges
Customer Satisfaction
With regard to overall satisfaction of shopping online, only 42.5% report to being either satisfied (29.5%) or very satisfied (13.0%). The highest response rate is for shoppers who report to being neither satisfied nor dissatisfied (34.3%).
Table 8: Overall Satisfaction
Satisfaction Total
Neutral 34.3%
Satisfied 29.5%
Unreported 14.8%
Very Satisfied 13.0%
Dissatisfied 7.0%
Very Dissatisfied 1.5%
In terms of finding the right product, 47.8% report to being either satisfied or very satisfied – which is higher than their overall satisfaction. This bodes slightly better than the statistic for overall satisfaction of shopping online.
Shopper Survey on E-Commerce in Bangladesh
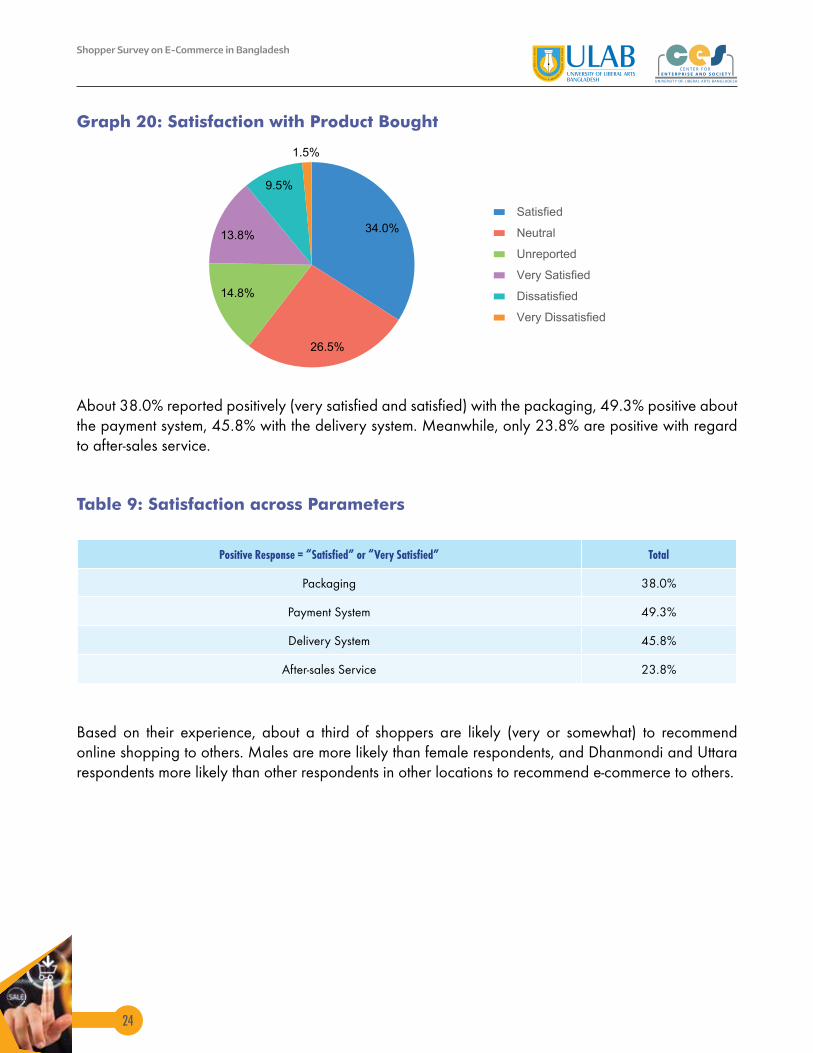
24
Graph 20: Satisfaction with Product Bought
34.0%
26.5%
14.8%
13.8%
9.5%
1.5%
Satisfied
Neutral
Unreported
Very Satisfied
Dissatisfied
Very Dissatisfied
About 38.0% reported positively (very satisfied and satisfied) with the packaging, 49.3% positive about the payment system, 45.8% with the delivery system. Meanwhile, only 23.8% are positive with regard to after-sales service.
Table 9: Satisfaction across Parameters
Positive Response = “Satisfied” or “Very Satisfied” Total
Packaging 38.0%
Payment System 49.3%
Delivery System 45.8%
After-sales Service 23.8%
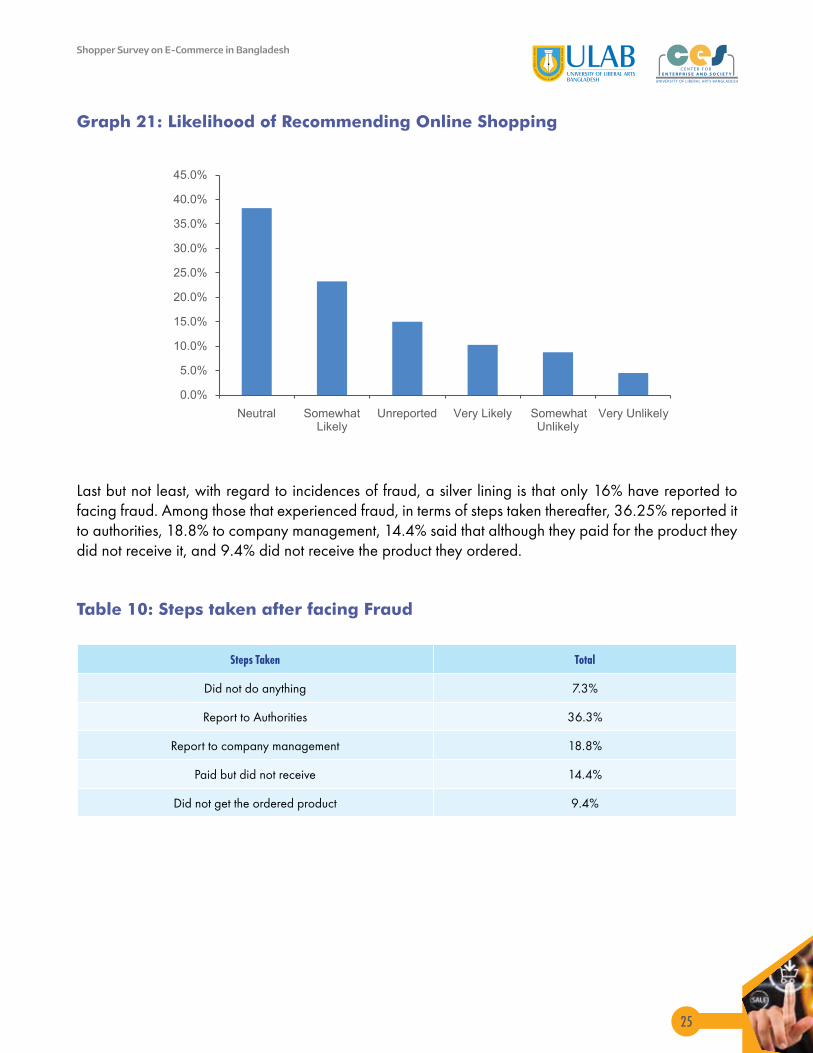
Based on their experience, about a third of shoppers are likely (very or somewhat) to recommend online shopping to others. Males are more likely than female respondents, and Dhanmondi and Uttara respondents more likely than other respondents in other locations to recommend e-commerce to others.
Shopper Survey on E-Commerce in Bangladesh
25
Graph 21: Likelihood of Recommending Online Shopping
Last but not least, with regard to incidences of fraud, a silver lining is that only 16% have reported to facing fraud. Among those that experienced fraud, in terms of steps taken thereafter, 36.25% reported it to authorities, 18.8% to company management, 14.4% said that although they paid for the product they did not receive it, and 9.4% did not receive the product they ordered.
Table 10: Steps taken after facing Fraud
Steps Taken Total
Did not do anything 7.3%
Report to Authorities 36.3%
Report to company management 18.8%
Paid but did not receive 14.4%
Did not get the ordered product 9.4%
Shopper Survey on E-Commerce in Bangladesh
26
RECOMMENDATIONS
Clearly, the level of awareness-generation, marketing, and advertising activities conducted by e-commerce entrepreneurs have been successful, given that already, about half the respondents surveyed professed possessing high level of knowledge on e-commerce. However, awareness-generation is not the same as behavioral change communication (BCC) activities, and it is to this end, that e-commerce entrepreneurs must focus their attention to. Video tutorials and e-commerce fairs ought to be introduced and organized on a more frequent basis. E-commerce entrepreneurs will do well to adopt tactics deployed by other digital finance players such as mobile financial services companies who deployed effective BCC programs in partnership with development agencies, often instructing customers on how to use services through television advertisements, radio programs, and by deploying agents.
Across the findings, it appears as if the age groups 19-24 and 25-40 are the most avid consumers of e-commerce. Clearly, as also supported by the key informant interviews, comfort with mobile phones and the internet renders it easier for these groups to conduct online shopping. This is a group towards whom more focused services are necessary, particularly, the 25-40 age group, since this is the working professionals’ age group, and this group, with regard to some of the findings, appear to be lagging behind the 19-24 age group. E-commerce platforms will do well to assess demand for products and services sought by the 25-40 age group, and develop partnerships with large high-profile employers so that their employees can avail of discounts on particular products and brands. For instance, if Chaaldal.com could develop partnerships with conglomerates allowing the latter to source food items for their cafeterias at discounted rates. Daraz.com could offer discounts on office supplies and stationary to large local corporates. Approaching this age group from an institutional level will eventually pave the way for retail sales.
Dhanmondi respondents far outstrip respondents in other areas of e-commerce familiarity, demand and usage. It is important to both cash in on this, and develop channels with which to offer products and services to the youth in Dhanmondi. Since Dhanmondi is an area where universities, schools, and hospitals/pharmacies proliferate, e-commerce providers can consider developing partnerships with the said institutions to sell products at discounted rates that universities, schools and hospitals/pharmacies routinely require. In the US, for instance, Amazon.com, for example, has had tie-ups with university libraries to enable book rentals since the price of textbooks can be quite high in the US. This is something e-commerce platforms in Bangladesh can consider with respect to private universities in Bangladesh.
Another important criterion for e-commerce players’ success is revisits by users. Statistics for revisits are not sufficiently high it appears. This is an area where e-commerce platforms can invest in. There are various strategies adopted by e-commerce players overseas to generate revisits: loyalty schemes, award mechanisms, credit cards dedicated to e-commerce platforms, membership discounts, and of course, by ensuring a continuously developing inventory and communicating the same to current and potential customers. Targeted advertisements are also used that enable e-commerce providers to showcase to visitors products they once clicked through or viewed, on other online platforms, via digital ads. These are techniques that can be adopted by Bangladesh-based e-commerce players in the long run. Of course, re-visits also depend on the user experience. User interface design and ease of navigation, ease of ordering the product, and very importantly, ensuring that a product being advertised is actually available on the site, are essential to generating more revisits.
Shopper Survey on E-Commerce in Bangladesh
27
Delivery services constitute another area that merits closer attention since in Bangladesh, this tends to be outsourced, and is often at the heard of consumer dissatisfaction, not only in terms of delays in delivery, but whether a product actually reaches a customer. An issue in the e-commerce sector is that of capital as most organizations do not possess sufficient capital, as borne by KIIs, to invest in their own delivery systems. Several problems may arise from thirdy-party delivery and cash collections:
• Delayed payment by third-party delivery companies to the e-commerce platforms, compromises the cash flow cycle of e-commerce companies. There are occasions when payments are not even handed over to the suppliers by the delivery companies.
� There are instances, as per KIIs, when deliverers disappear with products and the sale is never completed which compromises business relations between the buyer and the seller
• Inappropriate and improper etiquette from the delivery person hampers the sellers’ business relationship with the buyer
There were several recommendations posited by the e-commerce entrepreneurs surveyed for this study, that relate to expectations from the public sector. Although the respondents were unanimous in acknowledging the support of the government in developing the e-commerce sector, notwithstanding the setting up of the Ecommerce Association of Bangladesh (ECAB), they had long-term suggestions that had to do with popularizing use of internet at the rural level, perhaps through primary and secondary educational institutions. Other recommendations posited by the e-commerce entrepreneurs include lowering price of internet, a designated subsection for ecommerce businesses at the upcoming IT Park, and lastly, protective measures to dissuade foreign competition in this sector, to allow the local players to grow.

Shopper Survey on E-Commerce in Bangladesh
28
UNIVERSITY OF LIBERAL ARTS BANGLADESHHouse 56, Road, 4/A Dhanmondi, Dhaka-1209
Tel: 9661301, 9661255, 01730082198www.ulab.edu.bd
Related Documents


