E-commerce Adoption by Travel Agencies in Jordan By Mohammad Kasim Alrousan Student Number: 20024308 December, 2014 A thesis submitted to Cardiff Metropolitan University for the degree of Doctor of Philosophy Cardiff School of Management Cardiff Metropolitan University Supervised by Professor Peter Abell Dr Bernadette Warner

Welcome message from author
This document is posted to help you gain knowledge. Please leave a comment to let me know what you think about it! Share it to your friends and learn new things together.
Transcript
E-commerce Adoption by Travel
Agencies in Jordan
By
Mohammad Kasim Alrousan
Student Number: 20024308
December, 2014
A thesis submitted to Cardiff Metropolitan University for
the degree of Doctor of Philosophy
Cardiff School of Management
Cardiff Metropolitan University
Supervised by
Professor Peter Abell
Dr Bernadette Warner
i
Abstract
The advents of information and communication technologies (ICTs), especially the
Internet applications, have become indispensable tool to the tourism industry. ICTs have
had a major influence in changing the structure of this industry, to be information-
intensive industry. Travel agencies category of SMEs , have a vital role in tourism;
managing, coordinating and supplying all aspects thereof, such as transport sector,
hospitality sector and leisure attractions.
The factors affecting e-commerce adoption by SMEs have been well-documented in
developed countries, but inadequate studies have been conducted regarding e-commerce
adoption in the developing countries; particularly in Arab countries. Moreover, it has
been found that in spite of potential benefits for travel agencies of adoption of e-
commerce, travel agencies are commonly regarded as slow adopters of e-commerce,
lagging far behind the developed countries.
Therefore, the focus of this study is on investigating the factors affecting e-commerce
adoption by focusing on Jordanian travel agencies. To achieve this objective; an
integrated conceptual framework was developed on the basis of previous models and
theories relevant to ICTs and e-commerce adoption, namely Rogers’ Diffusion of
Innovation model, the Technology-Organisation-Environment model and Hofstede’s
Cultural Dimensions theory. The conceptual framework was developed for the
explanation of the factors affecting e-commerce adoption by travel agencies. These
factors were used to identify different levels of e-commerce adoption. These levels
include: non-adoption, e-connectivity, e-window, e-interactivity, e-transaction and e-
enterprise.
The quantitative method was applied in this study for data collection using self-
administrated questionnaire distributed to 300 Jordanian travel agents. The total number
of valid questionnaires was 206, constituting a response rate of 68.6%. The descriptive
analysis was used to explain demographic profiles of participants and current state of e-
commerce adoption level. Multinomial Logistic Regression was used to test the research
hypotheses. The research findings revealed that there are three different adoption levels
of e-commerce by Jordanian travel agencies: e-connectivity, e-window and e-
interactivity. The results showed that relative advantage, observability, business/partner
pressure, uncertainty avoidance and government support were the significant predictors
differentiating e-window from e-connectivity. Moreover, relative advantage,
observability, financial barriers, power distance, business/partner pressure and
government support proved to be significant predictors differentiating between e-
interactivity and e-connectivity. It was also found that observability, competitive
pressure, firm size and complexity were significant predictors differentiating between e-
interactivity and e-window. On the other hand, the results showed that compatibility,
ii
trialability, employees’ IT knowledge, top management support, manager’s attitude, and
customer pressure were insignificant predictors of any of the e-commerce adoption
levels.
Upon that, it can be argued with confidence that different levels of e-commerce adoption
are affected by different factors. This entails the necessity of addressing the above ten
significant predictors as they can be useful for managers, IT/web vendors and policy
makers in drawing a roadmap and strategies for expanding the use and benefits of e-
commerce adoption. Moreover, the conceptual framework of the study provide a best
explanation of factors affecting e-commerce adoption levels in travel agencies as an
example of SMEs, which contribute to the knowledge in the area of information systems
particularly in the context of e-commerce adoption in developing countries.
iii
ACKNOWLEDGEMENTS
First and foremost, any expression of my gratitude to the favours Allah has bestowed
upon me remains an understatement. It is only by these favours I have learned what I
would have never known and found the faith and guidance to complete this thesis.
My warmest gratefulness goes to my father Dr. Kasim Al-Rousan and my mother Seham
Al-Rousan for their support, encouragement and care not only during my PhD study but
ever since I was born. I am also thankful to my sisters and brother who sought to keep the
spark of confidence kindled within me. My heartfelt thanks are also to my dear wife Dr.
Dima Obeidat, for her patience, love and encouragement that kept motivating me.
I am very grateful to the director of my study, Professor Peter Abell, for his
encouragement, support, wisdom and knowledge. I have learnt many things from him and
his valuable knowledge, comments and instructions made the completion of this thesis
possible and at the same time a great experience for me. His humility and patience made
things much easier. I will never forget his inspiring directions and advices.
I also want to express my warmest gratitude to my supervisor Dr. Bernadette Warner,
whose vast knowledge and experience in research direction provided me with valuable
feedback, empowered me with better research skills and improved the quality of this
thesis. Not only academically, but also her exemplary hard work, tactfulness and
friendliness offered an outstanding role model for me. I was so fortunate to have such a
great supervisor without whom this thesis would not have been completed.
My sincere gratitude and appreciation are due to Professor Eleri Jones for her support and
comments, especially at first stages of my research. She also gave me her valuable time
and helped me to publish a relevant paper at a distinguished journal despite her busy
schedule as a PhD Research Programme Director at Cardiff Metropolitan University. To
her I owe my sincerest respect and appreciation.
I would like to thank my father-in-law, Professor Turki Obeidat, for his valuable
comments, advices and encouragement throughout my research period. He taught me
about statistical techniques and his tips through various discussions added strength to my
work.
I am also thankful to Dr. Mohammad Bsoul who helped me to access certain journals that
I needed. He also gave me some comments which added a special flavour to my work. I
also thank my friends and colleagues Ahmad Al-Adwan, Bardia Hariri, Dr. Bader Al-
Fawwaz, Amr Madadha, and Wael Asem Al-rousan for their useful comments and
support.

iv
I also owe special thanks to my friend Firas Abd-Alhadi for reviewing the thesis
linguistically and providing valuable comments which made a big difference in the
quality of my research.
I also owe sincere thanks to Jordan Tourism Board for its support in this study. This
study would not have been possible without its corporation, especially in data collection.
Finally, I am so grateful to Cardiff Metropolitan University for offering a range of
educational facilities, such as a first class library and advanced education system that
enabled me to use the resources of other academic institutions as the British Library and
the library of the London School of Economic and Political Science which had a
significant effect on completing of this work successfully.

v
DEDICATION
I dedicated this thesis to my father Dr Kasim Alrousan , to my
mother Seham Alrousan , to my sisters and brother , to my father-
in-law professor Turki Obeidat ,to my mother-in-law Muzaz Turki,
and to my wife Dima , who have supported and encouraged me to
achieve success and completion this PhD.

vi
Publications
Alrousan, M. and Jones, E. (In Press) ‘A conceptual model of factors affecting e-
commerce adoption by SME owner/managers in Jordan’, Int. J. Business Information
Systems.
vii
TABLE OF CONTENTS
Chapter One .................................................................................................................................... 1
Introduction ..................................................................................................................................... 1
1.1 Research Background ................................................................................................................ 2
1.2 Rationale of the Study ............................................................................................................... 5
1.3 Importance of the Study ............................................................................................................ 8
1.4 Research Aim and Objectives .................................................................................................. 10
1.5 Research Methodology ........................................................................................................... 11
1.6 Research Contribution ............................................................................................................. 12
1.7 Thesis Structure ....................................................................................................................... 14
Chapter Two .................................................................................................................................. 17
Technology and Tourism ............................................................................................................... 17
2.1 Introduction ............................................................................................................................. 18
2.2 Information and Communication Technologies and E-commerce in Developing Countries .. 18
2.3 ICTs and E-commerce in Jordan .............................................................................................. 27
2.3.1 Overview of Jordan ........................................................................................................... 27
2.3.2 ICTs and E-commerce in Jordan ...................................................................................... 29
2.3.3 Small and Medium Enterprises (SMEs) in Jordan ........................................................... 30
2.3.4 SMEs and E-commerce in Jordan .................................................................................... 32
2.4 Tourism Industry ..................................................................................................................... 33
2.4.1 Tourism in Jordan ............................................................................................................. 35
2.4.2 Tourism and ICTs ............................................................................................................. 36
2.4.3 Disintermediation and Reintermediation ........................................................................ 40
2.4.4 Travel Agencies in Jordan ................................................................................................. 44
2.4.5 Travel Agencies and E-commerce in Jordan ..................................................................... 45

viii
2.5 Conclusion ............................................................................................................................... 46
Chapter Three ................................................................................................................................ 48
Theoretical Background................................................................................................................. 48
3.1 Introduction ............................................................................................................................. 49
3.2 Theories and Models in Technology Adoption ........................................................................ 49
3.2.1 Theory of Reasoned Action (TRA)..................................................................................... 50
3.2.2 Technology Acceptance Model (TAM) ............................................................................. 53
3.2.3 Technology-Organisation-Environment (TOE) ................................................................. 58
3.2.4 Diffusion of Innovation Theory ......................................................................................... 61
3.2.5 Culture and Technology ................................................................................................... 69
3.3 Integrated Models and Theories ............................................................................................. 77
3.4 Previous Studies on E-commerce Innovation Adoption .......................................................... 82
3.5 Studies of Factors Affecting E-commerce Adoption in SMEs .................................................. 86
3.5.1 Technological Factors ....................................................................................................... 86
3.5.2 Organizational Factors ...................................................................................................... 89
3.5.3 Managerial Factors ........................................................................................................... 92
3.5.4 Environmental Factors...................................................................................................... 96
3.6 Studies of Factors Affecting E-commerce Adoption in Travel agencies .................................. 98
3.7 Maturity Models of E-commerce .......................................................................................... 102
3.8 Limitations and Gap in literature........................................................................................... 109
3.9 Conclusion ............................................................................................................................. 111
Chapter Four ................................................................................................................................ 127
Hypotheses and Conceptual Framework .................................................................................... 127
4.1 Introduction ........................................................................................................................... 128
4.2 The Proposed Conceptual Framework .................................................................................. 128

ix
4.3 Hypotheses and Relationship to Research Development ..................................................... 144
4.3.1 Attributes of Innovation ................................................................................................. 145
4.3.1.1 Relative Advantages ................................................................................................ 145
4.3.1.2 Compatibility ........................................................................................................... 146
4.3.1.3 Complexity ............................................................................................................... 148
4.3.1.4 Trialability ................................................................................................................ 149
4.3.1.5 Observability ............................................................................................................ 151
4.3.2 Organisational Factors .................................................................................................... 152
4.3.2.1 Firm Size .................................................................................................................. 152
4.3.2.2 Financial Barriers ..................................................................................................... 154
4.3.2.3 Employees’ IT Knowledge ........................................................................................ 156
4.3.3 Managerial Factors ......................................................................................................... 157
4.3.3.1 Top Management Support ...................................................................................... 158
4.3.3.2 Power Distance ........................................................................................................ 159
4.3.3.3 Uncertainty Avoidance ............................................................................................ 161
4.3.3.4 Manager’s Attitude toward E-commerce Applications ........................................... 163
4.3.4 Environmental Factors ................................................................................................... 165
4.3.4.1 Competitive Pressure .............................................................................................. 165
4.3.4.2 Supplier/Business Partner Pressure ...................................................................... 166
4.3.4.3 Customer Pressure .................................................................................................. 167
4.3.4.4 Government Support ............................................................................................... 168
4.3 Conclusion ............................................................................................................................. 170
Chapter Five ................................................................................................................................. 173
Research Methodology ............................................................................................................... 173
5.1 Introduction ........................................................................................................................... 174

x
5.2 The Research Methodology ................................................................................................... 174
5.3 Sampling Design .................................................................................................................... 179
5.3.1 Target Population ........................................................................................................... 179
5.3.2 Sample Frame ................................................................................................................. 180
5.3.3 Sample Method .............................................................................................................. 181
5.3.4 Sampling Unit ................................................................................................................. 183
5.3.5 Sample Size ..................................................................................................................... 183
5.4 Questionnaire Development ................................................................................................. 184
5.5 Operationalisation of Constructs .......................................................................................... 185
5.6 Questionnaire Design and Measurement ............................................................................. 186
5.7 Ethical Considerations in current Study ................................................................................ 189
5.8 Pilot Study .............................................................................................................................. 190
5.9 Administering the Questionnaire .......................................................................................... 192
5.10 Response Rate ..................................................................................................................... 193
5.11 Non-Response Bias .............................................................................................................. 195
5.12 Data Quality ......................................................................................................................... 196
5.12.1 Reliability ...................................................................................................................... 196
5.12.2 Validity .......................................................................................................................... 197
5.13 Chapter Summary ................................................................................................................ 198
Chapter Six ................................................................................................................................... 200
Data Analysis ............................................................................................................................... 200
6.1 Introduction ........................................................................................................................... 201
6.2 Data Preparation and Collection Process .............................................................................. 202
6.3 Pre-analysis Data Processing ................................................................................................. 202
6.3.1 Data Coding .................................................................................................................... 202

xi
6.3.2 Data Cleaning and Screening .......................................................................................... 203
6.3.3 Assessing Non-response Bias ......................................................................................... 207
6.3.4 Outliers ........................................................................................................................... 207
6.3.5 Normality Test ................................................................................................................ 210
6.3.6 Multicollinearity and Singularity .................................................................................... 213
6.4 Reliability and Validity Analysis ............................................................................................. 215
6.4.1 Initial Reliability Assessment .......................................................................................... 215
6.4.2 Validity Assessment ........................................................................................................ 228
6.4.2.1 Factor Analysis ......................................................................................................... 228
6.3.2.2 Principal Component Analysis Requirements ......................................................... 229
6.3.2.3 Principal Component Analysis ................................................................................. 230
6.3.2.3.1 Attributes of Innovation ................................................................................... 232
6.3.2.3.2 Organisational Factors ...................................................................................... 235
6.3.2.3.3 Managerial Factors ........................................................................................... 236
6.3.2.3.4 Environmental Factors ..................................................................................... 238
6.3.3 Final Reliability Assessment ........................................................................................... 242
6.4 Samples Demographic Profiles .............................................................................................. 244
6.4.1 Respondents Profile ....................................................................................................... 244
6.4.1.1 Participants Ages ..................................................................................................... 244
6.4.1.2 Educational Level ..................................................................................................... 245
6.4.2 Company Profile ............................................................................................................. 245
6.4.2.1 Travel Agencies Types ............................................................................................. 245
6.4.2.2 Travel Agencies Age ................................................................................................. 246
6.4.2.3 Travel Agency Size ................................................................................................... 247
6.4.3 E-commerce Information ............................................................................................... 247
xii
6.4.3.1 Current Level of E-commerce Adoption by Travel Agencies ................................... 248
6.5 Descriptive Statistics of the Research Constructs ................................................................. 249
6.5.1 Attributes of Innovation ................................................................................................. 252
6.5.2 Organisational Factors .................................................................................................... 253
6.5.3 Managerial Factors ......................................................................................................... 256
6.5.4 Environmental Factors .................................................................................................. 257
6.6 Inferential Statistics ............................................................................................................... 259
6.6.1 Data Analysis Methods ................................................................................................... 259
6.6.2 Multinomial Logistic Regression for E-commerce Adoption Levels in Travel Agencies . 260
6.6.2.1 Assessing Multinomial Regression Results .............................................................. 261
6.6.2.2 E-window versus E-connectivity Results ................................................................. 268
6.6.2.3 E-interactivity versus E-connectivity Results ........................................................... 269
6.6.2.4 E-interactivity versus E-window Results .................................................................. 270
6.7 Hypotheses Results for Multinomial Regression Analysis and their Relation to Adoption
Levels of E-commerce in Travel Agencies ................................................................................... 274
6.8 Chapter Summary .................................................................................................................. 280
Chapter Seven ............................................................................................................................. 282
Discussion of Findings ................................................................................................................. 282
7.1 Introduction ........................................................................................................................... 283
7.2 Respondents General Characteristics.................................................................................... 283
7.3 Travel Agents General Characteristics ................................................................................... 283
7.4 General Characteristics of E-commerce in Travel Agencies in Jordan .................................. 284
7.5 Factors Associated with e-commerce Adoption Levels by Jordanian Travel Agencies ......... 285
7.5.1 Attributes of Innovation ................................................................................................. 288
7.5.1.1 Relative Advantage .................................................................................................. 288
7.5.1.2 Compatibility ........................................................................................................... 290
xiii
7.5.1.3 Complexity ............................................................................................................... 291
7.5.1.4 Trialability ................................................................................................................ 292
7.5.1.5 Observability ............................................................................................................ 293
7.5.2 Organisational Factors .................................................................................................... 294
7.5.2.1 Travel Agency Size ................................................................................................... 294
7.5.2.2 Financial Barriers ..................................................................................................... 296
7.5.2.3 Employees’ IT Knowledge ........................................................................................ 297
7.5.3 Managerial Factors ......................................................................................................... 298
7.5.3.1 Top Management Support ...................................................................................... 298
7.5.3.2 Power Distance ........................................................................................................ 299
7.5.3.3 Uncertainty Avoidance ............................................................................................ 300
7.5.3.4 Owners/Managers’ Attitude toward E-commerce Applications ............................. 301
7.5.4 Environmental Factors ................................................................................................... 303
7.5.4.1 Competitive Pressure .............................................................................................. 303
7.5.4.2 Supplier/Partner Pressure ....................................................................................... 304
7.5.4.3 Customer Pressure .................................................................................................. 305
7.5.4.4 Government Support ............................................................................................... 306
7.6 Discussion and Summary of the Research Findings .............................................................. 307
7.7 Revising the Research Objectives .......................................................................................... 315
7.8 Chapter Summary .................................................................................................................. 318
Chapter Eight ............................................................................................................................... 319
Conclusion ................................................................................................................................... 319
8.1 Introduction ........................................................................................................................... 320
8.2 Research Summary ................................................................................................................ 320
8.3 The Study Main Findings ....................................................................................................... 322
xiv
8.3.1 Research Question 1 ....................................................................................................... 322
8.3.2 Research Question 2 ....................................................................................................... 323
8.3.3 Research Question 3 ....................................................................................................... 324
8.3.3.1 Attributes of Innovation .......................................................................................... 325
8.3.3.2 Organisational Factors ............................................................................................. 326
8.3.3.3 Managerial Factors .................................................................................................. 326
8.3.3.4 Environmental Factors ............................................................................................ 327
8.4 Contribution of this study ...................................................................................................... 328
8.4.1 Contribution to Research ............................................................................................... 328
8.4.2 Contribution to Practice ................................................................................................. 330
8.4.2.1 Contribution to Owners/Managers ......................................................................... 331
8.4.2.2 Contribution to Web Vendors and IT Consultants .................................................. 332
8.4.2.3 Contribution to Policy Makers ................................................................................. 333
8.8 Limitations and Suggestions for Future Study ....................................................................... 334
8.6 Conclusion ............................................................................................................................. 336
References ................................................................................................................................... 338
APPENDICES ................................................................................................................................. 409
xv
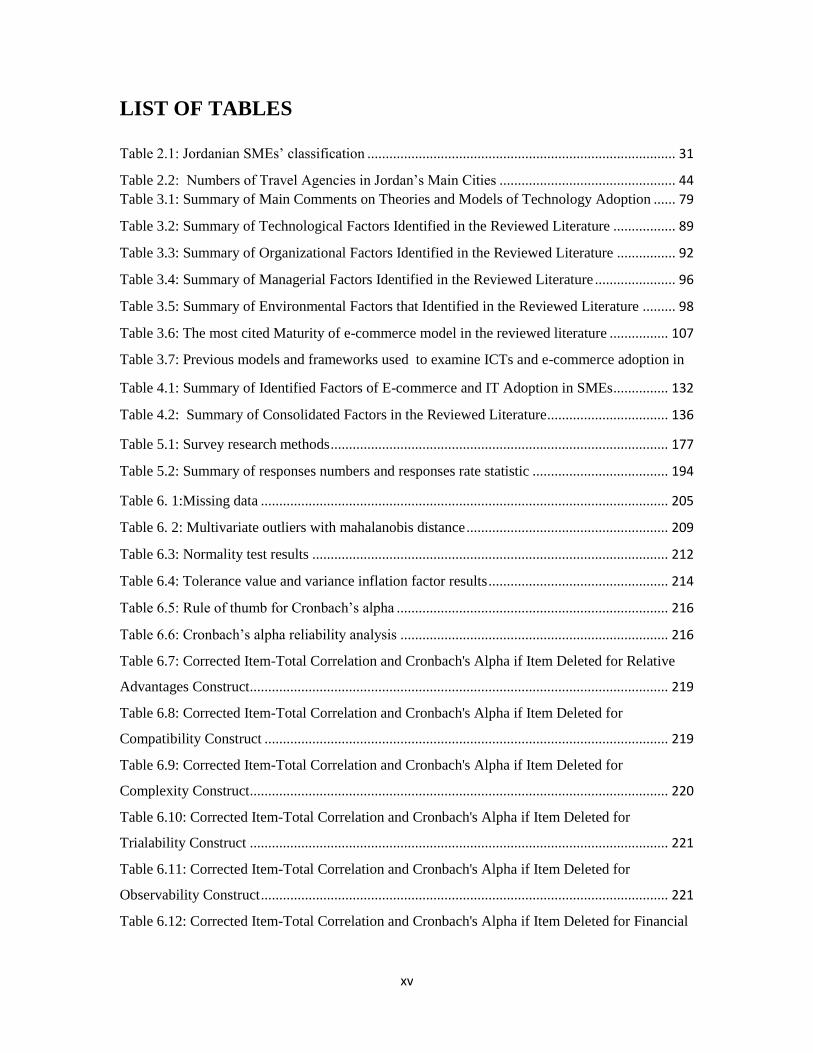
LIST OF TABLES
Table 2.1: Jordanian SMEs’ classification .................................................................................... 31
Table 2.2: Numbers of Travel Agencies in Jordan’s Main Cities ................................................ 44
Table 3.1: Summary of Main Comments on Theories and Models of Technology Adoption ...... 79
Table 3.2: Summary of Technological Factors Identified in the Reviewed Literature ................. 89
Table 3.3: Summary of Organizational Factors Identified in the Reviewed Literature ................ 92
Table 3.4: Summary of Managerial Factors Identified in the Reviewed Literature ...................... 96
Table 3.5: Summary of Environmental Factors that Identified in the Reviewed Literature ......... 98
Table 3.6: The most cited Maturity of e-commerce model in the reviewed literature ................ 107
Table 3.7: Previous models and frameworks used to examine ICTs and e-commerce adoption in
organisation ................................................................................................................................. 126
Table 4.1: Summary of Identified Factors of E-commerce and IT Adoption in SMEs ............... 132
Table 4.2: Summary of Consolidated Factors in the Reviewed Literature ................................. 136
Table 4.3: The Most frequently cited and significant factors in the literature of e-commerce
adoption by SMEs. ...................................................................................................................... 141
Table 4. 4: Summary of Hypotheses and Expected Relationships .............................................. 172
Table 5.1: Survey research methods ............................................................................................ 177
Table 5.2: Summary of responses numbers and responses rate statistic ..................................... 194
Table 6. 1:Missing data ............................................................................................................... 205
Table 6. 2: Multivariate outliers with mahalanobis distance ....................................................... 209
Table 6.3: Normality test results ................................................................................................. 212
Table 6.4: Tolerance value and variance inflation factor results ................................................. 214
Table 6.5: Rule of thumb for Cronbach’s alpha .......................................................................... 216
Table 6.6: Cronbach’s alpha reliability analysis ......................................................................... 216
Table 6.7: Corrected Item-Total Correlation and Cronbach's Alpha if Item Deleted for Relative
Advantages Construct .................................................................................................................. 219
Table 6.8: Corrected Item-Total Correlation and Cronbach's Alpha if Item Deleted for
Compatibility Construct .............................................................................................................. 219
Table 6.9: Corrected Item-Total Correlation and Cronbach's Alpha if Item Deleted for
Complexity Construct .................................................................................................................. 220
Table 6.10: Corrected Item-Total Correlation and Cronbach's Alpha if Item Deleted for
Trialability Construct .................................................................................................................. 221
Table 6.11: Corrected Item-Total Correlation and Cronbach's Alpha if Item Deleted for
Observability Construct ............................................................................................................... 221
Table 6.12: Corrected Item-Total Correlation and Cronbach's Alpha if Item Deleted for Financial
xvi
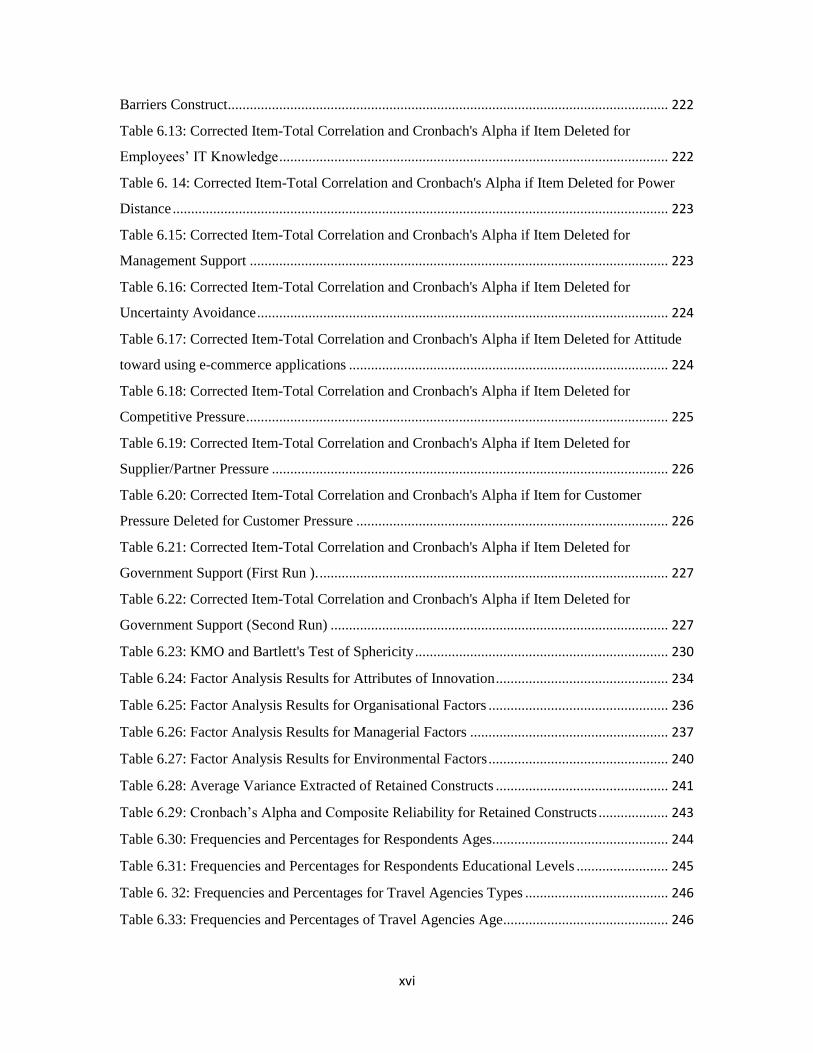
Barriers Construct ........................................................................................................................ 222
Table 6.13: Corrected Item-Total Correlation and Cronbach's Alpha if Item Deleted for
Employees’ IT Knowledge .......................................................................................................... 222
Table 6. 14: Corrected Item-Total Correlation and Cronbach's Alpha if Item Deleted for Power
Distance ....................................................................................................................................... 223
Table 6.15: Corrected Item-Total Correlation and Cronbach's Alpha if Item Deleted for
Management Support .................................................................................................................. 223
Table 6.16: Corrected Item-Total Correlation and Cronbach's Alpha if Item Deleted for
Uncertainty Avoidance ................................................................................................................ 224
Table 6.17: Corrected Item-Total Correlation and Cronbach's Alpha if Item Deleted for Attitude
toward using e-commerce applications ....................................................................................... 224
Table 6.18: Corrected Item-Total Correlation and Cronbach's Alpha if Item Deleted for
Competitive Pressure ................................................................................................................... 225
Table 6.19: Corrected Item-Total Correlation and Cronbach's Alpha if Item Deleted for
Supplier/Partner Pressure ............................................................................................................ 226
Table 6.20: Corrected Item-Total Correlation and Cronbach's Alpha if Item for Customer
Pressure Deleted for Customer Pressure ..................................................................................... 226
Table 6.21: Corrected Item-Total Correlation and Cronbach's Alpha if Item Deleted for
Government Support (First Run ). ............................................................................................... 227
Table 6.22: Corrected Item-Total Correlation and Cronbach's Alpha if Item Deleted for
Government Support (Second Run) ............................................................................................ 227
Table 6.23: KMO and Bartlett's Test of Sphericity ..................................................................... 230
Table 6.24: Factor Analysis Results for Attributes of Innovation ............................................... 234
Table 6.25: Factor Analysis Results for Organisational Factors ................................................. 236
Table 6.26: Factor Analysis Results for Managerial Factors ...................................................... 237
Table 6.27: Factor Analysis Results for Environmental Factors ................................................. 240
Table 6.28: Average Variance Extracted of Retained Constructs ............................................... 241
Table 6.29: Cronbach’s Alpha and Composite Reliability for Retained Constructs ................... 243
Table 6.30: Frequencies and Percentages for Respondents Ages................................................ 244
Table 6.31: Frequencies and Percentages for Respondents Educational Levels ......................... 245
Table 6. 32: Frequencies and Percentages for Travel Agencies Types ....................................... 246
Table 6.33: Frequencies and Percentages of Travel Agencies Age............................................. 246
xvii
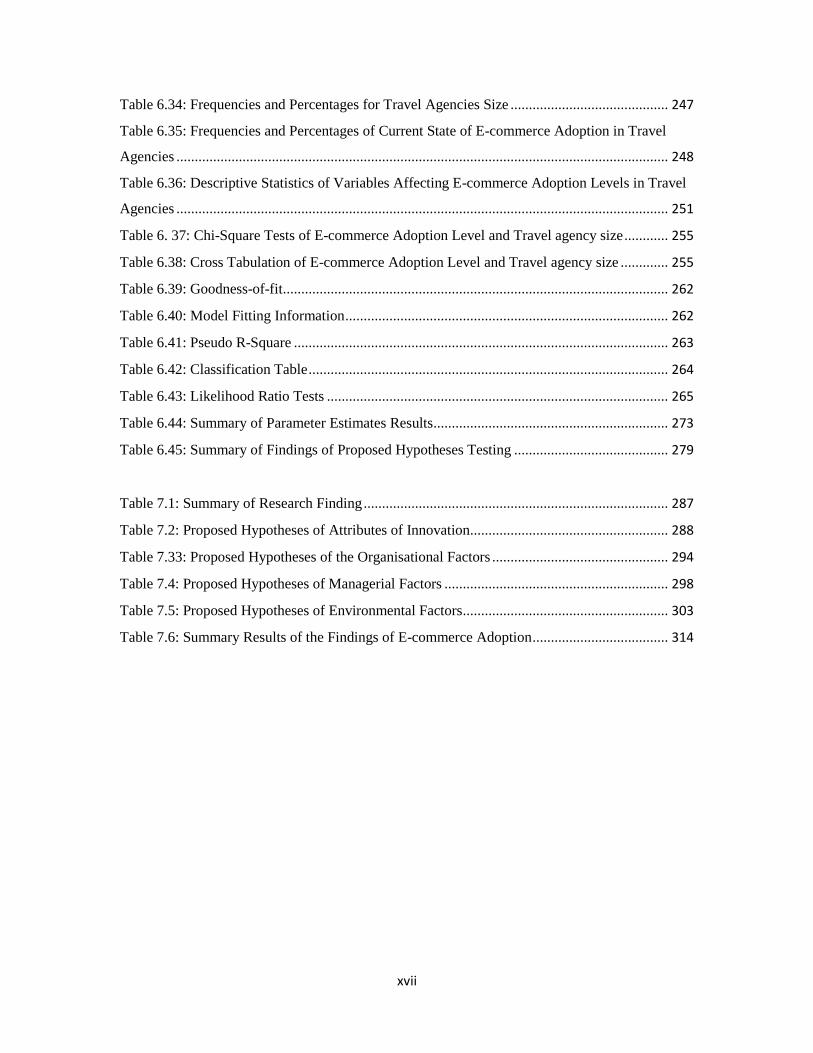
Table 6.34: Frequencies and Percentages for Travel Agencies Size ........................................... 247
Table 6.35: Frequencies and Percentages of Current State of E-commerce Adoption in Travel
Agencies ...................................................................................................................................... 248
Table 6.36: Descriptive Statistics of Variables Affecting E-commerce Adoption Levels in Travel
Agencies ...................................................................................................................................... 251
Table 6. 37: Chi-Square Tests of E-commerce Adoption Level and Travel agency size ............ 255
Table 6.38: Cross Tabulation of E-commerce Adoption Level and Travel agency size ............. 255
Table 6.39: Goodness-of-fit......................................................................................................... 262
Table 6.40: Model Fitting Information ........................................................................................ 262
Table 6.41: Pseudo R-Square ...................................................................................................... 263
Table 6.42: Classification Table .................................................................................................. 264
Table 6.43: Likelihood Ratio Tests ............................................................................................. 265
Table 6.44: Summary of Parameter Estimates Results ................................................................ 273
Table 6.45: Summary of Findings of Proposed Hypotheses Testing .......................................... 279
Table 7.1: Summary of Research Finding ................................................................................... 287
Table 7.2: Proposed Hypotheses of Attributes of Innovation...................................................... 288
Table 7.33: Proposed Hypotheses of the Organisational Factors ................................................ 294
Table 7.4: Proposed Hypotheses of Managerial Factors ............................................................. 298
Table 7.5: Proposed Hypotheses of Environmental Factors ........................................................ 303
Table 7.6: Summary Results of the Findings of E-commerce Adoption ..................................... 314

xviii
LIST OF FIGURES
Figure 2.2: Growth Effect of ICTs in Developed and Developing Countries ............................... 22
Figure 2.3: Internet Users in the World ......................................................................................... 24
Figure 2.4: Structure of ICTs and Internet in Tourism Market ..................................................... 37
Figure 2.5: Global Travel and Online Travel Sales ....................................................................... 39
Figure 2.6: Numbers of Travel Agencies Types in Jordan ............................................................ 45
Figure 3.2: Theory of Reasoned Action ........................................................................................ 50
Figure 3.3: Theory of Planned Behaviour .................................................................................... 51
Figure 3.4: Technology Acceptance Model .................................................................................. 53
Figure 3.5: Technology Acceptance Model 2 ............................................................................... 55
Figure 3. 6: Technology Acceptance Model 3 .............................................................................. 56
Figure 3.7: Technology-Organisation-Environment Framework ................................................. 58
Figure 3.8: Iacovou et al. (1995) Model ........................................................................................ 61
Figure 3.9: Model of Stages in the Innovation-Decision Process ................................................. 62
Figure 3.10: Hofstede’s Cultural Dimensions ............................................................................... 70
Figure 3.11: Hofstede’s Cultural Dimensions in Jordan ............................................................... 74
Figure 3.12: Grandon and Pearson s’ Model ................................................................................. 80
Figure 4.1: The proposed conceptual framework for adoption of e-commerce in Jordanian travel
agencies ....................................................................................................................................... 143 Figure 7.1: E-commerce Adoption Levels by Jordanian Travel Agencies .................................. 285 Figure 8.1: Determinants of E-commerce Adoption ................................................................... 324

xix
LIST OF ABBREVIATIONS
ICTs Information and Communication Technologies
E-commerce Electronic Commerce
EDI Electronic Data Interchange
DOI Diffusion of innovation Theory
TAM Technology Acceptance Model
TRA Theory of Reasoned Action
TPB Theory of Planned Behaviour
TOE Technology–Organisation–Environment Framework
IT Information Technology
SMEs Small Medium Enterprises
E-business Electronic Business
CRM Customer Relationship Management
ERP Enterprise Resource Planning
OECD The Organisation for Economic Cooperation and Development
GDSs Global Distribution Systems
CRSs Computer Reservation Systems
AVE Average Variance Extracted
GDP Gross Domestic Product
JSTA Jordan Society of Tourism and Travel Agents

1
Chapter One
Introduction

2
1.1 Research Background
The Internet revolution has become a major influence on global economy, having
penetrated every aspect of human life, health, education, business, governance and
entertainment. The Internet had a significant contribution to global economy, accounting
for 21% of world GDP over the past five years (Manyika and Roxburgh, 2011). It also
provides great opportunities for organisations to conduct more and better business
transactions, through electronic commerce (e-commerce).
Many studies have confirmed that e-commerce will dominate the world economy and
consider it a significant determinant of future growth in the next ten years (Indecon,
2013; Jagoda, 2010; Gawady, 2005). A recent study by the Census Bureau of the
Department of Commerce (2104) found that the U.S. total retail website sales were $70.1
billion for the second quarter of 2014, marking 15.9% increase from the same period in
2013.
E-commerce offers numerous benefits to small and medium enterprises (SMEs), such as:
reducing operation costs; increasing profits; enhancing customer services; expanding into
new markets and reaching new customers; and improving their competitive positions
(Heung, 2003; Apulu, 2011; Ashrafi and Murtaza, 2008). In addition, e-commerce offers
a survival guarantee and stability to SMEs in the market and provides a competitive
environment (Stansfield & Grant, 2003a, cited in Abou-Shouk et al., 2012).Regarding the
travel industry, the Organisation for Economic Co-operation and Development (OECD)
reported that tourism is the biggest and most dynamic industry in OECD economies and
it has positive effects on developing countries. They also reported that e-commence
provides opportunities to the developing countries to expand their exports and increase

3
the efficiency of tourism industry, which is considered one of the main the key success
factor to sustain their economies (National Tourism Strategy, 2010).
Also, the World Tourism Organisation (2002) reported that the Internet has become the
major influence on the structural changes of tourism industry, being an information-
intensive industry. Also, the Internet users are rapidly increasing with a large portion of
them turning to buy their travel products online (Wang & Cheung, 2004). According to
Poon (1993, P.173), “a whole system of ITs being rapidly diffused throughout the
tourism industry and no player will escape its impacts”. Therefore, it can be argued with
confidence that e-commerce has become an essential and integral part of tourism
industry.
The tourism industry is divided into four distinct sectors: travel, transport, hospitality and
visitor and leisure attractions sector. The travel subsector includes travel agencies and
tour operators. The transport subsectors include airports, port authorities, buses
companies, railways and car rental companies; while the hospitality subsectors include
accommodation, such as hotels and catering such as restaurants. Visitor and leisure
attractions include theatres, cinemas, parks, nightclubs and religious and historical sites.
Travel agencies are considered the backbone of tourism industry as they provide
customers with information about the transport, hospitality and leisure attractions
subsectors. Despite the benefits provided by the Internet to the tourism industry, travel
agencies, as SMEs, have been considered slow adopters of e-commerce due to the
various challenges they encounter when seeking such adoption like the need to
restructure their business strategy as to shift from traditional business models to

4
electronic ones, lack of sufficient budget for implementing e-commerce, complexity of
implementing e-commerce applications and mangers’ perceptions of the strategic value
of e-commerce adoption in SMEs (Grandon and Pearson, 2004; Heung, 2003; Musawa
and Wahab, 2012; Bradley et al., 1993; Poon, 1993).
In Jordan , SMEs are considered very important to jordan’s economoy ,contributing about
50% of total GDP , notable significance as 97% of total number of employment and 96%
of all Jordan’s exports (JEDCO, 2011; Al-Rawashdeh, 2011). SMEs in Jordan are mainly
consisted of three main sectors ,namely : services , industry and agriculture. According to
Feral Reseach Divisin (2006), Jordan’s economy is service-oriented as a services sector
accounts for over 70% of Jordan’s total GDP. According to World Trade Organization
(2013,b) , tourisim industry in Jordan contributes about 20.3% of total GDP and travel
agencies provide 1% of countris employment.
According to JEDCO (2011) , successful SMEs are very important to Jordan’s economic
growth as e-commerce adoption by SMEs is considered as significant component stratigy
to survive in the market as technology adoption provides many immense benefits for
SMEs that makes them able to have ultimate competitive advantage such as ablilty to
compete with larger organization. However, many studies argued that the diffusion and
adoption of e-commerce by Jordanian SMEs are slower than and far behind larger
organisations (Al-Dmour and Al-Surkhi (2012) Al-weshah and Al-zoubi (2012)
Allahawiah et al. (2010).
Travel agency as a category of SMEs are described as slow adopter and still in early
levels of e-commerce adoption (Kokash, 2012). According to Dajani (2012) , Jordanian

5
travel agents are facing threat to demise from market due rapid diffusion of e-commerce
applications. This is because e-commerce has changed tourism market stuture and
provides opportunities to the large organization such as flight companies and hotels to
encourage their customers to bypass intermediaries such as travel agents and buy their
travel products directly through their own website.
Therefore, investigation of e-commerce adoption by SMEs in developing countries , and
travel agencies in particular constitutes an emerging topic to research with limited
number of studies have conducted to date. The following section will discuss the rational
of the study.
1.2 Rationale of the Study
A number of studies found e-commerce to be widely adopted by firms that are larger than
SMEs, identifying many reasons of slow e-commerce adoption by SMEs such as limited
financial resources, firm size, security, computer literacy and inadequate ICTs resources
including both software and hardware (Pham et al., 2004; Kotelnikov, 2007; Simpson &
Docherty, 2004; Kapurubandara and Lawson, 2006). According to Lai (1994), cited in
Pham et al. (2004), investigating technology adoption by SMEs cannot necessarily be
generalized to large companies.
Also, SMEs in developing countries is slower in adopting e-commerce and technology
than those of developed countries (Khan et al., 2010; Hashim, 2007; Alzougool and
Kurnia, 2008). Many prior studies suggested that factors affecting e-commerce adoption
by SMEs in developing countries are different from those affecting such adoption in
developed countries. Several suggested that the main reasons of these differences are of a
6
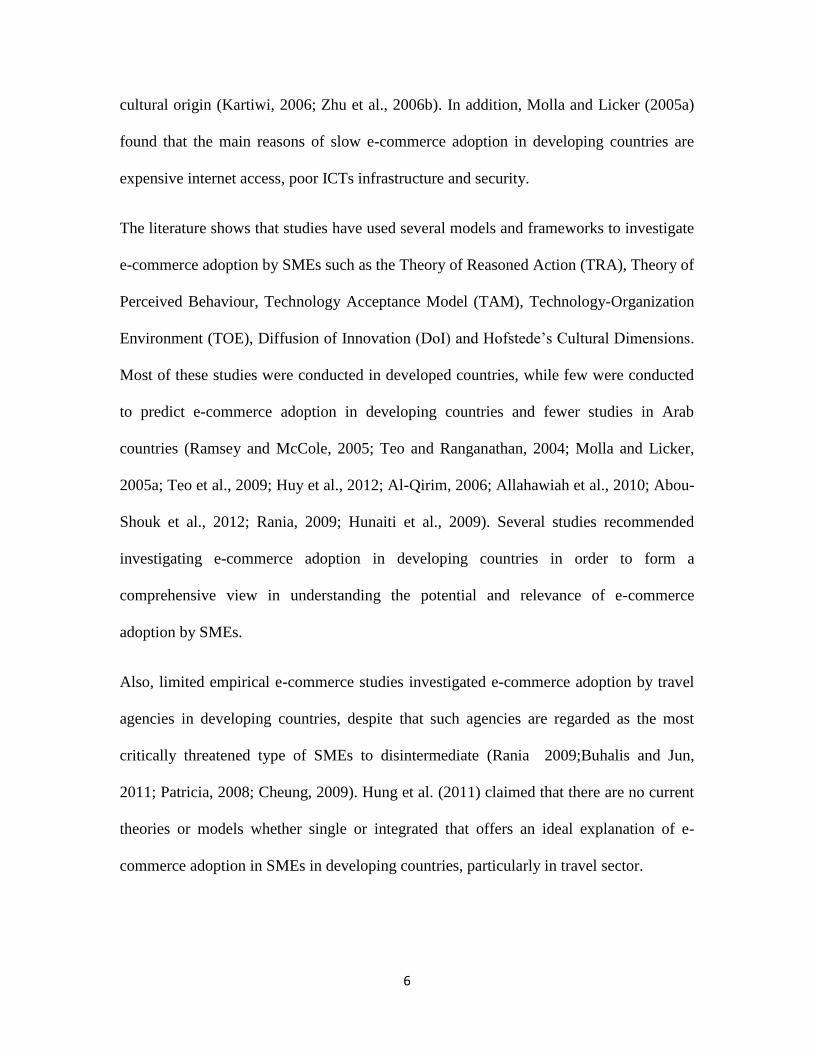
cultural origin (Kartiwi, 2006; Zhu et al., 2006b). In addition, Molla and Licker (2005a)
found that the main reasons of slow e-commerce adoption in developing countries are
expensive internet access, poor ICTs infrastructure and security.
The literature shows that studies have used several models and frameworks to investigate
e-commerce adoption by SMEs such as the Theory of Reasoned Action (TRA), Theory of
Perceived Behaviour, Technology Acceptance Model (TAM), Technology-Organization
Environment (TOE), Diffusion of Innovation (DoI) and Hofstede’s Cultural Dimensions.
Most of these studies were conducted in developed countries, while few were conducted
to predict e-commerce adoption in developing countries and fewer studies in Arab
countries (Ramsey and McCole, 2005; Teo and Ranganathan, 2004; Molla and Licker,
2005a; Teo et al., 2009; Huy et al., 2012; Al-Qirim, 2006; Allahawiah et al., 2010; Abou-
Shouk et al., 2012; Rania, 2009; Hunaiti et al., 2009). Several studies recommended
investigating e-commerce adoption in developing countries in order to form a
comprehensive view in understanding the potential and relevance of e-commerce
adoption by SMEs.
Also, limited empirical e-commerce studies investigated e-commerce adoption by travel
agencies in developing countries, despite that such agencies are regarded as the most
critically threatened type of SMEs to disintermediate (Rania 2009;Buhalis and Jun,
2011; Patricia, 2008; Cheung, 2009). Hung et al. (2011) claimed that there are no current
theories or models whether single or integrated that offers an ideal explanation of e-
commerce adoption in SMEs in developing countries, particularly in travel sector.
7
Reviewing the literature on e-commerce adoption shows that most of previous studies
focused on factors affecting e-commerce adoption by SMEs as simple dichotomy, that is
‘adopters versus non-adopters’ (Sparling et al., 2010; Hung et al., 2012; Aghaunor and
Fotoh, 2006; Teo and Ranganathan, 2004; Sutanonpaiboon and Pearson, 2008; Andreu et
al., 2010; Huy et al., 2012; Teo et al., 2009). Only a limited number of these studies
identified factors that distinguish different levels of e-commerce adoption by SMEs
(Chen and McQueen, 2008; Senarathna and Wickramasuriya, 2011; Abou-Shouk et al.,
2012; Raymond, 2001).
Since the internet revolution and e-commerce’s wide availability many studies have
described e-commerce maturity models in SMEs varying from basic adoption that
includes Internet access, which enables organizations to use facilities such as e-mail in
business activities moving to more sophisticated levels of e-commerce adoption such as
online payment, customer relationship management and enterprise resource planning
within companies that provide online services for both employees and customers (Molla
and Licker, 2005; Boisvert, 2002; Daniel et al., 2002; Rayport and Jaworski, 2002; Rao et
al., 2003; Duncombe et al., 2005; Lefebvrea et al., 2005).
Although several different models were identified in the literature under a variety of
names for the stages and numbers of e-commerce adoption levels, all these models have a
common goal: Provide guidance in assessing the maturity level of e-commerce in SMEs
(Molla and Licker, 2004). Limited studies were conducted to investigate and explain the
8
potential factors that might be associated with different levels of e-commerce adoption by
SMEs in order to address these factors and attain a mature e-commerce adoption.
The current study seeks to review the background, strengths and weaknesses of the most
dominant models, theories and maturity models related to e-commerce adoption by SMEs
in both developed and developing countries in order to fill gaps by developing a
comprehensive framework that best explains e-commerce adoption levels by Jordanian
travel agencies as an example of SMEs and developing countries.
1.3 Importance of the Study
It is clear that there is lack of literature on the factors affecting e-commerce adoption by
SMEs in developing countries, such as Jordan. Travel agencies can be considered one of
the most critically-threatened types of SME facing demise if they do not transform from
traditional business strategies to electronic strategies such as e-commerce adoption
(Abou-Shouk et al., 2012). This is attributed to the fact that travel products are
information-based, where travel agencies act as agents between travel suppliers such as
airlines and providers of accommodation, sea cruises, railways, car rentals, tour packages
and travel insurance on the one hand and consumers on the other. This characteristic
distinguishes travel agencies from most other service providers in that they sell their
services in the form of information rather than physically. Moreover, their income is
generated through the information they provide to customers about the services of travel
suppliers, as a commission paid from these latter.

9
The Internet penetration is rapidly increasing, urging travel suppliers to change their
business strategies by encouraging customers to buy their travel products directly through
the Internet without resorting to traditional travel agencies (Cheung and Lam, 2009;
Buhalis an Jun, 2011). In addition, travelers not only find the Internet a flexible and
accessible gateway to search for travel information, packages and prices but also consider
it easier to buy their travel products by bricks and clicks rather than dealing with a
traditional travel agency, which is called disintermediation (Abou-Shouk et al., 2012;
Patricia, 2008; Ma et al., 2003; Cheung and Lam, 2009;).
Therefore, travel agencies must change their strategy by adopting e-commerce in their
business in order to reach out to their customers and their suppliers. Many studies agreed
that beside the traditional business approach to travel business, travel agencies’ adoption
of e-commerce provide them with the ability to survive in the global travel market and
increase their profits (Buhalis and Jun, 2011; Cheung and Lam, 2009). On the other hand,
low level implementation of e-commerce due to several factors such as high costs,
limited strategic scope, mangers, e-commerce perception, employee technological skills
and partner participation (Heung, 2003; Buhalis and Jun, 2011).
Many studies, therefore, paid special attention to the impact of e-commerce on travel
agencies in developed countries (Andreu et al., 2010; Vatanasakdakul and D'Ambra,
2006; Braun, 2005; Cheung and Lam, 2009; Warnaby et al., 2008; Wang and Cheung.,
2004; Raymond, 2001; Standing et al., 1998). However, few studies addressed the factors
affecting e-commerce adoption by travel agencies in developing countries (Heung, 2003;
Kenneth et al., 2012; Li and Buhalis, 2006; Hussain and Noor, 2005). The Arab countries
are a good example of the shortcoming (Hussein, 2009; Abou-Shouk et al., 2012).
10
In this regard, this study attempts to fill the gap in the existing literature by identifying
the factors that influence and inhibit e-commerce adoption in Jordanian travel agencies.
1.4 Research Aim and Objectives
The main aim of this research is to contribute e-commerce literature by developing a
comprehensive model in order to explain the factors affecting e-commerce adoption by
SMEs in developing countries particularly travel agencies in Jordan. This aim is achieved
by meeting the following objectives:
Conduct a critical review of relevant literature related on ICTs and e-commerce
and develops a conceptual framework that can be used to identify the factors
associated with the adoption level of e-commerce in Jordanian travel agencies.
Study the current e-commerce adoption level in travel agencies in Jordan.
Analyse data and validate the proposed conceptual model to determine the factors
associated with e-commerce adoption level in Jordanian travel agencies.
Provide valuable guidance to decision makers, IT consultants and web vendors on
adopting, facilitating and accelerating the diffusion of e-commerce by Jordanian
travel agencies.
To achieve the above objectives, the following questions are posed:
1. What factors can be included in the proposed conceptual framework to study and
identify e-commerce adoption by Jordanian travel agencies?
2. What is the current state of e-commerce adoption level in Jordanian travel agencies?
3. What are the significant factors associated with the adoption level of e-commerce in
Jordanian travel agencies?

11
1.5 Research Methodology
Based on the above objectives, an explanatory research based on a deductive approach
was considered as the most appropriate for this study, as this research attempts to
understand e-commerce adoption by Jordanian travel agencies and determine the
significant factors associated with the adoption level in order to provide a general
statement. This can be achieved through an in-depth investigation of previous studies’
findings and relevant models as to develop a conceptual framework, and propose
hypotheses based on that framework and test them.
This characterizes the study that is intertwined with a quantitative method of data
collection and analysis. The primary data is collected through survey using self-
administered questionnaire, being the most appropriate tool for explaining relationships
between variables. The questionnaire forms were hand-delivered to target population, the
owners/managers of travel agencies in Jordan.
The sampling frame was obtained from the Jordan Society of Tourism & Travel Agents
(JSTA), using simple random sampling method. Close-ended questions were used in the
questionnaire that consists of three parts the first of which includes demographical
questions about the travel agency and respondents. Questions of the second part address
the current level of e-commerce adoption (dependent variable), while those of the third
are directed at independent variables derived from the original questionnaires of DoI,
TAM, TOE and Hofstede’s Cultural Dimensions. An Arabic version of the questionnaire
was handed to respondents.
12
A cover letter was attached with the questionnaire forms explaining the purpose of the
study and observing the ethical guidelines of School Ethics Committee at Cardiff
Metropolitan University. A pilot study was conducted on 15 of the travel agencies
owners/mangers upon whose outcomes changes were introduced to the questionnaire.
The final version of the questionnaire was distributed to 300 owners/managers of
Jordanian travel agencies. The total number of valid questionnaires was 206, constituting
a response rate of 68.6%. All data were coded, screened, refined and analysed using the
Statistical Package for Social Sciences (SPSS) Version 20.0. The results showed that all
data had an adequate level of validity and reliability. The non-response bias was assessed,
showing no significant differences between respondents and non-respondents. Thus, the
data collected from participants was representative of the sample chosen.
The data analysis in this study consisted of two phases: descriptive analysis and
inferential analysis. A descriptive analysis was undertaken as the first phase of data
analysis as to summarize data meaningfully, making it simpler for interpretation. The
inferential analysis of the second phase was conducted to test the study’s hypotheses.
Multinomial logistic regression was employed as inferential statistical technique in order
to test and determine the factors associated with e-commerce adoption level by Jordanian
travel agencies.
1.6 Research Contribution
The main original contribution of this research is developing a comprehensive conceptual
framework by integrating many theoretical frameworks in order to produce a best
explanation of factors affecting e-commerce adoption by travel agencies, which expands
13
the body of knowledge on information systems particularly in the context of e-commerce
adoption in developing countries.
Moreover, this study also contributes to theory by investigating the different levels of e-
commerce adoption explanations for travel agencies in Jordan. It explains the factors that
affect the adoption of different levels. This explanations is a contribution to extant
maturity models explanation , specifically in the context of Jordan travel agencies.
It was found that limited previous studies have focused on different levels of e-
commerce maturity adoption by SMEs, as and most studies of ecommerce diffusion used
a dichotomous approach in examining adoption (i.e., adoption versus non-adoption).
Based on this , this study attempts to explore the reasons that influence SMEs in adopting
different levels of e-commerce maturity and suggests how SMEs can be moved to higher
levels of e-commerce maturity. Therefore, it can be argued that this study’s approach of
conceptualizing and evaluate different levels of e-commence maturity adds value to
relevant literature.
In view of slow adoption of e-commerce by SMEs in Jordan, there is a need for
investigating the underlying causes (Alamro and Tarawneh, 2011). The findings of this
study may provide rich information to the existing literature on e-commerce adoption by
SME in developing countries particularly travel agencies sector, by presenting the factors
that affect the management decisions on the adoption level.
Therefore, this study provides input to managers, policy makers and IT vendors and
consultants about e-commerce adoption in Jordanian travel agencies. It provides
14
managers with a useful guidance on enhancing their businesses by investing the
advantages of e-commerce, while it also enables IT vendors and consultants, seeking to
understand the business profiles of travel agencies and managers’ perceptions regarding
e-commerce adoption, to identify the appropriate strategies that effectively address
agencies needs in adopting a relevant level of e-commence applications.
Moreover, the findings of this study will be useful for policy makers seeking to
understand the factors that affect e-commence adoption in travel agencies in order to
design policies that promote e-commerce adoption among travel agencies in Jordan.
Finally, the findings could be applied to SMEs in other sectors in Jordan.
1.7 Thesis Structure
Chapter Two presents tourism industry in Jordan and its relationship with technology. It
first presents the importance of tourism industry to economy in developing countries
particularly Jordan and the Arab countries. It moves to overview the importance, benefits
and challenges of adopting ICTs and e-commerce in developing countries, Jordan and
Arab countries in particular. This is followed by a brief description of Small-Medium
Enterprises (SMEs), their characteristics and economic role.
It also addresses ICTs and e-commerce phenomena and their relationship to SMEs by
exploring the drivers and challenges of ICTs and e-commerce adoption in developing
countries, specifically Jordan. Then, it introduces the affiliation of ICTs and e-commerce
in tourism industry, its benefits and challenges. Finally, the chapter describes the nature
of travel agencies business and its relevance to ICTs and e-commerce, the importance of
e-commerce adoption in travel agencies and the immanent threats facing them.
15
Chapter Three reviews relevant literature, presenting the most prominent theories and
models in technology adoption by SMEs and the most common sequences in e-commerce
adoption levels by SMEs. Also, it discusses the most influential factors of e-commerce
adoption in literature.
Chapter Four offers a conceptual framework and hypotheses of the bases of identifying
weaknesses and strengths of models and theories presented in Chapter Three as to
embark on the conceptual framework that best explains the factors affecting e-commerce
adoption by Jordanian travel agencies.
Chapter Five discusses the research methodology and the selection of research
appropriate methods. It also presents the rationale of the research design and strategies
and their viability for this study in terms of data collection process, sampling unit and
sample size. The questionnaire design and development, and measurement of variables
and ethical considerations are also discussed. . Finally, the chapter outlines the validity
and reliability of constructs and the suitable techniques used to verify them.
Chapter Six presents the details of statistical procedures and the outcomes of data
obtained from the survey conducted on the basis of research methodology presented in
Chapter Five. The chapter starts with data preparation, coding, refining and screening. It
moves to inspecting and explaining non-response bias, multicollinearity and outliers. The
reliability and validity are also examined through Cronbach’s alpha and factor analysis,
respectively. This is followed by a descriptive analysis of the demographic profile
including respondent’s profile, company’s profile and e-commerce information and an
analysis of the research constructs using independent sample t-test as to determine the

16
differences in levels of e-commerce adoption in travel agencies. Finally, the inferential
statistics technique using multinomial regression analysis was applied in testing the
hypotheses associated with the research model.
Chapter Seven discuses the findings presented in Chapter Six, starting with the results of
the surveyed sample in terms of respondent’s profile, travel agency profile and the
current state of e-commerce adoption. A subsequent discussion of the outcomes of
research hypotheses examination compares them with those of the literature review
presented in Chapter Four.
Chapter Eight presents the main findings of this study in addition to its main
contributions. Finally, the study’s limitations and suggestions for future research are
outlined.

17
Chapter Two
Technology and Tourism

18
2.1 Introduction
This chapter consists of two parts of reviewed literature divided into nine sections. The
first part involves ICTs and e-commerce in developing countries, followed by presenting
the country profile of Jordan, which involves an overview of Jordan’s culture, economy
and resources, followed by presenting ICTs and e-commerce in Jordan. Then a profile of
small-medium enterprises (SMEs), their characteristics, challenges and role in Jordan’s
economy are presented. The fourth section explores SMEs and e-commerce adoption in
Jordan including challenges, opportunities and technology infrastructure.
The second part of reviewed literature addresses certain views of relevance to this study.
It starts with presenting tourism industry and its effect on the economy, particularly in
developing courtiers. This is followed by showcasing the importance of tourism industry
in Jordan. The focus is then turned to the relationship between ICTs and e-commerce in
tourism industry, discussing the benefits observed in e-commerce adoption and the
threats accompanied with e-commerce adoption in tourism industry, particularly travel
agents. This is followed by an overview of travel agencies in Jordan, while the last
section addresses relationship between e-commerce and travel agencies in Jordan.
2.2 Information and Communication Technologies and E-commerce in Developing
Countries
Information and communication technologies (ICT) include hardware, software,
computer networks, telecommunications such as telephone lines, mobile, internet,
wireless signals and audio visual systems; enabling users to create, access, store, transmit
19
and manipulate information. In other words, ICT is simply articulated as a diversity of
computerized technologies (Apulu and Latham, 2009c).
With the development in the Internet and World Wide Web technologies in 1990s, the
rapid expansion of the Internet has become commercialized and affordable among
businesses as well as individuals, giving birth to the concept of ‘e-commerce’. There is
no agreed definition of the term of ‘e-commerce’ among researchers. For example, Goel
(2007, p.1) defined e-commerce as “The e-commerce can be defined as a modern
business methodology that addresses the needs of organizations, merchants, and
consumers to cut costs improving the quality of goods and services and increasing the
speed of service delivery, by using Internet”.
Furthermore, Wen et al. (2001), cited in Purwati (2011, p.78), defined e-commerce as
“buying and selling of product, services, or information via computer network, mainly
the internet”. Wigand (1997, p.2) provided another definition of e-commerce as
“Electronic commerce denotes the seamless application of information and
communication technology from its point of origin to its endpoint along the entire value
chain of business processes conducted electronically and designed to enable the
accomplishment of a business goal. These processes may be partial or complete and may
encompass business-to-business as well as business to consumer and consumer-to-
business transactions”.
Grandon and Pearson (2004) state that the definition of e-commerce depends on research
aims and objectives. However, the term e-commerce is based on two main elements. The
first element is that all business activities such as buying, selling and exchanging
20
information occur by electronic means while the second element is the electronic medium
that enables these business activities such as computer networks, electronic data
interchange (EDI) and the internet.
According to Tagini (2000, p.1), “E-commerce is a recent phenomenon in the world of
business. It represents the most radical force of change that nations have encountered in
commerce since the Industrial Revolution”. Yet, no one has any doubt that e-commerce is
the fastest growing retail in world market and is expected to grow by 20% in 2014
(eMarketer, 2014).
E-commerce is classified into many categories, the most common of which are Business-
to-Business (B2B), Business-to-Customer (B2C) and Customer-to-Customer (C2C).
Business-to-Business is defined as electronic transaction between companies such as
retailers and suppliers, while Business-to-Customer involves electronic business activities
between companies and customers such as enabling customers to buy tangible or
intangible products/services from retailer through the electronic network. Customer-to-
Customer includes electronic transaction between customers through a third party such as
online auctions (Nemat, 2011).
Information and communication technology has become essential for the growth of
economic development for both firms and macro levels. At the macro-level, Kramer et
al. (2007) argue that ICT and e-commerce are important parts of macro-level growth,
identifying ICT and e-commerce to have a significant impact on GDP growth in both the
developed and developing countries led by telecommunications, Internet service
providers, and mobile investments.
21
Many studies provided evidence of the importance of ICT and e-commerce in economic
growth in the developing countries. They found that ICT enabled e-commerce to play a
significant role in enhancing global trade and facilitating developing countries’
integration in the global economy. Moreover, ICT and e-commerce help developing
countries to overcome their economic problems by increasing productivity, accessing
global markets with little or no barriers and reducing transaction costs (Kraemer et al.,
2002; Humphrey et al., 2004).
Qiang et al. (2009) conducted a study to investigate the impact of broadband on
sustainable economic growth in developed and developing countries, finding a positive
and significant relationship between the level of communication technology adoption and
the rate of economic growth in these countries. Figure 2.1 shows that penetration of
fixed, mobile, internet and broadband adoption can increase GDP growth to 0.43%,
0.60%, 0.77% and 1.38% in the developing countries and 0.73%, 0.81%, 1.12% and
1.21% in the developed countries, respectively.
As a result, it was found that higher levels of communication technology such as
broadband has more effect on economic growth than lower levels of internet technologies
such as fixed and mobile telephony, and internet communication.
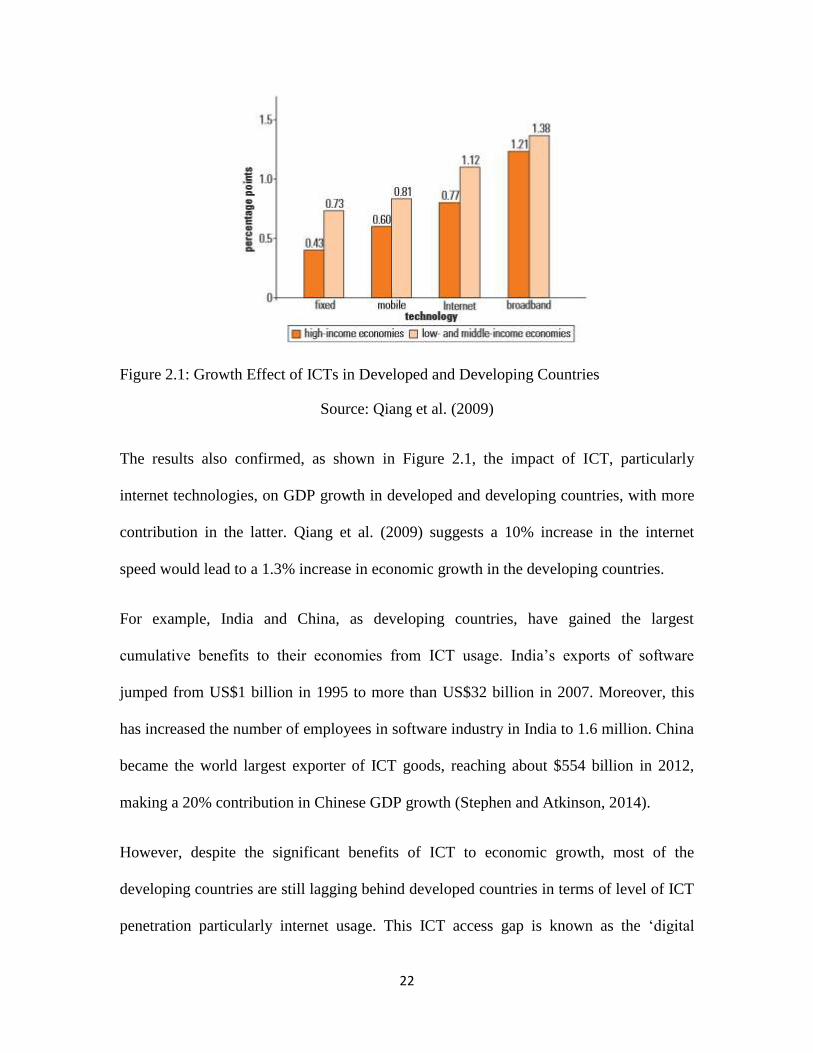
22
Figure 2.1: Growth Effect of ICTs in Developed and Developing Countries
Source: Qiang et al. (2009)
The results also confirmed, as shown in Figure 2.1, the impact of ICT, particularly
internet technologies, on GDP growth in developed and developing countries, with more
contribution in the latter. Qiang et al. (2009) suggests a 10% increase in the internet
speed would lead to a 1.3% increase in economic growth in the developing countries.
For example, India and China, as developing countries, have gained the largest
cumulative benefits to their economies from ICT usage. India’s exports of software
jumped from US$1 billion in 1995 to more than US$32 billion in 2007. Moreover, this
has increased the number of employees in software industry in India to 1.6 million. China
became the world largest exporter of ICT goods, reaching about $554 billion in 2012,
making a 20% contribution in Chinese GDP growth (Stephen and Atkinson, 2014).
However, despite the significant benefits of ICT to economic growth, most of the
developing countries are still lagging behind developed countries in terms of level of ICT
penetration particularly internet usage. This ICT access gap is known as the ‘digital
23
divide’ (United Nations, 2010), which is caused by insufficient technological
infrastructure and ICT availability, lack of financial resources for ICT, low computer
literacy and technology skills, high cost of ICT equipment and internet access, and poor
IT policies and regulations (OECD, 2004).
Alos, there are other barriers to potential impact of ICT in developing counties such as
socio-economic factors including educational system, payment system and logistics; and
socio-cultural factors including language, transactional trust, and personal contact
(Lawrence and Tar, 2010).
An empirical study by Alrawabdeh et al. (2012) to investigate the current state of ICT
penetration in Arab countries identified the availability of access to fixed telephone lines,
mobile telephones, internet and broadband subscription and personal computer access.
The study shows that Arab countries are still not active initiators of these ICT modes and
still lag behind developed countries and that ICT infrastructure and cost are the main
barriers of a better ICT penetration in these courtiers. They also found a negative
significant relationship between global national income (GNI) per capita and internet
penetration in Arab countries. For example, UAE that had the highest internet penetration
in Arab countries constituted 0.8% of the monthly GNI, followed by Bahrain with 1.3%
of the monthly GNI, while Syria and Yemen had the least internet penetration with 10.3%
and 134.9%, respectively.
Moreover, Arendt (2008), Molla and Licker (2005a), and Alrawabdeh et al. (2012) state
that government policies and legal framework have a significant role in increasing ICT
and e-commerce adoption and penetration in Arab countries. They suggest that Arab

24
countries should build a reliable legal framework that encourages individuals and firms to
adopt new technologies and governments to reform the policies such as liberalization and
privatization of telecommunication industry which would enhance and support
development of ICT infrastructure.
Also, a recent study by World Internet Stats (2014), found that Middle Eastern (mostly
Arab) countries were the second least in the number of internet users in the world
accounting for 3.7%, only second to Oceania/Australia which accounted for 0.9%. (see
Figure 2.2).
Figure 2.2: Internet Users in the World
Source: Internet Word Stats- www.internetworldstats.com/stats.htm
At the firm level, many studies found that ICT and e-commerce adoption had a positive
and significant role in boosting organizations’ efficiency. For example, the World Bank,
cited in (Khalil and Kenney, n.d., p.7), conducted a survey of over 20,000 businesses in
developing countries and suggests that “firms using ICT see faster sales growth, higher
productivity and faster employment growth”. Also, Gupta (2000) confirmed that ICT has
a significant impact on operation, structure and strategy of organizations, as well as
communication with consumers.

25
Many empirical studies show several impacts of ICT and e-commerce on organizations
such as acquiring competitive advantages, increasing productivity and profitability,
reducing inefficiency, improving and increasing access to global market, enhancing
performance, creating new business and improving management (Peppard, 1993; Kew
and Herrington, 2009; Ghobakhloo et al., 2011; Huy et al., 2012).
According to Oxford Economics (2011), cited in Stephen and Atkinson (2014),
productivity growth is increased in firms adopting ICT about five times more than non-
ICT firms. However, benefits of adopting ICT, particularly e-commerce, are not always
guaranteed, as firms need to apply technology properly (Ma et al., 2003) and have
appropriate skills and business plans such as business strategies and process. However,
the percentage of firms with access to the ICT and e-commerce adoption in developing
countries is still lower than that in developed countries, due to several factors. Many
studies found that cultural factors such as computer anxiety, language, face-to-face
contact with sellers and suppliers and attitude toward ICT usage are important barriers to
ICT and e-commerce diffusion in firms in developing countries (Van Dijk, 2006; Grazzi,
and Vergara, 2012; Kapurubandara and Lawson, 2006).
Second, several studies (Kapurubandara and Lawson, 2006; Ashrafi, R. and Murtaza,
2008; Archer et al., 2008; McGrgor and Varazalic, 2006; Robert et al., 2010) found that
internal barriers in the firms were major impediments of adopting ICT and e-commerce,
arguing that internal barriers include managerial and organizational barriers. Managerial
barriers included lack of time, ICT skills and awareness; resistance of change and
unfavourable top management attitudes among decision makers were significant factors
hindering e-commerce diffusion in developing countries’ firms. Organisational factors

26
included return on investment, cost of ICT and e-commerce implementation and access
and firm size.
Third, firms in developing countries are inhibited in implementing ICT and e-commerce
due to external barriers (Kapurubandara and Lawson, 2006) such as telecommunications
infrastructure. Many studies addressed the external barriers and their impact on ICT and
e-commerce adoption by firms in developing countries (Kapurubandara and Lawson,
2006; Robert et al.; 2010; Ashrafi and Murtaza, 2008; Robert et al., 2010) and agreed that
lack of government legal and regularity systems was a serious barrier of ICT growth.
Other external barriers include poor delivery and transport systems which hinder
distribution of the products sold through the internet. Also, uncertainty of taxation rules
was found as directly hindering adoption of ICT and e-commerce in organizations
(Alamo, 201; Dedrick and Kraemer, 2001).
It can be concluded that developing countries are not yet ready to fully benefit from ICT
usage, despite its becoming a necessary pillar of economic growth. Therefore, this study
focuses on the internet technology as medium for e-commerce adoption in the developing
countries including Jordan which falls under this category of countries.

27
2.3 ICTs and E-commerce in Jordan
This section presents information about country profile, ICTs and e-commerce
infrastructure, and SMEs and e-commerce in Jordan.
2.3.1 Overview of Jordan
Jordan has a strategic location being in the heart of Middle East, bordered by five
countries: Saudi Arabia from southeast, Iraq from northeast, Israel and Palestinian
territories from west and Syria from north. Jordan has a total of 90,000 square meters.
According to the World Population Review (2014), Jordan is inhabited by over than 7
million, 70% of whom are under the age of 30 years. Jordan’s population has
dramatically increased since 2012 as over one million of Syrian and Iraqi refugees poured
into Jordan due to war and violence in these countries. The official language of Jordan is
Arabic, while English is widely spoken as a second language. Arabs constitute 98% of
the population and the remaining includes Armenians, Chechens and Kurds. The majority
of Jordanians is Sunni Muslims constituting 92% of the population, followed by 6% as
Christians and 2% as Shia, Sophi and Durze (Jordan embassy, 2013).
According to the World Health Organisation (2013, p.13) “Jordan has limited natural
resources and suffers from severe fresh water scarcity; it is ranked among the five most
water-poor countries in the world”. Also, Jordan suffers from scarcity of natural
resources such as oil and gas. Therefore, it mainly relies on imported energy resources to
meet domestic demand, which consumes 40% of the country’s budget. However, Jordan
enjoys abundant quantities of phosphate and potash, making the country the second
largest exporter of phosphates in the world, with an annual production around 7 million

28
tons. Phosphate and potash together generated $564 million which constitutes about 22%
of Jordan's domestic export earnings.
Jordan is classified by World Bank (2014) as upper-middle income developing country.
According to the Department of Statistics of Jordan (2014) unemployment was estimated
at 12% for the first half of 2014, being higher among females who constituted 25.4% of
the unemployed population. On the other hand, more than 25% of the population is below
the poverty line. Finally, inflation has increased by 6.1%. Therefore, as poverty,
unemployment and inflation are of the most challenging economic problems facing
Jordan’s economy, the government lunched a national agenda to address these issues.
For examples, official policies encouraged private sectors to play an active role in
economic growth by granting them several incentives such as tax exemptions for 9 years,
custom exemptions and unlimited profit repatriation. Moreover, Jordan’s membership in
the WTO and partnership with the European Union enabled it to access the global
market, attract foreign investments and improve its economy (Jordan embassy, 2013). In
2011, foreign investments in Jordan reached around US$1.5 billion, being focused in the
information and telecommunication sector, banking sector and tourism sector (OECD,
2013).
Against the backdrop of scarce natural resources, Jordan’s economy is service-oriented as
services sector contributed more than 70% of total GDP (Federal Research Division,
2006). This reliance encouraged the government to render more attention to services
sectors such as tourism as shall be discussed in the following sections.

29
2.3.2 ICTs and E-commerce in Jordan
Jordan displayed a steady growth in information and communication technologies
infrastructure in the last decade. Strategic plans were developed and investments
allocated to optimize ICTs infrastructure, increase ICTs literacy and liberalize and
regulate the ICTs market. Although the environment for e-commerce is still in early
stages of development and therefore has not yet acquired a sufficient level of readiness
and usage penetration, Jordan has a strong ICTs and e-commerce agenda, which can have
a significant impact on its development.
According to the Ministry of Information and Communications Technology (2007), there
are a number of factors for slow e-commerce adoption in Jordan such as the relatively
high cost of Internet access compared to individuals’ incomes and unaffordable prices of
computers for many Jordanians. There is also a general lack of awareness of e-commerce
applications among businesses and customers like the electronic payment system. The
legal framework that protects customers and businesses using e-commerce is insufficient.
Finally, taxes imposed by the government discourage e-commerce adoption in business
processes.
Moreover, there is inadequate training and technical assistance provided by government
to people who may otherwise use information technology in their work. In 2007, about
8% of Jordanian shoppers used the Internet to purchase products and services, a low rate
that can be also attributed to cultural issues such as lack of trust in e-commerce, security
concerns regarding electronic payment methods and unreliable postal infrastructure.

30
In spite of the low e-commerce adoption and ICTs tools in Jordan, the country has a
strong ICTs infrastructure. Jordan ranked third in Arab countries with respect to e-
commerce readiness after UAE and Bahrain, respectively. The Jordanian government is
working intensively by establishing the necessary strategies to move from e-commerce
readiness to actual use of e-commerce amongst Jordanian stakeholders (Al-Khaffaf,
2011).
2.3.3 Small and Medium Enterprises (SMEs) in Jordan
Small and medium-size enterprises are an important participant in economic performance
and play a crucial role in economic growth, especially in developing countries through
creating jobs and increasing international trade. In most Organisations for Economic
Cooperation and Development (OECD) countries, SMEs make around 95% of the total
number of enterprises (OECD, 2002).
SMEs in Jordan are particularly important to Jordan’s economy for three main reasons.
Representing 98% of all businesses in Jordan, SMEs assume a significant role in
employment, accounting for 97% of all jobs and provide for about 96% of all exports and
contribute about 50% of Jordan’s GDP (JEDCO, 2011; Al-Rawashdeh, 2011). According
to the Jordanian Ministry of Industry and Trade (2012), SMEs in Jordan consist of three
main sectors: services, industry and agriculture.
There is no specific definition of SMEs; as this depends on the country’s criteria that are
based on either quantitative or qualitative measurement. Quantitatively, the criteria are
based on the number of employees, total amount of assets, and production capacity;
qualitatively, measurement includes the business operations and the structure of

31
organisation (Meredith, 1994). In Jordan, the classification of SMEs is based on the
quantitative criteria, using number of employees. As shown in the Table 2.1 below, the
Ministry of Industry and Trade classified as medium size businesses with less than 249
employees, small size those with less than 49 employees and micro size those with less
than 9 employees (JEDCO, 2011).
SMEs Classification in Jordan Total Number of Employees
Micro 1-9
Small 10-49
Medium 50-249
Table 2.1: Jordanian SMEs’ classification
Many studies discussed the problems and challenges to SMEs that prevent them from
growing and positively contributing to economic development in both developed and
developing countries. The most common challenges include lack of finance, low human
resources capability, limited technological resources, difficult access to market and lack
of public and private awareness (Hussain et al., 2010; OECD, 2004). In Jordan, SMEs are
facing similar challenges in addition to lack of managerial skills, procurement, long
bureaucratic procedures, regulatory issues and marketing (Al-Rawashdeh, 2011; Ajlouni,
2006).
According to JEDCO (2011), technology adoption is the most critical factor that must be
addressed in Jordanian SMEs, as technology provides SMEs with a wide range of
opportunities and benefits such as cost reduction, productivity improvement, access to
32
new markets and improved competitiveness. However, the diffusion and adoption of e-
commerce by Jordanian SMEs are slower than and far behind larger organisations due to
lack of a strategic plan for e-commerce adoption, costs and lack of technological
knowledge.
2.3.4 SMEs and E-commerce in Jordan
E-commerce grew rapidly and penetrated SMEs in the past decade, transforming the
organisational process by creating new ways of storing, distributing and exchanging
information between companies and customers (Kollberg and Dreyer, 2006). Moreover,
it has transformed SMEs’ business structures and strategy.
Many researchers suggested that e-commerce adoption by SMEs provides opportunities
to compete large organisations as it offers equal access to the global market. Also, SMEs
adoption of e-commerce increases productivity improves customer services and enhances
profitability. According to Kapurubandara and Lawson (2007, p. 141) “developing
countries forge ahead to achieve rapid and sustainable economic and social development
by building an economy based on an ICT enabled and networked SME sector capable of
applying affordable yet effective ICT solutions”.
In Jordan, however, e-commerce adoption is relatively slow. According to Allahawiah et
al. (2010), who investigated the current state of e-commerce adoption amongst Jordanian
SMEs, about 90% SMEs are using a basic internet tool (e-mail) for business activities
rather than having simple website such as presenting only information about their
business and/or more advanced website with more complex activates such online
payment.

33
Few studies investigated the factors affecting e-commerce adoption by SMEs in Jordan.
For example Alamro and Tarawneh (2010) investigated the factors affecting e-commerce
adoption in different sectors of SMEs in Jordan, finding that CEO characteristics and
employee’s IT knowledge are the most significant factors in this regard. A study by Al-
weshah and Al-zoubi (2012) found that SMEs in Jordan are still at lower stages of e-
commerce adoption due to several factors such as high cost of implementation, absence
of strategies and legal framework by the government, and low e-commerce awareness
amongst decision makers in Jordanian SMEs.
Al-Dmour and Al-Surkhi (2012) focused on the adoption rate of Internet-based
information systems by SMEs in Jordan, finding that more than half of the surveyed
SMEs had a low level of adoption, while 15.6% and 31.3% adopted a medium and a high
level, respectively. They identified top management support, system’s cost and
complexity and business partner’s pressure to have the most significant effects on
Internet-based information systems adoption in Jordanian SMEs.
2.4 Tourism Industry
The World Tourism Organisation defines tourists as people “traveling to and staying in
places outside their usual environment for not more than one consecutive year for leisure,
business and other purposes” (WTO, 2001). The travel industry is considered the biggest
and fastest growing industry in 21st century due to convergence of social, economic and
technological developments. According to WTO (2013a), tourism industry contributed
about 9.5% of the worldwide GDP in 2013, and is expected to raise about 4.5% of total
worldwide GDP in 2014.
34
Tourism industry includes other affiliated industries such as catering, hospitality,
transport and entertainment industry (Liu, 2005). Consequently, it is a complicated
business because it involves more than one industry at the same time.
Travel industry is divided into four different sectors, namely, travel sector, transport
sector, hospitality sector, and visitor and leisure attractions sector. Travel sector includes
travel agents, and tour operators. Transport sector includes airports, port authorities,
buses companies, railway, and car rental companies. Hospitality sector includes
accommodations such as hotels, and catering such as restaurants. Visitor and leisure
attractions include theatres, cinemas, parks, night clubs, and religious and historical sites.
Therefore, tourism industry is mainly operated by SMEs. In 2013, more than 100 million
employees were working directly in tourism sectors including travel agencies, hotels,
restaurants, airlines, transportation and leisure providers, contributing about 3.4% of total
employment in the world (WTO, 2013a).
As a product, tourism is intangible and cannot be consumed or inspected in advance for a
trial. In addition, it depends totally on information and social interaction between the
supplier and the consumer (Werthner and Klein, 1999). Information and time in tourism
industry are very crucial to consumers to make an informed decision, and this makes
effective use of information technology vital for tourism as it helps consumers obtain
necessary information at the right time.

35
2.4.1 Tourism in Jordan
As discussed earlier in this chapter, Jordan is a small and open country with limited
natural resources. In spite of limited natural resources, Jordan has plethora of tourism
resources. There are three major tourism recourses in Jordan. First, natural resources that
include land, and sea such as; Aqaba, Jordan valley. Second, cultural resources, which,
include archaeological/historical sites such as Petra that is considered as the most
attractive touristic destination in the country and designated as one of the New Seven
Wonders of the World, Um Qais, and Jerash and other ancient cities (Wood and Wood,
2009). Finally, there are therapeutic resources like the Dead Sea and hot springs of
Maeen.
Jordan has heavily invested in tourism by establishing luxury hotels, spas, resorts and real
estate projects, thus enhancing its contribution to national income. In 2013, tourism in
Jordan generated about $8 billion, or 20.3% of total GDP, and is expected to further grow
by 2.7% in 2014.
Moreover, the total number of employees in tourism is 48,151, constituting about 4.5% of
overall employment and considered the second biggest source of employment in Jordan.
This is expected to continue growing over the next decade to reach about 96,000 through
an average of 3.3% annual increase in contribution to overall employment (WTO,
2013b). Jordan, however, is still far from reaching its touristic potentials. According to
Shdeifat et al. (2006), there are problems and challenges facing Jordan’s tourism
development, including:
36
General unawareness of tourism importance and benefits.
Jordan’s limited presence in international tour operators catalogues.
Lack of marketing Jordanian tourism products internationally.
Inadequate training, skills and experience among employees in this sector.
Weakness and financial inadequacy of many tourist agencies.
Shdeifat et al. (2006) suggested that one of the most significant measures to overcome
these challenges is developing more promotional programmes, increasing promotion
representatives abroad and adopting the Internet and technology in tourism industry.
The Ministry of Information and Communications Technology (2007) investigated the
economic impact of ICTs on the Jordanian tourism sector, finding that ICTs have a
significant and positive effect on tourism and suggesting that government should
introduce well-structured technology to tourism industry which would facilitate
interaction between all sectors of tourism industry and customers.
2.4.2 Tourism and ICTs
ICTs have penetrated all aspects of tourism, bringing more innovation to manage,
monitor and market tourism products than traditional ways. The relationship between
tourism and ICTs was born in 1970 when airlines established and adopted Computer
Reservation Systems (CRSs) to manage their inventory, store and retrieve information
and operate logistics. CRSs were expanded and made accessible to other tourism sectors
such as travel agencies, tour operators, hotels and other hospitality firms (Buhails and
Jun, 2011).
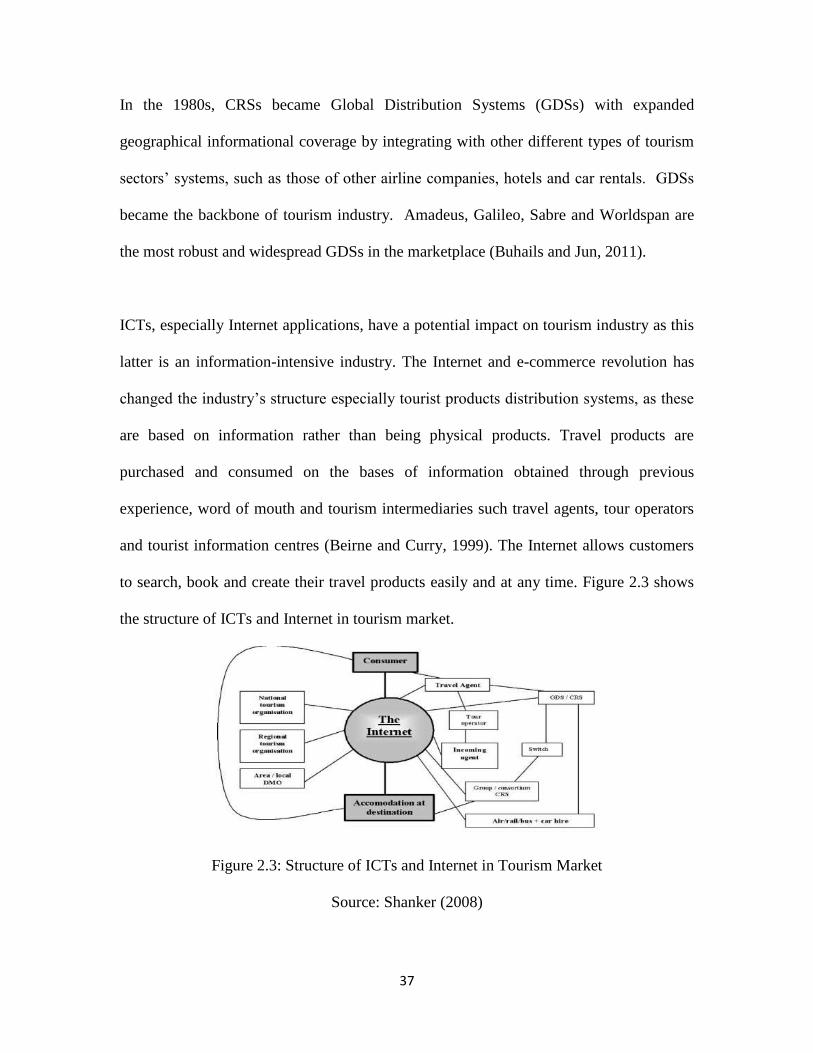
37
In the 1980s, CRSs became Global Distribution Systems (GDSs) with expanded
geographical informational coverage by integrating with other different types of tourism
sectors’ systems, such as those of other airline companies, hotels and car rentals. GDSs
became the backbone of tourism industry. Amadeus, Galileo, Sabre and Worldspan are
the most robust and widespread GDSs in the marketplace (Buhails and Jun, 2011).
ICTs, especially Internet applications, have a potential impact on tourism industry as this
latter is an information-intensive industry. The Internet and e-commerce revolution has
changed the industry’s structure especially tourist products distribution systems, as these
are based on information rather than being physical products. Travel products are
purchased and consumed on the bases of information obtained through previous
experience, word of mouth and tourism intermediaries such travel agents, tour operators
and tourist information centres (Beirne and Curry, 1999). The Internet allows customers
to search, book and create their travel products easily and at any time. Figure 2.3 shows
the structure of ICTs and Internet in tourism market.
Figure 2.3: Structure of ICTs and Internet in Tourism Market
Source: Shanker (2008)

38
The percentage of U.S adult online travellers reached 74% in 2009 marking a 3%
increase from 2008. Growth in travel online customers can be attributed to the ease of
using technology such as the Internet that grants travellers more confidence and
satisfaction by navigating and controlling their travels online.
In addition, the technologies owned by online travellers such as laptops, iPods, MP3
players, and mobile technologies have increased by 20% in 2009 compared to 2007
(eMarketer, 2011). A recent study by eMarketer (2014) found that U.S mobile travellers
who used mobile devices such as smartphones and tablets to book their travels are
expected to increase from 2013 to 2014 by 59.8% and to boost sales to reach US$26.14
billion which accounts for 18% of total digital travel sales. Moreover, eMarketer (2014)
expects that mobile travellers could grow to reach 37% of total digital travel sales in 2018
which accounts for US$64.69 billion.
In Europe, digital travel sales have grown dramatically by 41% between 2002 and2007
reaching €50 billion in 2007 which accounted for 20% of all European travel sales.
(EyeforTravel Research, 2008). This considerable growth can be attributed to change in
customer behaviour in Europe that found the internet a provider of an easy means to
search in a wide range of destinations and travel products. A recent study conducted by
Catalyst Corporate Finance (2013) reported that online travel sales in Europe generated
US$140 billion, growing by 20% compared to 2012.
With regard to online travel sales worldwide, World Travel Market (2014) reported that
online travel sales accounted for US$590 billion in 2013, comprising 27% of total global
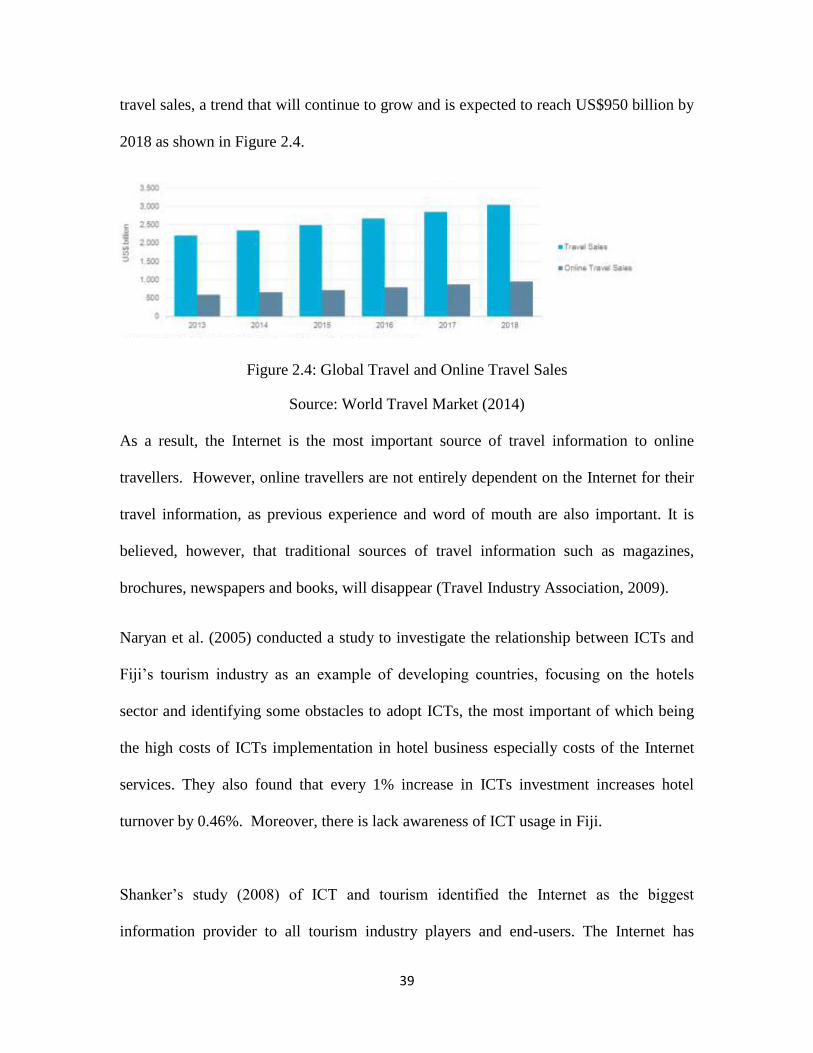
39
travel sales, a trend that will continue to grow and is expected to reach US$950 billion by
2018 as shown in Figure 2.4.
Figure 2.4: Global Travel and Online Travel Sales
Source: World Travel Market (2014)
As a result, the Internet is the most important source of travel information to online
travellers. However, online travellers are not entirely dependent on the Internet for their
travel information, as previous experience and word of mouth are also important. It is
believed, however, that traditional sources of travel information such as magazines,
brochures, newspapers and books, will disappear (Travel Industry Association, 2009).
Naryan et al. (2005) conducted a study to investigate the relationship between ICTs and
Fiji’s tourism industry as an example of developing countries, focusing on the hotels
sector and identifying some obstacles to adopt ICTs, the most important of which being
the high costs of ICTs implementation in hotel business especially costs of the Internet
services. They also found that every 1% increase in ICTs investment increases hotel
turnover by 0.46%. Moreover, there is lack awareness of ICT usage in Fiji.
Shanker’s study (2008) of ICT and tourism identified the Internet as the biggest
information provider to all tourism industry players and end-users. The Internet has
40
transformed the traditional tourism industry strategies especially those of marketing,
communication and pricing, which added more effectiveness and efficiency to this
industry. However, unstructured, unusable and weakly presented tourist website may be
misleading and time consuming to Internet users searching for convenient information.
Researches also confirmed that the contents of tourism website such as information and
images and its usability will positively attract consumers to buy tourist products online
(Zhou and DeSantis, 2005).
Ma et al. (2003) found that the Internet has definitely changed the structure of tourism
industry in China by providing more added value services such as booking airlines, hotels
and packages directly by consumers. They found out that while airlines and hotels are
adopting Internet applications, tour operators, visitor attractions and destination
management organisations in China are still in an early stage of the Internet adoption due
to low awareness of ICTs and Internet, cultural and governmental issues.
2.4.3 Disintermediation and Reintermediation
The Internet revolution has changed the strategies and structures of many tourism sub-
sectors. For example, hotels, airlines, car rentals became able to sell their products
directly to consumers. Analogously, customers’ behaviour has also changed as they
obtained access to travel information which enabled them to organize and book their trips
independently through a new effective marketplace of travel products where the Internet
directly links between travel suppliers and customers. This has downplayed the role of
intermediaries in what became known as “disintermediation” (Cheung and Lam, 2009;
Ma et al., 2003; Buhalis and Jun, 2011; Patricia, 2008).
41
Disintermediation is rapidly gaining more ground in tourism sectors than other industries.
According to Kaewkitipong (2010), cited in Nelson et al. (2010, p.162), “the tourism
industry is one of the first industries in which disintermediation has been attempted”.
This can be attributed to treating travel products as information-intensive which fits well
into Internet marketing. Travel suppliers such as airlines seeking to reduce commissions
paid to intermediaries like travel agents and tour operators started encouraging customers
to buy their travel products directly through their websites. This development occurs
against a backdrop of the fact that travel agencies have traditionally been found as the
highest contributors in selling flights tickets of most airline companies. As a result, the
survival of intermediaries, particularly travel agents, is now threatened to be replaced by
these airline suppliers (Buhalis and Jun 2011; Cheung and Lam, 2009).
Cheung and Lam (2009, p.86) argued that “changes in the industry over the past ten years
have dramatically altered the nature and value of information in the travel industry and,
consequently, the role of travel agency”. Traditionally, travel agency is considered as a
retail business that intermediates between customers and travel suppliers, selling travel
products through different GDSs on basis of commission. GDSs enabled travel agencies
to access all types of tourism suppliers and coordinate with customers by providing them
with tourist information such as available flight seats, hotel and car rental reservations, in
a business environment on behalf of customers who their satisfaction became more
complicated and demanding more services .(Livi, 2008; Buhalis and Jun, 2001; Ma et al.,
2003).
42
Therefore, ICTs are inevitable tools for traditional travel agencies to provide their
services and enhance the intermediation between suppliers and customers. Travel
agencies have also the role of informing the customer about their destinations like
exhibitions, attractions, weather, climate, customs, regulations, currency rates and
required documents like passports and visas (Cheung and Lam, 2009). All these
characteristics differentiate travel agencies from other retail companies that sell tangible
products, for they do not have a stock in hand but generate profits through commissions
charged from suppliers and sometimes from customers as well (Buhalis and Jan, 2011).
Although, travel agencies are facing disintermediation by e-commerce, this latter offers
them a powerful tool to reintermediate back into global travel market (Patricia, 2008;
Cheung and Lam, 2009). According to Livi (2008, p.2) “Access to GDSs was soon no
longer an option but obligation for travel agencies. They had to learn specific
terminology and new technical and technological skills”.
The Internet has not simply become a tool for distribution channels, or a tool of services
promotion for travel agencies, but even a forceful catalyst to change their business
strategies. For example, GDSs operators have employed Internet advantages and updated
their services, which brought them closer to other suppliers and consumers by creating
their own websites and adopting e-commerce in their business. Instances include
‘expedia.com’ and ‘travelocity.com’ that are owned by Sabre and ‘vacation.com,
‘opodo.com’ and ‘traveltainment.com’ that are owned by Amadeus IT Group (Buhalis
and Jun, 2011).
43
Moreover, adopting e-commerce provides travel agencies with an organisational added
value by aggregating and sorting information on travel products offers by travel suppliers
to online customers, especially that customers may find it difficult to fetch and compare
information and prices from different travel suppliers, thus they prefer to use online travel
agency as one-stop shop (Buhalis and Law, 2008).
Although travel suppliers seek to cut off the intermediary costs, SME travel suppliers
such as hotels and car rentals still prefer to deal with online travel agencies to promote
and sell their products as they have less experience in making their products visible over
the Internet in addition to avoiding the cost of developing and maintaining an online
booking system (Kaewkitipong, 2010). Having unfolded these factors, it is fair to confirm
that the Internet adoption is inevitable to travel agencies. In addition to selling their
products and services traditionally (using GDSs), they should invest the Internet
advantages and launch their own websites to provide information of their products and
services and sell them directly to customers (Levi, 2008).
As a result, many travel agencies have recently made that step transforming their business
from “brick and mortar” to “brick and click” thus becoming cybermediaries (Buhalis and
Jun, 2011; Paricia, 2008). However, despite the benefits of e-commerce adoption in
supporting travel agencies future survival in the market, e-commence has not been yet
fully adopted, particularly in developing countries. Therefore, investigating the factors of
e-commerce adoption by travel agencies represents a novel area for academic research.
As a result, the interest of this study to investigate reasons of slow e-commerce adoption
by travel agencies has become an urgent need for analysing e-commerce adoption in
developing countries, specifically Jordan.
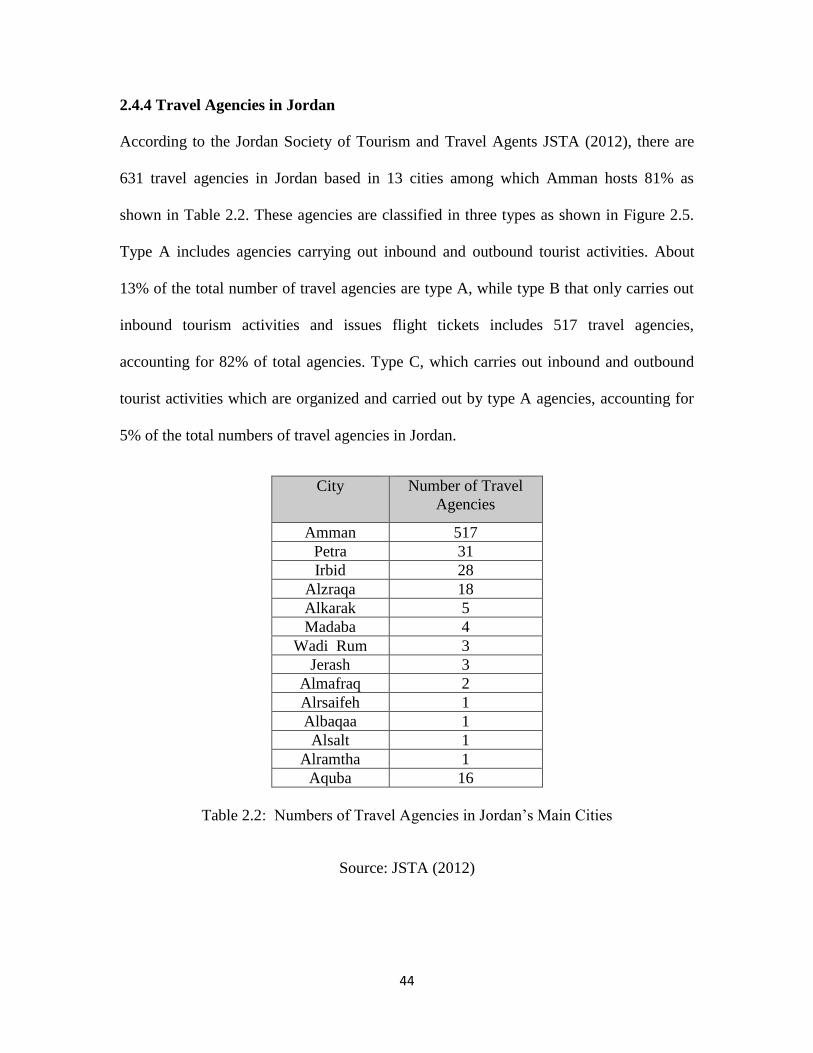
44
2.4.4 Travel Agencies in Jordan
According to the Jordan Society of Tourism and Travel Agents JSTA (2012), there are
631 travel agencies in Jordan based in 13 cities among which Amman hosts 81% as
shown in Table 2.2. These agencies are classified in three types as shown in Figure 2.5.
Type A includes agencies carrying out inbound and outbound tourist activities. About
13% of the total number of travel agencies are type A, while type B that only carries out
inbound tourism activities and issues flight tickets includes 517 travel agencies,
accounting for 82% of total agencies. Type C, which carries out inbound and outbound
tourist activities which are organized and carried out by type A agencies, accounting for
5% of the total numbers of travel agencies in Jordan.
City Number of Travel
Agencies
Amman 517
Petra 31
Irbid 28
Alzraqa 18
Alkarak 5
Madaba 4
Wadi Rum 3
Jerash 3
Almafraq 2
Alrsaifeh 1
Albaqaa 1
Alsalt 1
Alramtha 1
Aquba 16
Table 2.2: Numbers of Travel Agencies in Jordan’s Main Cities
Source: JSTA (2012)
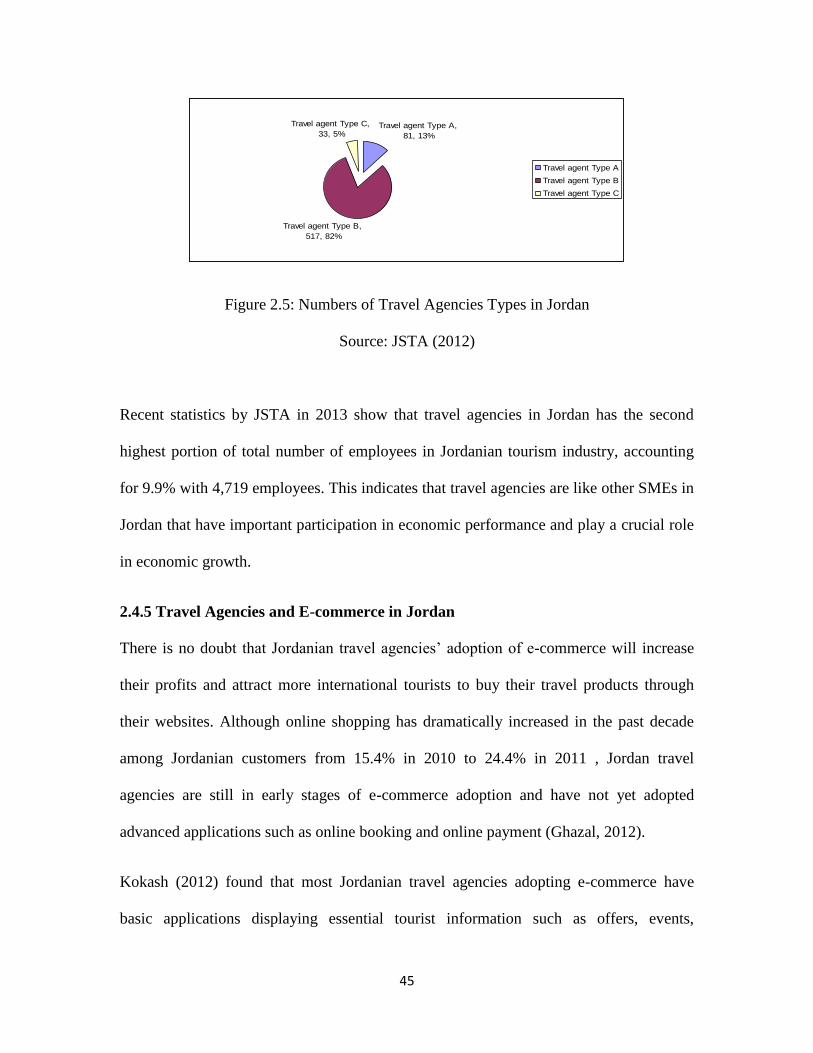
45
Figure 2.5: Numbers of Travel Agencies Types in Jordan
Source: JSTA (2012)
Recent statistics by JSTA in 2013 show that travel agencies in Jordan has the second
highest portion of total number of employees in Jordanian tourism industry, accounting
for 9.9% with 4,719 employees. This indicates that travel agencies are like other SMEs in
Jordan that have important participation in economic performance and play a crucial role
in economic growth.
2.4.5 Travel Agencies and E-commerce in Jordan
There is no doubt that Jordanian travel agencies’ adoption of e-commerce will increase
their profits and attract more international tourists to buy their travel products through
their websites. Although online shopping has dramatically increased in the past decade
among Jordanian customers from 15.4% in 2010 to 24.4% in 2011 , Jordan travel
agencies are still in early stages of e-commerce adoption and have not yet adopted
advanced applications such as online booking and online payment (Ghazal, 2012).
Kokash (2012) found that most Jordanian travel agencies adopting e-commerce have
basic applications displaying essential tourist information such as offers, events,
Travel agent Type A,
81, 13%
Travel agent Type B,
517, 82%
Travel agent Type C,
33, 5%
Travel agent Type A
Travel agent Type B
Travel agent Type C
46
attractions, recommendations, climate and currency. The study also found that many of
Jordanian travel agencies only use e-mail, telephone and fax to interact with their
customers and therefore recommends adopting a higher level of technology applications
in order to enhance their competitive position and customer relations. These technologies
include online live chat, computer telephone using VoIP technology, and interactive and
transactional website that allow booking and buying travel products.
Traditional travel agencies in Jordan are facing the threat of losing commissions paid by
airlines and even becoming ousted by online agencies (Dajani, 2012). The investigation
of factors affecting e-commerce adoption by travel agencies stand out as an important
issue that is not yet sufficiently addressed either in developed or developing countries
including Jordan. This study seeks to contribute in filling this gap by studying the factors
affecting e-commerce adoption level in travel agencies SMEs.
The next chapter discusses in details the most common models, theories and factors
relevant to e-commerce adoption in order develop a comprehensive framework that better
explains e-commerce adoption in the context of travel agencies.
2.5 Conclusion
This chapter opened with an overview of Jordan including location, population, and
culture, showing that it is a developing upper-middle income country with limited natural
resources and three main economic challenges: poverty, unemployment and inflation.
Jordan is heavily dependent on foreign investments, private sectors and services such as
tourism. The chapter moved to highlight the use of ICTs and e-commerce in Jordan, as
the country is witnessing a rapid development in this field although it is still in an early

47
stage of e-commerce adoption due to several factors. Then the chapter addressed small
and medium size enterprises (SMEs) in Jordan, their challenges, classification, and
importance to the economic development before presenting issues related to e-commerce
adoption by SMEs in Jordan and benefits obtained from such adoption.
The main factors responsible for the slow e-commerce adoption were identified to be the
cost, system complexity, decision maker characteristics and employees e-commerce
literacy. Also discussed was the importance of tourism to global economy whether in
developed or developing countries including Jordan where tourism plays a role in the
economy, employment and contribution to the GDP, despite the problems and challenges
facing it. The chapter also reviewed literature on ICTs and e-commerce adoption in
tourism industry showing the special relevant benefits as tourism is considered an
information-intensive industry.
The chapter discussed the threats facing travel intermediaries, especially travel agencies,
as a result of Internet utilization, in what is known as disintermediation and the need to
adopt e-commerce to overcome this threat. Finally, the chapter addressed issues related
to travel agencies in Jordan in terms of numbers and types. The next chapter discusses the
most dominant theories and models that explain the factors affecting e-commerce
adoption.

48
Chapter Three
Theoretical Background
49
3.1 Introduction
This chapter explores the most common theories applied in information systems,
particularly technology adoption by individuals and organisations and their relevance to
this study. Also, it presented the most common sequences levels of-commerce adoption
by SMEs. The chapter consists of three sections, the first of which describes the most
dominant theories and models related to innovation diffusion and technological adoption,
including Theory of Reasoned Action (TRA), Technology Acceptance Model (TAM),
Technology-Organisation-Environment (TOE) model, Diffusion of Innovation Theory
(DoI) and Hofstede’s Cultural Dimensions.
The second section reviews the most common e-commerce maturity models that
describing the sequential levels of Internet adoption in SMEs including Rao model,
Daniel model, PriceWaterhouseCoopers model, Rayport and Jaworski model , Lefebvrea
et al. model and Molla and Licker model for staged Internet adoption. Then it discusses
the numerous factors suggested by prior studies that influence e-commerce adoption in
SMEs in general and travel agencies in particular. The last section presents limitations
and gap in literature.
3.2 Theories and Models in Technology Adoption
This section of this chapter reviews and discusses the most five prominent models and
theories were developed in information systems literature in order to attempt to
understand the factors that influence/inhibit technology adoption by individuals and
organisations. The five models reviewed are: Theory of Reasoned Action (TRA);
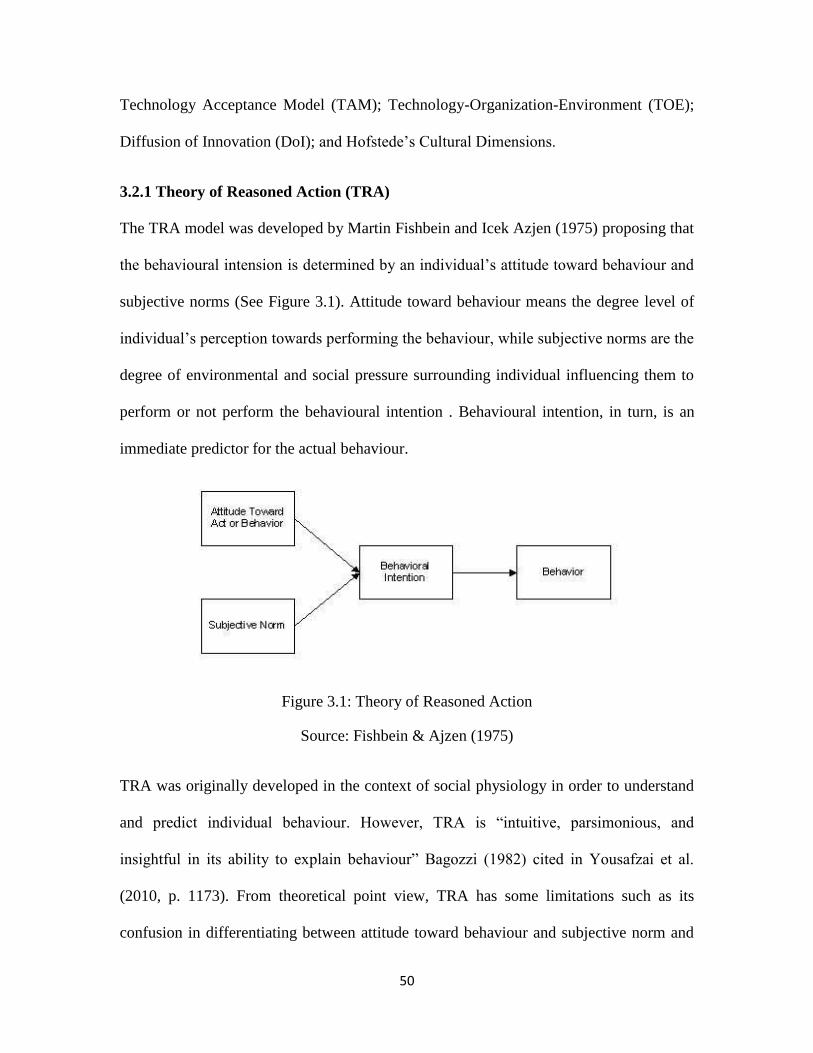
50
Technology Acceptance Model (TAM); Technology-Organization-Environment (TOE);
Diffusion of Innovation (DoI); and Hofstede’s Cultural Dimensions.
3.2.1 Theory of Reasoned Action (TRA)
The TRA model was developed by Martin Fishbein and Icek Azjen (1975) proposing that
the behavioural intension is determined by an individual’s attitude toward behaviour and
subjective norms (See Figure 3.1). Attitude toward behaviour means the degree level of
individual’s perception towards performing the behaviour, while subjective norms are the
degree of environmental and social pressure surrounding individual influencing them to
perform or not perform the behavioural intention . Behavioural intention, in turn, is an
immediate predictor for the actual behaviour.
Figure 3.1: Theory of Reasoned Action
Source: Fishbein & Ajzen (1975)
TRA was originally developed in the context of social physiology in order to understand
and predict individual behaviour. However, TRA is “intuitive, parsimonious, and
insightful in its ability to explain behaviour” Bagozzi (1982) cited in Yousafzai et al.
(2010, p. 1173). From theoretical point view, TRA has some limitations such as its
confusion in differentiating between attitude toward behaviour and subjective norm and

51
presenting no explanation of the beliefs that are significant predictors of a particular
behaviour (Cho and Agrusa, 2006). Therefore, silent beliefs from individuals must be
taken into consideration by researchers who are using TRA to investigate the individual’s
behaviour (Davis, 1989). Also, TRA is useful theory to predict behaviours rather than
outcome of behaviours (Yousafzai et al., 2010).
To resolve these limitations, Ajzen (1991) amended TRA introducing the construct of
Perceived Behavioural Control (PBC), which extended the theory to become the Theory
of Planned Behaviour (TPB), (See Figure 3.2).
Figure 3.2: Theory of Planned Behaviour
Source: Ajzen (1991)
The PBC influences individual’s intention, which is identified by individuals’ perceptions
of their ability to perform a given behaviour. PBC is influenced by two beliefs: control
beliefs and perceived facilitation. Control beliefs are the availability of perceived skills
and resources while perceived facilitation is an individual’s assessment to achieve
outcomes based on available resources.
52
Many studies used TPB to predict and explain behavioural intention regarding ICTs and
e-commerce adoption. For example, Harrison et al. (1997) used TPB to investigate
information technology adoption among decision makers in small businesses, finding that
the decision process of technology adoption was strongly affected by subjective norms,
attitude toward technology and perceived behavioural control. Riemenschneider and
McKinney (2001) used TBP to understand the decision makers’ behaviours toward e-
commerce adoption in SMEs, identifying attitude, subjective norms and perceived
behavioural control as significant predictors in differentiating between adopter and non-
adopters.
Also, Nasco et al. (2008) used TPB in studying the impact of e-commerce on SMEs in
developing countries, taking Chile as a case study. They found that attitude and
subjective norms strongly significant constructs in measuring e-commence applications
in SMEs while the perceived behavioural control construct was not. Table 3.7 Part 2
shows a summary of reviewed studies that used TPB to investigate factors that influence
technology and e-commerce adoption by SMEs.
A recent study by Mirsha (2014) applying TPB to study user acceptance behaviour
toward mobile commerce in India found that attitude and perceived behavioural control
were significant predictors of individual’s intention to adopt mobile commerce, while
subjective norms has no significant effect. The TBP theory was thus found valid and
useful for studying the adoption of different types of technology innovation. In fact,
many studies found TPB to be more comprehensive and more powerful in predicting
behaviours regarding technology adoption than TRA (Gokhan and Yilmaz, 2011; Cheung

53
et al., 1999; Venkatesh et al., 2003).
Nonetheless, TPB has some limitations in predicting individuals’ behavioural intentions
toward IT adoption. First, like TRA, the TBP still useful to predict individuals’
behaviours rather than outcome of behaviours (Foxall, 1997). Second, TBP only added
one predictor and there is continuing evidence that behaviour intention is not only
determined by these antecedents, but other factors add a predictive power to TBP in
explaining technology adoption (Werner, 2004; Davis, 1989).
3.2.2 Technology Acceptance Model (TAM)
The Technology Acceptance Model (TAM) that was developed by Davis (1989) is
originally adapted from the Theory of Reasoned Action (TRA) (Fishbein and Azjen,
1975). This model is used to determine and predict the factors influencing users in their
acceptance/rejection of using technology applications. As shown in figure 3.3, TAM is
similar to TRA, yet with slight differences in that Perceived Usefulness and Perceived
Ease of Use have been added to TAM while Subjective Norms was excluded for being
identified as insignificant for technology adoption (Davis, 1989).
Figure 3.3: Technology Acceptance Model
Source: Davis (1989)
54
This theory assumes that individual actual acceptance of technology is determined by
behaviour intention to use that technology. Behavior intention (BI), in turn, is a function
of attitude toward use technology and perceived usefulness. Attitude toward use
technology (AT), in turn, is determined by perceived usefulness (PU) and perceived ease
of use (PEOU). Davis (1989) referred attitude as a sum of two beliefs that individual
holds about the use of particular technology. The first belief, perceived usefulness refers
the degree of user’s perception that utilizing technology will improve his/her job
performance. The second belief, perceived ease of use refers to the degree of user’s belief
that utilizing technology will be free of mental effort.
Davis (1989) conducted study to test his original TAM on the acceptance of word-
processor technology. He found, that perceived usefulness has a stronger significant
effect on a person’s intention to use system than that of perceived ease of use. He
explained that if an individual’s know that implementing a technological application will
increase productivity and job performance, they are more likely to use system regardless
of how this implemented system is difficult or easy to use. This should be considered not
as an indication that perceived ease of use has no significance for the intention to use
system, but that it has a less significant effect and therefore should not be ignored as a
construct influencing users’ decisions to use information systems applications.
However, TAM only focuses on individuals rather than the role of social and
environmental factors that affect technology adoption. Therefore, this model was
expanded to TAM2 that further emphasizes the important role of Subjective Norms and
includes additional variables (Venkatesh and Davis, 2000).
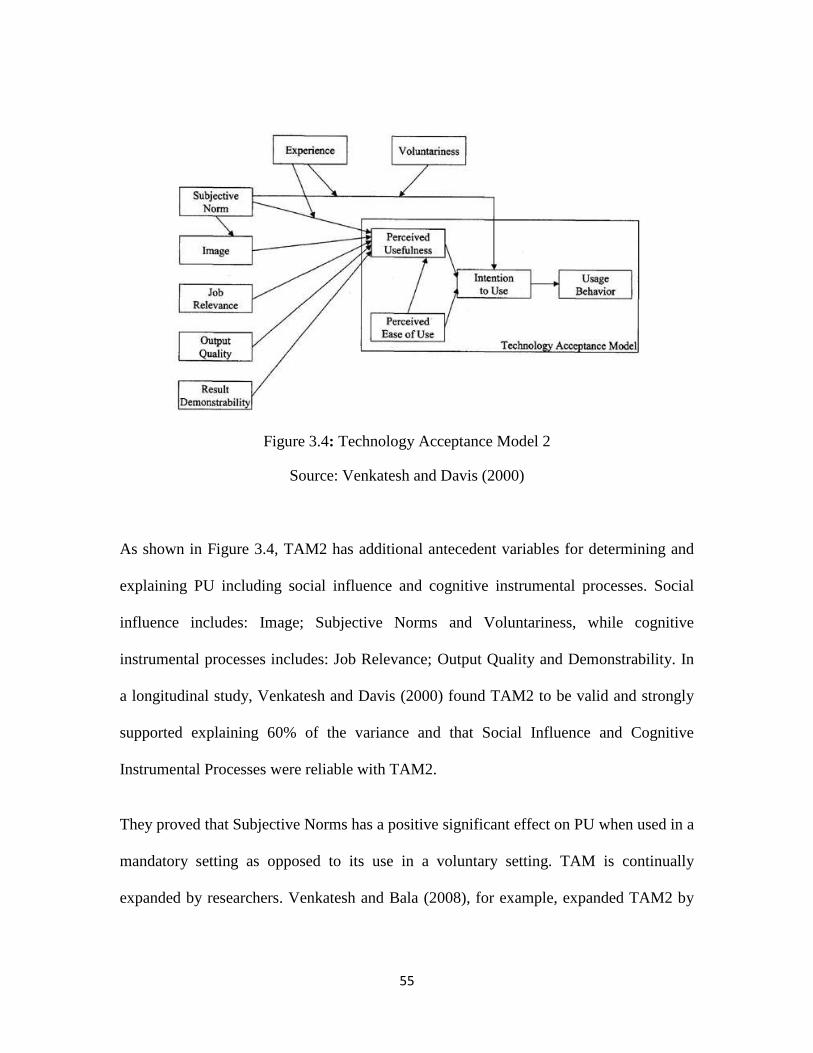
55
Figure 3.4: Technology Acceptance Model 2
Source: Venkatesh and Davis (2000)
As shown in Figure 3.4, TAM2 has additional antecedent variables for determining and
explaining PU including social influence and cognitive instrumental processes. Social
influence includes: Image; Subjective Norms and Voluntariness, while cognitive
instrumental processes includes: Job Relevance; Output Quality and Demonstrability. In
a longitudinal study, Venkatesh and Davis (2000) found TAM2 to be valid and strongly
supported explaining 60% of the variance and that Social Influence and Cognitive
Instrumental Processes were reliable with TAM2.
They proved that Subjective Norms has a positive significant effect on PU when used in a
mandatory setting as opposed to its use in a voluntary setting. TAM is continually
expanded by researchers. Venkatesh and Bala (2008), for example, expanded TAM2 by
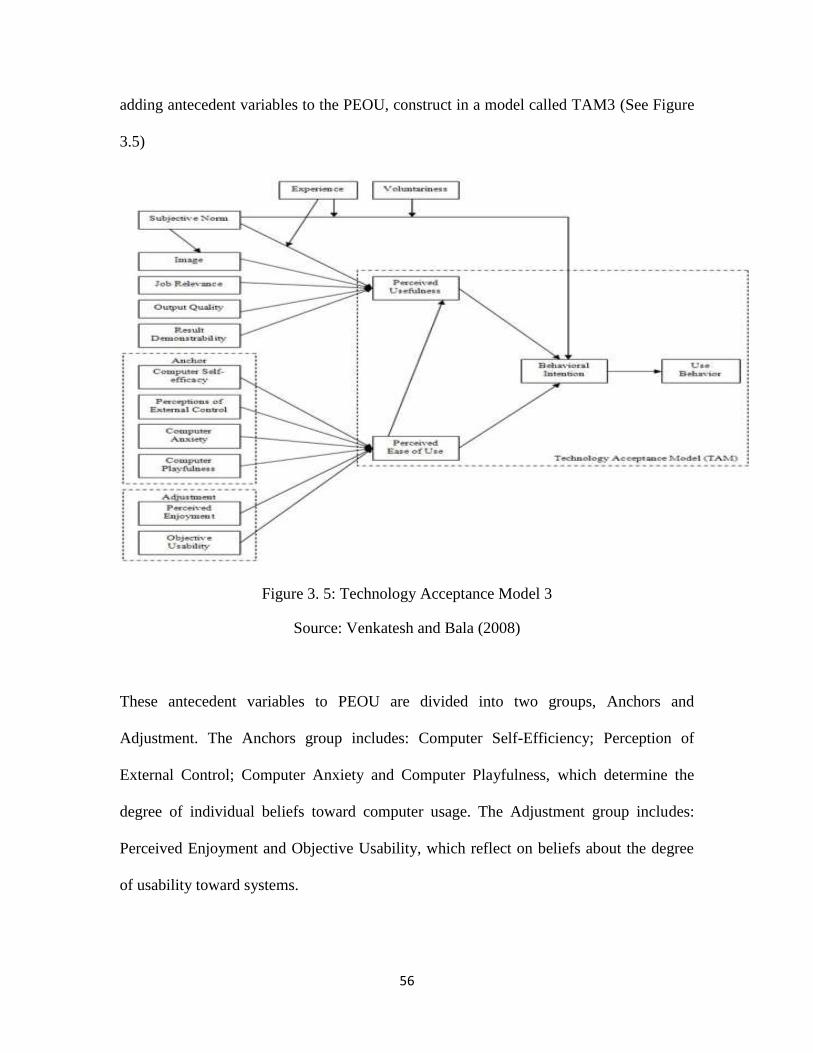
56
adding antecedent variables to the PEOU, construct in a model called TAM3 (See Figure
3.5)
Figure 3. 5: Technology Acceptance Model 3
Source: Venkatesh and Bala (2008)
These antecedent variables to PEOU are divided into two groups, Anchors and
Adjustment. The Anchors group includes: Computer Self-Efficiency; Perception of
External Control; Computer Anxiety and Computer Playfulness, which determine the
degree of individual beliefs toward computer usage. The Adjustment group includes:
Perceived Enjoyment and Objective Usability, which reflect on beliefs about the degree
of usability toward systems.
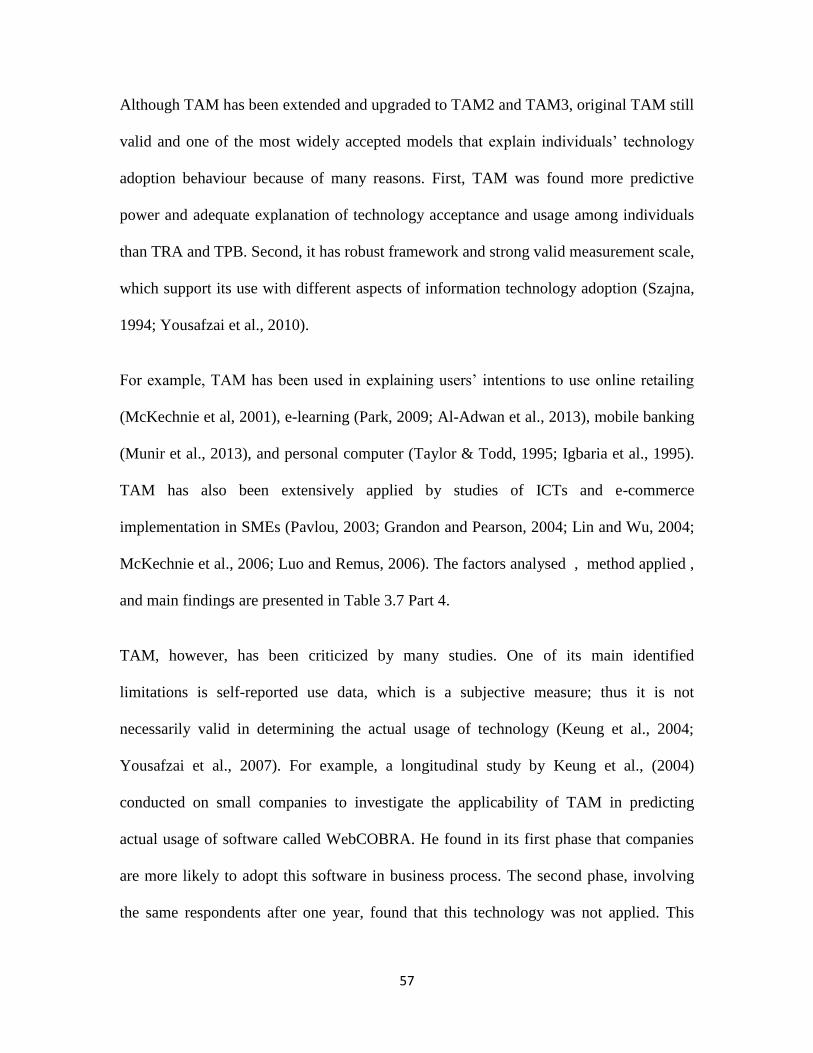
57
Although TAM has been extended and upgraded to TAM2 and TAM3, original TAM still
valid and one of the most widely accepted models that explain individuals’ technology
adoption behaviour because of many reasons. First, TAM was found more predictive
power and adequate explanation of technology acceptance and usage among individuals
than TRA and TPB. Second, it has robust framework and strong valid measurement scale,
which support its use with different aspects of information technology adoption (Szajna,
1994; Yousafzai et al., 2010).
For example, TAM has been used in explaining users’ intentions to use online retailing
(McKechnie et al, 2001), e-learning (Park, 2009; Al-Adwan et al., 2013), mobile banking
(Munir et al., 2013), and personal computer (Taylor & Todd, 1995; Igbaria et al., 1995).
TAM has also been extensively applied by studies of ICTs and e-commerce
implementation in SMEs (Pavlou, 2003; Grandon and Pearson, 2004; Lin and Wu, 2004;
McKechnie et al., 2006; Luo and Remus, 2006). The factors analysed , method applied ,
and main findings are presented in Table 3.7 Part 4.
TAM, however, has been criticized by many studies. One of its main identified
limitations is self-reported use data, which is a subjective measure; thus it is not
necessarily valid in determining the actual usage of technology (Keung et al., 2004;
Yousafzai et al., 2007). For example, a longitudinal study by Keung et al., (2004)
conducted on small companies to investigate the applicability of TAM in predicting
actual usage of software called WebCOBRA. He found in its first phase that companies
are more likely to adopt this software in business process. The second phase, involving
the same respondents after one year, found that this technology was not applied. This
58
indicates that TAM was more relevant to measuring behavioural intention to use that
technology than actual usage and that TAM will have different results when measuring
past use, present use or future plans to use the technology.
Another limitation of TAM is its reliance in identifying the acceptance of technology on
only two constructs (PU and PEOU) which is insufficient and needs to be more
comprehensive and include more additional variables (Park et al., 2008; Lee et al., 2003,
Looi, 2005). Moreover, TAM is only useful to study technology adoption at individual
level rather than firm level, as it does not describe the factors related to the organisational
level such as environmental and organisational factors (Oliveira et al., 2011; El-gohary,
2011).
3.2.3 Technology-Organisation-Environment (TOE)
The TOE model was developed by Tornatzky and Fleischer (1990). It consists of three
contexts for identifying the factors that influence diffusion process within companies:
technological, organisational, and environmental (see Figure 3.6).
Figure 3.6: Technology-Organisation-Environment Framework
Source: Tornatzky and Fleischer (1990)
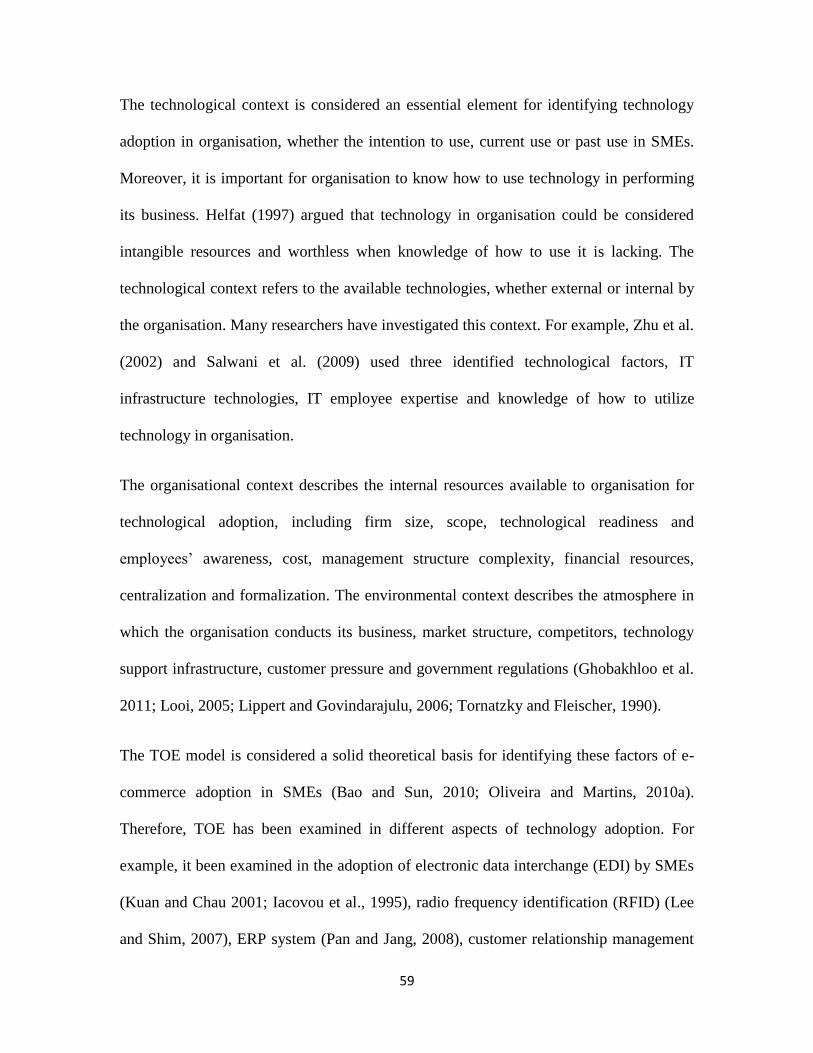
59
The technological context is considered an essential element for identifying technology
adoption in organisation, whether the intention to use, current use or past use in SMEs.
Moreover, it is important for organisation to know how to use technology in performing
its business. Helfat (1997) argued that technology in organisation could be considered
intangible resources and worthless when knowledge of how to use it is lacking. The
technological context refers to the available technologies, whether external or internal by
the organisation. Many researchers have investigated this context. For example, Zhu et al.
(2002) and Salwani et al. (2009) used three identified technological factors, IT
infrastructure technologies, IT employee expertise and knowledge of how to utilize
technology in organisation.
The organisational context describes the internal resources available to organisation for
technological adoption, including firm size, scope, technological readiness and
employees’ awareness, cost, management structure complexity, financial resources,
centralization and formalization. The environmental context describes the atmosphere in
which the organisation conducts its business, market structure, competitors, technology
support infrastructure, customer pressure and government regulations (Ghobakhloo et al.
2011; Looi, 2005; Lippert and Govindarajulu, 2006; Tornatzky and Fleischer, 1990).
The TOE model is considered a solid theoretical basis for identifying these factors of e-
commerce adoption in SMEs (Bao and Sun, 2010; Oliveira and Martins, 2010a).
Therefore, TOE has been examined in different aspects of technology adoption. For
example, it been examined in the adoption of electronic data interchange (EDI) by SMEs
(Kuan and Chau 2001; Iacovou et al., 1995), radio frequency identification (RFID) (Lee
and Shim, 2007), ERP system (Pan and Jang, 2008), customer relationship management
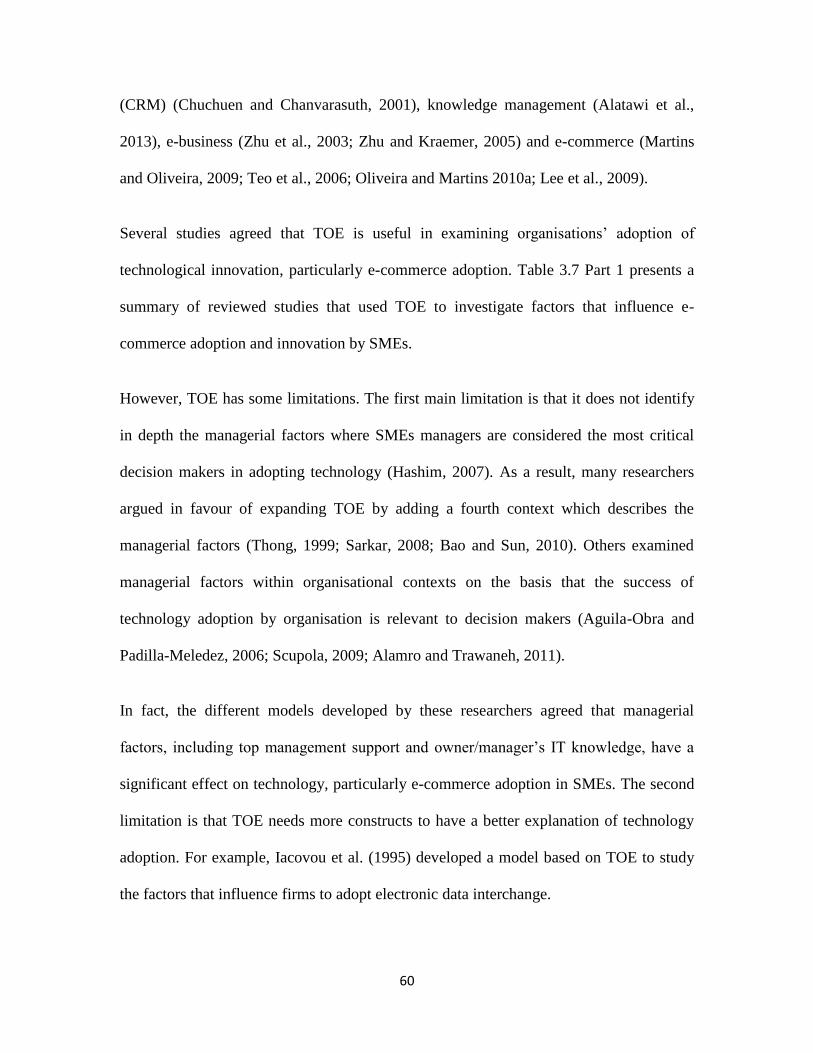
60
(CRM) (Chuchuen and Chanvarasuth, 2001), knowledge management (Alatawi et al.,
2013), e-business (Zhu et al., 2003; Zhu and Kraemer, 2005) and e-commerce (Martins
and Oliveira, 2009; Teo et al., 2006; Oliveira and Martins 2010a; Lee et al., 2009).
Several studies agreed that TOE is useful in examining organisations’ adoption of
technological innovation, particularly e-commerce adoption. Table 3.7 Part 1 presents a
summary of reviewed studies that used TOE to investigate factors that influence e-
commerce adoption and innovation by SMEs.
However, TOE has some limitations. The first main limitation is that it does not identify
in depth the managerial factors where SMEs managers are considered the most critical
decision makers in adopting technology (Hashim, 2007). As a result, many researchers
argued in favour of expanding TOE by adding a fourth context which describes the
managerial factors (Thong, 1999; Sarkar, 2008; Bao and Sun, 2010). Others examined
managerial factors within organisational contexts on the basis that the success of
technology adoption by organisation is relevant to decision makers (Aguila-Obra and
Padilla-Meledez, 2006; Scupola, 2009; Alamro and Trawaneh, 2011).
In fact, the different models developed by these researchers agreed that managerial
factors, including top management support and owner/manager’s IT knowledge, have a
significant effect on technology, particularly e-commerce adoption in SMEs. The second
limitation is that TOE needs more constructs to have a better explanation of technology
adoption. For example, Iacovou et al. (1995) developed a model based on TOE to study
the factors that influence firms to adopt electronic data interchange.
61
This model consists of three factors: Perceived Benefits; Organisational Readiness and
External Pressure (see Figure 3.7).
Figure 3.7: Iacovou et al. (1995) Model
Source: Iacovou et al. (1995)
The Iacovou et al. model (1995) differs from TOE in that its Organisational Readiness
context is a combination of technological and organisational factors and that a trading
partner power construct has been added to external environment and found an important
factor in technology adoption. Also, perceived benefits were added into model as a new
context to explain the potential benefits of implementing technology, as perceived by
firms and found its significant.
3.2.4 Diffusion of Innovation Theory
The diffusion of innovation theory (DoI), that is also called the Rogers’ Model
(1962), is one of most popular theories on innovation adoption. Originally, the
Rogers’ Model is used in explaining the innovation adoption in rural sociology

62
discipline. This model has been extended and studied by many researchers across
different disciplines, including education, medicine, industry and technology. The
Rogers’ model consists of four main elements relevant to the diffusion of
innovation process: Innovation; Communication Channels; Time and Social
System. See Figure 3.8.
Figure 3.8: Model of Stages in the Innovation-Decision Process
Source: (Rogers, 2003)
Rogers (2003, p.12) defined innovation as “an idea, practice, or object that is perceived as
new by an individual or other unit of adoption”. The innovation element is determined by
the rate of adoption theory. The rate of innovation is explained by five attributes: Relative
Advantage; Compatibility; Complexity; Observability and Trialability.
Relative Advantage is defines as “the degree to which an innovation is perceived as being
better than the idea it supersedes” (Rogers, 2003, p.229). Relative Advantage was found
one of the strongest predictors of adoption of innovation (Rogers, 2003). Compatibility
refers to “the degree to which the innovation is consistent with existing values, past
experiences and needs of potential adopters” (Rogers, 2003, p.240).

63
Complexity is defined by Rogers (2003, p.257) as “the degree to which the innovation is
difficult to understand and use”. Trialability refers to “the degree to which the innovation
can be experimented on a limited basis (Rogers, 2003, p.258), while Observability is “the
degree of visibility of the new innovation results” (Rogers, 2003, p.258).
These five attributes of innovation have been broadly used in various disciplines such as
sociology, political science, health, agriculture and information systems. In the
technological context, relative advantage is measured by the perceived benefits obtained
through adoption of ICTs and e-commerce such as reducing cost, reaching new
customers, enhancing productivity, increasing profitability, gaining a competitive
advantage, promoting products and expanding into new markets (Poorangi et al., 2013;
Apulu and Latham, 2011; Scupola, 2001).
Compatibility entails that ICTs and e-commerce adoption are compatible with current
traditional business operations and processes; ways of doing business by suppliers and
customers and the existing values and mentality of the people in the company
(Kamaroddin et al., 2009; Poorangi et al., 2013).
Complexity refers to the less likeliness of adopting technology if individuals find it
difficult to use and understand and to the inadequate tools and lack of computers to
support ICTs and e-commerce adoption.
Trialability provides an opportunity for individuals to experiment with technology
innovation for a period of time which reduces their uncertainty toward new technology
adoption (Weiss and Dale, 1998). It includes free trial of e-commerce application before
making a decision to adopt it in organisation which involves having a sufficient period of

64
time to test this application and discover its true capabilities (Kamaroddin et al., 2008;
Poorangi et al., 2013).
Observability, according to Rogers (1995), involves that observing the benefits other
people obtain from adopting an innovation entails more likeliness of adopting that
innovation by those ‘observers’. The Internet has facilitated companies’ visibility to
customers, suppliers and competitors, displaying the benefits of adopting e-commerce. In
addition, websites allow companies to show information about their products and
corporate profiles around the clock to all potential customers and suppliers on the
cyberspace (Limthongchai and Speece 2003; Poorangi et al., 2013).
The second element of innovation process is communication channels which are defined
by Rogers (2003, p.18) as “the means by which messages get from one individual to
another”. This means that individual can share and exchange information to another by
using different type of communication channels such as television, radio, telephone, and
internet. Nowadays, a widespread of the internet has become a useful and cheapest way
to communicate between individuals especially at different geographical area. Rogers
(2003) argued that a communication channel is useful in producing effect on individuals’
attitudes toward a new idea that leads to decide whether to adopt or reject that idea.
The third element is time which is defined by Rogers (2003, p.21) as “the length of time
required to pass through the innovation-decision process”. This decision occurs through a
five step process the first of which is ‘knowledge’ where the individual starts to be aware
and understand an innovation but still lacks information on how it works. The second
step is ‘persuasion’ in which the individual becomes interested in the innovation and

65
searches for information about it. This is followed by ‘decision’, that is considered the
most critical and complicated step, as it is here where the individual’s gathered
information and formed concept of the innovation and its activities lead to the decision
either to adopt or disregard innovation. The fourth step is ‘implementation’, in which the
individual utilizes the innovation and may identify its effectiveness which leads him/her
to search for more information about it.
The last step is ‘confirmation’, as the individual evaluates the innovation and decides
either to continue employing it or not. Moreover, Rogers (2003) involved time into the
innovativeness theory, which implicates its classification based on the period of time.
Rogers (2003, p.37) defines innovativeness as “the degree to which an individual or other
unit of adoption is relatively earlier in adopting new ideas than other members of a social
system”. Rogers (2003) classifies adopters in five categories:
1. Innovators: Rogers (2003) considers innovators as those who are able to adopt
innovation regardless of uncertainly of the risk level at time of adoption. Usually,
innovators have the highest financial resources and social class and are young.
2. Early Adopters: Those who are able to adopt an innovation. Early adopters have a
higher leadership attitude than those of other categories, more financial recourses
and education, and are younger than those of the late majority. They are more
careful to make the decision of adopting an innovation than innovators.
3. Early Majority: Unlike the early adopters and innovators, this group takes more
time than innovators and early adopters for making the decision to adopt an
innovation and seldom hold position of opinion leadership.
66
4. Late Majority: The individuals here are highly cautious and hate to take the risk
of adopting an innovation. In addition, individuals in late majority adopt an
innovation after most others have already adopted it. They are of a low social
class, lack financial recourses, and lower opinion leadership than above
categories.
5. Laggards: This is the group of the conservative and last group of adopters of an
innovation. They almost have no opinion leadership, have lowest financial
resources, cannot tolerate the risk of adopting an innovation that may fail and
have a little or no social class. They are classified as traditional and they take the
decision to adopt an innovation based on the past and previous adopted
innovation.
Social System is the last element of Rogers’ model process, which is defined as “a set of
interrelated units that are engaged in joint problem solving to accomplish a common
goal” (Rogers, 2003, p.23). It includes individuals, organisations and informal groups as
to identify diffusion, norms, and the function of opinion leaders.
Social System determines diffusion and how it affects the diffusion process. Norms are
based on different behavioural attitudes in social system and is used to study how these
attitudes affect diffusion. Rogers (2003) stated that amounts of influence on individuals
are various. An opinion leader plays an important role in influencing other individuals’
behaviours and attitudes either positively or negatively, which makes such leader a very
crucial factor especially at the initial stage of adoption process.
67
The reviewed literature shows that the DoI theory, particularly the Attributes of
Innovation elements, has been widely used as theoretical bases in many empirical studies
addressing technological innovation adoption in SMEs (Tan and Eze, 2008;
Limthongchai and Speece, 2003; Alam et al., 2008; Kendall et al., 2001; Kamaroddin et
al., 2009; Hussin and Noor, 2005; Poorangi et al. , 2013). These studies examined the rate
of innovation identifying potential relevance of factors such as relative advantage,
compatibility, complexity, trialability and observability, in enhancing or inhibiting
technology adoption by SMEs (see Table 3.7 Part 3).
The literature also shows that TAM is similar to DOI in some constructs, even if DOI is
more comprehensive in evaluating behavioural intention of technology. This similarity
can be attributed to the fact that the TAM’s perceived usefulness construct is similar to
relative advantage in DoI and that the perceived ease of use construct in tam is close to
the complexity attribute in DoI (Pham et al., 2011; El-gohary, 2011; Lee et al., 2011;
Karahanna et al., 1999). The DoI supremacy was confirmed by Plouffe et al. (2001), cited
in Olatokun and Igbinedion (2009), who compared between DoI and TAM in predicting
technology adoption of smart card readers by retailers, finding DoI stronger in explaining
technology adoption than TAM, with 45% and 36.2% variance, respectively.
Therefore, many studies replaced the TAM constructs of perceived ease of use and
persevered usefulness with DoI attributes in studying the individual’s intention to use
technology. They found that DoI attributes provided a significant analytical framework
for predicting the intention to use of different types of technology. For example, DoI has
been used in studying customers’ intentions to use online stores (Chen et al., 2002;
68
Zendehdel and Paim, 2012), in automatic teller machines (Olatokun and Igbinedion,
2009), internet banking (MD and Pearson, 2007; Tan and Teo, 2000) and e-learning
(Yatigammana et al., 2014).
However, DoI received the criticism of many researchers who found that the diffusion
variables are not sufficient by themselves to explain the organisational environment, as
they focus solely on technological innovation. DoI, therefore, does not pay attention to
environmental, organisational and cultural factors that determine how technology is
adopted by organisations (Sparling et al., 2010; Perez et al., 2004; Lee and Cheung, 2004;
Allan et al., 2003; Ordanini, 2006).
Ordanini (2006) argued that integrating DoI with other factors, such as environmental
and organisational factors, is necessary in order to capture stronger predictors in the
context of technology adoption. Furthermore, Perez et al. (2004) stated that DoI is not
sufficient to explain adoption within organisational context, suggesting either to add
additional factors or control variable into the original theory.
As a result, many researchers extended their researches by adding more constucts into
DoI to overcome these limitations. Moreover, Kamaroddin et al. (2009) used DoI as a
theoretical basis for measuring the perceptions of Malaysian SMEs regarding e-
commence applications. They integrated within DoI two additional constructs, security
and confidence, identifying their significant effect on Malaysian SMEs’ adoption of e-
commerce. Using DoI and introducing the ICTs security and ICTs cost constructs, Tan
and Eze (2008) examined the factors of ICTs adoption by Malaysian SMEs, finding that
69
the DoI attributes along with security and cost, are significant factors that influence
SMEs to adopt ICTs in their business.
3.2.5 Culture and Technology
There are many definitions of culture. For example, Hofstede (1984, p.24) defined culture
as “the collective programming of the mind which distinguishes the members of one
human group from another”. Also, culture has been defined as “The integrated sum total
of learned behavioural traits that are manifest and shared by members of society”
(Hoebel, 1960, p. 168). Culture has been broadly taken into account in several fields of
study such as information technology (Khushman et al., 2009), international marketing
(Yoo et al., 2011), economic (Borker, 2013) and political sciences (Buff et al., 2008).
A review of literature addressing e-commerce adoption showed that the relation between
culture and technology adoption at organisational level has been a subject of interest of
recent studies of information systems. These studies identified cultural effects on
technology adoption and usage behaviour (Cooper, 1994; Hasan and Ditsa, 1999; Yoon,
2009; Lee et al., 2013).
Hofstede (1991, p.237) defined organisational culture as “the collective programming of
the mind, which characterizes the members of one organisation from others”. Hofstede
(1984) developed a theory to understand the cultural differences that became one of the
most popular cultural theories in social science disciplines, particularly in investigating
technology adoption among different cultures (Nakata and Sivakumar, 2001; Straub et
al., 1997; Chen and McQueen, 2008).
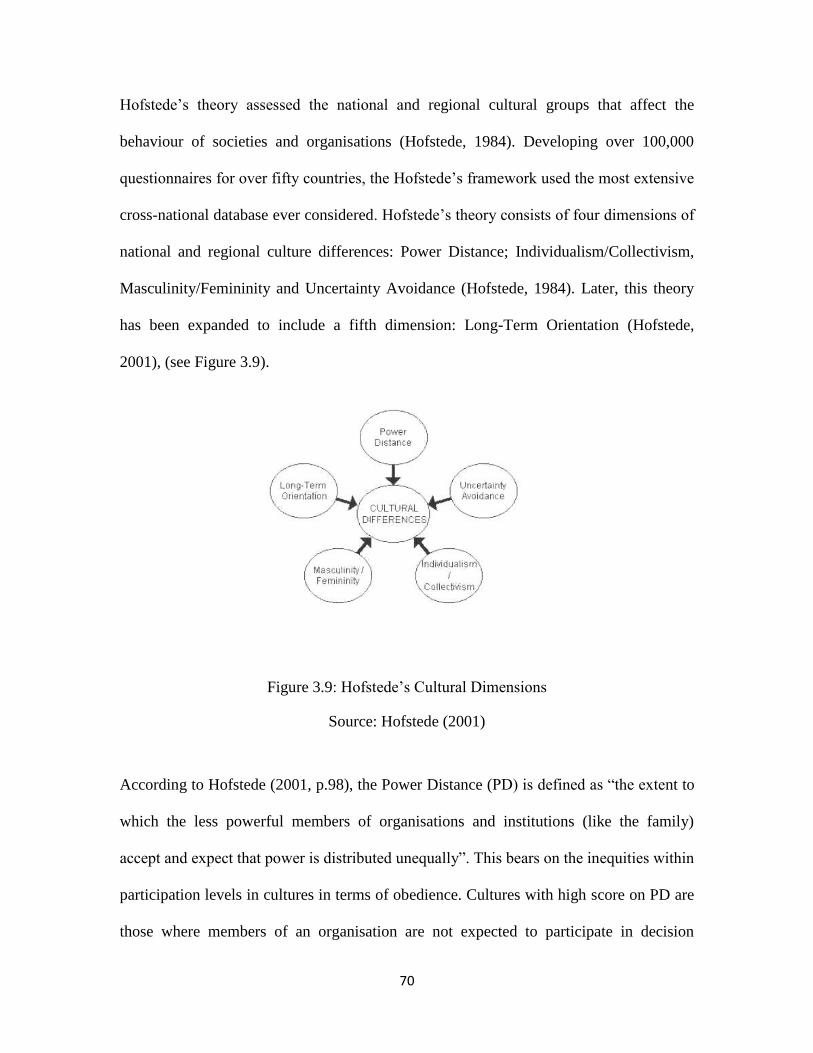
70
Hofstede’s theory assessed the national and regional cultural groups that affect the
behaviour of societies and organisations (Hofstede, 1984). Developing over 100,000
questionnaires for over fifty countries, the Hofstede’s framework used the most extensive
cross-national database ever considered. Hofstede’s theory consists of four dimensions of
national and regional culture differences: Power Distance; Individualism/Collectivism,
Masculinity/Femininity and Uncertainty Avoidance (Hofstede, 1984). Later, this theory
has been expanded to include a fifth dimension: Long-Term Orientation (Hofstede,
2001), (see Figure 3.9).
Figure 3.9: Hofstede’s Cultural Dimensions
Source: Hofstede (2001)
According to Hofstede (2001, p.98), the Power Distance (PD) is defined as “the extent to
which the less powerful members of organisations and institutions (like the family)
accept and expect that power is distributed unequally”. This bears on the inequities within
participation levels in cultures in terms of obedience. Cultures with high score on PD are
those where members of an organisation are not expected to participate in decision
71
making along with their superiors or be involved in managerial issues. Conversely,
cultures with low power distance are those where employees in an organisation evidently
appear not afraid of power, and managers are not paternalistic, which allows employees
to express their opinions and views comfortably and participate in management and
decision making.
Hofstede (2001, p.225) defines Individualism (IDV) as “pertains to societies in which the
ties between individuals are loose: everyone is expected to look after himself or herself
and his or her immediate family”. Conversely, Collectivism is defined as “societies in
which people from birth onwards are integrated into strong, cohesive in-groups, which
throughout people's lifetime continue to protect them in exchange for unquestioning
loyalty”. Therefore, in its essence, it is a dimension that revolves around the extent to
which individuals are engaged within groups.
Hofstede (2001) stated that in countries with a high IDV score, the individuals prefer to
address their goals by themselves, and people are mostly independent and prefer to
assume responsibility individually. In collectivistic societies, on the other hand,
individuals prefer to work in groups and foster commitment to the group members such
as direct relationships with their immediate and extended family and other extended
relationships. Loyalty and harmony are paramount in collectivistic cultures.
Uncertainty Avoidance (UA) is defined as “the extent to which a culture programs its
members to feel either uncomfortable or comfortable in unstructured situations.
Unstructured situations are novel, unknown, surprising, and different from usual. The
basic problem involved is the degree to which a society tries to control the
72
uncontrollable” (Hofstede, 2001, p.145). This dimension is about the extent of people’s
ability to deal with unknown and uncertain events and the future. Cultures with a high
score in UA prefer to minimize ambiguous events by following orders, abide by strict and
clear rules and guidelines, and other ways of avoiding risk. But people from cultures with
low score in UA are more tolerance of the unknown, unexpected and uncertain events,
more willing to take risk, and able to accept different opinions and develop innovative
ideas.
Hofstede (2001, p.297) defines the Masculinity/Femininity (MAS) dimension as follows:
“masculinity pertains to societies in which social gender roles are clearly distinct (i.e.,
men are supposed to be assertive, tough, and focused on material success whereas women
are supposed to be more modest, tender, and concerned with the quality of life);
femininity pertains to societies in which social gender roles overlap (i.e., both men and
women are supposed to be modest, tender, and concerned with the quality of life)”. In
cultures with high score in masculinity, people are more interested in wealth acquisition
and are more assertive, and gender role are more distinct, whereas in a feminine culture,
there is more gender-based equity in gender roles, modesty, care for others and more
interest in the quality of life.
The last cultural diminution is long-term orientation (LTO). Hofstede (2001) added this
dimension to the original four as to understand culture’s time horizon. He defines it as
“the extent to which a culture programs its members to accept delayed gratification of
their material, social and emotional needs” (Hofstede, 2001, p.351). Societies of long-
term orientation are persistent, practical, thrift and have a sense of shame, while those of

73
short–term orientation have more respect for tradition, personal steadiness and stability,
preservation of one’s face and tendency to interchange gifts and favours.
Hofstede measured each dimension starting from the lowest score (1) to the highest
(120). Hofstede’s scale and results have been initially validated against forty cross-
national cultures (Hofstede, 1984). It was later expanded to include another 32 countries
(Hofstede, 2001).
According to Hofstede results (see Figure 3.10), Jordan scored high (70) in PD, which
indicates that Jordan's culture entertains a hierarchical order and is characterized by
inequality. Also, the organisations employees in Jordan are expected to obey their
superiors’ instructions without argument. The results also showed that Jordan has low
score (30) in IDV, emphasizing the collectivistic character of the society, people’s
preference to work within groups and importance of loyalty and harmony in this culture.
Regarding the organisational level, the relationship between employees and employer in
Jordan is based on moral terms such as family links, while the promotion and
employment process are based on employee’s in-group.
Moreover , the results showed that Jordan has high score (65) in uncertainty avoidance,
which is indicative of a culture where unknown situations and risks are feared, precision
and punctuality sought, innovation resisted and security required for motivating
individuals. On the organisational level, employees have high stress and anxiety due to
uncertainty about future including employment stability, which drives them to follow the
organisation’s rules to reduce these issues.
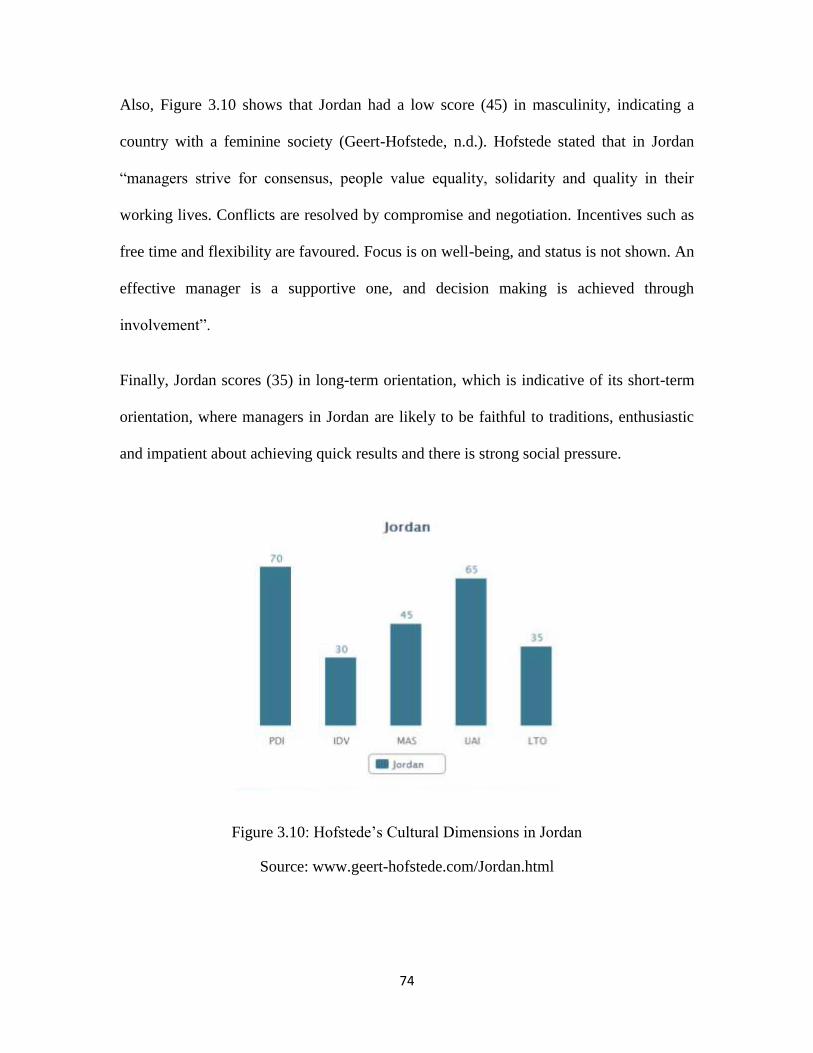
74
Also, Figure 3.10 shows that Jordan had a low score (45) in masculinity, indicating a
country with a feminine society (Geert-Hofstede, n.d.). Hofstede stated that in Jordan
“managers strive for consensus, people value equality, solidarity and quality in their
working lives. Conflicts are resolved by compromise and negotiation. Incentives such as
free time and flexibility are favoured. Focus is on well-being, and status is not shown. An
effective manager is a supportive one, and decision making is achieved through
involvement”.
Finally, Jordan scores (35) in long-term orientation, which is indicative of its short-term
orientation, where managers in Jordan are likely to be faithful to traditions, enthusiastic
and impatient about achieving quick results and there is strong social pressure.
Figure 3.10: Hofstede’s Cultural Dimensions in Jordan
Source: www.geert-hofstede.com/Jordan.html

75
The Hofstede’s cultural dimensions were found a robust theory in explaining the effect of
culture on the diffusion process of technology adoption in organisations. Thus, many
studies used this theory either solely or integrated with other models to predict e-
commerce adoption by cultures. For example, Hassan and Dista (1999) tested Hofstede's
theory regarding technology adoption in three countries (in the Middle East, Australia
and Africa) and found resistance to change and fear to be significant factors that inhibit
managers in the Middle East from adopting technology in SMEs rather than Australia and
Africa.
Also, Yoon (2009) conducted a study to predict the effect of national culture on
consumer’s acceptance of e-commence in China, finding that that UA and LTO
dimensions are significantly related to intention to use online shopping. Straub et al.
(1997) investigated the applicability of TAM in different cultures, including the U.S,
Switzerland and Japan. They found that TAM was useful in USA and Switzerland but not
in Japan culture has a higher degree of UA and PD. All these results confirm the
significant effect of cultural differences on technology adoption.
Straub et al. (2001) investigated the effect of cultural factors on technology adoption in
the Arab Region, concluding that the Arab culture leads to a slow diffusion process of
technology adoption. Using TAM, Veigna and Floyd (2001) studied the impact of culture
on the use of technology, finding that Hofstede’s cultural dimensions had an important
influence on e-commerce adoption, particularly in the PU construct.
Moreover, a study conducted by Kushman et al. (2009) to investigate the relationship
between the Arab culture and e-business adoption found that this culture has a high
76
degree in PD, UA and MAS, and low degree in IDV. The findings revealed that all these
cultural dimensions have a significant effect on e-business adoption.
Thatcher et al. (2006) examined the factors affecting e-commerce adoption among
owners/mangers in electronic and textile companies in Taiwan, where cultural values
were identified as important determinants of the e-commerce adoption decision. Table
3.7 Part 5, summarizes the studies that used Hofstede’s cultural dimensions in studying
technology adoption in SMEs.
Although Hofstede’s Cultural Dimensions theory has been found widely applicable, it did
not escape criticism for displaying a number of limitations. The first limitation is that the
sample used in his study was IBM employees, who stand for members of a homogeneous
corporate culture across different countries rather than heterogeneous cultures within a
country (Shackleton and Ali, 1990).
The second limitation is that Hofstede’s theory fails to capture the flexibility of cultural
dimensions over time and its being influenced by technology and media. This made
several researchers consider Hofstede’s results outdated especially that his study was
conducted in 1980 (Kirkman et al., 2006; Usunier and Lee, 2005). For example, Hofstede
(1980) found that Arab cultures have a lower score in the Masculinity dimension than
Western cultures, while Khasman et al. (2009) found that Arab cultures have a higher
degree of Masculinity than Western Europe.
Finally, the cultural emphasis of Hofstede’s is only on groups, excluding individual
differences inside within the group (Yoo et al., 2002, cited in Collins et al. 2009). When
applied on individuals it proved useful regarding e-commerce adoption in SMEs. For

77
example, Chen and McQeen (2008) applied Hofstede’s cultural dimensions to investigate
the growth of e-commerce adoption levels among Chinese owners/managers of SMEs in
New Zealand, finding cultural values significant predictors of the SMEs’ e-commerce
growth process. Almoawi (2011) adopted Hofstede’s cultural dimensions as a moderator
in the TOE model to identify the factors of e-commerce adoption by SMEs in Saudi
Arabia .The findings revealed that Hofstede’s cultural dimensions has a moderate effect
between TOE factors and e-commerce adoption.
3.3 Integrated Models and Theories
As discussed in the above section, many studies investigated technology innovation and
its adoption. They observed, discussed and tested various theories and models related to
technology adoption, particularly e-commerce adoption by users/organisations. The
available literature presented the most common theories and models in technology
innovation and adoption including: Theory of Reasoned Action (TRA), Theory of
Planned Behaviour (TPB), Technology Acceptance Model (TAM), Technology-
Organisation-Environment (TOE), Diffusion of Innovation (DOI) and Hofstede’s
Cultural Dimensions. It also shows that those models and theories have limitations. Table
3.1 below presents brief comments on technology adoption in these theories and models.
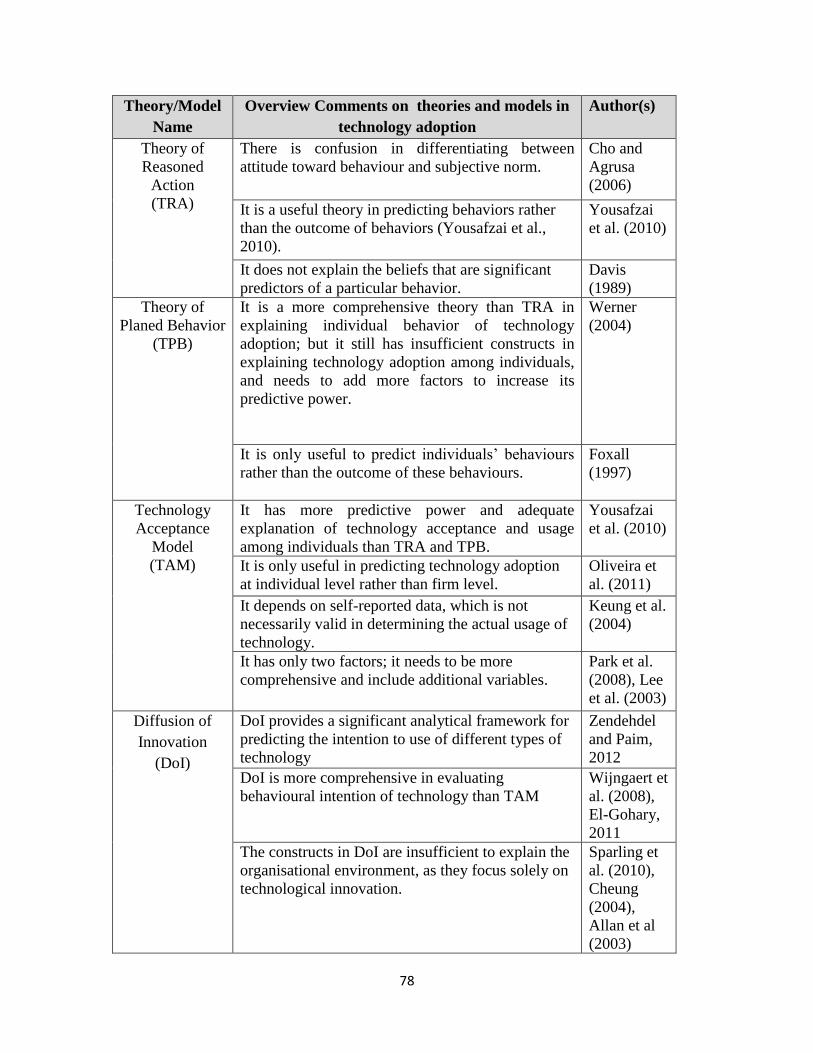
78
Theory/Model
Name
Overview Comments on theories and models in
technology adoption
Author(s)
Theory of
Reasoned
Action
(TRA)
There is confusion in differentiating between
attitude toward behaviour and subjective norm.
Cho and
Agrusa
(2006)
It is a useful theory in predicting behaviors rather
than the outcome of behaviors (Yousafzai et al.,
2010).
Yousafzai
et al. (2010)
It does not explain the beliefs that are significant
predictors of a particular behavior.
Davis
(1989)
Theory of
Planed Behavior
(TPB)
It is a more comprehensive theory than TRA in
explaining individual behavior of technology
adoption; but it still has insufficient constructs in
explaining technology adoption among individuals,
and needs to add more factors to increase its
predictive power.
Werner
(2004)
It is only useful to predict individuals’ behaviours
rather than the outcome of these behaviours.
Foxall
(1997)
Technology
Acceptance
Model
(TAM)
It has more predictive power and adequate
explanation of technology acceptance and usage
among individuals than TRA and TPB.
Yousafzai
et al. (2010)
It is only useful in predicting technology adoption
at individual level rather than firm level.
Oliveira et
al. (2011)
It depends on self-reported data, which is not
necessarily valid in determining the actual usage of
technology.
Keung et al.
(2004)
It has only two factors; it needs to be more
comprehensive and include additional variables.
Park et al.
(2008), Lee
et al. (2003)
Diffusion of
Innovation
(DoI)
DoI provides a significant analytical framework for
predicting the intention to use of different types of
technology
Zendehdel
and Paim,
2012
DoI is more comprehensive in evaluating
behavioural intention of technology than TAM
Wijngaert et
al. (2008),
El-Gohary,
2011
The constructs in DoI are insufficient to explain the
organisational environment, as they focus solely on
technological innovation.
Sparling et
al. (2010),
Cheung
(2004),
Allan et al
(2003)
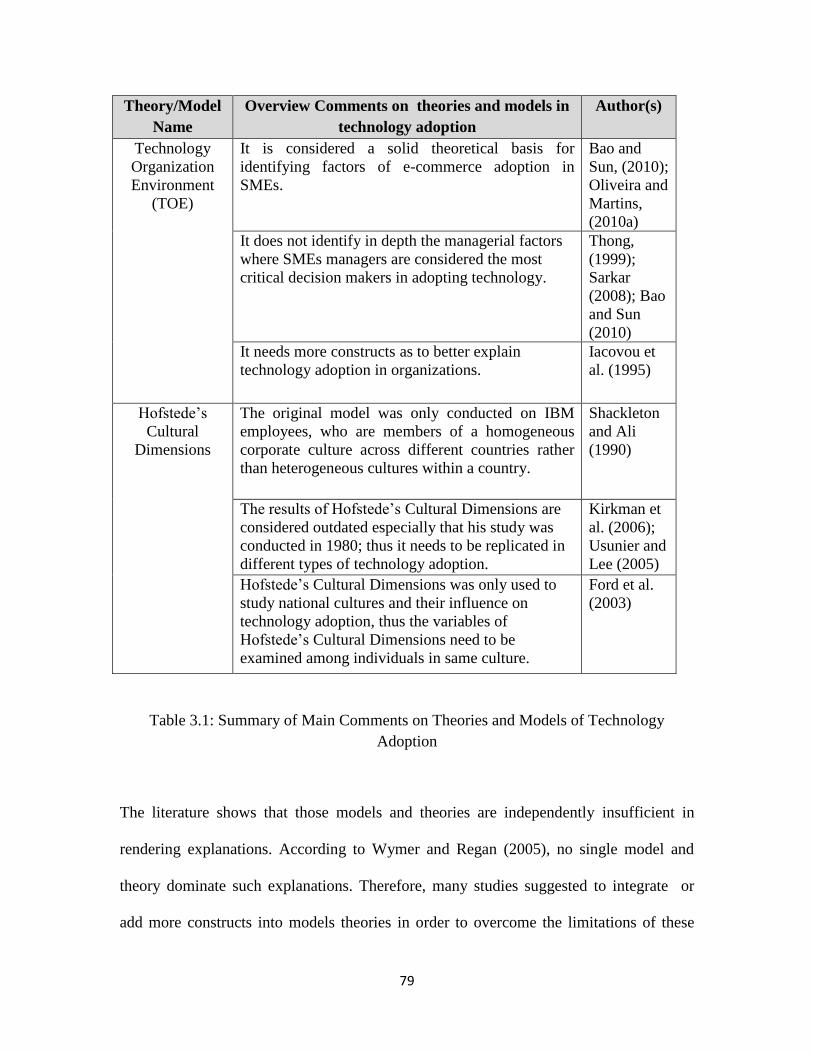
79
Theory/Model
Name
Overview Comments on theories and models in
technology adoption
Author(s)
Technology
Organization
Environment
(TOE)
It is considered a solid theoretical basis for
identifying factors of e-commerce adoption in
SMEs.
Bao and
Sun, (2010);
Oliveira and
Martins,
(2010a)
It does not identify in depth the managerial factors
where SMEs managers are considered the most
critical decision makers in adopting technology.
Thong,
(1999);
Sarkar
(2008); Bao
and Sun
(2010)
It needs more constructs as to better explain
technology adoption in organizations.
Iacovou et
al. (1995)
Hofstede’s
Cultural
Dimensions
The original model was only conducted on IBM
employees, who are members of a homogeneous
corporate culture across different countries rather
than heterogeneous cultures within a country.
Shackleton
and Ali
(1990)
The results of Hofstede’s Cultural Dimensions are
considered outdated especially that his study was
conducted in 1980; thus it needs to be replicated in
different types of technology adoption.
Kirkman et
al. (2006);
Usunier and
Lee (2005)
Hofstede’s Cultural Dimensions was only used to
study national cultures and their influence on
technology adoption, thus the variables of
Hofstede’s Cultural Dimensions need to be
examined among individuals in same culture.
Ford et al.
(2003)
Table 3.1: Summary of Main Comments on Theories and Models of Technology
Adoption
The literature shows that those models and theories are independently insufficient in
rendering explanations. According to Wymer and Regan (2005), no single model and
theory dominate such explanations. Therefore, many studies suggested to integrate or
add more constructs into models theories in order to overcome the limitations of these

80
theories and provide more comprehensive explanations of technology adoption. Table
3.7 Part 6 presents the reviewed the studies that used integrated models and theories that
influence technology and e-commerce adoption by SMEs in both developed and
developing countries.
According to Chooprayoon et al. (2007), suggested extending TAM by combining it with
other theoretical models in order to become more useful for investigating technology
adoption. Indeed, as shown in Table 3.7 Part 6 ,many empirical studies extended TAM by
including additional constructs or integrating it with other models/theories to enhance its
explanation of behavioural Intention to use a system ( Grandon and Pearson, 2004; Awa
et al., 2010; Riemenschneider et al., 2003; Abou-Shouk et al.(2012).
For Example, Grandon and Pearson (2004) used TAM, introducing additional constructs
from TOE and Iacovou et al.(2005) model to identify the factors that affect the adoption
e-commerce as perceived by decision makers in USA SMEs (Figure 3.11). This model
was found valid and powerful in predicting e-commerce adoption by decision makers in
SMEs.
Figure 3.11: Grandon and Pearson s’ Model
Source: Grandon and Pearson (2004)

81
Also, Many studies have suggested integrating TOE with DoI which introduced more
strength in explaining technology adoption. As shown in Table 3.7 Part 6 ,various studies
incorporated TOE and Diffusion of Innovation by Rogers (1995) within a theoretical
model to determine the factors of technology adoption in organisation (Tan, 2010; Allan
et al. , 2003; Forman, 2005; Ling, 2001; Zhu and Kraemer, 2005; Scupola, 2009; Oliveira
et al. , 2010). These agreed that TOE is consistent with DoI which creates a better
explanation of technological factors that influence organisations’ adoption of technology.
Many, for instance, integrated DoI with TOE model to identify the factors that influence
and inhibit technology adoption in SMEs (Allan et al., 2003; Forman, 2005; Ling, 2001;
Zhu and Kraemer, 2005). Their findings confirmed that using both theories provided a
robust explaination in technology adoption by organizations. This is because DoI is
independently applicable to explain organizational and technological contexts and it is
insufficient to explain environmental context, which TOE includes environmental context
in explanation innovation adoption in organizations (Oliveira et al. , 2011).
Also, Table 3.7 Part 6 shows other studies integrated TOE with TAM to explain
technology adoption such as SMEs’ adoption of IT (Awa et al., 2010) and e-commerce
SMEs (Awa and Ukoha, 2012).They found that the integration between TAM and TOE
provide more comprehensive explanation of e-commerce adoption.
82
3.4 Previous Studies on E-commerce Innovation Adoption
The literature review shows that many researchers extended their researches by
integrating several models in order to provide comprehensive view of technology
adoption by SMEs. Table 3.7 presents a summary of the factors involved in technology
and e-commerce adoption by organisations, as identified by the most popular studies. It
shows the model/theory, object of analysis, type of industry, place of research and
number of sampling, research method, explanatory variables and major findings.
It can be clearly found in this table, that a wide range of theoretical foundations has been
provided including numerous variables that function as facilitators or inhibitors of
technology adoption and use. It is noteworthy here the heterogeneity in describing these
factors as well as the wide range of independent variables (Huang et al., 2004; Wymer
and Regan, 2005; Al-Somali et al., 2011).
For example, the analysis conducted by Huy et al. (2012) is based on sixteen independent
variables, while Kurnia et al. (2009) identified five independent variables to study e-
commerce adoption in SMEs. It was also noted that even similar studies produced
inconsistent findings. For example, Hussin and Noor (2005) and Lin and Wu (2004)
found that Top Management Support was the most significant factor in SMEs’ adoption
of e-commerce , while Seyal et al. (2004) and Sparling et al. (2007) found that factor not
statistically significant in SMEs’ adoption of e-commence.
Moreover, it was found from Table 3.7 that many of prior studies used different
terminology of describing same factor. For example , Many of prior studies have used
different terms to describe the advantages of using technology such as “E-commerce
83
Benefits” (Alamro and Tarawneh, 2011; Seyal et al., 2005; Kurnia et al., 2009; Ifinedo,
2011, Relative advantage (Huy et al., 2012; Hung et al., 2011; Sparling et al., 2007;
Ramdani and Kawalek, 2009; Tan et al.; 2008, Ghobakhloo et al.; 2011) , Perceived
Usefulness (Azam and Quaddus, 2012; Yoon, 2009; Straub et al., 1997; Lin and Wu,
2004; Khan et al. , 2010).
In another manifestation of such inconsistency, as shown in Table 3.7, some studies
sought to explain technology adoption through only addressing the barriers to that
adoption, while others’ concern was only directed to facilitators. For example, Heung
(2003) investigated the barriers of e-commence adoption in travel agencies in China,
while Abou-Shouk et al. (2012) considered the perceived benefits of e-commerce
adoption in Egyptian travel agencies.
This wide range of identified variables affecting technology and e-commerce adoption in
SMEs and the different significant predictors produced by studies can be attributed to two
main reasons.
First, it is believed that different socio-cultural national environments lead to different
rates of technology innovation diffusion in SMEs (Scupola, 2009). This was confirmed
by Zhu et al. study (2006b) that used TOE as theoretical framework to identify factors
affecting e-business adoption by SMEs in ten different countries. The findings revealed
that technology readiness and environmental context have more significant role in SMEs’
decision to adopt e-business in developing countries than in developed countries.
Also, Kartiwi (2006) found that factors influencing e-commerce adoption by SMEs in
developing countries are different from adoption of e-commerce by SMEs in developed
84
countries. They suggested that reason of these differences between developed and
developing countries are based on cultural differences between these countries.
Second, limited of studies focused on the different levels of e-commerce adoption in
organisation, while the majority of studies focused e-commerce adoption as a
dichotomous variable. However, it was found that different factors influence different
levels of this adoption (Kurnia et al., 2009; Al-somali et al., 2009, Raymond, 2001,
Hussein, 2009). Scupola (2009) even highlighted the need to focus on the different levels
as dependent variable. She stated that “the rate of e-commerce adoption and diffusion
among SMEs increases and consequently SMEs become more acquainted and
sophisticated in incorporating e-commerce in their operations it can be expected that the
drivers and inhibitors of e-commerce adoption and implementation change as a result”
(p.4-5).
For example, Chen and McQueen (2008) have investigated the effects of Hofstede’s
cultural dimensions on the attitudes of owners/managers of Chinese SMEs in New
Zealand toward e-commerce adoption level. They identified four levels of e-commerce
adoption, starting in basic websites and reaching online payment website. They found
that the different rates of Hofstede’s cultural dimensions have different effect on the
adoption of e-commerce levels. The findings revealed that SMEs at lower levels of e-
commerce adoption are highly rated on individualism, uncertainty avoidance, and power
distance, while SMEs at higher levels of e-commerce adoption have lower rate of
individualism, uncertainty avoidance, and power distance.
85
Also, a study by Al-Somali et al. (2011), who adopted TOE model to identify the effect
of different factors that may influence different levels of e-commerce adoption among
Saudi Arabian SMEs. The findings supported their suggestions and found that different
factors affect different levels of e-commerce adoption. The results showed that
Organisational IT Readiness, Top Management Support, Regulatory Environment are
significant factors in predicting e-commerce for both levels simple and advanced e-
commerce adoption, while Customer Support and Strategic Orientation have significant
influence only on the advanced level of e-commerce adoption.
The reviewed literature shows that various studies described different groups of factors
influencing e-commerce adoption in SMEs. Grouping such factors is heterogeneous
among these studies. For example, many studies have used three categories for the
effective factors: technological, organizational and environmental contexts (Hao et al.,
2010; Scupola, 2009; Seyal et al., 2005; Alamro and Tarawneh, 2011; Ghobakhloo et al.,
2011; Ramdani and Kawalek, 2009; Scupola, 2003; Seyal et al., 2004; Kurnia et al.,
2009; Hung et al., 2011; Sparling et al., 2007).
Other studies, such as Huy et al. (2012), Ching and Ellis (2004) and Hussein (2009),
added an additional context, the managerial context. While Raymond (2001) developed
four groups of categories, namely: the environmental context, marketing strategy,
managerial context and characteristics of e-commerce. Kurnia et al. (2009) divided
variables into four categories: organization readiness, national readiness, industrial
readiness and environmental pressure.

86
A recent study by Abou-Shouk et al. (2012) used three categories to investigate the
factors affecting Egyptian travel agencies’ adoption of e-commerce. These categories
include essential benefits, marketing and competition benefits and business internal
efficiency benefits. Therefore, the reviewed literature shows that factors of e-commerce
adoption are either related to categories of theoretical model or other categories
developed independently by researchers based on the objectives of each study.
3.5 Studies of Factors Affecting E-commerce Adoption in SMEs
Based on above discussion , many factors has been identified to predict e-commerce and
technology adoption. These factors were grouped in different contexts (see table 3.7)
,however this study concludes that most of these factors can be grouped into four main
dimensions : technological factors, organizational factors, managerial and environmental
factors. The following section discuses the factors affecting e-commerce adoption
relevant to literature.
3.5.1 Technological Factors
The reviewed literature had presented a number of identified factors related to the
technological context, (see Table 3.2). According to Ma et al. (2003) the decision to
adopt technology in SMEs does not only depend on technological availability in the
market, but also the knowledge of how to apply new technology properly as to meet their
business needs. The technological factors identified in the literature include e-commerce
benefits, information systems input, perceived benefits, task variety, e-commerce
barriers, technology competence, cost, security, perceived ease of use, perceived
87
usefulness, risk, relative advantages, compatibility, trialability, complexity, observability,
technology readiness, and technology integration.
Among these factors, several studies found that the most appropriate key factors
explaining technological factors are the DoI theory explained by Attributes of Innovation
proposed by Rogers (2003). They show that technological factors include relative
advantage, compatibility, complexity, trialability and observability, as DoI provides more
robust understanding of the technological factors that influence technology adoption
(Oliveira et al., 2011).
As a result, these factors have been widely examined to determine their impact on
technology and e-commerce adoption by SMEs. The literature shows inconsistent results
for the same factor amongst different studies. For example, Limthongchai and Speece
(2003) investigated e-commerce adoption by SMEs in Thailand using the innovation
characteristics of DoI, introducing security as an additional construct. They found all DoI
characteristics to be significant except trialability, while security had the least significant
effect on e-commerce adoption. Alam et al. (2008) used a model similar to that of
Limthongchai and Speece (2003) to study e-commerce adoption in Malaysian
manufacturing sectors, finding that DoI factors are significant in predicting e-commerce
adoption. Other studies identified different technological factors such as technological
benefits (Teo et al., 2009; Seyal et al, 2004; Ifinedo, 2011; Scupola, 2003), e-commerce
barriers (Alamoro and Tarawneh, 2011; Heung, 2003), task variety (Seyal et al., 2005),
perceived ease of use and perceived usefulness (Luo and Remus, 2006; Lin and Wu,
2004; McKechnie et al, 2001). The following table shows a summary of technological
factors identified in the reviewed literature.

88
Technological Factors Author(s)
Relative Advantage Scupola (2009); Ghobakhloo et al. (2011); Tan et al.
(2008); Ramdani and Kawalek (2009); Limthongchai and
Speece (2003); Hussin and Noor (2005); Almoawi
(2011); Sparling et al. (2007); Hussein (2009); Hung et
al. (2011); Huy et al. (2012)
Compatibility Hung et al. (2011); Huy et al. (2012); Ghobakhloo et al.
(2011); Hung et al. (2011); Tan et al. (2008); Ramdani
and Kawalek (2009); Tan and Teo (2000); Limthongchai
and Speece (2003); Hussin and Noor (2005); Hussein
(2009); Sparling et al. (2007); Almoawi (2011)
Trialability Tan et al. (2008); Ramdani and Kawalek (2009); Tan and
Teo (2000); Limthongchai and Speece (2003); Hussin
and Noor (2005); Hussein (2009)
Complexity Huy et al. (2012); Limthongchai and Speece (2003);
Almoawi (2011); Hussein (2009); Tan et al. (2008);
Ramdani and Kawalek (2009); Hussin and Noor (2005)
Observability Tan et al. (2008); Ramdani and Kawalek (2009);
Limthongchai and Speece (2003); Hussin and Noor
(2005); Hussein (2009)
Technology Readiness Zhu et al. (2006b); Al-Somali et al. (2011)
Task Variety Seyal et al. (2005); Seyal et al. (2004)
E-Commerce Barriers Scupola (2009); Alamro and Tarawneh (2011)
Technology Competence Zhu et al. (2003)
Perceived Ease of Use Lin and Wu (2004); Straub et al.(1997)
Luo and Remus (2006); McKechnie et al. (2001); Pavlou
(2003); Grandon and Pearson (2004)
Perceived Usefulness Pavlou (2003); Grandon and Pearson (2004); Lin and Wu
(2004); Straub et al. (1997); Luo and Remus (2006);
McKechnie et al. (2001)
Risk Tan and Teo (2000); Hussein (2009); Hung et al. (2011);
Huy et al. (2012)

89
Security Limthongchai and Speece (2003); Hao et al. (2010); Tan
et al. (2008); Limthongchai and Speece (2003)
Technological Factors Author(s)
E-Commerce Benefits Scupola (2009); Alamro and Tarawneh (2011)
Perceived Benefits Raymond (2001); Teo et al. 2009; Seyal et al. (2004);
Seyal et al. (2005); Ifinedo (2011)
Technology Integration Zhu et al. (2006b)
Table 3.2: Summary of Technological Factors Identified in the Reviewed Literature
3.5.2 Organizational Factors
Table 3.3 below, shows a number of organizational factors associated with the adoption
of technology. Several studies confirmed the importance of determining organizational
factors in order to have successful adoption of new technology in the organization
(Wymer and Regan, 2005; Raymond, 2001; Kurnia et al., 2009). Organizational factors
refer to the organizational characteristics related to the decision to adopt a new
technology (Lippert and Govindarajulu, 2006).
The reviewed literature shows that organizational factors include cost, firm size, IT
readiness and availability, organizational culture, financial resources, Employees’ IT
knowledge, firm scope, organizational IT competence, strategic orientation, marketing
capabilities, business category, centralization and formalization.
90
Many studies found the firm size to be one of the main key predictors of ICTs and e-
commerce adoption by SMEs (Jeyaraj et al., 2006; Thong, 1999; Zhu et al., 2003;
Ramadani an Kawalek, 2009). Employee’s IT knowledge is another common
organizational factor in the literature on technology adoption. According to Lippert and
Govindarajulu (2006, p.152) Employee’s IT knowledge is “the sum of technological
expertise by all members of an organization and is reflected in the technological
sophistication of their operations”. This factor has been widely identified and considered
as significant in predicting e-commerce adoption by SMEs (Scupola, 2009; Ramdani and
Kawalek, 2009; Huy et al., 2012; Alam and Noor, 2009; Thong, 1999).
The cost factor was also found very significant in predicting technology and e-commerce
adoption by SMEs. Different terms have been used in describing this factor. For example,
many studies use financial barriers or cost (Ghobakhloo et al., 2011; Tan et al., 2008;
Teo, et al., 2009) while others use financial benefits (Abou-Shouk et al., 2012) or
financial resources (Ifinedo, 2011; Alamro and Tarawneh, 2011).
On the other hand, variability of factors was identified in the organizational context. For
example, Sparling et al. (2007) proposed that organizational factors refer to firm size,
technological readiness, and technological opportunism. Huy et al. (2012) identified
factors in the organizational context to include employee’s e-commerce knowledge,
organizational readiness, firm strategic orientation, firm size, and firm globalization
orientation. Other findings by Ramdani et al. (2009) identified the organizational factors
that relate as top management support, organisational readiness, IS experience, firm size.
However, the following section of this study discusses in details the managerial factors in
different category.
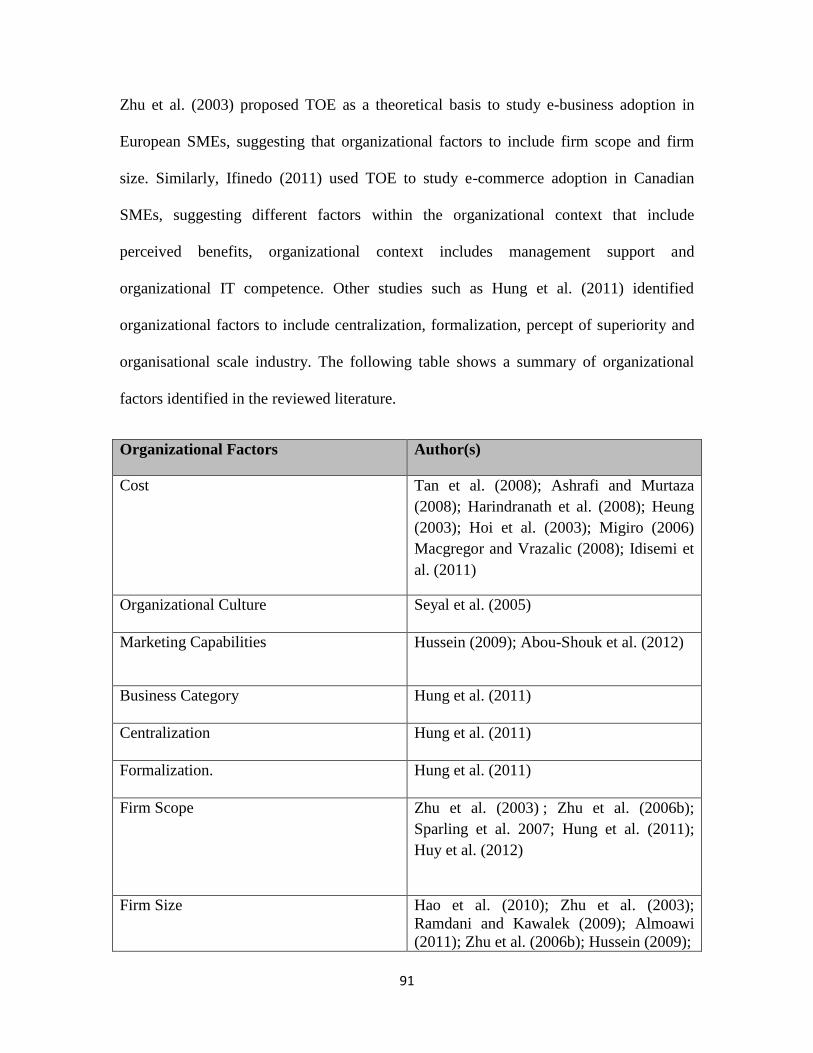
91
Zhu et al. (2003) proposed TOE as a theoretical basis to study e-business adoption in
European SMEs, suggesting that organizational factors to include firm scope and firm
size. Similarly, Ifinedo (2011) used TOE to study e-commerce adoption in Canadian
SMEs, suggesting different factors within the organizational context that include
perceived benefits, organizational context includes management support and
organizational IT competence. Other studies such as Hung et al. (2011) identified
organizational factors to include centralization, formalization, percept of superiority and
organisational scale industry. The following table shows a summary of organizational
factors identified in the reviewed literature.
Organizational Factors Author(s)
Cost Tan et al. (2008); Ashrafi and Murtaza
(2008); Harindranath et al. (2008); Heung
(2003); Hoi et al. (2003); Migiro (2006)
Macgregor and Vrazalic (2008); Idisemi et
al. (2011)
Organizational Culture Seyal et al. (2005)
Marketing Capabilities Hussein (2009); Abou-Shouk et al. (2012)
Business Category Hung et al. (2011)
Centralization Hung et al. (2011)
Formalization. Hung et al. (2011)
Firm Scope Zhu et al. (2003) ; Zhu et al. (2006b);
Sparling et al. 2007; Hung et al. (2011);
Huy et al. (2012)
Firm Size Hao et al. (2010); Zhu et al. (2003);
Ramdani and Kawalek (2009); Almoawi
(2011); Zhu et al. (2006b); Hussein (2009);
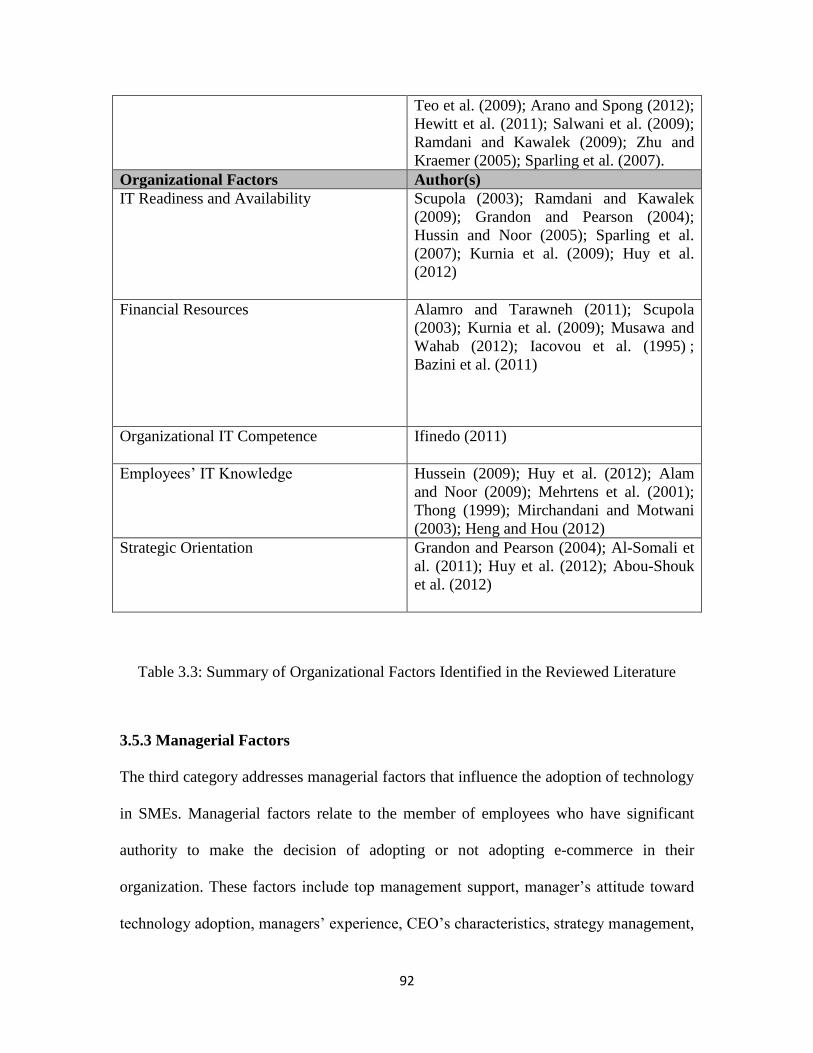
92
Teo et al. (2009); Arano and Spong (2012);
Hewitt et al. (2011); Salwani et al. (2009);
Ramdani and Kawalek (2009); Zhu and
Kraemer (2005); Sparling et al. (2007).
Organizational Factors Author(s)
IT Readiness and Availability Scupola (2003); Ramdani and Kawalek
(2009); Grandon and Pearson (2004);
Hussin and Noor (2005); Sparling et al.
(2007); Kurnia et al. (2009); Huy et al.
(2012)
Financial Resources Alamro and Tarawneh (2011); Scupola
(2003); Kurnia et al. (2009); Musawa and
Wahab (2012); Iacovou et al. (1995) ;
Bazini et al. (2011)
Organizational IT Competence Ifinedo (2011)
Employees’ IT Knowledge Hussein (2009); Huy et al. (2012); Alam
and Noor (2009); Mehrtens et al. (2001);
Thong (1999); Mirchandani and Motwani
(2003); Heng and Hou (2012)
Strategic Orientation Grandon and Pearson (2004); Al-Somali et
al. (2011); Huy et al. (2012); Abou-Shouk
et al. (2012)
Table 3.3: Summary of Organizational Factors Identified in the Reviewed Literature
3.5.3 Managerial Factors
The third category addresses managerial factors that influence the adoption of technology
in SMEs. Managerial factors relate to the member of employees who have significant
authority to make the decision of adopting or not adopting e-commerce in their
organization. These factors include top management support, manager’s attitude toward
technology adoption, managers’ experience, CEO’s characteristics, strategy management,
93
manger’s IT knowledge, CEO’s innovativeness, CEO’s commitment to IT, managerial
obstacles, strategic orientation, response to risk, manager’s attitude toward change,
motivation to use e-commerce, power distance, and uncertainty avoidance. The literature
review shows that several studies have addressed manager’s characteristics as a potential
key determinant of technology adoption. According to Rogers (2003) individual’s
decision to adopt innovation relies mainly on knowledge about particular innovation.
Many studies found that manger’s IT knowledge is a significant determinant of
technology and e-commerce adoption by SMEs (Ifinedo, 2011; Al-Somali, 2011; Heung,
2003; Hao et al., 2010; Scupola, 2009). Other studies, such as those of Raymond (2001)
and Ramdani and Kawalek (2009), who identified managers’ experience , as well as
Ghobakhloo et al. (2011) and Almoawi (2011) who identified CEO’s innovativeness are
similar to manger’s IT knowledge in definition and finding it as potential significant
factor in determining e-commerce adoption by SMEs.
The literature shows that there is a significant link between top management support and
technology adoption. According to Al-Somali and Clegg (2011, p. 408) “Successful
innovation adoption requires support from top management to integrate the innovation
into business activities and processes. Broadly speaking e-commerce may be exacerbated
by poor management commitment and support”. Several studies found that top
management support has an important influence on e-commerce adoption by SMEs
(Ifinedo, 2011; Al-Somali, 2011; Heung, 2003; Hao et al., 2010; Scupola, 2009). Other
studies such as that of Hussin and Noor (2005) identified CEO commitment to IT and
found it as a potential significant factor in determining e-commerce adoption by SMEs.

94
Moreover, literature identified the characteristics of managers as barriers to adopt e-
commerce. For example, Zhu et al. identified managerial obstacle that inhibit the
adoption of e-commerce in SMEs. Similarly, other studies used response to risk (Hussein,
2009) and uncertainty avoidance (Chen and McQueen, 2008) founding them negatively
correlated with adoption of technology in SMEs.
Rogers (2003) argued that innovation adoption is significantly correlated with the
innovation decision process, particularly when an attitude of decision maker will be
either negative or positive towards performing or rejecting innovation. Therefore,
managers’ attitudes play a crucial role in adopting or not adopting the new innovation.
Many studies investigated the effect of manager’s attitude towards e-commence adoption
in SMEs. For example, Mpofu et al. (2009), Seyal & Rahman (2003) and To and Ngai
(2007) found that e-commerce adoption in SMEs is positively and significantly driven by
managers’ attitude toward the use of information technology. The following table shows
the summary of managerial factors that identified in the reviewed literature.
Managerial Factors Author(s)
Top Management Support Scupola (2009); Lin and Wu (2004);
Alamro and Tarawneh (2011); Teo et al.
(2009); Chong et al. (2009); Ramdani and
Kawalek (2009); Al-Weshah and Al-Zubi
(2012); Beatty et al. (2001); Shaharudin et
al. (2011); Ifinedo (2011); Al-Somali et al.
(2011); Hussein (2009); Seyal et al. (2004);
Scupola (2009); Hao et al. (2010)
Manager’s Attitude toward Technology
Adoption
Almoawi (2011); Hussein (2009); Mpofu et
al. (2009); Seyal and Rahman, (2003); To
and Ngai (2007); Teo et al. (2009); Ramsey
and McCole (2005); Huy et al. (2012);
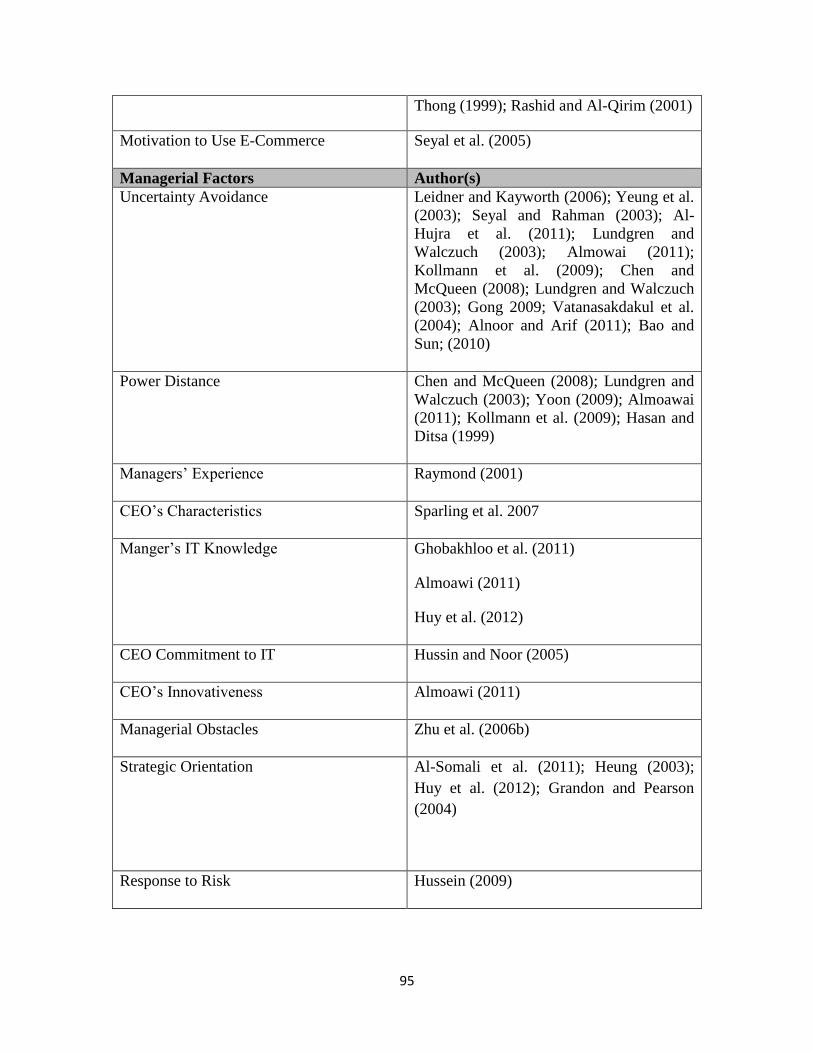
95
Thong (1999); Rashid and Al-Qirim (2001)
Motivation to Use E-Commerce Seyal et al. (2005)
Managerial Factors Author(s)
Uncertainty Avoidance Leidner and Kayworth (2006); Yeung et al.
(2003); Seyal and Rahman (2003); Al-
Hujra et al. (2011); Lundgren and
Walczuch (2003); Almowai (2011);
Kollmann et al. (2009); Chen and
McQueen (2008); Lundgren and Walczuch
(2003); Gong 2009; Vatanasakdakul et al.
(2004); Alnoor and Arif (2011); Bao and
Sun; (2010)
Power Distance Chen and McQueen (2008); Lundgren and
Walczuch (2003); Yoon (2009); Almoawai
(2011); Kollmann et al. (2009); Hasan and
Ditsa (1999)
Managers’ Experience Raymond (2001)
CEO’s Characteristics Sparling et al. 2007
Manger’s IT Knowledge Ghobakhloo et al. (2011)
Almoawi (2011)
Huy et al. (2012)
CEO Commitment to IT Hussin and Noor (2005)
CEO’s Innovativeness Almoawi (2011)
Managerial Obstacles Zhu et al. (2006b)
Strategic Orientation Al-Somali et al. (2011); Heung (2003);
Huy et al. (2012); Grandon and Pearson
(2004)
Response to Risk Hussein (2009)
96
Table 3.4: Summary of Managerial Factors Identified in the Reviewed Literature
3.5.4 Environmental Factors
The literature shows that environmental factors play an important role in SMEs’ adoption
of technology. Environmental factors relate to the atmosphere surrounding the
organization, supporting or inhibiting its decision to adopt technology. The factors
identified in the reviewed literature include competitive pressure, partner or business
pressure, customer pressure, government regulation, information intensity, competition
intensity, external pressure, IS vendor support and pressure, regularly environment,
national readiness, environmental uncertainty, government support, government policy,
legal regulation, market scale, IT infrastructure, power of consumer and market scope.
Scupola (2009) argued that the most important environmental factor affecting e-
commerce adoption by SMEs is customer pressure. Many studies found this factor to be
significant in adopting e-commerce by SMEs. (Scupola, 2009; Molla and Licker, 2005b;
Ifinedo, 2011; Al-Qirim, 2006). According to Plana et al. (2004), more than 30% of
medium size enterprises in Chile that have adopted the Internet were driven by their
suppliers’ pressure.. Other factors influencing decision makers to adopt technology in
their SMEs include the role of government such as government support, policy,
regulations, government policy, and legal aspects. These factors have similar concepts in
explaining technology adoption.
The role of market was also found to be a significant predictor of technology adoption by
SMEs. The reviewed literature shows that this role includes market scope and significant
changes in the market. Zhu et al. (2003, p.254) define market scope as “the horizontal
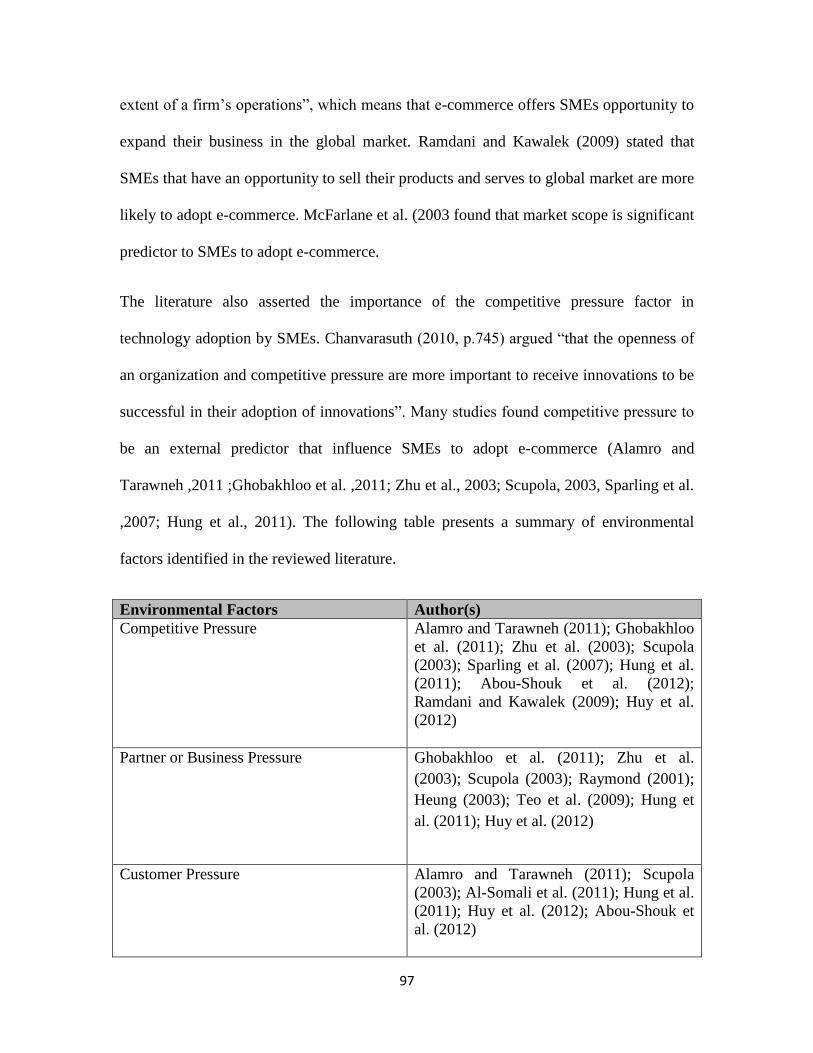
97
extent of a firm’s operations”, which means that e-commerce offers SMEs opportunity to
expand their business in the global market. Ramdani and Kawalek (2009) stated that
SMEs that have an opportunity to sell their products and serves to global market are more
likely to adopt e-commerce. McFarlane et al. (2003 found that market scope is significant
predictor to SMEs to adopt e-commerce.
The literature also asserted the importance of the competitive pressure factor in
technology adoption by SMEs. Chanvarasuth (2010, p.745) argued “that the openness of
an organization and competitive pressure are more important to receive innovations to be
successful in their adoption of innovations”. Many studies found competitive pressure to
be an external predictor that influence SMEs to adopt e-commerce (Alamro and
Tarawneh ,2011 ;Ghobakhloo et al. ,2011; Zhu et al., 2003; Scupola, 2003, Sparling et al.
,2007; Hung et al., 2011). The following table presents a summary of environmental
factors identified in the reviewed literature.
Environmental Factors Author(s)
Competitive Pressure Alamro and Tarawneh (2011); Ghobakhloo
et al. (2011); Zhu et al. (2003); Scupola
(2003); Sparling et al. (2007); Hung et al.
(2011); Abou-Shouk et al. (2012);
Ramdani and Kawalek (2009); Huy et al.
(2012)
Partner or Business Pressure Ghobakhloo et al. (2011); Zhu et al.
(2003); Scupola (2003); Raymond (2001);
Heung (2003); Teo et al. (2009); Hung et
al. (2011); Huy et al. (2012)
Customer Pressure Alamro and Tarawneh (2011); Scupola
(2003); Al-Somali et al. (2011); Hung et al.
(2011); Huy et al. (2012); Abou-Shouk et
al. (2012)

98
Market Scope Alamro and Tarawneh (2011); Abou-
Shouk et al.(2012); Ramdani and Kawalek
(2009); Hussein (2009); Hung et al. (2011)
Environmental Factors Author(s)
IT Infrastructure Scupola (2009); Scupola (2003); Huy et al.
(2012); Kollmann et al. (2009)
Legal Regulation Hung et al. (2011); Hudhaif and
Alkubeyyer (2011)
Government Policy Hung et al. (2011); Huy et al. (2012)
Government Support Tan and Teo (2000); Hung et al. (2011);
Huy et al. (2012); Hunaiti et al. (2009);
Scupola (2009); Saprikis and
Vlachopoulou (2012); Hamid (2009);
Gibbs et al. (2003); Thatcher et al. (2006);
Seyal et al. 2004; Molla and Licker 2005;
Al-Weshah and Al-Zubi (2012)
National Readiness Al-Somali et al. (2011)
Environmental Uncertainty Raymond (2001)
IS Vendor Support and Pressure Ghobakhloo et al. (2011); Ramdani and
Kawalek (2009); Lin and Wu (2004);
Ifinedo (2011)
Information Intensity Almoawi (2011)
Competition Intensity Almoawi (2011); Zhu et al. (2006b)
External Pressure Ifinedo (2011); Kurnia et al. (2009)
Regularly Environment Zhu et al. (2006b); Al-Somali et al. (2011)
Table 3.5: Summary of Environmental Factors that Identified in the Reviewed Literature
3.6 Studies of Factors Affecting E-commerce Adoption in Travel agencies
Based on literature review, although many studies have been increasingly investigating e-
commerce adoption in SMEs, there still lack of studies about e-commerce adoption in
travel agencies in developed and developing countries, especially in Arab countries. As
discussed earlier, e-commerce adoption has become very important for travel agencies to
99
survive in the global travel market; however, travel agencies’ adoption of e-commerce
still lags behind that of other SMEs sectors.
This shortcoming encouraged several studies to address the importance of this adoption
and investigate the reasons of its slow progress. Buhalis and Jun (2011), for example,
found that there are four main barriers restricting e-commerce adoption: limited strategic
scope, insufficient ICTs expertise and understanding, low profit margin limiting
investments and emphasis on human interaction with consumers. He also confirmed that
travel agencies still have a limited access to the Internet due to high cost and insufficient
telecommunication infrastructure. Limited financial resources are also responsible for
many travel agencies’ adoption of simple e-commerce applications such as developing
basic websites presenting their travel products and offers without an online payment
facility, showing price comparisons or inviting customers to move to travel suppliers for
a direct purchase (Kaewkitipong, 2010).
Heung (2003) pointed out the barriers to adopt e-commerce in travel agencies in Hong
Kong, focusing on the threats these agencies may encounter without implementing e-
commerce and expecting that 20% of them will run out of business in the next three
years. He found that slow e-commerce adoption by travel agencies can be attributed to
concerns about the management support and partner participation. He also found that the
cost of e-commerce implementation and lack of well-trained staff are significant factors
of slow adoption.
Andreu et al. (2010) conducted a study to explore the effect of external pressure,
including that of customers and industry, on e-commerce adoption by travel agencies in

100
Spain. They examined these pressures on different levels of e-commerce adoption,
namely: e-communication and e-procurement, where the former is “the use of Internet
technologies by the travel agency to interact with its suppliers for communication
processes” (p.778) and the latter reflects more complex levels of e-commerce adoption
that include integration in the business process such as online reservation. They found
customers pressure to be a significant factor in adopting e-communication, while travel
suppliers pressure significantly affects adopting e-procurement. They also found that
travel agencies that have already adopted e-communication are more likely to adopt e-
procurement due to the great benefits obtained and low risks identified through that initial
e-communication adoption.
Abou-Shouk et al. (2012) investigated the facilitators that may influence the decision of
managers of travel agencies in Egypt to adopt an advanced level of e-commerce, finding
that marketing benefits, competitive benefits and business efficiency benefits have a
significant effect on such a decision.
Vrana et al. (2006) investigated the current state of e-commerce adoption in Greek travel
agencies and explored the decision makers’ attitudes toward advanced levels of e-
commerce applications, finding that the majority of agencies only use e-mail in their
business, followed those who use simple website to present their product information,
while a limited number have adopted a complete online business. They found that
security and lack of interpersonal communication were the main barriers of e-commerce
adoption.
101
Hussein (2009) investigated factors affecting e-commerce adoption by travel agencies in
Egypt, looking at non-adopters who do not have website, adopters with only a simple
website and sophisticated e-commerce adopters such as users of online inquires, online
booking and online payment. The findings revealed that perceived risk, marketing
capabilities and attitude toward risk are significant in differentiating between simple and
sophisticated e-commerce adoption, whereas relative advantage, complexity, employees
IT knowledge, marketing capabilities, top management support and attitude toward risk
are significant for those travel agencies considering an initial adoption decision. I
nvestigating the different determinants of e-commerce adoption by travel agencies in
Canada, Raymond (2001) who developed a comprehensive model based on TOE and
DOI to identify the factors that influence the levels of e-commerce adoption by travel
agencies, showed that partner support and environmental uncertainty are significant
predictors that influence owner/managers to adopt low and medium level of websites,
while the firm’s distribution, communication strategy, type of ownership, nature of
business, perceived advantages and technology attributes are significant for adopting an
advanced level of websites.
Moreover, studying the factors affecting travellers’ intention to use travel agencies
websites for buying their travel products, Luo and Remus (2006) found that perceived
usefulness had a significant effect on travellers’ behavioural intention to use travel
agencies online, whereas perceived ease of use had an indirect significant effect.
Therefore, improving travel agency’s website usability and access as well as the website
interface ease of use will influence customers to buy travel products through travel
agencies’ websites.
102
Based on the above discussions, it is clear the variation of variables, conceptualizing and
finding among researchers regarding to e-commerce adoption in SMEs. Also, the
reviewed literature showed that there have been many studies investigating and
predicting e-commerce adoption by SMEs in developing and developed countries.
However, there is still a need to further investigate and understand the factors affecting e-
commerce adoption by SMEs particularly travel agencies in developing countries,
including Arab countries like Jordan. Moreover, there still a need for a holistic views that
addresses the factors affecting different levels of e-commence adoption.
The results of prior studies in both developed and developing countries are therefore
important for the purpose of this study to develop a comprehensive conceptual
framework inclusive of the factors affecting e-commerce adoption in travel agencies in
Jordan. The following chapter presents the conceptual framework proposed by this study.
3.7 Maturity Models of E-commerce
Along with the internet revolution in the 1990s the term ‘e-commerce’ emerged and has
been rapidly and increasingly diffused among individuals and organizations. A number of
studies investigated different aspects of e-commerce adoption focusing on the individual
and organizational level. However, the factors affecting e-commerce adoption in
organizations are different from those affecting individuals’ adoption of e-commerce in
terms of the progression of e-commerce maturity (Ghachem, 2006). E-commerce
maturity model is defined as “stages from an initial state to maturity to help organizations
assess as-is situations, to guide improvement initiatives, and to control progress and the
sophistication of eCommerce use” (Alghamidi et al., 2014, p.40). Therefore, e-commerce
maturity model relates to sequential levels of e-commerce adoption.

103
SMEs are therefore different in terms of rating and assessment the maturity level of e-
commerce. According to Janom et al. (2014), SMEs must be aware of the current state of
e-commerce and aware of the right strategy they currently used in order to achieve their
goals. However, many challenges are facing SMEs that inhibit them to attain the right
level of e-commerce maturity. For example, risk and lack of knowledge significantly
differentiate non-adopters with no website presence from adopters with website activities.
The use of e-commerce maturity model is very important in order to have holistic
explanation of the factors that may affect different levels of e-commerce maturity.
According to Zandi (2013), the use of maturity e-commerce model allows SMEs to
evaluate and determine the level of e-commerce that they currently use and compare it
with the levels of maturity described in the model. Morias et al (2012), suggested using e-
commerce maturity models in SMEs in order to have a comprehensive explanation for
decision makers in planning, deciding and implementing the suitable level of e-commerce
that meets their SMEs Needs. This can be done by identifying the factors associated with
the level of e-commerce maturity model.
Several maturity models of e-commerce have been developed as to identify the sequential
levels of e-commerce in organizations such as those developed by Boisvert (2002),
Daniel et al. (2002), PricewaterhouseCoopers (1999), Rao et al. (2003), Lefebvrea et al.
(2005), and Molla and Licker (2004). Boisvert (2002) points out three levels of internet
adoption in organisations. In the first level, a basic website is built with one-way
communication presenting only information and the organisation’s promotional activities.

104
The second level relates to relational and transactional activities which allow
organisations to gain and analyse information from their partners, customers and
suppliers through their website. Moreover, it allows organisations to sell their products
and services online. The third level presents full online business where the internet is
fully integrated into the organisation’s processes.
Rayport and Jaworski (2002) proposed a four-stage model of e-commerce adoption in
organisations. The first stage is called broadcast, which enables the organisation to show
its information, products and services to customers through a static website. Interact is
the second stage, encompassing a dynamic website that allows interaction with customers
through e-mail, feedback and survey. The third stage is called transact that includes
online ordering and payment transactions. Then, the internet is used to provide inter-
organisational activities and online interaction with their trading partners, forming the
fourth stage which is called Collaborate.
Rao et al. (2003) also developed a similar e-commerce stage growth model, proposing
four stages. Presence is the first stage; it is the initial step where the organisation adopts
e-commerce. At this stage the company shows its information and advertisements and its
products on a static website with only one-way communication using e-mail. The second
stage is called portal that allows customers and suppliers to communicate with company’s
website to order products, giving online feedback, and inventory search without online
payment transaction. Transaction Integration is the third stage that is similar to the Portal
stage but with ability to support financial transactions. At this stage, customers can order
and pay online for products and services. Moreover, online auctions are also supported in
105
this stage. The fourth level includes a complete integration of business processes and
high-level collaboration between customers and suppliers with high-level online business
management integration, such as supply chain management, and CRM.
Moreover, Daniel et al. (2002) and PricewaterhouseCoopers (1999) proposed a similar
model consisting of four levels of e-commerce adoption in SMEs, where the first level
presents basic internet tools using only e-mail to communicate with customers and
suppliers with no website development. The second level presents information on
company’s products and services through a basic website with no advanced capabilities.
The third level is similar to the second level but the company has more advanced
capabilities, such as online orders, the provision of customer services and online
communications with suppliers through its website. In the final level, the company has
full online business integration, such as managing its inventory, receiving online
payments and providing post-sale services.
Lefebvrea et al. (2005) proposed six stages of e-commerce progression in SMEs to
differentiate non-adopters from adopters. The first two stages are specific to non-
adopters, where stage 00 refers to firms that have no interest in adopting any e-commerce
activities in their business, whereas stage 0 refers to firms that have not yet adopted any
of e-commerce activities but have the intention to do so within the next twelve months.
E-commerce adoption is classified in four stages. The first stage is called electronic
information search and content creation where adopters use basic e-commerce activities
and advertise the company’s products and services using a digital format. Electronic
transactions are the second stage, where the company can buy and sell products and

106
services using electronic catalogues. The third stage is more complex and includes online
auctions, as suppliers and customers are able to negotiate contracts online with company
such as volumes and prices and the company can accept electronic payments from its
customers. Stage four which is called electronic collaboration includes full e-commerce
business activities, such as software integration into management information systems
and supports e-collaboration with customers and suppliers.
Molla and licker (2004), proposed six different levels to access e-commerce maturity by
SMEs in developing countries. Stage 1 refers to SMEs that have not yet connected with
the internet, with no e-mail. In stage 2, SMEs are connected with the Internet with only e-
mail for business communications and activities. In stage 3, SMEs that have simple
website that presents their information online with one-way communication. In stage 4,
SMEs have dynamic website enabling them to provide more detailed information about
their products and services by having online catalogue. At this stage, potential customers
and suppliers can use the online catalogue to make offers and make online inquiries, but
with no online payment facility. In stage 5, SMEs are able to sell their products and
services to potential customers and suppliers through their own website, but the orders
are handled manually. In stage 6, SMEs have an advanced website including internal and
external business activates and other back office system such as CRM, ERP, and
accounting system. Table 3.6 below shows summary of the e-commerce maturity models.
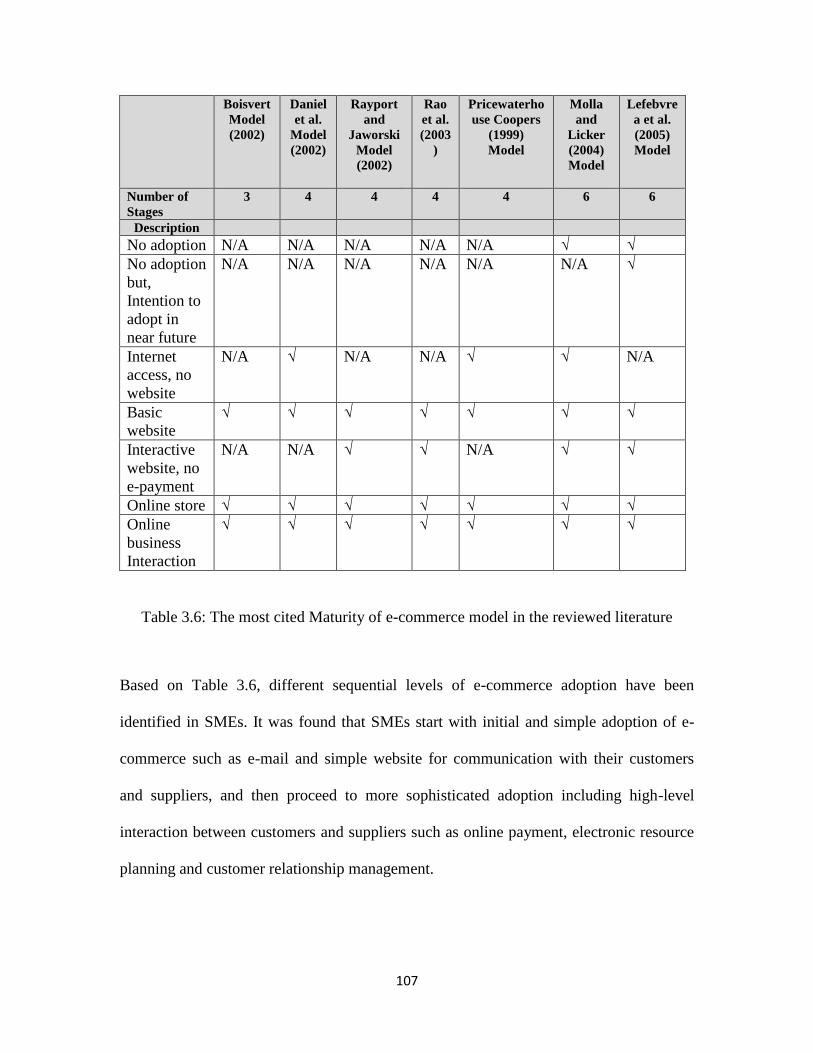
107
Boisvert
Model
(2002)
Daniel
et al.
Model
(2002)
Rayport
and
Jaworski
Model
(2002)
Rao
et al.
(2003
)
Pricewaterho
use Coopers
(1999)
Model
Molla
and
Licker
(2004)
Model
Lefebvre
a et al.
(2005)
Model
Number of
Stages
3 4 4 4 4 6 6
Description
No adoption N/A N/A N/A N/A N/A √ √
No adoption
but,
Intention to
adopt in
near future
N/A N/A N/A N/A N/A N/A √
Internet
access, no
website
N/A √ N/A N/A √ √ N/A
Basic
website
√ √ √ √ √ √ √
Interactive
website, no
e-payment
N/A N/A √ √ N/A √ √
Online store √ √ √ √ √ √ √
Online
business
Interaction
√ √ √ √ √ √ √
Table 3.6: The most cited Maturity of e-commerce model in the reviewed literature
Based on Table 3.6, different sequential levels of e-commerce adoption have been
identified in SMEs. It was found that SMEs start with initial and simple adoption of e-
commerce such as e-mail and simple website for communication with their customers
and suppliers, and then proceed to more sophisticated adoption including high-level
interaction between customers and suppliers such as online payment, electronic resource
planning and customer relationship management.

108
Also, it shows that the main objective of maturity is helping organizations to identify the
current state of e-commerce adoption, the level of e-commerce they want, and which
factors are needed to overcome in order to reach a mature e-commerce status.
Also, Table 3.6 shows numerous e-commerce maturity models developed to describe
different levels of e-commerce adoption by SMEs. However, describing these levels was
inconsistent among these models. For example, Danial et al.’s (2002) model described
four stages of e-commerce beginning from internet access then moving to basic website,
online store and full online business activities. This model overlooked non-adopters with
no internet connection, and medium level of e-commerce adoption including two-way
communication, while Lefebvrea et al.’s (2005) model proposed six levels of e-
commerce adoption, beginning in describing two levels of e-commerce non-adopters,
followed by basic website, interactive website, online store and online business
interaction. However, Lefebvrea et al.’s (2005) model did not explain basic e-commerce
adopter who has internet access with only e-mail for business communications.
According to Kurnia et al (2009), the different conceptualizing of e-commerce adoption
among studies leads to inconsistent results and conclusion among them regarding the
factors affecting different stages of e-commerce. For example, many studies only focused
on the factors affecting e-commerce in SMEs as adopters and non-adopters (Teo and Tan,
1998; Teo and Ranganathan, 2004; Ramsey and McCole, 2005; Tan et al., 2007; Andreu
et al., 2010), while others examined the factors affecting different levels of e-commerce
adoption within SMEs (Chen and McQueen, 2008; Senarathna and Wickramasuriya,
2011; Raymond, 2001). However, the e-commerce maturity levels were described
109
inconsistently in these studies. For example, Raymond (2001) used e-commerce maturity
models consisting of three levels: informational, transactional and strategic; while Chen
and McQueen (2008) identified four levels: messaging, online marketing, online ordering
and online transactions.
Based on above discussion, it can be clearly concluded that e-commerce adoption is
considered a multi-level phenomenon rather than the dichotomy of adopter vs. non-
adopter. Also, the reviewed literature shows that the determinants of e-commerce
adoption can be different based on the level of adoption being considered. Therefore it is
very important to consider sequential levels of e-commerce when conducting study of e-
commerce adoption by SMEs.
3.8 Limitations and Gap in literature
As clearly presented in Tables 3.3, 3.4, 3.5 and 3.7, a large number of potential factors
has been identified in order to explain e-commerce and technology adoption by SMEs in
both developed and developing countries. Most of these studies belong to three groups of
factors of e-commerce adoption by SMEs, namely: technological factors, organizational
and environmental factors. It was found from reviewed literature that few prior studies
(see Table 3.7) have identified managerial factors in depth in one grouping context, while
most prior studies identified managerial factors within the organizational context as one
or two factors which may not present comprehensive explanation of technology adoption
by SMEs where managers are considered the most critical decision makers in adopting
technology.

110
Also, the reviewed literature shows that Hofstede’s Cultural Dimensions has a vital role
in explaining technology adoption. Yet, there is a general lack of studies on cultural
factors of ICTs and e-commerce adoption as a limited number of studies focused on the
effects of these factors on the levels of e-commerce adoption. Moreover, the reviewed
literature showed that a variety of models and theories were applied to study e-commerce
and technology adoption by SMEs. It is worth mentioning that none of these models and
theories has provided compatible explanation of e-commerce and technology adoption by
SMEs. Thus, it is necessary to develop a comprehensive framework in order to have a
best explanation of e-commerce adoption by SMEs.
Also, the findings of these studies are inconsistent and confusing because due to the
following reasons. First, most prior studies of e-commerce adoption focused on
dichotomous variables presenting adoption versus non-adoption, while limited studies
focused on factors affecting different levels of e-commerce adoption which explainations
for SMEs maturity level for SMEs.
Second, the terminology of defining the independent variables of these studies is
inconsistent. Third, wide range of independent variables has been suggested and
identified by prior studies, but there is no clear evidence in explaining the reason of
choosing certain variables rather than others.
Therefore, determining the important factors and consolidating the factors that have
similar definition to avoid overlapping and considering e-commerce adoption as multi-
levels to explain e-commerce adoption is still controversial among relevant literature on
111
e-commerce and technology adoption which is necessary to address in order to have a
comprehensive view of e-commerce adoption by SMEs.
Finally, most prior studies in technology and e-commerce adoption by SMEs have been
conducted in developed countries, while limited studies in developing countries were
undertaken to date, and even fewer in Arab countries such as Jordan. Travel agencies as
an example of SMEs are considered the most critically-threatened type of SME facing
changes in the travel market structure caused by e-commerce adoption. Therefore,
investigating e-commerce adoption by travel agencies in developing countries such as
Jordan is regarded an emerging area of study and needs to be addressed in the literature
of e-commerce context.
Therefore, the current study addresses these limitations and fill the gap by developing a
comprehensive framework that includes that most significant potential factors that may
influence decision makers on different levels of e-commerce adoption in order to improve
the understanding of e-commerce adoption and maturity of Jordanian travel agencies as
an example of developing countries. The following chapter presents the conceptual
framework proposed by this study.
3.9 Conclusion
This chapter reviewed the background, strengths and weaknesses of most dominant
theories and models in technology adoption. It also explored the most common e-
commerce maturity levels, starting with simple e-commerce adoption moving to more
advanced levels. Finally, the chapter addressed the factors identified by prior studies

112
through applying the different theories and models relevant to technology adoption. It
concluded by addressing the knowledge gaps that emerged in the reviewed literature as a
first step to develop the initial conceptual framework that will be presented in the next
chapter.
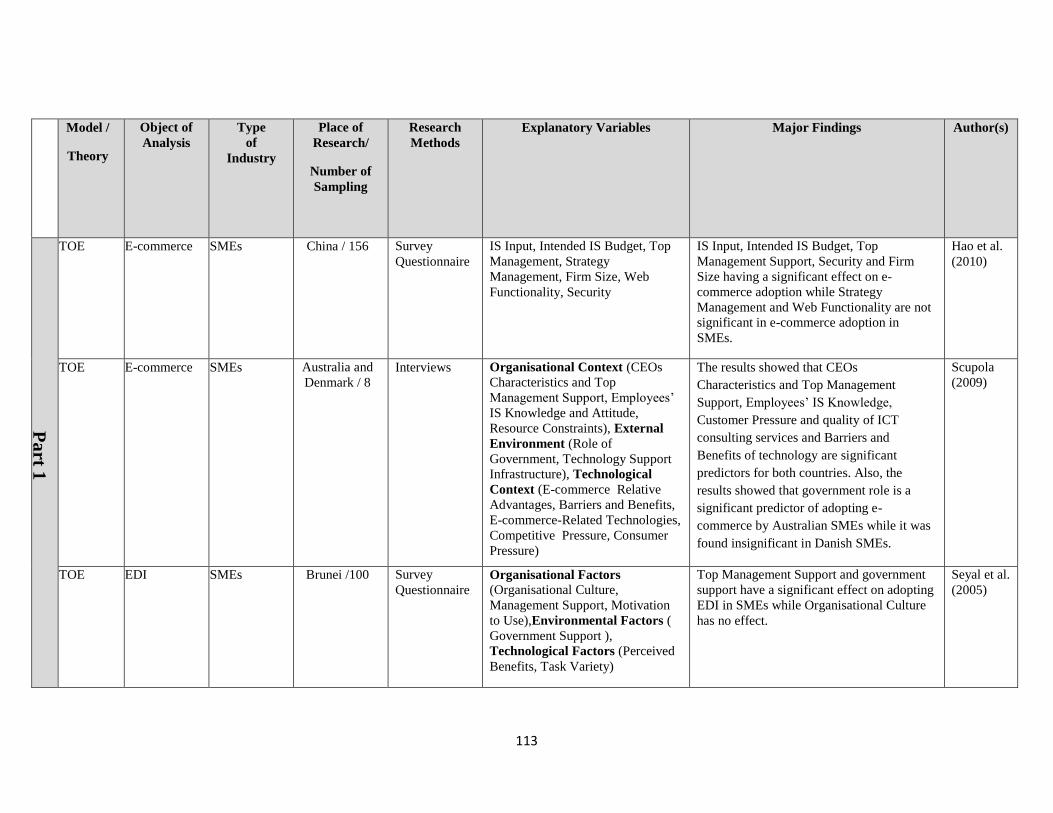
113
Model /
Theory
Object of
Analysis
Type
of
Industry
Place of
Research/
Number of
Sampling
Research
Methods
Explanatory Variables Major Findings Author(s)
Pa
rt 1
TOE E-commerce SMEs China / 156 Survey
Questionnaire
IS Input, Intended IS Budget, Top
Management, Strategy
Management, Firm Size, Web
Functionality, Security
IS Input, Intended IS Budget, Top
Management Support, Security and Firm
Size having a significant effect on e-
commerce adoption while Strategy
Management and Web Functionality are not
significant in e-commerce adoption in
SMEs.
Hao et al.
(2010)
TOE E-commerce SMEs Australia and
Denmark / 8
Interviews Organisational Context (CEOs
Characteristics and Top
Management Support, Employees’
IS Knowledge and Attitude,
Resource Constraints), External
Environment (Role of
Government, Technology Support
Infrastructure), Technological
Context (E-commerce Relative
Advantages, Barriers and Benefits,
E-commerce-Related Technologies,
Competitive Pressure, Consumer
Pressure)
The results showed that CEOs
Characteristics and Top Management
Support, Employees’ IS Knowledge,
Customer Pressure and quality of ICT
consulting services and Barriers and
Benefits of technology are significant
predictors for both countries. Also, the
results showed that government role is a
significant predictor of adopting e-
commerce by Australian SMEs while it was
found insignificant in Danish SMEs.
Scupola
(2009)
TOE EDI SMEs Brunei /100 Survey
Questionnaire
Organisational Factors (Organisational Culture,
Management Support, Motivation
to Use),Environmental Factors (
Government Support ),
Technological Factors (Perceived
Benefits, Task Variety)
Top Management Support and government
support have a significant effect on adopting
EDI in SMEs while Organisational Culture
has no effect.
Seyal et al.
(2005)

114
Model /
Theory
Object of
Analysis
Type
of
Industry
Place of
Research/
Number of
Sampling
Research
Methods
Explanatory Variables Major Findings Author(s)
Pa
rt 1
TOE E-commerce SMEs Jordan /41 Interviews Organisational Context (Financial
Resources, Top Management
Support, Rapid Political Change,
Changing nature of workforce, Increased importance of ethical and
legal issues ,Increased social
responsibility of organisations), Technological context(E-
commerce Benefits, E-commerce
Barriers, Increase innovations and
new technologies , Rapid decline in
technology cost vs. performance
ratio ), External Environment
(Strong Competition, Increased
Power of Consumer, Significant
Change in markets , Global
economy , Regional trade
agreements)
Client Pressure, Availability of ICT, CEOs
and Employees’ Knowledge are significant
factors in adopting e-commence, while
Government Support has no significant
effect.
Alamro
and
Tarawneh
(2011)
TOE E-commerce Firms Iran/1237 Survey
Questionnaire
Technological context (Perceived
Relative Advantages, Perceived
Compatibility, Cost),
Organisational Context (Information Intensity, CEO’s
Knowledge, CEO’s Innovativeness,
Business Size), Environmental
context (Competition,
Buyer/Supplier Pressure, Support
from Technology Vendors)
Perceived Relative Advantages, Perceived
Compatibility, CEO’s Innovativeness,
Competition, Buyer/Supplier Pressure and
Support from Technology Vendors are
significant factors that affect adopting e-
commerce in SMEs, while other factors
were found insignificant.
Ghobakhl
oo et al.
(2011)
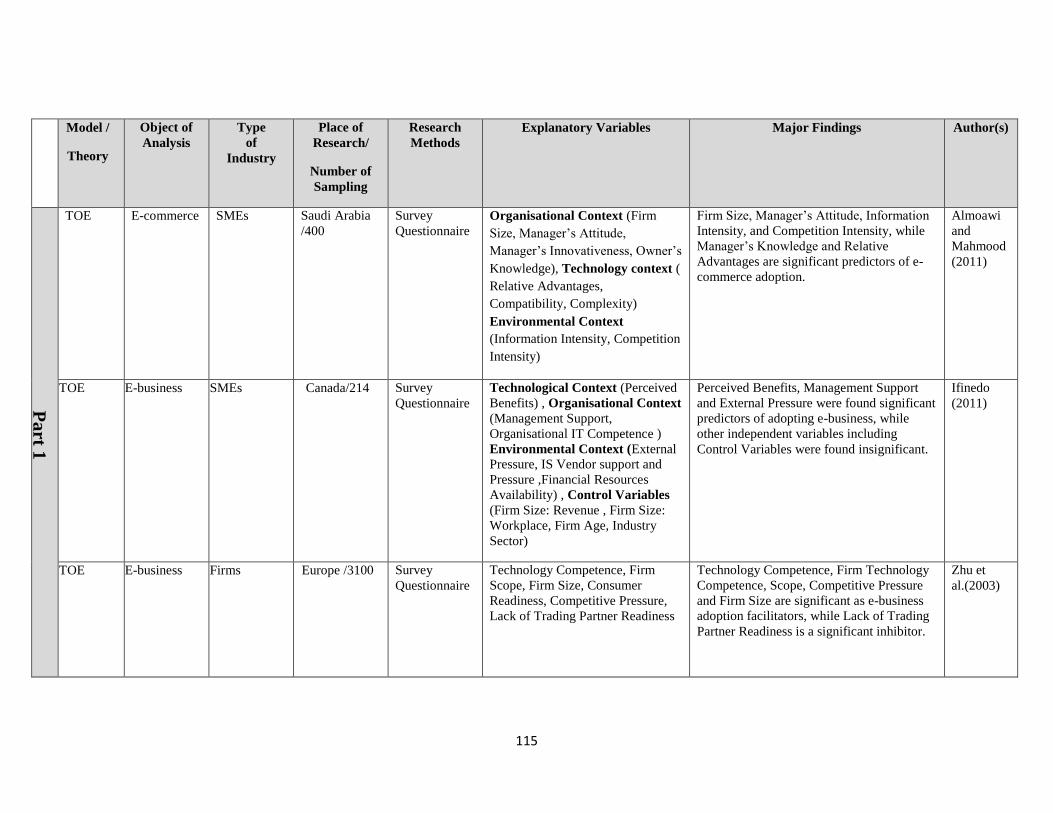
115
Model /
Theory
Object of
Analysis
Type
of
Industry
Place of
Research/
Number of
Sampling
Research
Methods
Explanatory Variables Major Findings Author(s)
Pa
rt 1
TOE E-commerce SMEs Saudi Arabia
/400
Survey
Questionnaire
Organisational Context (Firm
Size, Manager’s Attitude,
Manager’s Innovativeness, Owner’s
Knowledge), Technology context (
Relative Advantages,
Compatibility, Complexity)
Environmental Context
(Information Intensity, Competition
Intensity)
Firm Size, Manager’s Attitude, Information
Intensity, and Competition Intensity, while
Manager’s Knowledge and Relative
Advantages are significant predictors of e-
commerce adoption.
Almoawi
and
Mahmood
(2011)
TOE E-business SMEs Canada/214 Survey
Questionnaire
Technological Context (Perceived
Benefits) , Organisational Context
(Management Support,
Organisational IT Competence )
Environmental Context (External
Pressure, IS Vendor support and
Pressure ,Financial Resources
Availability) , Control Variables
(Firm Size: Revenue , Firm Size:
Workplace, Firm Age, Industry
Sector)
Perceived Benefits, Management Support
and External Pressure were found significant
predictors of adopting e-business, while
other independent variables including
Control Variables were found insignificant.
Ifinedo
(2011)
TOE E-business
Firms Europe /3100 Survey
Questionnaire
Technology Competence, Firm
Scope, Firm Size, Consumer
Readiness, Competitive Pressure,
Lack of Trading Partner Readiness
Technology Competence, Firm Technology
Competence, Scope, Competitive Pressure
and Firm Size are significant as e-business
adoption facilitators, while Lack of Trading
Partner Readiness is a significant inhibitor.
Zhu et
al.(2003)

116
Model /
Theory
Object of
Analysis
Type
of
Industry
Place of
Research/
Number of
Sampling
Research
Methods
Explanatory Variables Major Findings Author(s)
Pa
rt 1
TOE E-business Firms Brazil, China,
Denmark,
France,
Germany,
Japan,
Mexico,
Singapore,
Taiwan,
United States)
/1857
Survey
questionnaire
Technological Context
(Technology Readiness,
Technology Integration),
Organisational Context (Firm
size, Global Scope, Managerial
Obstacles), Environmental
Context (Competition Intensity,
Regulatory Environment)
Technology Readiness was the most
significant factor of adopting e-business in
developing countries but less significant in
developed countries. However, the
Technology Integration factor affected e-
business adoption in developed country
more than developing countries. Firm Size
has a negative effect on the e-business
routinization stage. Competition has a
positive effect on adopting e-business in the
initiation and adoption stages but a negative
effect in the routinization stage. The
environmental context affects e-business
adoption in developing countries more than
developed ones.
Zhu et al.
(2006b)
TOE E-
procurement
SMEs Singapore/ 147 Survey Technological Factors (Perceived
Direct Benefits, Perceived Indirect
Benefits, Perceived
Costs),Organisational Factors (
Firm Size, Top Management
Support, Information Sharing
Culture), Environmental Factor(
Business Partner Influence)
Firm Size, Top Management Support,
Perceived Indirect Benefits and Business
Partner Influence are significant predictors
in differentiating between adopters and non-
adopter of e-procurement.
Teo et al.
2009
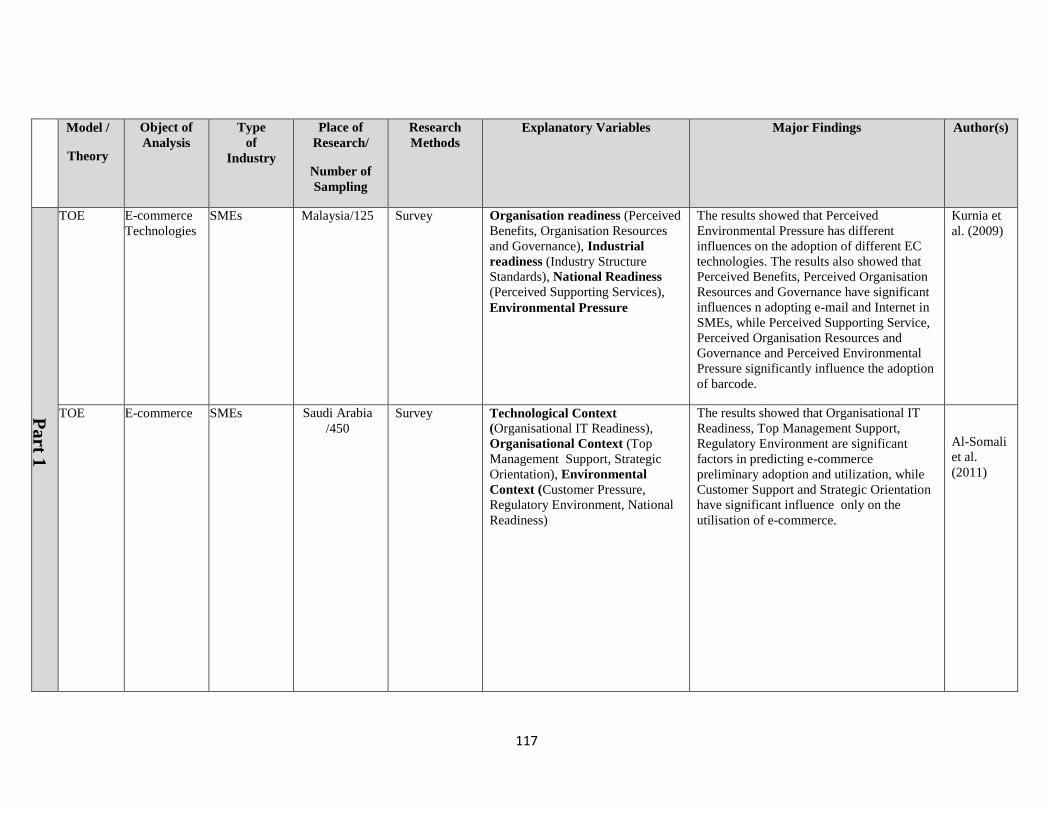
117
Model /
Theory
Object of
Analysis
Type
of
Industry
Place of
Research/
Number of
Sampling
Research
Methods
Explanatory Variables Major Findings Author(s)
Pa
rt 1
TOE E-commerce
Technologies
SMEs Malaysia/125 Survey Organisation readiness (Perceived
Benefits, Organisation Resources
and Governance), Industrial
readiness (Industry Structure
Standards), National Readiness
(Perceived Supporting Services),
Environmental Pressure
The results showed that Perceived
Environmental Pressure has different
influences on the adoption of different EC
technologies. The results also showed that
Perceived Benefits, Perceived Organisation
Resources and Governance have significant
influences n adopting e-mail and Internet in
SMEs, while Perceived Supporting Service,
Perceived Organisation Resources and
Governance and Perceived Environmental
Pressure significantly influence the adoption
of barcode.
Kurnia et
al. (2009)
TOE
E-commerce SMEs Saudi Arabia
/450
Survey Technological Context
(Organisational IT Readiness),
Organisational Context (Top
Management Support, Strategic
Orientation), Environmental
Context (Customer Pressure,
Regulatory Environment, National
Readiness)
The results showed that Organisational IT
Readiness, Top Management Support,
Regulatory Environment are significant
factors in predicting e-commerce
preliminary adoption and utilization, while
Customer Support and Strategic Orientation
have significant influence only on the
utilisation of e-commerce.
Al-Somali
et al.
(2011)
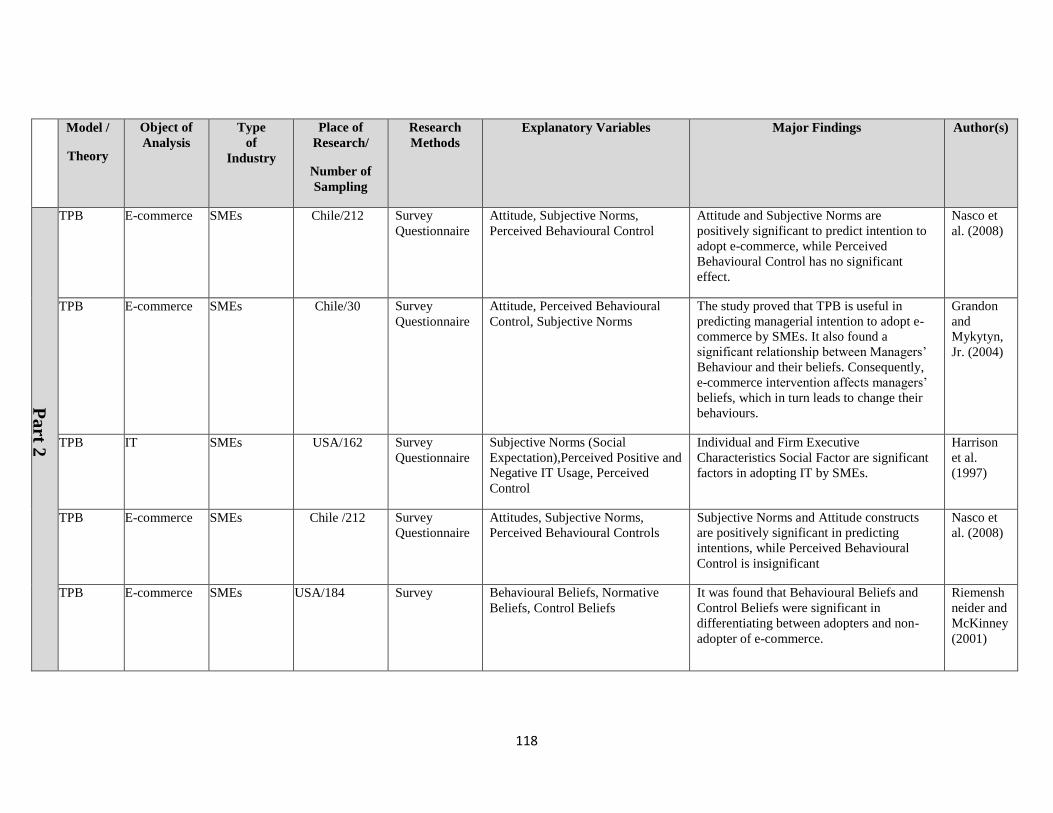
118
Model /
Theory
Object of
Analysis
Type
of
Industry
Place of
Research/
Number of
Sampling
Research
Methods
Explanatory Variables Major Findings Author(s)
Pa
rt 2
TPB E-commerce SMEs Chile/212 Survey
Questionnaire
Attitude, Subjective Norms,
Perceived Behavioural Control
Attitude and Subjective Norms are
positively significant to predict intention to
adopt e-commerce, while Perceived
Behavioural Control has no significant
effect.
Nasco et
al. (2008)
TPB E-commerce SMEs Chile/30 Survey
Questionnaire
Attitude, Perceived Behavioural
Control, Subjective Norms
The study proved that TPB is useful in
predicting managerial intention to adopt e-
commerce by SMEs. It also found a
significant relationship between Managers’
Behaviour and their beliefs. Consequently,
e-commerce intervention affects managers’
beliefs, which in turn leads to change their
behaviours.
Grandon
and
Mykytyn,
Jr. (2004)
TPB IT SMEs USA/162 Survey
Questionnaire
Subjective Norms (Social
Expectation),Perceived Positive and
Negative IT Usage, Perceived
Control
Individual and Firm Executive
Characteristics Social Factor are significant
factors in adopting IT by SMEs.
Harrison
et al.
(1997)
TPB E-commerce SMEs Chile /212 Survey
Questionnaire
Attitudes, Subjective Norms,
Perceived Behavioural Controls
Subjective Norms and Attitude constructs
are positively significant in predicting
intentions, while Perceived Behavioural
Control is insignificant
Nasco et
al. (2008)
TPB E-commerce
SMEs USA/184 Survey Behavioural Beliefs, Normative
Beliefs, Control Beliefs
It was found that Behavioural Beliefs and
Control Beliefs were significant in
differentiating between adopters and non-
adopter of e-commerce.
Riemensh
neider and
McKinney
(2001)
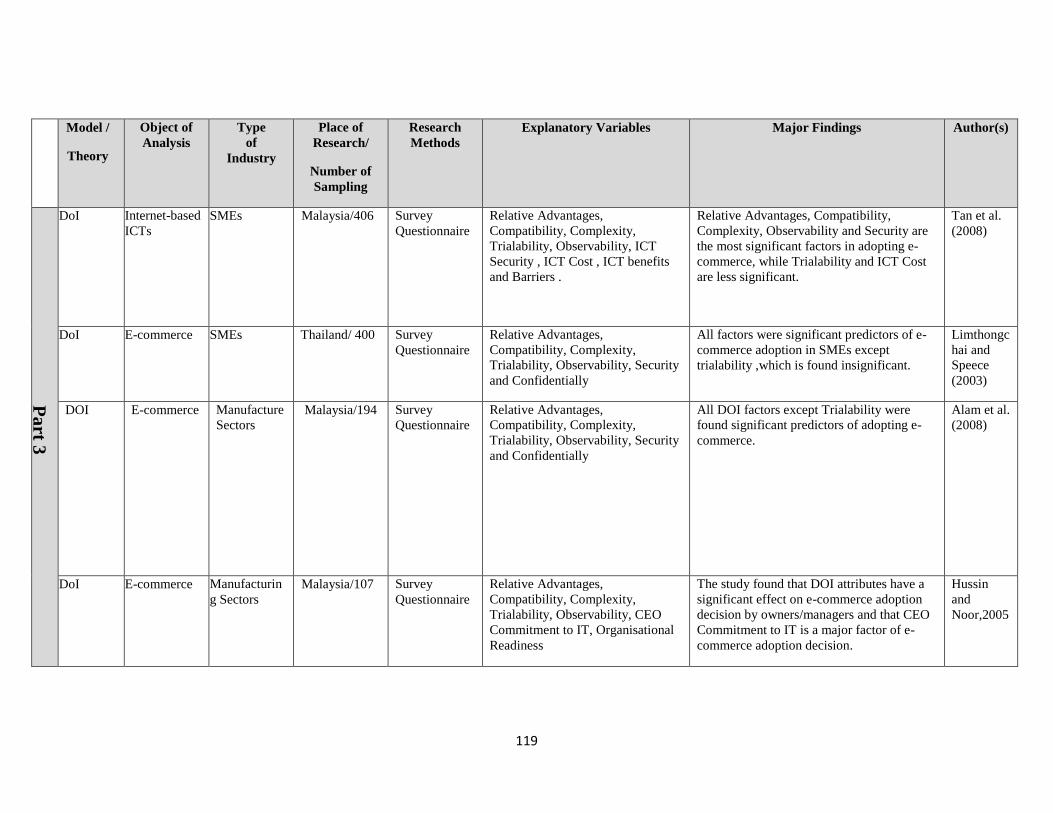
119
Model /
Theory
Object of
Analysis
Type
of
Industry
Place of
Research/
Number of
Sampling
Research
Methods
Explanatory Variables Major Findings Author(s)
Pa
rt 3
DoI Internet-based
ICTs
SMEs Malaysia/406 Survey
Questionnaire
Relative Advantages,
Compatibility, Complexity,
Trialability, Observability, ICT
Security , ICT Cost , ICT benefits
and Barriers .
Relative Advantages, Compatibility,
Complexity, Observability and Security are
the most significant factors in adopting e-
commerce, while Trialability and ICT Cost
are less significant.
Tan et al.
(2008)
DoI E-commerce SMEs Thailand/ 400 Survey
Questionnaire
Relative Advantages,
Compatibility, Complexity,
Trialability, Observability, Security
and Confidentially
All factors were significant predictors of e-
commerce adoption in SMEs except
trialability ,which is found insignificant.
Limthongc
hai and
Speece
(2003)
DOI E-commerce Manufacture
Sectors
Malaysia/194 Survey
Questionnaire
Relative Advantages,
Compatibility, Complexity,
Trialability, Observability, Security
and Confidentially
All DOI factors except Trialability were
found significant predictors of adopting e-
commerce.
Alam et al.
(2008)
DoI E-commerce Manufacturin
g Sectors
Malaysia/107 Survey
Questionnaire
Relative Advantages,
Compatibility, Complexity,
Trialability, Observability, CEO
Commitment to IT, Organisational
Readiness
The study found that DOI attributes have a
significant effect on e-commerce adoption
decision by owners/managers and that CEO
Commitment to IT is a major factor of e-
commerce adoption decision.
Hussin
and
Noor,2005
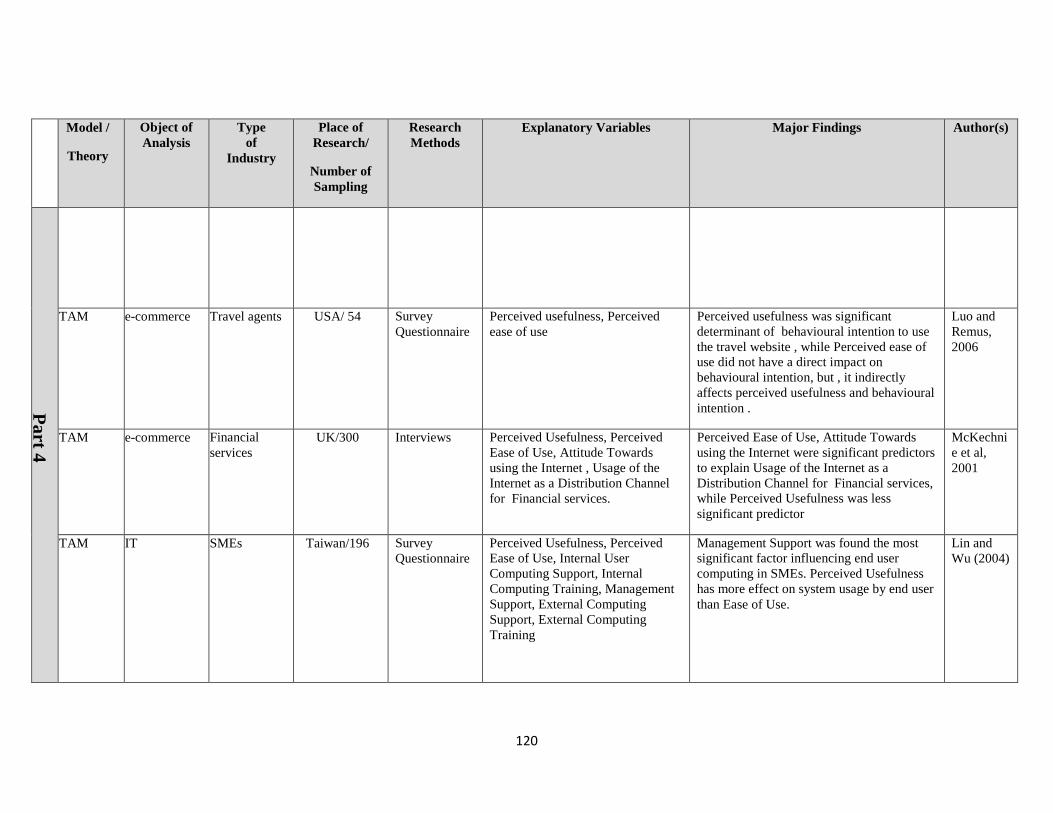
120
Model /
Theory
Object of
Analysis
Type
of
Industry
Place of
Research/
Number of
Sampling
Research
Methods
Explanatory Variables Major Findings Author(s)
Pa
rt 4
TAM e-commerce Travel agents USA/ 54 Survey
Questionnaire
Perceived usefulness, Perceived
ease of use
Perceived usefulness was significant
determinant of behavioural intention to use
the travel website , while Perceived ease of
use did not have a direct impact on
behavioural intention, but , it indirectly
affects perceived usefulness and behavioural
intention .
Luo and
Remus,
2006
TAM e-commerce Financial
services
UK/300 Interviews Perceived Usefulness, Perceived
Ease of Use, Attitude Towards
using the Internet , Usage of the
Internet as a Distribution Channel
for Financial services.
Perceived Ease of Use, Attitude Towards
using the Internet were significant predictors
to explain Usage of the Internet as a
Distribution Channel for Financial services,
while Perceived Usefulness was less
significant predictor
McKechni
e et al,
2001
TAM IT SMEs Taiwan/196 Survey
Questionnaire
Perceived Usefulness, Perceived
Ease of Use, Internal User
Computing Support, Internal
Computing Training, Management
Support, External Computing
Support, External Computing
Training
Management Support was found the most
significant factor influencing end user
computing in SMEs. Perceived Usefulness
has more effect on system usage by end user
than Ease of Use.
Lin and
Wu (2004)
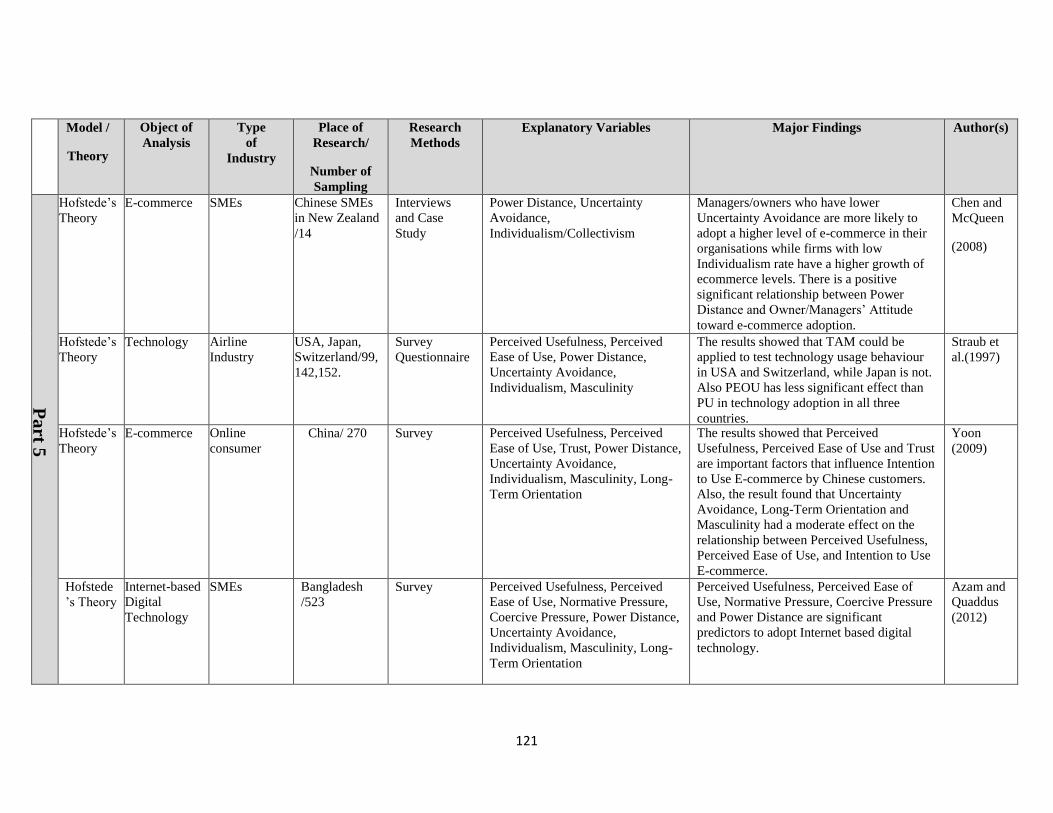
121
Model /
Theory
Object of
Analysis
Type
of
Industry
Place of
Research/
Number of
Sampling
Research
Methods
Explanatory Variables Major Findings Author(s)
Pa
rt 5
Hofstede’s
Theory
E-commerce SMEs Chinese SMEs
in New Zealand
/14
Interviews
and Case
Study
Power Distance, Uncertainty
Avoidance,
Individualism/Collectivism
Managers/owners who have lower
Uncertainty Avoidance are more likely to
adopt a higher level of e-commerce in their
organisations while firms with low
Individualism rate have a higher growth of
ecommerce levels. There is a positive
significant relationship between Power
Distance and Owner/Managers’ Attitude
toward e-commerce adoption.
Chen and
McQueen
(2008)
Hofstede’s
Theory
Technology Airline
Industry
USA, Japan,
Switzerland/99,
142,152.
Survey
Questionnaire
Perceived Usefulness, Perceived
Ease of Use, Power Distance,
Uncertainty Avoidance,
Individualism, Masculinity
The results showed that TAM could be
applied to test technology usage behaviour
in USA and Switzerland, while Japan is not.
Also PEOU has less significant effect than
PU in technology adoption in all three
countries.
Straub et
al.(1997)
Hofstede’s
Theory
E-commerce Online
consumer
China/ 270 Survey Perceived Usefulness, Perceived
Ease of Use, Trust, Power Distance,
Uncertainty Avoidance,
Individualism, Masculinity, Long-
Term Orientation
The results showed that Perceived
Usefulness, Perceived Ease of Use and Trust
are important factors that influence Intention
to Use E-commerce by Chinese customers.
Also, the result found that Uncertainty
Avoidance, Long-Term Orientation and
Masculinity had a moderate effect on the
relationship between Perceived Usefulness,
Perceived Ease of Use, and Intention to Use
E-commerce.
Yoon
(2009)
Hofstede
’s Theory
Internet-based
Digital
Technology
SMEs Bangladesh
/523
Survey Perceived Usefulness, Perceived
Ease of Use, Normative Pressure,
Coercive Pressure, Power Distance,
Uncertainty Avoidance,
Individualism, Masculinity, Long-
Term Orientation
Perceived Usefulness, Perceived Ease of
Use, Normative Pressure, Coercive Pressure
and Power Distance are significant
predictors to adopt Internet based digital
technology.
Azam and
Quaddus
(2012)
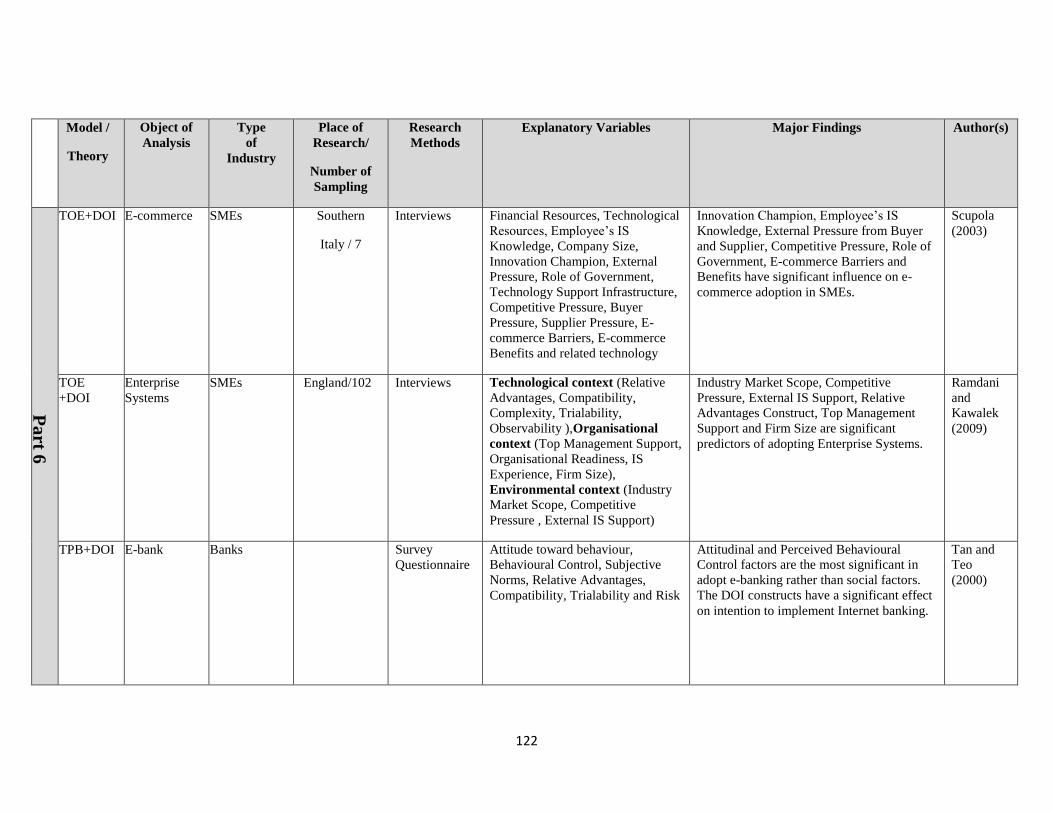
122
Model /
Theory
Object of
Analysis
Type
of
Industry
Place of
Research/
Number of
Sampling
Research
Methods
Explanatory Variables Major Findings Author(s)
Pa
rt 6
TOE+DOI E-commerce SMEs Southern
Italy / 7
Interviews Financial Resources, Technological
Resources, Employee’s IS
Knowledge, Company Size,
Innovation Champion, External
Pressure, Role of Government,
Technology Support Infrastructure,
Competitive Pressure, Buyer
Pressure, Supplier Pressure, E-
commerce Barriers, E-commerce
Benefits and related technology
Innovation Champion, Employee’s IS
Knowledge, External Pressure from Buyer
and Supplier, Competitive Pressure, Role of
Government, E-commerce Barriers and
Benefits have significant influence on e-
commerce adoption in SMEs.
Scupola
(2003)
TOE
+DOI
Enterprise
Systems
SMEs England/102 Interviews Technological context (Relative
Advantages, Compatibility,
Complexity, Trialability,
Observability ),Organisational
context (Top Management Support,
Organisational Readiness, IS
Experience, Firm Size),
Environmental context (Industry
Market Scope, Competitive
Pressure , External IS Support)
Industry Market Scope, Competitive
Pressure, External IS Support, Relative
Advantages Construct, Top Management
Support and Firm Size are significant
predictors of adopting Enterprise Systems.
Ramdani
and
Kawalek
(2009)
TPB+DOI E-bank
Banks Survey
Questionnaire
Attitude toward behaviour,
Behavioural Control, Subjective
Norms, Relative Advantages,
Compatibility, Trialability and Risk
Attitudinal and Perceived Behavioural
Control factors are the most significant in
adopt e-banking rather than social factors.
The DOI constructs have a significant effect
on intention to implement Internet banking.
Tan and
Teo
(2000)

123
Model /
Theory
Object of
Analysis
Type
of
Industry
Place of
Research/
Number of
Sampling
Research
Methods
Explanatory Variables Major Findings Author(s)
Pa
rt 6
TOE+Hof
stede’s
Theory
E-commerce SMEs Saudi Arabia
/400
Survey
Questionnaire
Organisational Context (Firm
Size, Owner’s Attitude, Owner’s
Innovativeness, Owner’s
Technological Knowledge),
Technology context (Relative
Advantages, Compatibility,
Complexity) Environmental
Context (Information Intensity,
Competition Intensity), Cultural
Context (Power Distance,
Uncertainty Avoidance,
Individualism/Collectivism ,
Masculinity/Femininity )
The research results showed that Power
Distance and Masculinity had a moderating
effect on e-commerce adoption while
Uncertainty Avoidance and Individualism
had no significant moderating effect. In
addition, Firm Size, Information Intensity
and Competition Intensity had a significant
relationship with e-commerce adoption
among SMEs in Saudi Arabia.
Almoawi
(2011)
TOE+DOI E-commerce Travel
Agencies
Egypt/160 Survey +
Interviews
Innovation Attributes (Relative
Advantages, Compatibility,
Observability, Trialability,
Complexity, Perceived Risk), Firm
Resources (Firm Size, Employees’
IT Knowledge, Marketing
Capabilities, Organisational
Learning, Market Orientation),
Individual Factors( Top
Management Support, Attitude
toward Change, Response to Risk)
Relative Advantages, Complexity,
Employees’ IT Knowledge, Marketing
Capabilities, Organisational Learning,
Attitude toward Change and Response to
Risk were significant predictors to
differentiate adopters from non-adopters.
The results also found that Perceived Risk,
Marketing Capabilities and Response to
Risk are significant predictors to
differentiate simple adopters from
sophisticated adopters.
Hussein
(2009)

124
Model /
Theory
Object of
Analysis
Type
of
Industry
Place of
Research/
Number of
Sampling
Research
Methods
Explanatory Variables Major Findings Author(s)
Pa
rt 6
TOE+DOI E-commerce Travel
Agency
Canada /410 Survey Environmental Context (Partner
Influence, Environmental
Uncertainty),Marketing Strategy(
Price, Distribution, Customer
Relations) ,Managerial Context
(Owner/Manager’s Experience,
Educational Level),Organisational
Context( Type of Ownership,
Nature of Business),
Characteristics of E-commerce (Perceived Advantages,
Technology Attributes)
Partner Influence and Environmental
Uncertainty are significant predictors of
adopting website at the informational and
transactional levels and insignificant
predictors of implementing a website at the
strategic level. The results also show that
Firm’s Distribution, Communication
Strategy, Type of Ownership, Nature of
Business, Perceived Advantages,
Technology Attributes are significant to
adopting higher level of website (website
strategic level) rather than lower level of
website implementation (website
informational and transactional level). Also,
the results showed that Managerial Context
including Owner/Manager’s Experience and
Educational Level are not associated with
website implementation levels.
Raymond
(2001)
DOI+TOE E-commerce Travel
Agencies
Taiwan/122 Survey Innovation attributes (Compatibility, Relative
Advantages, Relative Risk)
Organisation (Centralization,
Formalization, Percept of
Superiority, Organisation Scale
Industry), Environment
(Government Policy, Legal
Regulation, Competition Intensity,
Market Scale, Popularity of Internet
User, Customers Pressure, Supplier
Pressure, Security, Website
Transmission Correctness, Website
Transmission Speed, Website
Maintenance
Compatibility, Centralization,
Organisational Scale and Correctness of
Website Transmission were significant
predictors in differentiating between
adopters and non-adopters.
Hung et al.
(2011)
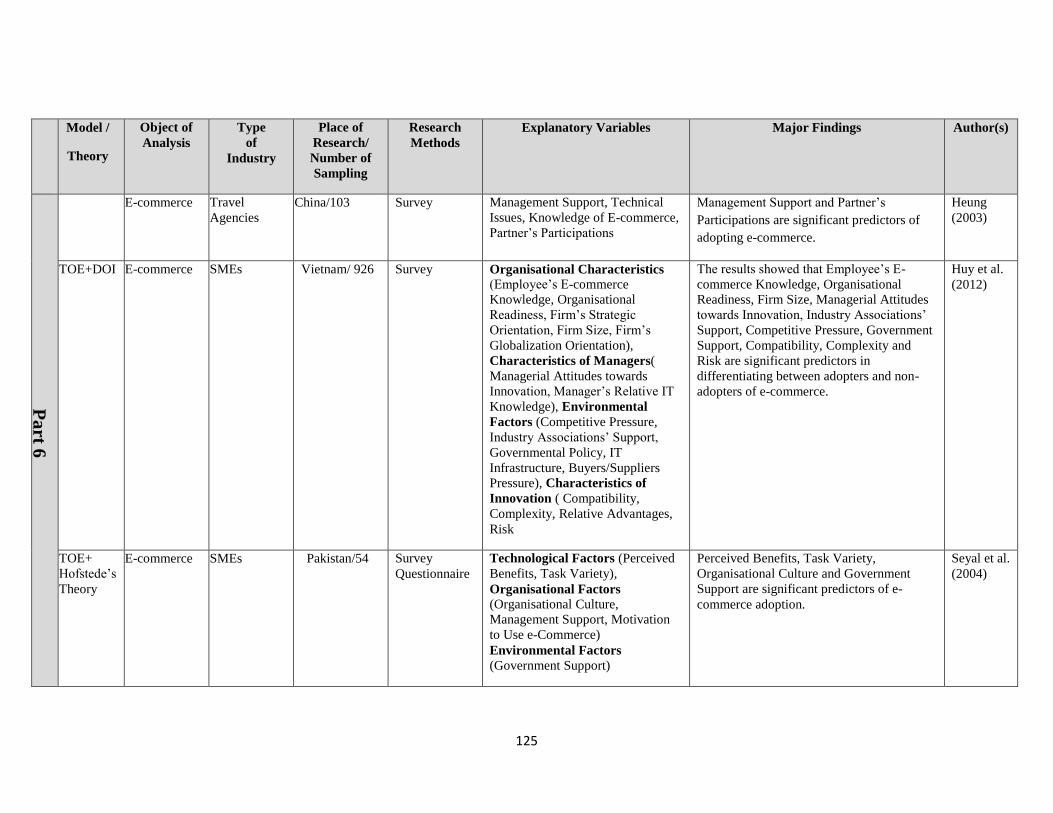
125
Model /
Theory
Object of
Analysis
Type
of
Industry
Place of
Research/
Number of
Sampling
Research
Methods
Explanatory Variables Major Findings Author(s)
Pa
rt 6
E-commerce Travel
Agencies
China/103 Survey Management Support, Technical
Issues, Knowledge of E-commerce,
Partner’s Participations
Management Support and Partner’s
Participations are significant predictors of
adopting e-commerce.
Heung
(2003)
TOE+DOI E-commerce SMEs Vietnam/ 926 Survey Organisational Characteristics (Employee’s E-commerce
Knowledge, Organisational
Readiness, Firm’s Strategic
Orientation, Firm Size, Firm’s
Globalization Orientation), Characteristics of Managers(
Managerial Attitudes towards
Innovation, Manager’s Relative IT
Knowledge), Environmental
Factors (Competitive Pressure,
Industry Associations’ Support,
Governmental Policy, IT
Infrastructure, Buyers/Suppliers
Pressure), Characteristics of
Innovation ( Compatibility,
Complexity, Relative Advantages,
Risk
The results showed that Employee’s E-
commerce Knowledge, Organisational
Readiness, Firm Size, Managerial Attitudes
towards Innovation, Industry Associations’
Support, Competitive Pressure, Government
Support, Compatibility, Complexity and
Risk are significant predictors in
differentiating between adopters and non-
adopters of e-commerce.
Huy et al.
(2012)
TOE+
Hofstede’s
Theory
E-commerce SMEs Pakistan/54 Survey
Questionnaire
Technological Factors (Perceived
Benefits, Task Variety),
Organisational Factors (Organisational Culture,
Management Support, Motivation
to Use e-Commerce)
Environmental Factors
(Government Support)
Perceived Benefits, Task Variety,
Organisational Culture and Government
Support are significant predictors of e-
commerce adoption.
Seyal et al.
(2004)
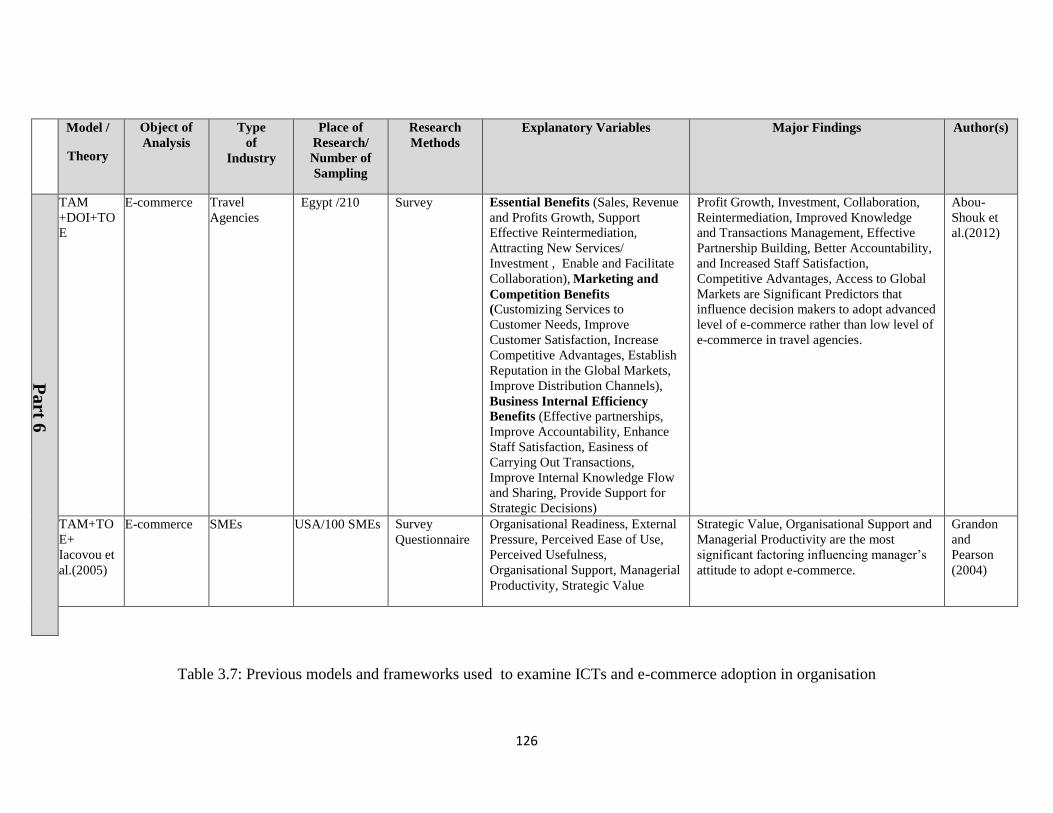
126
Model /
Theory
Object of
Analysis
Type
of
Industry
Place of
Research/
Number of
Sampling
Research
Methods
Explanatory Variables Major Findings Author(s)
Pa
rt 6
TAM
+DOI+TO
E
E-commerce Travel
Agencies
Egypt /210 Survey Essential Benefits (Sales, Revenue
and Profits Growth, Support
Effective Reintermediation,
Attracting New Services/
Investment , Enable and Facilitate
Collaboration), Marketing and
Competition Benefits
(Customizing Services to
Customer Needs, Improve
Customer Satisfaction, Increase
Competitive Advantages, Establish
Reputation in the Global Markets,
Improve Distribution Channels),
Business Internal Efficiency
Benefits (Effective partnerships,
Improve Accountability, Enhance
Staff Satisfaction, Easiness of
Carrying Out Transactions,
Improve Internal Knowledge Flow
and Sharing, Provide Support for
Strategic Decisions)
Profit Growth, Investment, Collaboration,
Reintermediation, Improved Knowledge
and Transactions Management, Effective
Partnership Building, Better Accountability,
and Increased Staff Satisfaction,
Competitive Advantages, Access to Global
Markets are Significant Predictors that
influence decision makers to adopt advanced
level of e-commerce rather than low level of
e-commerce in travel agencies.
Abou-
Shouk et
al.(2012)
TAM+TO
E+
Iacovou et
al.(2005)
E-commerce SMEs USA/100 SMEs Survey
Questionnaire
Organisational Readiness, External
Pressure, Perceived Ease of Use,
Perceived Usefulness,
Organisational Support, Managerial
Productivity, Strategic Value
Strategic Value, Organisational Support and
Managerial Productivity are the most
significant factoring influencing manager’s
attitude to adopt e-commerce.
Grandon
and
Pearson
(2004)
Table 3.7: Previous models and frameworks used to examine ICTs and e-commerce adoption in organisation

127
Chapter Four
Hypotheses and Conceptual Framework
128
4.1 Introduction
The previous chapter presented the literature review of the technology and e-commerce
adoption by SMEs in both developed and developing countries and showed the most
dominant theories and frameworks that used in technology and e-commerce adoption
studies. Also, it discussed the most frequently and dominant models that used to evaluate
the level of e-commerce maturity in SMEs. As a result , limitations and gap of literature
was identified.
This chapter contribute to first research objective by developing a comprehensive
conceptual framework to understand the factors that affect decision makers in Jordanian
travel agencies in their decisions on levels of e-commerce adoption.
4.2 The Proposed Conceptual Framework
In the previous chapter the extensive literature review showed the relevant theories and
models on the adoption and use of technology and e-commerce and the maturity models’
relevance to e-commerce adoption by SMEs. Through reviewing that literature the
current research found that a wide range of models were applied as theoretical bases, and
a large number of variables were identified as facilitators or inhibitors of adopting and
using technology and e-commerce by SMEs. The existing literature also shows a number
of overlapping and inconsistencies in the identification of variables which creates
complication for many studies in determining the appropriate variables and grouping
these variables.

129
Therefore, the main aim of the current research is to overcome the limitations and fill the
gap in the literature presented in chapter three by developing a framework that provides a
comprehensive explanation of e-commerce adoption as to guide this study. The proposed
framework is developed based on the Wymer and Regan’s (2005) criteria.
First, all factors are identified and listed based on the literature reviewed in this study (see
Table 3.7). As shown in the table below, 58 independent variables were suggested by the
literature reviewed.
Factors Description Author(s)
Technological Factors
Relative Advantage Increases profits; improves productivity;
enhances efficiency; improves customer
satisfaction and services; enhances
communication with trade partners and
enhance company’s image
Oluyinka et al.
(2014);
Shanker
(2008)
Compatibility E-commerce is compatible with company's
current software and hardware; technology is
compatible with current business
operations/processes
Kamaroddin et
al.(2009);
Scupola (2001)
Trialability Ability to have a free trial before making
decision to adopt e-commerce
Tan et al.
(2008)
Complexity Technology applications are too complicated
to understand and use, and lack of
appropriate tools to support e-commerce
applications
Shanker
(2008);
Kamaroddin et
al. (2009)
Observability The extent to which technology adoption
results are seen by others
Kamaroddin et
al.(2009)
Technology Readiness Technology infrastructure, IT knowledge,
and available IT resources
Al-Somali et
al. (2011)
Task Variety Diverse tasks at job can be performed
through using technology
Seyal et al.
(2004)
E-commerce Barriers Low level of IT Knowledge of the
employees; lack of understanding of new
technology, lack of innovativeness of the
CEO, lack of managerial time, lack of
customers readiness; lack of trust in banks’
supporting electronic transactions
Alamro and
Tarawneh
(2011)
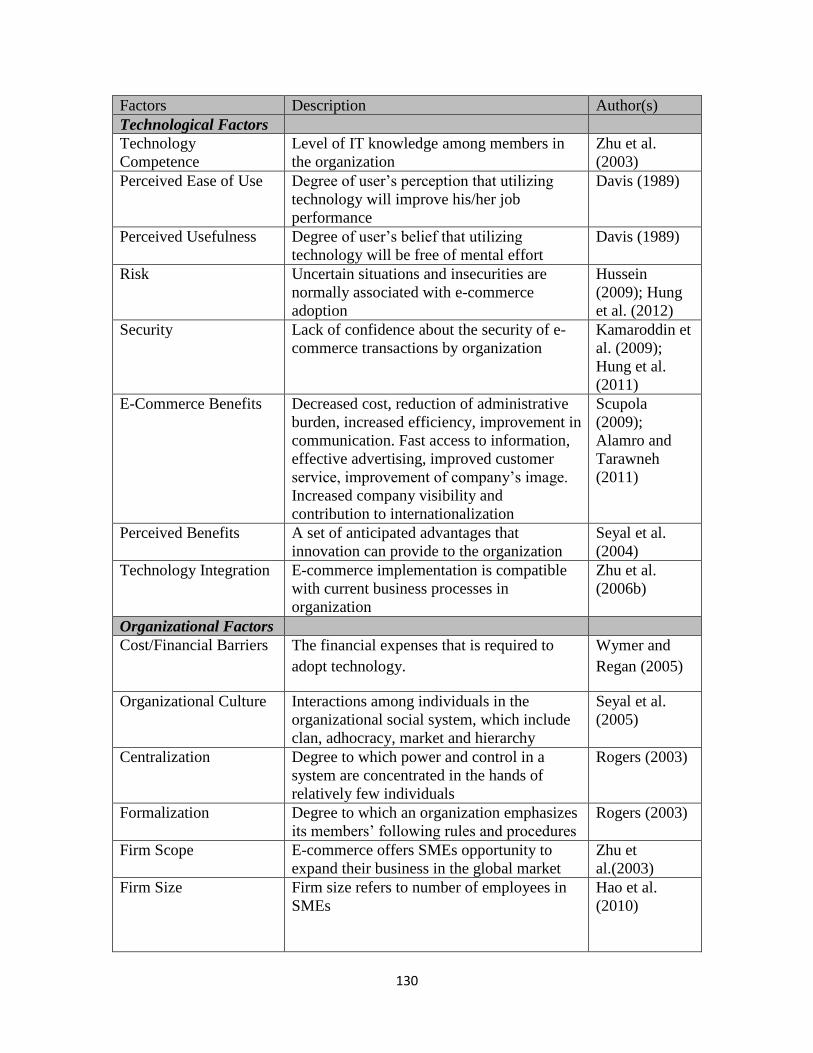
130
Factors Description Author(s)
Technological Factors
Technology
Competence
Level of IT knowledge among members in
the organization
Zhu et al.
(2003)
Perceived Ease of Use Degree of user’s perception that utilizing
technology will improve his/her job
performance
Davis (1989)
Perceived Usefulness Degree of user’s belief that utilizing
technology will be free of mental effort
Davis (1989)
Risk Uncertain situations and insecurities are
normally associated with e-commerce
adoption
Hussein
(2009); Hung
et al. (2012)
Security Lack of confidence about the security of e-
commerce transactions by organization
Kamaroddin et
al. (2009);
Hung et al.
(2011)
E-Commerce Benefits Decreased cost, reduction of administrative
burden, increased efficiency, improvement in
communication. Fast access to information,
effective advertising, improved customer
service, improvement of company’s image.
Increased company visibility and
contribution to internationalization
Scupola
(2009);
Alamro and
Tarawneh
(2011)
Perceived Benefits A set of anticipated advantages that
innovation can provide to the organization
Seyal et al.
(2004)
Technology Integration E-commerce implementation is compatible
with current business processes in
organization
Zhu et al.
(2006b)
Organizational Factors
Cost/Financial Barriers The financial expenses that is required to
adopt technology.
Wymer and
Regan (2005)
Organizational Culture Interactions among individuals in the
organizational social system, which include
clan, adhocracy, market and hierarchy
Seyal et al.
(2005)
Centralization Degree to which power and control in a
system are concentrated in the hands of
relatively few individuals
Rogers (2003)
Formalization Degree to which an organization emphasizes
its members’ following rules and procedures
Rogers (2003)
Firm Scope E-commerce offers SMEs opportunity to
expand their business in the global market
Zhu et
al.(2003)
Firm Size Firm size refers to number of employees in
SMEs
Hao et al.
(2010)

131
Organizational Factors
IT Readiness and
Availability
Availability of the organisational resources
needed for adoption
Iacovou et al.
(1995)
Financial Resources Availability of capital to carry e-commerce
activity without any financial burden
Kurnia et al.
(2009)
Organizational IT
Competence
Level of technical expertise available to the
organization
Ifinedo (2011)
Strategic Orientation Philosophy of firms and how firms should
interact with external environments to
conduct business through a deeply rooted set
of values and beliefs
Al-Somali et
al. (2011)
Employees’ IT
Knowledge
Extent to which employee IT knowledge is
perceived through practice and training
Huy et al.
(2012)
Managerial Factors
Top Management
Support
Managers’ perception toward the role of IT
adoption in business activities in their
organisation
Masrek et al.
(2008)
Manager’s Attitude
toward Technology
Adoption
Degree of feeling or mental issue -whether
positive of negative- which influences
managers in adopting or not adopting
technology
Seyal et al.
(2004)
Motivation to Use E-
commerce
Performance of an activity because it is
perceived to be instrumental in achieving
valued outcomes that are distinct from the
activity itself such as improved job
performance and business gains
Seyal et al.
(2006)
Uncertainty Avoidance Extent of individual’s ability to tolerate
unstructured and ambiguous situations
Chen and
McQueen
(2008)
Power Distance Extent to which a relationship between
managers and employees produce decisions
within firms
Chen and
McQueen
(2008)
CEO’s Characteristics Refers to whether the owner involved in the
choice of computers and information
technology had received formal computer
training and used computers frequently and
owner’s highest education level
Sparling et al.
(2007)
Manger’s IT
Knowledge
IT knowledge and skills of decision makers
that can influence the adoption of technology
Almoawi
(2011)
CEO Commitment to IT Extent of manager’s commitment to provide
the resources required to adopt technology
Hussin and
Noor (2005)
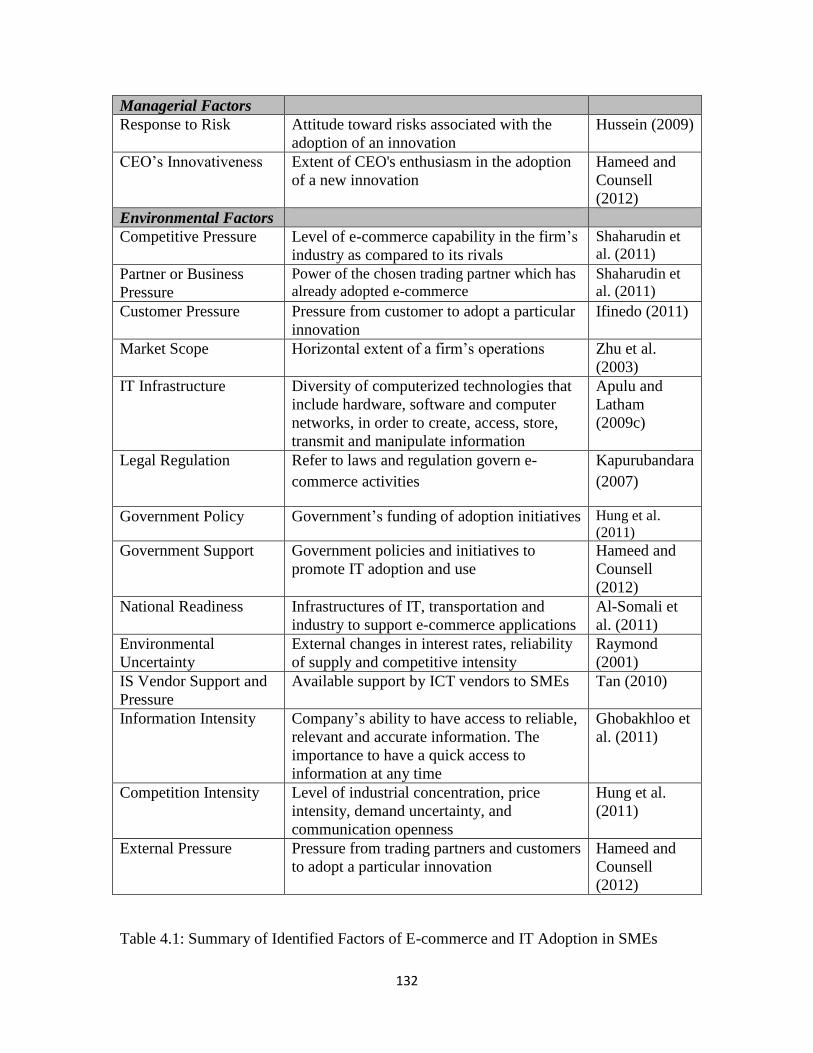
132
Managerial Factors
Response to Risk Attitude toward risks associated with the
adoption of an innovation
Hussein (2009)
CEO’s Innovativeness Extent of CEO's enthusiasm in the adoption
of a new innovation
Hameed and
Counsell
(2012)
Environmental Factors
Competitive Pressure Level of e-commerce capability in the firm’s
industry as compared to its rivals
Shaharudin et
al. (2011)
Partner or Business
Pressure
Power of the chosen trading partner which has
already adopted e-commerce Shaharudin et
al. (2011)
Customer Pressure Pressure from customer to adopt a particular
innovation
Ifinedo (2011)
Market Scope Horizontal extent of a firm’s operations Zhu et al.
(2003)
IT Infrastructure Diversity of computerized technologies that
include hardware, software and computer
networks, in order to create, access, store,
transmit and manipulate information
Apulu and
Latham
(2009c)
Legal Regulation Refer to laws and regulation govern e-
commerce activities
Kapurubandara
(2007)
Government Policy Government’s funding of adoption initiatives Hung et al.
(2011)
Government Support Government policies and initiatives to
promote IT adoption and use
Hameed and
Counsell
(2012)
National Readiness Infrastructures of IT, transportation and
industry to support e-commerce applications
Al-Somali et
al. (2011)
Environmental
Uncertainty
External changes in interest rates, reliability
of supply and competitive intensity
Raymond
(2001)
IS Vendor Support and
Pressure
Available support by ICT vendors to SMEs Tan (2010)
Information Intensity Company’s ability to have access to reliable,
relevant and accurate information. The
importance to have a quick access to
information at any time
Ghobakhloo et
al. (2011)
Competition Intensity Level of industrial concentration, price
intensity, demand uncertainty, and
communication openness
Hung et al.
(2011)
External Pressure Pressure from trading partners and customers
to adopt a particular innovation
Hameed and
Counsell
(2012)
Table 4.1: Summary of Identified Factors of E-commerce and IT Adoption in SMEs
133
The second criterion is to reduce variables that have similar definition and consolidate
them into one variable. Table 4.1 shows that many of the identified variables have similar
concepts.
The reviewed literature in Chapter Three shows that DoI model provided a significant
analytical framework for predicting the intention to use different types of technology
more than TPB and TAM. The reviewed literature also shows that TAM and DoI have
shared common constructs and a concept while the latter is more comprehensive model in
explaining technology adoption (Looi, 2005). DoI theory has five constructs in
explaining technology adoption: relative advantage, complexity, trialability, compatibility
and observability. The relative advantage and complexity constructs in DOI are similar to
PU and PEOU constructs in TAM, respectively (El-Gohary, 2011; Karahanna et al.,
1999; Pham et al., 2011).
As clearly shown in Table 4.1, relative advantage construct in DOI is similar to
information systems input, task variety, technology competence, perceived usefulness, e-
commerce benefits and perceived benefits. Also, the complexity construct is similar to e-
commerce barriers and perceived ease of use despite the different terminology. Table 4.1
shows that the compatibility construct is similar to technology integration. Finally,
security and risk are similar variables.
As a result, the identified variables in technological context are consolidated into seven
variables: relative advantage, complexity, trialability, compatibility, observability, risk
and technology readiness.

134
Regarding the organizational factors, Table 4.1 shows that the constructs cost, financial
barriers and financial resources are similar variables. Also similar are IT readiness and
availability and organizational IT competence. Moreover, the organizational culture has
the same description of centralization variable. Finally, marketing capability and firm
scope are similar variables. Therefore, the identified variables are consolidated into nine
variables: financial barriers, employees’ IT knowledge, organizational culture, marketing
capabilities, business category, formalization, firm size, business category and strategic
orientation.
Table 4.1 shows that many of the identified variables in the managerial context are
similar in description. It was found that the variables top management support,
motivation to use e-commerce and CEO commitment to IT have the same concepts
despite the different terminology. Also, manager’s attitude toward technology adoption
and CEO’s innovativeness are similar in definition. Moreover, CEO’s characteristics and
manger’s IT knowledge are similar in terms of description. Finally, response to risk and
uncertainty avoidance have similar concept.
Therefore, the identified variables are consolidated into five variables: top management
support, manager’s attitude toward technology adoption, manger’s IT knowledge, power
distance and uncertainty avoidance.
Regarding the environmental context, Table 4.1 shows that the description of government
support variable covers the definition of IT infrastructure, legal regulation and
government policy.

135
Competitive pressure is similar to competition intensity and environmental uncertainty
variables. Moreover, Table 4.1 shows that partner or business pressure and customer
pressure have more distinct definition than that of external pressure. Therefore, the
identified variables are consolidated into eight variables: government support,
competitive pressure, partner or business pressure and customer pressure, market scope,
national readiness, IS vendor support and pressure, and information intensity.
It can be clearly noticed from Table 4.2 that there is number of similar factors identified
in different contexts. It shows that the organizational culture variable which is identified
within organizational context is similar to power distance that is identified in the
managerial context. Also, uncertainty avoidance that is identified in the managerial
context is similar to formalization and risk variables which are identified in the
organizational and technological contexts, respectively. However, most studies on e-
commerce adoption by SMEs the aforementioned factors were identified within
managerial context; thus power distance and uncertainty are chosen in the current study.
Moreover, marketing capabilities variable in the organizational context is similar to the
marketing scope variable in environmental factors; thus marketing scope is chosen in the
current study. As a result, the identified variables in the literature consolidated into 25
factors as shown in Table 4.2 below.
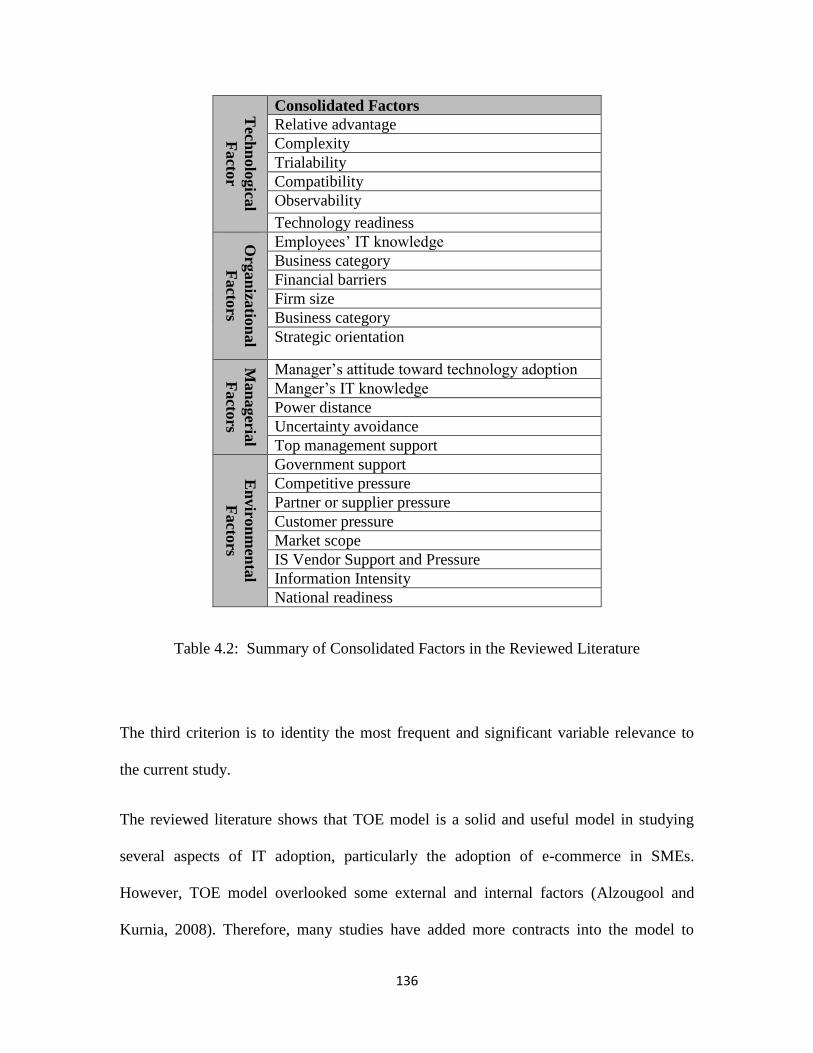
136
Tech
nolo
gica
l
Facto
r
Consolidated Factors
Relative advantage
Complexity
Trialability
Compatibility
Observability
Technology readiness
Org
an
izatio
nal
Facto
rs
Employees’ IT knowledge
Business category
Financial barriers
Firm size
Business category
Strategic orientation
Man
ageria
l
Facto
rs
Manager’s attitude toward technology adoption
Manger’s IT knowledge
Power distance
Uncertainty avoidance
Top management support
En
viro
nm
enta
l
Facto
rs
Government support
Competitive pressure
Partner or supplier pressure
Customer pressure
Market scope
IS Vendor Support and Pressure
Information Intensity
National readiness
Table 4.2: Summary of Consolidated Factors in the Reviewed Literature
The third criterion is to identity the most frequent and significant variable relevance to
the current study.
The reviewed literature shows that TOE model is a solid and useful model in studying
several aspects of IT adoption, particularly the adoption of e-commerce in SMEs.
However, TOE model overlooked some external and internal factors (Alzougool and
Kurnia, 2008). Therefore, many studies have added more contracts into the model to

137
overcome these limitations (Ifinedo, 2011; Al-Somali et al., 2011, Teo et al., 2009,
Kurnia et al., 2009). For example, the reviewed literature shows that many studies have
integrated DoI with TOE and found its consistency and better explanation of technology
adoption for many reasons. First, both theories describe the external and internal
characteristics of the organisation. In addition, both theories focus on the technological
context of new IT diffusion (Zhu et al., 2006b). Second, the combination between TOE
and the DoI forms the most popular and comprehensive theory in describing the adoption
of a new technology.
According to Hsu et al. (2006), the TOE framework, combined with DOI theory, is more
capable of describing intra-firm innovation. Ukoha et al. (2011) argued that the
integration of TOE and DoI theories makes a larger number of constructs and thus richer
and more powerful theoretical bases in describing the technological factors. Many studies
combined DoI with TOE and found it better to explain e-commerce adoption decisions in
SMEs (See Table 3.7 part 4). Therefore, the proposed framework will combine TOE and
the attributes of innovation from DOI.
Moreover, TOE has an additional important context, the environmental context which
describes the atmosphere-relevant factors that influence or inhibit the organisation in
adopting IT (Oliveira and Martins, 2010a; Ghobakhloo et al. 2011). Also the reviewed
literature shows that the organisational and environmental contexts manifest an important
context influencing SMEs adoption of ICTs and e-commerce.
Also, the literature review shows that these contexts have been refined and extended this
framework which was originally developed by Tornatzky and Fleischer (1990), in order

138
to make the model more comprehensive in describing these internal and external factors
and their effect on ICTs and e-commerce adoption among SMEs.
In this study, the most frequently cited factors are considered regarding to these contexts.
The organisational factors that are considered and more relevant to this research are: firm
size, financial barriers, and employees IT knowledge , while the environmental factors
that are considered in literature and relate to this study are : competitive pressure,
supplier/partner pressure, customer pressure and government Support (See Table 4.3).
Surprisingly, a limited number of studies examined in depth the managerial factors of e-
commerce adoption in SMEs, although owners/managers’ characteristics have played an
important role in e-commerce adoption by SMEs (Huy et al., 2012; To and Ngai, 2007;
Scupola, 2009; Ifinedo, 2011). Also, Hashim (2007) argued that although TOE model is
robust tool to predict technology adoption in organisation, TOE does not sufficiently
identify managerial factors where managers are considered the most critical decision
makers in adopting technology in SMEs.
The literature review of this study found that top management support and manager’s
attitude toward e-commerce adoption were the identical and determinant factors that
influence e-commerce adoption in SMEs. Therefore, these factors will be included in the
proposed framework.
Also, the literature review of this study found that cultural variables have an important
effect on IT adoption and diffusion of new technology. According to Straub et al. (1997),
there is a reason to believe that there are connections between culture and the use of
creation information technology. In addition, literature showed that Hofstede’s cultural

139
dimensions has been widely used to investigate cross-cultural technology adoption,
proving that different countries have different cultural variables leading to different
perceptions on e-commerce adoption. Although Hofstede’s cultural dimensions
confirmed its applicability in studying technology adoption across cultures, it has not
been frequently applied in developing theory or integrated with other information
systems’ theories.
According to Ford et al.’s (2003, p.1) view of Hofstede’s cultural dimensions: “most
research is focused on issues related to IS management and to IS, while issues related to
IS development and operations and to IS usage remain relatively unexamined”.
Moreover, Hofstede’s cultural dimensions was found useful in studying the differences
between cultures within the same country rather than different countries (Chen and
McQueen, 2008; Almoawi, 2011).
Also, Ford et al. (2003) stated that limited studies applied Hofstede’s cultural variables to
examine the individual/managerial characteristics with respect to e-commerce adoption
among SMEs, although Hofstede’s cultural dimensions was found useful in studying the
managerial aspects of technology adoption , thus, the power distance and uncertainty
avoidance dimensions will be included within managerial factors in the proposed
conceptual framework .
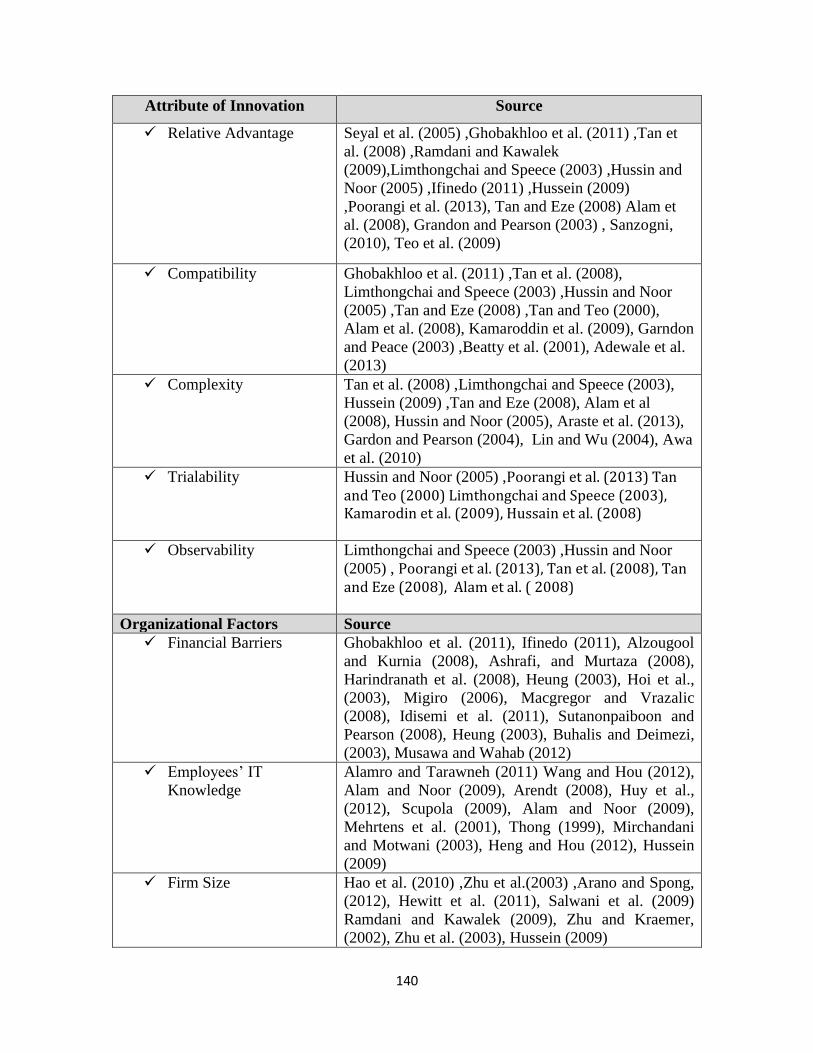
140
Attribute of Innovation Source
Relative Advantage
Seyal et al. (2005) ,Ghobakhloo et al. (2011) ,Tan et
al. (2008) ,Ramdani and Kawalek
(2009),Limthongchai and Speece (2003) ,Hussin and
Noor (2005) ,Ifinedo (2011) ,Hussein (2009)
,Poorangi et al. (2013), Tan and Eze (2008) Alam et
al. (2008), Grandon and Pearson (2003) , Sanzogni,
(2010), Teo et al. (2009)
Compatibility
Ghobakhloo et al. (2011) ,Tan et al. (2008),
Limthongchai and Speece (2003) ,Hussin and Noor
(2005) ,Tan and Eze (2008) ,Tan and Teo (2000),
Alam et al. (2008), Kamaroddin et al. (2009), Garndon
and Peace (2003) ,Beatty et al. (2001), Adewale et al.
(2013) Complexity
Tan et al. (2008) ,Limthongchai and Speece (2003),
Hussein (2009) ,Tan and Eze (2008), Alam et al
(2008), Hussin and Noor (2005), Araste et al. (2013),
Gardon and Pearson (2004), Lin and Wu (2004), Awa
et al. (2010)
Trialability Hussin and Noor (2005) ,Poorangi et al. (2013) Tan and Teo (2000) Limthongchai and Speece (2003), Kamarodin et al. (2009), Hussain et al. (2008)
Observability
Limthongchai and Speece (2003) ,Hussin and Noor
(2005) , Poorangi et al. (2013), Tan et al. (2008), Tan and Eze (2008), Alam et al. ( 2008)
Organizational Factors Source
Financial Barriers Ghobakhloo et al. (2011), Ifinedo (2011), Alzougool
and Kurnia (2008), Ashrafi, and Murtaza (2008),
Harindranath et al. (2008), Heung (2003), Hoi et al.,
(2003), Migiro (2006), Macgregor and Vrazalic
(2008), Idisemi et al. (2011), Sutanonpaiboon and
Pearson (2008), Heung (2003), Buhalis and Deimezi,
(2003), Musawa and Wahab (2012)
Employees’ IT
Knowledge
Alamro and Tarawneh (2011) Wang and Hou (2012),
Alam and Noor (2009), Arendt (2008), Huy et al.,
(2012), Scupola (2009), Alam and Noor (2009),
Mehrtens et al. (2001), Thong (1999), Mirchandani
and Motwani (2003), Heng and Hou (2012), Hussein
(2009)
Firm Size
Hao et al. (2010) ,Zhu et al.(2003) ,Arano and Spong,
(2012), Hewitt et al. (2011), Salwani et al. (2009)
Ramdani and Kawalek (2009), Zhu and Kraemer,
(2002), Zhu et al. (2003), Hussein (2009)

141
Managerial Factors Source
Top Management
Support
Hao et al. (2010) ,Scupola (2009) ,Ifinedo (2011)
Al-Somali et al. (2011) ,Teo et al. (2009), Chong et al.
(2009), Ramdani et al. (2009), Al-Weshah and Al-
Zubi (2012), Beatty et al. (2001), Shaharudin et al.,
(2011), Kim (2004), Hussein (2009).
Attitude toward
e-commerce applications
Mpofu et al. (2009) ,Seyal and Rahman (2003) ,To
and Ngai (2007), Teo et al. (2009), Ramsey and
McCole (2005), Huy et al. (2012) Thong (1999),
Rashid and Al-Qirim (2001)
Power Distance
Lundgren and Walczuch, 2003; Yoon, 2009; Chen and
McQueen, 2008; Almoawai, 2011; Kollmann et al.
,2009; Hasan and Ditsa, 1999.
Uncertainty Avoidance
Hao et al. (2010) ,Tan et al. (2008) ,Leidner and
Kayworth (2006), Yeung et al. (2003), Seyal and
Rahman (2003), Al-Hujra et al (2011), Lundgren and
Walczuch (2003), Almowai (2011), Kollmann et al.,
(2009), Chen and McQueen (2008), Lundgren and
Walczuch (2003), Gong (2009), Vatanasakdakul et al.,
(2004), Alnoor and Arif (2011) ,Bao and Sun (2010)
Environmental Factors Source
Competitive Pressure
Ramdani and Kawalek (2009) ,Zhu et al. (2003),
Jeyaraj et al. (2006), Olatokun (2010), Sarosa and
Zowghi (2003), Mpofu et al. (2009), Alamro and
Tarawneh (2011), Almoawi and Mahmood (2011),
Lee and Cheung (2004), Iacovou et al. (2005),
Ghobakhloo et al. (2011), Raymond (2001) ,To and
Ngai (2007), Looi (2005), Sandy and Graham (2008).
Supplier/Partner
Pressure
Lin and Lin (2008), Riemenschneider et al. (2003),
Ghobakhloo et al. (2011),Jaidee and Beaumont
(2003), Scupola (2003), Heck and Ribbers (1999),
Mehrtens et al. (2001), Molla and Licker (2005)
Ifinedo (2011), Al-Qirim (2007) ,Raymond (2001)
Customers Pressure
Grandon and Pearson (2003)Ghobakhloo et al. (2011),
Teo et al. (2003) Al-Somali et al. (2011), Scupola
(2009) ,Alamro and Tarawneh, (2011), Scupola
(2009), Abdul Hameed and Counsell (2012)
Government Support Hung et al. (2011), Tan and Teo (2000),Huy et al.,
(2012), Hunaiti et al. (2009), Scupola (2009), Saprikis
and Vlachopoulou (2012), Hamid (2009), Gibbs et al.,
(2003), Thatcher et al. (2006), Seyal et al. (2004)
Molla and Licker (2005), Al-Weshah and Al-Zubi,
2012.
Table 4.3: The Most frequently cited and significant factors in the literature of e-
commerce adoption by SMEs.
142
Finally, many studies investigated the different factors associated with adoption and non-
adoption of e-commerce in SMEs (Ramsey and McCole, 2005; Tan et al., 2007; Tan and
Teo, 1998; Teo and Ranganathan, 2004; Sutanonpaiboon and Pearson 2008). However,
limited ones examined the factors affecting the different levels of e-commerce adoption
within SMEs, (Chen and McQueen, 2008; Abou-Shouk et al, 2012; Senarathna and
Wickramasuriya, 2011; Rania, 2011; Raymond, 2001).
As mentioned in Section 3.6 of Chapter Three, several studies identified the concept of e-
commerce adoption levels in SMEs (Spencer et al., 2012; Boisvert, 2002; Rao et al.,
2003; Duncombe et al., 2005; Lefebvrea et al., 2005; Daniel et al., 2002; Rayport and
Jaworski, 2002; Spencer et al., 2012). However, the e-commerce maturity levels were
described inconsistently among these studies.
Among these e-commerce maturity models, this study adopted Molla and Licker’s (2005)
e-commerce maturity model to identify the organizational level of e-commerce. As
shown in Table 3.6, Molla and Licker’s (2005) e-commerce maturity model consists of
six levels of e-commerce adoption starting from no adoption, then moving through
internet connection with e-mail, static website, interactive website, online store, and full
e-business activities. This model was chosen because for several reasons. First, the model
was developed on the basis of most cited e-commerce maturity models and it overcomes
the limitations of these models. Secondly, the model was found most validated in
evaluating actual and planned adoption of e-commerce in SMEs (AlGhamdi et al., 2014).
Finally, Molla and Licker’s (2005) e-commerce maturity model is more relevant in
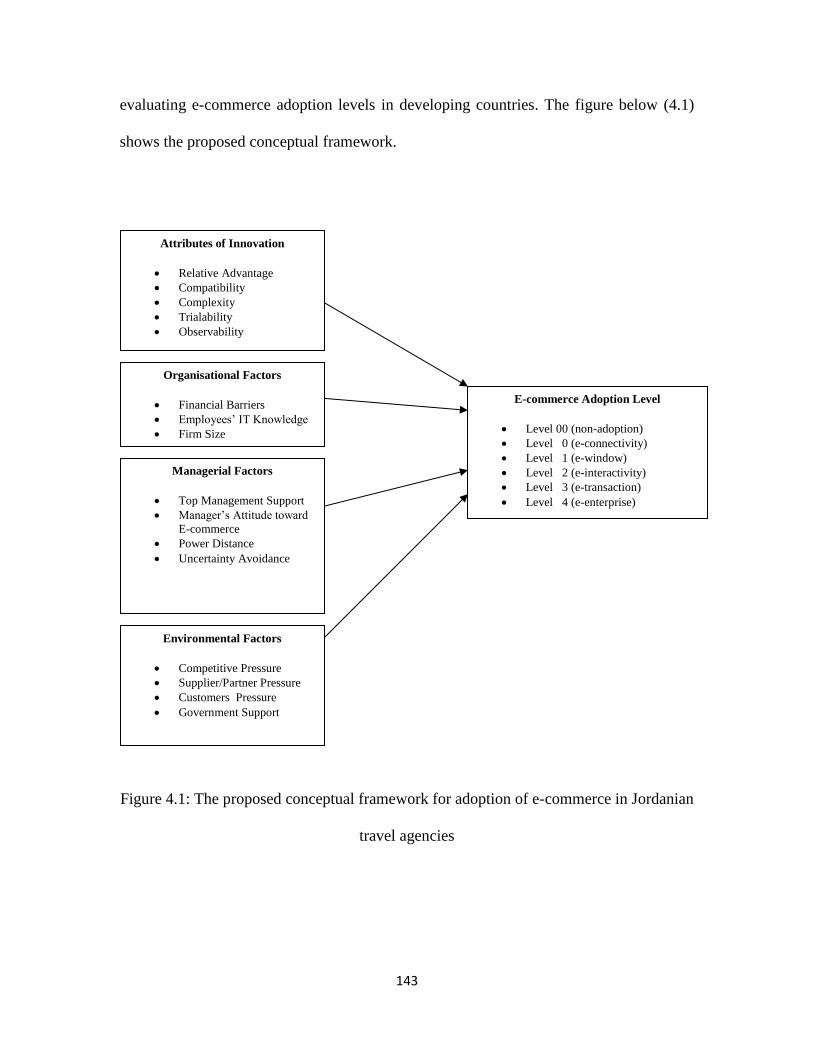
143
evaluating e-commerce adoption levels in developing countries. The figure below (4.1)
shows the proposed conceptual framework.
Figure 4.1: The proposed conceptual framework for adoption of e-commerce in Jordanian
travel agencies
Attributes of Innovation
Relative Advantage
Compatibility
Complexity
Trialability
Observability
Organisational Factors
Financial Barriers
Employees’ IT Knowledge
Firm Size
E-commerce Adoption Level
Level 00 (non-adoption)
Level 0 (e-connectivity)
Level 1 (e-window)
Level 2 (e-interactivity)
Level 3 (e-transaction)
Level 4 (e-enterprise)
Environmental Factors
Competitive Pressure
Supplier/Partner Pressure
Customers Pressure
Government Support
Managerial Factors
Top Management Support
Manager’s Attitude toward
E-commerce Power Distance
Uncertainty Avoidance

144
4.3 Hypotheses and Relationship to Research Development
As shown in Figure 4.1, the proposed conceptual framework consists of two segments.
The first (on the left side of the proposed model) represents the independent variables,
which are classified into four categories. The first category is attribution of innovation,
which will be used in examining the technological factors and their relation to the level of
e-commerce adoption. The second category is organisational factors, which show the
organisation’s internal factors and their relations to e-commerce adoption level The third
category is managerial factors, which present the characteristics of managers and their
associations with e-ecommerce adoption level. The fourth category is environmental
factors, or the external factors surrounding the organisation and their effects on e-
commerce adoption level.
The second segment (on the right side of the proposed conceptual framework) represents
the dependent variables, consisting of six levels: non-adoption, e-connectivity, e-window,
e-interactivity, e-transaction and e-enterprise. This proposed model will be tested with
Jordanian travel agencies’ owners/managers as to embark on the right model and validate
it in order to achieve a better understanding of the factors affecting the levels of e-
commerce adoption among Jordanian travel agencies. Thus, it is important to develop
hypotheses for these constructs and their relationships to the adoption level of e-
commerce. The following sections discuss each of the factors and the proposed
hypotheses of this study.
145
4.3.1 Attributes of Innovation
As mentioned above, the attributes of innovation theory consists of five characteristics:
relative advantage, compatibility, complexity, trialability and observability. These factors
will be used to examine the technological characteristics as determinants of the e-
commerce adoption level among decision makers in Jordanian travel agencies. The
research hypotheses for these factors will be discussed in the following section.
4.3.1.1 Relative Advantages
Rogers (2003, p.229) defined relative advantages as “the degree to which an innovation
is perceived as being better than the idea it supersedes”, meaning the extent of benefits
that can be obtained through adopting a new idea compared to the benefits of the current
idea. Relative Advantages is a significant factor in identifying adoption of an innovation
(Tronatzky and Klien, 1982; Rogers, 1995). This study highlights the technological
benefits that influence Jordanian travel agencies managers’ decisions on adopting or
dismissing e-commerce.
In the technological context, relative advantages includes increasing profits, improving
productivity, reducing cost and time, enhancing efficiency, increasing competitiveness,
improving customer satisfaction and services and enhancing communication with trade
partners. (Oluyinka et al. ,2014, Shanker , 2008; Ma et al., 2003; Ashrafi and Murtaza,
2008; Apulu, 2011). Studies, particularly of ICTs and e-commerce, agreed that relative
advantages has a positive significant effect on innovation adoption (Poorangi et al.,2013;
Ghobakhloo et al., 2011; Tan and Eze, 2008; Ramdani and Kawalek, 2009; Tan and Teo,
2000; Limthongchai and Speece, 2003; Alam et al., 2008; Hussin and Noor, 2005;
Grandon and Pearson, 2003; Looi, 2004).
146
Ghobakhloo et al. (2011) and Tan and Eze (2008) found that relative advantages as the
most significant factor in positively affecting e-commerce adoption in SMEs. Several
studies focusing on web adoption found that relative advantages is positive and
significant in differentiating between adoption and non-adoption in SMEs (Aziz and
Jamali, 2013; Sparling et al., 2007; Sanzogni, 2010; Teo et al., 2009).
Other studies, however, found relative advantages insignificant in affecting e-commerce
adoption in SMEs as their owners/managers lack sufficient awareness of the perceived
benefits of e-commerce adoption in SMEs (Almoawi and Mahmood, 2011; El-Gohary,
2011; Seyal and Rahman, 2003). This study shall be in line with Roger’s and most recent
studies that identified a positive relationship between relative advantages and e-
commerce adoption. Hence, the following hypothesis is presented:
H1: There is a positive and significant relationship between relative advantages and
the adoption level of e-commerce.
4.3.1.2 Compatibility
Rogers (2003, p.240) defined compatibility as: “the degree to which an innovation is
perceived as consistent with the existing values, past experiences, and needs of potential
adopters”. Therefore, an innovation is more positively significant for adoption by
individuals if it is compatible and consistent with individual’s work, firm objectives and
needs, previous experience and current technology infrastructure (Tornatzky and Klein,
1982; Rogers, 2003).

147
Compatibility in the context of ICTs and e-commerce adoption indicates the extent to
which the adoption of innovation level and consistent technology is needed (Beatty et al.,
2001). The manager’s compatibility with respect to technological innovation has a vital
role in e-commerce adoption by SMEs. This means that the manager is supposed to know
if the new technology to be implemented will meet the firm’s goals and internal
operation. Several studies found a significant positive relationship between compatibility
and ICTs/e-commerce adoption in SMEs (Ghobakhloo et al., 2011; Tan and Eze, 2008;
Ramdani and Kawalek, 2007; Tan and Teo, 2000; Limithongchai and Speece, 2003;
Alam et al., 2008; Kamaroddin et al., 2009; Garndon and Peace, 2003; Beatty et al.,
2001; Adewale et al., 2013; Mndzebele, 2013).
However, the outcomes of these studies regarding compatibility’s effect on e-commerce
adoption are inconsistence. For example, some, such as Limithongchai and Speece’s
(2003) and Alam et al.’s (2008), found that compatibility is the most positively
significant factor in e-commerce adoption by SMEs.
Moreover, an empirical study by Hung et al. (2011) found that compatibility has more
positive significant effect on ecommerce adoption in Taiwan travel agencies than relative
advantage and perceived risk. Azam and Quaddus (2009), however, found that
compatibility has a positively significant effect, that is yet less of a predictor regarding e-
commerce adoption in SMEs than other constructs of attribution of innovation.
Conversely, other studies found that compatibility has no significant effect on e-
commerce adoption (Almoawi and Mahmood, 2011; Sultan & Chan, 2000; Al-Somali,
2011; Al-Qirim, 2006). These conflicting results can be attributed to differences in time,
148
place, SMEs type and methods of data collection. As for this study, it will be in line with
most previous studies, specifically Hung et al.’s (2011) that found a positively significant
relationship between compatibility and e-commerce adoption in Taiwan travel agencies.
Hence, the following hypothesis is presented:
H2: There is a positive and significant relationship between compatibility and the
adoption level of e-commerce.
4.3.1.3 Complexity
Complexity is defined as “the degree to which an innovation is perceived as relatively
difficult to understand and use” (Rogers, 2003, p.257). In the technological context,
complexity means that individuals are less likely to adopt an innovation if they find
technology applications difficult to use and understand (Teo, 2003). Moreover,
complexity affects individuals’ decision to adopt a new technology, which indicates that
more complex technology leads to more uncertainty and sense of risk involved in such
adoption (Premkumar and Roberts, 1999). Conversely, if IT applications are easy to use,
their adoption would become more likely.
Many previous researchers examined the construct’s perceived ease of use as defined by
Davis et al. (1989) with respect to e-commerce adoption in SMEs, and agreed that more
ease of use of e-commerce and technology applications involves greater likelihood to
adopt the innovation (Araste et al., 2013; Gardon and Pearson, 2004; Lin and Wu, 2004;
Awa et al., 2010; Riemenschneider et al., 2003).
149
Several studies tested the construct’s complexity regarding e-commerce resources and
technical competencies. These resources include sufficient computer systems and
information technology infrastructure to support e-commerce activities, adequate
training, skills and knowledge to facilitate e-commerce installation, maintenance and
usage (Scupola, 2001; Kamaroddin et al., 2009).
However, other prior studies found a negative relationship between complexity and e-
commerce adoption. (Tan and Eze, 2008; Limthongchai and Speece, 2003; Alam et al,
2008; Hussin and Noor, 2005). Only a limited studies found that complexity has no
significant relationship with e-commerce adoption in SMEs (Almoawi and Mahmood,
2011; Sultan and Chan, 2000; Poorangi et al., 2013). Based on the aforementioned and in
line with Rogers’s model, the following hypothesis is presented:
H3: There is a negative relationship between complexity and the adoption level of e-
commerce.
4.3.1.4 Trialability
Trialability means “the degree to which an innovation may be experimented with on a
limited basis” (Rogers, 2003, p.258). Rogers found that individuals allowed to
experiment with an innovation for a period of time are more likely to adopt the
innovation because trialability allowed decreasing uncertainty.
In the e-commerce context, trialability provides potential adopters with opportunity to
reduce their uncertainty about new e-commerce applications and learn to use new
technological applications as to become more comfortable with them and thus more
likely to adopt them (Tan and Teo, 2000; Weiss and Dale, 1998, cited in Limthongchai
150
and Speece, 2003). Azam and Quaddus (2009), Alam et al. (2009) and Kendall et al.
(2001) found that trialability has no significant effect on e-commerce adoption by SMEs
in Bangladesh, Malaysia and Singapore, respectively. Azam and Quaddus (2009)
justified the insignificance of trialability in Bangladesh SMEs by waiving taxes on
computers since 1998 which led to lower prices of computer hardware and software that
most of SMEs started using computer and connecting to the Internet in their business
which minimized the role of trialability. In addition, online transactions are common in
Bangladesh and used by SMEs.
However, other studies found that trialability has a significant effect in adopting e-
commence in SMEs (Poorangi et al., 2013; Tan and Teo, 2000; Limthongchai and
Speece, 2003; Kamarodin et al., 2009; Hussain et al., 2008). These studies confirmed that
trialability affords SMEs the opportunity to assess the usages of new ICTs and e-
commerce in their business activities, which reduces uncertainty about using new
technology and allows discovering the characteristics of ICTs and e-commerce adoption.
Consequently, potential adopters will be more familiar with the usage of ICTs and e-
commerce in their business which supports their decision to adopt ICTs and e-commerce.
Hence, the following hypothesis is presented:
H4: There is a positive and significant relationship between trialability and the
adoption level of e-commerce.

151
4.3.1.5 Observability
Observability is defined by Rogers (2003, p.258) as “the degree to which the results of an
innovation are visible to others”. This means that individuals able to see the results of
others’ adoption of an innovation will affect their own decisions to adopt or dismiss the
innovation. Rogers (2003) found that if individuals are able to see the benefits of an
innovation, they would be more likely to adopt it. In the context of ICTs and e-
commerce, observability provides individuals a great opportunity to adopt ICTs and e-
commerce in their organisation. According to Chong (2006), if SMEs observe the
benefits obtained from e-commerce adoption by competitors, they will develop more
willingness to adopt it.
Since the Internet revolution, e-commerce has enhanced companies’ observability and
visibility to customers, suppliers and competitors. A website allows companies to present
information about their products and profiles around the clock to potential customers and
suppliers (Blackwood,1997, cited in Limthongchai and Speece, 2003). Some researches
argued that the observability attribute has an insignificant effect on SMEs’ willingness to
adopt ICTs and e-commence (Kendall et al, 200; Ramdani and Kawalek, 2009), while
others found a significant positive relationship between observability and e-commerce
adoption (Poorangi et al., 2013; Tan et al., 2009; Limithongchai and Speece, 2003;
Hussin and Noor, 2005; Tan and Eze, 2008; Alam et al., 2008). These researchers
suggested that observability gives adopters the opportunity to observe the benefits and
positive results of e-commerce adoption by other SMEs.
152
According to Rogers (2003), observability is an important factor that is positively
significant for adopting an innovation by individuals. Hence, the following hypothesis is
presented:
H5: There is a positive and significant relationship between observability and the
adoption level of e-commerce.
4.3.2 Organisational Factors
Based on literature review of this study , the organisational factors of this study refers to
the availability and use of the internal resources in terms of technology adoption . The
organisational factors that are of concern to this research are firm size, financial barriers,
and employees IT knowledge. The following sections present each factor and formulates
the relevant hypothesis.
4.3.2.1 Firm Size
Firm size is considered one of the main key predictors of ICTs and e-commerce adoption
and diffusion (Jeyaraj et al., 2006). Prior studies have found that large companies are
more likely to adopt ICTs and e-commerce than smaller ones, as the former have greater
financial resources, knowledge and experience, and ability to tolerate failing
implementations of ICTs and e-commerce than smaller firms (Tornatzsky & Fleischer,
1990; Iacovou et al., 1995; Levenburg et al., 2006; Thong, 1999).
The literature review in this study indicates no agreement on measurement of firm size,
defining firm size in different aspects such as available resources, assets, annual sales,
human capital and number of employees (Zhu and Kraemer, 2005; Khan et al., 2010). In
the context of IT adoption in SMEs, most studies suggest that size is defined according to
153
the number of employees and is considered an important factor affecting ICTs adoption.
They found that larger firms with larger numbers of employees are more likely to adopt
ICTs and e-commerce (Arano and Spong, 2012; Hewitt et al., 2011; Salwani et al. 2009;
Ramdani and Kawalek, 2009; Zhu and Kraemer, 2005).
According to OECD (1999) cited in Awa et al. (2010), larger firms are faster to uptake e-
commerce than smaller ones. OECD (1999) cited in Awa et al. (2010) investigated the
situation in Australia, Denmark, Finland, Japan and Netherland, concluding that 80-86%
of larger firms in these countries had adopted e-commerce, while only 19-57% of smaller
firms there were adopters. Hussein (2009) found that firm size has a significant effect on
travel agencies in Egypt while Salwani et al. (2009) found that firm size in tourism
sectors has no significant effect on e-commerce adoption in Malaysia. Therefore, the
effect of firm size varies in the different studies based on the study’s nature and context.
In Addition, Tan et al. (2010) conducted a study in Malaysia to examine the Internet and
ICTs adoption among manufacturing and services SMEs, concluding that services sectors
as category of SMEs are more willing to adopt e-commerce than manufacturing SMEs
and that the willingness of SMEs in manufacturing and services firms to adopt e-
commerce is greater than that of micro-size firms in the same line of business. Some
other studies measured firm size in terms of available assets, finance and annual revenues
as to examine the effects of size on IT adoption (Henderson et al., 2000; Teo and
Ranganathan, 2004;Teo et al., 2009; Huy et al., 2012). Henderson et al. (2000) measured
firm size by company’s annual sales and found that larger firms that have greater annual
sales are more likely to adopt ICTs and e-commerce than smaller ones. Thus, it can be
clearly seen that firm size significantly affects the decision to adopt ICTs and e-
154
commerce according to all measurement types used. In this research, firm size will be
measured by the number of employees in Jordanian travel agencies. Hence, the following
hypothesis is presented:
H6: There is a positive and significant relationship between travel agency size and the
adoption level of e-commerce.
4.3.2.2 Financial Barriers
Kurnia et al. (2009, p.3) defined financial resources in terms of organisation’s financial
e-readiness that is “the availability of capital to carry EC activity without any financial
burden”. According to Welsh and White’s study (1981), cited in Ghobakhloo et al.
(2011), small businesses have generally limited resources specifically financial. In
addition, studies in information technology found that financial resources are the main
characteristics differentiating between small business and larger ones (Thong ,1999;
Ifinedo, 2011).
This factor has been described in different terms and from different perspectives by
various researchers, many of whom referred this factor to financial resources, while
others described it in terms cost. According to Alzougool and Kurnia (2008, p.43-44),
“when the cost factor is expressed as ‘adoption cost’, it is considered as a barrier, but
when it is expressed as ‘financial commitment’, it is considered as a driver. When the
‘financial resource’ term is used, it is considered a neutral factor (neither a driver nor an
inhibitor”.
For example, financial resources have been identified by many studies as positively and
significantly relevant to SMEs’ adoption of ICTs and e-commerce (Musawa and Wahab,
2012; Iacovou et al., 1995; Alamro and Tarawneh,2011; Scupola ,2009; Bazini et al.,

155
2011), while ‘cost’ or ‘barriers’ were identified by other researchers as a factor negatively
relevant to ICTs and e-commerce adoption in SMEs (Ashrafi and Murtaza, 2008;
Harindranath et al., 2008; Heung, 2003; Hoi et al., 2003; Migiro, 2006; Macgregor and
Vrazalic, 2008; Idisemi et al., 2011).
However, few studies showed that ‘cost’ and ‘financial resources’ are insignificant to the
adoption of ICTs and e-commerce in SMEs.(Tan and Eze, 2008; Ghobakhloo et al., 2011;
Al-Qirim, 2006). Ramsey and McCole (2005) sought to identify and compare the factors
that influence and inhibit adopters and non-adopters of e-commerce in New Zealand
services firms, concluding that a financial resource is insignificant in differentiating
between adopters and non-adopters. However, a later study by Sutanonpaiboon and
Pearson (2008) found that, for both adopters and non-adopters in Thailand SMEs,
financial resources have a significant effect on e-commerce adoption, with more
significance to adopters.
‘Cost’ and ‘financial barriers’ were considered major factors in adopting ICTs and e-
commerce in tourism. Heung (2003) investigated barriers to adopting e-commerce in
Hong Kong travel agencies, identifying the cost of e-commerce implementation as the
most significant inhibitor among the 15 barriers in his study. This finding is consistent
with a study by Buhalis and Deimezi (2003) that identified lack of financial resources as
a major obstacle to implement ICTs and e-commerce in Greek tourism industry. A recent
study by Musawa and Wahab (2012) found that financial resources is the most significant
factor in adopting EDI by Nigerian SMEs rather than other factors such as technological

156
and internal pressures. Based on most previous researches outcomes, the following
hypothesis is presented:
H7: There is a negative relationship between financial barriers and the adoption level
of e-commerce.
4.3.2.3 Employees’ IT Knowledge
IT knowledge by employees is considered an important factor whether as a booster or
barrier to ICTs and e-commerce adoption in SMEs (Wang and Hou, 2012). Individuals’
IT knowledge is obtained through practice and training. According to Guimaraes and
Igbaria (1997), cited in Sabherwal et al. (2006, p.4), a user’s experience in IT indicates
“the duration or level of an individual's prior use of computers and ISs in general”. In
addition, IT training is a very important tool to increase user’s IT knowledge that is
obtained through school, vendors and self-study (Sabherwal et al., 2006).
Therefore, many changes are needed in employees’ knowledge as to use information and
traditional work when technology is being adopted in their organisation (Chanvarasuth,
2010). According to Chanvarasuth (2010, p.743) the “employees’ learning capacity is
also essential in terms of self-efficacy to understand business by IT and understand IT by
business”. Alam and Noor (2009) found employee’s ITs knowledge and skills important
in encouraging organisations to adopt e-commerce. A study by Arendt (2008) found that
the reason of an early stage adoption of e-commerce in most SMEs in Nigeria was
owners/managers’ unwillingness to invest in training their staff and improving their
qualifications which in turn encourages staff to leave for other firms offering better
remuneration and benefits.

157
Most of prior studies found that IT and e-commerce knowledge among employees is a
significant factor in ICTs and e-commerce adoption in SMEs (Huy et al., 2012; Scupola,
2009; Alam and Noor, 2009; Mehrtens et al., 2001; Thong, 1999; Mirchandani and
Motwani, 2003; Heng and Hou, 2012).
However, Sarosa and Underwood (2005), cited in Alzougool and Kurnia (2008), found
that employee’s knowledge of IT and e-commerce is insignificant in adopting ICTs and
e-commerce in Indonesian SMEs. Hussein (2009) found that there is a significant
relationship between employee’s IT knowledge and the level of e-commerce adoption in
travel agencies of Egypt. A study by Heng and Hou (2012) found that employee’ IT
Knowledge is a vital factor influencing travel agencies’ to adopt ICTs and e-commerce,
an outcome that supports most previous studies. Hence, the following hypothesis is
presented:
H8: There is a positive and significant relationship between employees’ IT knowledge
and the adoption level of e-commerce.
4.3.3 Managerial Factors
Based on the literature review in this study, owners/managers have a significant authority
to make the decision of adopting or not adopting e-commerce in their organisations.
According to Awa et al. (2010), different factors for decision makers have a significant
effect on e-commerce adoption in SMEs. They also stressed that firms’ decisions to adopt
e-commerce are based on of decision makers’ perceptions and behaviours. In this study,
managerial factors will be tested according to four managerial characteristics: top
management support, power distance, uncertainly avoidance and managers’ attitude

158
toward e-commerce adoption. The following section presents each factor and formulates
the relevant hypothesis.
4.3.3.1 Top Management Support
Aghaunor et al. (2006, p.8) defined top management support in the context of e-
commerce as: “top management consists of individuals with power and authority to make
strategic decisions; thus they can develop a clear-cut ecommerce vision and strategy
while at the same time sending signals to different parts of the organisation about the
importance of ecommerce”. Masrek et al. (2008) refers to top management support in the
context of technology as the perception of manager toward the role of IT adoption in
business activities in their organisation.
Top management support has been considered an important factor in e-commerce
adoption in SMEs. Teo et al. (2009) stated that top management support is necessary to
overcome the obstacles that face an organisation in adopting new technology. Moreover,
Gover (1993), cited in Sarker (2008), confirmed that the adoption of information
technology will be facilitated by top management support. In addition, Chong et al.
(2009) argued that the possibility to adopt e-commerce in organisation will be higher
when financial and technical resources are supported by top management. Ramdani et al.
(2009) found that top management support is the most significant factor to adopt
electronic enterprise systems in SMEs. Al-Weshah and Al-Zubi (2012) found that top
management support has an important influence on e-commerce adoption among
Jordanian communications sectors. This is also consistent with many other studies of e-
159
commerce adoption in SMEs (Beatty et al., 2001; Shaharudin et al., 2011; Ifinedo, 2011;
Al-Somali, 2011).
Interestingly, Mirchandani and Mowarni (2001) and Teo and Ranganathan (2004) found
that top management support is more significant for adopters of e-commerce than non-
adopters. This finding is confirmed by Al-Somali et al. (2011) who found that top
management support is a crucial factor in differentiating between adopters and non-
adopters of e-commerce in Saudi’s SMEs. Kim (2004) conducted a study to identify the
barriers and solutions related to e-commerce in Korean small-medium tourism enterprises
(SMTEs), finding top management support an important factor in e-commerce adoption.
In addition, Hussein (2009) found a positively significant relationship between top
management support and the level of e-commerce adoption in Egypt travel agencies.
Hence, the following hypothesis is presented:
H9: There is a positive and significant relationship between top management support
and the adoption level of e-commerce.
4.3.3.2 Power Distance
As described in the previous chapter, power distance means the degree of power
distribution in organisations and cultures. In the organisational context, power distance
means the extent to which a relationship between managers and employees produce
decisions within firms. According to Hofstede (1991), the manager who delegates
authority and freedom to his employees, in all levels within the organisation, as to make
decisions and solve problems without permission from superiors provides for a low
power distance. While a high power distance involves a manager acting as a commander
160
and a division of power that is based on hierarchal order, where employees have less or
even no authority to make decisions in the organisation.
According to Filley et al. (1971), cited in Awa et al. (2010, p.13), “group heterofeneity
and performance correlate on accounts that routine problem solving is best handled by a
homogeneous group, and ill-defined, novel problem solving is best handled by
heterogeneous group, where diversity of opinions, knowledge, and backgrounds allow for
a thorough airing and assessment of alternatives”. Therefore, it is important to share
information among superiors and employees, as this leads to a better decision toward
problem solving and other critical business issues in the organisation.
Many empirical studies examined the role of power distance factor in information
technology adoption. For example, Lundgren and Walczuch (2003) examined the effect
of power distance on consumer trust in e-retailing websites in different countries,
concluding that buyers in low power distance societies have more trust to buy online than
buyers in high power distance societies. Yoon (2009) agreed that buyers in cultures
which have low power distance are more influenced to buy online compared to buyers in
high power distance cultures. Chen and McQueen (2008) found e-commerce adoption
and growth to be directly influenced by Chinese SMEs managers in New Zealand who
advocate a high power distance.
Moreover, Almoawai (2011) found that power distance has a slightly significant
moderating effect on e-commerce adoption in Saudi SMEs. The results of another study
by Kollmann et al. (2009) showed that countries with high power distance have
significantly moderated the relationship between organisational readiness and e-business
161
adoption. However, Hasan and Ditsa (1999) found that there is a negative relationship
between power distance and e-commerce adoption, indicating that firms which have a
low power distance are more likely to implement and adopt technology, because
employees, especially IT staff, have better opportunity to convince and advise their
superiors. Hence, the following hypothesis is presented:
H10: There is a negative relationship between power distance and the adoption level of
e-commerce.
4.3.3.3 Uncertainty Avoidance
Uncertainty avoidance indicates individuals and societies ability to tolerate unstructured
and ambiguous situations. According to Hofstede (1991), uncertainty avoidance refers to
cultures or individuals who have a high score in uncertainty avoidance and more anxiety
and fear of unknown events and situations. On the other hand, cultures or individuals who
score low uncertainly avoidance are able to take risks and less reluctant to accept
changes.
Hofstede (1994) measured the uncertainty avoidance factor by the extent to which
employees and managers feel anxious towards adopting new ideas in their work and
prefer to follow rules. According to Leidner and Kayworth (2006, p.366), “IT is
inherently risky, those less comfortable with uncertainty will be less likely to adopt and
use new technologies”. Therefore, taking risks or reluctance to change are crucial factors
particularly when managers decide to adopt a new technology in their organisations
(Yeung et al., 2003; Seyal and Rahman, 2003).
162
Many studies examined the effects of uncertainty avoidance on IT adoption (Al-Hujra et
al, 2011; Lundgren and Walczuch, 2003; Almowai, 2011; Kollmann et al., 2009; Chen
and McQueen, 2008; Gong, 2009; Vatanasakdakul et al., 2004; Al-Noor and Arif, 2011).
Seyal & Rahman (2003) found that SMEs have characteristics that are different from
large enterprises due to the former’s small management teams and customary reluctance
to take risks and avoidance to implement sophisticated systems in their firms, which
makes them slower in IT adoption than larger one and more inclined to adopt lower
levels.
Vatanasakdakul et al. (2004) also found that individuals in Thailand have a high degree
of resistance to change which hinders their adoption of e-commerce. These results
confirm Hofstede’s theory that individuals with high uncertainty avoidance are slower to
adopt new innovations than those with lower score in uncertainty avoidance.
Chen and McQueen (2008), in their study of the factors affecting e-commerce growth
stages in Chinese firms in New Zealand found that managers of SMEs at lower stages of
e-commerce adoption have higher scores in uncertainty avoidance compared with
managers of SMEs at higher stages of e-commerce adoption who have lower scores in
uncertainty avoidance. They also found that managers with lower scores in uncertainty
avoidance are willing to adopt higher stages of e-commerce in their organisations.
Also, Al-Noor and Arif (2011) confirmed that uncertainty has a direct negatively
significant effect on e-commerce adoption in Bangladesh SMEs. However, Kollmann et
al. (2009) found that organisations with high scores of uncertainty avoidance force
managers to make a decision to adopt technology to avoid missing opportunities.
163
Almowai (2011) found that uncertainty avoidance has no significant moderating effect
between technology and e-commerce adoption in Saudi Arabia SMEs.
Bao and Sun (2010) found that managers in early adopters are more likely to take the risk
of adopting e-commerce than late adopters because when the organisation transforms its
traditional operation to e-commerce, it faces many uncertainties such as technologies,
financial recourses and their partners and suppliers.
Lockett and Littler (1997) investigated factors associated with technological innovation
in Banking sectors in the UK. They found that risk factor such security concerns is an
important factor that inhibit to the adoption of technology. Apparently, studies reached
different results indicating either significant or insignificant relationship between
uncertainty avoidance and e-commerce adoption in SMEs. This study is in line with Chen
and McQueen’s (2008) study. Hence, the following hypothesis is presented:
H11: There is a negative relationship between uncertainty avoidance and the adoption
level of e-commerce.
4.3.3.4 Manager’s Attitude toward E-commerce Applications
Applications Social psychologists defined the term “attitude” in different ways but all
leading to the same concept. According to Fishbein and Ajzen (1975, p.6), attitude is “a
learned predisposition to respond in a consistently favorable or unfavorable manner with
respect to a given object”. According to Roger (2003), attitude is a predisposition to
action. Gibson et al. (2000) also agreed that attitude is the degree of feeling or mental
issue whether positive of negative which influences individual’s behaviours and
intentions toward objects, events and situations.

164
Moreover, adoption the of new innovation usually interferes with the current systems and
usual procedure in organisation, which creates hesitation among organisation members to
adopt that innovation. Therefore, managers’ attitudes play a crucial role in adopting or
not adopting the new innovation.According to To and Ngai (2007, p.31), “favorable or
unfavorable managerial attitudes or evaluations about adopting innovations become one
of the major factors which determine whether enterprises will adopt possible
innovations”.
Many studies investigated the effect of manager’s attitude towards e-commence adoption
in SMEs. For example, Mpofu et al. (2009), Seyal & Rahman (2003) and To and Ngai
(2007) found that e-commerce adoption in SMEs is positively and significantly driven by
managers’ attitude toward the use of information technology.
Moreover, Teo et al. (2009) found that managers’ attitude toward using e-commerce and
technology applications was greatly significant in differentiating between adopters and
non-adopters of e-commerce in SMEs. Also, Ramsey and McCole (2005) found that
managers’ negative attitude toward e-commerce applications is a main reason of slower
e-commerce adoption in New Zealand SMEs. On the other hand, some studies found that
managers’ attitude toward using e-commerce applications has weak or insignificant
relationship with e-commerce adoption in SMEs (Abdul Hameed and Counsell, 2012;
Seyal and Rahim, 2006; Chau and Jim, 2002). However, this study will be in line with
most previous studies. Hence, the following hypothesis is presented:
H12: There is a positive and significant relationship between manager’s attitude
toward using e-commerce applications and e-commerce adoption level.
165
4.3.4 Environmental Factors
As mentioned in the reviewed literature, environmental factors play a significant role in
SMEs adoption of e-commerce. Lippert & Govindarajulu (2006, p.148) described the
environmental context of e-commerce adoption: “The environmental context represents
the setting in which the firm conducts business, and influenced by the industry itself, its
competitors, the firm’s ability to access resources supplied by others, and interactions
with the government”. In this study, four variables of environmental factors are
considered: competitive pressure, supplier pressure, customer pressure and government
support.
4.3.4.1 Competitive Pressure
Competitive pressure is defined as “the level of e-commerce capability in the firm
industry as compared to its rivals”, Shaharudin et al. (2011, p.3651). Many studies
confirmed that a competitive pressure is the best external predictor of e-commerce
adoption in SMEs (Zhu et al., 2003; Jeyaraj et al., 2006; Olatokun, 2010).
Sarosa and Zowghi (2003) found that SMEs are influenced to adopt e-commerce by
competitors that have already implemented e-commerce in their business as to keep up
with business changes and avoid being left behind those competitors. Porter and Miller
(1985) found that companies’ use of information technology enables them to outperform
their competitors. Saunders and Hart (1993) assert that the level of IT capability by an
organisation is positively affected by its competitors. Therefore, the probability of SMEs
adoption of IT is significantly dependent on their competitors as to remain in a
competitive position with them.
166
Many studies showed a significant relationship between competitive pressure and e-
commerce adoption (Mpofu et al., 2009; Alamro and Tarawneh, 2011; Zhu et al., 2003;
Almoawi and Mahmood, 2011; Lee and Cheung, 2004; Zu et al., 2006; Iacovou et al.,
2005; Ghobakhloo et al., 2011; Raymond, 2001 ;To and Ngai, 2007).
Moreover, many studies have identified competitive pressure as the most significant
factor in e-commerce adoption by SMEs (Looi, 2005; Sandy and Graham, 2008). Zhu et
al. (2006) conducted a study to investigate the factors affecting e-business adoption in
SMEs in developed and developing countries. They found that competitive pressure has a
significant positive effect particularly in initiation and adoption stage in SMEs.
On the other hand, Scupola (2009), Thong (1999) and Alamro and Tarawneh (2011)
found that competitive pressure is not a very significant factor in e-commerce adoption
by SMEs. Huy et al. (2012) found that competitive pressure is positive and significant in
differentiating between SMEs adopters and non-adopters of e-commerce. Based on the
aforementioned discussion, the following hypothesis is presented:
H13: There is a positive and significant relationship between competitive pressure and
the adoption level of e-commerce.
4.3.4.2 Supplier/Business Partner Pressure
In the context of e-commerce adoption, the supplier pressure is defined as “the power of
the chosen trading partner which has already adopted the e-commerce” (Shaharudin et al.
,2011, p.3651). The supplier or business partner pressure places a major effect on SMEs
adoption of e-commerce (Lin and Lin, 2008). According to Plana et al. (2004), more than
167
30% of medium size enterprises in Chile that have adopted the Internet were driven by
their suppliers’ pressure. In addition, supplier pressure was found a major factor in
predicting SMEs adoption of e-commerce. This is attributed to SMEs’ wish to keep their
business relationship with suppliers or partners that have already adopted e-commerce
through better communication and becoming part of their network. (Riemenschneider et
al., 2003; Ghobakhloo et al., 2011; Jaidee and Beaumont, 2003).
Previous studies have found that supplier or partner pressure has a positive effect on
adopting e-commerce (Scupola, 2003; Heck and Ribbers, 1999; Mehrtens et al., 2001;
Molla and Licker, 2005b; Ifinedo, 2011; Al-Qirim, 2006). Other studies, however, found
that this factor has no significant effect on e-commerce adoption (Alamro and Tarawneh,
2011; Scupola, 2009; Chau and Hui, 2001). A study by Oliveira and Martins (2010b)
found that partner pressure is a dominant factor of e-commerce adoption in organisations.
Hence, the following hypothesis is presented:
H14: There is a positive and significant relationship between supplier/partner
pressure and the adoption level of e-commerce.
4.3.4.3 Customer Pressure
Pavlou and El Sawy (2006) argued that the information system movement and changes in
firms are mainly caused by customers. Customer pressure for e-commerce adoption is
mainly considered as an important factor (Iacovou et al., 1995). Many studies showed
that customer pressure has a significant effect on SMEs adoption of e-commerce
(Grandon and Pearson, 2003; Harrison et al. 1997; Ghobakhloo et al., 2011; Teo et al.,
2003).

168
Kula and Tatoglu (2003), cited in Ifinedo (2011, p.8), argued that “most SMEs innovate
only when they come under pressure from their clients”. While very few studies found
that customer pressure was insignificant (Sparling et al., 2007). Al-Somali et al. (2011)
found that customer pressure is significant in differentiating between adopters and non-
adopters of e-commerce in Saudi SMEs.
Also, a study by Alamro and Tarawneh (2011), investigating the factors affecting e-
commerce adoption in Jordan SMEs and clarifying responses to these factors, found that
customer pressure is the most significant driver of e-commerce adoption by Jordanian
SMEs. Hence, the following hypothesis is presented:
H15: There is a positive and significant relationship between customer pressure and
the adoption level of e-commerce.
4.3.4.4 Government Support
Many studies have investigated the role of government support in affecting SMEs’
decision to adopt information technology, particularly e-commerce. (Tan and Teo, 2000;
Hung et al., 2011; Huy et al., 2012; Hunaiti et al., 2009; Scupola, 2009). In the reviewed
literature, government support in the context of information technology was manifested
in three different ways: policies and legislations, funding and IT infrastructure (Saprikis
and Vlachopoulou, 2012; Hamid, 2009; Gibbs et al., 2003).
Many studies confirmed that governmental factors have positive effects on SMEs
adoption of e-commerce (Thatcher et al., 2006, Seyal et al., 2004; Molla and Licker,
2005). For example, Gibbs et al. (2003) found liberalization of telecommunication and
trade to have the greatest influence on SMEs adoption of e-commerce by making access

169
to the Internet more affordable, while e-commerce legislations did not have a significant
impact. However, Hunaiti et al. (2009) who examined the barriers facing e-commerce
growth in Libya suggested absence of e-commerce legislations there as one of the main
barriers to e-commerce adoption by Libyan SMEs.
In terms of government funding, Thatcher et al. (2006) found lunching training and
educational programme and promoting e-commerce within SMEs to have a great effect
on technology adoption in SMEs. Wang (1999) found that establishing relevant ICT
infrastructure allows IT adoption in Thailand SMEs. Tan and Eze (2008) found that
government support had a positive effect on ICT adoption in Malaysian SMEs. However,
they suggested that the government should optimize its support to promote ICT
particularly e-commerce adoption in SMEs, establish a good IT infrastructure and
facilitate loans to Malaysian SMEs to encourage them adopt ICT.
Alamro and Tarawneh (2011), on the other hand, found that the government role has no
significant effect on Jordanian adoption of SMEs. Yet this finding is inconsistent with Al-
Weshah and Al-Zubi (2012) who investigated the inhibitors and drivers that influence e-
business growth in Jordanian SMEs, suggesting that government should develop new
strategies to increase SMEs adoption of e-business. The government should also develop
advanced ICT infrastructure and enhance e-business awareness among SMEs.
Another study by Scupola (2009) examined factors influencing e-commerce adoption in
Australia and Denmark SMEs, finding that the government’s role in Danish SMEs was
insignificant as opposed to the government’s role in Australian SMEs that was indirectly
significant. The above indicates no agreement on significance/insignificance on

170
government support’s effect on e-commerce adoption. However, based on most studies
identified by in this research, it is assumed that government’s support influences SMEs to
adopt e-commerce. Hence, the following hypothesis is presented:
H16: There is a positive and significant relationship between government support and
the adoption level of e-commerce.
4.3 Conclusion
This chapter presented the developed conceptual framework of e-commerce adoption
level in travel agencies of Jordan, which meets the first objective of this study. This
developed framework is an integration of the Diffusion of Innovation theory by Roger
(1991), Technology-Organisation-Environment model by Tornatzky & Fleisher (1990)
and the inclusion of managerial factors such as top management support, power distance
and uncertainty avoidance, manager’s attitude toward e-commerce adoption This
comprehensive framework may offer a richer theoretical bases and much better
understanding of the factors that facilitate or inhibit Jordanian travel agencies adoption
of e-commerce. The chapter also offered a set of hypotheses for examining these factors’
significance/insignificance in affecting the level of ICTs and e-commerce adoption by
travel agencies. Table (4.4) shows a summary of developed hypothesis in this research.

171
Research Hypothesis Expected Relationship Effect
H1: There is a positive and significant
relationship between relative advantages
and the adoption level of e-commerce.
(+)
H2: There is a positive and significant
relationship between compatibility and the
adoption level of e-commerce..
(+)
H3: There is a negative relationship
between complexity and the adoption level
of e-commerce.
(-)
H4: There is a positive and significant
relationship between trialability and the
adoption level of e-commerce.
(+)
H5: There is a positive and significant
relationship between observability and the
adoption level of e-commerce.
(+)
H6: There is a positive and significant
relationship between travel agency size and
the adoption level of e-commerce.
(+)
H7: There is a negative relationship
between financial barriers and the
adoption level of e-commerce.
(-)
H8: There is a positive and significant
relationship between employees’ IT
knowledge and the adoption level of e-
commerce.
(+)
H9: There is a positive and significant
relationship between top management
support and the adoption level of e-
commerce.
(+)
H10: There is a negative relationship
between power distance and the adoption
level of e-commerce.
(-)
H11: There is a negative relationship
between uncertainty avoidance and the
adoption level of e-commerce.
(-)

172
H12: There is a positive and significant
relationship between manager’s attitude
toward using e-commerce applications and
e-commerce adoption level.
(+)
H13: There is a positive and significant
relationship between competitive pressure
and the adoption level of e-commerce.
(+)
H14: There is a positive and significant
relationship between supplier/partner
pressure and the adoption level of e-
commerce.
(+)
H15: There is a positive and significant
relationship between customer pressure
and the adoption level of e-commerce.
(+)
H16: There is a positive and significant
relationship between government support
and the adoption level of e-commerce.
(+)
Table 4. 4: Summary of Hypotheses and Expected Relationships

173
Chapter Five
Research Methodology
174
5.1 Introduction
The aim of this chapter is to present the research methodology and design. It starts by
discussing the research design, approaches, methods and time horizon, followed by
explaining the sample design, data collection process, target population and ethical
considerations adopted in this study. Also presented is the operationalisation of the
constructs for both dependent and independent variables. This is followed by discussion
of the questionnaire design and the measurement scales. Then, the pilot study, response
rate and non-response bias were presented. Finally, reliability and validity were discussed
as well as the appropriate methods adopted to assess them.
5.2 The Research Methodology
Selecting the appropriate research methodology is important to produce a clear
connection with the research problem and reliable results. Many studies argue that there
is no ideal research methodology, as this depends on the research nature, questions,
objectives and hypotheses. The methodology is also dependent on the available resources
and skills the researcher has for conducting the study (Hair et al., 2006; Saunders et al.,
2012).
The objective of this study is to investigate e-commerce adoption, the current e-
commerce adoption level in travel agencies in Jordan, factors associated with the
adoption level and its impact on business operation in Jordanian travel agencies. The
study starts addressing the research problem by making an extensive review of studies
related to technology and e-commerce adoption, and tourism and technology, presented
in Chapter Two and Chapter Three. The research then moves to develop the conceptual
framework that consists of four dimensions each including several factors aiming to
175
understand the interactive process involving these factors and their relationship to e-
commerce adoption level among travel agencies and it could help to answer the research
questions.
This study is of an explanatory nature as it seeks to investigate the relationships between
variables in order to generate an explanatory knowledge. It explores evidences of cause
and effect relationships between different components, known as dependent and
independent variables (Draper, 2004).
The proposed conceptual framework of this study draws on integration of TOE, DOI and
Hofstede’s Cultural Dimensions. Then, hypotheses were formulated to be tested and
guide the study. Therefore, the explanatory approach of the research satisfies the
requirements of deductive reasoning that is based on the existing theory. Then the
concepts in the developed hypotheses are operationalised as to be measured through
observations, followed by testing the operational hypotheses which leads to confirm or
reject these hypotheses and embark on a conclusion (Greener, 2008).
Neuman (2003) emphasizes that the deductive approach is appropriate for the
quantitative method of data collection, as it tends to test theory and explain the casual
relationships between variables rather than developing a theory, which is rather more
appropriate to the qualitative method. Moreover, Creswell (2012) argues that in
quantitative research, a detailed plan is required prior to collecting and analysing data
because the variables are measured and the hypotheses are developed and remain fixed
throughout the study. Therefore, the quantitative method is appropriate for data collection
and analysis in this study.
176
Easterby-Smith et al. (2008) suggest that selecting the appropriate research method is
very important as it guides researchers to choose the suitable research strategy for
collecting and analysing data. In information systems studies, there is a wide range of
research strategies that could be employed such as experiments, surveys, case studies,
theorem proof, forecasting, simulation, reviews, action research, futures research and
role/game playing (Galliers, 1992). However, the most predominantly strategies used for
empirical information systems studies use survey, experiments, case studies and
interviews (Mingers, 2001).
Choudrie and Dwivedi (2005) extended Mingers study (2001), reviewing the methods
used by prior studies in technology adoption and found that surveys and case studies
methods have been predominantly used in technology adoption by users and
organisations than experiments and interviews methods.
In this study, the survey approach was adopted as the collecting data method for the
following reasons. First, the nature of this study requires a large sample of travel agencies
in order to have reliable results. It was found through sample frame that the large number
of travel agencies in Jordan is located in thirteen cities in Jordan, which makes the survey
approach the most suitable. According to (Ditsa, 2004), survey is the most appropriate
approach to collect a large amount of data, as it increases the study’s validity and
generalizibility. Second, due to time and cost constraints, survey is the most feasible and
economical method in collecting a large amount of data in short time. Third, survey
approach was found the most effective method to study technology acceptance and
diffusion and innovation technology adoption in organisation (Williams et al., 2009).
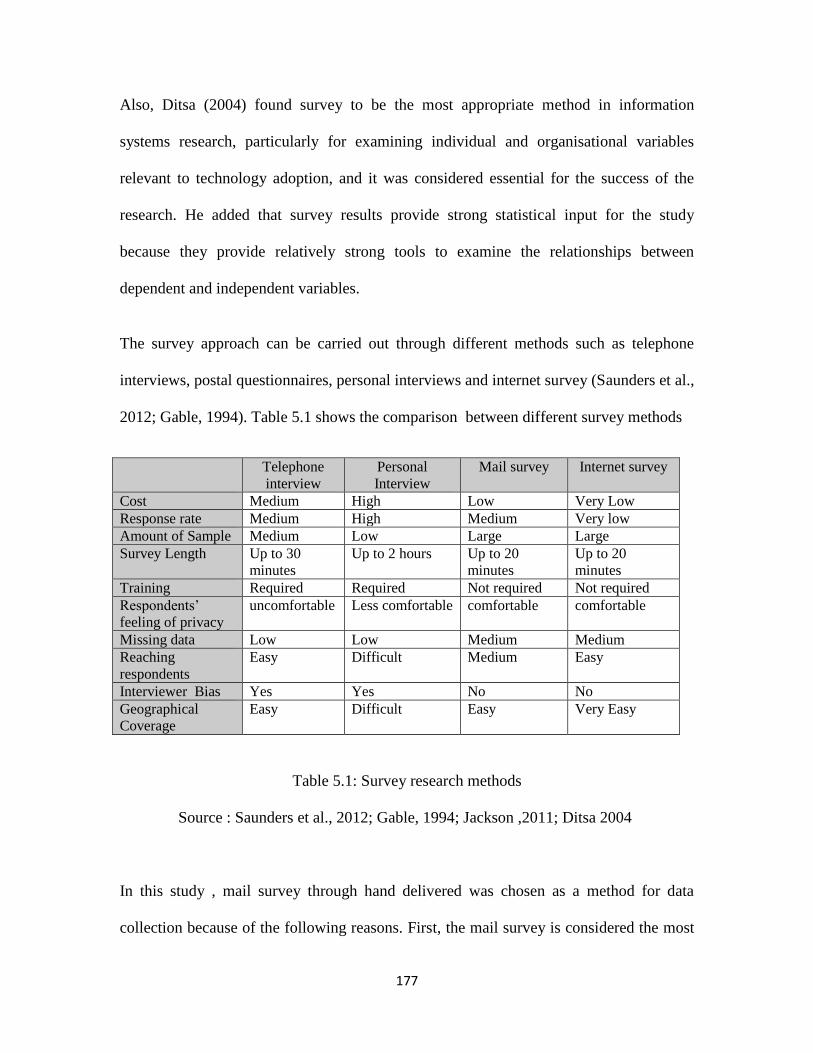
177
Also, Ditsa (2004) found survey to be the most appropriate method in information
systems research, particularly for examining individual and organisational variables
relevant to technology adoption, and it was considered essential for the success of the
research. He added that survey results provide strong statistical input for the study
because they provide relatively strong tools to examine the relationships between
dependent and independent variables.
The survey approach can be carried out through different methods such as telephone
interviews, postal questionnaires, personal interviews and internet survey (Saunders et al.,
2012; Gable, 1994). Table 5.1 shows the comparison between different survey methods
Telephone
interview
Personal
Interview
Mail survey Internet survey
Cost Medium High Low Very Low
Response rate Medium High Medium Very low
Amount of Sample Medium Low Large Large
Survey Length Up to 30
minutes
Up to 2 hours Up to 20
minutes
Up to 20
minutes
Training Required Required Not required Not required
Respondents’
feeling of privacy
uncomfortable Less comfortable comfortable comfortable
Missing data Low Low Medium Medium
Reaching
respondents
Easy Difficult Medium Easy
Interviewer Bias Yes Yes No No
Geographical
Coverage
Easy Difficult Easy Very Easy
Table 5.1: Survey research methods
Source : Saunders et al., 2012; Gable, 1994; Jackson ,2011; Ditsa 2004
In this study , mail survey through hand delivered was chosen as a method for data
collection because of the following reasons. First, the mail survey is considered the most
178
appropriate method to collect original data from large amount of samples, particularly
when samples are widely distributed geographically, in addition to being considered the
most suitable method for describing samples (Babbie, 2010).
Second, mail survey is considered an economical way to collect data from large
populations unlike other methods such as telephone or face-to-face interviews (Dista,
2004; Jackson, 2011; Wrenn et al., 2006). Third, the nature of participants in this study,
being travel agencies owners/mangers, expected to be always busy and very difficult to
be interviewed personally or by telephone, which consumes time and cost.
Finally, although internet survey is considered the most effective, inexpensive and fastest
method of collecting data, internet users are less likely to participate in internet surveys
which leads to a very low response in addition to having a limited screening capability in
reaching participants as participants are supposed to have a valid e-mail address (Jackson,
2011). The current study focuses on all different levels of e-commerce adoption starting
from non-adoption until mature e-commerce adoption; thus online survey is considered a
challenge in reaching non-adopters of e-commerce who do not have an e-mail address.
Mail survey enables them to answer self-administrated questionnaires freely, adequately
and at their own convenience (Dista, 2004; Taylor-Powell and Hermann, 2000; Babbie,
2010). Fourth, mail survey was found appropriate to provide accurate description of
individuals’ attitudes, behaviours toward technology adoption (Dista, 2004). Finally,
there is no interviewer bias in self-administrated mail questionnaires which adds more
accuracy to the outputs.

179
Saunders et al. (2012) argue that time horizon should be considered after determining the
research strategy, as it plays an important role in conducting the research. Time horizon is
classified into two options, cross-sectional and longitudinal studies. In a cross-sectional
study, data analysis is conducted at one specific time while in longitudinal study data is
collected and analysed from the same sample over a long period of time.
This study is cross-sectional in nature, as it aims to identify the factors that influence the
adoption level of e-commerce in travel agencies at a particular time rather than observe
the changes in those factors over time. Moreover, the study has time and cost limitations,
which are not commonly a problem in cross-sectional studies (Babbie, 2010, Penny et al.,
2000; Saunders et al. 2012). The following sections describe the process of developing
and implementing the survey questionnaire of this study.
5.3 Sampling Design
It is almost impossible or even unfeasible to study and collect the data from every
possible member in a given population, which is called a census. Sample is a technique
that allows researchers to collect data from subset of population that is representative of
the larger population. There is a five step sequences for sampling design: target
population, sample frame, sample method, sample unit and finally sample size (Saunders
et al., 2012).
5.3.1 Target Population
Target population is defined as “a group of individuals (or group of organisations) with
some common defining characteristic that researcher can identify study”. Creswell (2012,
p.142). He argues that the study should identify what group to study, which is therefore
180
termed as target population. The study will then choose a subset (sample) of the target
population representative of the whole population. The target population of this study is
owners/managers of travel agencies in Jordan.
5.3.2 Sample Frame
Sample frame is defined as “a listing of the members of the target population that can be
used to create and/or draw the sample” (Bruce et al., 2002, p.161). The purpose of
sampling design is to select from the target population particular participants to be
surveyed. The sample frame is commonly obtained through the yellow pages, telephone
directory, the Internet, government or any other trusted resources related to the target
population of the research. The sample frame is considered a crucial part in sampling
design as it has reflections on the cost and quality of the survey.
The sample frame of this study targets Jordanian travel agencies. Therefore, Jordan
Society of Tourism and Travel Agents (JSTA) was used as the sample frame of this
study, as JSTA stands as “the representative body of the travel and tourism industry in
Jordan, forming the only association of travel agents in the Hashemite Kingdom of
Jordan” (JSTA, 2012). JSTA’s directory lists all travel agencies in Jordan, including type,
address, telephone numbers and e-mail if applicable (see Appendix A-1). The directory
shows there are 631 travel agencies distributed in 13 cities. The JSTA database shows
that the majority (82%) of travel agencies in Jordan are Type B, followed by Types A and
Type C, constituting about 13% and 5%, respectively.
For this study, travel agencies of all three types are the sample frame while the target
population is owners/mangers of Jordanian travel agencies. It was also found in JSTA’s

181
list that 128 travel agencies are organizers of religious tours, namely Hajj and Umrah
tours, which entails dealing with one country, ‘Saudi Arabia. As this kind of agencies has
characteristics different from ordinary agencies, they were excluded from the survey.
Another 81 travel agencies were also excluded from the survey because they have
branches or affiliations with other travel agencies and are managed by one decision
maker. Finally, 9 more agencies were excluded because they only offer worldwide
shipments. Therefore, the total number of the sample unit considered as the target
population for this study was 413 travel agencies.
In addition, it was important to ensure that the information provided by JSTA was
accurate and complete (Saunders et al., 2012). For that purpose, the travel agencies list
offered by the Jordanian Ministry of Tourism & Antiquities was checked for verification.
5.3.3 Sample Method
The sampling method is used to identify the unit of analysis and the way to obtain
information from the target sample (Bruce et al., 2002; Saunders et al., 2012). This
method was also used to reduce any possible errors in the sampling process (Davis,
2004). The sampling method is of two types, probability and non-probability sampling. In
the probability sampling, each individual of the population has an equal possibility of
being selected from the desired sample. There are four main methods of probability
sampling: simple random sampling, systematic sampling, stratified sampling and cluster
sampling (Saunders et al., 2012; Bruce et al., 2002).
182
As for the non-probability sampling, it is “any sampling techniques that do not involve
the selection of sample elements by chance” (Bruce, 2002, p.165). Non-probability
sampling, therefore, does not include in its sample any probability or random selection,
which differentiates it from probability sampling. According to Saunders et al. (2012),
there are four main methods of non-probability sampling: convenience sampling,
snowball sampling, judgment sampling and quota sampling.
Selecting the sampling method, according to Hair et al. (2006), depends on the nature of
study, availability of samples and time and financial resources. In this study, probability
sampling was selected for certain reasons. First, as this study aims to generalize the
findings derived from a sample that is representative of the population, probability
sampling is preferred because it provides more accurate and generalizibility than non-
probability sampling. Second, with the support of the Jordan Tourism Board in collecting
data, all samples are available to participate in the survey. Finally, this research has time
and budget constraints (Sharma, 2008; Hair et al, 2006).
Regarding the method used, the simple random method was selected to represent the
whole target population, being the Jordanian travel agencies. The heterogeneity of this
population makes the simple random method the most appropriate option for selecting
samples in this study (Saunders et al., 2012). Online random generator
‘www.random.org’ was used as a technique to obtain the required sample size that is
representative of the population (Sharma, 2008).
183
5.3.4 Sampling Unit
Dodge (2003, p.360) defined the sampling unit as “one of the units into which an
aggregate is divided or regarded as divided for the purpose of sampling, each unit being
regarded as individual and indivisible when the selection is made”. Therefore, it is
essential to identify the sampling unit, as the data will be collected from that ‘identified’
sampling unit in order to allocate the research problem (Davis, 2004). In this study,
managers/owners of travel agencies were identified as the sample unit. As described in
literature reviewed in this study, owners/mangers of travel agencies are the key persons
who make the decision to adopt or dismiss ICTs and ecommerce in SMEs.
5.3.5 Sample Size
Determining the appropriate sample size is very important in any empirical research, as
inadequate sample size or even too large size may affect the quality of the research
(Bartlett et al., 2001). Many researchers, however, suggested that the larger the sample
size the less probable to produce errors in generalizing findings to the population; and a
larger size is more likely to be normally distributed when analysing the resultant data
(Creswell, 2012; Saunders et al., 2012). Therefore, the sample size was based on this
study’s criterion and the accuracy sought.
Many formulas have been used to determine the appropriate sample size based on many
factors such as population size, margin error and confidence level. Krejcie & Morgan
(1970) suggested a formula (shown in Figure 5.1) that has been widely used in
information technology studies to guide determining the sample size, particularly in
survey research (Bartlett et al., 2001).
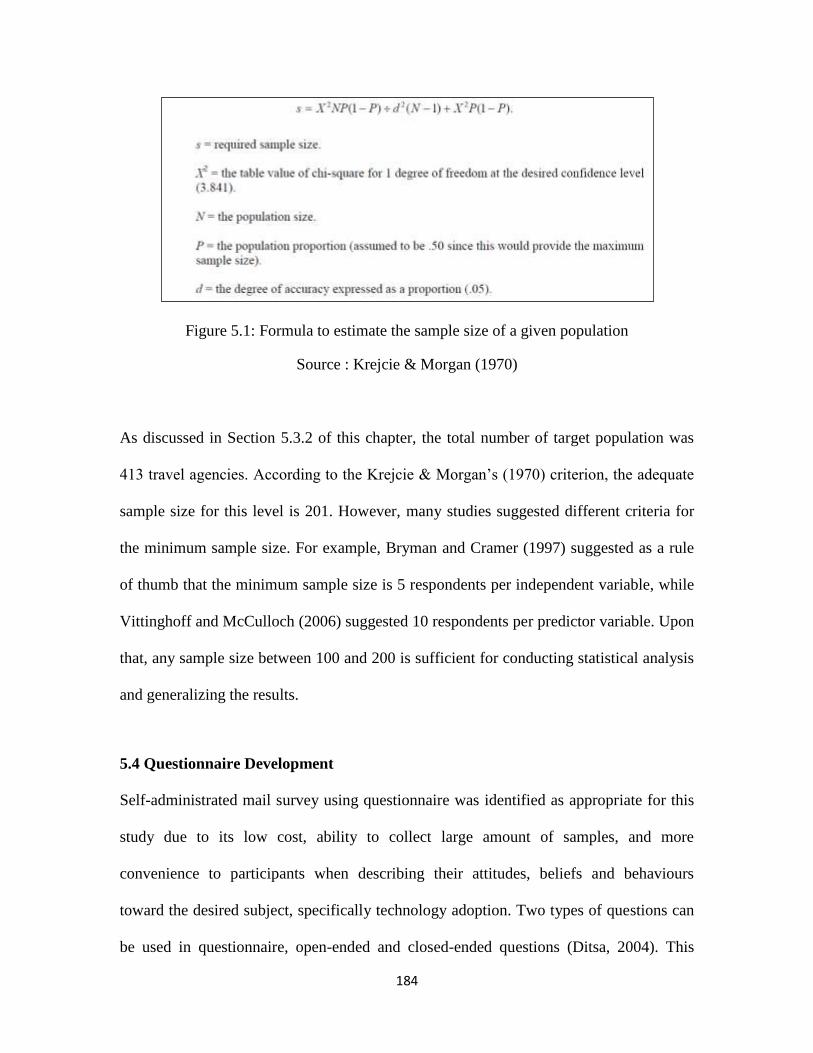
184
Figure 5.1: Formula to estimate the sample size of a given population
Source : Krejcie & Morgan (1970)
As discussed in Section 5.3.2 of this chapter, the total number of target population was
413 travel agencies. According to the Krejcie & Morgan’s (1970) criterion, the adequate
sample size for this level is 201. However, many studies suggested different criteria for
the minimum sample size. For example, Bryman and Cramer (1997) suggested as a rule
of thumb that the minimum sample size is 5 respondents per independent variable, while
Vittinghoff and McCulloch (2006) suggested 10 respondents per predictor variable. Upon
that, any sample size between 100 and 200 is sufficient for conducting statistical analysis
and generalizing the results.
5.4 Questionnaire Development
Self-administrated mail survey using questionnaire was identified as appropriate for this
study due to its low cost, ability to collect large amount of samples, and more
convenience to participants when describing their attitudes, beliefs and behaviours
toward the desired subject, specifically technology adoption. Two types of questions can
be used in questionnaire, open-ended and closed-ended questions (Ditsa, 2004). This

185
research employed close-ended, self-administrated questionnaire, as the target
participants are owners/managers of travel agencies, usually considered busy and hard to
be interviewed in person.
Moreover, the answers of closed-ended questions can be transferred directly into
computerized database, as they are much easier to be tabulated, coded and analysed in
computer system. Finally, closed-ended questions are more flexible and easy in obtaining
sensitive answers than open-ended questions (Ditsa, 2004; Bruce et al., 2002).
The developed questionnaire was adapted from the literature review and from the
proposed conceptual framework of this study. It consists of three parts. The first part
includes general information of travel agency and participants. The questions here
revolve around agency’s age and type and the level of respondent’s education. The
second part concerns the current level of e-commerce implemented by the agency, while
the third part addresses the factors that may affect managers’ decision on the adoption
level of e-commerce. Questions of the third part are related to attributes of innovations,
organisational factors, managerial factors and environmental factors. The following
section discusses in more details the operationalisation of constructs in the questionnaire.
5.5 Operationalisation of Constructs
Ary et al. (2002, p.36) defines operationalisation as “ascribes meaning to a construct by
specifying operations that researchers must perform to measure or manipulate the
construct”. It helps to create a best definition of constructs to be measured in the study.
Ary et al. (2002) stated that researchers should identify variables from a variety of
resources that represent the best description to approach the research problem. They

186
added that the operationalisation of constructs helps researchers to minimize the gap
between the theoretical and the observable. In this research, each variable was identified
from the literature review, where the independent variables were identified by ‘attributes
of innovation, organisational factors, managerial factors and environmental factors’ while
dependent variables were identified by ‘e-commerce adoption level’. These variables
should be defined in a meaningful and measurable manner. For this reason, these
variables are translated through operationalisation.
Creswell (2012) stated that it is much better, faster and easier to borrow constructs if they
are already measured by previous studies. Appendix C-1 shows the concepts and
operational definition and measurement for each construct and the source of each defined
construct.
5.6 Questionnaire Design and Measurement
Measuring and designing questionnaire is very important and the researcher must be
careful when designing, composing and revising the questionnaire questions and layout;
and a pilot testing must be conducted to ensure that the developed questionnaire has the
appropriate format and the participants can easily understand the topic and questions
(Bruce et al., 2002). Saunders et al. (2012) stated that a well-designed questionnaire leads
to maximizing the response rate and the validity and reliability of the collected data. The
questionnaire in this study consists of three parts including 21 questions. The questions
content, length and clarity are the main factors that affect the response rate.

187
Therefore, all questions of the survey were carefully designed and revised in order to
increase the response rate. A cover letter was attached to questionnaire describing the
purpose of the study and including contact details for both the researcher and the
university. The questionnaire also explained that all data and company information to be
provided by participants shall be confidential and only used for the purpose of this study.
In addition, the questionnaire was supported with an official letter from the Jordan
Tourism Board to add more credibility to its purpose. Descriptions were provided at the
header of each part of the questionnaire to ensure obtaining as accurate answers from the
participants as possible. On the last page of the questionnaire, the respondents were
thanked for their contribution to the study and asked to make any further comments they
may have. In addition, the respondents had the option to request a copy of the study’s
results.
As the participants were owners/managers of travel agencies, a suitable technique was
employed to draw the needed data through the questionnaire. Part 1 (Q1 to Q4) of the
questionnaire was designed to capture the demographic profile of respondents such as
travel agency’s age and type and the respondent’s age and educational level. Part 2 (Q5)
addressed dependent variable, including a question about the current level of e-
commerce adoption in the agency. The questions in parts 1 and 2 were measured by
nominal scale to classify and categorize the observed data using the multichotomous
questions type. Part 3 (Q6–Q21) addressed independent variables, questions about
attributes of innovation, organisational factors, managerial factors and environmental
factors. Part 3 used interval scale questions represented by the five-point Likert scale

188
questions with score 1 (being strongly disagree) to score 5 (being strongly agree), except
Q12 about travel agency’s size, which was measured by nominal scale using the
multichotomous questions type to identify the number of employees currently working in
the agency.
The five-point Likert scale was implemented to measure the independent variables for
many reasons. First, this scale is suitable for measuring dissimilarity in attitudes and
perceptions among individuals (Sekaran, 2003). Second, it is believed that this scale is
the most common questioning format to obtain opinion data (Saunders et al, 2012). Third,
this scale is considered easy and fast for understanding and answering question by
respondents. Finally, the answers of the Likert scale can be easily coded and managed in
many statistical techniques (Malhotra, 2010).
The questions included in the questionnaire were originally written in English language
and the survey took place in Jordan where the official language is Arabic. Therefore, it
was very important to have an accurate translation of the questions to make them
understandable to the respondents (Saunders et al., 2012). The researcher carefully
followed the translation method of questionnaires as suggested by Usunier (1998), cited
in Saunders et al. (2012, p.383, 385), who suggested that when translating the
questionnaire the researcher should pay attention to the following:
1. Lexical Meaning: The precise meaning of individual words.
2. Idiomatic Meaning: The meanings of a group of words as natural to a native
speaker and not deducible from those of the individual words.
3. Experiential Meaning: The equivalence of meanings of words and sentences for
people in their everyday experiences.
189
4. Grammar and Syntax: The correct use of language, including the ordering of
words and phrases to create well-formed sentences.
Usunier (1998) also suggested a parallel translation technique to ensure an accurately-
worded translation of the questionnaire. The translated questionnaire was independently
reviewed by two linguistic experts, both specialized in English to Arabic translation. That
was followed by comparing the two revised versions to ensure the accuracy and clarity of
the translation equivalence including syntax and grammar. Feedback and comments were
considered and updated into the final Arabic version. Appendices A-2 and A-3 show the
Arabic translation and English original of the questionnaire, respectively.
The layout of questionnaire is very important to maximize the number of willing
respondents (Saunders et al., 2012). Therefore, the questionnaire layout was designed to
make reading the questions by respondents easy. In addition, a colour text and template
were designed to be attractive and encourage the respondents to fill the questionnaire. As
a lengthy questionnaire may negatively affect response rate, it was designed to take no
more than twenty minutes for completion.
5.7 Ethical Considerations in current Study
Ethics in research should be evidently present which entails the necessity of
understanding the fundamentality of an ethical research and its influence before
conducting the study particularly if it involves communications such as a survey with
respondents like companies or participants (Polonsky and Waller, 2005).

190
The researcher should also be careful during communication with respondents not to
offend them unintentionally, either psychologically, financially, socially or otherwise.
The researcher followed several agreed ethical research standards to avoid offending
respondents as well as to protect researcher, supervisor and institution against any future
legal issues that may be claimed by respondents.
All research activities conducted in Cardiff Metropolitan University must be submitted
directly to the School Ethics Committee within the school framework. This study
followed the Business School Framework for ethics approval after which the application
was submitted to School Ethics Committee at Cardiff Metropolitan University and
approval was issued for the research study. Pursuing the Business School Framework for
ethics approval, the cover letter of the questionnaire explained the purpose of study and
assured that respondents are not to be harmed physically, socially and psychologically.
The study also ensured avoiding any actions that may negatively affect other researchers.
Also included in the cover letter, the confidentially and anonymity of the respondents and
a clear statement that they have right to withdraw their participations at any time. Finally,
the participants had the choice to obtain the results of the study if they wish and were
asked to fill their contact details including e-mails and fax.
5.8 Pilot Study
Pilot study is considered an important technique as it increases success of the study and
improves the efficiency and accuracy of the data collected and the meaningfulness of the
results. In addition, a pilot test helps to assess the validity of questionnaire’s questions
and reliability of the data collected (Saunders, 2012). Moreover, it provides the

191
researcher with early warning signs of any weaknesses of the proposed research such as
the inappropriateness of methods or tools used.
Bell et al. (2013) suggest conducting a pilot study over small numbers of target
respondents to provide feedback on the level of questions difficulty and instructions
clarity, time needed and any other comments the respondents may have, which would
improve the questionnaire. Previous studies do not agree on the minimum number of
participants that should be involved in a pilot study. For example, Baker (1994) argued
that 10-20% of the research sample size is sufficient number for a pilot study, while Fink
(2003b) cited in Saunders et al. (2012) suggested a minimum of ten respondents.
For this research, fifteen travel agents were asked to be involved in completing a pilot
questionnaire. They were informed it was a trial version of the questionnaire and asked to
be critical, give notes on any unclear question and/or wording and mention their opinions
about the layout of questionnaire, completion time and any comments and suggestions for
improving the questionnaire. Only eleven respondents agreed to participate in the survey
and give their comments and suggestions.
The pilot led to further amendments in a number of questions wording, the layout and the
questionnaire length. In addressing wording and clarity, some questions were reworded
and made more clear and understandable by participants. For example, most of
participants did not understand the word “subordinates” in its Arabic translation as
which has a different denotation from the original English. Therefore, it was ”التابعين“
replaced with the Arabic equivalent of “employees” “الموظفين”. Secondly, as participants
were not familiar with the term e-commence, it was clarified in the cover letter.
192
Regarding the layout, the font size used that had been in the pilot questionnaire 10 of
Times New Roman type was changed in the final version to 12 of the same type to make
it more legible.
Regarding the questionnaire length, the participants took 15-20 minutes to complete it;
most suggested reducing the number of pages, initially being 17 single pages. Upon that,
the questionnaire was redesigned and printed into duplex A4 format totalling 6 pages.
Based on the pilot study outcomes and feedback and changes made accordingly, the final
version of questionnaire was produced as shown in Appendix A-3 and collecting data
from participants was ready using that version.
5.9 Administering the Questionnaire
Data collection started in June 2013 continuing for five months. This period included
distribution and collection of the questionnaires from target samples and follow-up.
Personal delivery and collection were used for data collection, as the postal system in
Jordan is not reliable enough and property numbering unclear. Although personal
delivery and collection is more expensive in data collection than the postal system, it has
many advantages such as saving time, needlessness for follow-up and increased response
rate (Saunders et al., 2012).
Three hundred travel agents in Jordan were contacted and asked to participate in the
survey, Two hundred seventy one of whom agreed to participate. Refusals to participate
were explained by lack of interest in the study, being too busy to complete the survey or
unwillingness to provide any sensitive information about agency, although it was
explained that all provided data will be confidential and used only for the research.
193
In addition to the researcher, four persons were involved in delivering and collecting
questionnaire forms due to the considerable number of travel agents involved and their
distribution in different geographical areas.
The questionnaire forms were personally delivered to each owner/manager of travel
agencies during which the purpose of study was explained and the confidentiality and
anonymity of the information to be provided emphasized. The forms were filled
independently by respondents without any interference by the data collection team.
The total numbers of collected questionnaire forms were 247 out of 271. Forty one of the
returned forms were discarded for not being useful for analysis for several reasons. First,
thirteen forms included many questions left blank and many items with missing answers.
Second, eight forms were filled by inappropriate people due to a busy manager
transferring it to an employee. Third, twenty forms were found outliers, which are
considered unusable for analysis. Therefore, the total number of useful questionnaires for
this study was 206.
5.10 Response Rate
McCarty (2003, p.396) stated that “Response rates were originally intended as a measure
of the extent to which the data represent the responses of the entire population, that is, as
an indicator of nonresponse bias”. Saunders et al. (2012) said that obtaining a highly
representative sample from population increases the accuracy and quality of the research.
There are many equations to calculate the response rate. According to Shih and Fan
(2007) response rate calculation should be standardized in order to make compression
across different studies. Therefore, this study adopted the RR5 formula of the American
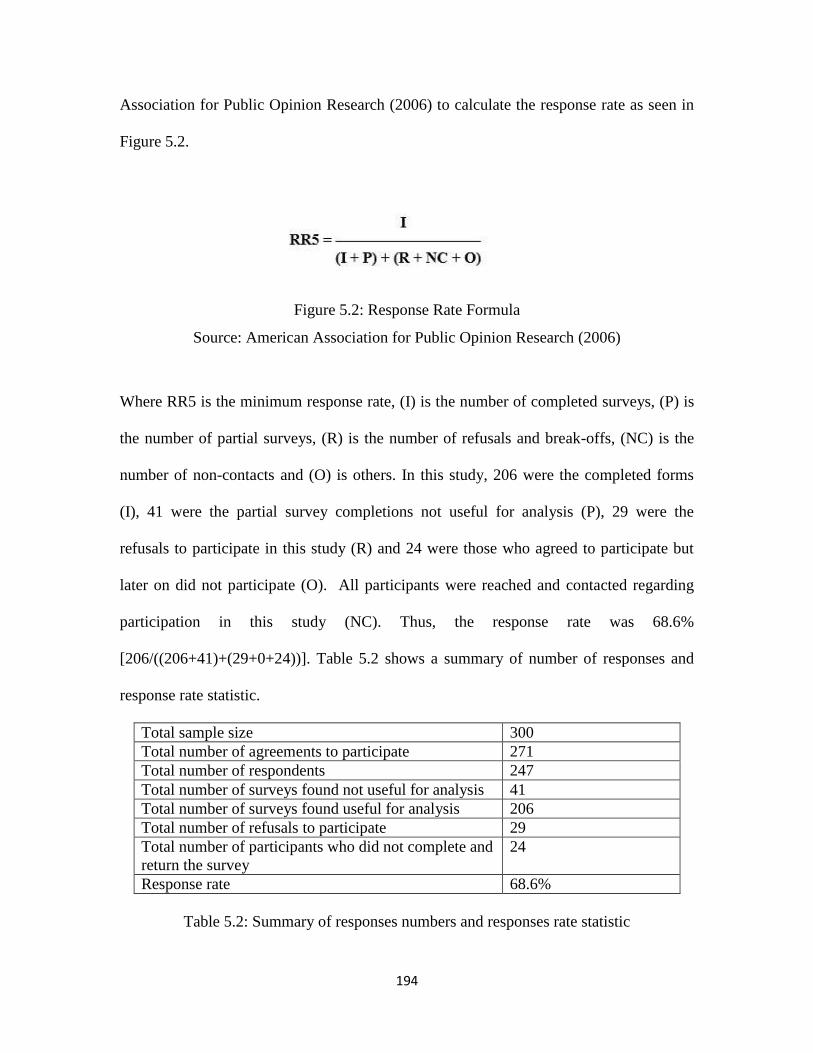
194
Association for Public Opinion Research (2006) to calculate the response rate as seen in
Figure 5.2.
Figure 5.2: Response Rate Formula
Source: American Association for Public Opinion Research (2006)
Where RR5 is the minimum response rate, (I) is the number of completed surveys, (P) is
the number of partial surveys, (R) is the number of refusals and break-offs, (NC) is the
number of non-contacts and (O) is others. In this study, 206 were the completed forms
(I), 41 were the partial survey completions not useful for analysis (P), 29 were the
refusals to participate in this study (R) and 24 were those who agreed to participate but
later on did not participate (O). All participants were reached and contacted regarding
participation in this study (NC). Thus, the response rate was 68.6%
[206/((206+41)+(29+0+24))]. Table 5.2 shows a summary of number of responses and
response rate statistic.
Total sample size 300
Total number of agreements to participate 271
Total number of respondents 247
Total number of surveys found not useful for analysis 41
Total number of surveys found useful for analysis 206
Total number of refusals to participate 29
Total number of participants who did not complete and
return the survey
24
Response rate 68.6%
Table 5.2: Summary of responses numbers and responses rate statistic
195
According to Baruch (1999), cited in Saunders et al. (2012), a response rate of 35% is
acceptable for most of academic studies in managements and organisation’s
representative. The response rate in this study is higher than other similar studies in
developing countries, particularly Arab countries. For example, Al-Somali and Clegg
(2011) used the same method in data collection from 450 owners/managers of SMEs in
Saudi Arabia, receiving only 202 usable forms, thus scoring 44.88% response rate.
Al-Hudhaif and Alkubeyyer (2011) distributed 200 questionnaire forms for studying the
factors affecting e-commerce adoption in Saudi SMEs, obtaining 46% response rate. In
Sri Lanka, seeking to study the barriers of e-commerce adoption by SMEs,
Kapurubandara and Lawson (2007) only obtained 19% response rate of the 625
respondents who were owners/managers of SMEs. In Malaysia, Tan et al. (2009) studied
the factors affecting e-commerce adoption level, receiving only 27% useable forms.
Therefore, the 68.6% response rate obtained for this study is quite acceptable and
reasonable.
5.11 Non-Response Bias
Vogt and Johnson (2011, p.256) defined non-response bias as: “The kind of bias that
occurs when some subjects choose not to respond to particular questions and when the
non-responders are different in some way from those who do respond”. Malhotra and
Birks (2000) argued that there is a negative relationship between response rate and non-
response rate. Upon that, a high response rate indicates a low rate of non-response bias.
However, response rate is not always an essential or sufficient indicator of non-response
bias. Examining non-response bias is very important to research in terms of study results

196
validity. There are two forms of non-response bias. The first is ‘item non-response’
which occurs when the respondents fail to answer some questions in the survey, while the
second, ‘unit non-response’, occurs when the respondents fail to answer the survey for
many reasons such as refusal to participate, having been not contacted or inability to
respond (Saunders et al. (2012).
Non-respondents can be different from respondents in terms of demographic profiles
such as age, experience, educational level, income, gender, race and region. Gall et al.
(2003) suggest that non-response bias must be investigated when the response rate is less
than 80%. Having a response rate of 68.6% in this study made a non-response bias
investigation necessary prior to data analysis as to ensure the study’s validity, quality and
generalizability. Chapter Six discusses in details the assessment of non-response bias of
the study.
5.12 Data Quality
It is essential to verify the quality of collected data prior to data analysis and findings
generalization in order to ensure data consistency and accurate measuring of the survey
concept as what is intended to measure. Reliability and validity are the two quality
criteria taken into consideration. The following sections present explanation of each
criterion and how it was measured in this study.
5.12.1 Reliability
Reliability is defined as “the extent to which an experiment, test, or any measurement
procedure yields the same results on repeated trial” (Carmines and Zeller, 1979, p.11).

197
This means that the measurement scale from an instrument is stable and consistent across
time. Examining reliability is very important to ensure high score of stability and
consistency of the research and avoid any errors of measurement (Golafshani, 2003).
In this study, Cronbach’s alpha technique was applied to check data reliability, as this is
considered the most common practice in measuring the homogeneity of scale based on
multiple-items scale of the construct which was used in this research (Cresswell, 2012;
Tavakol and Dennick, 2011). The composite reliability method was also employed in this
his study in order to verify the reliability of the constructs. The following chapter
discusses in details the assessment of reliability.
5.12.2 Validity
Validity means “the extent to which any measuring instrument measures what is intended
to measure” (Carmines and Zeller, 1979, p.17). This means that a validly test is used to
determine if the instrument truly reflects what it is intended to measure. The test also
confirms the research quality. In this study, the validity was checked by examining the
content validity and construct validity.
Content validity is defined as “the degree to which set of items, taken together, constitute
an adequate operational definition of a construct” (Polit and Beck, 2006, p.490). The
content validity was attained through extensive literature review relating to e-commerce
adoption, and all constructs in the questionnaire were measured through
operationalisation that was adopted from previous studies. Secondly, parallel translation
was used to translate the questionnaire into Arabic prior to the pilot test in order to make
sure that the questionnaire constructs were accurately and meaningfully translated. Also,

198
a pilot study was conducted and feedback on the questionnaire obtained from
participants, leading to some changes in questions wording and layout of the
questionnaire.
Construct validity, which concerns the degree to which and how well the instrument
measures a theoretical construct, includes two subtypes, discriminate and convergent
validity. Convergent validity is established when two or more instruments measuring the
same concept are positively correlated, while discriminate validity is used when two or
more instruments measuring different concepts are of low correlation (Saunder et al.,
2008). In this study, the two subtypes of construct validity have been assessed through
factor analysis, which will be further discussed in Chapter Six.
5.13 Chapter Summary
This chapter presented the research design approach and research methods relevant to
information systems researches. The chapter then presented and justified the research
methodology which corresponds to the nature of this study. The research design is of an
exploratory nature accompanied by the deductive approach, which in turn is tied with
quantitative method of data collection in order to test the hypothesis derived from the
study’s conceptual framework.
The research strategy and sampling issues are then presented followed by a discussion of
the operationalisation of constructs and measurement scale of this study. The study also
adopted personal delivery and collection of survey and used self-administrated
questionnaires to obtain data from a large number of owners/managers of Jordanian travel
agencies.

199
Moreover, the ethical considerations and time horizon with respect to data collection
were presented. Finally, the pilot study, response rate, non-response bias and validity and
reliability were discussed and established. The next chapter will present the method used
for data analysis as well as the results of the hypotheses testing.

200
Chapter Six
Data Analysis
201
6.1 Introduction
The previous chapter outlined the methodology used for this study. The questionnaire
was developed based on the conceptual framework in Chapter 4. This chapter addresses
in details the statistical procedures and presents the results of data analysis obtained
through the researcher’s survey. This chapter opens with the pre-analysis process that
explains the data preparation, coding, cleaning and screening.
Then, it moves to evaluate non-response bias, followed by addressing and explaining the
outliers. Next, multicollinearity was monitored and examined and a normality test was
performed and discussed. The chapter then moves to the reliability and validity of the
research variables, starting with initial reliability in order to measure the internal
consistency of the items. An exploratory factor analysis was then conducted to evaluate
the validity of the retained items of reliability. Next, the retained items that resulted from
exploratory factor analysis were evaluated for internal consistency to insure their
reliability.
The narrative analysis of demographic profile that includes respondents’ profile,
companies’ profile and e-commerce information is then presented, followed by an
analysis of the research constructs and an independent t-test to examine the difference
between the different levels of e-commerce adoption to the businesses of travel agencies.
Finally, an inferential statistical technique using multinomial regression analysis was
applied to test the hypotheses presented in the research model. For the purpose of this
study, the Statistical Package for Social since (SPSS) software version 20.0 was chosen.

202
6.2 Data Preparation and Collection Process
The data collection process faced many challenges. As discussed in earlier chapters,
many of the target respondents were unwilling to participate in the survey due to time
constraints, lack of interest, unwillingness to provide ‘sensitive’ information about their
travel agencies. This resulted in obtaining only 247 completed questionnaire forms out of
the 300 distributed. Each collected form was reviewed for completeness necessary to the
analysis. After data cleaning and screening a total of 206 of the completed forms were
found useable for analysis, resulting in 68.6% response rate. The following section
discusses pre-analysis data processing.
6.3 Pre-analysis Data Processing
After completion of data collection, it was very important to have them examined through
conversion into a form suitable for data analysis to ensure their integrity, significance,
accuracy and representability.
6.3.1 Data Coding
Coding refers to “the process of assigning numerals or other symbols to answers so that
responses can be put into a limited number of categories or classes” (Kothari, 2004,
p.123). This means that each category of answers in the questionnaire will be allocated a
specific code that will help the researcher transfer it into a form identifiable by computer
and make subsequent analysis easier (Saunders et al. 2012). In this study, the continuous
response scale (questions 6-12 and 13-21) used a pre-coded technique by allocating
numbers for each question, with No. 1 meaning ‘strongly disagree’ and No. 5 ‘strongly
agree’, which facilitated respondents task. The questions 1-5 and 12 were entered into

203
the coding scheme prior to being entered into the computer software. The collected data
were entered into SPSS and the codes were labelled for each variable as to illustrate the
meaning of codes.
6.3.2 Data Cleaning and Screening
Data cleaning and screening was conducted in this study before any further statistical
analyses to ensure that the entered data are free of any coding error or missing data or any
inappropriate responses. This process was very important to ensure that the entered data
includes only accurate values that are essential for examining the casual theory.
Descriptive statistics, and frequency tables were employed using SPSS to identify the
missing data in range values and inconsistent responses (Saunders et al, 2012; Paul,
2005).
Missing data must be considered in order to decide how to deal with it. According to
Dong and Peng (2013) the missing data can be at two levels: Unit level and item level.
Unit level refers to respondents who fail to take or entirely refuse the survey, while item
level refers to those who return the survey with incomplete answers. Item level occurs for
two main reasons. First, the respondent may fail to answer part(s) of the questionnaire in
case of lack of information, unwillingness to answer some ‘sensitive’ questions or
missing to answer some questions. Second, the respondent may not have time to finish
answering the questionnaire (Saunders et al., 2012).
Also , Saunders et al.(2012) defined three patterns of missingness : Missing Completely
At Random (MCAR), Missing At Random (MAR) and Missing Not At Random
(NMAR). MCAR occurs when the missing values for a variable are not correlated with
204
that variable itself or any other variable of interest. As for MAR, it occurs when the
missing values for a variable are not correlated with that variable itself but with other
variables. In NMAR, the missing values for a variable are correlated with that variable
itself and with other variables. Therefore, it was essential for this study to address the
missing data problem to avoid embarking on false findings, compromised internal
validity leading to loss of statistical power and external invalidity when research results
are to be generalized.
There are different approaches to address the missing data such as list-wise deletion, pair-
wise deletion, mean substitution, estimation of conditional means, imputation using the
expectation maximization algorithm (EM), multiple imputation and regression-based
imputation (Dong and Peng 2013; Paul, 2005; Schlomer, 2010).
In this study, the percentage of missing data was identified before conducting further
statistical inferences. Out of the 247 responses, 40 had missing data ranging between
0.05% and 34% of the survey. In average, this accounts for approximately 16% of all
responses. Excluding such forms was considered inappropriate for this research because
it reduces the samples size which in turn affects the generalizability of data findings.
Although, there was no agreement in related literature about the acceptable percentage of
missing data, many studies agree that 10% is considered acceptable (Bennett, 2001;
Schlomer et al., 2010).
Therefore, 13 forms were excluded for exceeding the 10% of missing data while 27 were
retained due to not exceeding that percentage. Table 6.1 shows the percentage of missing
data for the item(s) in each question in the survey.
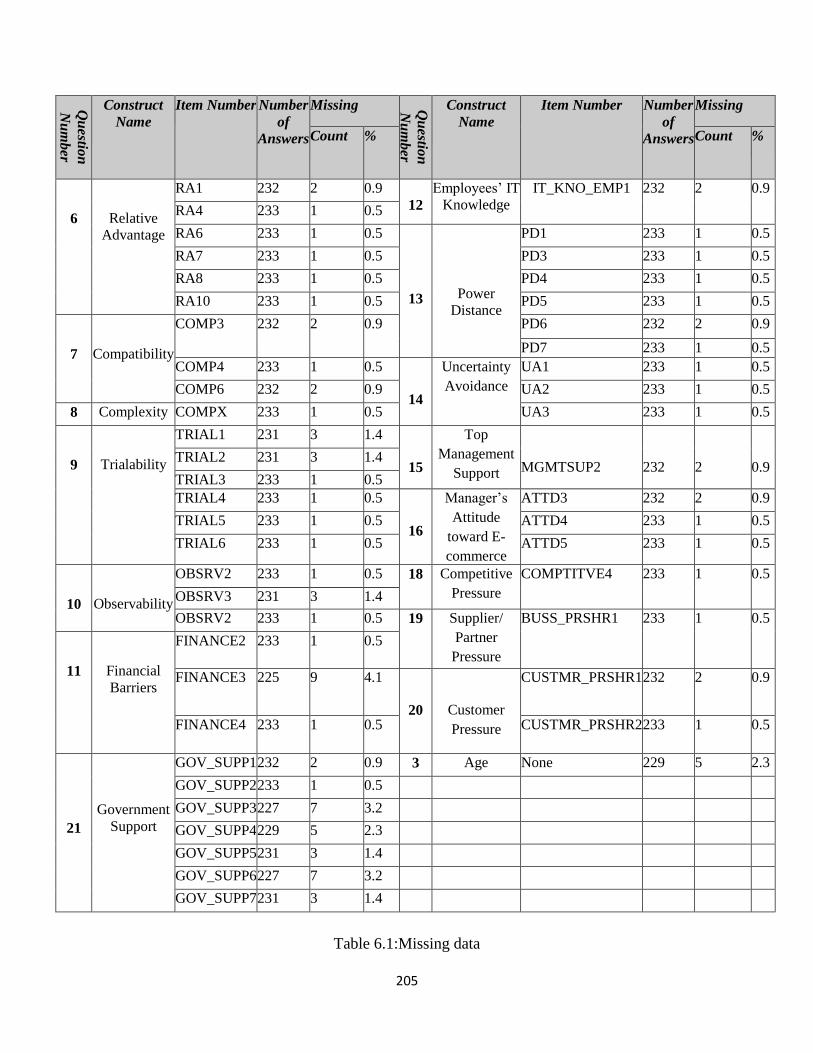
205
Qu
estion
Nu
mb
er
Construct
Name
Item Number Number
of
Answers
Missing Qu
estion
Nu
mb
er
Construct
Name
Item Number Number
of
Answers
Missing
Count % Count %
6
Relative
Advantage
RA1 232 2 0.9
12
Employees’ IT
Knowledge
IT_KNO_EMP1 232 2 0.9
RA4 233 1 0.5
RA6 233 1 0.5
13
Power
Distance
PD1
233 1 0.5
RA7 233 1 0.5 PD3
233 1 0.5
RA8 233 1 0.5 PD4
233 1 0.5
RA10 233 1 0.5 PD5
233 1 0.5
7
Compatibility
COMP3 232 2 0.9 PD6
232 2 0.9
PD7 233 1 0.5
COMP4 233 1 0.5
14
Uncertainty
Avoidance
UA1 233 1 0.5
COMP6 232 2 0.9 UA2 233 1 0.5
8 Complexity COMPX 233 1 0.5 UA3 233 1 0.5
9
Trialability
TRIAL1 231 3 1.4
15
Top
Management
Support
MGMTSUP2
232
2
0.9 TRIAL2 231 3 1.4
TRIAL3 233 1 0.5
TRIAL4 233 1 0.5
16
Manager’s
Attitude
toward E-
commerce
ATTD3 232 2 0.9
TRIAL5 233 1 0.5 ATTD4 233 1 0.5
TRIAL6 233 1 0.5 ATTD5 233 1 0.5
10
Observability
OBSRV2 233 1 0.5 18
Competitive
Pressure
COMPTITVE4 233 1 0.5
OBSRV3 231 3 1.4
OBSRV2 233 1 0.5 19 Supplier/
Partner
Pressure
BUSS_PRSHR1 233 1 0.5
11
Financial
Barriers
FINANCE2
233
1
0.5
FINANCE3 225 9 4.1
20
Customer
Pressure
CUSTMR_PRSHR1 232 2 0.9
FINANCE4 233 1 0.5 CUSTMR_PRSHR2 233 1 0.5
21
Government
Support
GOV_SUPP1 232 2 0.9 3 Age None 229 5 2.3
GOV_SUPP2 233 1 0.5
GOV_SUPP3 227 7 3.2
GOV_SUPP4 229 5 2.3
GOV_SUPP5 231 3 1.4
GOV_SUPP6 227 7 3.2
GOV_SUPP7 231 3 1.4
Table 6.1:Missing data
206
Leah et al. (2007, p.1) argue that “trying to avoid the deletion of a case because of a
missing data point can be conducted, but implementing a naïve missing data method can
result in distorted estimates and incorrect conclusions”. Therefore, identifying the pattern
of missing data is a necessity decide an appropriate approach to replace the missing data.
Little (1998) used the statistical test based chi-square to determine whether values are
‘missing completely at random’. Little’s MCAR assumes the missing data of null
hypothesis is MCAR and the P value >= .05; otherwise it may be MAR or MANR. The
results of this study show that Little's MCAR Chi-Square = 1977.475, DF = 1989 with P
value = .568, which confirms that the missing data is MCAR.
As a result , Expectation Maximization method (EM) was applied to replace the missing
data values because of the following reasons. First , the EM method uses a recursive
process with two steps to impute the missing data, the expectation step and the
maximization step. In the expectation step, the missing and non-missing values are
identified using parameters (including means, variance and covariance) then the missing
values are substituted by their predicted scores using regression methods. In the
maximization step, the predicted scores of the missing values are computed by the
maximum likelihood function to obtain new values for parameters. This process is
iterated with the expectation step until convergence is attained. Secondly, the EM
provides an efficient and unbiased estimate of parameter particularly when the type of
missing data is MACR, which makes it useful for conducting the exploratory factor
analysis and internal consistency procedure (Schlomer 2010; Paul, 2005; Bennett, 2001).
207
6.3.3 Assessing Non-response Bias
As discussed in Chapter five , the non-response bias is important to be addressed
especially that the response rate in this study was 68.6%. This bias occurs when
respondents in the sample refuse to participate in the survey due to certain characteristics
they may have. The existence of non-response bias is prone to result in a major problem
in the study because it would generate bias in the sample which undermines its validity
and quality (Linder et al., 2001; Ygge and Arnetz, 2004).
Non-response bias was evaluated by comparing the responses of early and late
respondents. Lindner et al. (2001) suggested that the early and late comparison
respondents’ is the most widely useful method in quantitative research to identify non-
response bias. They argue that if there are no significant differences between early and
late respondents, the study results can be generalized to the population.
This study considered the first 40 responses as early responses because they responded
fast without any further efforts by the researcher, while the last 40 responses are
considered late responses due to efforts exerted to obtain them. Independent t-test was
used to compare early and late respondents. The results are presented in appendix (B-1)
showing that (p>0.05) in all variables, which indicates that there were no significant
differences between early and late respondents.
6.3.4 Outliers
Tabachnick and Fidell (2013, p.72) defined outliers as “A case with such an extreme
value on one variable (a univariate outlier) or such a strange combination of scores on
two or more variables (a multivariate outlier) that it distorts statistics”. Therefore, the

208
outlier can lead to incorrect effect on the statistical analysis, reducing the statistical power
of the study in different ways such as increasing error variance.
Tabachnick and Fidell (2013) presented four main reasons for outliers’ occurrence. First
,it occurs from incorrect data entry .Second ,it occurs from including and considering
missing data as actual data. The third reason is when the sample is not representative of
the concerned population, i.e. a sampling error. Finally, an outlier occurs when including
values of a variable are out of the range of normal distribution. In this study, the first,
second and third types of outliers were treated and corrected as discussed earlier in this
chapter; whereas the fourth type will be treated by detecting univariate and multivariate
outliers, as discussed later in this section. Tabachnick and Fidell (2013) stated that
univariate and multivariate outliers can be present among dichotomous and continuous
variables.
In this study, all relevant variables are measured by continuous variable questions using
the 5-point Likert scale, which necessitates examining univariate and multivariate
outliers. Tabachnick and Fidell (2013) recommended examining univariate outlier by
either statistical criteria through calculating the standard score (z score) for each variable
or by visual inspection using graphical method such as histograms and box plots. This
study examined univariate outlier by converting each data variables to z score.
Tabachnick and Fidell (2013) suggested that potential outliers appear if the absolute data
values of z score are greater than ±3.29. The results showed in Appendix B-2 that 16
cases were beyond z score with most extreme positive value of z score being 4.503 and
most extreme negative value of z score being -5.284. Out of the 16 cases, 7 were found
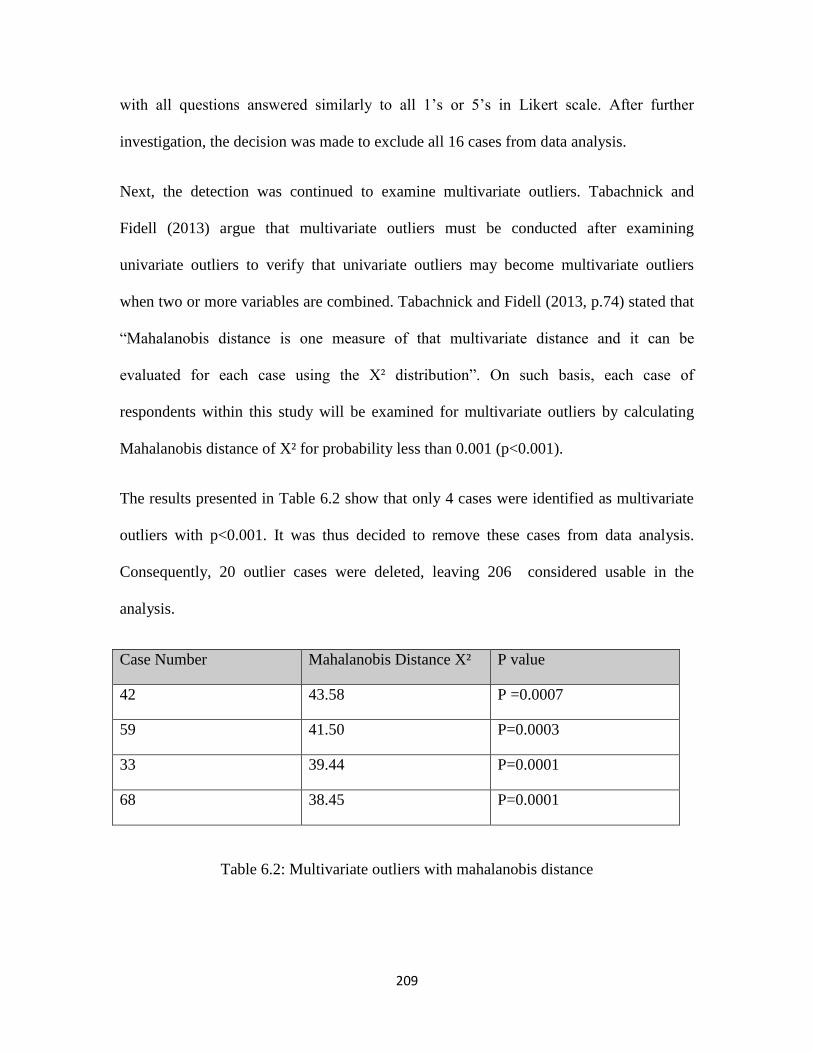
209
with all questions answered similarly to all 1’s or 5’s in Likert scale. After further
investigation, the decision was made to exclude all 16 cases from data analysis.
Next, the detection was continued to examine multivariate outliers. Tabachnick and
Fidell (2013) argue that multivariate outliers must be conducted after examining
univariate outliers to verify that univariate outliers may become multivariate outliers
when two or more variables are combined. Tabachnick and Fidell (2013, p.74) stated that
“Mahalanobis distance is one measure of that multivariate distance and it can be
evaluated for each case using the X² distribution”. On such basis, each case of
respondents within this study will be examined for multivariate outliers by calculating
Mahalanobis distance of X² for probability less than 0.001 (p<0.001).
The results presented in Table 6.2 show that only 4 cases were identified as multivariate
outliers with p<0.001. It was thus decided to remove these cases from data analysis.
Consequently, 20 outlier cases were deleted, leaving 206 considered usable in the
analysis.
Case Number Mahalanobis Distance X² P value
42 43.58 P =0.0007
59 41.50 P=0.0003
33 39.44 P=0.0001
68 38.45 P=0.0001
Table 6.2: Multivariate outliers with mahalanobis distance
210
6.3.5 Normality Test
Normality assessment is an important prerequisite for any further analysis particularly in
the multivariate analysis that was conducted in this study. According to Field (2009,
p.134) “normality assumes that the independent variables and the sampling distribution is
normally distributed”. This means assuming that all values in each item of the individual
variables are normally distributed.
Normality test is important in any study that conducts regression analysis. Non-normality
will severely reduce the statistical power of the study. In addition, it undermines the
efficiency of standard errors which may lead to wrong conclusions (Tabachnick and
Fidell, 2013). However, non-normality can be treated through transformation
mathematical methods such as square root, logarithm and inverse. The deviance form
of normality is examined either graphically or statistically. Graphically, deviance is
assessed by histogram or normality plot. Statistically, skewness and kurtosis are used to
assess normality (Tabachnick and Fidel, 2013; Field, 2009).
According to Tabachnick and Fidell (2013) skewness refers to the symmetry of
distribution while kurtosis refers to the peakedness of distribution. Tabachnick and Fidell
(2013, p.79) proposed that “skewed variable is a variable whose mean is not in the centre
of the distribution”. The skewed variable could be either positive or negative. Positive
skew occurs when the tail is longer on the positive side rather than negative side of the
peak, while the negative skew happens when the tail is longer on the negative side of the
peak. Positive kurtosis occurs when values of kurtosis are above zero, displaying heavy
tails and too peaked to normal distribution, while the negative kurtosis occurs when
values are below zero with flat and light tails.

211
Tabachnick and Fidell (2013) explained that normal distribution occurs when the values
of skewness and kurtosis are equal to zero. However, there is no clear agreement in
researches on the absolute values of skewness and kurtosis indexes. Many previous
studies agreed that absolute values of skweness index greater than 3.0 are considered
extremely skewed (Kline, 1993, Chou & Bentler, 1995; Hoyle, 1995). According to
Kline, (1998) and Hoyle (1995) absolute values of kurtosis greater than 10.0 are
considered a problem and values greater than 20.0 an extremely serious problem.
In this study, all independent variables were examined for normality using skewness and
kurtosis methods as shown in Table 6.3. The table shows that all items were normally
distributed with lowest registered values of skewness and kurtosis being -1.566 and -
1.164, respectively, while the highest were 1.418 and 3.909, respectively.
Con
struct
Nam
e
Item
Nu
mber
Mea
n
Sta
ndard
Devia
tion
Skew
ness
Ku
rtosis
Con
struct
Nam
e
Item
Nu
mber
Mea
n
Sta
ndard
Devia
tion
Skew
ness
Ku
rtosis
Rela
tive A
dv
an
tag
e
RA1 3.2701 .99770 -.298 -.423
Co
mp
atib
ility
COMP1 3.4660 1.02947 -.599 -.467
RA2 3.6699 .99156 -.995 .435 COMP2 3.6408 .91975 -1.124 1.161
RA3 3.6650 .94711 -.814 .329 COMP3 3.2147 1.10399 -.280 -1.086
RA4 3.4564 1.16688 -.489 -.703 COMP4 3.3500 .97473 -.497 -.438
RA5 3.9854 .62842 -.704 1.814 COMP5 3.0437 1.16996 -.289 -.937
RA6 3.8659 .85448 -1.110 1.267 COMP6 3.6195 .85620 -1.108 1.314
RA7 3.7661 .91175 -1.041 1.222 COMP7 3.4709 .98606 -1.090 .256
RA8 3.2788 1.11511 -.143 -.989 Co
mp
lexity
COMPX1 2.7645 1.15787 .358 -.797
RA9 3.3641 1.09476 -.223 -.805 COMPX2 3.1699 1.16672 -.299 -1.120
RA10 3.6776 1.01395 -.847 .088 COMPX3 2.8301 1.11542 .213 -1.119
Tria
lab
ility
TRIAL1 2.3002 .91978 .242 -.584 COMPX4 2.6699 1.18436 .398 -.970
TRIAL2 2.3450 .89589 .209 -.681 Ob
serv
ab
ility
OBSRV1 4.0874 .65677 -.823 1.990
TRIAL3 2.9218 .91740 -.190 -.648 OBSRV2 4.1143 .63063 -.793 2.293
TRIAL4 3.5955 .88360 -.746 .379 OBSRV3 4.0354 .61628 -.858 2.914
TRIAL5 3.1327 .80900 -.293 .165 OBSRV4 3.3738 1.06889 -.502 -.333
TRIAL6 2.8503 .86220 .109 -.201 OBSRV5 3.8001 .87352 -1.153 1.630
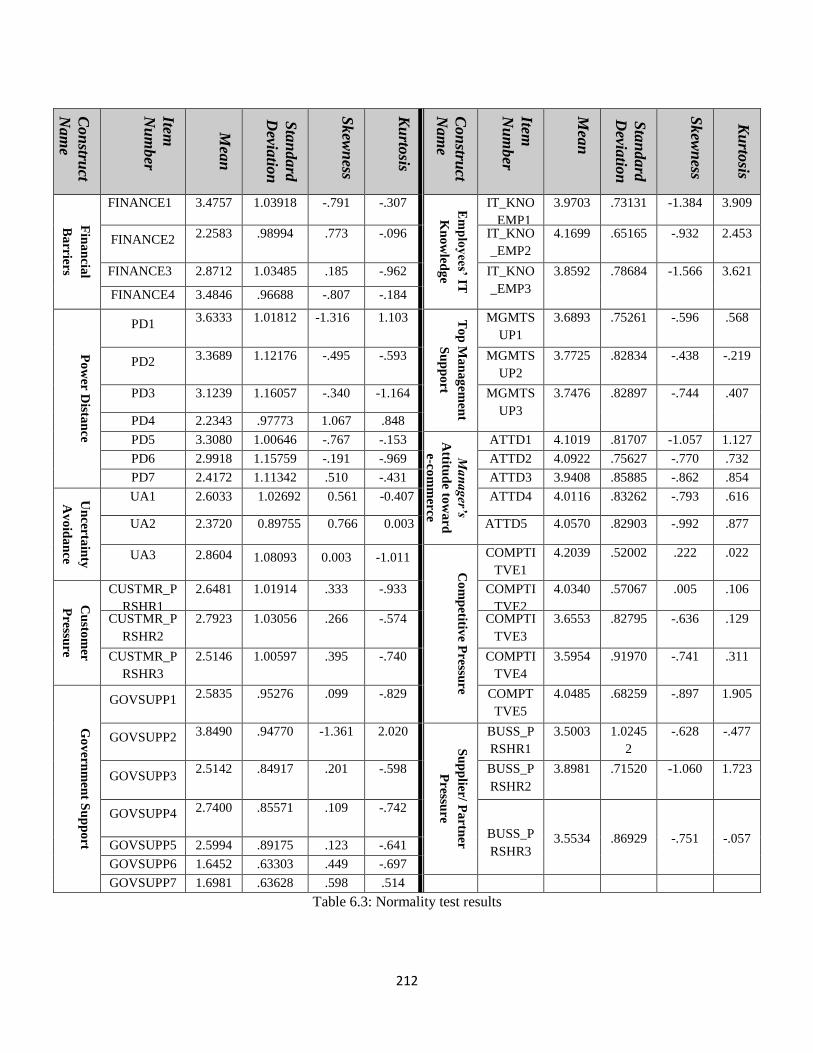
212
Table 6.3: Normality test results
Con
struct
Nam
e
Item
Nu
mber
Mea
n
Sta
ndard
Devia
tion
Skew
ness
Ku
rtosis
Con
struct
Nam
e
Item
Nu
mber
Mea
n
Sta
ndard
Devia
tion
Skew
ness
Ku
rtosis
Fin
an
cial
Ba
rriers
FINANCE1 3.4757 1.03918 -.791 -.307 Em
plo
yee
s’ IT
Kn
ow
ledg
e
IT_KNO
_EMP1
3.9703 .73131 -1.384 3.909
FINANCE2 2.2583 .98994 .773 -.096 IT_KNO
_EMP2
4.1699 .65165 -.932 2.453
FINANCE3 2.8712 1.03485 .185 -.962 IT_KNO
_EMP3
3.8592 .78684 -1.566 3.621
FINANCE4 3.4846 .96688 -.807 -.184
Po
wer
Dista
nce
PD1 3.6333 1.01812 -1.316 1.103 T
op
Ma
na
gem
ent
Su
pp
ort
MGMTS
UP1
3.6893 .75261 -.596 .568
PD2 3.3689 1.12176 -.495 -.593 MGMTS
UP2
3.7725 .82834 -.438 -.219
PD3 3.1239 1.16057 -.340 -1.164 MGMTS
UP3
3.7476 .82897 -.744 .407
PD4 2.2343 .97773 1.067 .848
PD5 3.3080 1.00646 -.767 -.153
Ma
na
ger’s
Attitu
de to
wa
rd
e-com
mer
ce
ATTD1 4.1019 .81707 -1.057 1.127
PD6 2.9918 1.15759 -.191 -.969 ATTD2 4.0922 .75627 -.770 .732
PD7 2.4172 1.11342 .510 -.431 ATTD3 3.9408 .85885 -.862 .854
Un
certa
inty
Av
oid
an
ce
UA1 2.6033 1.02692 0.561 -0.407 ATTD4 4.0116 .83262 -.793 .616
UA2 2.3720 0.89755 0.766 0.003 ATTD5 4.0570 .82903 -.992 .877
UA3 2.8604 1.08093 0.003 -1.011
Co
mp
etitive P
ressu
re
COMPTI
TVE1
4.2039 .52002 .222 .022
Cu
stom
er
Pre
ssure
CUSTMR_P
RSHR1
2.6481 1.01914 .333 -.933 COMPTI
TVE2
4.0340 .57067 .005 .106
CUSTMR_P
RSHR2
2.7923 1.03056 .266 -.574 COMPTI
TVE3
3.6553 .82795 -.636 .129
CUSTMR_P
RSHR3
2.5146 1.00597 .395 -.740 COMPTI
TVE4
3.5954 .91970 -.741 .311
Go
ver
nm
ent S
up
po
rt
GOVSUPP1 2.5835 .95276 .099 -.829 COMPT
TVE5
4.0485 .68259 -.897 1.905
GOVSUPP2 3.8490 .94770 -1.361 2.020
Su
pp
lier/ Pa
rtner
Pre
ssure
BUSS_P
RSHR1
3.5003 1.0245
2
-.628 -.477
GOVSUPP3 2.5142 .84917 .201 -.598 BUSS_P
RSHR2
3.8981 .71520 -1.060 1.723
GOVSUPP4 2.7400 .85571 .109 -.742
BUSS_P
RSHR3
3.5534
.86929
-.751
-.057 GOVSUPP5 2.5994 .89175 .123 -.641
GOVSUPP6 1.6452 .63303 .449 -.697
GOVSUPP7 1.6981 .63628 .598 .514
213
6.3.6 Multicollinearity and Singularity
Multicollinearity occurs when two or more independent variables (0.9 and above) are
highly correlated with each other, while singularity occurs when the independent
variables are perfectly correlated and one of these variables is a combination of two or
more other independent variables. Examining multicollinearity prior to analysis is highly
recommended because its occurrence poses a problem to the research .The occurrence of
multicollinearity increases the variances of regression, making it very difficult to predict
which of the independent variables accounts for variance R2 in the dependent variable
(Paul and Bhar, 2006; Tabachnick and Fidell, 2013).
Related literature presents three common methods used for determining the presence of
multicollinearity. The first is the correlation matrix, used to examine correlation among
independents variables. A squared correlation below 0.90 indicates no problem with
multicollinearity (Tabachnick and Fidell, 2013). The other two methods are used to
examine multicollinearity in the context of regression analysis by assessing two methods,
Tolerance Value and Variance Inflation Factor (VIF), respectively (Hair et al, 2010,
Kleinbaum et al, 1998).
The tolerance value indicates the amount of variance in the independent variable that
can’t be explained by another independent variable. The tolerance value is estimated by
1-R2 of each independent variable. Tolerance values range from 0 to 1, with values less
than 0.10 indicate the presence of multicollinearity. Conversely, the variance inflation
factor (VIF) is reciprocal of tolerance (1/tolerance). High variability of VIF (greater than
10) indicates multicollinearity (Meyers et al., 2013b; Hair et al., 2010).

214
In this study multicollinearity was assessed using Pearson’s Correlation method to
examine correlation between independent variables, as shown in Appendix B-3. The
results show that none of correlations between independent variables were above 0.90;
thus there was no apparent problem with multicollinearity. Lee (2009) recommended
conducting the Variance Inflation Factor (VIF) in addition to correlation matrix in order
to provide additional evidence that no multicollinearity is present. Therefore and for
further assessment, this study also conducted VIF and tolerance value to assess
multicollinearity within the context of multiple regressions. The results of collinearity are
shown in Table 6.4, with VIF ranging between 1.2 and 3.054 and tolerance level between
0.327 and 0.833, indicating that none of VIFs exceeded 10 and none of tolerance values
was below 0.10. The results, therefore, confirmed that variables were not highly collinear
and did not constitute a problem to regression analysis in this study.
Variables Collinearity Statistics
Tolerance VIF
Relative Advantage .327 3.054
Compatibility .356 2.809
Complexity .531 1.884
Trialability .739 1.353
Observability .438 2.282
Financial Barriers .833 1.200
Employees’ IT Knowledge .821 1.218
Top Management Support .739 1.354
Power Distance .477 2.096
Uncertainty Avoidance .450 2.220
Manger’s Attitude toward E-
commerce
.373 2.678
Competitive Advantage .508 1.969
Business Pressure .523 1.913
Customer Pressure .573 1.745
Government support .789 1.267
Travel Agency Size .726 1.377
Table 6.4: Tolerance value and variance inflation factor results
215
6.4 Reliability and Validity Analysis
Reliability and validity are important concept in research and should be measured to
ensure that the instruments in the survey are valid and reliable which leads to a better
quality data. The following sections show in details the measurement of these two
concepts.
6.4.1 Initial Reliability Assessment
Reliability refers to the stability of measurement instrument through time. In the current
study, the constructs in the survey were measured by multiple item scale. Therefore,
internal consistency was used to measure the reliability of this study through measuring
correlations between items within a scale of a given construct. Cronbach’s alpha was
used to calculate the internal reliability or homogeneity formed of a multiple items scale
(Creswell, 2012). Cronbach’s alpha value ranges between 0 and 1, where coefficient
alpha is closer to 1, being the greater degree of items’ reliability.
However, there has been no agreement among researchers on an acceptable cut-off value
for reliability. Many considered that value 0.7 or above highly acceptable (Pallant, 2007;
Field, 2009) while some have confirmed the value of 0.6 as fair (Moss et al., 1998;Yong
et al., 2007) and others argued that a value above 0.5 is poor but acceptable (Nunnally,
1978; Bowling,1997). George and Mallery (2003, P.231) presented a rule of thumb for
Cronbach’s alpha categorizing reliability values, as shown in Table 6.5 :
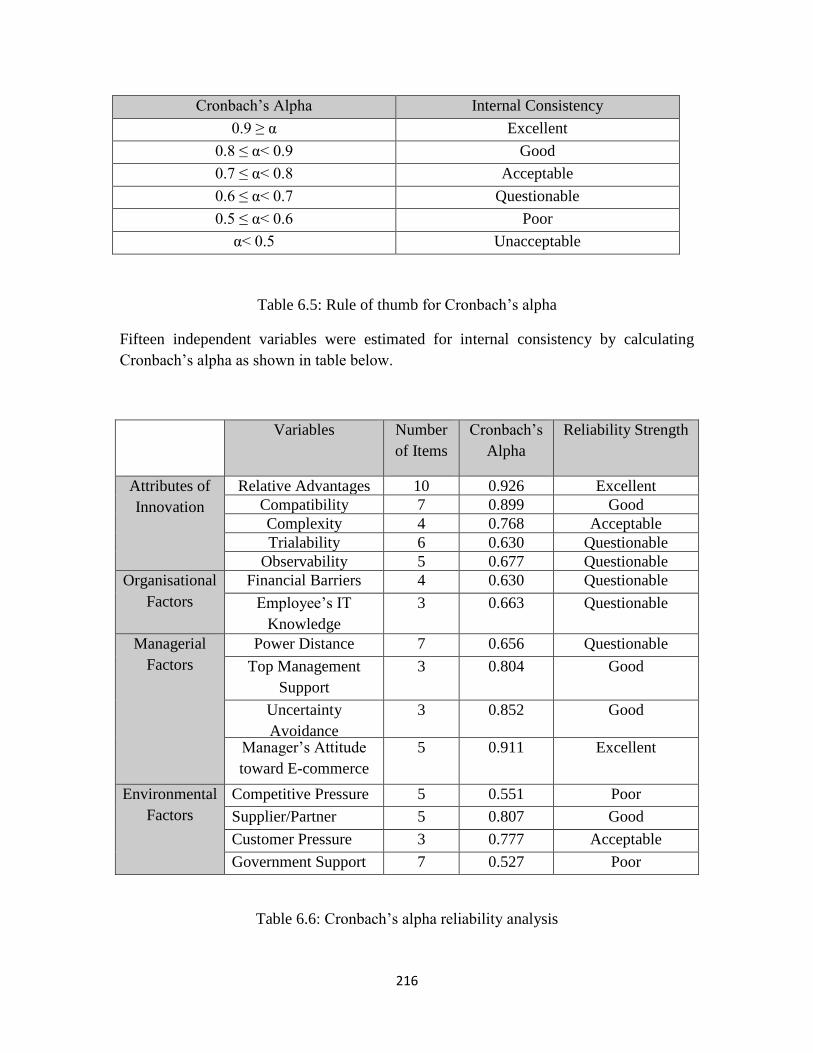
216
Cronbach’s Alpha
Internal Consistency
0.9 ≥ α Excellent
0.8 ≤ α< 0.9 Good
0.7 ≤ α< 0.8 Acceptable
0.6 ≤ α< 0.7 Questionable
0.5 ≤ α< 0.6 Poor
α< 0.5 Unacceptable
Table 6.5: Rule of thumb for Cronbach’s alpha
Fifteen independent variables were estimated for internal consistency by calculating
Cronbach’s alpha as shown in table below.
Variables Number
of Items
Cronbach’s
Alpha
Reliability Strength
Attributes of
Innovation
Relative Advantages 10 0.926 Excellent
Compatibility 7 0.899 Good
Complexity 4 0.768 Acceptable
Trialability 6 0.630 Questionable
Observability 5 0.677 Questionable
Organisational
Factors
Financial Barriers 4 0.630 Questionable
Employee’s IT
Knowledge
3 0.663 Questionable
Managerial
Factors
Power Distance 7 0.656 Questionable
Top Management
Support
3 0.804 Good
Uncertainty
Avoidance
3 0.852 Good
Manager’s Attitude
toward E-commerce
5 0.911 Excellent
Environmental
Factors
Competitive Pressure 5 0.551 Poor
Supplier/Partner
pressure
5 0.807 Good
Customer Pressure 3 0.777 Acceptable
Government Support 7 0.527 Poor
Table 6.6: Cronbach’s alpha reliability analysis

217
The above table shows that Cronbach’s alpha scores range between 0.527 for the
government support variable and 0.926 for the relative advantage variable. Out of the 15
variables, two have excellent reliability, four good, two acceptable, five questionable and
two poor. Although that all items of each variable have a confirmed reliability through
previous studies, it was found here that competitive pressure and government support
display poor internal consistency.
This can be attributed to several factors including translation survey from original
English language to Arabic. Also, multicultural issues may affect reliability. Finally, it
could be affected by inappropriate items used to measure the construct (Rode, 2005;
Kamaroddin et al., 2009). Field (2009) suggested applying Cronbach’s alpha if item
deleted in order to examine what the value of alpha would be with such exclusion. In
other words, Cronbach’s alpha if item deleted, explains the total score of coefficient
alpha.
Squires et al., (2011) recommended dropping the items causing a substantial increase
equal or more than 10% on the scale. Moreover, item-total correlation was also
recommended beside Cronbach’s alpha value if the item is deleted to evaluate internal
consistency (Field, 2009; Gliem and Gliem, 2003). Item-total correlation is used to check
correlation between items that measure the same concept with the total assessment score.
However, Kline (1993) proposed that item-total correlation score is affected by the
sample size which exposes it to bias, , recommending to calculate corrected item-total
correlation to minimize such bias. Corrected item-total correlation shows the correlation
between a particular item and the summated score of the rest of items. In reliable scale,

218
there are many arguments among researchers regarding the accepted cut-off values for
corrected item-total correlation through dropping an item in order to improve reliability.
Some researchers suggested that corrected item-total correlation should be at least 0.30
(Field, 2009; Kline, 1993), others recommended that it should be higher than 0.4 (Tan et
al, 2007; Tang, 2009; Molla and Licker, 2005b). There were also those who proposed
that, to be retained, an item should range between 0.3 and 0.8; otherwise it should be
dropped from the scale because it may not measure the same concept in the rest of items
if they have a low inter-item correlation or if the items are similar or repetitive through
asking the same question in different ways in case of an inter-item correlation > 0.80
(Rattray & Jones, 2007; Squires et al ., 2011, Tavakol and Dennick, 2011).
Therefore, Cronbach’s alpha if item deleted and corrected item-total correlation were
computed for reliability as shown in Tables 6.7 through 6.22. All constructs were
checked for the values of corrected item-total correlation. If values were not between 0.3
and 0.8, the item was considered for deletion. Then the values of Cronbach’s alpha were
checked upon which items with alpha value deletion over 10% of current Cronbach’s
alpha in the total scale were considered for deletion. Starting with the relative advantages
construct, the Cronbach’s alpha value is 0.926.
Table 6.7 shows that two items RA4, RA10 had values higher than 0.80 of corrected
item-total correlation; therefore they were dropped from the relative advantage
instrument. It also shows that none of the items will substantially increase reliability if
one item was removed. The Cronbach’s alpha for the remaining eight items became
0.896 instead of 0.926. Therefore, these two items were removed from further analysis.

219
Relative
Advantages
Corrected Item-Total
Correlation
Cronbach's Alpha if Item
Deleted
RA1 .644 .922
RA2 .751 .917
RA3 .741 .917
*RA4 .827 .912
RA5 .459 .930
RA6 .740 .918
RA7 .712 .919
RA8 .766 .916
RA9 .716 .919
*RA10 .802 .914
* item/s is dropped from measurement scale of the construct
Table 6.7: Corrected Item-Total Correlation and Cronbach's Alpha if Item Deleted for
Relative Advantages Construct
Table 6.8 shows that all items of the compatibility construct had valid ranges of corrected
item-total correlation and none of alpha values was greater than the current Cronbach’s
alpha (0.889) of the total scale. As a result, all items were retained.
Compatibility Corrected Item-Total
Correlation
Cronbach's Alpha if Item
Deleted
COMP1 .581 .899
COMP2 .739 .881
COMP3 .759 .878
COMP4 .779 .876
COMP5 .705 .886
COMP6 .704 .886
COMP7 .702 .885
Table 6.8: Corrected Item-Total Correlation and Cronbach's Alpha if Item Deleted for
Compatibility Construct
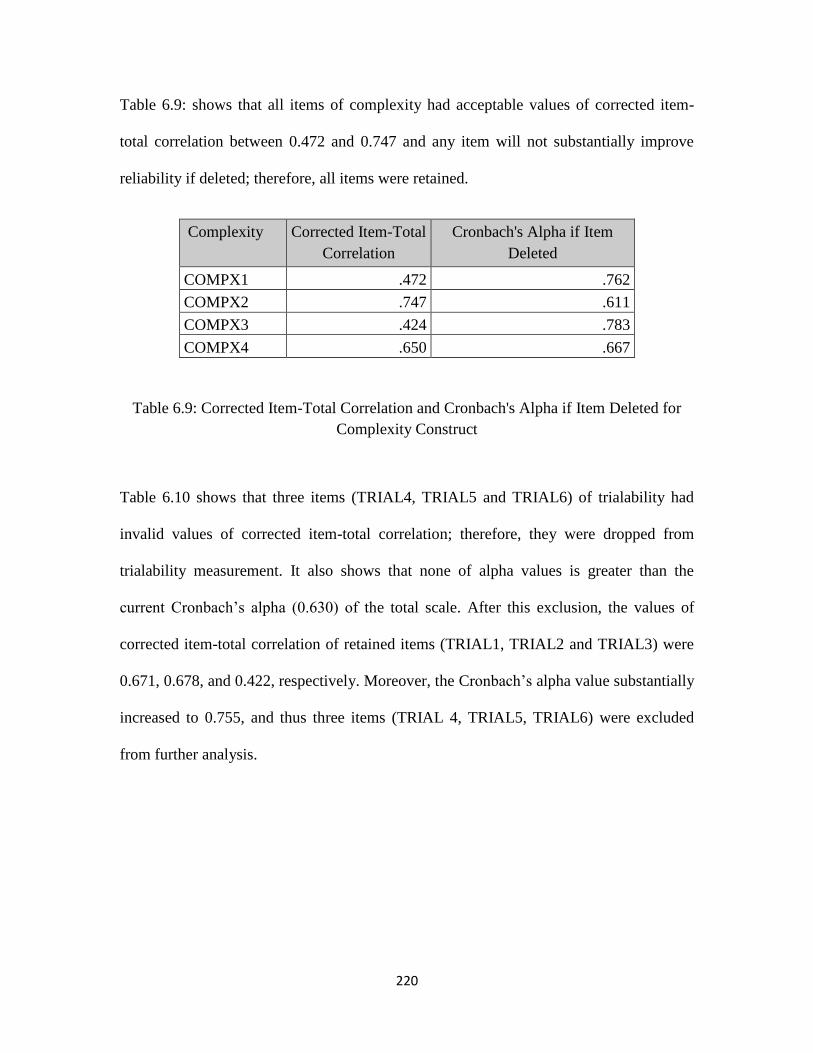
220
Table 6.9: shows that all items of complexity had acceptable values of corrected item-
total correlation between 0.472 and 0.747 and any item will not substantially improve
reliability if deleted; therefore, all items were retained.
Complexity Corrected Item-Total
Correlation
Cronbach's Alpha if Item
Deleted
COMPX1 .472 .762
COMPX2 .747 .611
COMPX3 .424 .783
COMPX4 .650 .667
Table 6.9: Corrected Item-Total Correlation and Cronbach's Alpha if Item Deleted for
Complexity Construct
Table 6.10 shows that three items (TRIAL4, TRIAL5 and TRIAL6) of trialability had
invalid values of corrected item-total correlation; therefore, they were dropped from
trialability measurement. It also shows that none of alpha values is greater than the
current Cronbach’s alpha (0.630) of the total scale. After this exclusion, the values of
corrected item-total correlation of retained items (TRIAL1, TRIAL2 and TRIAL3) were
0.671, 0.678, and 0.422, respectively. Moreover, the Cronbach’s alpha value substantially
increased to 0.755, and thus three items (TRIAL 4, TRIAL5, TRIAL6) were excluded
from further analysis.
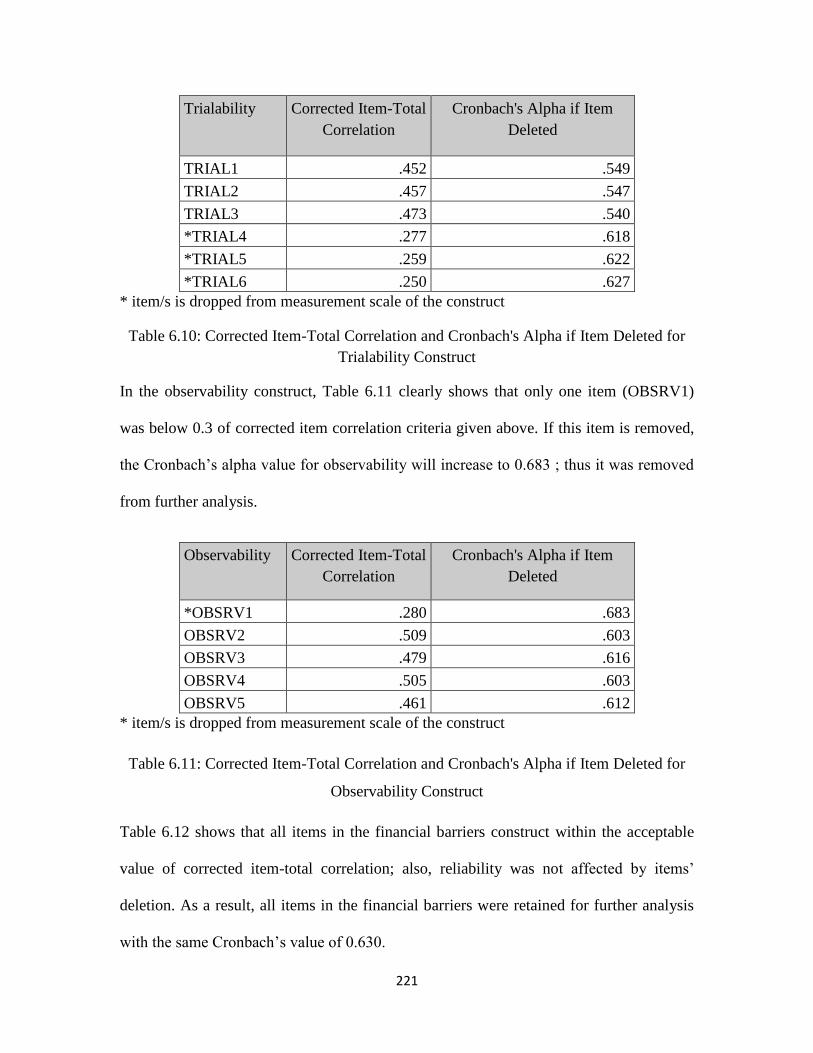
221
Trialability Corrected Item-Total
Correlation
Cronbach's Alpha if Item
Deleted
TRIAL1 .452 .549
TRIAL2 .457 .547
TRIAL3 .473 .540
*TRIAL4 .277 .618
*TRIAL5 .259 .622
*TRIAL6 .250 .627
* item/s is dropped from measurement scale of the construct
Table 6.10: Corrected Item-Total Correlation and Cronbach's Alpha if Item Deleted for
Trialability Construct
In the observability construct, Table 6.11 clearly shows that only one item (OBSRV1)
was below 0.3 of corrected item correlation criteria given above. If this item is removed,
the Cronbach’s alpha value for observability will increase to 0.683 ; thus it was removed
from further analysis.
Observability Corrected Item-Total
Correlation
Cronbach's Alpha if Item
Deleted
*OBSRV1 .280 .683
OBSRV2 .509 .603
OBSRV3 .479 .616
OBSRV4 .505 .603
OBSRV5 .461 .612
* item/s is dropped from measurement scale of the construct
Table 6.11: Corrected Item-Total Correlation and Cronbach's Alpha if Item Deleted for
Observability Construct
Table 6.12 shows that all items in the financial barriers construct within the acceptable
value of corrected item-total correlation; also, reliability was not affected by items’
deletion. As a result, all items in the financial barriers were retained for further analysis
with the same Cronbach’s value of 0.630.
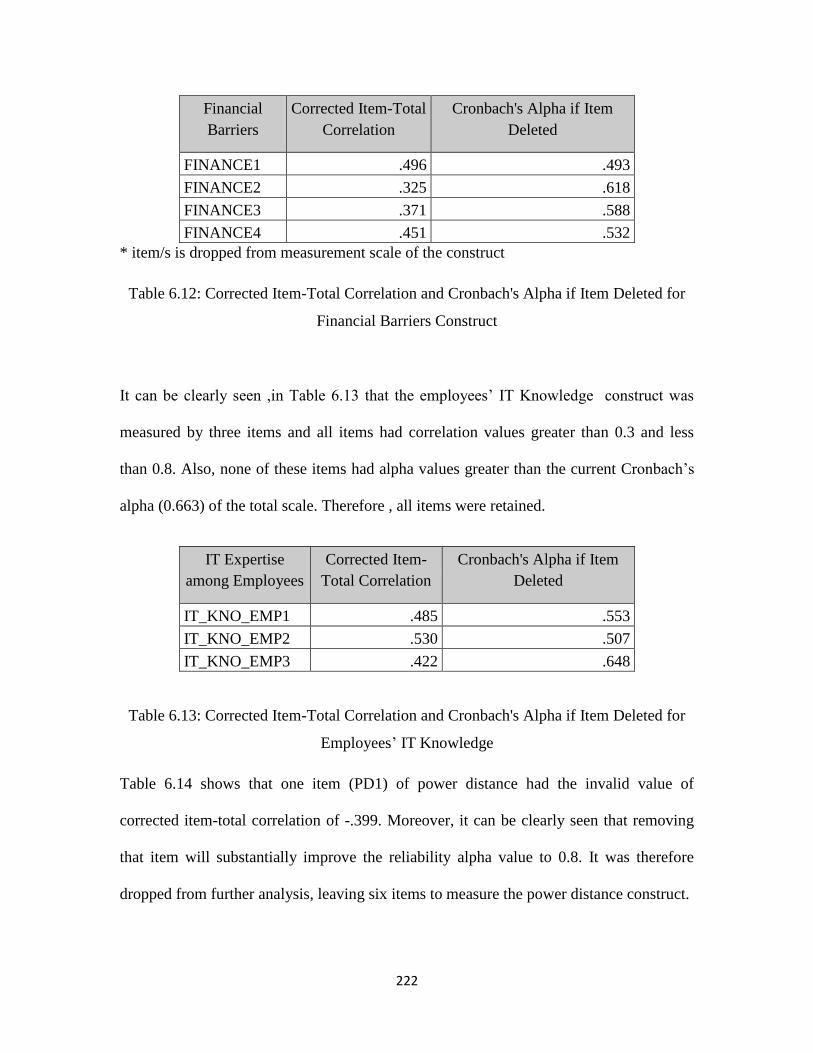
222
Financial
Barriers
Corrected Item-Total
Correlation
Cronbach's Alpha if Item
Deleted
FINANCE1 .496 .493
FINANCE2 .325 .618
FINANCE3 .371 .588
FINANCE4 .451 .532
* item/s is dropped from measurement scale of the construct
Table 6.12: Corrected Item-Total Correlation and Cronbach's Alpha if Item Deleted for
Financial Barriers Construct
It can be clearly seen ,in Table 6.13 that the employees’ IT Knowledge construct was
measured by three items and all items had correlation values greater than 0.3 and less
than 0.8. Also, none of these items had alpha values greater than the current Cronbach’s
alpha (0.663) of the total scale. Therefore , all items were retained.
IT Expertise
among Employees
Corrected Item-
Total Correlation
Cronbach's Alpha if Item
Deleted
IT_KNO_EMP1 .485 .553
IT_KNO_EMP2 .530 .507
IT_KNO_EMP3 .422 .648
Table 6.13: Corrected Item-Total Correlation and Cronbach's Alpha if Item Deleted for
Employees’ IT Knowledge
Table 6.14 shows that one item (PD1) of power distance had the invalid value of
corrected item-total correlation of -.399. Moreover, it can be clearly seen that removing
that item will substantially improve the reliability alpha value to 0.8. It was therefore
dropped from further analysis, leaving six items to measure the power distance construct.

223
Power
Distance
Corrected Item-Total
Correlation
Cronbach's Alpha if Item
Deleted
*PD1 -.399 .800
PD2 .439 .597
PD3 .606 .539
PD4 .537 .573
PD5 .385 .615
PD6 .566 .553
PD7 .583 .550
* item/s is dropped from measurement scale of the construct
Table 6.14: Corrected Item-Total Correlation and Cronbach's Alpha if Item Deleted for
Power Distance
Table 6.15 shows that all items in the top management support construct were within the
acceptable value of corrected item-total correlation. The values of correlation range
between 0.525 and 0.739. Also, reliability was not substantially affected by items
deletion. As a result, all items in management support were retained for further analysis
with the same Cronbach’s value of (0.804).
Table 6.15: Corrected Item-Total Correlation and Cronbach's Alpha if Item Deleted for
Management Support
Table 6.16 shows that all items in the uncertainty avoidance construct were within the
acceptable values of corrected item-total correlation. The values of correlation range
between 0.680 and 0.758. Also, reliability was not substantially affected by items
Management
Support
Corrected Item-Total
Correlation
Cronbach's Alpha if Item
Deleted
MGMTSUP1 .707 .681
MGMTSUP2 .739 .635
MGMTSUP3 .525 .863

224
deletion. As a result, all items in the uncertainly avoidance were retained for further
analysis with same Cronbach’s value of (0.852).
Table 6.16: Corrected Item-Total Correlation and Cronbach's Alpha if Item Deleted for
Uncertainty Avoidance
The manager’s attitude toward using e-commerce applications construct was measured
by 5 items. Table 6.17 shows that only 1 item ATT4 had a value greater than 0.80. Also,
the reliability was not substantially affected by items deletion. After that, the ATT4 item
was deleted from measurement construct leaving a total of 4 items with Cronbach’s alpha
of 0.883 instead of 0.911 used for further analysis.
Attitude Corrected Item-Total
Correlation
Cronbach's Alpha if Item
Deleted
ATTD1 .765 .893
ATTD2 .758 .895
ATTD3 .774 .891
*ATTD4 .812 .883
ATTD5 .765 .893
* item/s is dropped from measurement scale of the construct
Table 6.17: Corrected Item-Total Correlation and Cronbach's Alpha if Item Deleted for
Attitude toward using e-commerce applications
Uncertainty
Avoidance
Corrected Item-Total
Correlation
Cronbach's Alpha if Item
Deleted
UA1 .758 .758
UA2 .680 .836
UA3 .742 .776
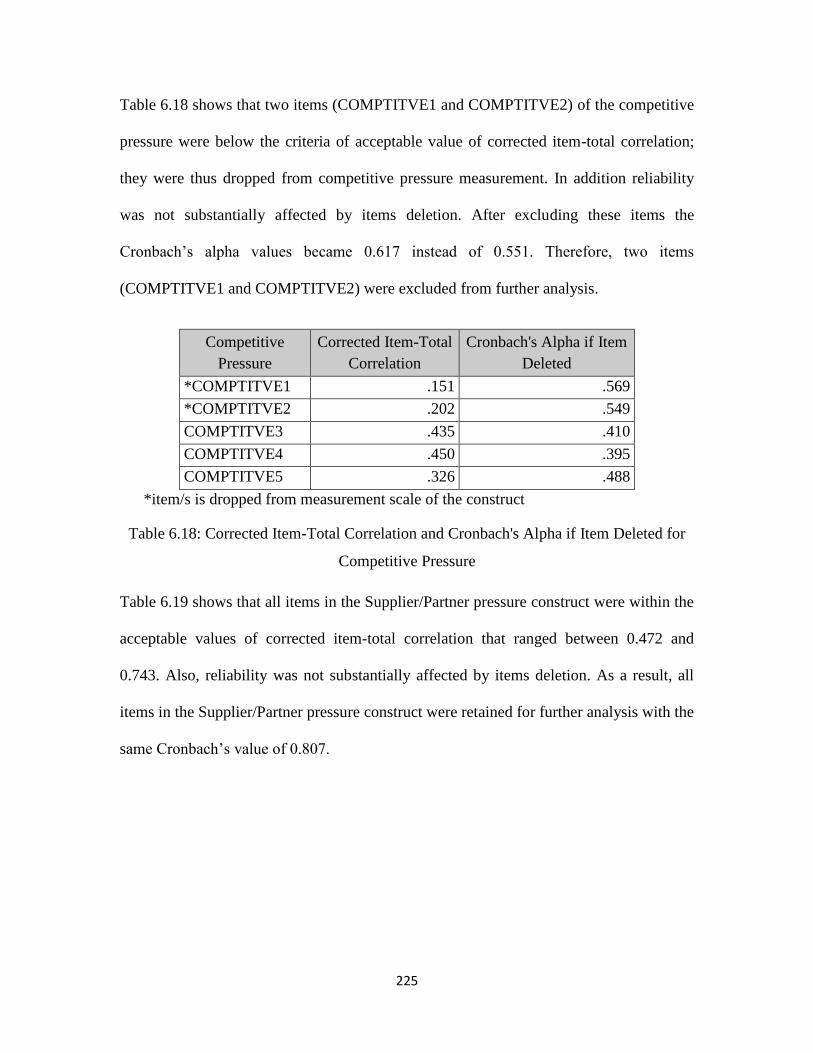
225
Table 6.18 shows that two items (COMPTITVE1 and COMPTITVE2) of the competitive
pressure were below the criteria of acceptable value of corrected item-total correlation;
they were thus dropped from competitive pressure measurement. In addition reliability
was not substantially affected by items deletion. After excluding these items the
Cronbach’s alpha values became 0.617 instead of 0.551. Therefore, two items
(COMPTITVE1 and COMPTITVE2) were excluded from further analysis.
Competitive
Pressure
Corrected Item-Total
Correlation
Cronbach's Alpha if Item
Deleted
*COMPTITVE1 .151 .569
*COMPTITVE2 .202 .549
COMPTITVE3 .435 .410
COMPTITVE4 .450 .395
COMPTITVE5 .326 .488
*item/s is dropped from measurement scale of the construct
Table 6.18: Corrected Item-Total Correlation and Cronbach's Alpha if Item Deleted for
Competitive Pressure
Table 6.19 shows that all items in the Supplier/Partner pressure construct were within the
acceptable values of corrected item-total correlation that ranged between 0.472 and
0.743. Also, reliability was not substantially affected by items deletion. As a result, all
items in the Supplier/Partner pressure construct were retained for further analysis with the
same Cronbach’s value of 0.807.
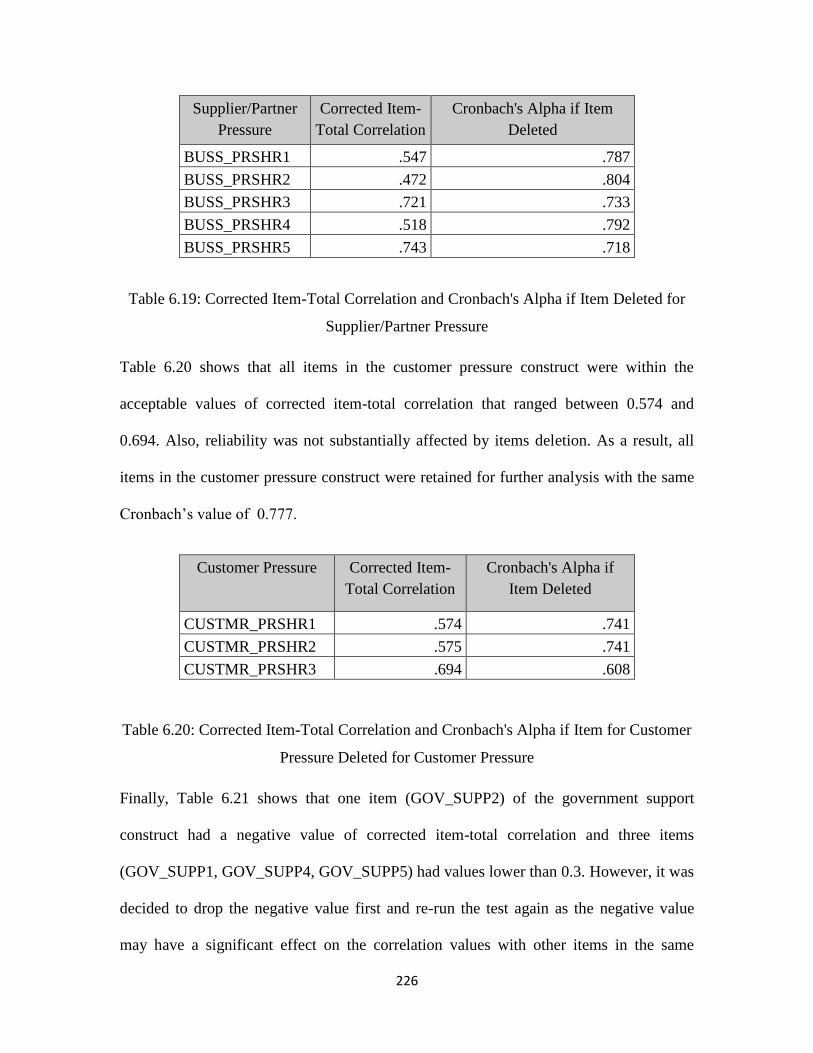
226
Supplier/Partner
Pressure
Corrected Item-
Total Correlation
Cronbach's Alpha if Item
Deleted
BUSS_PRSHR1 .547 .787
BUSS_PRSHR2 .472 .804
BUSS_PRSHR3 .721 .733
BUSS_PRSHR4 .518 .792
BUSS_PRSHR5 .743 .718
Table 6.19: Corrected Item-Total Correlation and Cronbach's Alpha if Item Deleted for
Supplier/Partner Pressure
Table 6.20 shows that all items in the customer pressure construct were within the
acceptable values of corrected item-total correlation that ranged between 0.574 and
0.694. Also, reliability was not substantially affected by items deletion. As a result, all
items in the customer pressure construct were retained for further analysis with the same
Cronbach’s value of 0.777.
Customer Pressure Corrected Item-
Total Correlation
Cronbach's Alpha if
Item Deleted
CUSTMR_PRSHR1 .574 .741
CUSTMR_PRSHR2 .575 .741
CUSTMR_PRSHR3 .694 .608
Table 6.20: Corrected Item-Total Correlation and Cronbach's Alpha if Item for Customer
Pressure Deleted for Customer Pressure
Finally, Table 6.21 shows that one item (GOV_SUPP2) of the government support
construct had a negative value of corrected item-total correlation and three items
(GOV_SUPP1, GOV_SUPP4, GOV_SUPP5) had values lower than 0.3. However, it was
decided to drop the negative value first and re-run the test again as the negative value
may have a significant effect on the correlation values with other items in the same

227
construct. Having performed this deletion, it can be clearly seen in Table 6.22 that the
corrected item correlation values significantly changed and only one item (GOV_SUPP1)
had lower value than 0.3. In addition, removal of any of these items will not lead to
substantially increasing reliability. Following that, two items (GOV_SUPP1,
GOV_SUPP2) were removed from the construct leaving a total of six items with 0.630
reliability instead of 0.527.
Customer Pressure Corrected Item-
Total Correlation
Cronbach's Alpha if
Item Deleted
GOV_SUPP1 .258 .491
*GOV_SUPP2 -.089 .638
GOV_SUPP3 .402 .426
GOV_SUPP4 .450 .403
GOV_SUPP5 .288 .476
GOV_SUPP6 .290 .483
GOV_SUPP7 .365 .459
*item/s is dropped from measurement scale of the construct
Table 6.21: Corrected Item-Total Correlation and Cronbach's Alpha if Item Deleted for
Government Support (First Run ).
Customer Pressure Corrected Item-
Total Correlation
Cronbach's Alpha if
Item Deleted
*GOV_SUPP1 .171 .630
GOV_SUPP3 .462 .557
GOV_SUPP4 .358 .599
GOV_SUPP5 .334 .610
GOV_SUPP6 .381 .596
GOV_SUPP7 .438 .578
*item/s is dropped from measurement scale of the construct
Table 6.22: Corrected Item-Total Correlation and Cronbach's Alpha if Item Deleted
for Government Support (Second Run)
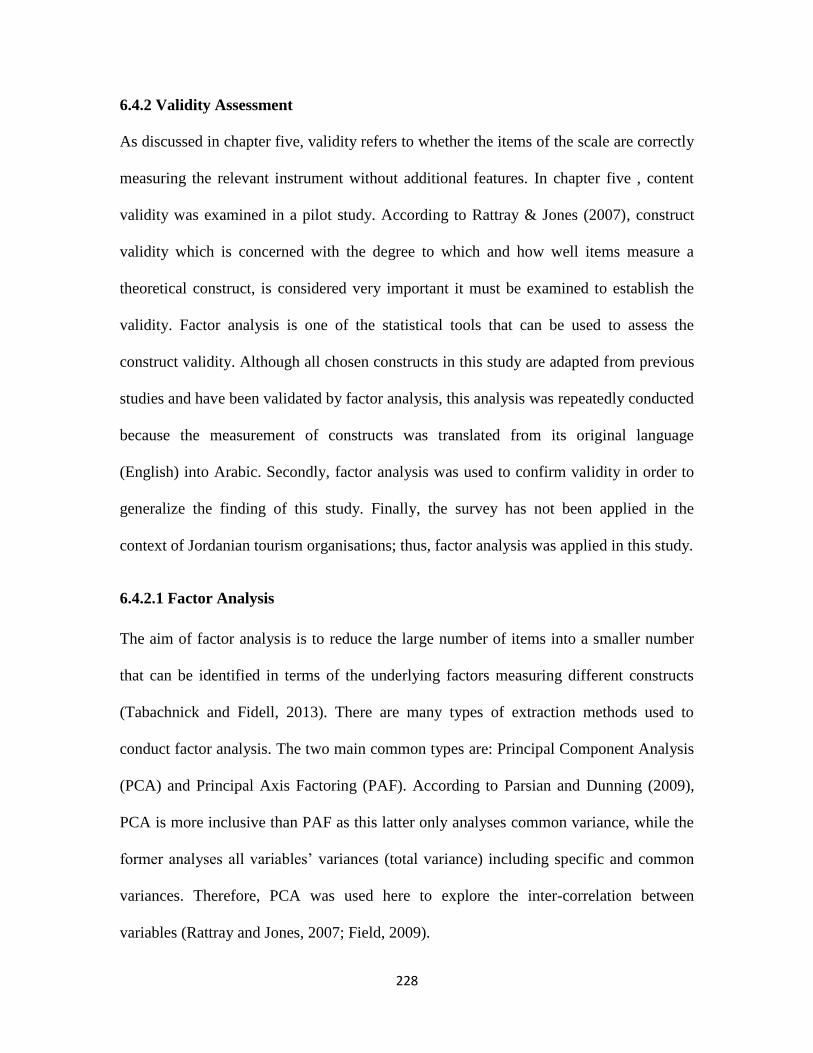
228
6.4.2 Validity Assessment
As discussed in chapter five, validity refers to whether the items of the scale are correctly
measuring the relevant instrument without additional features. In chapter five , content
validity was examined in a pilot study. According to Rattray & Jones (2007), construct
validity which is concerned with the degree to which and how well items measure a
theoretical construct, is considered very important it must be examined to establish the
validity. Factor analysis is one of the statistical tools that can be used to assess the
construct validity. Although all chosen constructs in this study are adapted from previous
studies and have been validated by factor analysis, this analysis was repeatedly conducted
because the measurement of constructs was translated from its original language
(English) into Arabic. Secondly, factor analysis was used to confirm validity in order to
generalize the finding of this study. Finally, the survey has not been applied in the
context of Jordanian tourism organisations; thus, factor analysis was applied in this study.
6.4.2.1 Factor Analysis
The aim of factor analysis is to reduce the large number of items into a smaller number
that can be identified in terms of the underlying factors measuring different constructs
(Tabachnick and Fidell, 2013). There are many types of extraction methods used to
conduct factor analysis. The two main common types are: Principal Component Analysis
(PCA) and Principal Axis Factoring (PAF). According to Parsian and Dunning (2009),
PCA is more inclusive than PAF as this latter only analyses common variance, while the
former analyses all variables’ variances (total variance) including specific and common
variances. Therefore, PCA was used here to explore the inter-correlation between
variables (Rattray and Jones, 2007; Field, 2009).

229
6.3.2.2 Principal Component Analysis Requirements
Three main requirements had to be met before conducting PCA in this study. The first
requirement is sample size. Rattray and Jones (2007) suggested that the minimum
absolute sample size of 100 respondents is necessary to conduct PCA. Other suggested
that at least 150 are needed as the sample size (Hutcheson and Sofroniou, 1999).
However, some recommended as a rule of thumb that five respondents or more per
variable is the sufficient number to conduct the PCA (Bryman & Cramer, 1997; Hatcher,
1994).
In this study, the sample size is 206 respondents while variables were 16, which is a ratio
of 13 to 1, meeting the first requirement to conduct PCA. The second prerequisite of PCA
is examining the inter-item correlation which should be between 0.3 and 0.8, as to avoid
undermining the analyses, especially the regression analysis (Field, 2009). To meet this
requirement, an examination of inter-item correlation was conducted in previous section
of this chapter and all items greater than 0.8 or lower than 0.3 were dropped from
analysis. The third prerequisite is to identify sampling adequacy. This adequacy was
measured through the Kaiser-Meyer-Olkin (KMO) measure. KMO ranges from 0 to 1,
where the KMO value is closer to 1, the most appropriate value for factor analysis (Field,
2009). Kaiser (1974), cited in Parsian and Dunning (2009), suggested that KMO values
greater than 0.5 are considered acceptable, describing those between 0.5 and 0.7 are
mediocre, values between 0.7 and 0.8 are good, values between 0.8 and 0.9 are great
values higher than 0.9 as superb, while values less than 0.5 are unacceptable. Beside
KMO test, Field (2009) and Hair (2010) suggest to examine Bartlett's Test of Sphericity
prior to conducting factor analysis in order to confirm the correlation matrix is an identity

230
matrix among variables. To have a significant outcome the Bartlett's test should be P
value <0.05. Table 6.23 shows that all the KMO values were acceptable for all four
dimensions (Attributes of Innovation, Organisational Factors, Managerial Factors, and
Environmental Factors). In addition, Table 6.23 shows that all Bartlett's test were
significant for all dimensions.
Dimension KMO Bartlett's Test of Sphericity
Approx. Chi-
Square
df Sig (P-Value)
Attributes of
Innovation
0.859 3492.349 325 0.000
Organisational
Factors
0.640 233.017 28 0.000
Managerial Factors 0.799 1870.626 120 0.000
Environmental
Factors
0.720 1176.652 120 0.000
Table 6.23: KMO and Bartlett's Test of Sphericity
As a result , all these measurements confirmed that all dimensions in the study were
satisfactory for conducting the principle component analysis.
6.3.2.3 Principal Component Analysis
In order to determine the interpretation of factor, factor rotation was applied with PCA to
maximize the variance of factor loading and minimize low loading of variables with
weak association with factor. There are two main types of rotation: orthogonal and
oblique. Orthogonal rotation assumes that factors are not correlated with each other and
are used when the research assumes that factors are independent of each other, whereas
the oblique rotation assumes that factors are correlated and have some relationships
amongst them. Tabachnick and Fidell (2013) described many types of orthogonal

231
rotations such as varimax, quartamax and equamax and many types of oblique rotations
such as oblimin, promax and direct quartimin. For the purpose of current study, the
varimax orthogonal rotation approach was used to examine the validity construct in order
to identify several high level factors by maximizing the variance of factor loading. There
are many arguments among researchers regarding the significant cut-off loading value.
Many researchers suggested the absolute value of factor loading should be at least 0.40 as
to provide an appropriate interpretation of factor analysis and should not be loaded on
more than one factor with a value of 0.40 or greater. Others suggested that the significant
loading value should be at least 0.30 (Hair et al., 2010; Morgan et al., 2013). According
to Anderson et al. (1998), cited in Parsian and Dunning (2009), the minimal absolute
value of factor loading is 0.30, and loading of 0.50 or greater is considered very
significant. For a higher precision, this study adopted a factor loading of 0.50, dropping
factors with lower values. The eigenvalue and scree plot were used to identify the number
of factors to be retained in factor loading. Many previous studies recommended to adopt
Kaiser’s criterion according to which all factors with eigenvalue >=1 are retained
(Rattray and Jones, 2007; Field, 2009; Parsian and Dunning, 2009). Field (2009, p. 640)
stated that “this criterion is based on the idea that the eigenvalues represent the amount of
variation explained by a factor and that an eigenvalue of 1 represents a substantial
amount of variation”. Beside Kaiser’s criterion, the number of factors can be also
identified by the graphical form scree plot. Scree plot is the graphical form that represents
the eigenvalues in (Y axis) against components in X axis. Field (2009) suggested the cut-
off for selecting the number of factors is based on break in the slope. He suggested
retaining the factors that fitted in the vertical part of the plot before the data point at
232
which eigenvalue begins to drop into the horizontal part (excluding the factor at the point
of break in the slope).Each dimension of this study was analysed separately using PCA
with varimax rotation and eigenvalue greater than 1. In addition, items with loading
values less than 0.50 and/or items that cross loaded value 0.50 were dropped.
6.3.2.3.1 Attributes of Innovation
Table A6.1 in Appendix B-4 shows that the Attributes of Innovation dimension was
extracted in six factors explaining 70.371% of total variance. Factor 1, “Compatibility”,
accounts for 37.75% of the variance. factor 2, “Relative Advantage”, accounts for
8.357% of the variance. factor 4, “Trialability”, accounts for 6.636% of the variance.
factor 5, “Complexity”, accounts for 5.679% of the variance. factor 6, “Observability”,
accounts for 4.967% of the variance. factor 3, “visibility”, accounts for 7.252% of the
variance. Also, the scree plot was compiled and the inspection was supported by the
Kaiser’s criterion indicating six factors as seen in Figure B6.1 in Appendix B-4. The six
resulting factors were rotated using the varimax method and items were loaded on these
factors as seen in Table 6.24. The table below shows that items related to compatibility
was loaded on factor 1. However, item COMP1 did not load on any factor .As a result,
this item was deleted. All items related to the relative advantage construct were cleanly
loaded on factor 2, except item RA5 that did not load on any factor and was therefore
dropped from analysis. The complexity construct was measured on four items, two of
which (COMPX2, COMPX3) were loaded significantly on factor 5, while the other two
(COMPX1, COMPX4) were insignificant and loaded on factor 3 and dropped from
further analysis. The trialability construct was measured on three items that were all
loaded significantly on factor 4. In the observability construct, only two items (OBSRV2,
233
OBSRV3) were loaded significantly on factor 6. As for item OBSRV5 of the
observability construct, it was loaded on the compatibility scale’s Factor 1 rather than on
its expected factor 6, as this item states that “e-commerce shows improved results over
doing business than traditional way,” which makes it more appropriate to the
compatibility scale. Nonetheless, the item was dropped from further analysis. Item
OBSERV4 was loaded on factor 3 rather than its expected factor, as it stated that “e-
commerce improves visibility to connect with customers at any time”. Therefore, factor 3
was named “visibility ”, and it was excluded from analysis as it had only one item. In
total, five factors were retained with twenty items for attributes of innovation
measurement.
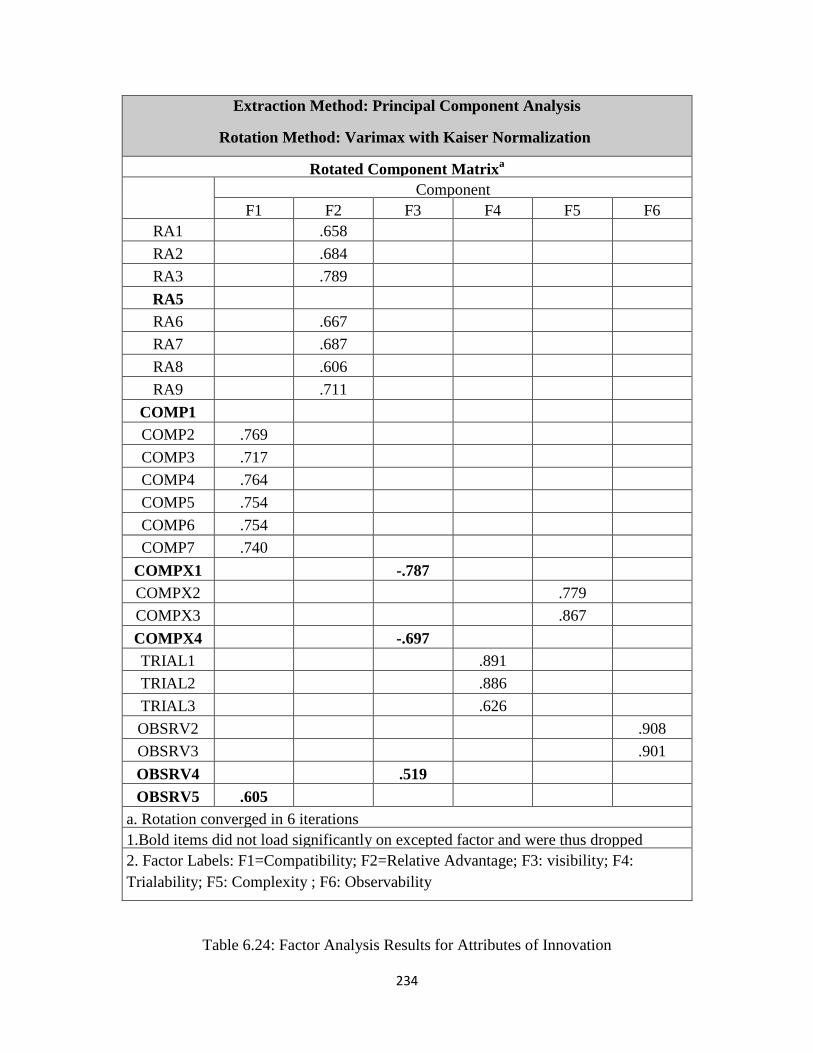
234
Extraction Method: Principal Component Analysis
Rotation Method: Varimax with Kaiser Normalization
Rotated Component Matrixa
Component
F1 F2 F3 F4 F5 F6
RA1 .658
RA2 .684
RA3 .789
RA5
RA6 .667
RA7 .687
RA8 .606
RA9 .711
COMP1
COMP2 .769
COMP3 .717
COMP4 .764
COMP5 .754
COMP6 .754
COMP7 .740
COMPX1 -.787
COMPX2 .779
COMPX3 .867
COMPX4 -.697
TRIAL1 .891
TRIAL2 .886
TRIAL3 .626
OBSRV2 .908
OBSRV3 .901
OBSRV4 .519
OBSRV5 .605
a. Rotation converged in 6 iterations
1.Bold items did not load significantly on excepted factor and were thus dropped
2. Factor Labels: F1=Compatibility; F2=Relative Advantage; F3: visibility; F4:
Trialability; F5: Complexity ; F6: Observability
Table 6.24: Factor Analysis Results for Attributes of Innovation
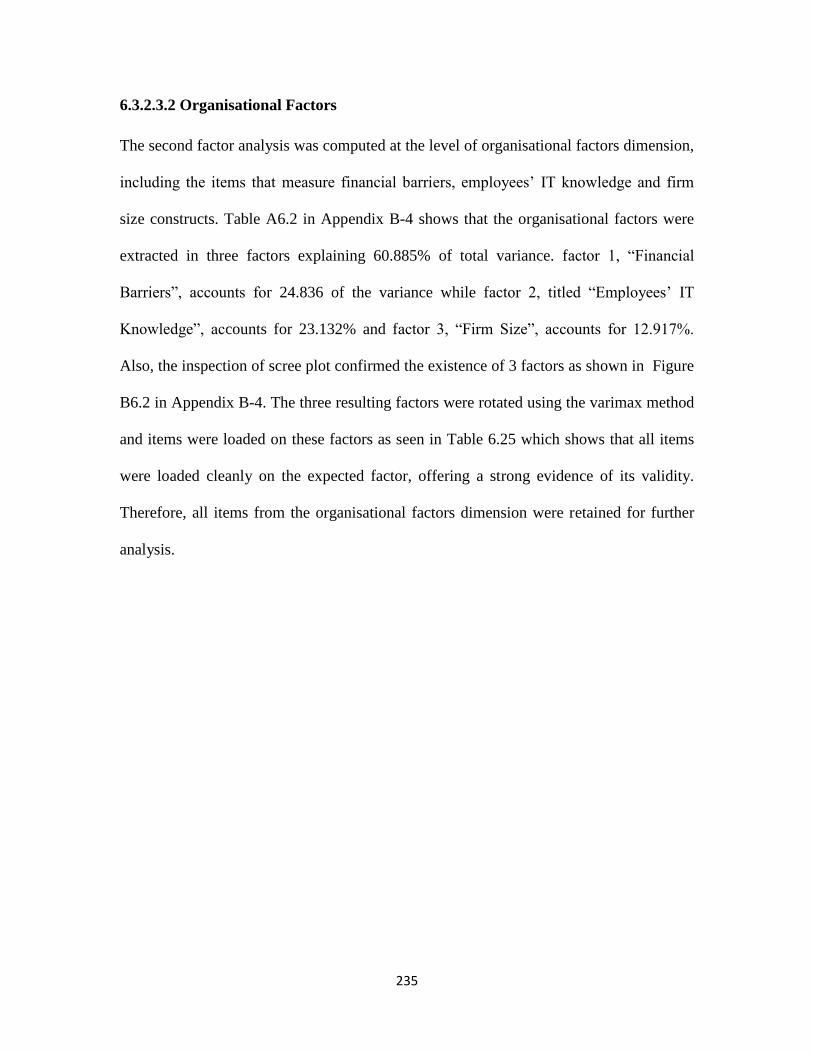
235
6.3.2.3.2 Organisational Factors
The second factor analysis was computed at the level of organisational factors dimension,
including the items that measure financial barriers, employees’ IT knowledge and firm
size constructs. Table A6.2 in Appendix B-4 shows that the organisational factors were
extracted in three factors explaining 60.885% of total variance. factor 1, “Financial
Barriers”, accounts for 24.836 of the variance while factor 2, titled “Employees’ IT
Knowledge”, accounts for 23.132% and factor 3, “Firm Size”, accounts for 12.917%.
Also, the inspection of scree plot confirmed the existence of 3 factors as shown in Figure
B6.2 in Appendix B-4. The three resulting factors were rotated using the varimax method
and items were loaded on these factors as seen in Table 6.25 which shows that all items
were loaded cleanly on the expected factor, offering a strong evidence of its validity.
Therefore, all items from the organisational factors dimension were retained for further
analysis.
236
Extraction Method: Principal Component Analysis
Rotation Method: Varimax with Kaiser Normalization
Rotated Component Matrixa
Component
F1 F2 F3
FINANCE1 .771
FINANCE2 .585
FINANCE3 .639
FINANCE4 .740
IT_KNO_EMP1 .795
IT_KNO_EMP2 .823
IT_KNO_EMP3 .687
NUM_EMP .893
a. Rotation converged in 4 iterations.
1.Bold items did not load significantly on expected factor and were dropped.
2.Factor Labels: F1= Financial Barriers; F2= Employees IT Knowledge; F3: Firm Size. 2. Factor Labels: F1=Financial Barriers ; F2=Employee’s IT Knowledge; F3: Travel
Agency Size
Table 6.25: Factor Analysis Results for Organisational Factors
6.3.2.3.3 Managerial Factors
The third factor analysis was computed at the level of managerial factors dimension
including items relevant to power distance, top management support, uncertainty
avoidance and manager’s attitude constructs. Four factors were extracted from the
principal component analysis with varimax rotation and eigenvalue >1, accounting for
69.396% of total variance as seen in Table A6.3 in Appendix B-3. factor 1, “Manager’s
Attitude toward E-commerce Applications”, accounts for 33.875% of the variance and
factor 2, “Power Distance”, accounts for 19.731%. As for factor 3, “Uncertainty
Avoidance”, it accounts for 9.030% of the variance while factor 4 titled “Top
Management Support”, accounts for 6.761%. The inspection of scree plot confirmed the

237
existence of four factors as shown in Appendix B-4, Figure B.6.3 . Table 6.26 shows that
all items were loaded on their expected factor, except one item (MGMTSUP3) of the top
management support factor that had a cross loading on factor 1 “Manager’s Attitude
toward E-commerce Applications” with value greater than 0.50 and was therefore
dropped from subsequent analysis.
Extraction Method: Principal Component Analysis
Rotation Method: Varimax with Kaiser Normalization
Rotated Component Matrixa
Component
1 2 3 4
PD2 .584
PD3 .754
PD4 .750
PD5 .558
PD6 .773
PD7 .789
MGMTSUP1 .836
MGMTSUP2 .859
MGMTSUP3 .520 .586
UA1 .813
UA2 .768
UA3 .841
ATTD1 .831
ATTD2 .881
ATTD3 .671
ATTD5 .743
a. Rotation converged in 5 iterations.
1. Items in bold did not load significantly on expected factor and were dropped.
2. Factor Labels: F1= Manager’s Attitude; F2=Power Distance; F3: Uncertainty
Avoidance; F4: Top Management Support.
Table 6.26: Factor Analysis Results for Managerial Factors

238
6.3.2.3.4 Environmental Factors
The fourth factor analysis was computed at the level of environmental factors dimension
which includes items from competitive pressure, Supplier/Partner pressure, customer
pressure and government support constructs. Five factors were extracted from principal
component analysis with varimax rotation and eigenvalue >1, explaining 66.493 % of
total variance as seen in Table A6.4 in Appendix B-4. factor 1, titled “Competitive
Pressure”, accounts for 26.107% of the variance; while factor 2, titled “Supplier/Partner
Pressure”, accounts for 15.249% and factor 3, titled “Customer Pressure”, accounts for
9.956%. For the Government Support scale, two factors were extracted on the rule
eigenvalue >1. As Table 6.27 shows, items GOV_SUPP 3, GOV_SUPP4 and
GOV_SUPP5 were extracted and loaded on factor 5 which can be titled “Government
Support” accounting for 6.623% of the variance. The other items GOV_SUPP6 and
GOV_SUPP7 were extracted and loaded on factor 4 which can be titled “Government
Funds and Incentives” accounting for 8.559% of the variance. As for factor 1,
“Competitive Pressure ”, it was measured on three items, two of which (COMPTITVE3,
COMPTITVE34) were loaded significantly on expected factor, while the item
(COMPTITVE5) did not load on any factor and was therefore dropped from further
analysis. The Supplier/Partner pressure construct was measured on five items. It can be
clearly seen in Table 6.27 that two items, BUSS_PRSHR1 and BUSS_PRSHR2, were
loaded on factor 1 rather than expected factor which is factor 2 with value greater than
0.50, therefore, these items were dropped from further analysis. As for items in the
customer pressure construct they were all cleanly loaded on the expected factor and were
thus retained for further analysis. As shown in table 6.27, the items were used to measure
239
government support were loaded on factor 4, and factor 5 and were constituted as
‘Government Funds and Incentives’ and ‘Government Support’ , respectively. These two
factors was resulted based on the criteria of eigenvalue greater than 1. Madu (1998), cited
in Chong et al. (2009), argued that the results obtained from statistical data analysis
should be carefully interpreted based on an overview of research content in addition to
sampling frame. Also, he suggested that the construct may not be divided into two factors
if the eigenvalue for expected factor is slightly greater than 1, particularly if items
measuring this construct were validated previously and loaded on one factor. As shown in
table A6.4 in appendix B-4, the eigenvalue for factor 5 is 1.060, slightly greater than 1
and thus closer to the eigenvalue for factor 4 accounting for 1.369, Moreover, the
contents of items in the government support construct were derived from pervious
researches after proving validity. Finally, the scree plot test shows only four factors rather
than five as proposed by the eigenvalue rule, (See Figure B.6.4, Appendix B-4);
therefore, the Government Support construct was not divided into two factors.
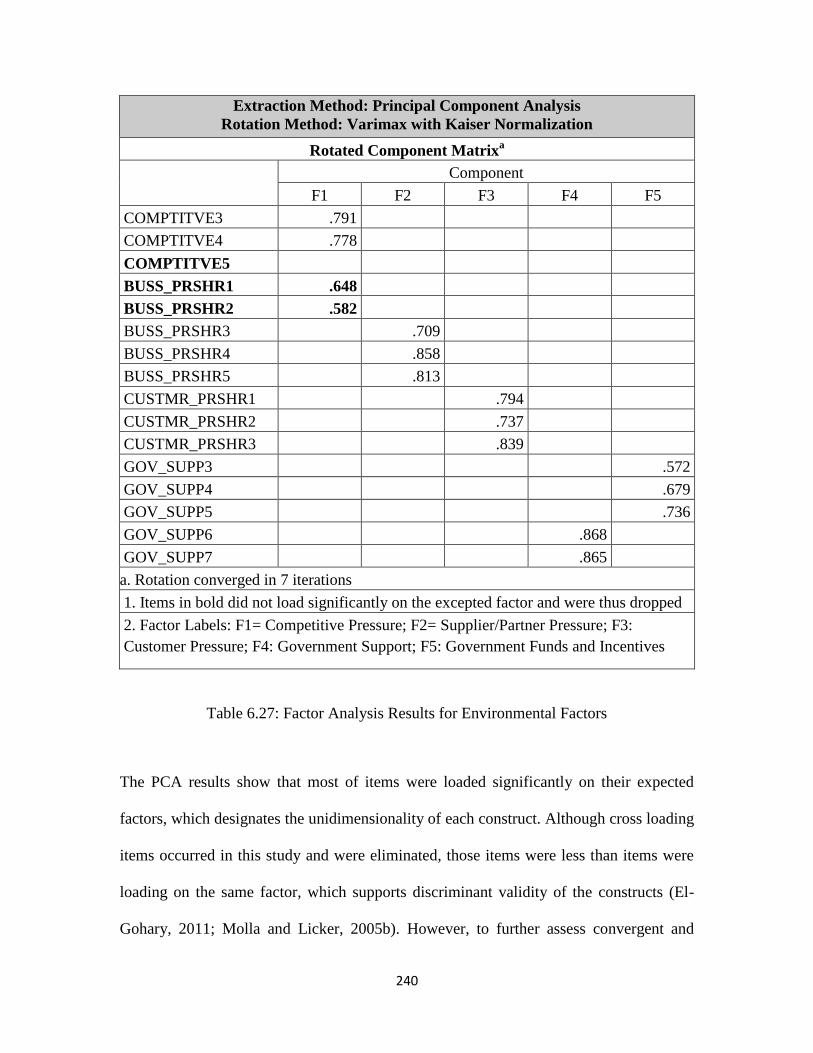
240
Extraction Method: Principal Component Analysis
Rotation Method: Varimax with Kaiser Normalization
Rotated Component Matrixa
Component
F1 F2 F3 F4 F5
COMPTITVE3 .791
COMPTITVE4 .778
COMPTITVE5
BUSS_PRSHR1 .648
BUSS_PRSHR2 .582
BUSS_PRSHR3 .709
BUSS_PRSHR4 .858
BUSS_PRSHR5 .813
CUSTMR_PRSHR1 .794
CUSTMR_PRSHR2 .737
CUSTMR_PRSHR3 .839
GOV_SUPP3 .572
GOV_SUPP4 .679
GOV_SUPP5 .736
GOV_SUPP6 .868
GOV_SUPP7 .865
a. Rotation converged in 7 iterations
1. Items in bold did not load significantly on the excepted factor and were thus dropped
2. Factor Labels: F1= Competitive Pressure; F2= Supplier/Partner Pressure; F3:
Customer Pressure; F4: Government Support; F5: Government Funds and Incentives
Table 6.27: Factor Analysis Results for Environmental Factors
The PCA results show that most of items were loaded significantly on their expected
factors, which designates the unidimensionality of each construct. Although cross loading
items occurred in this study and were eliminated, those items were less than items were
loading on the same factor, which supports discriminant validity of the constructs (El-
Gohary, 2011; Molla and Licker, 2005b). However, to further assess convergent and
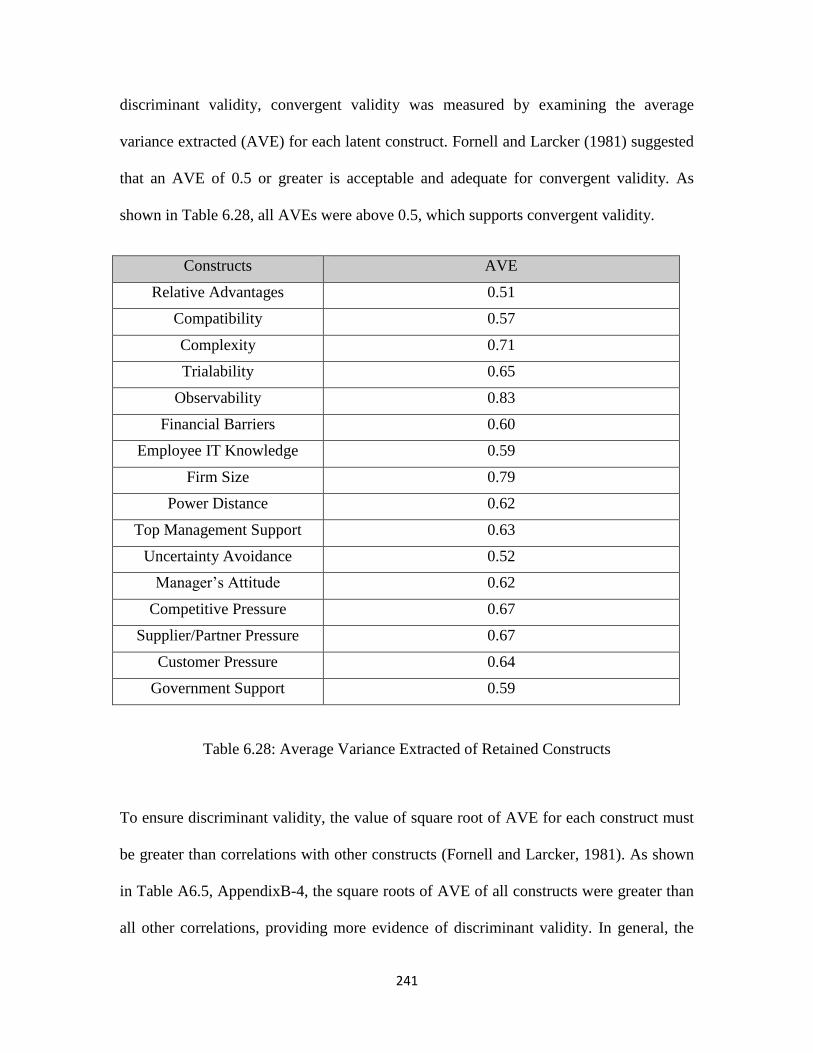
241
discriminant validity, convergent validity was measured by examining the average
variance extracted (AVE) for each latent construct. Fornell and Larcker (1981) suggested
that an AVE of 0.5 or greater is acceptable and adequate for convergent validity. As
shown in Table 6.28, all AVEs were above 0.5, which supports convergent validity.
Constructs AVE
Relative Advantages 0.51
Compatibility 0.57
Complexity 0.71
Trialability 0.65
Observability 0.83
Financial Barriers 0.60
Employee IT Knowledge 0.59
Firm Size 0.79
Power Distance 0.62
Top Management Support 0.63
Uncertainty Avoidance 0.52
Manager’s Attitude 0.62
Competitive Pressure 0.67
Supplier/Partner Pressure 0.67
Customer Pressure 0.64
Government Support 0.59
Table 6.28: Average Variance Extracted of Retained Constructs
To ensure discriminant validity, the value of square root of AVE for each construct must
be greater than correlations with other constructs (Fornell and Larcker, 1981). As shown
in Table A6.5, AppendixB-4, the square roots of AVE of all constructs were greater than
all other correlations, providing more evidence of discriminant validity. In general, the
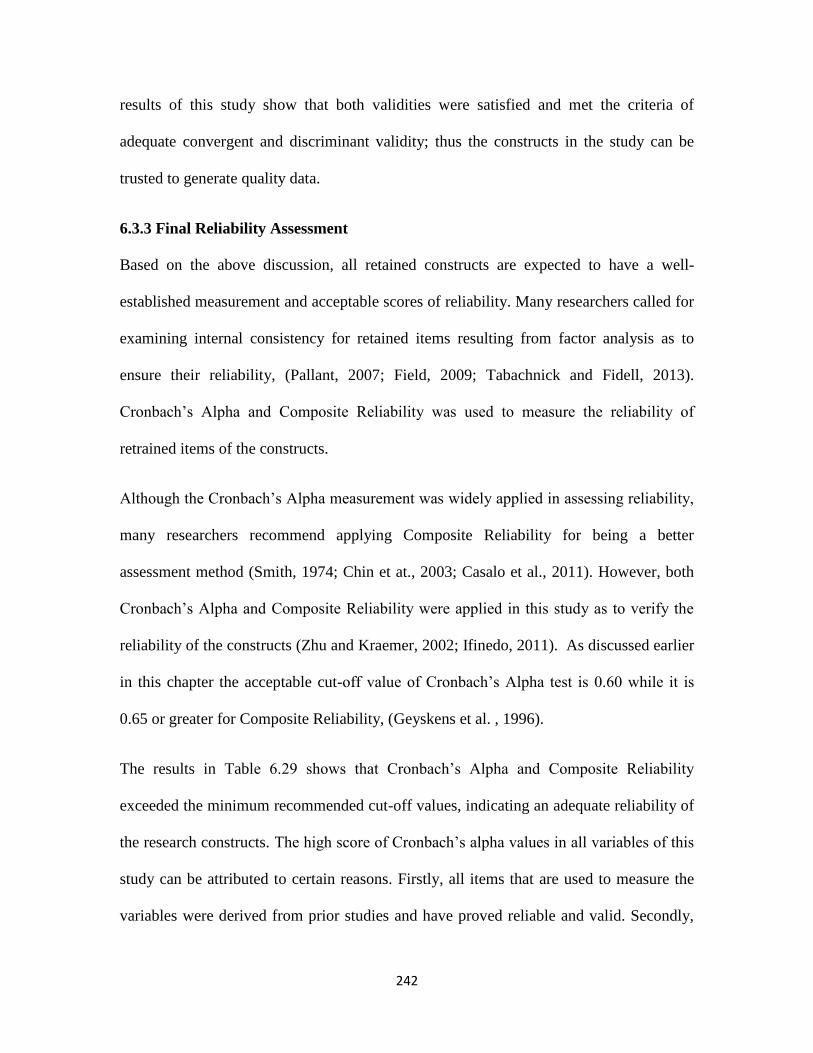
242
results of this study show that both validities were satisfied and met the criteria of
adequate convergent and discriminant validity; thus the constructs in the study can be
trusted to generate quality data.
6.3.3 Final Reliability Assessment
Based on the above discussion, all retained constructs are expected to have a well-
established measurement and acceptable scores of reliability. Many researchers called for
examining internal consistency for retained items resulting from factor analysis as to
ensure their reliability, (Pallant, 2007; Field, 2009; Tabachnick and Fidell, 2013).
Cronbach’s Alpha and Composite Reliability was used to measure the reliability of
retrained items of the constructs.
Although the Cronbach’s Alpha measurement was widely applied in assessing reliability,
many researchers recommend applying Composite Reliability for being a better
assessment method (Smith, 1974; Chin et at., 2003; Casalo et al., 2011). However, both
Cronbach’s Alpha and Composite Reliability were applied in this study as to verify the
reliability of the constructs (Zhu and Kraemer, 2002; Ifinedo, 2011). As discussed earlier
in this chapter the acceptable cut-off value of Cronbach’s Alpha test is 0.60 while it is
0.65 or greater for Composite Reliability, (Geyskens et al. , 1996).
The results in Table 6.29 shows that Cronbach’s Alpha and Composite Reliability
exceeded the minimum recommended cut-off values, indicating an adequate reliability of
the research constructs. The high score of Cronbach’s alpha values in all variables of this
study can be attributed to certain reasons. Firstly, all items that are used to measure the
variables were derived from prior studies and have proved reliable and valid. Secondly,
243
as discussed in Section 6.4.1 of this chapter, initial reliability was initially applied using
Cronbach’s alpha if item deleted and corrected item-total correlation methods and
dropped the items that affected the reliability of value scores.
Variables Number
of Items
Number
of
Deleted
Items
Number
of
Retained
Items
Cronbach’s
Alpha
Composite
Reliability
Attrib
utes o
f
Inn
ovatio
n
Relative
Advantage
8 1 7 0.898 0.88
Compatibility 7 1 6 0.899 0.89
Complexity 4 2 2 0.789 0.83
Trialability 3 0 3 0.755 0.84
Observability 4 2 2 0.859 0.91
Org
an
isatio
nal
Facto
rs
Financial Barriers 4 0 4 0.630 0.85
Employee IT
Knowledge
3 0 3 0.663 0.81
Man
ageria
l Facto
rs
Power Distance 6 0 6 0.80 0.90
Top Management
Support
3 1 2 0.863 0.77
Uncertainty
Avoidance
3 0 3 0.852 0.76
Manager’s
Attitude toward E-
commerce
Applications
4 0 4 0.883 0.87 E
nviro
nm
enta
l
Facto
rs
Competitive
Pressure
3 1 2 0.671 0.80
Supplier/Partner
Pressure
5 2 3 0.809 0.86
Customer Pressure 3 0 3 0.777 0.84
Government
Support
5 0 5 0.630 0.87
Table 6.29: Cronbach’s Alpha and Composite Reliability for Retained Constructs
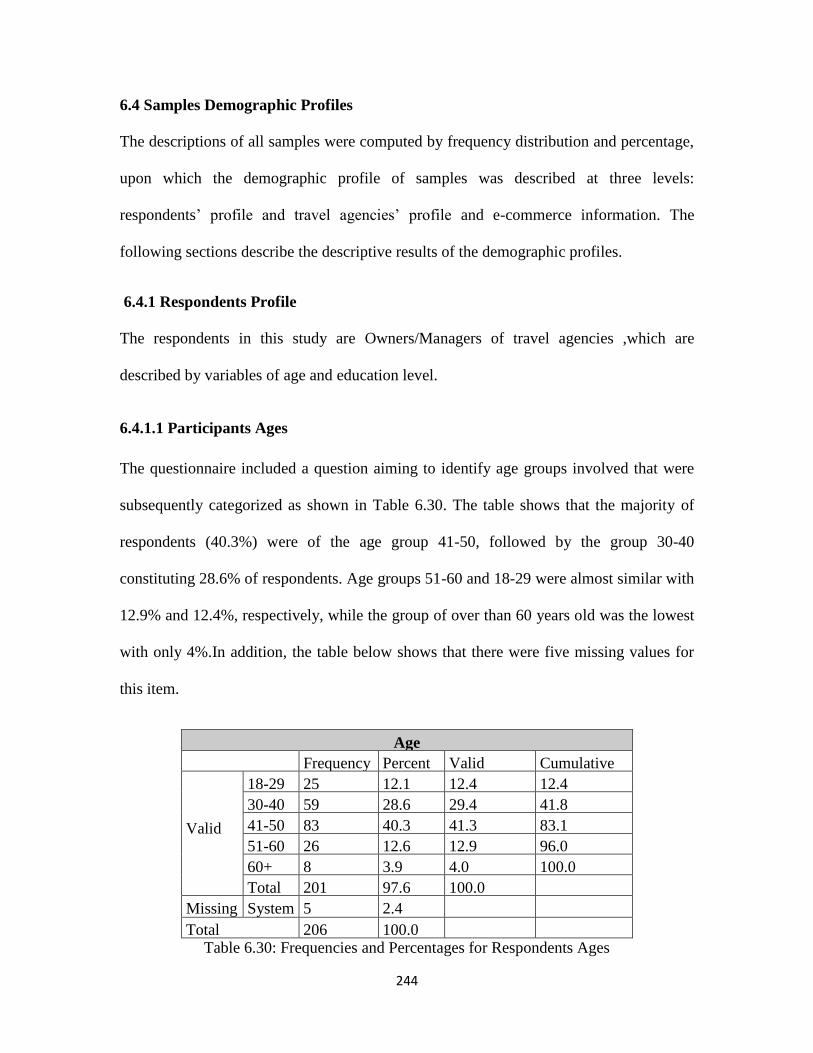
244
6.4 Samples Demographic Profiles
The descriptions of all samples were computed by frequency distribution and percentage,
upon which the demographic profile of samples was described at three levels:
respondents’ profile and travel agencies’ profile and e-commerce information. The
following sections describe the descriptive results of the demographic profiles.
6.4.1 Respondents Profile
The respondents in this study are Owners/Managers of travel agencies ,which are
described by variables of age and education level.
6.4.1.1 Participants Ages
The questionnaire included a question aiming to identify age groups involved that were
subsequently categorized as shown in Table 6.30. The table shows that the majority of
respondents (40.3%) were of the age group 41-50, followed by the group 30-40
constituting 28.6% of respondents. Age groups 51-60 and 18-29 were almost similar with
12.9% and 12.4%, respectively, while the group of over than 60 years old was the lowest
with only 4%.In addition, the table below shows that there were five missing values for
this item.
Age
Frequency Percent Valid
Percent
Cumulative
Percent
Valid
18-29 25 12.1 12.4 12.4
30-40 59 28.6 29.4 41.8
41-50 83 40.3 41.3 83.1
51-60 26 12.6 12.9 96.0
60+ 8 3.9 4.0 100.0
Total 201 97.6 100.0
Missing System 5 2.4
Total 206 100.0
Table 6.30: Frequencies and Percentages for Respondents Ages
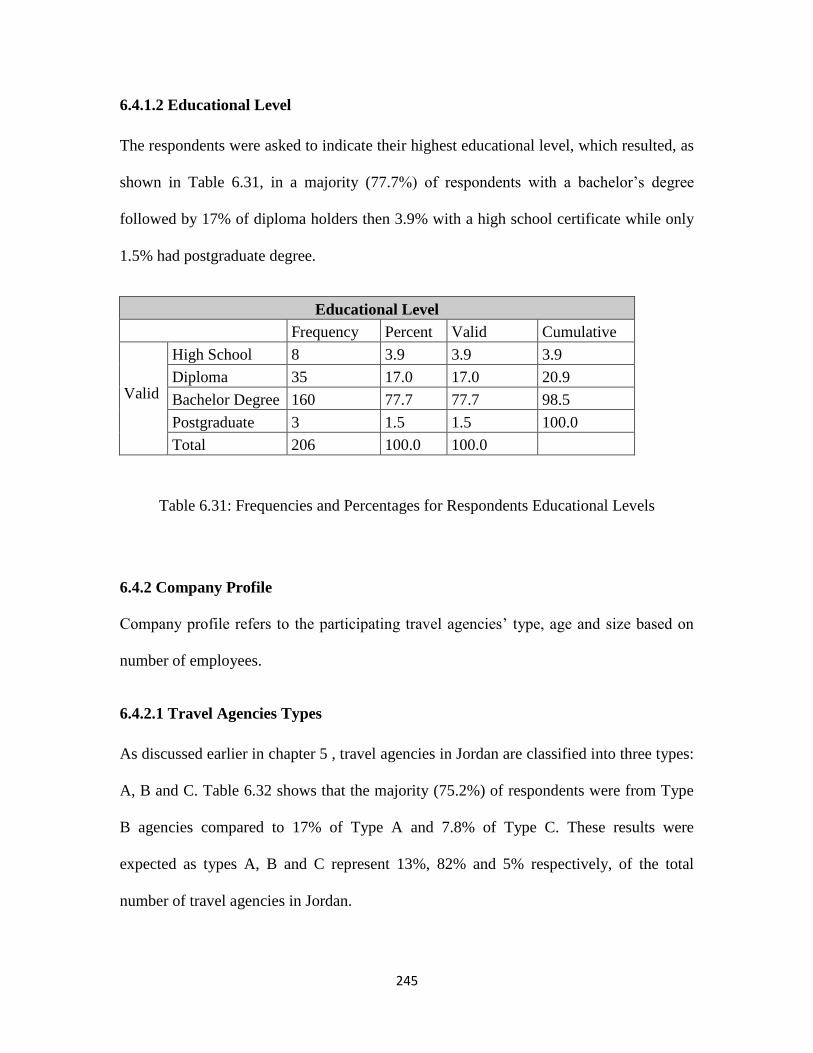
245
6.4.1.2 Educational Level
The respondents were asked to indicate their highest educational level, which resulted, as
shown in Table 6.31, in a majority (77.7%) of respondents with a bachelor’s degree
followed by 17% of diploma holders then 3.9% with a high school certificate while only
1.5% had postgraduate degree.
Educational Level
Frequency Percent Valid
Percent
Cumulative
Percent
Valid
High School 8 3.9 3.9 3.9
Diploma
/certificate
35 17.0 17.0 20.9
Bachelor Degree 160 77.7 77.7 98.5
Postgraduate
Degree
3 1.5 1.5 100.0
Total 206 100.0 100.0
Table 6.31: Frequencies and Percentages for Respondents Educational Levels
6.4.2 Company Profile
Company profile refers to the participating travel agencies’ type, age and size based on
number of employees.
6.4.2.1 Travel Agencies Types
As discussed earlier in chapter 5 , travel agencies in Jordan are classified into three types:
A, B and C. Table 6.32 shows that the majority (75.2%) of respondents were from Type
B agencies compared to 17% of Type A and 7.8% of Type C. These results were
expected as types A, B and C represent 13%, 82% and 5% respectively, of the total
number of travel agencies in Jordan.
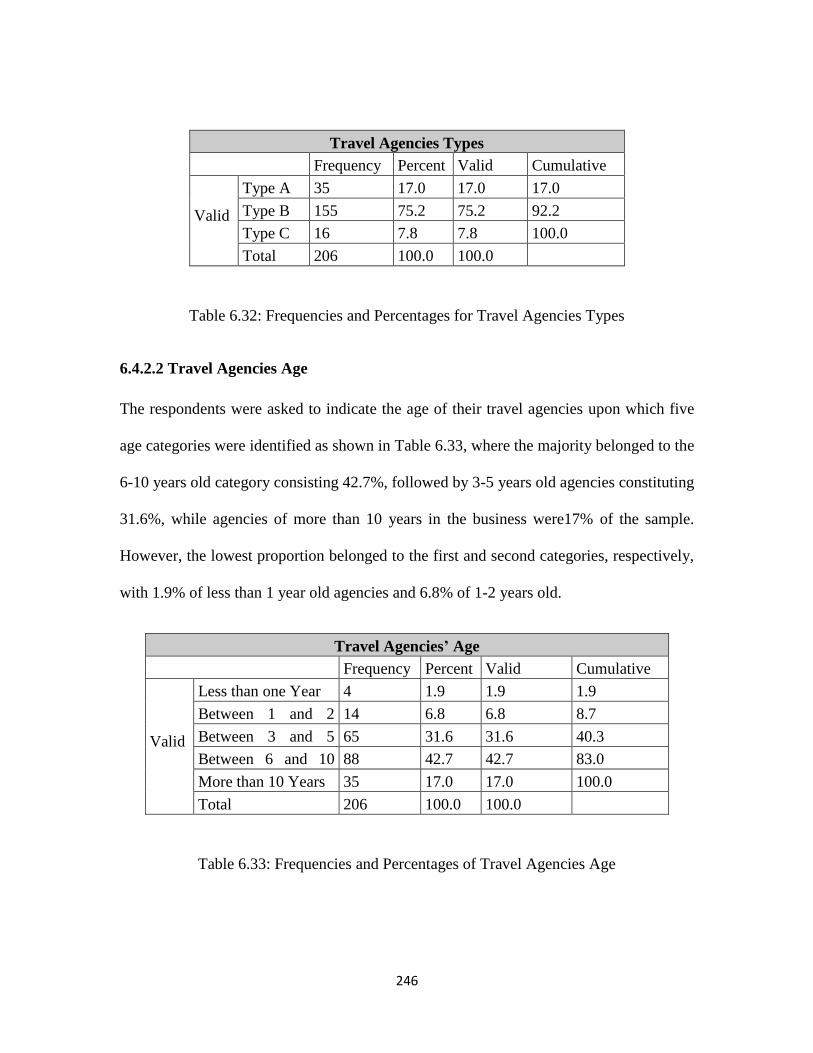
246
Travel Agencies Types
Frequency Percent Valid
Percent
Cumulative
Percent
Valid
Type A 35 17.0 17.0 17.0
Type B 155 75.2 75.2 92.2
Type C 16 7.8 7.8 100.0
Total 206 100.0 100.0
Table 6.32: Frequencies and Percentages for Travel Agencies Types
6.4.2.2 Travel Agencies Age
The respondents were asked to indicate the age of their travel agencies upon which five
age categories were identified as shown in Table 6.33, where the majority belonged to the
6-10 years old category consisting 42.7%, followed by 3-5 years old agencies constituting
31.6%, while agencies of more than 10 years in the business were17% of the sample.
However, the lowest proportion belonged to the first and second categories, respectively,
with 1.9% of less than 1 year old agencies and 6.8% of 1-2 years old.
Travel Agencies’ Age
Frequency Percent Valid
Percent
Cumulative
Percent
Valid
Less than one Year 4 1.9 1.9 1.9
Between 1 and 2
Years
14 6.8 6.8 8.7
Between 3 and 5
Years
65 31.6 31.6 40.3
Between 6 and 10
Years
88 42.7 42.7 83.0
More than 10 Years 35 17.0 17.0 100.0
Total 206 100.0 100.0
Table 6.33: Frequencies and Percentages of Travel Agencies Age
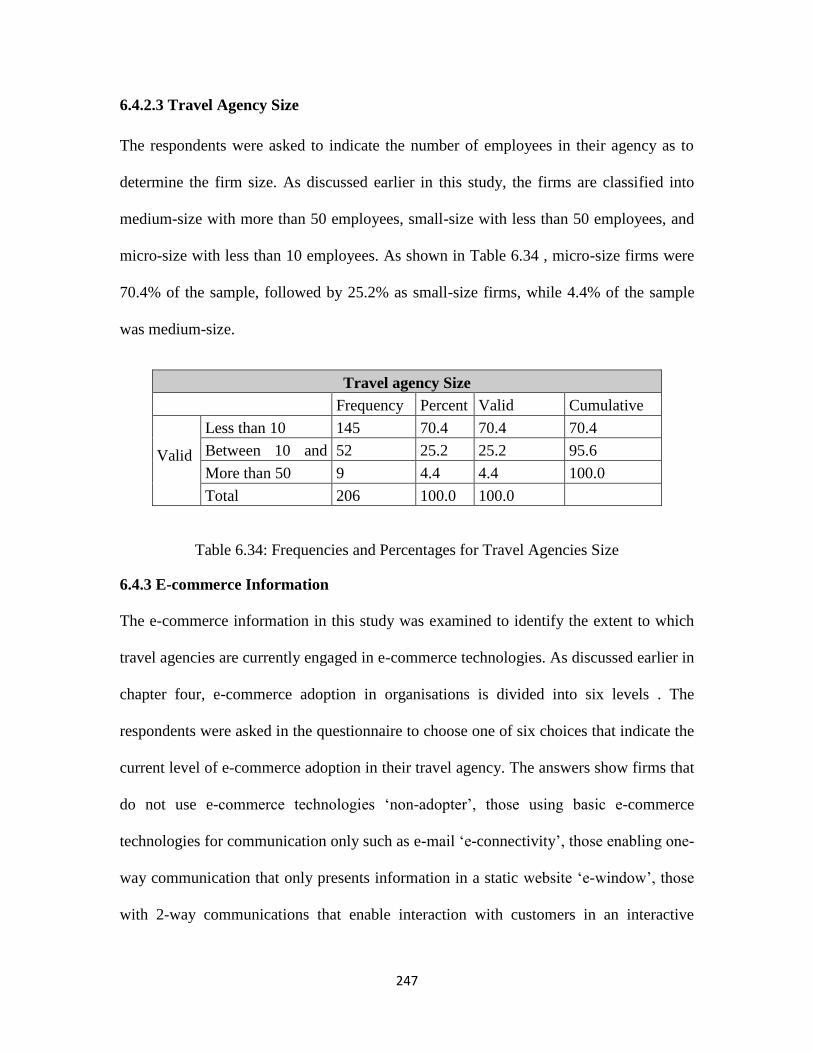
247
6.4.2.3 Travel Agency Size
The respondents were asked to indicate the number of employees in their agency as to
determine the firm size. As discussed earlier in this study, the firms are classified into
medium-size with more than 50 employees, small-size with less than 50 employees, and
micro-size with less than 10 employees. As shown in Table 6.34 , micro-size firms were
70.4% of the sample, followed by 25.2% as small-size firms, while 4.4% of the sample
was medium-size.
Travel agency Size
Frequency Percent Valid
Percent
Cumulative
Percent
Valid
Less than 10 145 70.4 70.4 70.4
Between 10 and
50
52 25.2 25.2 95.6
More than 50 9 4.4 4.4 100.0
Total 206 100.0 100.0
Table 6.34: Frequencies and Percentages for Travel Agencies Size
6.4.3 E-commerce Information
The e-commerce information in this study was examined to identify the extent to which
travel agencies are currently engaged in e-commerce technologies. As discussed earlier in
chapter four, e-commerce adoption in organisations is divided into six levels . The
respondents were asked in the questionnaire to choose one of six choices that indicate the
current level of e-commerce adoption in their travel agency. The answers show firms that
do not use e-commerce technologies ‘non-adopter’, those using basic e-commerce
technologies for communication only such as e-mail ‘e-connectivity’, those enabling one-
way communication that only presents information in a static website ‘e-window’, those
with 2-way communications that enable interaction with customers in an interactive
248
website ‘e-interactivity’, those using sophisticated e-commerce technologies that enable
transactions such as online payment ‘e-transaction’ and those with ‘e-enterprise’ adoption
level that enable providing all business process online such as an accounting system and
transforming traditional business to electronic one .
6.4.3.1 Current Level of E-commerce Adoption by Travel Agencies
As shown in Table 6.35 , 91 of the 206 travel agencies, representing 44.2% of the sample,
were currently adopted e-connectivity. Moreover, 49 of the sampled 206 travel agencies,
representing 23.8%, were currently adopted e-window. The rest of travel agencies,
(32%), were currently adopted e-interactivity. It is noteworthy here that none of travel
agencies in the sample were non-adopters nor advanced adopters at e-transaction or e-
enterprise groups. The latter type of advanced adoption can be attributed to the complex
and costly technological equipment and high ICTs required for these levels. In addition,
online payment and transaction security are still in early stages in Jordan. On the other
hand, internet access is inexpensive in Jordan and widely available for business plans;
thus, travel agencies use e-mail in communicating with their partners and customers.
Current State of E-commerce Adoption
E-commerce Level Frequency Percent Valid
Percent
Cumulative
Percent
Valid
e-connectivity 91 44.2 44.2 44.2
e-window 49 23.8 23.8 68.0
e-interactivity 66 32.0 32.0 100.0
Total 206 100.0 100.0
Table 6.35: Frequencies and Percentages of Current State of E-commerce Adoption in
Travel Agencies
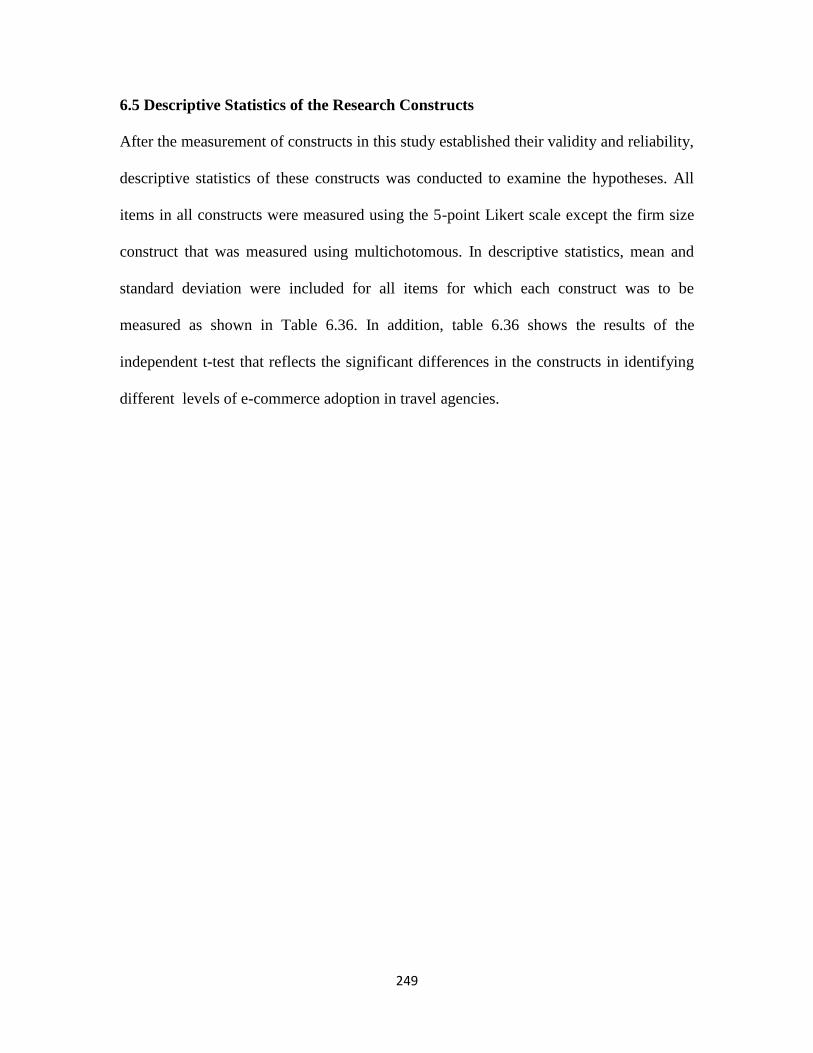
249
6.5 Descriptive Statistics of the Research Constructs
After the measurement of constructs in this study established their validity and reliability,
descriptive statistics of these constructs was conducted to examine the hypotheses. All
items in all constructs were measured using the 5-point Likert scale except the firm size
construct that was measured using multichotomous. In descriptive statistics, mean and
standard deviation were included for all items for which each construct was to be
measured as shown in Table 6.36. In addition, table 6.36 shows the results of the
independent t-test that reflects the significant differences in the constructs in identifying
different levels of e-commerce adoption in travel agencies.
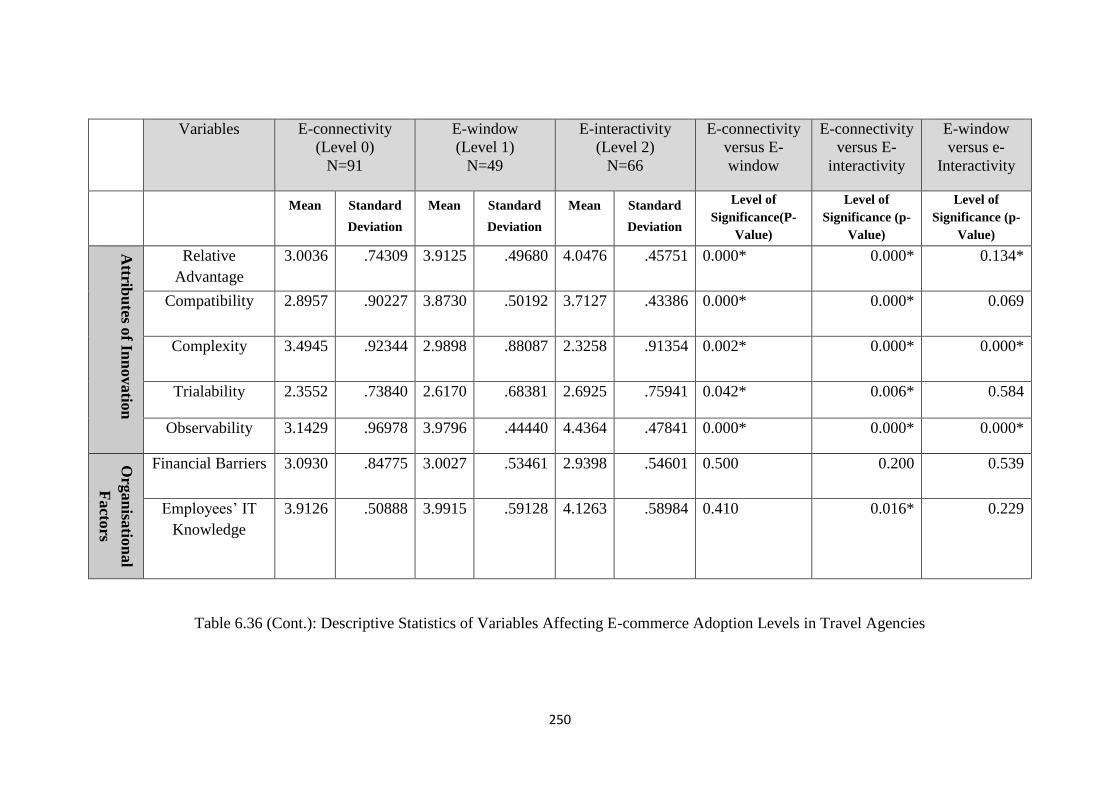
250
Variables
E-connectivity
(Level 0)
N=91
E-window
(Level 1)
N=49
E-interactivity
(Level 2)
N=66
E-connectivity
versus E-
window
E-connectivity
versus E-
interactivity
E-window
versus e-
Interactivity
Mean Standard
Deviation
Mean Standard
Deviation
Mean Standard
Deviation
Level of
Significance(P-
Value)
Level of
Significance (p-
Value)
Level of
Significance (p-
Value)
Attrib
utes o
f Inn
ovatio
n
Relative
Advantage
3.0036 .74309 3.9125 .49680 4.0476 .45751 0.000* 0.000* 0.134*
Compatibility 2.8957 .90227 3.8730 .50192 3.7127 .43386 0.000* 0.000* 0.069
Complexity 3.4945 .92344 2.9898 .88087 2.3258 .91354 0.002* 0.000* 0.000*
Trialability 2.3552 .73840 2.6170 .68381 2.6925 .75941 0.042* 0.006* 0.584
Observability 3.1429 .96978 3.9796 .44440 4.4364 .47841 0.000* 0.000* 0.000*
Org
an
isatio
nal
Facto
rs
Financial Barriers 3.0930 .84775 3.0027 .53461 2.9398 .54601 0.500 0.200 0.539
Employees’ IT
Knowledge
3.9126 .50888 3.9915 .59128 4.1263 .58984 0.410 0.016* 0.229
Table 6.36 (Cont.): Descriptive Statistics of Variables Affecting E-commerce Adoption Levels in Travel Agencies
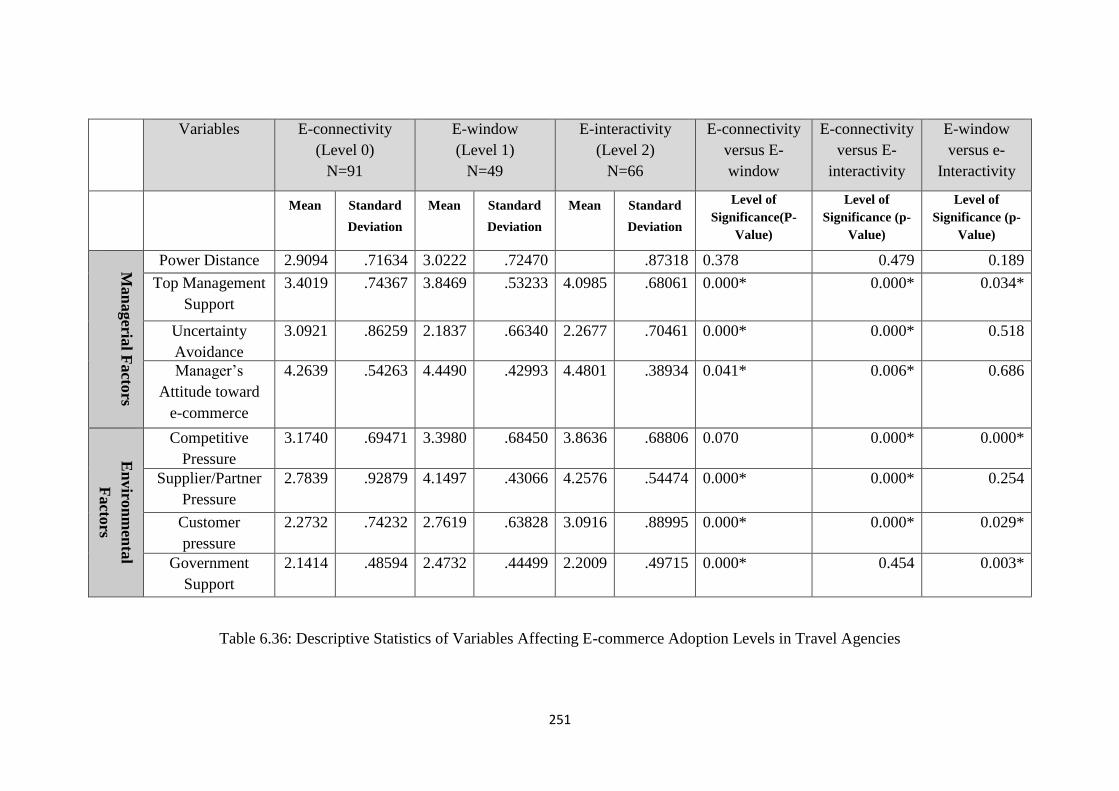
251
Variables
E-connectivity
(Level 0)
N=91
E-window
(Level 1)
N=49
E-interactivity
(Level 2)
N=66
E-connectivity
versus E-
window
E-connectivity
versus E-
interactivity
E-window
versus e-
Interactivity
Mean Standard
Deviation
Mean Standard
Deviation
Mean Standard
Deviation
Level of
Significance(P-
Value)
Level of
Significance (p-
Value)
Level of
Significance (p-
Value)
Man
ageria
l Facto
rs
Power Distance 2.9094 .71634 3.0222 .72470
2.8193
.87318 0.378 0.479 0.189
Top Management
Support
3.4019 .74367 3.8469 .53233 4.0985 .68061 0.000* 0.000* 0.034*
Uncertainty
Avoidance
3.0921 .86259 2.1837 .66340 2.2677 .70461 0.000* 0.000* 0.518
Manager’s
Attitude toward
e-commerce
4.2639 .54263 4.4490 .42993 4.4801 .38934 0.041* 0.006* 0.686
En
viro
nm
enta
l
Facto
rs
Competitive
Pressure
3.1740 .69471 3.3980 .68450 3.8636 .68806 0.070 0.000* 0.000*
Supplier/Partner
Pressure
2.7839 .92879 4.1497 .43066 4.2576 .54474 0.000* 0.000* 0.254
Customer
pressure
2.2732 .74232 2.7619 .63828 3.0916 .88995 0.000* 0.000* 0.029*
Government
Support
2.1414 .48594 2.4732 .44499 2.2009 .49715 0.000* 0.454 0.003*
Table 6.36: Descriptive Statistics of Variables Affecting E-commerce Adoption Levels in Travel Agencies

252
6.5.1 Attributes of Innovation
As shown in Table 6.36, the attributes of innovation dimension consists of five
variables: relative advantage, compatibility, complexity, trialability and observability.
The mean values of relative advantage differ in the three samples. For e-connectivity,
the mean value of relative advantage was 3.0036, which is lower than the values of
the two other groups of adopters ‘e-window and e-interactivity’ being 3.9125 and
4.0476, respectively. Moreover, the results of t-test shows that there were a
significant differences between the e-connectivity and e-window groups and between
the e-connectivity and e-interactivity with regard to relative advantage (p<0.05) which
indicates that the e-window group are more aware of technological than the e-
connectivity adopters. However, there were no significant differences between e-
window and e-interactivity in terms of relative advantage. In addition, the results
show that the mean values of compatibility for e-connectivity, e-window, and e-
interactivity were 2.8957, 3.8730 and 3.7127, respectively. The mean value for
compatibility was lower in the e-connectivity group than the e-window and e-
interactivity groups. In fact, the mean value of e-window group was close to that of e-
interactivity groups; and the t-test results show no significant differences in these
groups, while there was a significant difference between e-connectivity and e-
window groups and between e-connectivity and e-interactivity in terms of
compatibility, which indicates that adopters of higher levels e-commerce were more
aware of opportunities the web offers to their businesses. For the complexity variable,
the mean value in the e-connectivity group was 3.4945 , which higher than that of the
e-window group with 2.9898 and the e-interactivity group with 2.3258. This shows
that the e-connectivity group face more difficulty in understanding and using e-
commerce applications in their business than the other two higher levels of adopter
253
groups. Moreover, the t-test results show a significant differences between all three
levels of e-commerce adoption in terms of complexity, which indicates that the lower
levels of e-commerce adopters were less likely to adopt higher technology
applications because they found it difficult to use and understand than the higher
levels of adopters. For the trialability variable, the mean value in the e-connectivity
group was 2.3552, which lower than that of the e-window group with 2.6170 and the
e-interactivity group with 2.69170. This indicates that lower e-commerce adopters
were less aware of opportunities to exploit e-commerce applications on trial basis than
higher e-commerce adopters. The results of t-test show that there were significant
differences between e-connectivity and e-window groups and between e-connectivity
and e-interactivity groups regarding trialability (p<0.05); however, there were no
significant differences between e-window and e-interactivity with regard to awareness
of the opportunities of e-commerce applications trials. For the observability construct,
the mean value for e-interactivity group was 4.4364 compared to an e-connectivity
value of 3.1429 and e-window value of 3.9796. The results also show that there was a
significant difference between the three levels of e-commerce adoption in Jordanian
travel agencies, which suggests that the higher levels adopters were more aware of the
opportunities available through observability such as observing benefits obtained by
adopting e-commerce applications in other competitors .
6.5.2 Organisational Factors
The organisational factors dimension includes three variables: financial barriers,
employees’ IT knowledge and firm size. Table 6.36 shows that the mean value of the
financial barriers variable was higher in the e-connectivity group (3.0930) than the e-
window group (3.0027) and the e-interactivity group (2.9398), which indicates that
the lower levels e-commerce adopters have less available capital to implement e-
254
commerce applications than higher levels of adopters. However, the mean values of
the three groups were close to each other and the t-test results show that there was no
significant differences between three groups with regard to financial barriers (p>0.05).
The above table also shows that the mean value of employees’ IT knowledge for the
e-connectivity group was 3.9126, which is lower than those for the e-window with
3.9915 and the e-interactivity with 4.1263 groups. The t-test results show that there
was no significant differences between the e-connectivity and e-window groups or
between the e-window and e-interactivity groups while there were significant
differences between the e-connectivity and e-interactivity groups in terms of
employees IT knowledge (p>0.05) which suggests that employees in the higher levels
of e-commerce adoption in travel agents have more IT knowledge and skills than
simple adopters. The firm size variable was measured by categorical variable.
Therefore cross tabulation and Pearson chi-square tests were implemented between
current e-commerce adoption level in travel agencies and firm size. Table 6.37 shows
that there was a significant relationship between adoption level groups and firm size.
Also , Table 6.38 shows that the majority (73.6%) of e-connectivity group consisted
of micro-size firms while 26.4% of this group was small-size; however, there were no
medium-size firms in the e-connectivity group. Similarly, 83.7%, and 16.3% of the e-
window group were micro-size and small-size, respectively while there was no
medium-size firms in this group. In contrast, the percentage of micro-size firms in the
e-interactivity group was lower than those in the above mentioned two groups
representing 56% while the percentage of small-size firms was higher than those in e-
window and e-connectivity groups, respectively.
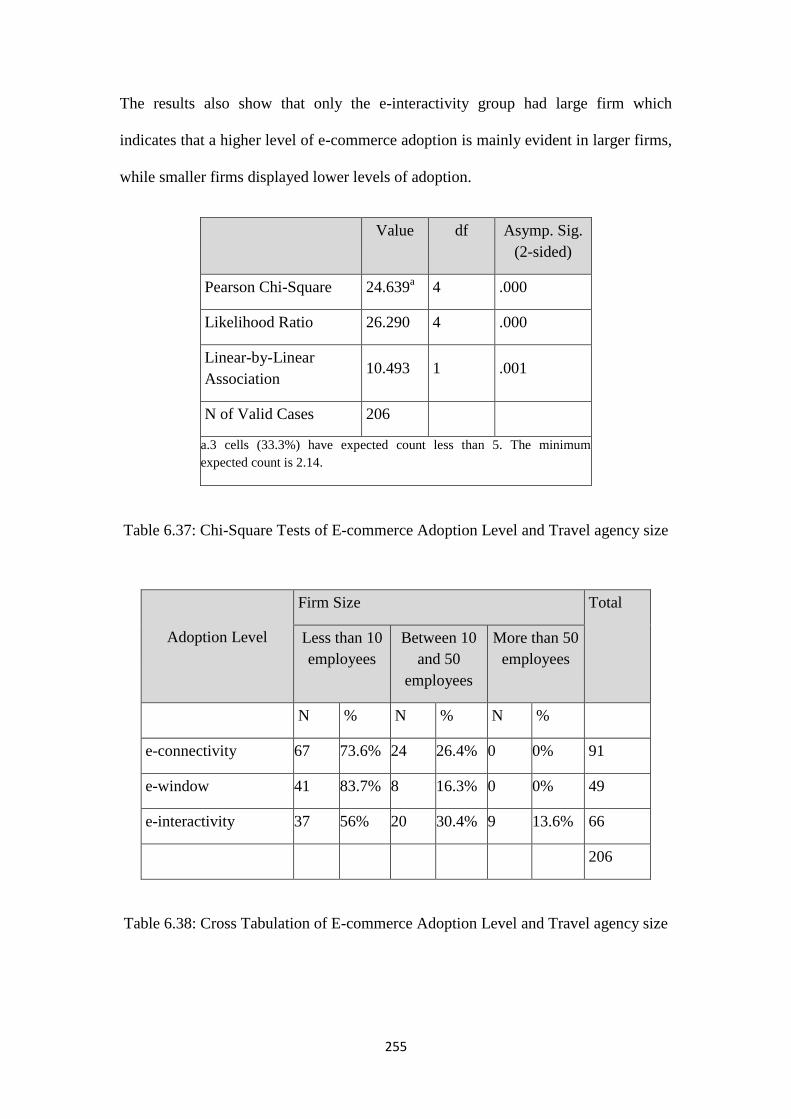
255
The results also show that only the e-interactivity group had large firm which
indicates that a higher level of e-commerce adoption is mainly evident in larger firms,
while smaller firms displayed lower levels of adoption.
Value df Asymp. Sig.
(2-sided)
Pearson Chi-Square 24.639a 4 .000
Likelihood Ratio 26.290 4 .000
Linear-by-Linear
Association 10.493 1 .001
N of Valid Cases 206
a.3 cells (33.3%) have expected count less than 5. The minimum
expected count is 2.14.
Table 6.37: Chi-Square Tests of E-commerce Adoption Level and Travel agency size
Adoption Level
Firm Size Total
Less than 10
employees
Between 10
and 50
employees
More than 50
employees
N % N % N %
e-connectivity 67 73.6% 24 26.4% 0 0% 91
e-window 41 83.7% 8 16.3% 0 0% 49
e-interactivity 37 56% 20 30.4% 9 13.6% 66
206
Table 6.38: Cross Tabulation of E-commerce Adoption Level and Travel agency size

256
6.5.3 Managerial Factors
The managerial factors dimension consists of four variables: power distance,
Manager’s attitude toward e-commerce applications, uncertainty avoidance and top
management support. Table 6.36 shows that the mean values of the power distance
variable differ in the three sample groups. In the e-connectivity group that value was
2.9094, which was lower than that of the e-window group with value of 3.0222, while
the mean value of power distance in the e-interactivity group was lower than those of
the two other groups, being 2.8193. Moreover, the results of the t-test show that there
were no significant differences between the three sample groups (p>0.05) which
indicates that that power distance variable is similar in all different groups of e-
commerce adoption. Moving to the top management support variable, the results
show that the mean for the e-connectivity group was 3.4019, lower than those of the
e-window and e-interactivity groups that were 3.8469 and 4.0985, respectively. This
suggests that higher levels of e-commerce adoption are relevant to higher
management support manifested in e-commerce implementation and
managers/owners better awareness of the opportunities possible through technology.
In addition, the results of t-test show that there were significant differences in the
three sample groups (p<0.05).
As for the uncertainty avoidance variable, the results show that the mean value for the
e-connectivity group was 3.092, higher than those of the e-window and e-interactivity
groups that were 2.1837 and 2.8193, respectively. Also, the t-test results show a
significant difference between the e-connectivity and e-window as well as between
the e-connectivity and e-interactivity groups in terms of uncertainty avoidance
(p<.05), while there were no significant differences between e-window and e-
interactivity groups (p>0.05). This indicates that simple adopters of e-commence were

257
less likely to take risks and are more reluctant to accept changes leading to adopting
higher sophisticated e-commerce applications.
For the manager’s attitude toward e-commerce applications, the results show 4.2639
as a mean value for the e-connectivity group, lower than those of the e-window and e-
interactivity groups, being 4.4490 and 4.4801, respectively. The results of t-test show
that there were significant differences between the e-connectivity and e-window
groups as well as between the e-connectivity and e-interactivity groups (p<0.05),
while there was no significant difference between e-window and e-interactivity
groups (p>0.05). This suggests that decision makers who adopted higher level of e-
commerce in their travel agents were more excited and have more positive outlook at
e-commerce applications than simple adopters.
6.5.4 Environmental Factors
The environmental factors dimension consists of four variables: competitive pressure,
supplier/partner pressure, customer pressure and government support. Table 6.36
shows 3.1740 to be the mean value of the competitive pressure variable in e-
connectivity group which is lower than those of e-window and e-interactivity groups
that were 3.3980 and 3.8636, respectively. The t-test results shows that there were
significant differences between the e-connectivity and e-window groups as well as
between the e-window and e-interactivity groups (p<0.05), while there were no
significant differences between the e-connectivity and e-window groups, which
indicates that owner/managers of travel agencies that have adopted higher level of e-
commerce were more influenced by other competitors in terms of e-commerce
adoption than lower level of e-commerce adopters. Regarding the Supplier/Partner
pressure variable the mean values of the e-connectivity, e-window and e-interactivity
groups were 2.7839, 4.1497 and 4.2576, respectively, indicating that such pressure
258
has more influence on higher levels of e-commerce adopters than lower levels of e-
commerce adopters. In addition, the results of t-test show that there were significant
differences between the e-connectivity and e-window groups as well as between the e-
connectivity and e-interactivity groups (p<0.05) while there were no significant
differences between e-window and e-interactivity groups (p>0.05). For the customers’
pressure variable, the results show that the mean value of this pressure in the e-
connectivity group was 2.2732, which is lower than the e-window and e-interactivity
groups whose mean values were 2.7619 and 3.0916, respectively. Although the mean
values in three sample groups were low, the results of t-test show significant
differences between them (p<0.05), which suggests that decision makers of higher
levels e-commerce adoption were more influenced by their customers’ pressure than
lower levels adopters. Regarding the government support, the data show that the mean
values of government support were the lowest in all sample groups. In the e-
connectivity group the mean values was 2.1414, which was lower than those of the e-
interactivity and e-window groups being 2.4732 and 2.2009, respectively. Although
there were no big differences between the mean values in all sample groups the results
of t-test show the significant differences between e-connectivity and e-window as
well as between e-window and e-interactivity (p<0.05) but no significant difference
between e-connectivity and e-window. This suggests that government support has
influence on e-commerce adoption levels among travel agencies in Jordan.
259
6.6 Inferential Statistics
The descriptive analysis results provided an initial idea on the factors that may
influence the adoption level of e-commerce; however, this results is not statistically
sufficient to answer the research questions and test the hypotheses of this study;
therefore, an additional statistical analysis was conducted. Based on the conceptual
framework and the questionnaire of the study, the independents variables were
measured by continuous and categorical questions, and the dependent variable was
measured by categorical groups. Therefore, the multinomial logistic regression was
appropriate for this study.
6.6.1 Data Analysis Methods
Logistic regression was applied in the current study to test the factors influencing
travel agencies e-commerce adoption levels. There were several reasons for selecting
the logistic regression method. First, this method is used to predict discrete outcomes
such groups or categorical dependent variables based on multiple independent
variables. Second, logistic regression is similar to multiple regressions, except that the
dependent variable is categorical, continuous, or a mix, while the dependent variable
in multiple regression is metric or numerical value (Field, 2009, Tabachnick and
Fidell, 2013). Finally, logistic regression is more flexible and robust than other
alternative statistical techniques such as discriminant analysis.
Tabachnick and Fidell (2013) argued that logistic regression does not have
assumptions like discriminant analysis. It is a significant difference as such
assumptions require normal distribution, linearity or equal of variance for independent
variables. Moreover, logistic regression is more flexible than discriminant analysis
because the independent variables in discriminant analysis have to be continuous,
while they can be a mix of continuous, nominal, and categorical in logistic regression.

260
All data in this study met the aforementioned assumptions, thus logistic regression
was applied rather than discriminant analysis due to several reasons. First, logistic
regression is consistent in all cases and gives valid results regardless whether the data
are distributed normally or not normally. Second, logistic regression is preferable
when the dependent variable is less than three categories while discriminant analysis
is preferable when this variable more exceeds three categories. Third, the outcomes of
the two methods are similar if the sample size is equal or more than 50 (Pohar et al.,
2004).
Logistic regression is divided into two types: Binary logistic regression and
multinomial logistic regression. Binary logistic regression is used when the dependent
variable is dichotomous (consisting of two categories), while the multinomial logistic
regression is an extension of binary logistic regression used in predicting the
dependant variable that have more than two categories (Field, 2009).
The dependent variable in this study consists of three categories of adoption groups
which necessitated using multinomial logistic regression to identify the predictor
variables that significantly influence the e-commerce adoption levels among travel
agencies in Jordan.
6.6.2 Multinomial Logistic Regression for E-commerce Adoption Levels in
Travel Agencies
Tabachnick and Fidell (2013) proposed testing multicollinearity before examining
multinomial logistic regression to avoid unreliable estimates of regression coefficient.
The results in Section 6.3.6 of this chapter show that all independents variables were
not highly correlated which confirms that there was no significant evidence of
multicollinearity problems among the research variables.
261
In this study, sixteen predictors’ variables were analysed using multinomial logistic
regression to identify their effects on each level of e-commerce adoption in travel
agencies. These e-commerce levels were categorized into three groups: e-connectivity
level, e-window level and e-interactivity level. After explaining the sixteen
independent variables used to predict the different dependent variables, a description
of multinomial logistic regression models is possible as follows:
Predicted logit (Y) = α+ β1x1 + β2x2+ β3x3+……. βnxn
Where:
Y= Dependent Variable
α is the constant of the equation
β is the regression coefficient
x is the predictor (independent variable)
6.6.2.1 Assessing Multinomial Regression Results
According to Tabachnick and Fidell (2013, p. 300) multinomial logistic regression
analysis “breaks the outcome variable down into a series of comparisons between two
categories”. Therefore, a reference category must be chosen for comparison between
other groups. Based on this definition, multinomial regression analysis was applied in
two separate runs. In the first run, the connectivity level was chosen as a reference
category to compare the estimated sets of coefficients of the two other groups (e-
window and e-interactivity). In the second run, the e-window level was chosen as a
reference category to compare the estimated sets of coefficients of the two other
groups (connectivity and e-interactivity). Table 6.39 shows goodness-of-fits which
examines whether the model adequately fits the data. Field (2009) argued that Pearson
and Deviance tests must not be significantly different from the observed value, which
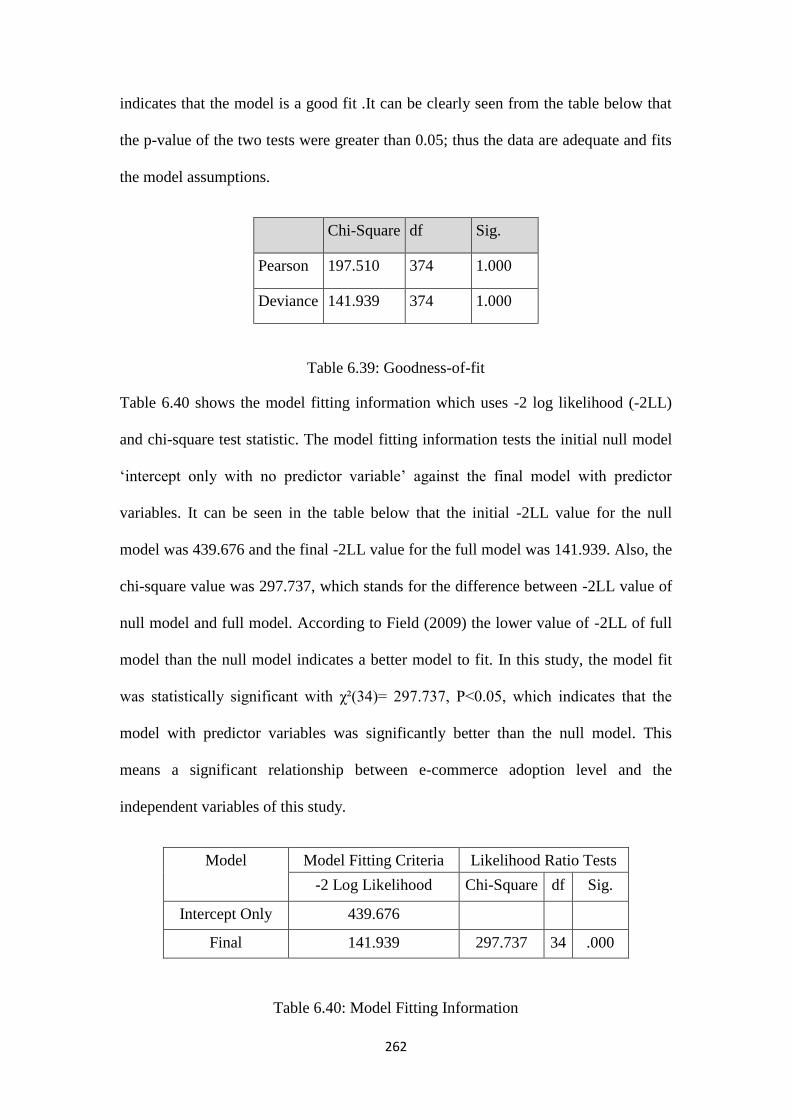
262
indicates that the model is a good fit .It can be clearly seen from the table below that
the p-value of the two tests were greater than 0.05; thus the data are adequate and fits
the model assumptions.
Chi-Square df Sig.
Pearson 197.510 374 1.000
Deviance 141.939 374 1.000
Table 6.39: Goodness-of-fit
Table 6.40 shows the model fitting information which uses -2 log likelihood (-2LL)
and chi-square test statistic. The model fitting information tests the initial null model
‘intercept only with no predictor variable’ against the final model with predictor
variables. It can be seen in the table below that the initial -2LL value for the null
model was 439.676 and the final -2LL value for the full model was 141.939. Also, the
chi-square value was 297.737, which stands for the difference between -2LL value of
null model and full model. According to Field (2009) the lower value of -2LL of full
model than the null model indicates a better model to fit. In this study, the model fit
was statistically significant with χ²(34)= 297.737, P<0.05, which indicates that the
model with predictor variables was significantly better than the null model. This
means a significant relationship between e-commerce adoption level and the
independent variables of this study.
Model Model Fitting Criteria Likelihood Ratio Tests
-2 Log Likelihood Chi-Square df Sig.
Intercept Only 439.676
Final 141.939 297.737 34 .000
Table 6.40: Model Fitting Information
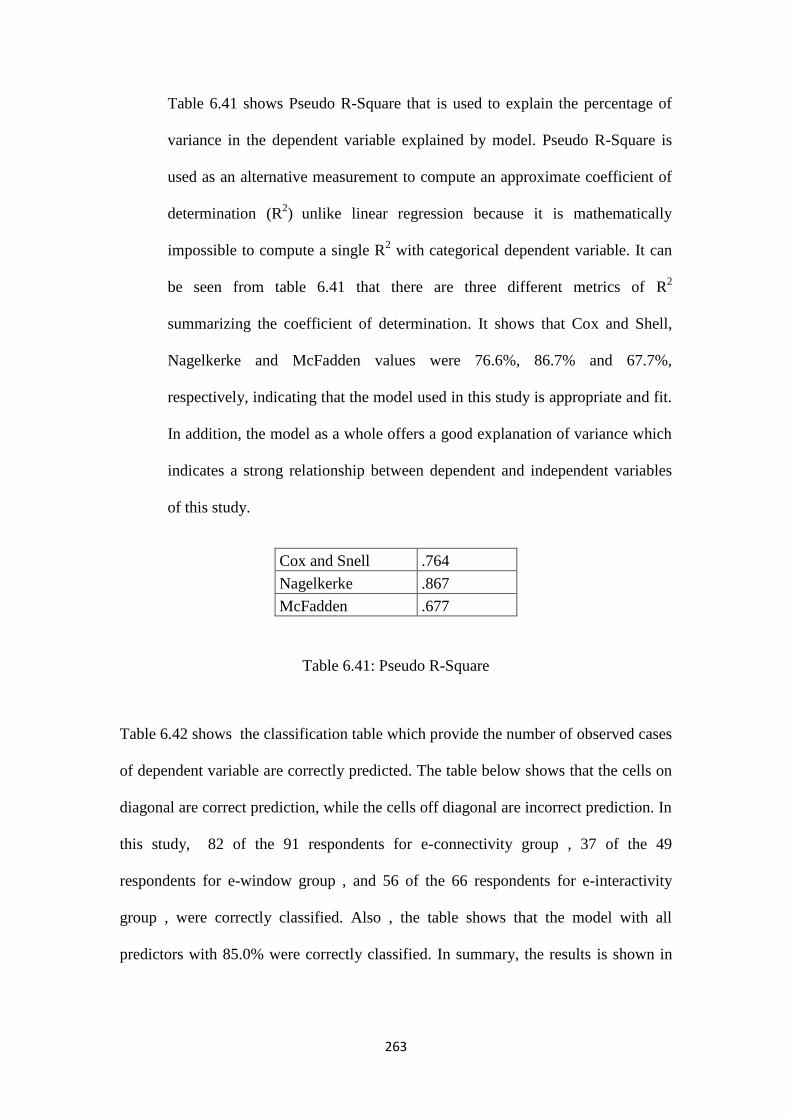
263
Table 6.41 shows Pseudo R-Square that is used to explain the percentage of
variance in the dependent variable explained by model. Pseudo R-Square is
used as an alternative measurement to compute an approximate coefficient of
determination (R2)
unlike linear regression because it is mathematically
impossible to compute a single R2 with categorical dependent variable. It can
be seen from table 6.41 that there are three different metrics of R2
summarizing the coefficient of determination. It shows that Cox and Shell,
Nagelkerke and McFadden values were 76.6%, 86.7% and 67.7%,
respectively, indicating that the model used in this study is appropriate and fit.
In addition, the model as a whole offers a good explanation of variance which
indicates a strong relationship between dependent and independent variables
of this study.
Cox and Snell .764
Nagelkerke .867
McFadden .677
Table 6.41: Pseudo R-Square
Table 6.42 shows the classification table which provide the number of observed cases
of dependent variable are correctly predicted. The table below shows that the cells on
diagonal are correct prediction, while the cells off diagonal are incorrect prediction. In
this study, 82 of the 91 respondents for e-connectivity group , 37 of the 49
respondents for e-window group , and 56 of the 66 respondents for e-interactivity
group , were correctly classified. Also , the table shows that the model with all
predictors with 85.0% were correctly classified. In summary, the results is shown in

264
the previous sections confirms the validity of model and shows that the overall model
in this study is good to predict all three levels of e-commerce adoption.
Observed Predicted
e-connectivity e-window e-interactivity Percent
Correct e-connectivity 82 5 4 90.1%
e-window 4 37 8 75.5%
e-interactivity 4 6 56 84.8%
Overall
Percentage
43.7% 23.3% 33.0% 85.0%
Table 6.42: Classification Table
Table 6.43 shows the likelihood ratio tests that are used to determine the contribution
and the effect of each predictor on the model. In other words, each predictor in the
model will be tested against the full model to indicate the significant weight of that
predictor within the model. As shown in the table below, there are two main variables:
-2 log likelihood of reduced model and chi-square. The -2 log likelihood of reduced
model is computed without selected predictor, whereas the chi-square represents the
difference between -2 log likelihood of reduced model and the final model reported in
the model fitting information table. In addition the table shows the P-value, as when
this value is < 0.05, the predictor would have a significant contribution in the model.
As seen below, ten predictors have a significant contribution in the model with p-
value <0.05: relative advantage, complexity, observability, financial barriers , power
distance, uncertainty avoidance, competitive pressure, Supplier/Partner pressure,
government support and firm size. On the other hand, compatibility, trialability,
employees IT knowledge, top management support, manager’s attitude toward e-
commerce applications and customer pressure have insignificant contribution in the
model.

265
Effect Model Fitting
Criteria
Likelihood Ratio
Tests
-2 Log Likelihood
of Reduced Model
Chi-
Square
df Sig.
Intercept 141.939a .000 0 .
Relative Advantage 149.477 7.538 2 .023
Compatibility 146.109 4.170 2 .124
Complexity 160.111 18.172 2 .000
Trialability 146.285 4.346 2 .114
Observability 182.087 40.148 2 .000
Financial Barriers 149.045 7.106 2 .029
Employees’ IT
Knowledge 146.269 4.330 2 .115
Power Distance 148.697 6.758 2 .034
Top Management
Support
144.721 2.782 2 .249
Uncertainty Avoidance 149.228 7.289 2 .026
Manager’ Attitude
toward e-commerce
145.536 3.597 2 .166
Competitive Pressure 151.064 9.125 2 .010
Supplier /Partner
Pressure 167.915 25.976 2 .000
Customer Pressure 144.354 2.415 2 .299
Government Support 157.338 15.399 2 .000
Travel agency Size 162.154 20.215 4 .000
The chi-square statistic is the difference in -2 log-likelihoods between the final model and
a reduced model. The reduced model is formed by omitting an effect from the final
model. The null hypothesis is where all parameters of that effect are 0.
a. This reduced model is equivalent to the final model because omitting the effect
does not increase the degrees of freedom.
Table 6.43: Likelihood Ratio Tests
266
Two separate runs of parameter estimates were conducted to compare between the
three different groups of e-commerce adoption. The e-connectivity group was chosen
in the first run as a reference category to compare between the e-window and e-
interactivity groups while the e-window was chosen in the second run as reference
category to compare it with the e-interactivity group (See Appendix B-5, table A.6.6 ,
and A.6.7 ). Table 6.44 presents a summary of parameter estimates that show results
of the effect of each predictor on the model, including the regression coefficient,
Wald statistic, and exponentiated beta. In the multinomial logistic regression
equation, each predictor is estimated by regression coefficient (β). A positive
regression coefficient (β) indicates that a predictor increase is a likely outcome of that
response category with respect to reference category, while the negative positive
regression coefficient (β) indicates that a predictor decrease is a likely outcome of that
response category with respect to reference category. Moreover, the parameter
estimates show the Exp(β) which is also called exponentiated beta or the odds ratios.
Field (2009) suggested that an Exp(β) less than 1 indicates that the predictor is less
likely to be involved in the outcome of the response category rather than the reference
category, while an Exp(β) higher than 1 indicates that predictor is more likely to be
involved in the outcome of the response category rather than the reference category.
Wald statistics is the most important part in parameter estimate as it is used to indicate
which predictor is statistically significant in the outcome (Field, 2009). According to
Field (2009), if the significant level of Wald statistic is a p-value lower than 0.05, the
predictor is accepted; if it is higher than 0.05, the predictor is rejected.
It can be concluded that there are three different equations of multinomial logistic
regression in this study as shown below :

267
Multinomial logistic regression equation 1:
Logit (e-window/e-connectivity_reference) = α+ β1Relative Advantage +
β2Compatibility+ β3 Complexity + β4Trialability + β5Observability + β6Financial
Barriers + β7Employees’ IT Knowledge + β8Firm Size + β9Power Distance + β10Top
Management Support + β11Uncertainty Avoidance + β12Manager’s Attitude +
β13Competitive Pressure + β14 Supplier/partner Pressure + β15Customer Pressure +
β16Government Support
And
Multinomial logistic regression equation 2:
Logit (e-interactivity/e-connectivity_reference) = α+ β1Relative Advantage +
β2Compatibility+ β3 Complexity + β4Trialability + β5Observability + β6Financial
Barriers + β7Employees’ IT Knowledge + β8Firm Size + β9Power Distance + β10Top
Management Support + β11Uncertainty Avoidance + β12Manager’s Attitude +
β13Competitive Pressure + β14 Supplier/Partner Pressure + β15Customer Pressure +
β16Government Support
And
Multinomial logistic regression equation 3:
Logit (e-interactivity /e-window_reference) = α+ β1Relative Advantage +
β2Compatibility+ β3 Complexity + β4Trialability + β5Observability + β6Financial
Barriers + β7Employees’ IT Knowledge + β8Firm Size + β9Power Distance + β10Top
Management Support + β11Uncertainty Avoidance + β12Manager’s Attitude +
β13Competitive Pressure + β14 Supplier/Partner Pressure + β15Customer Pressure +
β16Government Support.

268
6.6.2.2 E-window versus E-connectivity Results
In interpreting the results of each equation, Table 6.44 shows that five of the sixteen
predictors were a statistically significant contribution in the multinomial logistic
regression equation 1 with p-value <0.05 , which differentiates e-window from e-
connectivity. These significant predictors were relative advantage, observability,
uncertainty avoidance, supplier/partner pressure and government support .The results
showed that relative advantage had a positive effect on the possibility of
owners/managers’ decision to adopt e-window rather than e-connectivity. In other
words, the odd ratio showed that owners/managers who expressed a positive
comprehension of relative advantage were 4.356 times more likely to adopt e-window
than e-connectivity due to the positive β value. Also, observability had a positive and
significant effect on owners/managers’ decisions to adopt e-window compared toe-
connectivity. The odd ratio results showed that owners/managers who reported
positive answers of observability were 16.899 times more likely to adopt e-window
rather than e-connectivity due to the positive β value. Moreover, the results showed
that uncertainty avoidance had a significant and negative effect on the
owners/managers decisions in adopting e-window compared to e-connectivity. The
odd ratio of uncertainty avoidance was 0.235 with negative β value indicating that
owners/managers who reported positive answers of uncertainty avoidance were 0.217
times less likely to adopt e-window than e-connectivity. For the suppliers or partner
pressure, the results showed that it had a positive and significant effect on the
owners/managers decisions in adopting e-window compared to e-connectivity. The
odd ratio results showed that owners/managers who had more pressure from their
business partners or suppliers regarding e-commerce adoption were 15.772 times
more likely to adopt e-window than e-connectivity with positive β value. Finally, the
269
results showed that government support had a positive and significant effect on the
owners/managers decisions in adopting e-window compared to e-connectivity. The
odd ratio results showed that owners/managers who reported positive answers of
government support were 33.878 times more likely to adopt e-window than e-
connectivity due to the positive β value.
6.6.2.3 E-interactivity versus E-connectivity Results
Table 6.44 showed that seven of the sixteen predictors had statistically significant
contribution in the multinomial logistic regression equation 2 with p-value <0.05,
which differentiates between e-interactivity and e-connectivity. These significant
predictors were: relative advantage, complexity, observability, financial barriers,
power distance, Supplier/Partner pressure and governmental support. The results
showed that relative advantage was significant and positively correlated with the
possibility of owners/managers’ decision to adopt e-interactivity compared to e-
connectivity. The odd ratio showed that owners/managers who had positive answers
regarding the relative advantage were 6.626 times more likely to adopt e-interactivity
than e-connectivity. For the complexity predictor, the results showed that it was
significant but negatively differentiates between e-interactivity and e-connectivity.
The odd ratio results showed that managers/owners who reported positive answers to
complexity were 0.194 times less likely to adopt e-interactivity than e-connectivity.
Moreover, the results showed that observability had a significant and positive effect
on owners/managers’ decisions in adopting e-interactivity compared to e-
connectivity. The odd ratio results showed that owners/managers who reported
positive answers to observability were 93.512 times more likely to adopt e-
interactivity than e-connectivity due to the positive β value. In addition, the results
found that financial barriers was significant and had a negative effect on
270
owners/managers’ decisions in adopting e-interactivity compared to e-connectivity.
The odd ratio showed that owners/managers who reported positive answers to
financial barriers were 0.165 times less likely to adopt e-interactivity than e-
connectivity due to the negative β value. Similarly, the power distance predictor was
significant and negatively correlated with e-commerce adoption. The
owners/managers who reported positive answers to power distance were 0.198 times
less likely to adopt e-interactivity than e-connectivity due to the negative β value. For
the suppliers or partners pressure, the results showed that it had a positive and
significant effect on owners/managers’ decisions in adopting e-interactivity compared
to e-connectivity. The odd ratio results showed that owners/managers who had more
pressure from their business partners or suppliers regarding e-commerce adoption
were 11.913 times more likely to adopt e-interactivity rather than e-connectivity with
positive β value. Finally, the results showed that government support had a positive
and significant effect on owners/managers decisions in adopting e-interactivity than e-
connectivity. The odd ratio results showed that owners/managers who reported
positive answers to government support were 20.504 times more likely to adopt e-
interactivity rather than e-connectivity due to the positive β value.
6.6.2.4 E-interactivity versus E-window Results
Table 6.44 shows that four of the sixteen predictors had a statistically significant
contribution in the multinomial logistic regression equation 3 with p-value <0.05,
which differentiates between e-interactivity and e-window. These predictors include:
complexity, observability, firm size and competitive pressure. The results showed that
complexity predictors were significant but negatively differentiate between e-
interactivity and e-window. Also, the results showed that managers/owners who
reported positive answers to complexity were 0.270 times less likely to adopt e-
271
interactivity compared to e-window. Moreover, the results showed that observability
had a significant and positive effect on owners/managers’ decisions in adopting e-
interactivity compared to e-window. The odd ratio results show that owners/managers
who reported positive answers to observability were 5.534 times more likely to adopt
e-interactivity than e-window due to the positive β value. For firm size, this was
measured by three categorical questions where the variable NUM_EMP=1 refers to a
number of employees less than 10 comprising ‘micro-size company’, and,
NUM_EMP=2 refers to a number of employees between 10 and 50 comprising
‘small-size company’, and NUM_EMP=3 refers to a number of employees more than
50 comprising ‘medium-size company’. Table 6.44 shows that reference group is
number of employees NUM_EMP=3, which means that NUM_EMP=1 compares
with NUM_EMP=3 and NUM_EMP=2 compares with NUM_EMP=3. The results
showed that firm size was significant but it had a negative effect on adopting e-
interactivity compared to e-window. The odd ratio showed that micro-size and
medium size travel agencies were 3.729, and 8.590, respectively. These results
showed that micro-size and small-size travel agencies were less likely to adopt e-
interactivity than e-window in contrast with medium-size agencies that are more
likely to adopt e-interactivity than the other two groups. Finally, the results showed
that competitive pressure had a positive and significant effect on owners/managers
decisions in adopting e-interactivity compared to e-window. The odd ratio results
showed that owners/managers who had more pressure from their competitors in terms
of e-commerce adoption were 5.161 times more likely to adopt e-interactivity than e-
window.
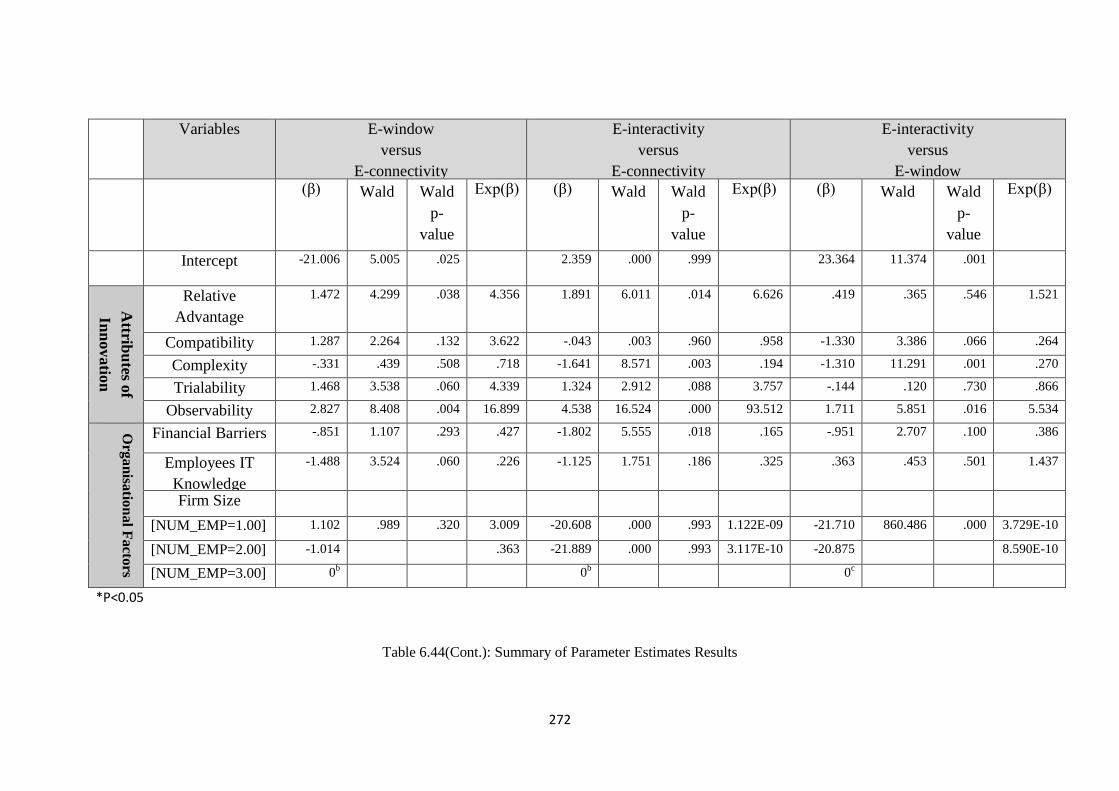
272
Variables
E-window
versus
E-connectivity
E-interactivity
versus
E-connectivity
E-interactivity
versus
E-window
(β) Wald Wald
p-
value
Exp(β)
(β) Wald Wald
p-
value
Exp(β)
(β) Wald Wald
p-
value
Exp(β)
Intercept -21.006 5.005 .025 2.359 .000 .999 23.364 11.374 .001
Attrib
utes o
f
Inn
ovatio
n
Relative
Advantage
1.472 4.299 .038 4.356 1.891 6.011 .014 6.626 .419 .365 .546 1.521
Compatibility 1.287 2.264 .132 3.622 -.043 .003 .960 .958 -1.330 3.386 .066 .264
Complexity -.331 .439 .508 .718 -1.641 8.571 .003 .194 -1.310 11.291 .001 .270
Trialability 1.468 3.538 .060 4.339 1.324 2.912 .088 3.757 -.144 .120 .730 .866
Observability 2.827 8.408 .004 16.899 4.538 16.524 .000 93.512 1.711 5.851 .016 5.534
Org
an
isatio
nal F
acto
rs
Financial Barriers -.851 1.107 .293 .427 -1.802 5.555 .018 .165 -.951 2.707 .100 .386
Employees IT
Knowledge
-1.488 3.524 .060 .226 -1.125 1.751 .186 .325 .363 .453 .501 1.437
Firm Size
[NUM_EMP=1.00] 1.102 .989 .320 3.009 -20.608 .000 .993 1.122E-09 -21.710 860.486 .000 3.729E-10
[NUM_EMP=2.00] -1.014 .363 -21.889 .000 .993 3.117E-10 -20.875 8.590E-10
[NUM_EMP=3.00]
0b 0
b 0
c
*P<0.05
Table 6.44(Cont.): Summary of Parameter Estimates Results
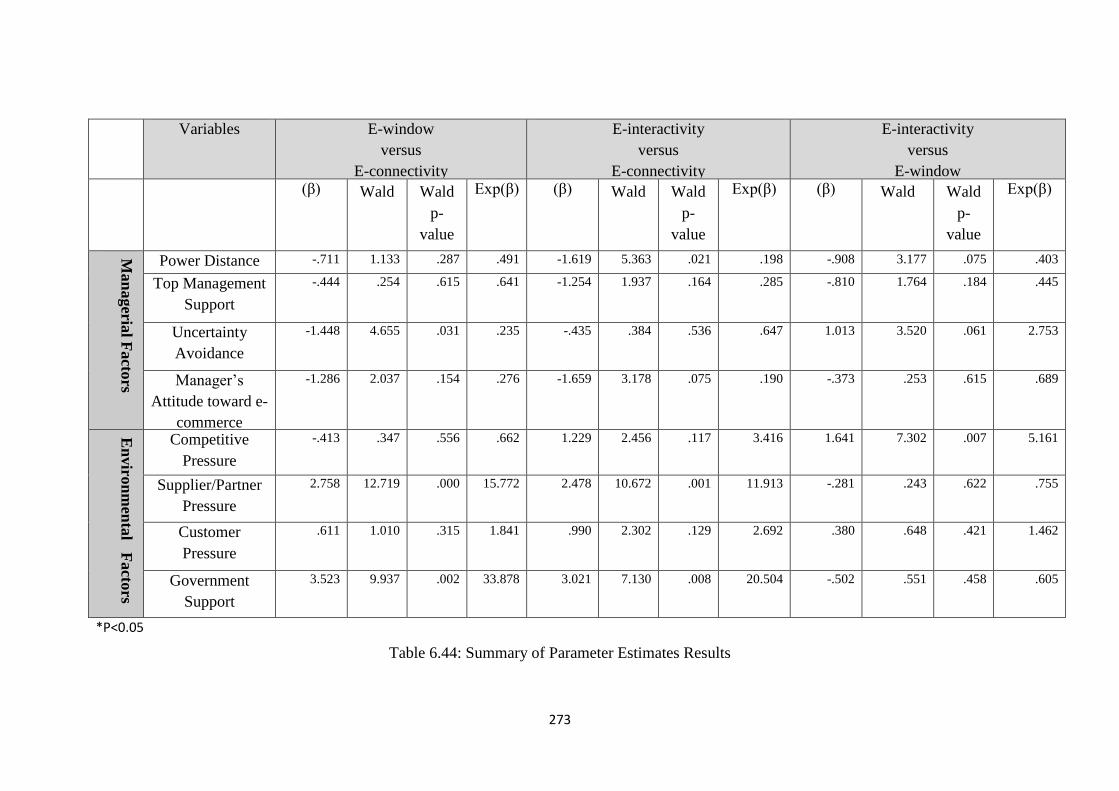
273
Variables
E-window
versus
E-connectivity
E-interactivity
versus
E-connectivity
E-interactivity
versus
E-window
(β) Wald Wald
p-
value
Exp(β)
(β) Wald Wald
p-
value
Exp(β)
(β) Wald Wald
p-
value
Exp(β)
Man
ageria
l Facto
rs
Power Distance -.711 1.133 .287 .491 -1.619 5.363 .021 .198 -.908 3.177 .075 .403
Top Management
Support
-.444 .254 .615 .641 -1.254 1.937 .164 .285 -.810 1.764 .184 .445
Uncertainty
Avoidance
-1.448 4.655 .031 .235 -.435 .384 .536 .647 1.013 3.520 .061 2.753
Manager’s
Attitude toward e-
commerce
-1.286 2.037 .154 .276 -1.659 3.178 .075 .190 -.373 .253 .615 .689
En
viro
nm
enta
l Facto
rs
Competitive
Pressure
-.413 .347 .556 .662 1.229 2.456 .117 3.416 1.641 7.302 .007 5.161
Supplier/Partner
Pressure
2.758 12.719 .000 15.772 2.478 10.672 .001 11.913 -.281 .243 .622 .755
Customer
Pressure
.611 1.010 .315 1.841 .990 2.302 .129 2.692 .380 .648 .421 1.462
Government
Support
3.523 9.937 .002 33.878 3.021 7.130 .008 20.504 -.502 .551 .458 .605
*P<0.05
Table 6.44: Summary of Parameter Estimates Results

274
6.7 Hypotheses Results for Multinomial Regression Analysis and their Relation
to Adoption Levels of E-commerce in Travel Agencies
Table 6.45 presents a summary of multinomial logistic regression analysis findings
against the proposed hypotheses across the three models of e-commence adoption
levels (e-window versus e-connectivity, e-interactivity versus e-connectivity, e-
interactivity versus e-window). It is noteworthy in the table below that hypotheses
results were not similar across all models because a single set of all hypotheses in this
research was used to test the influence of owners/managers’ decisions regarding the
three different levels of e-commerce adoption by travel agencies in Jordan. It can be
clearly seen in Table 6.45 that H1, H5, H11, H14 and H15 for model 1 (e-window
versus e-connectivity) were significant and correlated with the e-commerce adoption
level. In other word, these hypotheses have influenced owners/managers’ decisions to
adopt a statistic website (e-window) rather than using the internet with only e-mail (e-
connectivity). Conversely, the remaining hypotheses were found insignificant and
poor for Model 1. As can be seen from Table 6.45, it was found that the most
significant predictor in Model 1 was government support with odd ratio of 33.878.
This was followed by observability, Supplier/Partner pressure, relative advantage and
uncertainty avoidance, with odd ratios of 16.899, 15.772, 4.356 and 0.235,
respectively. For Model 2, e-interactivity versus e-connectivity, the results of
multinomial logistic regression show that H1, H3, H5, H7, H10, H14 and H16 were
significant and correlated with the e-commerce adoption level in travel agencies,
while the remaining hypotheses were found poor and insignificant. The supported
hypotheses mean that they have actually influenced owners/manager’s decisions to
adopt e-interactivity in their travel agencies instead of merely e-connectivity through
only using e-mail. The results show that the strongest predictor in this model was
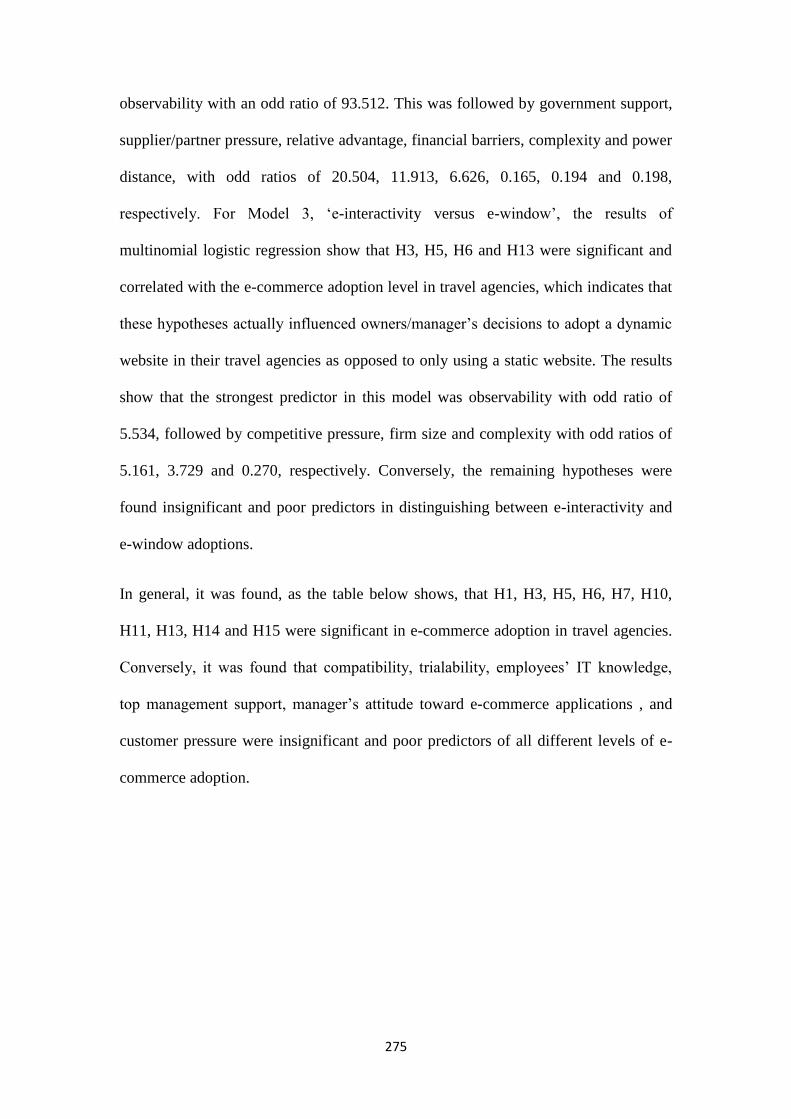
275
observability with an odd ratio of 93.512. This was followed by government support,
supplier/partner pressure, relative advantage, financial barriers, complexity and power
distance, with odd ratios of 20.504, 11.913, 6.626, 0.165, 0.194 and 0.198,
respectively. For Model 3, ‘e-interactivity versus e-window’, the results of
multinomial logistic regression show that H3, H5, H6 and H13 were significant and
correlated with the e-commerce adoption level in travel agencies, which indicates that
these hypotheses actually influenced owners/manager’s decisions to adopt a dynamic
website in their travel agencies as opposed to only using a static website. The results
show that the strongest predictor in this model was observability with odd ratio of
5.534, followed by competitive pressure, firm size and complexity with odd ratios of
5.161, 3.729 and 0.270, respectively. Conversely, the remaining hypotheses were
found insignificant and poor predictors in distinguishing between e-interactivity and
e-window adoptions.
In general, it was found, as the table below shows, that H1, H3, H5, H6, H7, H10,
H11, H13, H14 and H15 were significant in e-commerce adoption in travel agencies.
Conversely, it was found that compatibility, trialability, employees’ IT knowledge,
top management support, manager’s attitude toward e-commerce applications , and
customer pressure were insignificant and poor predictors of all different levels of e-
commerce adoption.
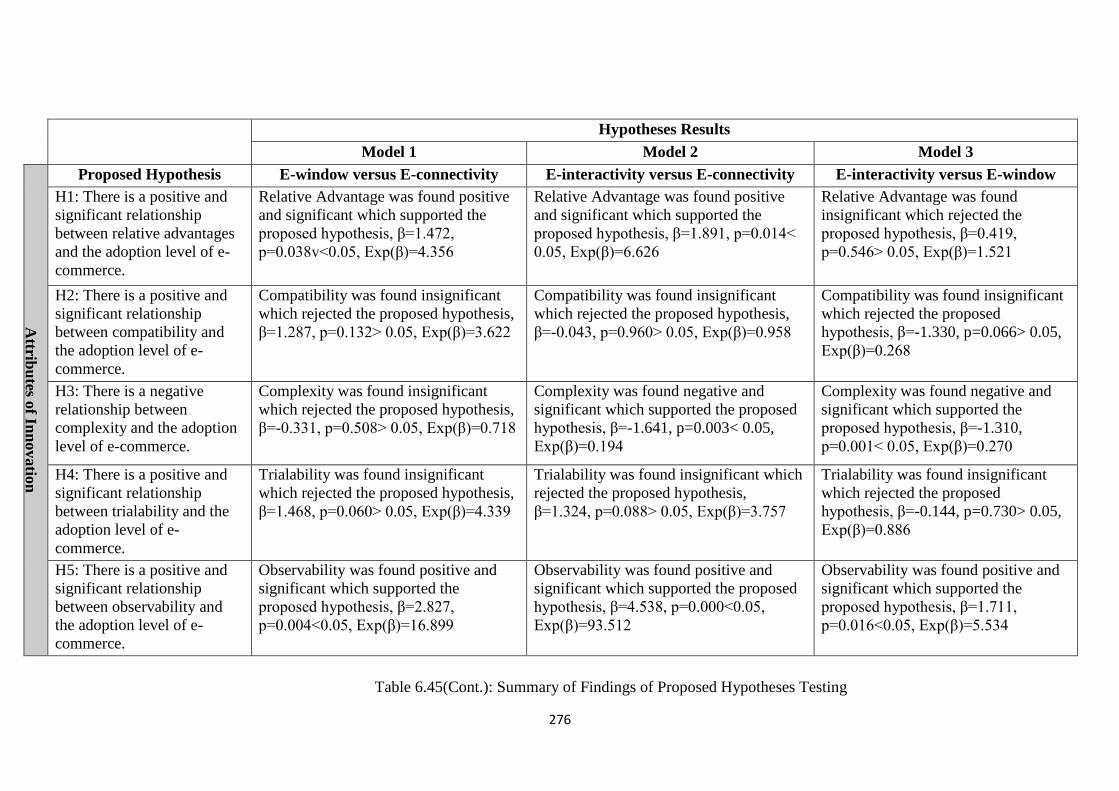
276
Hypotheses Results
Model 1 Model 2 Model 3
Attrib
utes o
f Inn
ovatio
n
Proposed Hypothesis E-window versus E-connectivity E-interactivity versus E-connectivity E-interactivity versus E-window
H1: There is a positive and
significant relationship
between relative advantages
and the adoption level of e-
commerce.
Relative Advantage was found positive
and significant which supported the
proposed hypothesis, β=1.472,
p=0.038v<0.05, Exp(β)=4.356
Relative Advantage was found positive
and significant which supported the
proposed hypothesis, β=1.891, p=0.014<
0.05, Exp(β)=6.626
Relative Advantage was found
insignificant which rejected the
proposed hypothesis, β=0.419,
p=0.546> 0.05, Exp(β)=1.521
H2: There is a positive and
significant relationship
between compatibility and
the adoption level of e-
commerce.
Compatibility was found insignificant
which rejected the proposed hypothesis,
β=1.287, p=0.132> 0.05, Exp(β)=3.622
Compatibility was found insignificant
which rejected the proposed hypothesis,
β=-0.043, p=0.960> 0.05, Exp(β)=0.958
Compatibility was found insignificant
which rejected the proposed
hypothesis, β=-1.330, p=0.066> 0.05,
Exp(β)=0.268
H3: There is a negative
relationship between
complexity and the adoption
level of e-commerce.
Complexity was found insignificant
which rejected the proposed hypothesis,
β=-0.331, p=0.508> 0.05, Exp(β)=0.718
Complexity was found negative and
significant which supported the proposed
hypothesis, β=-1.641, p=0.003< 0.05,
Exp(β)=0.194
Complexity was found negative and
significant which supported the
proposed hypothesis, β=-1.310,
p=0.001< 0.05, Exp(β)=0.270
H4: There is a positive and
significant relationship
between trialability and the
adoption level of e-
commerce.
Trialability was found insignificant
which rejected the proposed hypothesis,
β=1.468, p=0.060> 0.05, Exp(β)=4.339
Trialability was found insignificant which
rejected the proposed hypothesis,
β=1.324, p=0.088> 0.05, Exp(β)=3.757
Trialability was found insignificant
which rejected the proposed
hypothesis, β=-0.144, p=0.730> 0.05,
Exp(β)=0.886
H5: There is a positive and
significant relationship
between observability and
the adoption level of e-
commerce.
Observability was found positive and
significant which supported the
proposed hypothesis, β=2.827,
p=0.004<0.05, Exp(β)=16.899
Observability was found positive and
significant which supported the proposed
hypothesis, β=4.538, p=0.000<0.05,
Exp(β)=93.512
Observability was found positive and
significant which supported the
proposed hypothesis, β=1.711,
p=0.016<0.05, Exp(β)=5.534
Table 6.45(Cont.): Summary of Findings of Proposed Hypotheses Testing
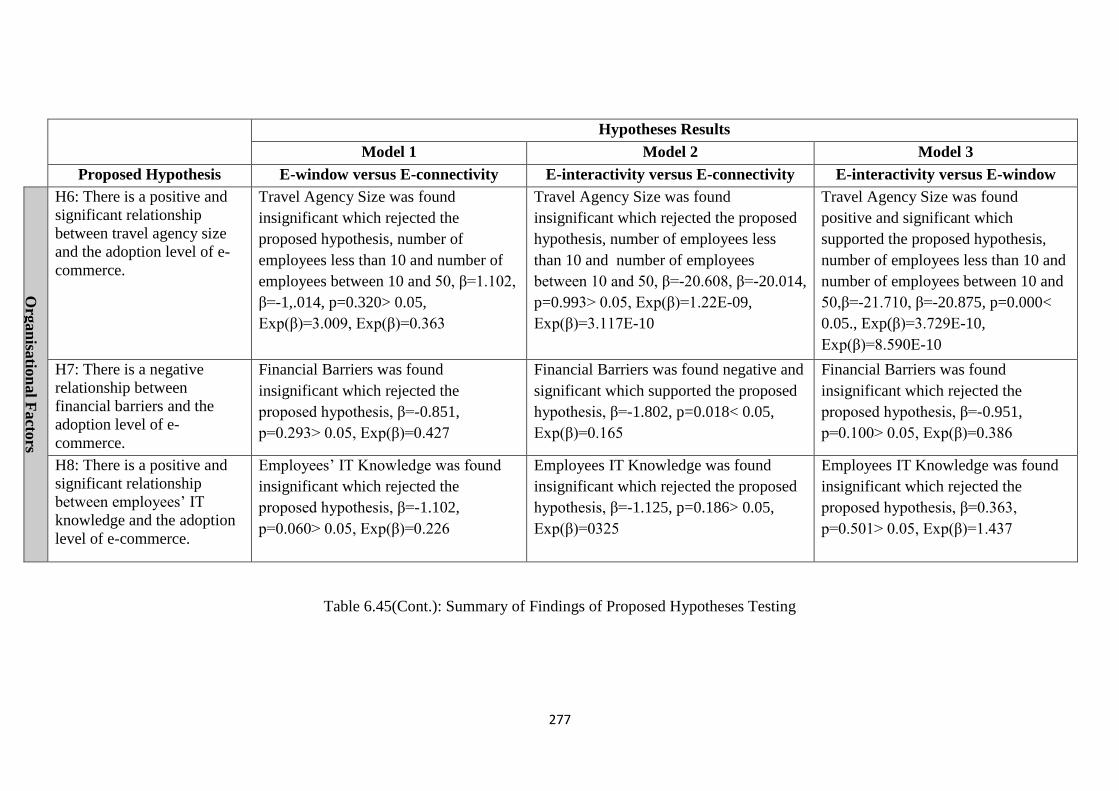
277
Hypotheses Results
Model 1 Model 2 Model 3
Proposed Hypothesis E-window versus E-connectivity E-interactivity versus E-connectivity E-interactivity versus E-window
Org
an
isatio
nal F
acto
rs
H6: There is a positive and
significant relationship
between travel agency size
and the adoption level of e-
commerce.
Travel Agency Size was found
insignificant which rejected the
proposed hypothesis, number of
employees less than 10 and number of
employees between 10 and 50, β=1.102,
β=-1,.014, p=0.320> 0.05,
Exp(β)=3.009, Exp(β)=0.363
Travel Agency Size was found
insignificant which rejected the proposed
hypothesis, number of employees less
than 10 and number of employees
between 10 and 50, β=-20.608, β=-20.014,
p=0.993> 0.05, Exp(β)=1.22E-09,
Exp(β)=3.117E-10
Travel Agency Size was found
positive and significant which
supported the proposed hypothesis,
number of employees less than 10 and
number of employees between 10 and
50,β=-21.710, β=-20.875, p=0.000<
0.05., Exp(β)=3.729E-10,
Exp(β)=8.590E-10
H7: There is a negative
relationship between
financial barriers and the
adoption level of e-
commerce.
Financial Barriers was found
insignificant which rejected the
proposed hypothesis, β=-0.851,
p=0.293> 0.05, Exp(β)=0.427
Financial Barriers was found negative and
significant which supported the proposed
hypothesis, β=-1.802, p=0.018< 0.05,
Exp(β)=0.165
Financial Barriers was found
insignificant which rejected the
proposed hypothesis, β=-0.951,
p=0.100> 0.05, Exp(β)=0.386
H8: There is a positive and
significant relationship
between employees’ IT
knowledge and the adoption
level of e-commerce.
Employees’ IT Knowledge was found
insignificant which rejected the
proposed hypothesis, β=-1.102,
p=0.060> 0.05, Exp(β)=0.226
Employees IT Knowledge was found
insignificant which rejected the proposed
hypothesis, β=-1.125, p=0.186> 0.05,
Exp(β)=0325
Employees IT Knowledge was found
insignificant which rejected the
proposed hypothesis, β=0.363,
p=0.501> 0.05, Exp(β)=1.437
Table 6.45(Cont.): Summary of Findings of Proposed Hypotheses Testing
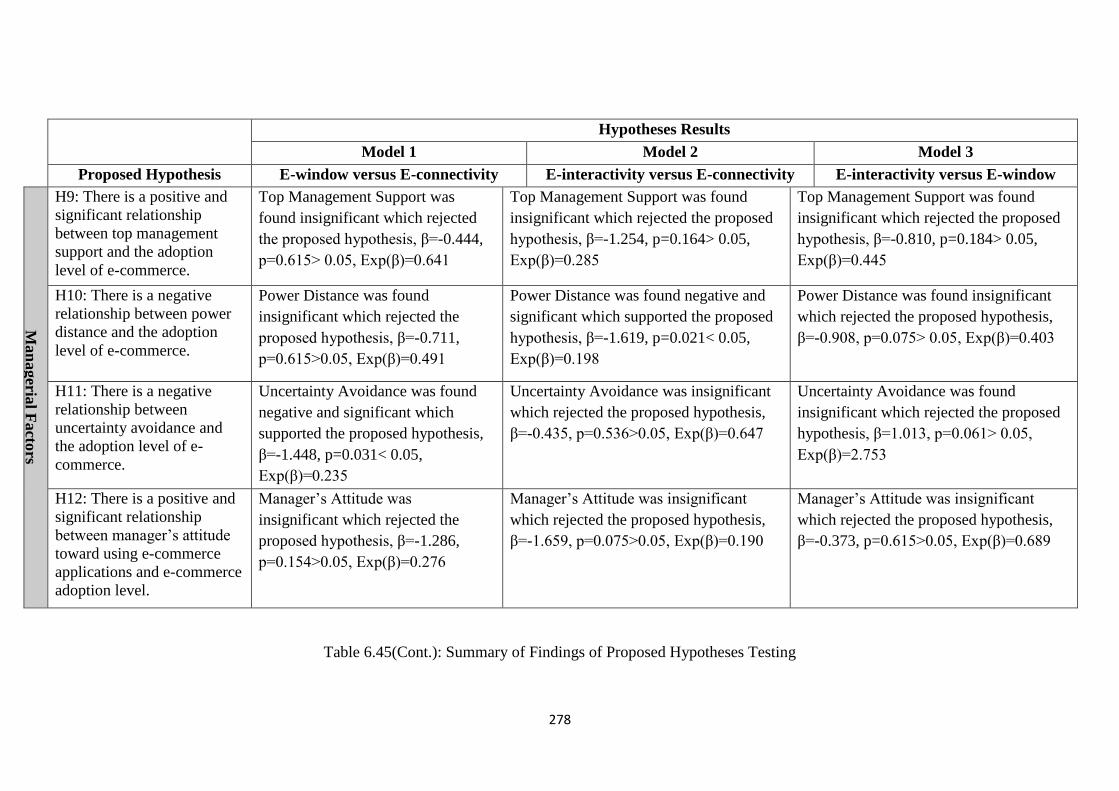
278
Hypotheses Results
Model 1 Model 2 Model 3
Proposed Hypothesis E-window versus E-connectivity E-interactivity versus E-connectivity E-interactivity versus E-window
Man
ageria
l Facto
rs
H9: There is a positive and
significant relationship
between top management
support and the adoption
level of e-commerce.
Top Management Support was
found insignificant which rejected
the proposed hypothesis, β=-0.444,
p=0.615> 0.05, Exp(β)=0.641
Top Management Support was found
insignificant which rejected the proposed
hypothesis, β=-1.254, p=0.164> 0.05,
Exp(β)=0.285
Top Management Support was found
insignificant which rejected the proposed
hypothesis, β=-0.810, p=0.184> 0.05,
Exp(β)=0.445
H10: There is a negative
relationship between power
distance and the adoption
level of e-commerce.
Power Distance was found
insignificant which rejected the
proposed hypothesis, β=-0.711,
p=0.615>0.05, Exp(β)=0.491
Power Distance was found negative and
significant which supported the proposed
hypothesis, β=-1.619, p=0.021< 0.05,
Exp(β)=0.198
Power Distance was found insignificant
which rejected the proposed hypothesis,
β=-0.908, p=0.075> 0.05, Exp(β)=0.403
H11: There is a negative
relationship between
uncertainty avoidance and
the adoption level of e-
commerce.
Uncertainty Avoidance was found
negative and significant which
supported the proposed hypothesis,
β=-1.448, p=0.031< 0.05,
Exp(β)=0.235
Uncertainty Avoidance was insignificant
which rejected the proposed hypothesis,
β=-0.435, p=0.536>0.05, Exp(β)=0.647
Uncertainty Avoidance was found
insignificant which rejected the proposed
hypothesis, β=1.013, p=0.061> 0.05,
Exp(β)=2.753
H12: There is a positive and
significant relationship
between manager’s attitude
toward using e-commerce
applications and e-commerce
adoption level.
Manager’s Attitude was
insignificant which rejected the
proposed hypothesis, β=-1.286,
p=0.154>0.05, Exp(β)=0.276
Manager’s Attitude was insignificant
which rejected the proposed hypothesis,
β=-1.659, p=0.075>0.05, Exp(β)=0.190
Manager’s Attitude was insignificant
which rejected the proposed hypothesis,
β=-0.373, p=0.615>0.05, Exp(β)=0.689
Table 6.45(Cont.): Summary of Findings of Proposed Hypotheses Testing
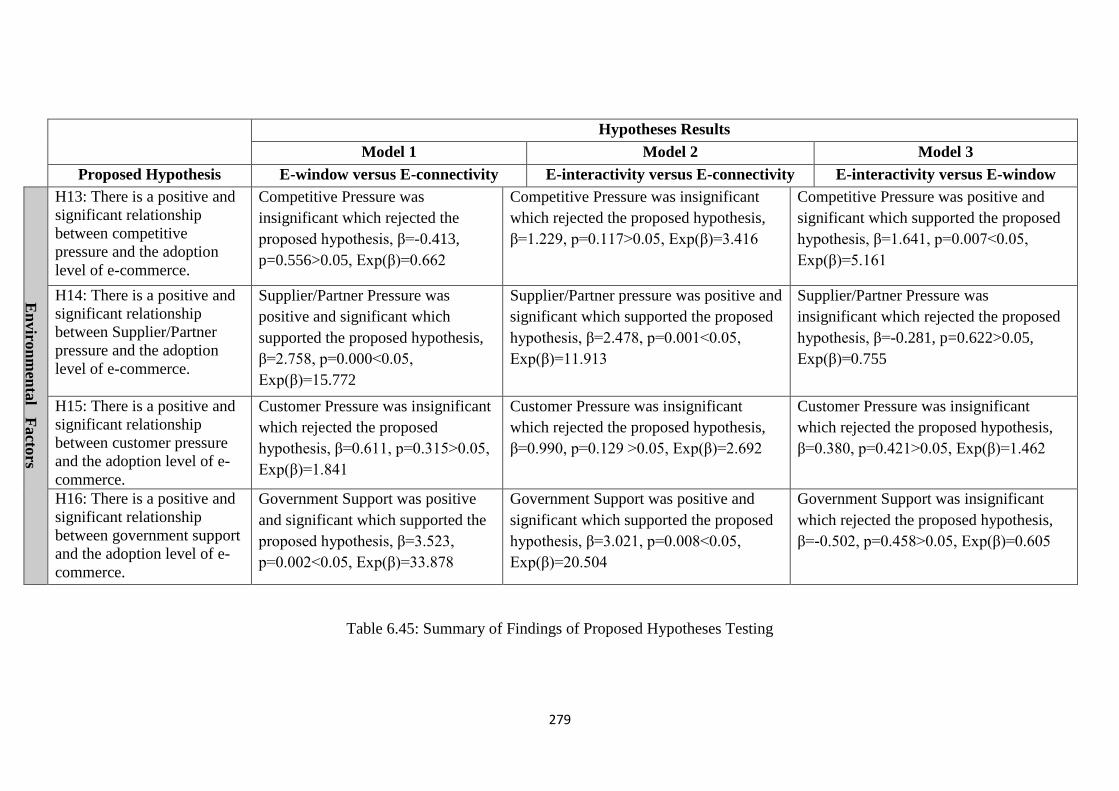
279
Hypotheses Results
Model 1 Model 2 Model 3
Proposed Hypothesis E-window versus E-connectivity E-interactivity versus E-connectivity E-interactivity versus E-window
En
viro
nm
enta
l Facto
rs
H13: There is a positive and
significant relationship
between competitive
pressure and the adoption
level of e-commerce.
Competitive Pressure was
insignificant which rejected the
proposed hypothesis, β=-0.413,
p=0.556>0.05, Exp(β)=0.662
Competitive Pressure was insignificant
which rejected the proposed hypothesis,
β=1.229, p=0.117>0.05, Exp(β)=3.416
Competitive Pressure was positive and
significant which supported the proposed
hypothesis, β=1.641, p=0.007<0.05,
Exp(β)=5.161
H14: There is a positive and
significant relationship
between Supplier/Partner
pressure and the adoption
level of e-commerce.
Supplier/Partner Pressure was
positive and significant which
supported the proposed hypothesis,
β=2.758, p=0.000<0.05,
Exp(β)=15.772
Supplier/Partner pressure was positive and
significant which supported the proposed
hypothesis, β=2.478, p=0.001<0.05,
Exp(β)=11.913
Supplier/Partner Pressure was
insignificant which rejected the proposed
hypothesis, β=-0.281, p=0.622>0.05,
Exp(β)=0.755
H15: There is a positive and
significant relationship
between customer pressure
and the adoption level of e-
commerce.
Customer Pressure was insignificant
which rejected the proposed
hypothesis, β=0.611, p=0.315>0.05,
Exp(β)=1.841
Customer Pressure was insignificant
which rejected the proposed hypothesis,
β=0.990, p=0.129 >0.05, Exp(β)=2.692
Customer Pressure was insignificant
which rejected the proposed hypothesis,
β=0.380, p=0.421>0.05, Exp(β)=1.462
H16: There is a positive and
significant relationship
between government support
and the adoption level of e-
commerce.
Government Support was positive
and significant which supported the
proposed hypothesis, β=3.523,
p=0.002<0.05, Exp(β)=33.878
Government Support was positive and
significant which supported the proposed
hypothesis, β=3.021, p=0.008<0.05,
Exp(β)=20.504
Government Support was insignificant
which rejected the proposed hypothesis,
β=-0.502, p=0.458>0.05, Exp(β)=0.605
Table 6.45: Summary of Findings of Proposed Hypotheses Testing

280
6.8 Chapter Summary
This chapter reported the results of data analyse from obtained research survey. In this
chapter, data preparation, coding, screening and cleaning were first addressed to
insure that data is free of errors, accurate and ready for analysis. Non-response bias,
checking outliers, multicollinearity and normal distribution were then examined and
verified as acceptable to avoid any statistical problems that can be associated with the
regression analysis in this study. Then, reliability and validity were established using
Cronbach’s alpha, factor analysis and composite reliability. This was followed by a
descriptive analysis of demographic information, providing a general profile of
companies’ information, respondents’ information and e-commerce current adoption
level by travel agencies in Jordan. Then, a descriptive analysis and t-test of the
independent variables were conducted to provide an overview of the variables
associated with e-commence adoption levels. Finally, multinomial logistic regression
was applied to test the proposed hypotheses relating to e-commerce adoption,
showing that ten of the sixteen hypotheses were supported with e-commerce adoption.
For Model 1, five hypotheses were found significant: relative advantage,
observability, Supplier/Partner pressure, uncertainty avoidance and government
support, which differentiate between e-window and e-connectivity. For Model 2, six
hypotheses (relative advantage, observability, financial barriers, power distance,
Supplier/Partner pressure, and government support) were found significant and
differentiate between e-interactivity and e-connectivity. For Model 3, four hypotheses
were found significant and differentiate between e-interactivity and e-window. These
significant hypotheses were: complexity, observability, firm size and competitive
pressure. However, the results showed that six hypotheses (compatibility, trialability,
employees’ IT knowledge, top management support, manager’s attitude toward e-

281
commerce applications , and customer pressure) were insignificant in e-commerce
adoption. Chapter 8 will follow to discuss in details the results of these hypotheses.

282
Chapter Seven
Discussion of Findings
283
7.1 Introduction
This chapter discusses the findings of hypothesis testing presented in chapter six and
compares them with the reviewed literature presented in chapter four. The chapter is
divided into five main sections. The first presents the characteristics of the surveyed
respondents and the second the characteristics of the surveyed Jordanian travel
agencies. The third section addresses the results of the surveyed sample regarding the
current state of e-commerce adoption by Jordanian travel agencies. This is followed
by discussing the research hypotheses results based on the proposed conceptual model
of this study and the reviewed literature, while the final section offers a summary of
the chapter.
7.2 Respondents General Characteristics
The survey has been provided to 300 of travel agents in Jordan, with a sampling frame
drawn from the Jordan Society of Tourism and Travel Agents (JSTA). The final
sample size consisting of 206 respondents is considered useful for the analysis and
represents a 68.6% response rate. The respondents were owners/managers of travel
agencies in Jordan, 40.3% of who were between 41 and 50 years old. The results also
show that the majority of respondents (77.2%) had a university degree, indicating a
high level of education.
7.3 Travel Agents General Characteristics
According to the Jordan Society of Tourism and Travel Agents (JSTA, 2013) the total
number of travel agencies in Jordan is 631, the majority (82.7%) of whom based in
the capital city of Jordan, Amman. In addition, travel agencies in Jordan are classified
into three types: A, B and C. Type B agencies were the majority of total sample
frame, accounting for 82%, followed by A then C accounting for 13% and 5.3%,

284
respectively. Out of 206 of responses , the results show that Type B agencies
provided the highest number of respondents, accounting for 75.2% of the sample,
followed by Type A then Type C, representing 17% and 7.8%, respectively.
These results were expected and approximately mirrored the sampling frame.
Regarding firm size, the results show that the majority of samples were micro-sized
firms, representing 70.4%, followed by small-sized then medium-sized firms that
accounting for 25.2% and 4.4%, respectively. In terms of travel agencies age, the
results show that the majority in the market were established between 6 and 10 years,
representing 42.7%, followed by 17% that have been in the market for over 10 years,
which indicates having sufficient experience in this industry.
7.4 General Characteristics of E-commerce in Travel Agencies in Jordan
The second objective of the research was to identify the current state of e-commerce
adoption by Jordanian travel agencies. Several earlier studies investigated factors
associated with e-commerce adoption in SMEs; however, emphasis was on whether
those enterprises have adopted or not adopted e-commerce applications
(Sutanonpaiboon and Pearson 2008; Teo and Ranganathan, 2004; Sparling et al, 2007;
Kurnia et al., 2009; Huy et al., 2012). Others have only focused on identifying any
intention to adopt such applications (Nasco et al 2008; Wymer and Regan , 2005;
Lippert and Govindarajulu, 2006).
As discussed in chapter four, there are e-commerce maturity levels of e-commerce
adoption in SMEs varying from non-adoption that includes no internet connectivity to
most sophisticated levels of e-commerce adoption such as online payment, customer
relationship management and enterprise resource planning within companies that
provide online services for both employees and customers.
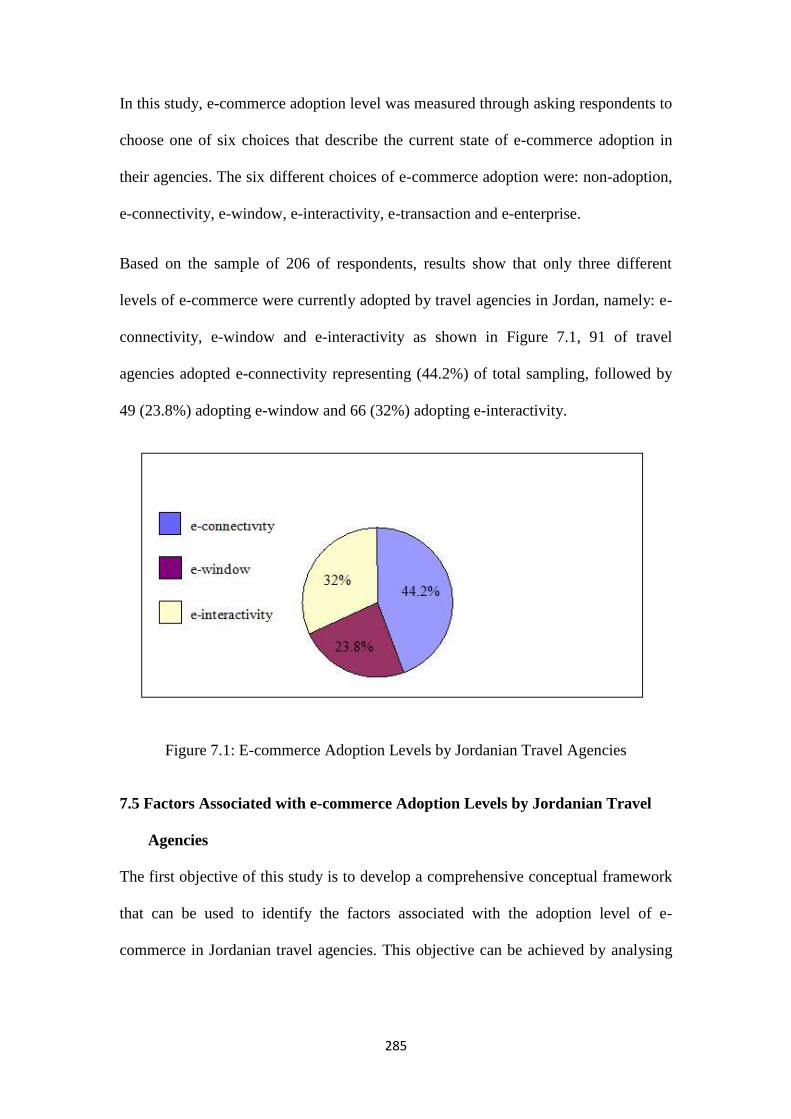
285
In this study, e-commerce adoption level was measured through asking respondents to
choose one of six choices that describe the current state of e-commerce adoption in
their agencies. The six different choices of e-commerce adoption were: non-adoption,
e-connectivity, e-window, e-interactivity, e-transaction and e-enterprise.
Based on the sample of 206 of respondents, results show that only three different
levels of e-commerce were currently adopted by travel agencies in Jordan, namely: e-
connectivity, e-window and e-interactivity as shown in Figure 7.1, 91 of travel
agencies adopted e-connectivity representing (44.2%) of total sampling, followed by
49 (23.8%) adopting e-window and 66 (32%) adopting e-interactivity.
Figure 7.1: E-commerce Adoption Levels by Jordanian Travel Agencies
7.5 Factors Associated with e-commerce Adoption Levels by Jordanian Travel
Agencies
The first objective of this study is to develop a comprehensive conceptual framework
that can be used to identify the factors associated with the adoption level of e-
commerce in Jordanian travel agencies. This objective can be achieved by analysing
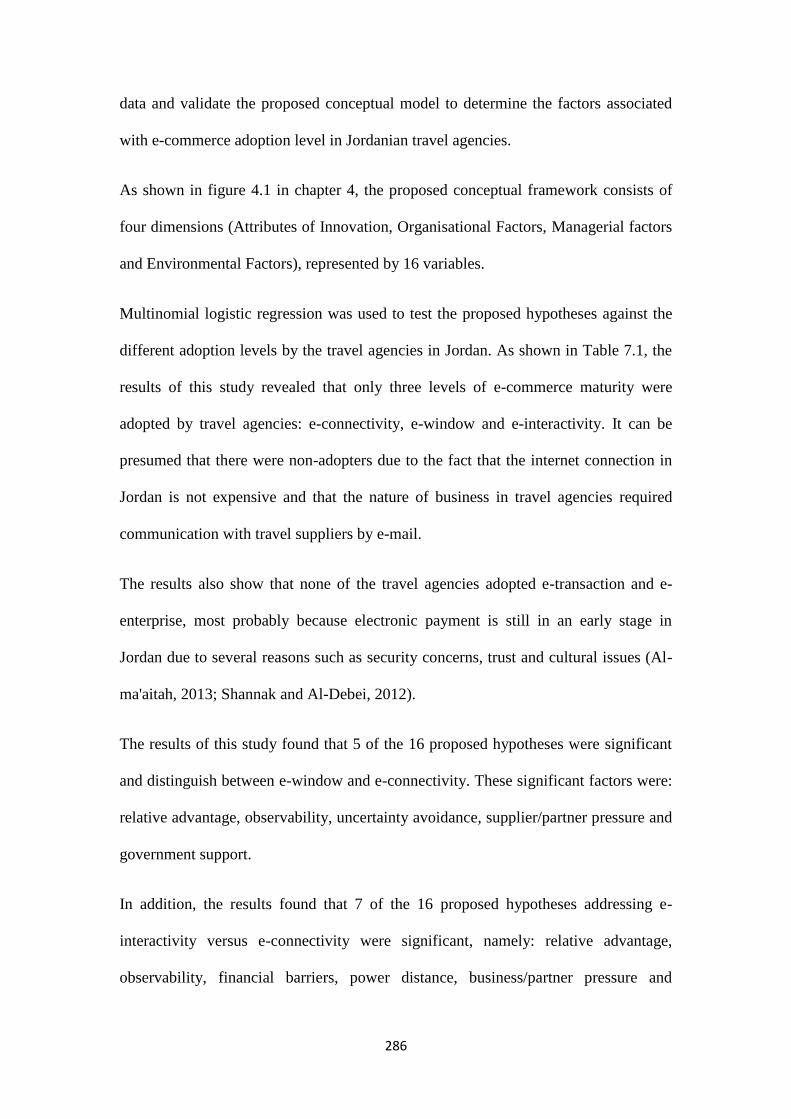
286
data and validate the proposed conceptual model to determine the factors associated
with e-commerce adoption level in Jordanian travel agencies.
As shown in figure 4.1 in chapter 4, the proposed conceptual framework consists of
four dimensions (Attributes of Innovation, Organisational Factors, Managerial factors
and Environmental Factors), represented by 16 variables.
Multinomial logistic regression was used to test the proposed hypotheses against the
different adoption levels by the travel agencies in Jordan. As shown in Table 7.1, the
results of this study revealed that only three levels of e-commerce maturity were
adopted by travel agencies: e-connectivity, e-window and e-interactivity. It can be
presumed that there were non-adopters due to the fact that the internet connection in
Jordan is not expensive and that the nature of business in travel agencies required
communication with travel suppliers by e-mail.
The results also show that none of the travel agencies adopted e-transaction and e-
enterprise, most probably because electronic payment is still in an early stage in
Jordan due to several reasons such as security concerns, trust and cultural issues (Al-
ma'aitah, 2013; Shannak and Al-Debei, 2012).
The results of this study found that 5 of the 16 proposed hypotheses were significant
and distinguish between e-window and e-connectivity. These significant factors were:
relative advantage, observability, uncertainty avoidance, supplier/partner pressure and
government support.
In addition, the results found that 7 of the 16 proposed hypotheses addressing e-
interactivity versus e-connectivity were significant, namely: relative advantage,
observability, financial barriers, power distance, business/partner pressure and
287
government support. Finally, the results showed that 4 of the 16 proposed hypotheses
were significant, distinguishing between e-interactivity and e-window.
These significant factors were observability, competitive pressure, firm size and
complexity. The following sections will provide more details on the findings of each
hypothesis in this study and compare them to previous studies.
Model 1 Model 2 Model 3
Factors e-window
versus
e-connectivity
e-interactivity
versus
e-connectivity
e-interactivity
versus
e-window
Attrib
utes o
f
Innovatio
n
Relative advantage Sig(+) Sig(+) N.S
Compatibility N.S N.S N.S
Complexity N.S Sig(-) Sig(-)
Trialability N.S N.S N.S
Observability Sig(+) Sig(+) Sig(+)
Org
anisatio
nal
Facto
rs
Travel agency size N.S N.S Sig(+)
Financial barriers N.S Sig(-) N.S
Employees’ IT knowledge N.S N.S N.S M
anag
erial
Facto
rs Top management support N.S N.S N.S
Power distance N.S Sig(-) N.S
Uncertainty avoidance Sig(-) N.S N.S
Manager’s attitude toward e-
commerce
N.S N.S N.S
Enviro
nm
ental
Facto
rs
Competitive pressure N.S N.S Sig(+)
Supplier/Partner pressure Sig(+) Sig(+) N.S
Customer pressure N.S N.S N.S
Government support Sig(+) Sig(+) N.S
Table 7.1: Summary of Research Finding

288
7.5.1 Attributes of Innovation
As shown in Table 7.1 , attributes of the innovation dimension includes five variables
each of which was formulated into a hypothesis as shown Table 7.2.
H1: There is a positive and significant relationship between relative advantages and
the adoption level of e-commerce.
H2: There is a positive and significant relationship between compatibility and the
adoption level of e-commerce.
H3: There is a negative relationship between complexity and the adoption level of e-
commerce.
H4: There is a positive and significant relationship between trialability and the
adoption level of e-commerce.
H5: There is a positive and significant relationship between observability and the
adoption level of e-commerce.
Table 7.2: Proposed Hypotheses of Attributes of Innovation
7.5.1.1 Relative Advantage
As discussed in chapter four, relative advantage refers to the degree of benefits
obtained by adopting a new technology. According to Sparling et al. (2007, p.1049)
“relative advantage is one of the most frequently used innovation characteristics in
adoption research”. This study focuses on the degree relative advantage influences
travel agencies’ decision on the adoption levels of e-commerce.
The relative advantage includes these factors: reduce operation cost, expand market
share, increase customer base, enhance company’s image, improve customer services
and improve business relationship with suppliers. This result of this research found
289
that relative advantage is one of the important factor influencing manager’s decision
to adopt e-commerce.
Relative advantage had a significant and positive effect in differentiating between e-
connectivity and e-window and between e-connectivity and e-interactivity. However,
it was also found that relative advantage was insignificant in differentiating between
e-window and e-interactivity, which is an important indication that the higher levels
adopter groups of ‘e-window’ and ‘e-interactivity’ were more aware of perceived
benefits that may be obtained of e-commerce adoption in their travel agencies than the
lower levels of adopter group of ‘e-connectivity’.
The finding is in line with Al-Qirim (2006), who found relative advantage factor
positive and significant in differentiating between low and high levels of e-commerce
adopters in SMEs in New Zealand. Moreover, many previous researchers found that
relative advantage is significant and has an important role in determining adoption in
different types of technology, particularly e-commerce (Tan and Eze, 2008, Ramdani
and Kawalek, 2009; Tan and Teo, 2000; Limthongchai and Speece, 2003; Alam et al.,
2008; Hussin and Noor, 2005; Grandon and Pearson, 2003; Looi, 2004). In addition,
this research also shows that the score of expediential ratio of e-interactivity group is
higher than those of e-window and e-connectivity groups and that e-window has a
higher score than that of e-connectivity.
This indicates the importance role of relative advantage in adopting new innovation
such as e-commerce which supported Roger’s (2003) DoI model who argued that
decision maker will not adopt new innovation without having clear information of the
benefits perceived from e-commerce applications. The finding of the current study is
somewhat consistent with the results previous studies , which had found that relative

290
advantage has a positive significant effect on e-commerce adoption (Poorangi et
al.,2013; Ghobakhloo et al., 2011; Tan and Eze, 2008; Ramdani and Kawalek, 2009;
Tan and Teo, 2000; Limthongchai and Speece, 2003; Alam et al., 2008; Hussin and
Noor, 2005; Grandon and Pearson, 2003; Looi, 2004).
Moreover , the findings is consistent with the results of previous studies , which
found that relative advantage is significant for those SMEs considering an initial
adoption decision of e-commerce ( Ghobakhloo et al. ,2011; Hussein ,2009).
Moreover, other studies also found that advanced level of e-commerce adoption is
only determined by perceived advantages of using e-commerce in Canadian travel
agencies (Raymond ,2001; Al-Somali ,2011)
Based on this study’s finding on relative advantage, it can be considered that
owners/managers with more experience and faith in the advantages of e-commerce,
are more likely to adopt e-commerce in their businesses. It is therefore recommended
to invest in the important role of relative advantage on travel agencies
owners/managers’ decisions on the adoption levels of e-commerce.
7.5.1.2 Compatibility
Compatibility in this study is defined as the extent to which innovation level and
consistent technology are needed to be adopted, or in other words, the degree to which
e-commerce application fits the current businesses of Jordanian travel SMEs. It is
found here that compatibility was insignificant and unrelated with any of e-commerce
adoption levels, which is consistent with several previous studies (Almoawi and
Mahmood, 2011; Sultan and Chan, 2000; Adewale et al., 2013; Thong, 1999;
Premkumar and Roberts 1999; Hussin and Noor, 2005).
291
It is also consistent with the relevant findings of Al-Somali (2011) and Al-Qirim
(2006) that compatibility is insignificant to any of e-commerce adoption levels among
SMEs. Nevertheless, there were also many previous studies that found compatibility
significant and has a positive effect on e-commerce adoption by SMEs (To and Ngai,
2007; Limithongchai and Speece, 2003; Alam et al, 2008; Sparling et al., 2007; Azam
and Quaddus, 2009; Ghobakhloo et al., 2011; Tan and Eze, 2008; Ramdani and
Kawalek, 2007; Tan and Teo, 2000; Garndon and Peace, 2003; Beatty et al., 2001).
This insignificance could very well be expressive of Jordanian travel agencies
owners/managers’ lack of compatibility background experience such as integrating e-
commerce applications in their existing business. This study suggests addressing this
factor in future research with a larger number of samples.
7.5.1.3 Complexity
Complexity refers to difficulty in understanding e-commerce applications, lack of
appropriate tools and computer systems to support e-commerce and difficulty in
integrating e-commerce applications in current business. With regard to complexity,
the study found that it is insignificant in differentiating between e-window and e-
connectivity, but significant and with a negative bearing on differentiating between e-
interactivity and e-connectivity and between e-window and e-interactivity.
This result is somewhat consistent with previous studies which found complexity to
be insignificant in e-commerce adoption by SMEs (Poorangi et al., 2013; Almoawi
and Mahmood, 2011; Sultan and Chan, 2000; Chang and Cheung, 2001;
Limthongchai and Speece, 2003). On the other hand, the results shows that
complexity is significant and relevant to e-commerce adoption, which is somewhat
292
consistent with previous studies (Tan and Eze,2009; Alam et al, 2008; Hussin and
Noor, 2005).
Upon that, complexity does not influence owners/manager in the early adoption stage
such as e-mail and basic website, but when considering to adopt more sophisticated e-
commerce applications such as interactive website , the complexity of using advanced
website is considered significant factor whereby SMEs who perceive implementing
the web as being difficult to understand and use are less likely to adopt. This view is
compatible with Al-Qirim (2006) results who found that compatibility is significant
factor influencing initial and advanced e-commerce adoption by SMEs.
Therefore, it is suggested here that complexity has an important role in steering travel
agencies owners/managers’ decisions to upgrade the adoption level in their
businesses.
7.5.1.4 Trialability
Trialability is defined here as SMEs’ ability to integrate e-commerce applications in
their business on trial basis for a period of time with a low start-up cost. Trialability is
found in this study to be insignificant and irrelevant to any of e-commerce adoption
levels, which is inconsistent with previous studies (Tan and Teo, 2000; Kamarodin et
al, 2009; Hussain et al, 2008) and challenged the proposed hypothesis of this study
that trialability has a positive and significant effect on e-commerce adoption levels.
However, there are many other previous studies with which this finding is in line
(Azam and Quaddus, 2009; Alam et al, 2009; Kendall et al., 2001; Hussin and
Noor,2005). This result indicates that trialability has no influence on Jordanian travel
agencies owners/managers decisions to adopt e-commerce and they are unaware of
trialability’s benefits. In addition, the descriptive findings imply that e-commerce

293
tourism applications as trial is not provided by software vendors such as Amadeus,
and Galileo to travel agencies in Jordan.
7.5.1.5 Observability
In this study, observability refers to owners/managers’ ability to observe the results of
adopting e-commerce applications by other SMEs. Observability was found here
positive and significantly associated with all levels of e-commerce adoption by
Jordanian travel agencies, which is in line with previous studies (Tan et al., 2009;
Limithongchai and Speece, 2003; Hussin and Noor, 2005; Tan an Eze, 2008; Alam et
al., 2008; Hussin and Noor, 2005; Poorangi et al., 2013; Hussin et al., 2008).
Also, observability was found the strongest predictor in attribution of innovation
dimension that differentiates between all levels of e-commerce adoption by Jordanian
travel agencies, which means that it is the strongest factor that influences
owners/managers to adopt e-commerce. This research shows the score of expediential
ratio in the observability factor is higher in e-interactivity group than the e-window
and e-connectivity groups, respectively. Therefore, the positive association of
observability with e-commerce adoption levels implies that decision makers in travel
agencies who rely on the results of e-commerce adoption by others are more likely to
adopt e-commerce in their agencies.
This results confirms Poorangi et al. (2013), who suggests that the advantages of
innovation perceived by other business such as e-commerce adoption will provide
SMEs an opportunity to observe the benefits from that experience and encourage
them to adopt e-commerce in their business. This suggests that observability has an
important role in Jordanian travel agencies owners/managers’ decisions on the
adoption levels of e-commerce because website offers available information of other
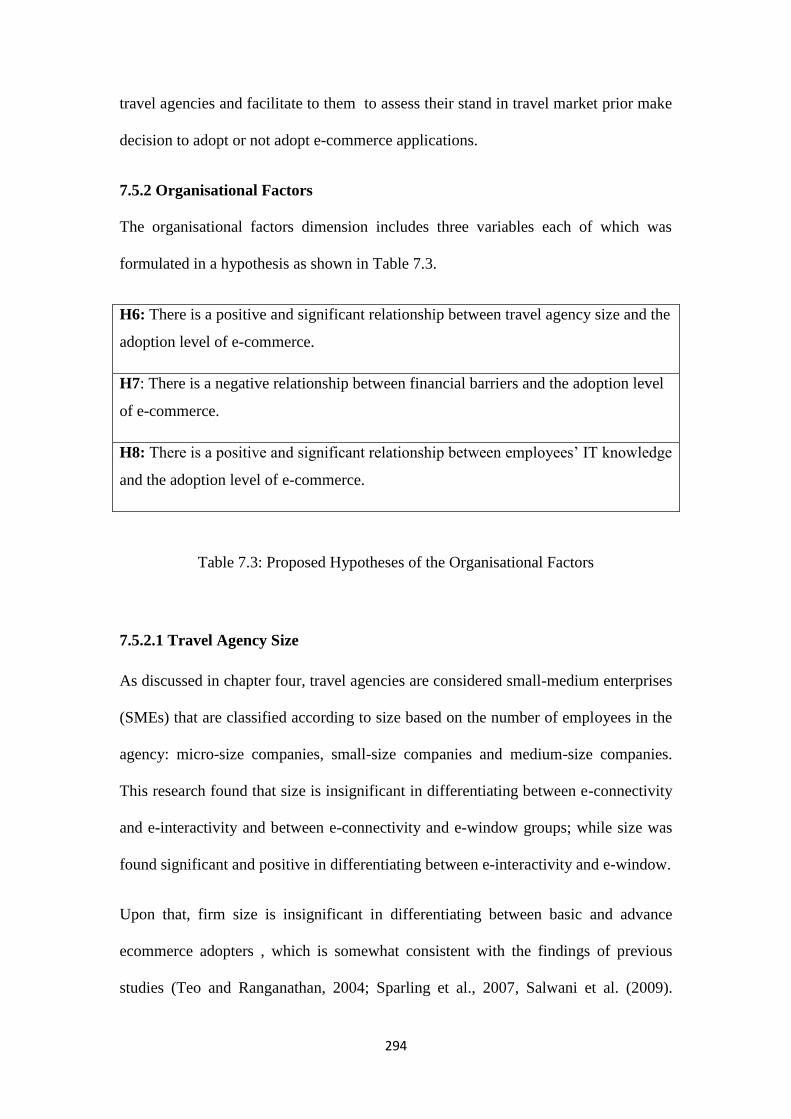
294
travel agencies and facilitate to them to assess their stand in travel market prior make
decision to adopt or not adopt e-commerce applications.
7.5.2 Organisational Factors
The organisational factors dimension includes three variables each of which was
formulated in a hypothesis as shown in Table 7.3.
H6: There is a positive and significant relationship between travel agency size and the
adoption level of e-commerce.
H7: There is a negative relationship between financial barriers and the adoption level
of e-commerce.
H8: There is a positive and significant relationship between employees’ IT knowledge
and the adoption level of e-commerce.
Table 7.3: Proposed Hypotheses of the Organisational Factors
7.5.2.1 Travel Agency Size
As discussed in chapter four, travel agencies are considered small-medium enterprises
(SMEs) that are classified according to size based on the number of employees in the
agency: micro-size companies, small-size companies and medium-size companies.
This research found that size is insignificant in differentiating between e-connectivity
and e-interactivity and between e-connectivity and e-window groups; while size was
found significant and positive in differentiating between e-interactivity and e-window.
Upon that, firm size is insignificant in differentiating between basic and advance
ecommerce adopters , which is somewhat consistent with the findings of previous
studies (Teo and Ranganathan, 2004; Sparling et al., 2007, Salwani et al. (2009).
295
However, the study also shows that travel agency size is positive and significant in
differentiating between e-window (one-way communication) and e-interactivity (2-
way communication website), which is consistent with previous studies (Salwani et
al., 2009; Ramdani and Kawalek, 2009; Zhu and Kraemer, 2002; Zhu et al., 2003;
Hussien, 2009; Thong, 1999) that found firm size to be positively relevant to the level
of e-commerce adoption.
In addition, Huy et al. (2012) and Hewitt et al. (2011) found that firm size is a
significant key element in influencing SMEs owners/managers’ decisions to upgrade
e-commerce adoption level. These findings imply that firm size may turn into a weak
predictor of ecommerce adoption as connection to the Internet and setting up a basic
website because they are becoming more common in SMEs, particularly travel
agencies.
This findings confirm the evidence by prior studies , which found that firm size play a
significant role influencing SMEs to attain higher e-commerce maturity levels (Huy et
al., 2012; Teo et al., 2009) .Prior studies suggested that firm size play a significant
role influencing decision maker to adopt advanced level of e-commerce because
larger companies are normally have greater financial resources, knowledge and
experience, and ability to tolerate failing implementations of ICTs and e-commerce
than smaller firms (Tornatzsky & Fleischer, 1990; Iacovou et al., 1995; Levenburg et
al., 2006; Thong, 1999). However, the finding on firm size was only relevant to e-
commerce adoption level in travel agencies; therefore, this study suggests conducting
further investigation with larger samples of SMEs involving different sectors.
296
7.5.2.2 Financial Barriers
As discussed in chapter four, the financial barrier is defined as limited financial
resources and funding for adopting e-commerce applications in travel agencies. This
study focuses on the relationship between the availability of financial resources and e-
commerce adoption among travel agencies.
Financial barriers refer to cost required to adopt e-commerce applications, cost of
internet access and e-commerce maintenance cost. It is found here that financial
barriers are insignificant in differentiating between e-connectivity and e-window and
between e-window and e-interactivity groups, while these barriers were negative and
significant in differentiating between e-interactivity and e-connectivity. It is a result
that is somewhat consistent with previous studies (Al-Somali, 2011; Al-Qirim 2006,
Sutanonpaiboon and Pearson, 2008) which found that e-commerce adoption is only
significant at higher levels of adoption.
In addition, Al-Qirim (2006) found that huge investments, time, and effort are
required to integrate advanced e-commerce applications in SMEs compared to low-
level of e-commerce applications. Therefore, SMEs owners/managers need to study
feasibility and cost-effectiveness before making the decision to adopt advanced e-
commerce in their business.
It is therefore logical to consider lack of financial resources a major barrier
influencing the decision to adopt ecommerce in travel agencies (Buhalis and Deimezi,
2003; Heung, 2003). Also, the finding is consistent with another study conducted by
Kaewkitipong (2010) found that limited financial resources is significant barrier on e-
commerce adoption among travel agencies in Thailand particularly in advanced level
of e-commerce adoption.

297
This result implies that financial resources are the biggest challenge for non-adopters
and low adopters restricting their consideration of the opportunities obtainable from
adopting e-commerce applications such as return on investments , future cost
reduction and survive in the global market.
7.5.2.3 Employees’ IT Knowledge
In chapter four, the employee IT knowledge is defined as the level of performance and
the extent of employees’ knowledge of e-commerce applications and computer
systems usage that are obtained through previous practice or training. In this study,
employee’s IT knowledge refers to these components: level of employee’s knowledge
of e-commerce applications, level of employee’s knowledge of computer systems
usage, and identify whether the travel agencies have IT support staff.
It was found that employee’s IT knowledge is insignificant and irrelevant to any of e-
commerce adoption levels, which challenges the proposed hypothesis and previous
studies (Scupola, 2009; Alam and Noor, 2009; Mehrtens et al.,2001; Thong, 1999;
Mirchandani and Motwani, 2003; Hussein, 2009; Wang and Hou, 2012) that had
identified the importance of such knowledge in influencing owners/managers
decisions to adopt e-commerce applications.
However, there were studies with which this finding agrees such as Sarosa and
Underwood (2005) and Seyal and Rahman (2006), who both identified employee’s IT
knowledge as insignificant and did not influence decision makers in adopting e-
commerce in their business. This insignificance implies two possibilities. First, the
employee’s IT knowledge and computer skills are required to work in travel agencies
as the nature of this business necessitates knowledge of global distribution systems
(GDS) that connect agencies with travel suppliers like airlines and hotels for which a

298
networking infrastructure and computer hardware/software are needed. Second, it
could be that the owners/managers’ decisions regarding e-commerce adoption are not
influenced by their employee’s IT knowledge. Thus, this study suggests conducting
further investigation with larger samples of SMEs and involving different sectors.
7.5.3 Managerial Factors
As shown above in Table 7.4, managerial factors include four variables each of which
is formulated in a hypothesis : Top Management Support, Power Distance,
Uncertainty Avoidance and Manager’s Attitude toward E-commerce applications.
H9: There is a positive and significant relationship between top management support
and the adoption level of e-commerce.
H10: There is a negative relationship between power distance and the adoption level
of e-commerce.
H11: There is a negative relationship between uncertainty avoidance and the adoption
level of e-commerce.
H12: There is a positive and significant relationship between owner/ manager’s
attitude toward e-commerce applications and e-commerce adoption level.
Table 7.4: Proposed Hypotheses of Managerial Factors
7.5.3.1 Top Management Support
In chapter four, top management support was defined as the extent of
owners/manager’s perception and commitment to the role of e-commerce applications
in their business activities as reflected in allocating necessary resources. In this study,
top management support was measured in terms of: willingness to provide the
necessary resources for e-commerce adoption, having a clear vision of e-commerce
technologies in business activities and interest in e-commerce in business operations.
This research found that such support is insignificant and does not have a role in
influencing decision makers to adopt e-commerce in their travel agencies. This
299
outcome challenges the proposed hypothesis and previous studies (Beatty et al., 2001;
Shaharudin et al., 2011; Ifinedo, 2011; Teo et al., 2009; Ramdani et al., 2009;
Hussein, 2009; Al-Somali, 2011,Teo and Ranganathan, 2004; Mirchandani and
Mowarni, 2001) that found this factor significant in e-commerce adoption by SMEs.
Surprisingly , this result contradict many of previous studies findings , which found
that support and competence from manger play a critical role in influencing decision
in adoption e-commerce in SMEs.
However, that outcome is in line with Seyal et al. (2004) and Levy et al. (2005), both
finding that top management support is not statistically significant for e-commerce
adoption by SMEs. Also , this findings is compatible with Chong et al. (2009) argued
that the possibility to adopt e-commerce in organisation will be higher when financial
and technical resources are supported by top management. Therefore , this implies
that e-commerce adoption might be affected by other additional indirect factors such
as lack of financial and technological recourses that are addressed in this study.
However, the influence of top management support on Jordanian travel agencies
decision to adopt e-commerce applications must remain in question and receive
further investigation.
7.5.3.2 Power Distance
As discussed in chapter four, power distance is defined as the degree of unequal
distribution of power between managers and their employees. This study focuses on
the extent to which employees involve in decision making within travel agencies. The
power distance factor includes: owners/managers’ sharing of information with their
employees, owners/managers’ emphasis on their authority and power in dealing with
their employees and the extent to which managers consider their employees’ opinions.

300
Power distance is found here negative and significant in differentiating between e-
interactivity and e-connectivity but insignificant in differentiating between e-
connectivity and e-window and between e-window and e-interactivity groups.
This result is somewhat consistent with previous studies (Kollmann et al., 2009;
Hasan and Ditsa, 1999; Yoon, 2009; Almoawai, 2011; Lundgren and Walczuch,
2003) that found e-commerce adoption and growth to be directly influenced by the
power distance factor. In addition, Chen and McQueen (2008) found that
owners/managers with low power distance in SMEs are more likely to adopt a higher
level of e-commerce applications.
Also, this finding is inconsistent with Seyal et al. (2004) , which found that
organizational culture is insignificant factor in determining e-commerce adoption by
SMEs, but he argued that this insignificant result due to be that few organizations
already adopted technology at early stage and the chance is that organizational culture
could not be very viable factor at the early stage , which confirmed the results of this
study.
The finding of this study suggests that simple adopters might not be ready to adopt an
advanced level of e-commerce in their travel agencies because of the unequally
distributed power within these agencies that is reflected in a hierarchal order
preventing employees particularly IT staff from making suggestions or participating
in decision making with respect to e-commerce applications.
7.5.3.3 Uncertainty Avoidance
Uncertainty avoidance refers the extent to which Jordanian travel agencies
owners/managers feel at risk by uncertain situations relevant to making e-commerce
adoption decisions. The uncertainty avoidance factor includes: taking the risk of

301
adopting e-commerce, accepting departure from traditional business process to an
electronic one and have confidence about the security of e-commerce transactions.
The study found that uncertainty avoidance is significant in differentiating between e-
connectivity and e-window groups, but insignificant in differentiating between e-
connectivity and e-interactivity and between e-interactivity and e-window. This result
is somewhat consistent with several studies (Seyal and Rahman, 2003; Chen and
McQueen, 2008, Al-Hujra et al., 2011; Kollmann et al., 2009; Al-Noor and Arif,
2011; Azam and Quaddus, 2009b; Ghobakhloo and Tang, 2013) that found
uncertainty avoidance significant in e-commerce adoption by SMEs.
Based on the above results, it is logical to expect that owners/managers with a high
level of uncertainty avoidance are not likely to adopt a higher level of e-commerce
applications due to reluctance in taking risks and becoming exposed to the threat of
ambiguous situations like security concerns. Unexpectedly however, this study did not
find any significant difference between e-connectivity and e-interactivity, or between
e-window and e-interactivity, with regard to uncertainty avoidance which may suggest
that owners/managers who adopted e-interactivity are unwilling to ‘take risk’ by
adopting a higher level of e-commerce applications such as accepting credit card and
e-payment system.
A recent study by Al-ma'aitah (2103) found that security concerns related to e-
payment is major challenge to adopt an advanced e-commerce application by
Jordanian SMEs.
7.5.3.4 Owners/Managers’ Attitude toward E-commerce Applications
As discussed in chapter four, attitude are defined as the degree of owner/manager’s
feeling, either positively or negatively, toward using e-commerce applications in their
302
business. This attitude includes: the idea of using e-commerce applications in their
travel agencies, the excitement and enthusiasm for using websites in general, planning
to adopt e-commerce in near future and feeling toward the perceived benefits of
implementing e-commerce in travel agencies.
Owner/manager’s attitude toward e-commerce applications was found an important
and significant factor in the decision to adopt e-commerce by SMEs (Seyal et al.,
2006; To and Ngai, 2007; Hao et al., 2010; Thong, 1999; Dholakia and Kshetri, 2004,
Al-Qirim, 2006; Huy et al., 2012).
Moreover, Teo et al. (2009) found that manager’s attitude was a positive and
significant factor for both adopters and non-adopters, yet higher for adopters than
non-adopters. However, this study did not identify any evidence of association
between owner/manager’s attitude toward e-commerce applications and the decision
to adopt e-commerce by Jordanian travel agencies, which challenges the proposed
hypothesis but is consistent with Chau and Jim (2002) who found that
owner/manager’s attitude is an insignificant factor in e-commerce adoption. Moreover
, the study is somewhat consistent with Hussain (2009) results , which reported that
manager’s attitude toward using e-commerce is only significant to differentiate
adopters from non-adopters , but insignificant relationship with simple versus
advanced adoption.
This outcome suggests that owners/managers’ attitude has no significant effect on
adopting e-commerce as it might be other external factors such as, complexity and
lack of financial resources, or internal factors such as, uncertainty avoidance that have
the greater influence; nevertheless, this effect must be addressed and investigated in
future studies.
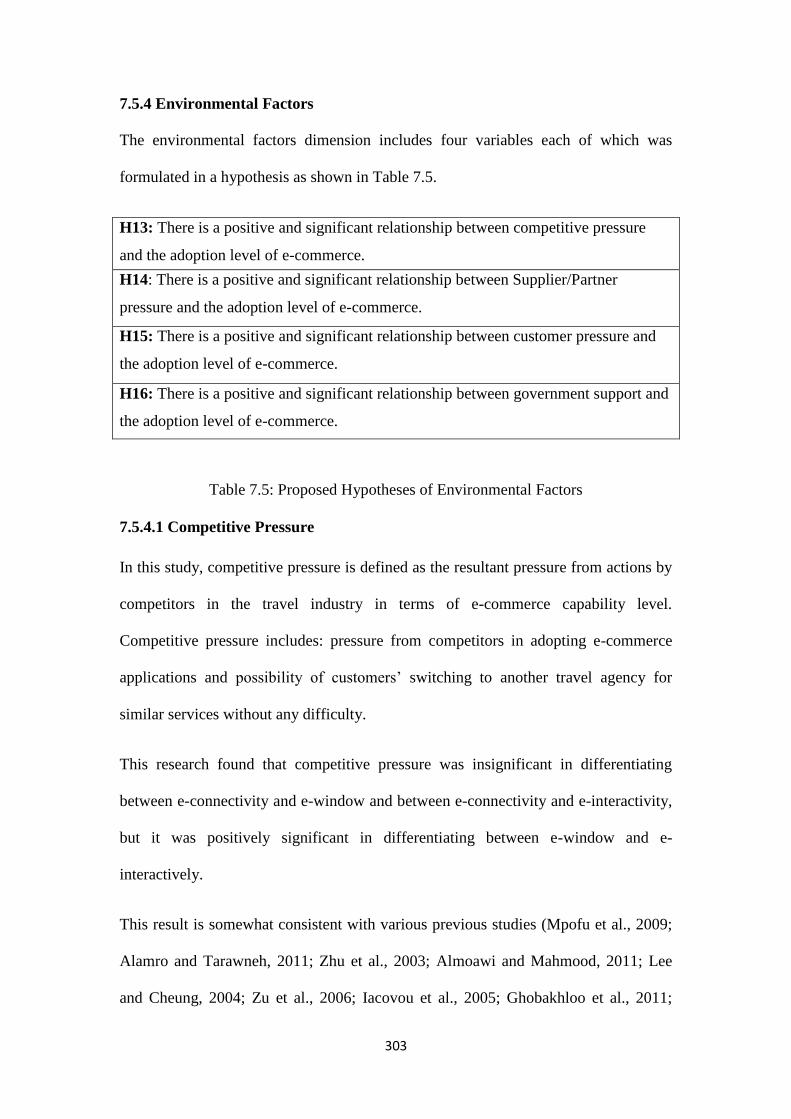
303
7.5.4 Environmental Factors
The environmental factors dimension includes four variables each of which was
formulated in a hypothesis as shown in Table 7.5.
H13: There is a positive and significant relationship between competitive pressure
and the adoption level of e-commerce.
H14: There is a positive and significant relationship between Supplier/Partner
pressure and the adoption level of e-commerce.
H15: There is a positive and significant relationship between customer pressure and
the adoption level of e-commerce.
H16: There is a positive and significant relationship between government support and
the adoption level of e-commerce.
Table 7.5: Proposed Hypotheses of Environmental Factors
7.5.4.1 Competitive Pressure
In this study, competitive pressure is defined as the resultant pressure from actions by
competitors in the travel industry in terms of e-commerce capability level.
Competitive pressure includes: pressure from competitors in adopting e-commerce
applications and possibility of customers’ switching to another travel agency for
similar services without any difficulty.
This research found that competitive pressure was insignificant in differentiating
between e-connectivity and e-window and between e-connectivity and e-interactivity,
but it was positively significant in differentiating between e-window and e-
interactively.
This result is somewhat consistent with various previous studies (Mpofu et al., 2009;
Alamro and Tarawneh, 2011; Zhu et al., 2003; Almoawi and Mahmood, 2011; Lee
and Cheung, 2004; Zu et al., 2006; Iacovou et al., 2005; Ghobakhloo et al., 2011;
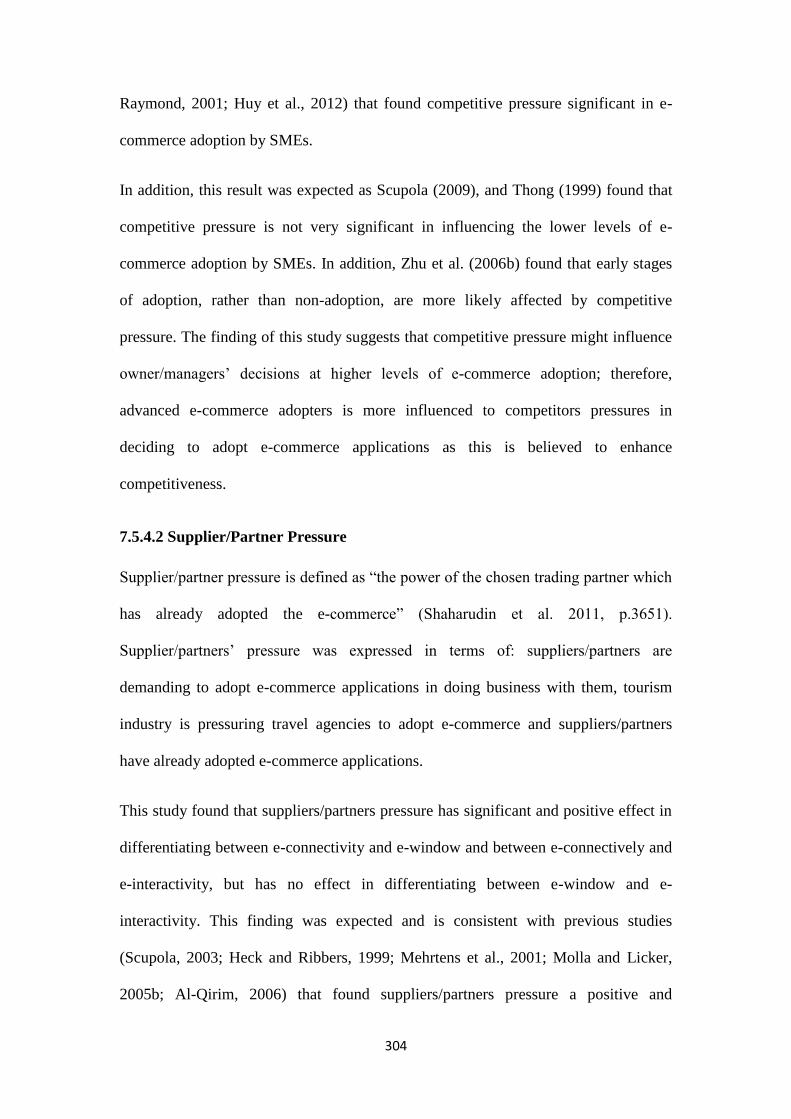
304
Raymond, 2001; Huy et al., 2012) that found competitive pressure significant in e-
commerce adoption by SMEs.
In addition, this result was expected as Scupola (2009), and Thong (1999) found that
competitive pressure is not very significant in influencing the lower levels of e-
commerce adoption by SMEs. In addition, Zhu et al. (2006b) found that early stages
of adoption, rather than non-adoption, are more likely affected by competitive
pressure. The finding of this study suggests that competitive pressure might influence
owner/managers’ decisions at higher levels of e-commerce adoption; therefore,
advanced e-commerce adopters is more influenced to competitors pressures in
deciding to adopt e-commerce applications as this is believed to enhance
competitiveness.
7.5.4.2 Supplier/Partner Pressure
Supplier/partner pressure is defined as “the power of the chosen trading partner which
has already adopted the e-commerce” (Shaharudin et al. 2011, p.3651).
Supplier/partners’ pressure was expressed in terms of: suppliers/partners are
demanding to adopt e-commerce applications in doing business with them, tourism
industry is pressuring travel agencies to adopt e-commerce and suppliers/partners
have already adopted e-commerce applications.
This study found that suppliers/partners pressure has significant and positive effect in
differentiating between e-connectivity and e-window and between e-connectively and
e-interactivity, but has no effect in differentiating between e-window and e-
interactivity. This finding was expected and is consistent with previous studies
(Scupola, 2003; Heck and Ribbers, 1999; Mehrtens et al., 2001; Molla and Licker,
2005b; Al-Qirim, 2006) that found suppliers/partners pressure a positive and

305
significant factor in e-commerce adoption by SMEs. In addition, it was in line with
Ifinedo (2011) and Teo et al. (2009), who found that there was a significant difference
between advanced adopters and low adopters with regard to suppliers/partners
pressure.
Moreover, the results of this study confirms the prior study conducted by Andreu et
al. (2010) found that travel suppliers pressure is very significant effect on adopting
advanced level of e-commerce in Spanish travel agencies. This study suggests an
important role of suppliers/partners’ readiness in adopting a higher level of e-
commerce by Jordanian travel agencies.
7.5.4.3 Customer Pressure
Customer pressure refers the degree to which customer demand e-commerce
applications from travel agencies in order to maintain relationship with them.
Customer pressure includes: customer demand from travel agencies to adopt e-
commerce, customer possible pressure on travel agencies to provide their products
and services online and travel agencies’ fear to lose their customers if they do not
adopt e-commerce.
Many previous studies found that customer pressure was positive and had a
significant effect on e-commerce adoption by SMEs (Grandon and Pearson, 2003;
Harrison et al., 1997; Ghobakhloo et al., 2011; Teo et al., 2003; Alamro and
Tarawneh, 2011; Scupola, 2009). Moreover, Abdul Hameed and Counsell (2012)
found that customer pressure was the most influential factor of e-commerce adoption.
However, Al-Somali et al. (2011) found that customer pressure was only significant
on advanced e-commerce adopters. Also, Andreu et al. (2010) found customers
pressure to be a significant factor in early e-commerce adoption level in Spanish

306
travel agencies. Contrary to above assumption, this study found that customer
pressure is insignificant and does not have a role in influencing the adoption of e-
commerce by Jordanian travel agencies, which is in line with Sparling et al. (2007)
who found that the customer pressure factor is statistically insignificant in
differentiating between adopters and non-adopters among Canadian SMEs. Also, Al-
Qirim (2007) found that customer pressure does not have any significance in different
e-commerce adoption levels among New Zealand SMEs.
The insignificance of customer pressure suggests that this factor does not influence
travel agents’ decisions to adopt e-commerce, possibly due to the supremacy of
competitive pressure and trading partners factors over customer pressure in adopting
e-commerce as decision makers in Jordanian travel agencies are more concerned
about their competitors and trading partners than their customers with respect to e-
commerce adoption and it can also be attributed to lack of online buyers in Jordan
(Masoud, 2013).
7.5.4.4 Government Support
Government support is defined as the degree to which government should be active in
supporting and encouraging the growth of e-commerce adoption in SMEs by
providing electronic infrastructure, policies and legislations, training and educational
programmes and funding.
This research found government support to be an important factor influencing travel
agencies decision to adopt e-commerce. Government support has a significant and
positive effect in differentiating between e-connectivity and e-window and between e-
connectivity and e-interactivity; it was however insignificant in differentiating
between e-window and e-interactivity.

307
The importance of this finding is that it indicates that the higher levels of adopter
groups ‘e-window’ and ‘e-interactivity’ were more aware than lower level of adopters
of government’s role in supporting travel agencies in adopting e-commerce in their
business, which is consistent with previous studies that found government support is
positive and significant to adopt advanced level of e-commerce in SMEs (Looi, 1998;
Ramsey and McCole, 2005; Ghobakhloo et al., 2011; Teo and Tan, 2000).
Moreover, other studies found government support to be positive and significant in
influencing all levels of e-commerce adoption in SMEs (Tan and Teo, 2000; Hung et
al., 2011; Huy et al., 2012; Hunaiti et al., 2009; Scupola, 2009).
In addition, among all environmental factors, government support is found in this
study to be the strongest significant predictor to determine e-commerce adoption by
Jordanian travel agencies. Thus, the greater government support as perceived by travel
agencies owners/managers, the higher likelihood to adopt e-commerce applications.
The suggested forms of this support includes promoting e-commerce adoption in
SMEs by providing training programmes and workshops, well established
technological infrastructure and financial support.
7.6 Discussion and Summary of the Research Findings
This research made a major contribution in investigating the factors affecting the
adoption level of e-commerce by Jordanian travel agencies. Although e-commerce
adoption is considered an important tool for SMEs to survive in the market, limited
studies have investigated the rate of adoption among SMEs. Surprisingly, as shown in
Table 7.6, most prior studies investigated factors that influence e-commerce adoption
as e-commerce adoption versus non-adoption. The main criticism for the reviewed
literature on e-commerce adoption by SMEs is overlooking the fact that e-commerce

308
adoption occurs in sequential levels of adoption. Therefore, it is important to
determine which factor affects each level of e-commerce maturity.
A comprehensive conceptual framework was developed and the factors were
identified on the basis of Doe, TOE, and Hofstede’s Cultural Dimension in order
identify the association between these factors and the level of e-commerce maturity
attained by travel agencies. In this study, e-commence maturity model as the
dependent variable was adapted from Molla and Licker (2004) including non-
adoption, e-connectivity, e-widow, e-interactivity, e-transaction and e-enterprise. The
key objective of this study is to determine different factors affecting different levels of
e-commerce in Jordanian travel agencies.
As discussed earlier, several key findings and implications were identified regarding
e-commerce adoption in Jordanian travel agencies. They show that travel agencies’
adoption of e-commerce in Jordan depends on attributes of innovation, managerial,
organizational and environmental contexts. The findings revealed that relative
advantage, complexity, observability, firm size, financial barriers, power distance,
uncertainty avoidance, competitive pressure, supplier/partner pressure and
government support have a significant role in influencing different levels of e-
commerce adoption in Jordanian travel agencies, while compatibility, trialability,
employees’ IT knowledge, top management support, managers’ attitude toward e-
commerce applications and customer pressure were found insignificant. Nevertheless,
the findings on these factors are unique and might not be compared with previous
studies.
309
As shown in the Table 7.6, the determinant factors of e-commerce adoption are
different based on the current level of e-commerce adoption by SMEs. For example,
the current study found relative advantage significant in differentiating between e-
connectivity and e-window and between e-connectivity and e-interactivity, but it was
not found significant in differentiating between e-window and e-interactivity. These
findings are compatible with Ghobakhloo et al. (2011) who identified e-commerce
adoption as a sequential levels process. However, the findings of this study might also
be considered as partially compatible with other studies that found relative advantage
significant but identified e-commerce as only dichotomous without determining the
sequential level. Therefore this study is different from prior studies through
contributing to the understanding of the different factors affecting different levels of
e-commerce adoption and showing that the levels of e-commerce maturity in SMEs
are very important in identifying the reason of the current level of e-commerce
adopted by these SMEs and encourage to move to a higher level of e-commerce
maturity.

310
Dependent variable
(Sig: Significant), InSig (Insignificant) ,(N/A: not
applicable)
Ind
epen
den
t
va
riab
le
Author(s) Ad
op
ter Versu
s
No
n-a
do
pter
e-win
do
w
versu
s
e-con
nectiv
ity
e-intera
ctivity
versu
s
e-con
nectiv
ity
e-intera
ctivity
versu
s
e-win
do
w
e-tran
sactio
n
versu
s e-
intera
ctively
e-intera
ctively
versu
s
e-enterp
rise
Relativ
e advan
tage
Current study N/A Sig Sig InSig Not
exist
Not
exist
Ghobakhloo et al. (2011) N/A Sig Sig N/A N/A N/A
Hussein (2009) Sig N/A N/A N/A N/A N/A
Raymond (2001) N/A InSig N/A N/A InSig Sig
Al-Somali (2011) N/A InSig N/A InSig Sig N/A
Ramdani and Kawalek (2009) Sig N/A N/A N/A N/A N/A
Teo et al. (2009) Sig N/A N/A N/A N/A N/A
Limthongchai and Speece ( 2003) Sig N/A N/A N/A N/A N/A
Alam et al. (2008) Sig N/A N/A N/A N/A N/A
Al-Qirim ( 2006) N/A InSig InSig N/A Sig N/A
Hussin and Noor (2005) Sig N/A N/A N/A N/A N/A
Co
mp
atibility
Current study N/A InSig InSig InSig Not
exist
Not
exist
Ghobakhloo et al. (2011) N/A Sig Sig N/A N/A N/A
Hussein (2009) InSig N/A InSig N/A N/A N/A
Raymond (2001) N/A InSig N/A N/A InSig Sig
Al-Somali (2011) N/A InSig N/A InSig InSig N/A
Ramdani and Kawalek (2009) InSig N/A N/A N/A N/A N/A
Limthongchai and Speece ( 2003) Sig N/A N/A N/A N/A N/A
Alam et al. (2008) Sig N/A N/A N/A N/A N/A
Hussin and Noor (2005) InSig N/A N/A N/A N/A N/A
Al-Qirim ( 2006) InSig InSig Sig
Trialab
ility
Current study N/A InSig InSig InSig Not
exist
Not
exist
Hussein (2009) InSig N/A N/A N/A N/A N/A
Ramdani and Kawalek (2009) Sig N/A N/A N/A N/A N/A
Limthongchai and Speece ( 2003) InSig N/A N/A N/A N/A N/A
Alam et al. (2008) InSig N/A N/A N/A N/A N/A
Hussin and Noor (2005) InSig N/A N/A N/A N/A N/A
Poorangi et al. (2013) Sig N/A N/A N/A N/A N/A
Azam and Quaddus (2009) InSig N/A N/A N/A N/A N/A
Table 7.6: Summary Results of the Findings of E-commerce Adoption (cont.)

311
Dependent variable
(Sig: Significant), InSig (Insignificant) ,(N/A: not
applicable)
Ind
epen
den
t
va
riab
le
Author(s) Ad
op
ter Versu
s
No
n-a
do
pter
e-win
do
w
versu
s
e-con
nectiv
ity
e-intera
ctivity
versu
s
e-con
nectiv
ity
e-intera
ctivity
versu
s
e-win
do
w
e-tran
sactio
n
versu
s e-
intera
ctively
e-intera
ctively
versu
s
e-enterp
rise
Co
mp
lexity
Current study InSig Sig Sig N/A N/A
Hussein (2009) Sig N/A N/A N/A N/A N/A
Ramdani and Kawalek (2009) InSig N/A N/A N/A N/A N/A
Limthongchai and Speece ( 2003) Sig N/A N/A N/A N/A N/A
Alam et al. (2008) Sig N/A N/A N/A N/A N/A
Hussin and Noor (2005) Sig N/A N/A N/A N/A N/A
Poorangi et al. (2013) InSig N/A N/A N/A N/A N/A
Tan et al. (2008) Sig N/A N/A N/A N/A N/A
Ramdani and Kawalek (2009) InSig N/A N/A N/A N/A N/A
Hussein (2009) Sig N/A N/A N/A N/A N/A
Ob
servab
ility
Current study N/A Sig Sig Sig Not
exist
Not
exist
Ramdani and Kawalek (2009) InSig N/A N/A N/A N/A N/A
Limthongchai and Speece ( 2003) Sig N/A N/A N/A N/A N/A
Alam et al. (2008) Sig N/A N/A N/A N/A N/A
Hussin and Noor (2005) Sig N/A N/A N/A N/A N/A
Poorangi et al. (2013) Sig N/A N/A N/A N/A N/A
Azam and Quaddus (2009) Sig N/A N/A N/A N/A N/A
Kendall et al. (2001) Insig N/A N/A N/A N/A N/A
Firm
Size
Current study N/A InSig InSig Sig Not
exist
Not
exist
Ghobakhloo et al. (2011) N/A InSig InSig N/A N/A N/A
Ramdani and Kawalek (2009) Sig N/A N/A N/A N/A N/A
Teo et al. (2009) Sig N/A N/A N/A N/A N/A
Zhu and Kraemer, 2002 Sig N/A N/A N/A N/A N/A
Hussien 2009 Sig N/A N/A N/A N/A N/A
Teo and Ranganatha (2004) InSig N/A N/A N/A N/A N/A
Huy et al. (2012) Sig N/A N/A N/A N/A N/A
Hewitt et al. (2011) Sig N/A N/A N/A N/A N/A
Sparling et al. (2007) InSig N/A N/A N/A N/A N/A
Salwani et al. (2009) InSig N/A N/A N/A N/A N/A
Table 7.6: Summary Results of the Findings of E-commerce Adoption (cont.)

312
Dependent variable
(Sig: Significant), InSig (Insignificant) ,(N/A: not
applicable)
Ind
epen
den
t
va
riab
le
Author(s) Ad
op
ter Versu
s
No
n-a
do
pter
e-win
do
w
versu
s
e-con
nectiv
ity
e-intera
ctivity
versu
s
e-con
nectiv
ity
e-intera
ctivity
versu
s
e-win
do
w
e-tran
sactio
n
versu
s e-
intera
ctively
e-intera
ctively
versu
s
e-enterp
rise
Fin
ancial B
arriers
Current study N/A InSig Sig InSig Not
exist
Not
exist
Ghobakhloo et al. (2011) N/A InSig InSig N/A N/A N/A
Al-Somali (2011) N/A InSig InSig Sig
Teo et al. (2009) InSig N/A N/A N/A N/A N/A
Al-Qirim ( 2006) N/A InSig InSig Sig
Sutanonpaiboon and Pearson
(2008
Sig N/A N/A N/A N/A N/A
Kaewkitipong (2010) Sig N/A N/A N/A N/A N/A
Ramsey and McCole (2005) InSig N/A N/A N/A N/A N/A
Heung (2003) Sig N/A N/A N/A N/A N/A
Buhalis and Deimezi (2003) Sig N/A N/A N/A N/A N/A
Musawa and Wahab (2012) Sig N/A N/A N/A N/A N/A
Em
plo
yee’s IT
Kn
ow
ledge
Current study N/A InSig InSig InSig Not
exist
Not
exist
Hussein (2009) Sig N/A N/A N/A N/A N/A
Scupola, 2009 Sig N/A N/A N/A N/A N/A
Sarosa and Underwood (2005) InSig N/A N/A N/A N/A N/A
Seyal and Rahman (2006) InSig N/A N/A N/A N/A N/A
Thong, 1999 Sig N/A N/A N/A N/A N/A
Mirchandani and Motwani, 2003 Sig N/A N/A N/A N/A N/A
Wang and Hou, 2012 Sig N/A N/A N/A N/A N/A
Alam and Noor, 2009 Sig N/A N/A N/A N/A N/A
Mehrtens et al.,2001 Sig N/A N/A N/A N/A N/A
To
p M
anag
emen
t Su
pp
ort
Current study N/A InSig InSig InSig Not
exist
Not
exist
Ghobakhloo et al. (2011) N/A Sig Sig N/A N/A N/A
Al-Somali (2011) N/A Sig N/A Sig Sig N/A
Ramdani and Kawalek (2009) Sig N/A N/A N/A N/A N/A
Teo et al. (2009) Sig N/A N/A N/A N/A N/A
Chen and McQueen (2008) InSig InSig Sig Sig
Sutanonpaiboon and Pearson
(2008)
Sig N/A N/A N/A N/A N/A
Ifinedo (2011) Sig InSig Sig InSig Sig N/A
Shaharudin et al. (2011) Sig N/A N/A N/A N/A N/A
Ranganathan (2004) Sig N/A N/A N/A N/A N/A
Seyal et al. (2004) Sig N/A N/A N/A N/A N/A
Chong et al. (2009) InSig N/A N/A N/A N/A N/A
Levy et al. (2005) InSig N/A N/A N/A N/A N/A
Table 7.6: Summary Results of the Findings of E-commerce Adoption (cont.)
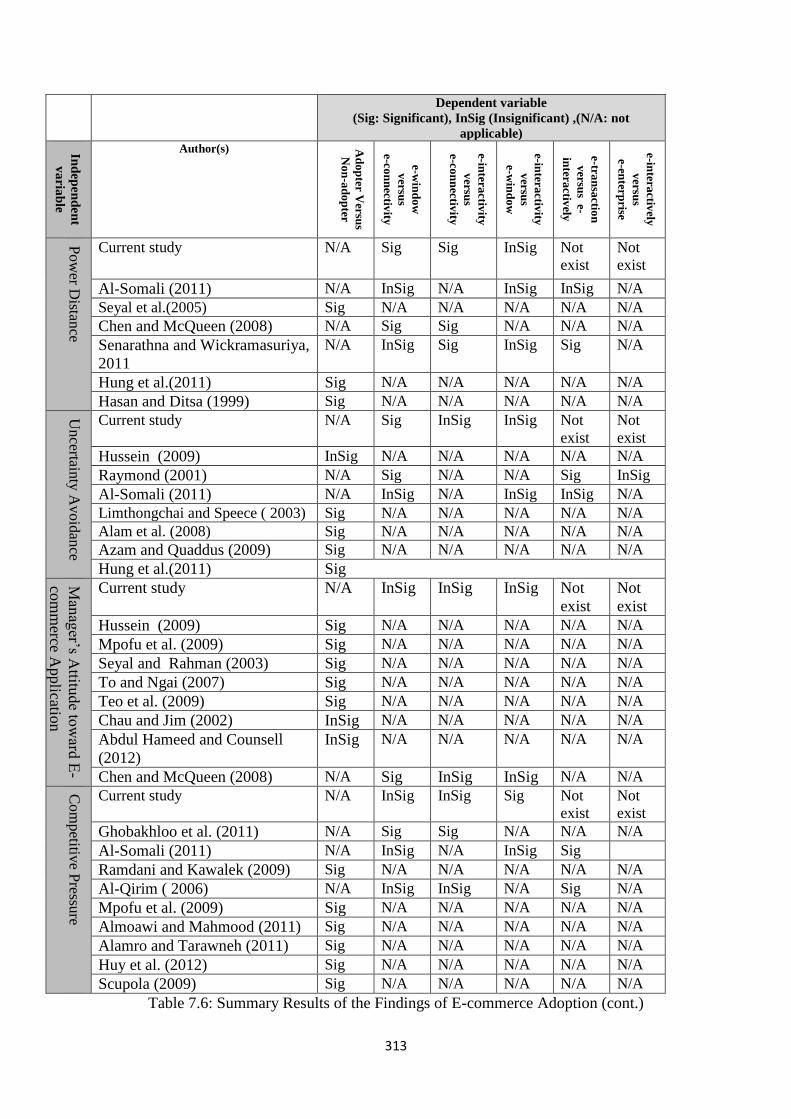
313
Dependent variable
(Sig: Significant), InSig (Insignificant) ,(N/A: not
applicable)
Ind
epen
den
t
va
riab
le
Author(s) Ad
op
ter Versu
s
No
n-a
do
pter
e-win
do
w
versu
s
e-con
nectiv
ity
e-intera
ctivity
versu
s
e-con
nectiv
ity
e-intera
ctivity
versu
s
e-win
do
w
e-tran
sactio
n
versu
s e-
intera
ctively
e-intera
ctively
versu
s
e-enterp
rise
Po
wer D
istance
Current study N/A Sig Sig InSig Not
exist
Not
exist
Al-Somali (2011) N/A InSig N/A InSig InSig N/A
Seyal et al.(2005) Sig N/A N/A N/A N/A N/A
Chen and McQueen (2008) N/A Sig Sig N/A N/A N/A
Senarathna and Wickramasuriya,
2011
N/A InSig Sig InSig Sig N/A
Hung et al.(2011) Sig N/A N/A N/A N/A N/A
Hasan and Ditsa (1999) Sig N/A N/A N/A N/A N/A
Un
certainty
Av
oid
ance
Current study N/A Sig InSig InSig Not
exist
Not
exist
Hussein (2009) InSig N/A N/A N/A N/A N/A
Raymond (2001) N/A Sig N/A N/A Sig InSig
Al-Somali (2011) N/A InSig N/A InSig InSig N/A
Limthongchai and Speece ( 2003) Sig N/A N/A N/A N/A N/A
Alam et al. (2008) Sig N/A N/A N/A N/A N/A
Azam and Quaddus (2009) Sig N/A N/A N/A N/A N/A
Hung et al.(2011) Sig
Man
ager’s A
ttitude to
ward
E-
com
merce A
pplicatio
n
Current study N/A InSig InSig InSig Not
exist
Not
exist
Hussein (2009) Sig N/A N/A N/A N/A N/A
Mpofu et al. (2009) Sig N/A N/A N/A N/A N/A
Seyal and Rahman (2003) Sig N/A N/A N/A N/A N/A
To and Ngai (2007) Sig N/A N/A N/A N/A N/A
Teo et al. (2009) Sig N/A N/A N/A N/A N/A
Chau and Jim (2002) InSig N/A N/A N/A N/A N/A
Abdul Hameed and Counsell
(2012)
InSig N/A N/A N/A N/A N/A
Chen and McQueen (2008) N/A Sig InSig InSig N/A N/A
Co
mp
etitive P
ressure
Current study N/A InSig InSig Sig Not
exist
Not
exist
Ghobakhloo et al. (2011) N/A Sig Sig N/A N/A N/A
Al-Somali (2011) N/A InSig N/A InSig Sig
Ramdani and Kawalek (2009) Sig N/A N/A N/A N/A N/A
Al-Qirim ( 2006) N/A InSig InSig N/A Sig N/A
Mpofu et al. (2009) Sig N/A N/A N/A N/A N/A
Almoawi and Mahmood (2011) Sig N/A N/A N/A N/A N/A
Alamro and Tarawneh (2011) Sig N/A N/A N/A N/A N/A
Huy et al. (2012) Sig N/A N/A N/A N/A N/A
Scupola (2009) Sig N/A N/A N/A N/A N/A
Table 7.6: Summary Results of the Findings of E-commerce Adoption (cont.)

314
Dependent variable
(Sig: Significant), InSig (Insignificant) ,(N/A: not
applicable)
Ind
epen
den
t
va
riab
le
Author(s) Ad
op
ter Versu
s
No
n-a
do
pter
e-win
do
w
versu
s
e-con
nectiv
ity
e-intera
ctivity
versu
s
e-con
nectiv
ity
e-intera
ctivity
versu
s
e-win
do
w
e-tran
sactio
n
versu
s e-
intera
ctively
e-intera
ctively
versu
s
e-enterp
rise
Su
pp
lier/Partn
er Pressu
re
Current study N/A Sig Sig InSig Not
exist
Not
exist
Raymond (2001) N/A Sig N/A N/A Sig InSig
Al-Somali (2011) N/A Sig N/A InSig Sig N/A
Teo et al. (2009) Sig N/A N/A N/A N/A N/A
Al-Qirim ( 2006) N/A InSig InSig N/A InSig N/A
Hung et al.(2011) InSig N/A N/A N/A N/A N/A
Al-Somali (2011) N/A Sig N/A InSig Sig
Andreu et al. (2010) N/A InSig N/A Sig N/A N/A
Cu
stom
er Pressu
re
Current study N/A InSig InSig InSig Not
exist
Not
exist
Al-Qirim ( 2006) N/A Sig Sig N/A Sig N/A
Teo et al. (2009) Sig N/A N/A N/A N/A N/A
Grandon and Pearson, 2003 Sig N/A N/A N/A N/A N/A
Scupola (2009) Sig N/A N/A N/A N/A N/A
Alamro and Tarawneh (2011) Sig N/A N/A N/A N/A N/A
Abdul Hameed and Counsell
(2012)
Sig N/A N/A N/A N/A N/A
Andreu et al. (2010) N/A Sig N/A InSig N/A N/A
Al-Somali (2011) N/A InSig N/A InSig Sig N/A
Go
vern
men
t Su
pp
ort
Current study N/A Sig Sig InSig Not
exist
Not
exist
Al-Somali (2011) N/A Sig N/A Sig Sig N/A
Seyal et al.(2005) Sig N/A N/A N/A N/A N/A
Hung et al.(2011) InSig N/A N/A N/A N/A N/A
Looi (1998) Sig N/A N/A N/A N/A N/A
Ramsey and McCole (2005) Sig N/A N/A N/A N/A N/A
Ghobakhloo et al. (2011) N/A InSig Sig N/A N/A N/A
Scupola (2009) Sig N/A N/A N/A N/A N/A
Tan and Teo (2000) Sig N/A N/A N/A N/A N/A
Hung et al. (2011) Sig N/A N/A N/A N/A N/A
Huy et al. (2012) Sig N/A N/A N/A N/A N/A
Hunaiti et al. (2009) Sig N/A N/A N/A N/A N/A
Table 7.6: Summary Results of the Findings of E-commerce Adoption
315
7.7 Revising the Research Objectives
Objective 1: Conduct a critical review of relevant literature related to ICTs and
e-commerce and develop a conceptual framework that can be used to identify the
factors associated with the adoption level of e-commerce in Jordanian travel
agencies
E-commerce technologies offer a survival guarantee and stability to SMEs in the
market and provide a competitive environment. However, the literature reviewed in
this study showed that the position of SMEs in developing countries is behind
developed countries in terms of e-commerce and technology adoption. Moreover, the
study found a lack of comprehensive framework that gives a best explanation of e-
commerce adoption by SMEs. Finally, most of prior studies of e-commerce adoption
focused on dichotomous variable presenting adoption versus non-adoption, while
limited studies addressed e-commerce maturity level in SMEs.
The current study extensively reviewed the literature relevant to technology and e-
commerce adoption by SMEs in both developed and developing countries and
reviewed the background, strengths and weaknesses of the most prominent theoretical
models that were used as bases of these studies to investigate e-commerce adoption by
SMEs. These include the Technology-Organisation-Environment (TOE), the Theory
of Reasoned Action (TRA), Technology Acceptance Model (TAM), Diffusion of
Innovation Theory and Hofstede’s Cultural Dimensions. It also reviewed the most
common e-commerce maturity models including the Rao Model, Daniel Model,
PriceWaterhouseCoopers Model, Rayport and Jaworski Model, Lefebvrea et al.’s
Model and Molla and Licker’s Model.
Based on reviewed literature, a comprehensive conceptual framework was developed
to provide a best explanation of e-commerce adoption as a guide of this study. The

316
conceptual framework was developed mainly on the basis of DoI, TOE, Hofstede’s
Cultural Dimension as independent variables and Molla and licker’s maturity model
as a dependent variable in order identify the association between these factors and the
level of e-commerce maturity attained by travel agencies, thus addressing the first
objective.
Objective 2: To study the current e-commerce adoption level in travel agencies in
Jordan
The study tested and validated the proposed conceptual framework by applying a
quantitative method for data collection using self-administrated questionnaire
distributed to 300 Jordanian travel agencies. A descriptive analysis was presented for
the demographic characteristics including respondent’s profile, company’s profile and
e-commerce information.
The results of descriptive analysis revealed that three different levels of e-commerce
are currently adopted by Jordanian travel agencies, namely: e-connectivity, e-window
and e-interactivity. It was found that 44.2% of the travel agencies adopted e-
connectivity, followed by 23.8% of agencies that adopted e-window and 32% of
agencies adopting e-interactivity, thus achieving the second objective.
Objective 3: To analyse data and validate the proposed conceptual model to
determine the factors associated with e-commerce adoption level in Jordanian
travel agencies
The multinomial logistic technique was applied as statistical procedure to test the
proposed hypotheses and their association with e-commerce adoption in travel
agencies. It was found that the effects of the developed hypotheses were different
based on the level of e-commerce adoption. In other words, it was found that
different factors affect different levels of e-commerce adoption in travel agencies.
317
The findings revealed that 10 independent variables have a significant role in
predicting e-commerce adoption levels by Jordanian travel agencies. The results
showed that relative advantage, observability, business/partner pressure, uncertainty
avoidance and government support were the significant predictors differentiating e-
window from e-connectivity. Moreover, relative advantage, observability, financial
barriers, power distance, business/partner pressure and government support proved to
be significant predictors differentiating between e-interactivity and e-connectivity.
It was also found that observability, competitive pressure, firm size and complexity
were significant predictors differentiating between e-interactivity and e-window. On
the other hand, the results showed that compatibility, trialability, employees’ IT
knowledge, top management support, manager’s attitude, and customer pressure were
insignificant predictors of any of the e-commerce adoption levels. These results,
therefore achieve the third objective of the study.
Objective 4: To provide valuable guidance to decision makers, IT consultants
and web vendors on adopting, facilitating and accelerating the diffusion of e-
commerce by Jordanian travel agencies
The results of the current study confirmed that different levels of e-commerce
adoption are affected by different factors. This entails the necessity of addressing the
ten significant predictors as they can be useful for managers, IT Vendors and policy
makers in drawing a roadmap and strategies for expanding the use and benefits of e-
commerce adoption.
The next chapter presents the study’s main findings and contribution to practice,
which addresses this objective.
318
7.8 Chapter Summary
This chapter discussed the findings based on the objectives of this study as well as the
results of this study compared to previous studies in order to answer the research
questions and validate the proposed conceptual model. The conceptual model covers
the factors affecting the adoption level of e-commerce in Jordanian travel agencies.
The next chapter will present the conclusion, contributions, limitations and
recommendations for future researches on e-commerce adoption.

319
Chapter Eight
Conclusion

320
8.1 Introduction
This chapter presents the conclusion of the study, based on the findings of the earlier
chapters and offers its main contributions. The limitations and suggestions for future
research are also included.
8.2 Research Summary
The study begins with the research background, problems, and motivations in order to
address the importance of this research and its contribution to the information systems
field. The discussion showed that while e-commerce growth affords many benefits
and opportunities to SMEs, travel agencies as a category of SMEs, face serious e-
commerce relevant challenges compared to other SMEs sectors. This can be attributed
to the fact that the Internet has changed the distribution structure in tourism industry,
which allowed travel suppliers to substitute their reliance on travel agents with
marketing and selling their products directly to customers through their own websites.
To survive in such market, travel agencies must, therefore, adopt e-commerce as an
alternative distribution channel, which gives them a wide range of opportunities to
reach their customers directly, improve their sales and marketing and increase their
revenues. However, there is lack of empirical studies in e-commerce adoption by
SMEs in developing countries, with only limited number of studies in Middle East
and more particularly Jordan.
The reviewed literature shows that no single or integrated theories have a best
explanation of the factors that affect e-commerce adoption in SMEs. Therefore, this
study attempts to develop a comprehensive framework that would present a better
explanation of e-commerce adoption decisions by SMEs in general and travel
agencies in particular.
321
In addition, there is a general lack of researches investigating whether different factors
affect different levels of e-commerce in SMEs. Therefore, this study included an
examination of the different factors affecting different levels of e-commerce adoption,
thus contributing to extant the maturity level of e-commerce in SMEs, specifically in
the in the area of information systems studies.
Based on the reviewed literature, the conceptual framework was developed to
examine and identify whether different factors affect different levels of e-commerce
adoption in travel agencies in Jordan, thus addressing the first objective. The
suggested conceptual framework was built on a combination of models including
TOE, DoI, and Hofstede’s Model. The factors were chosen for this study based on the
most frequent and dominant factors from prior studies, resulting in 16 factors that
examine the relationship between them and the e-commence adoption level.
Then, an inferential statistical technique using multinomial regression analysis was
applied to validate the model and test the proposed hypotheses for identifying the
factors associated with the research model. The study found that currently there are
only three different levels of e-commerce adoption in Jordanian travel agencies,
namely: e-connectivity, e-window and e-interactivity. It was found that 44.2% of the
travel agencies adopted e-connectivity, followed by 23.8% of agencies that adopted e-
window and 32% of agencies adopting e-interactivity.
Moreover, the results of the study showed the effects of e-commerce adoption levels
against the proposed hypotheses. The findings identified that different factors affect
different levels of e-commerce adoption in travel agencies. The results indicate that e-
window versus e-connectivity is determined by relative advantage, observability,
business/partner pressure, uncertainty avoidance and government. Moreover, e-

322
interactivity versus e-connectivity is determined by relative advantage, observability,
financial barriers, power distance, business/partner pressure and government support.
Finally, e-interactivity versus e-window is determined by observability, competitive
pressure, firm size and complexity.
The following chapter presents the study’s main findings, contribution, limitations
and recommendations for future research.
8.3 The Study Main Findings
The main findings are organized to answer the research questions as to achieve its
objectives. The findings are discussed based on three main questions as follows:
8.3.1 Research Question 1
What factors can be included in the proposed conceptual framework to study
and identify e-commerce adoption by Jordanian travel agencies?
The study aims is to analyse the impact of managerial decision on the level of e-
commerce adoption in travel agencies of Jordan. This aim has been met by addressing
the objectives of study, identifying the factors that influence or hinder decision
makers in Jordanian travel agencies in the adoption levels of e-commerce. To
examine the adoption level by Jordanian travel agencies a conceptual framework was
proposed including 16 predictors ,namely : relative advantage , compatibility,
complexity, trialability, observability , financial barriers , employees’ IT knowledge,
firm size, top management support , manager’s attitude toward e-commerce
application , power distance , uncertainty avoidance ,competitive pressure, customer
pressure, supplier/partner pressure and government support. These factors were tested
against different dependent variables, namely: non-adoption, e-connectivity, e-
window, e-interactivity, e-transaction and e-enterprise.
323
8.3.2 Research Question 2
What is the current state of e-commerce adoption level in Jordanian travel
agencies?
The findings of this study show that there are only three levels of e-commerce
adoption by travel agencies in Jordan, namely: e-connectivity, e-window and e-
interactivity and that 44.2% of the travel agencies adopted e-connectivity, followed by
23.8% of agencies that adopted e-window and 32% adopting e-interactivity. This
indicates that the majority of travel agencies of the sample have some sort of
connection to the Internet which can be attributed to the inexpensive cost of Internet
and well establishment of a modern telecommunication infrastructure in Jordan
(Jordan Investment Board, 2010). Moreover, travel agencies in Jordan use emails in
communicating with their travel suppliers and partners in order to maintain their
business relationship. Also, the findings show that many of travel agencies in Jordan
have websites to promote their travel products and services, and provide their profiles.
One interesting findings is that more advanced and sophisticated levels of e-
commerce adoption including online payment and/or full e-commerce business
activities , are not common in Jordanian travel agencies, which may be indicative that
an advanced level of e-commence requires more sophisticated technology equipment
and ICTs skills which is costly. In addition, electronic payment in Jordan is still in
infancy while the security concerns also hinders the adoption of an advanced level of
e-commerce in SMEs (Shannak and Al-Debei, 2005; Al-ma'aitah, 2013).
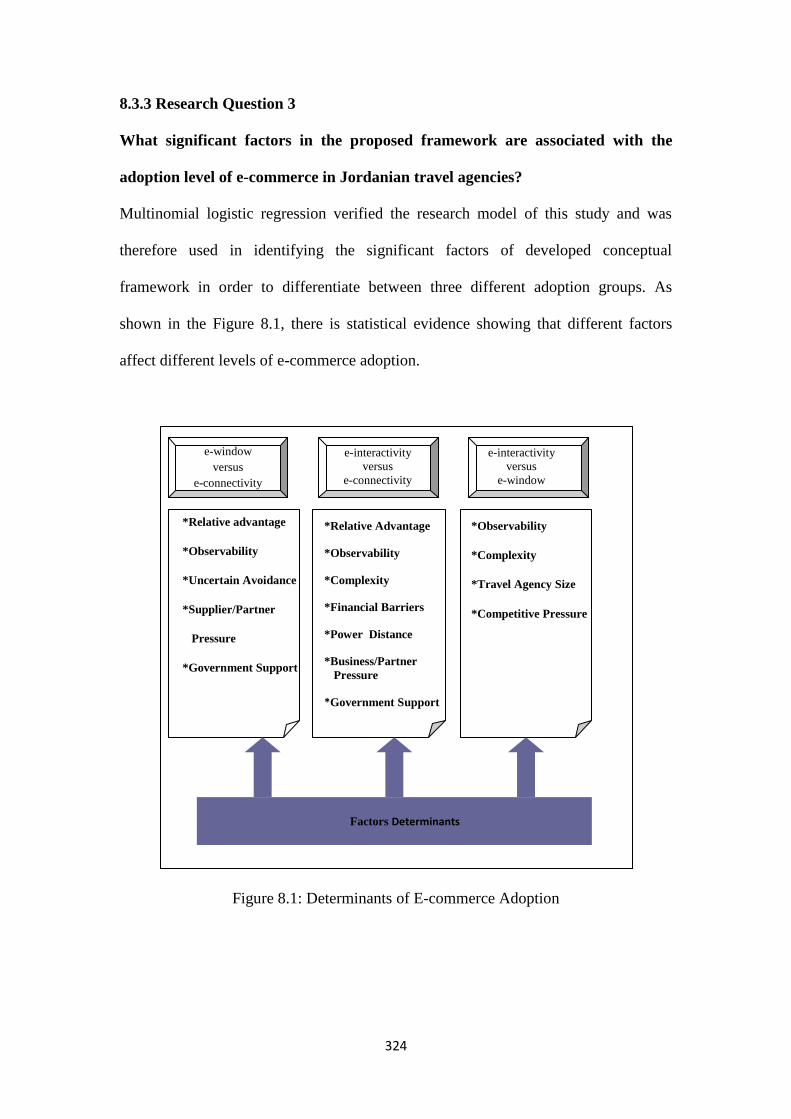
324
8.3.3 Research Question 3
What significant factors in the proposed framework are associated with the
adoption level of e-commerce in Jordanian travel agencies?
Multinomial logistic regression verified the research model of this study and was
therefore used in identifying the significant factors of developed conceptual
framework in order to differentiate between three different adoption groups. As
shown in the Figure 8.1, there is statistical evidence showing that different factors
affect different levels of e-commerce adoption.
Figure 8.1: Determinants of E-commerce Adoption
e-window
versus
e-connectivity
e-interactivity
versus
e-connectivity
e-interactivity
versus
e-window
*Relative advantage
*Observability
*Uncertain Avoidance
*Supplier/Partner
Pressure
*Government Support
*Relative Advantage
*Observability
*Complexity
*Financial Barriers
*Power Distance
*Business/Partner
Pressure
*Government Support
*Observability
*Complexity
*Travel Agency Size
*Competitive Pressure
Factors Determinants
325
8.3.3.1 Attributes of Innovation
The relationship between attributes of innovation and the e-commerce adoption level
was examined in Chapter 6 and the results showing that relative advantage,
observability and complexity were significant factors affecting the level of e-
commerce adoption in travel agencies while compatibility and trialability were
insignificant in all e-commerce adoption models. It can be clearly seen in Figure 8.1
that relative advantage is an important driver in influencing decision makers in travel
agencies to adopt simple and interactive website rather than basic e-commerce
adopters who only have e-mails but no website. This can be attributed to the benefits
obtained from e-commerce adoption that motivate decision makers to employ higher
level e-commence practices.
Moreover, the complexity factor was found negative but significant in differentiating
between e-interactivity and e-connectivity as well between as e-window and e-
interactivity. This indicates that the difficulty of using e-commerce applications is an
important factor influencing decision makers when considering the adoption choice
particularly with regard to an advanced level of e-commerce applications, which
means that a higher perception of technical complexity by decision makers led to a
lower e-commerce adoption level.
Observability was found the most significant factor in the attributes of innovation
dimension influencing the adoption decision. In addition, this study found that this
factor influenced all levels of e-commence adoption among Jordanian travel agencies,
which means that observing the benefits of e-commerce adoption results by other
adopters entails more likeliness of adopting that innovation in Jordanian travel
agencies.

326
8.3.3.2 Organisational Factors
Two of the three organisational factors were found significant in influencing decision
makers on the adoption level of e-commerce, namely: travel agency size and financial
barriers, while employees’ IT knowledge was found insignificant in all adoption
levels. As shown in Figure 8.1, the study found that travel agency size is only
significant in differentiating between e-interactivity and e-window, which indicates
this factor’s close relevance to advanced e-commerce adoption group.
The financial barriers factor was found significant and negatively in differentiating
between e-interactivity and e-connectivity, but insignificant in all other groups of
adopters. The findings showed that more advanced levels of e-commence adoption are
affected by financial barriers. Therefore, decision makers of travel agencies are more
willing to adopt more sophisticated levels of e-commerce if they have sufficient
budget for e-commerce implementation and maintenance and employee training.
8.3.3.3 Managerial Factors
Two of the four managerial factors were found relevant to travel agencies e-
commerce adoption. These significant variables include power distance and
uncertainty avoidance while top management support and manager’s attitude toward
e-commerce were found insignificant in all e-commence adoption levels.
As shown in Figure 8.1, the study found that the advanced level of e-commerce
adoption is more related to the power distance factor. This indicates that travel
agencies owners/mangers with low levels of power distance features such as
willingness to listen to employees’ suggestions are more ready to adopt higher levels
of e-commerce applications.

327
Uncertainty avoidance was found significant and negative in differentiating between
e-window and e-connectivity and insignificant in differentiating between e-
interactivity and e-connectivity as well as between e-window and e-interactivity. This
result indicates that the basic adoption and simple adoption levels are more affected
by uncertainty avoidance factor. In addition, the insignificant relation in high levels of
e-commerce adopters indicates that decision makers are not willing to take risk with
e-commerce due to security concerns and risks related to electronic payment.
8.3.3.4 Environmental Factors
Three of the four environmental factors were found relevant to travel agencies e-
commerce adoption: competitive pressure, supplier/partner pressure and government
support. As shown in Figure 8.1, competitive pressure was found to have a positive
and significant relationship in differentiating between e-window and e-interactivity,
while this factor had an insignificant relationship with other groups. This indicates
that only competitive pressure affected e-commerce adopters in travel agencies and
urged them to upgrade to more sophisticated e-commerce applications.
Supplier/partner pressure had a significant and positive relationship in differentiating
between e-window and e-connectivity as well as between e-interactivity and e-
connectivity indicating its significance in influencing decision makers to adopt a
higher level of e-commerce in their travel agencies.
However, supplier/partner pressure did not have any influence on advanced e-
commerce adopters because these have already adopted e-commence applications and
are now connected with their partners and suppliers over the Internet in different ways
as logging onto their websites to use information and database and placing orders.
Similarly, the government support was positive and significant in differentiating
328
between e-window and e-connectivity and between e-interactivity and e-connectivity
groups which indicates that government support is an important factor influencing
decision makers when considering a shift from basic level of e-commerce adoption to
higher adoption levels such as simple or interactive website.
To recap, these results confirmed that several factors are affecting owners/managers
decisions on the different levels of e-commerce adoption. They show that only the
observability factor influenced all levels of e-commerce adoption and that the
business/partner pressure factor and government support factor are significant for the
decision on basic and simple level of e-commerce adoption. Additionally, uncertainty
avoidance was found only significant to decision makers planning to upgrade from
basic e-commerce adoption to a simple adoption. Also, complexity and financial
barriers were found inhibitive factors for travel agencies planning to shift from basic
to a more advanced level of e-commerce. Finally, the travel agency size and
competitive pressure were significant factor for decisions on advanced level of e-
commerce adoption such as shifting from a simple website to interactive website.
8.4 Contribution of this study
The above section presented a summary of the key findings of the study, upon which
the study offers two main contributions, namely: contribution to research and
contribution to practice, as discussed hereunder.
8.4.1 Contribution to Research
This study presented more holistic image of the existing literature in the area of
information systems, particularly in the context of e-commerce adoption. The study
reviewed and evaluated the most prominent models and theories in IT adoption and
329
discussed the strengths and weaknesses of these models and their applicability in
organisations as to provide the best explanation of the factors affecting e-commerce
adoption in travel agencies as an SMEs in developing countries, and more particularly
in Jordan.
Upon that, the study developed a conceptual framework based on diffusion of
innovation theory (DoI), technology-organisation-environment model (TOE) and
Hofstede’s cultural dimensions to determine the relationship between four groups of
factors including ‘attribution of innovation factors’, ‘organisational factors’,
‘managerial factors’ and ‘environmental factors’ on the one hand and the e-
commerce adoption levels on the other. The findings of this study responded to Hung
et al. (2011) who claimed that there are no theories or models whether single or
integrated that have a best explanation of e-commerce adoption in SMEs in
developing countries, particularly in travel sector.
The e-commence adoption maturity level as the dependent variable was identified in
the current study as multichotomous variable including non-adoption, e-connectivity,
e-widow, e-interactivity, e-transaction and e-enterprise, which moves beyond many
previous studies that only identified the factors affecting e-commerce adoption as
dichotomous variables, ‘adoption versus non-adoption’.
Therefore, it can be argued that this study’s approach to conceptualizing e-commence
maturity levels adds to its strength and represents another contribution to relevant
literature. The study identified that the different levels of e-commerce adoption are
affected by the different predictors of the proposed model of this study. These
findings shed a light to researcher the real situation that travel agents face.
Understanding the factors that inhibiting or facilitating owners/managers’ decisions
on the adoption level of e-commerce also adds value to the context of e-commerce
330
adoption literature.
Also, the findings of this study answered the call by Abou-Shouk (2012) who claimed
to identify the factors affecting different levels of e-commerce adoption in travel
agents starting from simple e-commerce adoption and ends to extensive adoption.
These findings are contributes to the growing body of knowledge in the field of e-
commerce adoption in developing countries, particularly within SMEs. Also, the
measurement model for this study can be applied for other travel agencies and SMEs
in developing countries.
Another contribution of this study is manifested in the research methodology that is
based on empirical validation and measurement of the constructs included in the
conceptual framework that could be further invested in understanding e-commerce
adoption in developing countries. Another methodological contribution is the
multinomial logistic regression that offered a richer interpretation of data regarding
the factors affecting the level of e-commerce adoption, as no previous researches in
the context of technology adoption could be found with similar statistical methods.
8.4.2 Contribution to Practice
The above section presented the important contribution of this study to information
systems fields specifically within the discipline of e-commerce. This research has also
significant contribution to practice including owners/managers, policy makers, and IT
consultants and software vendors. It provided them to have a better understanding of
e-commerce adoption in Jordanian travel agencies such as, the current state of e-
commerce adoption activates by Jordanian travel agencies and the factors that
influence/inhibit travel agencies to adopt e-commerce.
331
8.4.2.1 Contribution to Owners/Managers
The findings of this study offer a useful model for owners/managers of travel agencies
to improve their decisions regarding e-commerce adoption. It can guide decision
makers to identify which level of e-commerce could be useful for their business and
help draw a roadmap and strategies for managers interested in expanding their
business and acquiring more benefits from adopting e-commerce applications. It also
shows factors that motivate and inhibit travel agencies’ decision makers in e-
commerce adoption. The findings are a significant contribution to the efforts of travel
agencies’ owners/managers in developing an effective and efficient support for SMEs.
For example, it is shown that observability and uncertainty avoidance are the greatest
influential factors to decision makers when considering moving from a traditional
business to an early stage of e-commerce adoption such as basic website. Therefore,
efforts should be exerted to increase the management’s awareness of the importance
of adopting e-commerce applications in travel agencies and reduce their sense of
uncertainty. Undoubtedly, if owners/managers see the benefits attained by e-
commence adopters in travel business, they will be more likely to adopt e-commence
applications and become less uncertain about such adoption.
In addition, the study shows that power distance and financial barriers are the most
significant factors that inhibit owners/managers’ decisions to move from traditional
business to interactive website. This suggests that owners/managers with high score of
power distance have a significant and negative relationship with advanced e-
commerce adoption .This may be indicative of Jordanian travel agencies’ reluctance
to adopt an advanced level of e-commerce as owners/managers do not share decision
with their employees, particularly IT staff who might explain the benefits of e-
commerce implementation and usage in the travel agency. Another finding is that lack

332
of financial resources is one of the most important reasons of this reluctance which
suggests that they should have a financial strategy in which the level of e-commerce
adoption is included. For example, it is not expensive for travel agencies to launch a
basic website displaying general information about the agency, its services,
promotional activities and contacts details, including website building, designing,
maintaining and hosting. On the other hand, travel agencies that adopted interactive
website enabling communication with customers and suppliers to receive requests and
provide online feedback and inventory search have to afford more costs as such level
entails regular maintenance and updates.
The study also found that competitive pressure influences owners/managers’ decisions
to move from simple website to interactive one, which suggests that travel agencies
with a high competitive position influence decision makers to upgrade e-commerce
adoption in their businesses. This would encourage decision makers to develop an
information systems strategy that includes e-commerce applications in their travel
agencies when they believe that Jordanian customers will buy their travel products
online rather than in the traditional way.
8.4.2.2 Contribution to Web Vendors and IT Consultants
As discussed earlier in this chapter, e-commerce adoption provides travel agencies
with the opportunity to increase their survival in the global travel market. In addition,
the study found that various factors affect the different levels of e-commerce
adoption, thus carrying important web vendors and IT consultants’ contribution in
developing and designing strategies to promote e-commerce adoption in Jordanian
travel agencies.
The findings allow web vendors and IT consultants to identify the appropriate model

333
affecting each level of e-commerce in travel agencies, understand owners/managers
perceptions and knowledge regarding using e-commerce applications and identify the
reasons for slow e-commerce adoption within travel agencies. This in turn enables
them to tailor solutions for travel agencies’ needs in adopting the appropriate level of
e-commence. Also, the complexity factor was found the most important barrier
hindering decision makers in Jordanian travel agencies from adopting an advanced e-
commerce level.
Furthermore, relative advantages were found a very important factor particularly in an
early adoption level. This entails that web vendors and IT consultants should educate
and train decision makers on e-commerce benefits through conferences, workshops
and personal visits. Finally, although the study found that trialability is insignificant in
influencing owners/managers to adopt e-commerce, web vendors should provide
travel agencies with trial versions of e-commerce applications and allow enough time
to evaluate these applications. Trial versions would assist owners/managers in making
the appropriate decision whether implementing a certain e-commerce application in
their agency will be rewarding, as such versions minimize the uncertainty of using e-
commerce applications and enable agencies to adopt solutions with low start-up cost.
8.4.2.3 Contribution to Policy Makers
The study showed that government support is an important factor that influences
policy makers in Jordanian travel agencies in adopting e-commerce. Government
support includes policies and legislations, training and educational programs,
electronic infrastructure and funding. This outcome ought to assist policy makers in
planning, identifying solutions and overcoming challenges hindering e-commerce
adoption in travel agencies. First, the government can use information in this study to

334
draft policies and legislations that promote the adoption of e-commerce in Jordanian
travel agencies. In terms of policy, the government should liberalize the
telecommunication sector and trade which might have a major impact on e-commerce
adoption in SMEs. The government should also decrease taxes and tariffs on
technology devices such as computers, servers, switches and routers, which may
expedite e-commerce adoption. In terms of legislations, the government should design
a solid regulatory framework to support e-commerce adoption and protect businesses
and customers against hacking and fraud. Also, government agencies, such as the
Jordan Tourism Board and Ministry of Tourism, should raise travel agencies’
awareness of e-commerce benefits and applications through training programs,
conferences and workshops. Moreover, the government has to further improve the
Internet infrastructure and provide subsidies to SMEs which would boost the growth
of e-commerce adoption. Finally, travel agencies in Jordan would have no problem to
adopt full and sophisticated levels of e-commerce applications if they receive
financial assistance from the government. It was found that the main concerns of
travel agencies owners/mangers are set-up cost and pricing issues. Therefore, the
government should support travel agencies financially through long term and low
interest loans.
8.8 Limitations and Suggestions for Future Study
First, the study employed a quantitative method that is based on self-administrated
cross-sectional survey to investigate the factors associated with e-commerce adoption
level by Jordanian travel agencies. The cross-sectional survey only reflects the
respondents’ beliefs, perceptions and experiences towards e-commerce adoption at
one point in time. However, these can change over time which necessitates

335
conducting a longitudinal survey in future research to provide more robust evidence
that explains the factors associated with e-commerce adoption and gives further
validation of the conceptual framework proposed in this study.
Second, in measuring the constructs of this study, the quantitative method using self-
administrated questionnaire. There is limitation of this method as it does not provide
true information about the context and it involves the problem of biased reporting
particularly by busy respondents who do not have enough time to answer the
questionnaire accurately. Also, self-administrated questionnaire have another
limitation, which is a subjective measure; thus it might be inappropriate surrogate in
determining the actual usage of technology.
Third, the data of this study was confined to Jordan which may restrict applying its
findings to other countries. Therefore, future research is needed to replicate it in other
countries particularly the Arab countries in order to expand the generalizability of the
study.
Fourth, owners/managers’ perception of e-commerce adoption in Jordanian travel
agencies were assessed. It would be interesting to conduct a future research to
examine these perceptions toward e-commerce adoption in SMEs in a wider range of
SMEs sectors such as financial, services and manufacturing in order to identify the
factors influencing owners/managers’ decisions on the level of e-commerce adoption.
Such research can also provide a useful comparative view of the different types of
SMEs and the factors affecting owners/managers decisions on the level of adoption,
which contributes to the knowledge and understanding of e-commerce adoption by
SMEs.
336
Finally, the study found that various factors affect the different levels of e-commerce
adoption. However, the current state of e-commerce adoption by Jordanian travel
agencies was only distributed in three adoption levels, namely: e-connectivity, e-
window and e-interactivity; while the other levels identified in the proposed
framework ‘non-adoption, e-transaction and e-enterprise’ did not exist in those
agencies. Future studies are needed to examine the factors affecting the other levels of
e-commerce adoption in order to build a complete picture in understanding e-
commerce adoption and identify different factors associated with different e-
commerce adoption levels.
8.6 Conclusion
Significant threat of disintermediation encounters traditional travel agencies if they do
not change their business strategies. Abu-Shouk (2012) and Cheung (2009) argued
that e-commerce adoption is the most effective strategy by travel agencies to save
them from disintermediation. However, exploratory studies found slow adoption of e-
commerce in travel agencies, particularly in developing countries (Rania, 2009; Abu-
Shouk, 2012; Heung, 2003; Li and Buhalis, 2006; Livi, 2008), although e-commerce
is considered a strategic tool in supporting travel agencies. Therefore, this study has
sought to understand the factors influencing owner/managers of Jordanian travel
agencies decisions on e-commerce adoption level. These factors were identified by
integrating three dominant technological theories, namely: DoI, TOE and Hofstede’s
Cultural Theory as to examine their association with e-commerce adoption levels
which included six different levels of e-commerce: non-adoption, e-connectivity, e-
window, e-interactivity, e-transaction and e-enterprise. The findings are expected to
provide a useful tool and necessary directions on e-commerce adoption among

337
decision makers in Jordanian travel agencies. This research has fulfilled its goals and
objectives and answered the questions presented in Chapter 1. Multinomial logistic
regression was used to test sixteen hypotheses and their relation to e-commerce
adoption level. Ten of the sixteen hypotheses were supported. Also, it was found that
different hypotheses affect different levels of e-commerce. Moreover, this study
showed that only three levels of e-commerce were adopted by travel agencies in
Jordan: e-connectivity, e-window and e-interactivity. The results of Multinomial
Logistic Regression Analysis supported Hypothesis 1 (Relative Advantage),
Hypothesis 5 (Observability), Hypothesis 11 (Uncertainty Avoidance), Hypothesis 14
(Business/Partner Pressure) and Hypothesis 16 (Government Support) to differentiate
between e-window and e-connectivity. The results also found that Hypothesis 1
(Relative Advantage), Hypothesis 3 (Complexity), Hypothesis 5 (Observability),
Hypothesis 7 (Financial Barriers), Hypothesis 10 (Power Distance), Hypothesis 14
(Business/Partner Pressure) and Hypothesis 16 (Government Support) were
significant in differentiating between e-window and e-connectivity. Finlay, the results
found that Hypothesis 3 (Complexity), Hypothesis 5 (Observability), Hypothesis 6
(Travel Agency Size) and Hypothesis 13 (Competitive Pressure) were significantly
supported as differentiating between e-interactivity and e-window.
In general, the findings of this study have provided an important contribution to the
information technology literature in general and e-commerce adoption in SMEs and
travel agencies in particular. Thus, it avoided the limitations of previous studies and
filled a gap by establishing a comprehensive conceptual framework that links between
the factors influencing owners/managers’ decisions and e-commerce adoption level
with empirical support. Although the study has provided a general evidence of
conceptual framework applicability in Jordan, further research is needed to examine
338
the applicability of this conceptual framework in other countries in order to increase
knowledge on e-commerce adoption in travel agencies and other SMEs which should
help expanding the research range in the field of information systems. Finally, it is
hoped that the findings of this study will provide useful information to practitioners,
policy makers and academics.
References
Abdul Hameed, M., and Counsell, S. (2012). “Assessing the influence of
Environmental and CEO Characteristics for Adoption of Information
Technology in Organizations”, Journal of Technology Management &
Innovation, Vol.7, No.1, pp. 64-83
Abou-Shouk, M., Megicks, P., and Lim,W.M. (2012) “Perceived Benefits and E-
Commerce Adoption by SME Travel Agents in Developing Countries:

339
Evidence From Egypt”, Journal of Hospitality & Tourism Research, Journal of
Hospitality & Tourism, Vol. 37, No. 4, pp. 490-515
Adewale, G., Ayo-Oyebiyi G.T, and Adebayo, S. A. (2013) “An Empirical Study of
Factors That Influence the Adoption Of e-Commerce in Nigerian Business
Organizations” , International Journal of Business and Management Invention,
Vol. 2, No. 9, pp. 28–33.
Aghaunor, L. and Fotoh, X. (2006) “Factors Affecting Ecommerce Adoption in
Nigerian Banks”, Jönköping Int. Bus. School, Jönköping University. Online
available at <hj.diva.portal.org/smash/get/diva2:4190/FULLTEXT01>
[Accessed 30/4/2011]
Ajlouni,K.H (2006) “ The financing problems of small and medium-sized
manufacturing enterprises in Jordan”, PhD Thesis, University of Durham, UK.
Online available at < http://etheses.dur.ac.uk/1816/1/1816.pdf > [Accessed
2/11/2014]
Ajzen, I. (1985) “From intentions to actions: A theory of planned behavior”. In J.
Kuhl and J. Beckmann (eds.), Action Control: From Cognition to Behavior.
New York: Springer.
Ajzen, I. (1991) “ The theory of planned behavior”. Organizational Behavior and
Human Decision Processes, Vol 50,No. 2,pp. 179-211.
Al-Adwan, A., Al- Adwan,A. , Smedley,J. (2013) “Exploring students acceptance of
e-learning using Technology Acceptance Model in Jordanian universities”.
International Journal of Education and Development using Information and
Communication Technology Vol. 9, No. 2, pp. 4-18
340
Alam, S.S, Khatibi ,A. Sayed ,and I. Isamil ,H. (2008) “Factors affecting e-commerce
adoption in the electronic manufacturing companies in Malaysia”.
International Journal of Commerce and Management, Vol. 17 ,Nos. 1/2, pp.
125-139
Alam,.S ,Khatibi,A, Ismail M.,Ahmad,S., Ismail,H. (2008) “Factors affecting e-
commerce adoption in the electronic manufacturing companies in Malaysia”,
International Journal of Commerce and Management, Vol. 17, Nos, 1/2,
pp.125 – 139.
Alam,S.,and Noor,M.(2009) “ICT Adoption in Small and Medium Enterprises: an
Empirical Evidence of Service Sectors in Malaysia”. International Journal of
Business and Management, Vol. 4, No 2, pp. 112-125
Alamro, S., Tarawneh, S.A. (2011) “Factors Affecting E-Commerce Adoption in
Jordanian SMEs”, European Journal of Scientific Research, Vol. 64, No. 4, pp.
497-506
Alatawi, F.M.H., Dwivedi, Y.K. and Williams, M.D. (2013) “Developing a
conceptual model for investigating adoption of knowledge management
system in Saudi Arabian public sector”, International Journal of Business
Information Systems, Vol. 14, No. 2, pp.135–163.
Al-Dmour,H. , and Al-Surkhi,M.M (2012) “Factors Affecting SMEs Adoption of
Internet-Based Information Systems in Business-To-Business ( B2B ) and the
Value-Added on organization’s Performance”, Jordan Journal of Applied
Science , Vol.14, No. 1, pp.181-200

341
Al-Hudhaif, S., and Alkubeyyer, A. (2011) “E-Commerce Adoption Factors in Saudi
Arabia”, International Journal of Business and Management, Vol. 6, No. 9, pp.
122-133.
Al-Hujra, O. Al-dalahmeh,M. and Aloudat, A. (2011) “The Role of National Culture
on Citizen Adoption of eGovernment Services: An Empirical Study”,
Electronic Journal of e-Government, Vol. 9 , No. 2, pp.93 – 106.
Al-Khaffaf, M. (2011) “E-Readiness in Jordan Public Shareholding Companies”,
Jordan Journal of Business Administration,Vol.7, No.3,pp. 494-510
AlGhamdi, R., Alfarraj, O. & Bahadad, A. (2014) “How Retailers at different Stages
of E-Commerce Maturity Evaluate Their Entry to E-Commerce Activities?”,
Journal of Computer Science and Information Technology, Vol. 2, No. 2, pp.
37-71.
Allahawiah, S., Altarawneh, H. , Alamro, S. (2010) “The Internet and Small Medium-
Sized Enterprises (SMES) in Jordan”, World Academy of Science,
Engineering and Technology, 62, pp. 302-306
Allan, C., Annear, J., Beck, E. and Beneren, J.V. (2003) “A framework for the
adoption of ICT and security technologies by SMEs”, Proceedings of 16th
Annual Conference of Small Enterprise Association of Australia and New
Zealand, pp. 1-10.
Al-ma'aitah, M.A. (2013) “Security Concernsin E-payment and the Law in Jordan”.
International Journal of Advanced Computer Science and Applications, Vol. 4,
No.7,pp. 179-183

342
Almoawi ,A. (2011) “E-commerce adoption Among Small and Medium Enterprises in
Saudi Arabia” PhD Thesis, University Utara Malaysia
Almoawi ,A.,and Mahmood,R. (2011) “Applying the OTE Model in Determining the
E-commerce Adoption on SMes in Saudi Arabia”, Asian Journal of Business
and Management Sciences , Vol. 1 ,No. 7 ,pp.12-24.
Al-Noor, M.,and Arif, R. (2011) “Adoption of B2B e-commerce by the SMEs in
Bangladesh Innovative Systems Design and Engineering”. Innovative Systems
Design and Engineering, Vol. 2, No.6, pp. 48-59
Al-Qirim, N. (2006) “The role of the government and e-commerce adoption in small
businesses in New Zealand”, International Journal of Internet and Enterprise
Management, Vol. 4, No. 4, pp. 293-313.
Alrawabdeh,W., Salloum,A., Mingers,J. (2012) “Key Factors influencing the
Diffusion of Information and Communication Technology (ICT) in the Arab
World, A Comparative Study”, British Journal of Economics, Finance and
Management Sciences, No. 2, Vol. 5, pp.45-59
Al-Rawashdeh, S.T. (2011) “The Effect of Small-Scale Industry on Local
Development Case Study : Karak Governorate”, Canadian Social Science,
Vol. 7, No. 6, pp. 264-271.
Al-Somali, S. A., and Clegg, B. (2011) “Determinants of B2B e-commerce adoption
in Saudi Arabian firms”, International Journal of Digital Society (IJDS), Vol.
2,No. 2,pp. 406–415.

343
Al-Somali, S. A., Gholami,R., and Clegg, B. (2011) “Determinants of B2B e-
commerce adoption in Saudi Arabian firms, International Journal of Digital
Society (IJDS)”,Vol. 2,No. 2,pp. 406–415.
Al-weshah, G. A., and Al-zubi, K. (2012) “Study Of SMEs in Jordanian
Communication”, Global Journal of Business Research, Vol. 6, No. 3, pp. 1–
15.
Alzougool, B., and Kurnia, S. (2008) “Electronic commerce technologies adoption by
SMEs: A conceptual study”, Proceedings of the 19th Australasian Conference
on Information System, pp. 42-54.
American Association for Public Opinion Research (2006) “Standard Definitions:
Final Dispositions of Case Codes and Outcome Rates for Surveys”, Available
online at <
http://www.aapor.org/AM/Template.cfm?Section=Standard_DefinitionsandTe
mplate=/CM/C > [Accessed 20/ 11/2013] .
Andreu, L., Aldás, J., Bigné, J. E., and Mattila, A. S. (2010) “An analysis of e-
business adoption and its impact on relational quality in travel agency–
supplier relationships”, Tourism Management, Vol. 31, No. 6,pp. 777–787.
Antunes,I., Barandas, H., and Martins,V. (2013) “The Impact Of National Cultures
On International Marketing Strategy And Subsidiary Performance Of
Portuguese Sme’s”. The International Journal of Management, Vol. 2, No. 3,
pp. 38-45.
344
Apulu, I and Latham, A. (2009c) “Information and communication technology
adoption: Challenges for Nigerian SMEs”, TMC Academic Journal, Vol. 4,
No. 2, pp. 64-80.
Apulu, I., and Latham, A. (2011) “Drivers for Information and Communication
Technology Adoption:A Case Study of Nigerian Small and Medium Sized
Enterprises”, International Journal of Business and Management, Vol. 6, No.
5, pp. 51-60.
Arabadvisors .(2012 ) “Jordan Internet users and e-commerce survey 2012”,Arab
Advisors Group, Available online at
<http://www.arabadvisors.com/node/13566> [Accessed 16/10/14]
Arano ,K.G., and Spong,B. (2012) “Electronic Commerce Adoption in the Hardwood
Industry” .Journal of extension , Vol. 50,No. 6 , Available online at
<http://www.joe.org/joe/2012december/rb4.php> [Accessed 11/09/2014 ]
Araste, A. R., Mansouri, A., and Jafari, M. (2013) “The Factors Affecting the E-
commerce Adoption in SMEs in the Industrial Towns of Zanjan-Iran:
Managers` Perspectives”, International Journal of Academic Research in
Business and Social Sciences, Vol. 3, No. 10, pp. 100–109.
Archer, N., Wang, S., and Kang, C. (2008) “Barriers to the adoption of online supply
chain solutions in small and medium enterprises”, Supply Chain Management,
Vol. 13, No. 1, pp. 73 - 82.
Arendt, L. (2008) “Barriers to ICT adoption in SMEs: how to bridge the digital
divide?”, Journal of Systems and Information Technology, Vol. 10, No. 2, pp.
93-108.

345
Ary, D. , Jacobs, L., Sorensen, C, and Walker, D. (2002) “Introduction to Research
in Education”, 9th
ed., Belmont,CA:Wadsworth.
Ashrafi, R., and Murtaza, M. (2008) “Use and Impact of ICT on SMEs in Oman”,
Electronic Journal Information Systems Evaluation, Vol. 11,No. 3,pp. 125-
138.
Awa ,H.O., Ukoha, O. (2012) “Integrating TAM and TOE Frameworks and
Expanding their Characteristic Constructs for E-Commerce Adoption by
SMEs” ,In Proceedings of Informing Science and IT Education Conference
(InSITE) .Online available
at<http://proceedings.informingscience.org/InSITE2012/InSITE12p571-
588Awa0144.pdf > [Accessed 15/10/2014]
Awa, H. Nwibere , B., Inyang, B. (2010) “The Uptake of Electronic Commerce By
SMEs: A Meta Theoretical Framework Expanding The Determining
Constructs Of TAM and TOE Frameworks”, Journal of Global Business
Technology ,Vol. 6, No. 1,pp. 1-27.
Azam, M.S., and Quaddus, M. (2009b) “Adoption of E-Commerce by the SMEs in
Bangladesh: The Effects of Innovation Characteristics and Perceived Risk”, In
Proceedings of the Australian and New Zealand Marketing Academy
Conference (ANZMAC) ,Melbourne, Australia.
Azam, M.S., and Quadddus, M. (2009), “Adoption of b2b e-commerce by the SMEs
in Bangladesh: an empirical analysis”, Proceedings of Asian Business

346
Research Conference, Dhaka, online available at
www.wbiconpro.com/18%5B1%5D.-Azam-.pdf [Accessed 13-4-2012]
Azam, M.S., and Quaddus, M. (2012) “Effects of internal and external factors on
internet-based digital technology usage by SMEs in a developing country”,
Communications of the IIMA ,Vol. 12 , No.4, pp. 41-69.
Aziz ,F., and Jamali ,N. (2013) “Factors Influencing the Level of Adoption in
Electronic Commerce Among SMEs”, International Journal of Information
Technology & Computer Science ( IJITCS ) ,Vol. 8 , No. 2 ,pp.105-110.
Babbie E. (2010) “The Practice of Social Research”, 12th ed, Thomson Wadsworth
Australia.
Baker,J. (2012) “The Technology–Organization–Environment Framework”.
Integrated Series in Information Systems, Vol. 28, pp. 231-245
Bao.J., and Sun, X. (2010) “A Conceptual Model of Factors Affecting e-Commerce
Adoption by SMEs in China”, In proceeding of International Conference on
Management of e-Commerce and e-Government, IEEE.
Barba-Sanchez, V., Martinez-Ruiz ,M., and Jiménez-Zarco, A. (2007) “Drivers,
Benefits and Challenges of ICT Adoption by Small and Medium Sized
Enterprises (SMEs): A Literature Review”, Problems and Perspectives in
Management ,Vol. 5, No. 1, pp.103-114.
347
Barker, C., Pistrang, N. and Elliott, R. (2005) “Research Methods in Clinical
Psychology: An Introduction for Students and Practitioners”, 2nd
Ed. ,John
Wiley & Sons, Ltd, Chichester, UK.
Barker, N. (1994) “The Internet as a Reach Generation for Small Business”, Master
Thesis, Business School, and University of Durham.
Bartlett, J.E. , Kotrlik J.W., and Higgins ,C.C. (2001) “Organizational research:
determining appropriate sample size in survey research”, Information
Technology Learning and Performance Journal, Vol. 19 ,No. 1, pp. 43–50.
Bartlett, S., Burton, D. and Peim, N. (2001) “Introduction to Education Studies”,1st
Ed., London: Paul Chapman
Bazini, E., Qarri, A., and Ilia, D., (2011) “Barriers of ICT Implementation within
SMEs in service sector in Albania”, Journal of Information Technology and
Economic Development, Vol. 2,No .1 , pp. 1-8.
Beatty R. C., Shim J. P., and Jones M. C.(2001) “Factors influencing corporate web
site adoption: A time-based assessment,” Information and Management, Vol.
38, No. 6, pp. 337-354.
Beirne, E., and Curry, P. (1999) “The impact of the Internet on the information
search process and tourism decision making”, In D. Buhalis and W. Schertler
(Eds.), International Conference on Information and Communication
Technologies in Tourism . Innsbruck, Austria: Springer-Verlag, pp. 87–97.
348
Bell ,R. , Brooks ,C. , and Prokopczuk , M. (2013) “Handbook of Research Methods
and Applications in Empirical Finance”, Edward Elgar , Cheltenham.
Bennett, D. A. (2001) “How can I deal with missing data in my study? Australian and
New Zealand”, Journal of Public Health, Vol. 25, No.5, pp. 464–469.
Beri, G.C., (2007) “Marketing Research: Research Design”, 4th Ed., McGraw Hill
Education.
Boisvert,H. (2002) “ The use of Internet in SME.Its impact on business processes”, In
preceding Conference of International Conference on Electronic Commerce
Research (ICECR-5).Available online at<
http://www2.hec.ca/cicma/communications/documentations/articles/ICECR5_
3UseofInternet.pdf> [Accessed 13-12-2011]
Borker, R.D. (2013) “Economic Growth and Cultural Value Analysis In Six Emerging
Economies” ,World Journal of Social Sciences, Vol. 3, No. 6, pp. 115 –125.
Bowling ,A. (1997) “Measuring health: a review of quality of life measurement
scales”, Open University Press. Available online at <
http://link.springer.com/article/10.1023%2FA%3A1006926723202#page-1>
[Accessed 20-03-2014]
Bradley, S. P., J. A. Hausman, and R. L. Nolan, eds. (1993) “Globalization,
Technology, and Competition: The Fusion of Computers and
Telecommunications in the 1990s. Boston”, Harvard Business School Press,
Korean ed.

349
Braun,P. (2005) “Regional Tourism and the Internet in Australia”.In
s,Marshall,W.Taylor,and X.Yu(Eds), Encyclopaedia of the developing
regional communities with information and communication technology ,
pp.603-607 ,Hcrshcy,PA:Idea Group Reference
Breakwell, G.M,Hammond,S., and Fife-Schaw,C. (1995) “Research Methods in
Psychology”, 3rd
ed., London: Sage.
Bruce,W. , Stevens, R., and Loudon ,D. (2002) “Marketing Research Text and Cases”,
An Imprint of the Haworth Press.
Bryman, A. , and Cramer, D. (1997) “Quantitative Data Analysis with SPSS for
Windows”, Routledge, London.
Bryman, A., Stephen, M. and Campo, C. (1996) “The Importance of Context:
Qualitative Research and the Study of Leadership”, Leadership Quarterly, Vol.
7, No. 3,pp. 353-370.
Buff, C., Seifert, C. and Van Ness, R. (2008),“Exploring Individual Culture and
Internet Commerce Success Factors” , The International Journal for Business
& IT, Vol. 4, No. 2, pp. 17-29.
Buhalis, D. (1996) “Enhancing the competitiveness of small and medium sized
tourism enterprises at the destination level by using information technology”,
Electronic Markets, Vol. 6, No. 1, pp. 1-6.
Buhalis, D., and Jun, S. (2011) “E-Tourism”, Contemporarily Tourism Reviews.
Oxford, Good fellow. Available online at
<www.goodfellowpublishers.com/free_files/fileEtourism.pdf> [Accessed 23-
11-2011]
350
Buhalis, D. and Deimezi, O. (2003) “Information technology penetration and E-
commerce developments in Greece, with a focus on small and medium-sized
enterprises”, Electronic Markets, Vo.13, No. 4, pp.309-324.
Buhalis, D.,and Law, R. (2008) “Progress in information technology and tourism
management: 20 years on and 10 years after the Internet, The state of
eTourism research”, Tourism Management, Vol. 29,No. 4, pp. 609-623.
Carmines, E.G., and Richard A.Z (1979) “Reliability and Validity Assessment”,
Newbury Park, CA: Sage Publications.
Carter R and Bedard, F. (2001) “ E-Business for Tourism-Practical Guidelines for
Tourism Destinations and Business”, WTO Business Council, Madrid.
Casaló, L. V., Flavián, C., and Guinalíu, M. (2011) “Understanding the intention to
follow the advice obtained in an online travel community”, Computers in
Human Behavior, Vol. 27, 2, pp. 622–633.
Catalyst Corporate Finance (2013) “Leisure Travel Sector”, online available at
http://www.catalystcf.co.uk/uploads/Leisure_Travel_Report.pdf [Accessed
15/10/2014]
Chambermag (2012) “Economic Development in Jordan Story of Success and
Achievement”, Available online at <
http://chambermag.com/en/details.asp?t=05&yearmonthid=33&idno=25>
[Accessed 22/11/11].
351
Chan, P., Yuen P., and Mills, A. (2003) “E-Commerce Adoption in Small Firms: a
Study of Online Share Trading”, Managing E-Commerce and Mobile
Computing Technologies,PA: IRM Press.
Chanvarasuth, P. (2010) “Adoption of E-Business by Thai SMEs”, World Academy
of Science, Engineering and Technology , Vol. 65, pp. 741-746
Chau, P.Y.K. and Hui, K.L. (2001) “Determinants of small business EDI adoption:
an empirical investigation”, Journal of Organizational Computing and
Electronic Commerce, Vol. 11 , No. 4, pp. 229-52.
Chau, P.Y.K. and Jim, C.C.F. (2002) “Adoption of electronic data interchange in
small and medium sized enterprises”, Journal of Global Information
Management, Vol. 10 ,No. 4, pp. 61-85.
Chen, J., and McQueen, R.J. (2008) “Factors Affecting E-Commerce Stages of
Growth in Small Chinese Firms in New Zealand: An Analysis of Adoption
Motivators and Inhibitors”, Journal of Global Information Management, Vol.
16, No. 1, pp. 26-60.
Chen, L., Gillenson, M. I., and Sherre ll, D. L. (2002) “Enticing online consumers: An
extended technology acceptance perspective”, Information & Management,
Vol. 39, No. 8,pp. 705-719.
Cheung, R., and Lam, P. (2009) “How travel agency survive in e-Business world?”,
Communications of the IBIMA, Vol. 10, No. 11, pp. 85-92.
Chia, R. (2002) “The Production of Management Knowledge: Philosophical
Underpinnings of Research Design”, In Partington, D. (ed.) Essential Skills for
Management Research, 1st ed. , SAGE Publications Ltd., London, pp. 1-19.
352
Chin, W. W., Marcolin ,B. L., Newsted and P. R. (2003) “A Partial Least Squares
Latent Variable Modeling Approach for Measuring Interaction Effects:
Results from a Monte Carlo Simulation Study and an Electronic-Mail
Emotion/ Adoption Study”, Information Systems Research, Vol. 14, No. 2,
pp.189-217.
Ching, H.L. and Ellis, P. (2004), “Marketing in cyberspace: what factors drive e-
commerce adoption?”, Journal of Marketing Management, Vol. 20, Nos 3/4,
pp. 409-29.
Cho,Y., Oh, H J., Kim ,O.K., and Shim S.J. (2013) “Outlier detection and missing
data filling methods for coastal water temperature data”, Journal of Coastal
Research, Vol. 65,No. 1,pp. 1898-1903.
Cho,Y., and Agrusa, J. (2006) “Assessing Use Acceptance And Satisfaction Toword
Online Travel Agencies”, Information Technology and Tourism ,Vol. 8 ,Nos.
3/4, pp. 179-195.
Chong , S. (2006) “An Empirical Study of Factors that Influence the Extent of
Deployment of Electronic Commerce for Small- and Medium-sized
Enterprises in Australia”, Journal of Theoretical and Applied Electronic
Commerce Research . Vol. 1, No. 2 , pp. 45- 57
Chooprayoon, V., Fung, C. and Depickere, A. (2007) ‘TECTAM, a modified
technology acceptance model to assess e-commerce technologies adoption by
Thai SME’, IEEE Region 10 Conference, pp.1–4.
Chou, C. P., and Bentler, P. M. (1995) “Estimates and tests in structural equation
modeling: Concepts, issues, and applications”, Sage Publications, Thousand
Oaks.
353
Choudrie, J., and Dwivedi, Y. K. (2005) “Investigating the research approaches for
examining technology adoption issues”, Journal of Research Practice,Vol. 1,
No.1, pp.1-12.
Chuchuen, C. and Chanvarasuth, P. (2011) “The adoption factors of E-CRM in
service sector of Thai SMEs”, 2nd International Conference on Networking
and Information Technology IPCSIT, Vol. 17, pp. 350–355.
Cohen, S., and Kallirroi, G. (2006) “e-Commerce Investments from an SME
perspective: Costs, Benefits and Processe”, The Electronic Journal
Information Systems Evaluation,Vol. 9 ,No. 2,pp. 45 – 56.
Collins, C. Srikes ,M, Louvieris ,P.(2009) “Impact of culture on mobile phone
purchasing: A comparison between Thai and British consumers”, In Preceding
of 17th European Conference on Information Systems .Available online at
<http:// www.ecis2009.it/papers/ ecis2009-0515.pdf> [Accessed 15/4/2012]
Collis, J. and Hussey, R. (2003) “Business Research: a practical guide for
undergraduate and postgraduate students”, 2nd
ed., Basingstoke: Palgrave
Macmillan
Conrad, C., Serlin,R.(2011) “The SAGE Handbook for Research in Education:
Pursuing Ideas as the Keystone of Exemplary Inquiry”,2nd
ed. , SAGE
Publications.
Cooper, D. and Schindler, P. (2001) “Business Research Methods”, 7th
ed. , McGraw-
Cortina, J.M. (1993) “What is coefficient alpha? An examination of theory and
applications”, Journal of Applied Psychology, Vol.78, No.1 ,pp. 98–104.
354
Costa, G., Prior, M. and Rogerson, S. (2007) “The learning organization:
Synonymous with ethical knowledge management?”, In Murata, K. et al.
(eds), ETHICOMP WORKING CONFERENCE , Kunming: Yunan
University, CD: paper 16
Creswell, J. W. (1994) “Research designs: Qualitative and quantitative approaches”,
Thousand Oaks, CA: Sage
Creswell, J. W. (2003) “Qualitative, quantitative, and mixed methods approaches “2nd
ed., Thousand Oaks, CA: Sage.
Creswell, J. W. (2012) “Educational research: Planning, conducting, and evaluating
quantitative and qualitative research”, 4th
ed., Boston: Pearson.
Creswell, J., Shope, R., Plano, C., and Green, D. (2006) “How Interpretive Qualitative
Research Extends Mixed Methods Research”, Research In The Schools, Vol.
13, No. 1,pp. 1-11.
Dajani, D. (2012) “Determinants of electronic commerce use: the case of Jordanian
travel agencies”, International Journal of Business and Management Studies,
Vol. 1 , No.1 ,pp. 75-81.
Daniel, E., Wilson, H. and Myers, A. (2002) “Adoption of e-commerce by SMEs in
the UK: towards a stage model”, International Small Business Journal, Vol.
20, pp.253–270.
Daniel, J. (2012) “Sampling Essentials: Practical Guidelines for Making Sampling
Choices”, Sage publications.
355
Davis, D (2004) “Business research for decision making”, 6th
ed. , Wadsworth,
Belmont, CA.
Davis, F. D. (1989) “ Perceived ease of use, and user acceptance of information
technology”, MIS Quarterly, Vol. 13, No. 3, pp. 319-339.
Dedrick, J. and K.L. Kraemer (2001) “China IT Report”, Electronic Journal on
Information Systems in Developing Countries, Vol. 6, No. 2, pp. 1–10.
Denzin, N. K., and Lincoln, Y. S. (2005) “Introduction: The discipline and practice of
qualitative research”, In N. K. Denzin and Y. S. Lincoln (Eds.), The Sage
handbook of qualitative research (pp. 1-32). Thousand Oaks, CA: Sage.
Department of Statistics of Jordan (2014) Available online at <
http://www.dos.gov.jo/dos_home_e/main/> [Accessed 10-10-2014]
Descombe, M. (2003) “The Good Research Guide: for small-scale social research
projects”, 2nd edition, Open University Press, Berkshire.
Deshpande, R. (1983) “Paradigms Lost: On Theory and Method in Research
Marketing”, Journal of Marketing, Vol. 47, No. 4, pp. 101-110.
Dholakia, R. R. and Kshetri, N. (2004) “Factors impacting the adoption of the Internet
among SMEs”, Small Business Economics, Vol. 23, No.4, pp. 311-23.
Ditsa ,G.(2004) “A Research Design and a Methodological Approach to an
Explanatory User Behavior Testing: Lessons Learnt”. In Khosrow-Pour
,M.(ed.) , “Innovations Through Information Technology” , Vol. 1 , pp. 1-730
.Online available at <http://www.irma-international.org/viewtitle/32475/>
[Accessed 27-6-2012]

356
Dodge, Y., (2003) “The Oxford Dictionary of Statistical Terms”, The Oxford
University Press, Oxford.
Dong, Y., Peng, C.-Y. J. (2013) “Principled missing data methods for researchers”,
Springer Plus.
Doyle, J. K. (2005) “Face-to-face surveys”, In B.S. Everitt and D. Howell (eds), “The
Encyclopedia of Statistics in Behavioral Science”, New York: Wiley.
Available online at <http://www.wpi.edu/Images/CMS/SSPS/Doyle_-_Face-
to-Face_Surveys.pdf > [Accessed 26-7-2012]
Draper, J. (2004) “The relationship between research question and research design. In
Crookes, Patrick A. and Davies, Sue (eds) , “Research into Practice: Essential
Skills for Reading and Applying Research in Nursing and Health Care”,
Bailliere Tindall, Edinburgh.
Duncombe, R., Heeks, R.B., Kintu, R., Nakangu, B. and Abraham, S. (2005) “E-
Commerce for Small Enterprise Development: A Handbook for Entrepreneurs
in Developing Countries”, IDPM, University of Manchester, UK
[online]http://www.ecomm4dev.org/handbooks.htm (accessed 13 July 2013).
Dutta, S., and Coury, M. (2003) “ICT Challenges for the Arab World”, Available
online at <http://www.mafhoum.com/press7/218T42.pdf > [Accessed
22/11/11]
Dutta., S., El-Hage, C., Sabbagh, K., and Tarazi, P.(2003) “Challenges for
Information and Communication Technology Development in the Arab World
the Global Information Technology Report 2002-03”, Available online at
357
<http://zunia.org/uploads/media/knowledge/1.12_Challenges_for_ICT_Develo
pment.pdf> [Accessed 14/05/11].
Easterby-Smith, M., Thorpe, R., Jackson, P. and Lowe, A. (2008) “Management
Research”, 3rd
ed., London: Sage
El-Gohary, H. (2011) “Factors affecting E-Marketing adoption and implementation in
tourism firms: An empirical investigation of Egyptian small tourism
organizations”, Tourism Management , Vol.55, No.5 , pp.1256-1269
eMarketer , (2014) Worldwide Ecommerce Sales to Increase Nearly 20% in
2014”.Available online at < http://www.emarketer.com/Article/Worldwide-
Ecommerce-Sales-Increase-Nearly-20-2014/1011039 > [Acessed 12/1/2015]
eMarketer ,(2014) “US Mobile Travel Sales to Increase 60% in 2014”, online
available at <http://www.emarketer.com/Article/US-Mobile-Treavel-Sales-
Increase-60-2014/1010828> [Accessed 23/12/2014]
eMarketer, (2010) “Post-Recession Online Travel Trends”. Available online at<
Evans, G., Peacock, M. (1999) “A comparative study of ICT and tourism and
hospitality SMEs in Europe”, Information and communication technologies in
tourism, In Buhalis et al. (eds.) , “Information and Communication
Technologies in Tourism ,pp. 247-258.
Eye for Travel Research (2008) “European Online travel repot”. EyeforTravel
Research. London.
Fazlollahi, B. (2002) “Strategies for E Commerce Success”, IPM, London,
358
Federal Research Division (2006) “Country Profile: Jordan”, Library of Congress,
Available online at <http://lcweb2.loc.gov/frd/cs/profiles/Jordan.pdf>
[Accessed 9/10/2014].
Field, A. P. (2009) “Discovering statistics using SPSS”, 4th
ed., Sage, London.
Fischer,R. (2005) “Organizational Behaviour across Cultures: Theoretical and
Methodological Issues for Developing Multi-Level Framework Involving
Culture”, International Journal of Cross Cultural Management , Vol. 5, No. 1,
pp.27-48
Fishbein, M., and Ajzen, I. (1975) “Belief, attitude, intention, and behavior : An
introduction to theory and research”, Don Mills, Ontario: Addison-Wesley
Pub. Co.
Ford, D. P., Connelly, C. E., and Meister, D. B. (2003) “ Information systems
research and Hofstede’s culture's consequences: an uneasy and incomplete
partnership” , IEEE Transactions on Engineering Management, Vol. 50, No.
1,pp. 8–25.
Forman, J., Creswell, J. ,Damschroder, L., Kowalski, C., and Krein, S. (2008)
“Qualitative research methods: Key features and insights gained from use in
infection prevention research”, AJIC: American Journal of Infection Control
,Vol. 36, No. 10 , pp. 764-771 .
Fornell, C., Larcker, DF. (1981) “Evaluating structural equation models with
unobservable variables and measurement error”, Journal of Marketing
Research , Vol.18 ,No. 1, pp. 39–47.

359
Foxall, G. (1997) “Marketing psychology: The paradigm in the wings”, London:
Macmillan.
Gable, G.G. (1994) “Integrating Case Study and Survey Research Methods: An
Example in Information Systems”, European Journal of Information Systems,
Vol. 3, No. 2, pp.112-126.
Ghachem L. (2006) “Maturity of Electronic Commerce: A Review of the Principal
Models”, In Proceedings of the Global Conference on Emergent Business
Phenomena in the Digital Economy; November 28thDecember 2nd. Tampere,
Finland
Gall, M. D., Gall, J. P., and Borg, W. R. (2003) “Educational Research: An
Introduction” 7th
ed., Allyn & Bacon, Boston.
Galliers, R. D. (1992) “Choosing Information Systems Research Approaches”, In
R.D. Galliers (Ed.), Information Systems Research: Issues, Methods and
Practical Guidelines. Blackwell Scientific Publications, 144-162. ISBN:
0632028645
Gawady, Z.M., (2005) “The Impact of E-commerce on Developed and Developing
Countries Case Study: Egypt and United States”. In proceeding of
International Conference of Globalization, Technology and Sustainable
Development. Misr University for Science and Technology, Giza-Egypt.
Gay, L.R. and Diehl, P. L. (1992) “Research methods for business and management”
, New York: Macmillan.
360
Gefen, D., Karahanna, E., Straub, D.W. (2003) “Inexperience and experience with
online stores: the importance of TAM and trust”, IEEE Transactions on
Engineering Management ,Vol. 50,No. 3, pp. 307– 321.
George, D., and Mallery, P. (2003) “SPSS for Windows step by step: A simple guide
and reference 11.0 update “, 4th
ed., Boston: Allyn & Bacon.
Geyskens, I., Steenkamp, J., and Scheer, L. K. (1996) “The effects of trust and
interdependence on relationship commitment. A trans-Atlantic stud”,
International Journal of Research in Marketing, Vol. 13, No. 4, pp. 303–317.
Ghazal, M. (2012) “Travel agencies urged to expand e-presence”, The Jordan Times.
Available online at <www.jordantimes.com/travel-agencies-urged-to-expand-
e-presence> [Accessed 16/10/2014]
Ghobakhloo ,M. and Tang,S.J. (2013) “The role of owner/manager in adoption of
electronic commerce in small businesses”, Journal of Small Business and
Enterprise Development ,Vol. 20 ,No. 4,pp. 754-787
Ghobakhloo,M., Arias-Aranda,D., and Benitez-Amado,J. (2011) “Adoption of e-
commerce applications in SMEs”, Industrial Management and Data Systems,
Vol. 111 , No. 8, pp.1238-1269
Gibbs,J., Kraemer, K.L., and Dedrick, J. (2003) “Environment and policy factors
shaping global e-commerce diffusion: a cross-country comparison”, The
Information Society ,Vol. 19 ,No.1 ,pp.5–18.
Gibson, J.L., Ivancevich, J.M., and Donnely Jr, J.H. (2000) “Organisations:
Bahaviour, Structure, Process”, Boston,MA: Mcgraw-Hill.
361
Girod-Seville, M., and Perret, V. (2001) “Epistemological Foundations’, in Doing
Management Research: A comprehensive Guide”, Sage Publications, London.
Gliem JA, Gliem RR. (2003) “Calculating, interpreting, and reporting Cronbach's
alpha reliability coefficient for Likert-type Scale”, In proceeding of the
Midwest Research to Practice Conference in Adult, Continuing, and
Community Education. Available online at
<https://scholarworks.iupui.edu/bitstream/handle/1805/344/Gliem%20&%20..
?sequence=1> [Accessed 4/03/2014]
Goel, R. (2007) “E-Commerce”, New Dehli: New Age International Pvt. Ltd.
Publishers.
Gokhan ,O.,Yilmaz,E. (2011) “Comparison of the theory of reasoned action and the
theory of planned behavior: An application on accountants’ information
technology usage”, African Journal of Business Management, Vol. 5, No. 1,
pp. 50-58,
Golafshani, N. (2003) “Understanding Reliability and Validity in Qualitative
Research”, The Qualitative Report, Vol. 8, No. 4, pp. 597-607
Gong, W. (2009) “National culture and global diffusion of business-to-consumer e-
commerce. cross Cultural Management”, International Journal, Vol. 16 ,No. 1,
, pp. 83-101
Grandon, E., and Mykytyn, P.P. (2004) “Theory-based instrumentation to measure
the intention to use electronic commerce in small and medium sized
businesses”, The Journal of Computer Information Systems, Vol. 44,No. 3,pp.
44-57.

362
Grandon, E., and Pearson, J.(2004) “Electronic commerce adoption: an empirical
study of small and medium US businesses”, Information and Management
,Vol. 42,no. 1, pp. 197–216.
Grandon, E.E, Nasco, S.A,and Mykytyn, P.P (2011) “Comparing theories to explain
e-commerce adoption”, Journal of Business Research ,Vol. 64, No. 3, pp.292-
298.
Gray, D. E. (2004) “Doing research in the real world”, London: Sage.
Grazzi, M., and Vergara, S. (2012) “ICT in developing countries: Are language
barriers relevant? Evidence from Paraguay”, Information Economics and
Policy, Vol. 24, No.1, pp. 161–171
Greene, J. C. (2007) “Mixed methods in social inquiry”, San Francisco, CA: Jossey-
Bass.
Greene, J. C., Caracelli, V. J., and Graham, W. F. (1989) “Toward a conceptual
framework for mixed-method evaluation designs”, Educational Evaluation and
Policy Analysis, Vol.11, No. 3, pp. 255- 274.
Greener S.L. (2008) “Business Research Methods”, Ventus Publishing ApS,
Copenhagen.
Greenwood, Davydd J. and Morten Levin (2007) “Introduction to Action Research:
Social Research for Social Change”, 2nd
ed., Thousand Oaks, CA: Sage
Greet-Hofstede, (n.d.) “Country comparison”, Online Available from < www.geert-
hofstede.com/Jordan.html > [Accessed 10/05/2012]
363
Gupta, U. (2000) “Information Systems: Success in the 21st Century”, Upper Saddle
River, NJ: Prentice Hall.
Hair, J., Black, W., Babin, B., Anderson, R. and Tatham, R. (2010) “Multivariate
Data Analysis”, 7th
ed., Pearson Educational International -Prentice Hall,
Upper Saddle River- New Jersey.
Han, Y.F (2012) “Technology acceptance model and adoption of internet with e-
purchase system among travel agencies in Kelantan” , Undergraduate project
report, Faculty of Entrepreneurship and Business. online available at
<http://umkeprints.umk.edu.my/1748/> [Accessed 20/9/2014]
Hani,B. Corbitt,B., Pittayachawan,S.,and Alsaggaf ,W. (2012)“Organisational Culture
and Adoption of ElectronicCommerce: A Study of the Saudi Arabian Tourism
Market”, The 7th International Conference onComputer Science and
Education (ICCSE 2012). Melbourne, Australia
Hao ,X., Duo-lin, L.Zhi-jie. (2010) “A Research Model for Measuring the Level of
E-commerce in SMEs”, In proceeding of the International Conference on
Machine Vision and Human-machine Interface MVHI ,pp. 776-779
Harindranath ,G., Dyerson, R., and Barnes, D. (2008) “ICT in small firms: Factors
affecting the adoption and use of ICT in Southeast England SMEs” , In
Proceedings of the European Conference on Information Systems (ECIS),
Galway, Ireland.
Harrison, DA. Mykytyn, PP., and Riemenschneider, CK.(1997) “Executive decisions
about adoption of information technology in small businesses: theory and
empirical test”, Information Systems Research ,Vol. 8, No. 1,pp. 171–95.
364
Hasan, H., and Ditsa, G. (1999) “The impact of Culture On The Adoption of IT: An
Interpretive Study”, Journal of Global information Management, Vol. 7, No. 1,
pp.5 – 15.
Hashim, J. (2007) “Information and Commuication Technology (ICT) Adoption
among SME Owner in Malaysia”, International Journal of Business and
Information, Vol. 2, No. 2, pp.221–240
Hatcher, L. (1994) “A Step-by-Step Approach to Using the SAS® System for Factor
Analysis and Structural Equation Modeling”, Cary, NC: SAS Institute, Inc.
Heck, E., and Ribbers, P. (1999) “The adoption and impact of EDI in Dutch SMEs”,
Proceedings of 32nd Hawaii International Conference on System Sciences,
Maui, Hawaii.
Helfat, C. E. (1997) “Know-How and Asset Complementarity and Dynamic
Capability Accumulation: The Case of R&D”, Strategic Management Journal,
Vol. 18, No. 5, pp. 339-360.
Henderson,J.Dooley,F,andAkridge,J. (2000) “Adoption of Ecommerce Strategies for
Agribusiness Firms”, American Agricultural Economics Association Annual
Meeting.Available online at <
https://www.agecon.purdue.edu/cab/research/articles/ecommerce.pdf>
[Accessed 19/4/2012]
Heung ,V. (2003) “Barriers to implement E-commerce in the travel industry :a
practical perspective”, International Journal of Hospitality Management, Vol.
22,No. 1, pp.111-118
365
Hewitt, R., Sowlati, T., and Paradi, J. C. (2011) “Information technology adoption in
US and Canadian forest products industries”, Forest Products Journal, Vo.l
61,No. 2, pp. 161-169.
Hoebel, A. (1960) “Man, Culture and Society”, New York : Oxford University Press.
Hofstede, G. (1980) “Culture’s Consequences; International Differences in work
related values”, Sage, Beverly Hills.
Hofstede, G. (1984) “Culture’s consequences: International differences in work-
related values”, Sage, Newbury Park, CA.
Hofstede, G. (2001) “Culture’s Consequences: Comparing Values, Behaviors,
Institutions, and Organization Across Nations”, Sage, Beverly Hills, CA.
Howe, K.R. (2004) “A critique of experimentalism”, Qualitative Inquiry, Vol. 10,
No.1, pp. 42-61.
Hoyle, R. H. (1995) “Structural equation modeling”, Sage Publications, Thousand
Oaks, CA.
Hsu, P.F., Kraemer, K.L., and Dunkle, D. (2006) “Determinants of e-business use in
us firms”, International Journal of Electronic Commerce, Vol. 10, No. 4, pp 9-
45.
Huang, C. D., Hart, P. and Wiley, M. (2004) “Factors Characterizing IT Use in SMEs:
An Exploratory Study”, In proceedings of the Innovations Through
Information Technology, New Orleans: Idea Group Inc, pp.1229–1230
366
Humphrey, J.,Mansell,R. Pare, D. and Schmitz, H. (2004) “E-commerce for
Developing Countries: Expectations and Reality”, IDS Bulletin, Vol. 35,No.
1,pp. 31–39.
Hunaiti, Z., Masa’deh R., Mansour, M., and Al-Nawafleh, A (2009) “Electronic
commerce adoption barriers in small and medium-sized enterprises (SMEs) in
developing countries: the case of Libya”, IBIMA Business Review, Vol. 2, pp.
37-45.
Hung, Y., Yang, Y., Yang, H., and Chuang, Y. (2011) “Factors Affecting the
Adoption of E- commerce for the Tourism Industry in Taiwan”, Asia Pacific
Journal of Tourism Research, Vol. 16, No. 1, pp. 105-119
Hussain,I.Sib,S., and Wang,L.(2010) “SMEs Development in Developing Countries
through Public – Private Partnership” ,In proceeding of the Inaugural
International Conference, Available online at http://www.ceauk.org.uk/2010-
conference-papers/full-papers/Iftikhar-Hussain-CEA-final.pdf > [Accessed
24-12-2011]
Hussein, R.M.S. (2009) “The Adoption of Web Based Marketing in the Travel and
Tourism Industry: An Empirical Investigation in Egypt”, PhD. Thesis,
University of Nottingham, UK.
Hussin,H., Noor, M. (2005) “Innovating Business Through E-commerce: Exploring
the Willingness of Malaysian SMEs”, In proceeding of the Second
International Conference on Innovations in IT (IIT'05).
367
Hussin, H.,Noor,M.and Suhaimi,M.(2008) “Perceived Attributes of E-Commerce and
the Adoption Decision: The Case of Malaysian SMEs” , Jurnal Teknologi
Maklumat & Multimedia ,Vol. 5,No.1 ,pp. 107-125
Hutcheson, G., and Sofroniou, N. (1999) “The multivariate social scientist:
Introductory statistics using generalized linear models”, Sage Publications,
Thousand Oaks, CA.
Huy, L. E. Van, Rowe, F., and Truex, D. (2012) “An empirical Study of Determinants
of E-commerce Adoption in SMEs in Vietnam an economy in transition”,
Journal of Global Information Management, Vol. 20, No. 3 ,pp.1-35.
Iacovou, C.L., Benbasat, I., and Dexter, A.S. (1995) “Electronic data interchange and
small organizations: Adoption and impact of technology”, MIS Quarterly, Vol.
19, No. 4, pp. 465-485.
Idisemi, A., Ann, L., and Moreton, R. (2011) “Factors affecting the effective
Utilisation and adoption of sophisticated ICT solutions Case studies of SMES
in Lagos”, Nigeria Journal of Systems and Information Technology ,Vol. 13,
No. 2, pp. 125-143
Ifinedo,P. (2011) “Internet/e-business technologies acceptance in Canada's SMEs: an
exploratory investigation”, Internet Research, Vol. 21 ,No. 3, pp. 255-281.
Igbaria, M., Iivari, J., and Maragahh, H. (1995) “Why do individuals use computer
technology? A Finnish case study”, Information and Management, Vol. 29,pp.
227–238.
368
Indecon International Economic Consultants (2013) “Assessment of the macro-
economic impact of Internet/digital on the Irish economy”, Report submitted
to the Department of Communications, Energy and Natural Resources. Online
available at < http://www.dcenr.gov.ie/NR/rdonlyres/3382C36A-3E42-4DA1-
BFFFD6A106F90684/0/IndeconReportonAssessmentofMacroEconomicValue
ofDigitalEconomy.pdf> Accessed on [10/9/2014] .
Ivanov, G.(2011) “The History and Background of Travel Agencies”, Online
available at <http://ezinearticles.com/?The-History-and-Background-of-
Travel-Agencies&id=5175442> [Accessed 13-12-2011]
Jackson, S.(2011) “Research Methods and Statistics: A Critical Thinking Approach”
,4th ed., Wadsworth Publishing.
Jagoda, K. (2010) “The Use of Electronic Commerce by SMEs in Newfoundland,
Canada”, Entrepreneurial Practice Review, Vol. 1, No. 3, pp. 36-47
Jaidee, S. and Beaumont, N. (2003), “Factors affecting SMEs` owners/mangers in
adoption of Business-to-Business Techniques: a Research Framework”,
Online available at <http://www.buseco.monash.edu.au/mgt/research/working-
papers/2003/wp47-03.pdf > [Accessed 20/3/2012]
Janom,N., Zakaria, M.S, Habibah,N., Salleh,S.S, Aris, A.R. (2014) “
Multidimensional Business to Business E-Commerce Maturity Application:
Assessment on Its Practicality”, iBusiness, Vol. 6, pp. 71-81. Online available
at < www.scirp.org/Journal/PaperDownload.aspx?paperID=46232> [Accessed
23/5/2015]

369
JEDCO (2011) “SME Development in Jordan”, Available online at <
http://worldsmeexpo.hktdc.com/pdf/2011/SeminarRoom_C/Dec_3/1630_1800
_24/2_AAl-Ahmad.pdf> [Accessed 16/10/2014]
Jeff Hoi, Y.Y, Shim, J.P., and Andy, K.L. (2003) “Current Progress of E-Commerce
Adoption: Small and Medium Enterprises in Hong Kong”, Communication of
the ACM, Vol. 46,No. 9, pp. 226- 232.
Jeyaraj, A., Rottman, J.W. and Lacity, M.C. (2006) “A review of the predictors,
linkages, and biases in IT innovation adoption research”, Journal of
Information Technology, Vol. 21, No. 1, pp. 1-23.
Jick, T. D. (1979) “Mixing qualitative and quantitative methods: Triangulation in
action”, Administrative Science Quarterly, Vol. 24,No.1 ,pp. 602-611.
Johnson, B., and Christensen, L. (2010) “Educational Research: Quantitative,
Qualitative, and Mixed Approaches”. UK: SAGE.
Johnson, B., and Turner, L. A. (2003) “Data collection strategies in mixed methods
research”, In Tashakkori, A. and Teddlie ,C. (Eds.) Handbook of mixed
methods in social & behavioral research (pp. 297-320). Thousand Oaks, CA:
Sage Publications.
Jones, K. (2001) “E-Commerce Attitudes and Technology Involvement:
Organizational Perspectives”, Journal of Business and Entrepreneurship, Vol.
13, No. 1.pp.3-6
Jordan Embassy (2014) “Culture and Religion” Available online at <
http://jordanembassyus.org/page/culture-and-religion> [Accessed 9/10/2014]
370
Jordan investment Board (2011) “This Middle East Market Report Gives an Overview
of the Fixed-line Segment of the Telecoms Markets of the Region”, Available
online at
<http://www.jordaninvestment.com/businessandinvestment/infrastructure/tabi
d/140/language/en-us/default.aspx#515 > [Accessed 12/7/2014]
JSTA (2012) “Jordan Society of Tourism and Travel Agents”, Available online at <
jsta.org.jo> [Accessed 13/05/2012]
Kaewkitipong, L. (2010) “Disintermediation in the Tourism Industry: Theory vs.
Practice”, Business Information Processing , Vol. 58, pp. 16-171
Kamaroddin,J. ,Mei,D., and Ahmad,A. (2009) “Measuring Perception of Malaysian
SME Towords E-commerce As An Innovation” ,In proceeding of the
Conference of Science and Social Research ,CSSR 08’ 09 .
Kapurubandara, M., and Lawson, R. (2007) “SMEs in Developing Countries Face
Challenges in Adopting e-commerce Technologies”, In proceeding of 20th
Bled eConference eMergence, pp. 141–146.
Kapurubandara, M., Lawson, R. (2006) “Barriers to Adopting ICT and e-commerce
with SMEs in Developing Countries: An Exploratory study in Sri Lanka”, In
proceeding of Collabourative Electronic Commerce Technology and Research,
CollECTeR ’06(9) December, Adelaide
Kapurubandara, M., Lawson, R. (2007) “SMEs in Developing Countries Face
Challenges in Adopting e-commerce Technologies”, In proceeding of the
Inaugural IEEE International Conference on Digital Ecosystems and
Technologies, pp.141-146
371
Karahanna, E., Straub, D, and Chervany, N. L. (1999) “Information technology
adoption across time: Across-sectional comparison of pre-adoption and post
adoption beliefs” , MIS Quarterly, Vol. 23 , No. 2, pp. 183-213.
Kartiwi, M. (2006) “Case Studies of E-commerce Adoption in Indonesian SMEs: The
Evaluation of Strategic Use”, Australasian Journal of Information Systems,
Vol.14, No. 1, pp. 69-80.
Keesee, G. S., and Shepard, M.F. (2011) “Perceived attributes predict course
management system adopter status”, Online Journal of Distance Learning
Administration, Vol. 4, No.1. Available online at
<http://www.westga.edu/~distance/ojdla/spring141/keesee_shepard141.html>
[Accessed 17/7/2014]
Kendall, J., Tung, L.L., Chua, K.H., Ng, C.H.D., and Tan, S.M. (2001) “Electronic
commerce adoption by SMEs in Singapore”, In proceedings of the 34th
Hawaii International Conference on System Sciences, pp.1-10.
Keung, J., Jeffery, R., and Kitchenham, B. (2004) “The challenge of introducing a
new software cost estimation technology into a small software organization”,
In proceedings of the 2004 Australian Software Engineering Conference
(ASWEC’04), IEEE Computer Society Press, pp. 52–59.
Kew, J. and Herrington, M. (2009) “ICT and Entrepreneurship”, A research report
presented to the Small Enterprise Development Agency, UCT Graduate
School of Business, University of Cape Town . Available online at:
<http://www.gsb.uct.ac.za/files/SEDAICTReport2009.pdf> [Accessed 10
June, 2011].
372
Khalil, M., and Kenny, C., (n.d) “The Next Decade of ICT Development: Access,
Applications and the Forces of Convergence “, Washington, DC: The World
Bank Group. Online available at <
http://siteresources.worldbank.org/EXTINFORMATIONANDCOMMUNICA
TIONANDTECHNOLOGIES/Resources/NextDecadeICTGrowth.pdf >
[Accessed on 08/01/2015]
Khan ,M., Dominic, P. Khan, A., and Naseebullah, A. (2010) “Adoption of E-
commerce in Malaysia and its Affect on the Business Performance: An
Organizational Perspective”, In proceeding of International Symposium on
Information Technology, ITSim , Vol. 1, pp.1-5.
Khushman, S. ,Todman, A. ,Amin, S. (2009) “The Relationship between Culture and
E-business Acceptance in Arab Countries”, In proceeding of the Second
International Conference on Developments in eSystems Engineering , pp.454-
459
King,W., and He, J. (2006) “A meta-analysis of the technology acceptance model”,
Information & Management, Vol. 43, No. 6, pp. 740-755
Kleinbaum, D.G., Kupper, L.L. and Muller, K.E. (1988) “Applied Regression
Analysis and Other Multivariate Methods”, PWS, Boston, MA.
Kline, P. (1993) “The Handbook of Psychological Testing”, Routledge, London.
Kokash, H.A. (2012) “Jordanian Travel Agencies' Websites Assessment: Experts vs
Tourists' Perceptions”, International Journal of Marketing Studies, Vol. 4, No.
2, pp.80-92
373
Kollberg, M., and Dreyer, H. (2006) “Exploring the impact of ICT on integration in
supply chain control: a research model”, Department of Production and
Quality Engineering, Norwegian University of Science and Technology,
Norway.
Kollmann, T., Kuckertz, A., and Breugst, N. (2009) “Organizational Readiness and
the Adoption of Electronic Business - The Moderating Role of National
Culture in 29 European Countries” ,The DATA BASE for Advances in
Information Systems, Vol/ 40,No. 4,pp. 117-131.
Kothari, C.R. (2004) “Research Methodology Methods and Techniques”, Second
Edition, New Delhi: New Age International publisher.
Kotelnikov,V. (2007) “Small and Medium Enterprises and ICT”, Asia-Pacific
Development Information Programme. e-Primers for the Information
Economy, Society and Polity. ISBN: 978-974-8283-93-7
Kowtha, N. R. and T. W. I. Choon (2001) “Determinants of website development: a
study of electronic commerce in Singapore”, Information & Management,Vol.
39, No.3 , pp. 227-242.
Kraemer, K.L., Dedrick, J. and Dunkle, D. (2002) “E-Commerce in the United States:
Leader or One of the Pack? ”, Global B Commerce Survey, Report of Results
for the United States, Center for Research on Information Technology and
Organisations, University of California, Irvine.
Kramer,W.J., Jenkins, B., and Katz ,R.S. (2007) “The Role of the Information and
Communications Technology Sector in Expanding Economic Opportunity”,
374
Corporate Social Responsibility Initiative Report No.22, Cambridge, MA:
Kennedy School of Government , Harvard University.
Krejcie, R.V., and Morgan, D.W. (1970) “Determining Sample Size for Research
Activities”, Educational and Psychological Measurement , Vol 30,
No.1,pp.607-610 .Available online at <
http://opa.uprrp.edu/InvinsDocs/KrejcieandMorgan.pdf> [Accessed
12/8/2012]
Kuan, K.K.Y., and Chau, P.Y.K. (2001) “A Perception-Based Model for EDI
Adoption in Small Businesses Using a Technology-Organization-Environment
Framework”, Information & Management,Vol. 38,No. 8 , pp. 507-521.
Kuhn, T.S. (1970) “The Structure of Scientific Revolutions”, 2nd
ed. , The University
of Chicago Press.
Kurnia S, Alzougool B., Ali M and Alhashmi S. (2009) “Adoption of Electronic
Commerce Technologies by SMEs in Malaysia”, In proceedings of the 42nd
Hawaii International Conference on System Sciences (HICSS 2009), pp. 1-10,
California, United States: IEEE Computer Society.
Lancaster, G. (2005) “Research methods in management: a concise introduction to
research in management and business consultancy”, Oxford: Elsevier
Butterworth-Heinemann.
Lawrence, J., Tar, U. (2010) “Barriers to e-commerce in developing countries
Information, Society and Justice”, Vol. 3, No. 1, pp. 23-35.
Leah H., Rubin, L.H., Witkiewitz,K., Andre,J.S., and Reilly, S. (2007) “Methods for
Handling Missing Data in the Behavioral Neurosciences: Don’t Throw the
375
Baby Rat out with the Bath Water”, The Journal of Undergraduate
Neuroscience Education ,Vol. 5, No.2,pp. 71-77
Lee, C.P., and Shim, J.P. (2007) “An Exploratory Study of Radio Frequency
Identification (RFID) Adoption in the Healthcare Industry”, European Journal
of Information Systems, Vol.16, No. 6, pp. 712-724.
Lee, M.K.O. and Cheung, C.M.K. (2004) “Internet Retailing Adoption by Small-to-
Medium Sized Enterprises (SMEs): A Multiple-Case Study”, Information
Systems Frontiers ,Vol. 6,No. 4, pp. 385-397.
Lee, O.K., Wang, M., Lim, K.H. ,and Peng, Z. (2009) “Knowledge management
systems diffusion in chinese enterprises: A multistage approach using the
technology-organization-environment framework”, Journal of Global
Information Management, Vol. 17, No. 1, pp 70-84.
Lee, Y.; Kosar, K. and Larsen, K. (2003) “The technology acceptance model: past,
present and future”, Communications of the Association for Information
Systems,Vol. 12 ,No. 50, pp.752-780.
Lee, Y.-H., Hsieh, Y.-C., and Hsu, C.-N. (2011) “Adding Innovation Diffusion
Theory to the Technology Acceptance Model: Supporting Employees'
Intentions to use E-Learning Systems”, Educational Technology &
Society,Vol. 14 ,No. 4,pp. 124–137.
Lefebvrea, L., Lefebvrea, E., Elia, E. and Boeck, H. (2005) “Exploring B-to-B e-
commerce adoption trajectories in manufacturing SMEs”, Technovation, Vol.
25, No. 12, pp.1443–1456.
376
Leidner, D. and Kayworth, T. (2006) “A Review of Culture in Information Systems
Research: Toward A Theory of Information Technology Culture Conflict”,
MIS Quarterly, Vol. 30, No. 2, pp. 357-399.
Levenburg, N., Magal, S.R., and Kosalge, P. (2006) “An exploratory investigation of
organizational factors and e-business motivations among SMFOEs in the US”,
Electronic Markets, Vol. 16, No. 1, pp. 70-84.
Levy, M., Powell, P. and Worrall, L. (2005) “Strategic Intent and E-business in
SMEs: Enablers and Inhibitors” Information Resources Management Journal,
Vol. 18, No.4, pp. 1-20.
Li , Li., and Buhalis, D. (2006) “E-Commerce in China: The case of travel”,
International Journal of Information Management, Vol. 6, No. 2, pp. 153-166
Limthongchai, P., and Speece, M.W. (2003) “The effect of perceived characteristics
of innovation on e-commerce adoption by SMEs in Thailand”, In proceeding
of the Seventh International Conference on Global Business and Economic
Development, 8-11 January, pp.1573-85.
Lin, F.H. , Wu, J.H. (2004) “An empirical study of end-user computing acceptance
factors in small and medium enterprises in Taiwan: analyzed by structural
equation modeling”, Journal of Computer Information Systems,Vol. 44, No. 4,
pp. 98–108.
Lindner, J. R., Murphy, T. H., and Briers, G. E. (2001) “Handling Nonresponse In
Social Science Research. Journal of Agricultural Education, Vol. 42, No. 4,
pp. 43–53.
377
Ling, C.Y (2001) “Model of factor influences on electronic commerce adoption and
diffusion in small and medium sized enterprises” ECIS Doctoral Consortium,
24-26 June, AIS Region 2 (Europe, Africa, Middle-East).
Lippert, S. K., and Govindarajulu,C. (2006) “Technological , Organizational , and
Environmental Antecedents to Web Services Adoption”, Communications of
the IIMA, Vol. 6,No. 1 ,pp. 146-158
Little, R. J. A. (1988) “A test of missing completely at random for multivariate data
with missing values”, Journal of the American Statistical Association, Vol.
83,No.404 , pp. 1198- 1202.
Liu, S. (2005) “ A Theoretic Discussion of Tourism E-commerce”, In proceeding of
the 17th
conference on electronic commerce .
Livi ,E,(2008) “Information Technology and New Business Models in the Tourism
Industry”, In proceeding of the 8th Global Conference on Business &
Economics ,October 18-19th
,pp. 1-13.
Locke,S.(2004) “ICT adoption and SME growth in New Zealand” ,Vol 4, Nos. 1/2,
pp. 93–102.
Lockett, A. and Littler, D. (1997), “The adoption of direct banking services”, Journal
of Marketing Management, Vol. 13, pp. 791-811.
Looi, H. C. (2005) “E-commerce adoption in Brunei Darussalam: A quantitative
analysis of factors influencing its adoption”, Communication of the
Association for Information Systems, Vol. 15, pp. 61-81.

378
Lopez-Nicolas,C., Molina-Castillo,F., and Bouwman,H.(2008) “An assessment of
advanced mobile services acceptance: Contributions from TAM and diffusion
theory models” , Information & Management, Vol. 45, No. 6, pp. 359-364
Lundgren, H., and Walczuch, R. (2003) “Moderated trust: The impact of power
distance and uncertainty avoidance on the consumer trust formation process in
e-retailing”, In proceedings of the tenth research symposium on Emerging
electronic markets,pp. 31-52.
Luo, M., and Remus,W. (2006) “Technology Acceptance of A Travel Website: An
Exploratory Study”, In proceedings of the 11th Annual Conference of Asia
Pacific Decision Sciences Institute Hong Kong, June 14-18, pp. 118-125.
Lutz, R. J. (1981) “A functional theory framework for designing and pretesting
advertising themes”, In R. J. Lutz (ed.), “Contemporary Perspectives in
Consumer Research”,Boston: Kent Publishing Company.
Ma, X., Buhalis, D., and Song, H. (2003) “ICTs and Internet adoption in China’s
tourism industry”, International Journal of Information Management, Vol.
23, No. 6, pp. 451–467.
Macgregor, R. (2008) “The Role of Gender in the Perception of barriers to E-
commerce Adoption in SMEs : An Australian Study”, Communications of the
IBIMA, Vol. 4, pp. 141-147
MacGregor, R., and Varazalic, L. (2005) “A basic model of electronic commerce
adoption barriers, a study of regional small businesses in Sweden and
Australia”, Journal of Small Business and Enterprise Development, Vol.12,
No. 4, pp.510-527
379
Malhotra, N.K., and Birks , D.F. (2000) “Marketing Research: An Applied Approach,
European Edition”, Harlow: Pearson Education Ltd.
Malhotra, N.K. (2010) “Marketing research: an applied orientation”, 6th
ed., Global
edition, Boston: Pearson.
Manyika, J., Roxburgh, C. (2011) “The great transformer: The impact of the Internet
on economic growth and prosperity”, McKinsey Global Institute, Available
online at
<http://www.mckinsey.com/insights/high_tech_telecoms_internet/the_great_tr
ansformer > [Accessed 10/2/2012]
Martin, L. (2005) “Internet adoption and use in small firms: Internal processes,
organizational culture and the roles of the owner-manager and key staff”, New
Technology, Work, and Employment, Vol. 13, No. 2, pp. 147- 159.
Martins, M. and Oliveira, T. (2009) “Determinants of e-commerce adoption by small
firms in Portugal”, In proceedings of the 3rd european conference on
information management and evaluation. Gothenburg, Sweden, September,
pp. 328-338.
Masoud, E. Y. (2013) “The Effect of Perceived Risk on Online Shopping in Jordan”,
European Journal of Business and Management, Vol.5, No.6,pp.76-87.
Masrek, M.N, Abdul Karim, N.S, and Hussein, R. (2008) “The effect of
organizational and individual characteristics on corporate intranet
utilizations”, Information Management & Computer Security, Vol. 16, No. 2
pp. 89-112
380
McCarty, C. (2003) “Differences in Response Rates Using Most Recent versus Final
Dispositions in Telephone Surveys”, Public Opinion Quarterly, Vol. 67, No.
3,pp. 396–406.
McFarlane, D., Chembezi, D., and Befecadu, J. (2003) “Internet adoption and use
of e-commerce strategies by agribusiness firms in Alabama”, The
Southern Agricultural Economics Association Annual Meeting, Mobile,
Alabama. Online available at <
http://www.webspace.aamu.edu/smallfarmers/AGB200308.pdf> [Accessed
19/5/2015]
Mcilhone, M. (2012) “Amadeus Jordan’s e-Commerce”, Workshop Focuses on
eTrends in MENA, African Brains, Available online at <
http://africanbrains.net/2012/09/28/amadeus-jordans-e-commerce-workshop-
focuses-on-etrends-in-mena/#sthash.yPQp7VmL.dpuf> [Accessed
16/10/2014]
McKechnie, S., Winklhofer, H., and Ennew, C. (2006) “Applying the technology
acceptance model to the online retailing of financial service”, International
Journal of Retail & Distribution Management , Vol. 34, No. 4/5,pp. 388-410.
Md Nor, K., and Pearson, J. M. (2007), “The Influence of Trust on Internet Banking
Acceptance,” Journal of Internet Banking and Commerce, Vol. 12, No. 2,pp.
1-10.
Mehrtens, J., Cragg ,P.B., and Mills, A. M. (2001) “A Model of Internet Adoption by
SMEs”, Information & Management, Vol. 39,No. 3, pp. 165-176.
381
Meredith, O.O. (1994) “Small Business Management in Australia”, 4th ed., Sydney:
McGraw-Hill.
Meyers, L.S., Gamst, G., and Guarino, A.J. (2013b) “Applied multivariate research:
Design and Interpretation”, 2nd
ed., Thousand Oaks, CA: Sage.
Migiro, S.O. (2006) “Diffusion of ICTs and E-commerce adoption in manufacturing
SMEs in Kenya”, South African Journal of Library & Information Science,
Vol. 72, No. 1, pp. 35-44.
Mingers, J. (2001) “Combining IS research methods: Towards a pluralist
methodology”, Information Systems Research, Vol. 12,No. 3,pp. 240-259.
Ministry of Information and Communications Technology (2007) “National e-
commerce Strategy : Policies and Strategies Directorate” , Available online
at< http://www.moict.gov.jo/portals/0/final1.pdf > [Accessed 10/10/2014]
Mirchandani, D.A., and Motwani, J. (2001) “Understanding small business electronic
commerce adoption: an empirical analysis”, Journal of Computer Information
Systems, Vol. 41 No. 3, pp. 70-3.
Mishra, S.(2014) “Adoption of M-commerce in India: Applying Theory of Planned
Behaviour Model”, Journal of Internet Banking and Commerce, Vol. 19, No.
1, pp.1-17
Mndzebele, N. (2013) “The Effects of Relative Advantage, Compatibility and
Complexity in the Adoption of EC in the Hotel Industry”, International
Journal of Computer and Communication Engineering, Vol. 2, No.4, pp. 473–
476.
382
Molla, A. and Licker, P. (2004) “Maturation Stage of eCommerce in Developing
Countries: A Survey of South African Companies”, Information Technologies
and International Development, Vol. 2, No. 1, pp. 89-98.
Molla, A. and Licker, P.S. (2005a), “eCommerce adoption in developing countries: a
model and instrument”, Information & Management, Vol. 42 No. 6, pp. 877-
99.
Molla, A. and Licker, P.S. (2005b), “Perceived e-readiness factors in e-commerce
adoption: an empirical investigation in a developing country”, International
Journal of Electronic Commerce, Vol. 10, No. 1, pp. 83-110.
Moraisa.E.P., Piresa,J.A., Gonçalvesb,R.M. (2012) “E-Business Maturity: Constraints
Associated With Their Evolution”, Journal of Organizational Computing and
Electronic Commerce, Vol. 22, No. 3,pp. 280-300
Morgan, D. L. (2007) “Paradigms lost and pragmatism regained: Methodological
implications of combining qualitative and quantitative methods”, Journal of
Mixed Methods Research, Vol. 1, No. 1, pp. 48-76.
Morgan, G. A., Leech, N. L., Gloeckner, G. W., and Barrett, K.C. (2013) “IBM SPSS
for introductory statistics: Use and interpretation”, 5th
ed., New York, NY:
Routledge/Taylor and Francis
Moss, S., Prosser, H., Costello, H., et al. (1998) “Reliability and validity of the PAS–
ADD Checklist for detecting psychiatric disorders in adults with intellectual
disability”, Journal of Intellectual Disability Research, Vol. 42, No.2, pp. 173–
183
383
Mpofu, K.C., Milne, D., and Watkin-Mathys, L. (2009) “ICT and Development of E-
business among SMEs in South Africa”, ISBE 2009 Conference, Liverpool,
UK.
Muijs, D. (2004) “Doing quantitative research in education with SPSS”, London:
Sage
Mumtaz ,AB. , Stev,C. (2012) “Assessing the Influence of Environmental and CEO
Characteristics for Adoption of Information Technology in Organizations”
,Journal of Technology Management & Innovation, Vol. 7, No. 1, pp. 64-84.
Munir,AR., Idrus M.S., and Kadir R.A. (2013) “Acceptance of Mobile Banking
Services in Makassar: A Technology Acceptance Model (TAM) Approach”,
Journal of Business and Management (IOSR-JBM) ,Vol. 7, No.6 ,pp. 52-59
Musawa,M., and Wahab, E. 2012 “The adoption of electronic data interchange (EDI)
technology by Nigerian SMEs: A conceptual framework” , Journal of Business
Management and Economics ,Vol. 3, No. 2, pp. 55-68.
Myers, M.D., and Avison, D.E. (2002) “Qualitative Research in Information Systems:
A Reader”, Sage Publications, London.
Nakata, C., and Sivakumar, K. (2001) “Instituting the Marketing Concept in a
Multinational Setting: The Role of National Culture”, Journal of the Academy
of Marketing Science, Vol. 29, No. 3, pp. 255-275.
Narayan, P., Prasad, B., Ram, Y., and Narayan, J. (2005) “An Analysis of the
Relationship between ICT and Fiji’s Tourism Industry”, Available online at<
www.gdn-oceania.org/Portals/83/Downloads/Paresh_final.pdf> [Accessed
22/11/11]
384
Nasco S.A., Grandón E.E., and Mykytyn P.P. (2008) “Predicting electronic commerce
adoption in Chilean SMEs” Journal of Business Research , Vol. 61, No. 6,
pp.697–705
Nelson, M., Michael S. and Troy, S. (2010) “Sustainable e-Business Management”, In
proceeding of the 16th Americas Conference on Information Systems
(AMCIS), pp.160-171
Nemat, R. (2011) “Taking a look at different types of e-commerce”, World Applied
Programming, Vol. 1, No. 2, pp. 100-104.
Neuman,W., (2003) “Social Research Methods: Qualitative and Quantitative
Approahes”, Boston: Pearson Education Inc.
Nunnally, J.C. (1978) “Psychometric Theory”, New York : McGraw-Hill.
OECD (2002) “OECD small and medium size enterprise outlook”, Available online at
<http://www.oecd.org/document/39/0,3746,en_2649_34197_2483303_1_1_1_
1,00.html> [Accessed 12/12/2011]
OECD (2004) “Promoting Entrepreneurship and innovative SMEs in a Global
Economy: Towards a More Responsive and Inclusive Globalisation”, In
proceeding of the 2nd
OECD Conference of Ministers Responsible for Small
and Medium-Sized Enterprises (SMEs) Istanbul, Turkey 3-5 June.
OECD (2013) “OECD Investment Policy Reviews: Jordan 2013 “, Available online
at< http://www.oecd.org/daf/inv/investment-policy/IPR-Jordan_2013-
ExecSum.pdf> [Accessed 12/11/2014]

385
OECD (2009) “Top Barriers and Drivers t o SME Internationalization”, Report by
the OECD Working Party on SMEs and Entrepreneurship. Available online at
< http://www.oecd.org/dataoecd/16/26/43357832.pdf > [Accessed
10/10/2014]
Olatokun, W. M., and Igbinedion, L.J. (2009) “The Adoption of Automatic Teller
Machines in Nigeria : An Application of the Theory of Diffusion of
Innovation”, Informing Science and Information Technology, Vol. 6, pp. 275-
393.
Olatokun, W., and Kebonye, M. (2010) “e-Commerce Technology Adoption by
SMEs in Botswana e-Commerce Technology Adoption by SMEs in Botswana
Introduction”, International Journal of Emerging Technologies and Society
,Vol. 8, No. 1,pp. 42–56.
Oliveira, T., and Martins, M.F. (2010a) “Firms patterns of e-business adoption:
Evidence for the European union- 27” , The Electronic Journal Information
Systems Evaluation Volume, Vol. 13, No. 1, pp 47-56.
Oliveira, T., and Martins, M.F. (2010b) “Understanding E-Business Adoption across
Industries in European Countries”, Industrial Management & Data Systems,
Vol. 110 No. 9, pp. 1337-54.
Oliveira, T., and Martins, M. (2011) “Literature Review of Information Technology
Adoption Models at Firm Level”, Information Systems Journal ,Vol. 14, No.
1, pp. 110- 121.

386
Oluyinka, S., Shamsuddin, A., Wahab, E., Akintunde, M. and Imoudu, W. (2013) “A
study ofelectronic commerce adoption factors in Nigeria”, International
Journal of Information Systems and Change Management, Vol. 6, No. 14,
pp.293–314.
Onwuegbuzie, A. J., and Collins, K. M. T. (2007) “A typology of mixed methods
sampling designs in social science research. The Qualitative Report ,Vol. 12,
No, pp. 281-316
Pallant, J. (2007) “SPSS Survival Manual, A Step by Step Guide to Data Analysis
using SPSS for Windows (Version 12)” , 3rd
ed., McGrew-Hill, Berkshire.
Pan, M.J., and Jang, W.Y. (2008) “Determinants of the adoption of enterprise
resource planning within the technology-organization-environment
framework: Taiwan's communications”, Journal of Computer Information
Systems, Vol. 48, No. 3, pp. 94-102.
Park, S. Y. (2009) “An Analysis of the Technology Acceptance Model in
Understanding University Students' Behavioral Intention to Use e-Learning”,
Educational Technology & Society, Vol. 12, No. 3,pp. 150–162.
Parsian, N., and Dunning, T. (2009) “Developing and validating a questionnaire to
measure spirituality: A psychometric process”, Global journal of health
science, Vol. 1, No. 1, pp. 2-11
Patricia ,D. (2008) “The Internet , Threat or Tool for Travel Agencies” , Available
online at < http://steconomice.uoradea.ro/anale/volume/2008/v2-economy-
and-business-administration/017.pdf [Accessed 10-12-2011]
387
Paul, D. (2005) “Survey research. Emerging issues. New directions for institutional
research”, San Francisco: Jossey-Bass.
Paul R, K., Bhar , L.M. (2006) “Multicollinearity: Causes, Effects And Remedies”
,Available online at <http://www.iasri.res.in/seminar/AS-
299/ebooks%5C2005-2006%5CMsc%5Ctrim2%5C3.%20Multicollinearity-
%20Causes,Effects%20and%20Remedies-Ranjit.pdf> [Accsessed on
10/03/2014]
Pavlou, P. (2003) “Consumer acceptance of electronic commerce: integrating trust
and risk with the technology acceptance model”, International Journal of
Electronic Commerce Vol. 7,No. 3, pp. 101–134.
Pavlou, P., and El Sawy, O.A. (2006) “From IT leveraging competence to competitive
advantage in turbulent environments: the case of new product development”,
Information Systems Research, Vol. 17, No. 3, pp. 198-227.
Peppard, J. (1993) “IT strategy for business”, Pitman, London.
Perez, M. P., Sanchez, A. M., Carnicer, P. L., and Jimenez (2004) “A Technology
Acceptance Model of Innovation Adoption: The Case of Teleworking”,
Journal of Innovation Management, Vol. 7, No. 4, pp. 280-91.
Pham, L., Pham, LN., and Nguyen, D. (2011) “Determinants Of E-commerce
Adoption in Vietnamese Small and Medium Sized Enterprises”, International
journal of entrepreneurship, Vol. 15 , pp. 45-72 , Available online at <
http://www.alliedacademies.org/Publications/Papers/IJE%20VOL%2015%202
011%20p%2045-72.pdf> [Accessed 20/9/2014]
388
Plana, C., Cerpa, N., and Bro ,P.B. (2004) “eCommerce Adoption Methodology for
Chilean SME's”, In proceeding of Collaborative Electronic Commerce
Technology and Research. Available online at <
https://www.researchgate.net/publication/233754770_eCommerce_Adoption_
Methodology_for_Chilean_SME%27s> [Accessed 15/7/2014]
Pohar, M., Blas, M., and Turk, S. (2004) “Comparison of Logistic Regression and
Linear Discriminant Analysis”, A Simulation Study. Metodološki zvezki ,
Vol.1, No.1, pp. 143–161.
Polit, D., Beck, C. (2006) “Essentials of Nursing Research: Methods, Appraisal and
Utilization”, 6th
ed., Lippincott Williams and Wilkins, Philadelphia
Polonsky, M., and Waller, D.S. (2005) “Designing and managing a research project: a
business student's guide”, Sage Publications, Thousand Oaks, Calif.
Poon, A. (1993) “Tourism, Technology and Competitive Strategies”, Wallingford:
CAB International. Oxford.
Poorangi, M.M., Edward, W.S.K., Shohreh, N. and Arash, K. (2013) “E-commerce
adoption in Malaysian small and medium enterprises practitioner firms: a
revisit on Rogers’ model” , Anais da Academia Brasileira de Ciências , Vol.
85, No. 4, pp.1593–1604.
Porter, M.E., and Millar, V.E. (1985) “How Information Gives You Competitive
Advantage”, Harvard Business Review, Vol. 63,pp. 149-160.
Premkumar, G., and Roberts, M. (1999) “Adoption of New Information Technologies
in Rural Small Businesses. Omega”, The International Journal of Management
Science, Vol. 27, No. 4, pp. 467-484.
389
PriceWaterhouseCoopers. (1999) “SME electronic commerce study” ,In proceedings
of the Asia Pacific Economic Cooperation (APEC) Telecommunications
Working Group.
Purwati, Y. (2011) “Standard Features of E-Commerce User Interface for the Web”,
Journal of Arts, Science & Commerce, Vol. 2, No. 3, pp. 77-87
Qiang, C.Z.-W., Rossotto, C.M., and Kimura, K. (2009) “Economic Impacts of
Broadband”, In Information and Communications for Development 2009:
Extending Reach and Increasing Impact, World Bank, Online available at <
http://siteresources.worldbank.org/EXTIC4D/Resources/IC4D_Broadband_35
_50.pdf > [Accessed 3/1/2015]
Ramdani, B., Kawalek, P., and Lorenzo, O. (2009) “Knowledge management and
enterprise systems adoption by SMEs: Predicting SMEs’ adoption of
enterprise systems”, Journal of Enterprise Information Management, Vol. 22,
Nos. 1/2, pp. 10-24.
Ramsey, E. and McCole, P. (2005) “E-business in professional SMEs: the case of
New Zealand”, Journal of Small Business and Enterprise Development, Vol.
12, No. 4, pp.528–544.
Rao, S., Metts, G., and Monge, C. (2003) “Electronic commerce development in
small and medium sized enterprises: A stage model and its implications”,
Business Process Management Journal, Vol. 9, No. 1, pp. 11-32.
Rattray, J., and Jones, M. C. (2007) “Essential elements of questionnaire design and
development” , Journal of Clinical Nursing, Vol. 16, No. 2,pp. 234–43.
390
Raymond, L. (2001) “Determinants of Web site implementation in small businesses”,
Internet Research: Electronic Networking Applications and Policy, Vol. 11,
No.5, pp.411-22.
Rayport, J. and Jaworski, B. (2002) “Introduction to E-Commerce”, 2nd
ed.,
Irwin/McGraw-Hill, Boston, MA.
Riemenschneider, C. K., Harrison, D. A., and Mykytn, P. P. (2003) “Understanding
IT adoption decisions in small business: Integrating current theories”,
Information & Management, Vol. 40,No. 4,pp. 269-285.
Riemenschneider, C.K., and McKinney, V.R. (2001) “Assessing Belief Differences
in Small Business Adopters and Non-Adopters of Web-Based E-Commerce”,
The Journal of Computer Information Systems ,Vol. 42 ,No. 2, pp. 101-107.
Riemenschneider, C.K., and McKinney, V.R. (1999) “Assessing the adoption of
web-based e-commerce for businesses: a research proposal and preliminary
findings”, Electronic Markets, Vol. 9, Nos. 1/2, pp. 9-13.
Robert C., MacGregor, R.C., and Kartiwi, M. (2010) “Perception of Barriers to E-
Commerce Adoption in SMEs in a Developed and Developing Country: A
Comparison Between Australia and Indonesia”, Journal of Electronic
Commerce in Organizations ,Vol.8, No. 1 , pp. 61-82
Rode, N. (2005) “Translation of Measurement Instruments and their Reliability: An
Example of Job-Related Affective Well-Being Scale “ Metodološki zvezki ,
Vol. 2, No. 1, pp.15-26
Rogers, E.M. (1983) “Diffusion of innovations”, 3rd
ed., New York: Free Press
391
Rogers, E.M. (2003) “Diffusion of innovations”, 5th
ed. New York: Free Press
Rogers, E.M., Medina, U.E., Rivera, M.A., and Wiley, C.J. (2005) “Complex adaptive
systems and the diffusion of innovations”, The Innovation Journal: The Public
Sector Innovation Journal, Vol. 10, No. 3, Article 30.
Royal , K.(2011) “Understanding Reliability in Higher Education Student Learning
Outcomes Assessment”, Quality Approach in Higher Education , Vol. 2, No.
2 , pp. 1-16 .
Sabherwal, R., Jeyaraj, A., and Chowa, C. (2006) “Information System Success:
Individual and Organizational Determinants”, Management Science, Vol. 52,
No.12, pp.1849-1864.
Salwani, M.I., Marthandan, G., Norzaidi, M.D., and Choy, S. (2009) “E-commerce
usage and business performance in the Malaysian tourism sector: empirical
analysis”, Information Management & Computer Security, Vol. 17 , No.2 ,pp.
166 – 185.
Sandy, C. and Graham, P. (2007) “Factors influencing the extent of deployment of e-
commerce for small and medium sized enterprises”, Journal of Electronic
Commerce in Organizations, Vol. 5,No. 1,pp. 1-29.
Sanzogni, L. (2010) “Factors Influencing the Adoption and Usage of Online Services
in Saudi Arabia”, The Electronic Journal on Information Systems in
Developing Countries, Vol. 40, No.1, pp. 1–32.
Saprikis, V., and Vlachopoulou, M. (2012) “Determinants of suppliers' level of use of
B2B emarketplaces”, Industrial Management & Data Systems, Vol. 112, No.
4, pp.619 – 643

392
Sarkar, A. (2008) “E-commerce adoption and Implementation in SMEs: an analysis of
factors”, In proceeding of the 21s t Annual Conference of the National
Advisory Committee on Computing Qualifications, pp. 309-319.
Sarosa, S., and Zowghi, D. (2003) “Strategy for Adopting Information Technology
for SMEs:Experience in Adopting Email within an Indonesian Furniture
Company”, Electronic Journal of Information Systems Evaluation, Vol. 6, No.
2, pp. 165-176.
Sarosa, S. and Underwood, J. (2005) “Factors affecting IT adoption within Indonesian
SMEs: manager's perspectives”, In Proceedings of the 9th Pacific Asia
Conference on Information Systems, 7-10 July, Bangkok, Thailand.
Satti, O., and Nour, M. (2002) “ICT Opportunities and Challenges for Development in
the Arab World”, World Institute for Development Economics Research
Discussion Paper 2002/83 United Nations University , Available online at <
https://www.academia.edu/4395099/ICT_Opportunities_and_Challenges_for_
Development_in_the_Arab_World > [Accessed 25/5/2012]
Saunders, C. and Hart, P. (1993) “Electronic Data Interchange Across Organizational
Boundaries: Building a Theory of Motivation and Implementation” , In
proceeding of 21st the Annual Conference of Administrative Sciences
Association of Canada , Lake Louise, Alberta, Canada.
Saunders, M., Lewis, P., and Thornhill, A. (2012) “Research methods for business
students”, 6th
ed., Harlow, Pearson Education

393
Schensul ,S.L., Schensul J.J., and LeCompte, M.D. (1999) “Essential ethnographic
methods: observations, interviews, and questionnaires”. Walnut Creek, CA:
Altamira Press; 1999.
Schlomer, G. L., Bauman, S., and Card, N. a. (2010) “Best practices for missing data
management in counseling psychology”, Journal of counseling psychology,
Vol. 57, No. 1, pp. 1–10.
Scupola , A. (2009) “SMEs’ e-commerce adoption:perspective from Denmark and
Australia”, Journal of Enterprise Information Management ,Vol 22. Nos ½.
pp. 152-166.
Scupola, A. (2003) “The adoption of internet commerce by SMEs in the South of
Italy: an environmental, technological and organizational perspective”,
Journal of Global Information Technology Management, Vol. 6 ,No. 1, pp. 51-
71.
Seidman, I. (2006) “Interviewing As Qualitative Research: A Guide for Researchers
in Education and the Social Sciences”, 3rd
ed., New York: Teachers College
Press.
Sekaran, U. (2003) “Research Methods for Business: A Skill Building Approach”,
USA: John Wiley and Sons.
Senarathna, R.P.I.R., and Wickramasuriya, H.V.A. (2011) “Organizational factors
affecting e-commerce adoption in small and medium-sized enterprises”,
Tropical Agricultural Research, Vol. 22, No. 2, pp.204–210.
394
Seni, D.A, and Hodges, W. (1996) “Common grounds and relationships between
information technology and philosophy”, Association for information
sciences, America’s conference, Vol. 2, pp. 398–400.
Seyal, A.H. and Rahman, M.N.A. (2003) “A preliminary investigation of e-commerce
adoption in SMEs in Brunei”, Journal of Global Information Technology
Management, Vol. 6, No. 6,pp. 6-26.
Seyal, A.H., Awais, M.M., Shamail, S., and Abbas, A. (2004) “Determinants of
Electronic Commerce in Pakistan: Preliminary Evidence from Small and
Medium Enterprises”, electronic markets , Vol. 14 ,No.4.pp. 372–387
Shackleton, V.J., and Ali, A.H. (1990) “Work-related values of managers: A test of
the Hofstede model”, Journal of Cross Cultural Psychology, Vol. 21, No. 1,
pp. 109-118.
Shaharudin, M. R., Omar, M. W., Elias, S. J., Ismail, M., Ali, S. M., and Fadzil, M. I.
(2012) “Determinants of electronic commerce adoption in Malaysian SMEs’
furniture industry”, African Journal of Business Management ,Vol. 6, No.10,
pp. 3648–3661.
Shanker, D. (2008) “ICT and Tourism: Challenges and Opportunities”, In preceding
of conference on Tourism in India-Challenges Ahead, pp. 15-17.
Shannak,O.R, Al-Debei,O.O. (2012) “The Current State of E-Commerce In Jordan:
Applicability And Future Prospects”, In proceedings of the 5th IBIMA
Conference on The Internet & Information Technology in Modern
Organizations, pp. 457-489.
395
Sharma, G. (2008) “Veterinary extension education”, Hyderabad [India] : BS
Publications.
Shdeifat, O. Mohsen, M. Mustafa, , M. al-Ali, , Y. and al-Mhaisen, B (2006)
“Development of Methods and Tools for the Establishment of Good
Environmental Performance in The Tourist Accommodation Sector in Jordan
– Implementation of pilot studies”, 1st Issue.
Shih, T., and Fan, X. (2007) “Response Rates and Mode Preferences in Web-Mail
Mixed-Mode Surveys: A Meta-Analysis”, International Journal of Internet
Science, Vol. 2, No. 1, pp. 59-82
Simpson, M., and Docherty, A. J. (2004) “E-commerce adoption support and advice
for UK SMEs Determine the barriers facing SMEs adopting”, Journal of Small
Business and Enterprise Development, Vol. 11, No. 3, pp. 315-328.
Smircich, L. (1983) “Concepts of culture and organisational analysis”, Administrative
Science Quarterly, Vol. 28, No. 3, pp. 339–58.
Smith, K. W. (1974) “On estimating the reliability of composite indexes through
factor analysis”, Sociological Methods & Research, Vol.2,No.4, pp. 485–510.
Sparling, L., Toleman, M., and Cater-steel, A. (2007) “SME Adoption of e-
Commerce in the Central Okanagan Region of Canada Review of e-
Commerce Adoption Literature”, In proceeding of the 18th Australasian
Conference on Information Systems, pp. 1046–1059.
Sparling, L., Cater-Steel, A., and Toleman, M. (2010) “Adoption of e-commerce by
Canadian SMEs: defining organizational, environmental and innovation
characteristics”, In Encyclopedia of e-business development and management
396
in the global economy”. Business Science Reference (IGI Global), Hershey,
PA, United States, pp. 305-315.
Squires, JE. , Estabrooks, CA. , Newburn-Cook, CV. , and Gierl, M. (2011)
“Validation of the Conceptual Research Utilization Scale: An application of
the Standards for Educational and Psychological Testing in Healthcare”, BMC
Health Services Research, Vol. 11,pp.107. Available online at<
http://www.biomedcentral.com/1472-6963/11/107> [Accessed 9/7/2014]
Standing, C., Vasudavan, T. ,and Borbely, S. (1998) “ Re-engineering travel
agencies with the World Wide Web”, Electronic Markets, Vol. 8, No. 4, pp.
40-43.
Stephen, J., Ezell, S.J., and Atkinson, R.D. (2014) “How ITA Expansion Benefits the
Chinese and Global Economies”, The Information Technology & Innovation
Foundation, online available at http://www2.itif.org/2014-ita-expansion-
benefits-chinese-global-economies.pdf Acessed on 5/1/2015]
Straub, D., Loch, K.D, and Hill, C.E. (2001) “Transfer of information technology to
the Arab World: A test of cultural influence modeling”, Journal of Global
Information Management. Vol.9, No. 4, pp. 1-60.
Straub, D., Keila, M., and Brenner, W. (1997) “Testing the technology acceptance
model across cultures: A three country study”, Information and Management,
Vol.33, No. 1, pp. 29-38.
397
Sultan, F., and Chan, L. (2000) “The adoption of new technology: the case of object-
oriented computing in software companies”, IEEE transactions on Engineering
Management, Vol. 47 ,No. 1, pp.106-126.
Sutanonpaiboon, J., and Pearson, A.M. (2008) “E-commerce adoption: perceptions of
managers/owners of small- and medium sized enterprises (SMEs) in Thailand
e-commerce adoption: perceptions of managers/owners of small- and medium-
sized enterprises (SMEs) in Thailand”, Journal of Internet Commerce, Vol. 5,
No. 3, pp.53–82.
Sweet, P. (2001) “Designing interactive value development” , PhD. Thesis, Lund
University, Lund Business Press , Sweden
Szajna, B. (1994) “Software evaluation and choice: predictive evaluation of the Technology
Acceptance Instrument”, MIS Quarterly, Vol. 18, No. 3,pp. 319–324,
Tabachnick, B. G., and Fidell, L. S. (2013) “Using multivariate statistics”, 6th
ed.,
Boston: Allyn and Bacon
Tagini, P. (2000) “E-Commerce in Vanuatu: Can Contract Law Accommodate for
New Technology?”, Journal of South Pacific Law (JSPL), Vol. 4. Online
available at < http://www.usp.ac.fj/index.php?id=13203 > [Accessed 10-1-
2015]
Tan, J., Tyler, K., and Manica, A. (2007) “Business-to-business adoption of
eCommerce in China”, Information & Management,Vol. 44,No. 3,pp. 332-
351.

398
Tan, K.S., Chong, S., Lin, B., Eze, U.C. (2009) “Internet-based ICT adoption:
evidence from Malaysian SMEs”, Industrial Management & Data Systems,
Vol. 109, No. 2, pp. 224 – 244.
Tan, M., and Teo, T.S.H. (2000) “Factors influencing the adoption of internet
banking”, Journal of the Association for Information Systems, Vol. 1, No.
5,pp. 1-42.
Tan, C.F. (2010) “A Perception-based Model for Technological Innovation in Small
and Medium Enterprises”, In proceeding of 18th
European Conference on
Information Systems, pp. 1-13.
Tan, K., and Eze, U. (2008) “An Empirical Study of Internet-Based ICT Adoption
Among Malaysian SMEs” , Communications of IBIMA, Vol.1 , No. 1, pp. 1-
12.
Tang, J.E., and Chiang ,C. (2009) “Towards an understanding of the behavioral
intention to use mobile knowledge management”, Information Science and
Applications , Vol. 6, No. 9, pp. 1601–1613.
Tavakol, M., and Dennick, R. (2011) “Making sense of Cronbach’s alpha”,
International Journal of Medical Education, Vol. 2, pp. 53-55.
Taylor, S. and Todd, P.A. (1995) “Assessing IT Usage: the Role of Prior
Experience”, MIS Quarterly, Vol. 19, No. 2 , pp. 561-570.
Taylor-Powell, E., and Hermann, C. (2000 “Collecting Evaluation Data: Surveys”,
University of Wisconsin-Extension, Online available at
<http://learningstore.uwex.edu/assets/pdfs/G3658-10.PDF> [Accessed 29-7-
2012]

399
Teo, H.H., Wei, K.K. and Benbasat, I. (2003) “Predicting Intention to Adopt
Interorganizational Linkages: An Institutional Perspective”, MIS Quarterly ,
Vol. 27, No.1, pp. 19-49.
Teo, T.S.H., and Tan, M. (1998) “An empirical study of adopters and non-adopters of
the internet in Singapore”, Information & Management, Vol. 34, pp. 339-345.
Teo, T.S.H., Lin, S., and Lai, K. H. (2009) “Adopters and non-adopters of e-
procurement in Singapore: An empirical study”, International Journal of
Management Science, Vol. 37, No. 5, pp. 972-987.
Teo, T.S.H., Ranganathan, C. , and Dhaliwal, J. (2006) “Key dimensions of inhibitors
for the deployment of web-based business-to-business electronic commerce”,
IEEE Transactions on Engineering Management, Vol. 53, No. 3, pp. 395-411.
Teo,T.S.H., and Ranganathan, C.(2004) “Adopters and non-adopters of business- to-
business electronic commerce in Singapore”, Information and Management
,Vol. 42,No.1,pp. 89–102.
Thatcher ,S.M.B., Foster, W., and Zhu., L. (2006) “B2B e-commerce adoption
decisions in Taiwan: the interaction of cultural and other institutional factors”,
Electronic research and applications , Vol. 5, pp. 92–104.
Thong, J.Y.L. (1999) “An integrated model of information systems adoption in small
businesses”, Journal of Management Information Systems, Vol. 15, No. 4, pp.
187-214.
To, M.L., and Ngai, E.W.T. (2007) “The role of managerial attitudes in the adoption
of technological innovations: an application to B2C e-commerce”,
400
International Journal of Enterprise Information Systems, Vol. 3, No. 2, pp.23-
33.
Tornatzky, L., and Klein, K. (1982) “Innovation characteristics and innovation
adoption-implementation : A meta-analysis of findings”, IEEE Transactions
on Engineering Management, Vol. 29,No. 1, pp. 28-45.
Tornatzky, L.G., and Fleischer, M.(1990) “The Processes of Technological
Innovation”, Lexington, MA: Lexington Books.
Touray ,A., Salminen,A., and Mursu ,A. (2013) “ICT BARRIERS AND CRITICAL
SUCCESS FACTORS IN DEVELOPING COUNTRIES”, The Electronic
Journal of Information Systems in Developing Countries, Vol. 56,No. 7,pp. 1-
17
Travel Industry Association (2009) “Travelers’ Use of the Internet”, Online available
at <
http://travel.utah.gov/publications/newsletters/files/2010_01_21/Travelers%20
Use%20of%20the%20Internet%20-%202009.pdf > [Accessed 25/11/11]
Ukoha,O., Awa,H., Nwuche,C., and Asiegbu ,I. (2011) “Analysis of Explanatory and
Predictive Architectures and the Relevance in Explaining the Adoption of IT
in SMEs” , Interdisciplinary Journal of Information, Knowledge, and
Management,Vol.6 , pp. 217-230
United Nations (2010) “The Global Partnership for Development at a Critical
Juncture”, MDG Gap Task Force Report, Online Available at <
http://www.un.org/millenniumgoals/pdf/1043282_MDG_2010%20%28E%29
%20WEBv2.pdf > [Accessed 6/1//2015]
401
Van Dijk, J. (2006) “Digital divide research, achievements and shortcomings
Poetics”, The digital divide in the twenty-first century, Vol. 34, No. 4-5, pp.
221-235.
Vatanasakdakul, S. , and D'Ambra, J. (2006) “An exploratory study of the socio-
cultural impact on the adoption of e-commerce for firms in the tourism
industry of Thailand, in proceeding of the14th
European Conference on
Information System (ECIS), Goteborg, Sweden, pp.235-247.
Vatanasakdakul, S., Tibben, W., and Cooper, J. (2004) “What prevents B2B
ecommerce adoption in developing countries?: A socio-cultural perspective”
,In proceeding of the 17th
Bled Ecommerce Conference Eglobal, Bled,
Slovenia.
Veiga, J. F., Floyd, S., and Dechant, K. (2001) “Towards modeling the effects of
national culture on IT implementation and acceptance”, Journal of Information
Technology, Vol. 16, No. 3 , pp. 145-158.
Venkatesh, V., Morris, V., Davis, G., and Davis, F. (2003) “User acceptance of
information technology: toward a unified view”, MIS Quarterly, Vol. 27,No.
3,pp. 425–78.
Venkatesh, V. and Davis, F.D. (2000) “A Theoretical Extension of the Technology
Acceptance Model: Four Longitudinal Field Studies”, Management Science,
Vol. 46, pp. 186-204.
Venkatesh, V., and Bala, H. (2008) “TAM 3: Advancing the Technology Acceptance
Model with a Focus on Interventions”, Decision Sciences , Vol. 39, No. 2, pp.
273–315.
402
Vittinghoff, E., and McCulloch, E.C. (2006) “Relaxing the Rule of Ten Events per
Variable in Logistic and Cox Regression”, American Journal of
Epidemiology,Vol.165, No. 6,pp. 710-718
Vogt, W.P., and Johnson, B. (2011) “Dictionary of statistics and methodology: A
nontechnical guide for the social sciences”, 4th
ed., Thousand Oaks, CA:
Sage.
Vrana, V., Zafiropoulos, C., and Paschalidis, S. (2006) “Attitudes towards Internet
Use among Travel Agencies in Greece”, In proceedings of the14 th European
Conference on Information Systems.
Wang, E.H. (1999) “ICT and economic development in Taiwan: analysis of the
evidence”, Telecommunications Policy, Vol. 23, No3-4, pp. 235–243.
Wang, H., Hou, J. (2012) “Factors Affecting E-commerce Adoption and
Implementation in Small and Medium-Sized Enterprise”, International Journal
of Digital Content Technology and its Applications(JDCTA) ,Vol. 6, No. 7,
pp. 167-173
Wang, S., and Cheung, W. (2004) “E-Business adoption by travel agencies: Prime
candidates for mobile e-business”, International Journal of Electronic
Commerce, Vol. 8, No. 3, pp. 43-63
Wang, H. , and Hou, J. (2012) “Factors Affecting E-commerce Adoption and
Implementation in Small and Medium-Sized Enterprises” , International
Journal of Digital Content Technology and its Applications,Vol. 6,No.
7,pp.167-173.

403
Warnaby, G., White, G., Prabhakar, G. P. , and Abd Razak, A. (2008) “Adoption and
use of E-commerce by small businesses in the UK tourism industry”, In
Entrepreneurship and Firms in the New Economy, Tunisia. Available online at
< http://eprints.uwe.ac.uk/14409/1/eCommerce_in_UK_Tourism_SMEs.pdf >
[Accessed 20/10/14]
Weaver, K., and Olson, J.K. (2006) “Understanding paradigms used for nursing
research”, Journal of Advanced Nursing, Vol. 53, No. 4, pp. 459-69.
Weiss, J.A., and Dale, B.C. (1998) “Diffusing against mature technology: Issues and
strategy”, Industrial Marketing Management, Vol. 27, No. 4, pp.293–304
Werner, P. (2004) “Reasoned Action and Planned Behavior”, In S.J. Peterson & T.S.
Bredow (eds), Middle range Theories: Application to Nursing Research,
Lippincott Williams & Wilkins, Philadelphia, pp. 125-147.
Werthner, H., and Klein, S. (1999) “Information technology and tourism: A
challenging relation”, Vienna: Springer Verlag.
Weston , R., and Gore, P. (2006) “A Brief Guide to Structural Equation Modeling”.
The Counseling Psychologist, Vol. 34 No. 5,pp. 719-751
Wigand, R. T. (1997) “Electronic Commerce: Definition, Theory and Context, The
Information Society”, Vol. 1, No. 13, pp. 1-16
Wijngaert, L.V.D., Vermaas, K., Brinkkemper, S., and Bouwman, H. (2008) “
Accumulating IS Theories Using a Network Approach Towards Meta-
Analysis” , In proceeding of the 2008 European Conference on Information
Systems , pp. 1153-1164.
404
Williams, M.D., Dwivedi, Y.K., Lal, B. and Schwarz, A. (2009) “Contemporary
trends and issues in IT adoption and diffusion research”, Journal of
Information Technology,Vol. 24, No. 1, pp. 1-10.
Woods, M., Woods , M.B, (2009) “Seven Wonders of the Ancient Middle East”, 2nd
ed., British Library Cataloguing :UK , Online available at<
http://books.google.co.uk/books/about/Seven_Wonders_of_the_Ancient_Midd
le_East.html?id=SldNota6-FUC&redir_esc=y >[Accessed 30/10/2014]
World Bank (2014) “Country and Lending Groups” , Available online at <
http://data.worldbank.org/about/country-and-lending-groups > [Accessed
12/11/2014]
World Health Organization (2013) “Country Cooperation Strategy for WHO and
Jordan 2008–2013”, Online available at <
http://www.who.int/countryfocus/cooperation_strategy/ccs_jor_en.pdf >
[Accessed 20/11/2014]
World Internet stats (2014) “Internet Users in the World”, Online available at <
http://www.internetworldstats.com/stats.htm> [Accessed 2/1/2015]
World Population Review (2014) “Jordan Population” Available online at<
http://worldpopulationreview.com/countries/jordan-population> [Accessed
9/10/2014].

405
World Tourism Organization Council (2001) “E-business for Tourism”, Available
online at <
http://pub.unwto.org/WebRoot/Store/Shops/Infoshop/Products/1210/1210-
1.pdf > [Accessed 17/11/11].
World Travel Market (2014) “The Future of Travel: Top Three Drivers of The
Industry”, Euromonitor International, Online Available at <
http://sete.gr/_fileuploads/entries/Online%20library/GR/The%20Future%20of
%20Travel_WTM.pdf > [Accessed 23/12/2014] .
Wrenn,B., Stevens,R., and Loudon,D. (2006) “Marketing Research: Text and Cases”,
Routledge, London.
WTO (2001) “E-business for Tourism”, Online available at <
http://pub.unwto.org/WebRoot/Store/Shops/Infoshop/Products/1210/1210-
1.pdf > [Accessed 17-11-11]
WTO (2013a) “Travel and Tourism , Economic Impact 2014 , Online available at <
http://www.google.co.uk/url?sa=t&rct=j&q=&esrc=s&source=web&cd=1&ca
d=rja&uact=8&ved=0CCQQFjAA&url=http%3A%2F%2Fwww.wttc.org%2F
~%2Fmedia%2Ffiles%2Freports%2Feconomic%2520impact%2520research%
2Fregional%2520reports%2Fworld2014.ashx&ei=vBE8VO7TMMSa7gao1IG
IAQ&usg=AFQjCNFw0VVjx0rC40ZNO-
h62yEv7G75qQ&bvm=bv.77161500,d.ZWU > [Accessed 29/10/2014]
406
WTO (2013b) “Travel and Tourism , Economic Impact 2014”,Online available at <
http://www.google.co.uk/url?sa=t&rct=j&q=&esrc=s&source=web&cd=2&ve
d=0CCgQFjAB&url=http%3A%2F%2Fwww.wttc.org%2F~%2Fmedia%2Ffil
es%2Freports%2Feconomic%2520impact%2520research%2Fcountry%2520re
ports%2Fjordan2014.ashx&ei=4gg8VPC6M43e7AbN1IH4CA&usg=AFQjC
NGiSe5qiR0H597Se6Z_7cJPfN8yQw&bvm=bv.77161500,d.ZWU&cad=rja>
[Accessed 29/10/2014]
Wymer, S., and Regan, E. (2005) “Factors influencing e-commerce adoption and use
by small and medium businesses”, Electronic Markets, Vol. 15, No. 4, pp.
438-453.
Yatigammana, K., Johar , M.G., and Gunawardhana, C. (2014) “Comparison of E-
Learning Acceptance among Postgraduate Students in Sri Lanka and
Malaysia”, Jouranl of South Asian Studies , Vol. 2 ,No. 2 ,pp.165-176
Yeung, J.H.Y., Shim, J.P., and Lai, A.Y.K. (2003) “Current Progress of E-Commerce
Adoption: Small and Medium Enterprises in Hong Kong”, Communications of
the ACM, Vol. 46, No. 9, pp. 226-232.
Ygge , B.M., and Arnetz J.E. (2004) “A study of non-response in a questionnaire
survey of parents’ views of pediatric care”, Journal of Nursing Management.
Vo. 12, No. 1, pp. 5-12.
Yin, R.K. (2003) “Case study research: Design and methods”, 3rd
ed., Thousand Oaks,
CA: Sage.
407
Yong,T., Shi-Hua, M., and Feng-Mei,G (2007). “An Empirical Research:Relationship
Between Logistics Capabilities and Supply Chain Performance in Industrial
Enterprises”, Chinese Journal of Management ,Vol. 4, No.4 pp. 493-504
Yoo, B., Donthu, N., and Lenartowicz, T. (2011) “Measuring Hofstede’s Five
Dimintions of Cultural Values at the individual level : development and
Validation of CVSCALE”, Journal of International Consumer Marketing .
Vol. 23. Nos. 3-4, pp. 193-210
Yoon, C. (2009) “The effects of national culture values on consumer acceptance of e-
commerce: Online shoppers in China”, Information & Management ,Vol. 46,
No. 5 ,pp. 294-301.
Yousafzai , S.Y., Foxall, G., and Pallister, J.G. (2010) “Explaining Internet Banking
Behavior: Theory of Reasoned Action, Theory of Planned Behavior, or
Technology Acceptance Model?”, Journal of Applied Social Psychology, Vol.
40,No. 5, pp. 1172–1202.
Yousafzai,S.Y., Foxall, G., and Pallister ,J.G (2007) “Technology acceptance: a
meta‐analysis of the TAM: Part 1”, Journal of Modelling in Management,
Vol. 2 ,No. 3, pp.251 – 280
Zandi,F. (2013) “A Country-Level Decision Support Framework for Self-Assessment
of E-Commerce Maturity”, iBusiness, Vol. 5 No. 2, pp. 43-54.
Zendehdel, M., and Paim, L.H. (2012) “Determinants of behavioural attitude to accept
E-shopping among the students in Malaysia”, Life Science Journal , Vol.9,
No. 3 , pp. 2441-2445
408
Zhou, Q., and DeSantis, R. (2005) “Usability Issues in City Tourism Website Design:
A Content Analysis”, In proceeding of the 2005 IEEE International
Professional Communication Conference.
Zhu, K., and Kraemer, K.L. (2002) “e-Commerce Metrics for Net-Enhanced
Organizations: Assessing the Value of e-Commerce to Firm Performance in
the Manufacturing Sector”, Information Systems Research, Vol. 13, No. 3,pp.
275-295.
Zhu, K., and Kraemer, K.L. (2005) “Post-adoption variations in usage and value of e-
business by organizations: cross-country evidence from the retail industry”,
Information Systems Research, Vol. 16 No. 1, pp. 61-84.
Zhu, K., Kraemer, K., and Xu, S. (2003) “Electronic business adoption by European
firms: a cross-country assessment of the facilitators and inhibitors”, European
Journal of Information Systems, Vol. 12, No. 4, pp. 251-268.
Zhu, K., Kraemer, K.L. and Xu, S. (2006b) “The process of innovation assimilation
by firms in different countries: A technology diffusion perspective on e-
business”, Management Science, Vol. 52, No. 10, pp. 1557-1576.

409
APPENDICES
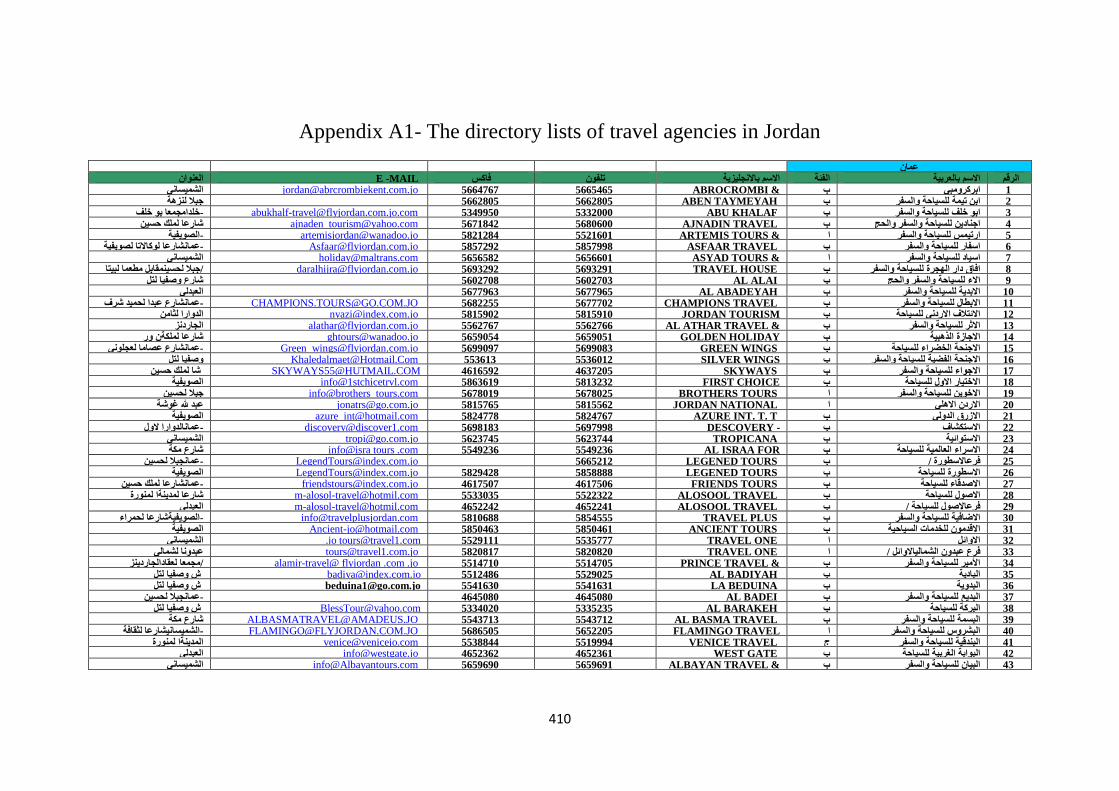
410
Appendix A1- The directory lists of travel agencies in Jordan
عمان الرقم بالعربية االسم الفئة باالنجليزية االسم تلفون فاكس E -MAIL العنوان
& [email protected] 5664767 5665465 ABROCROMBI الشميساني
KENT
1 ابركرومبي ب 2 والسفر للسياحة تيمة ابن ب ABEN TAYMEYAH 5662805 5662805 لنزھة جبال
3 والسفر للسياحة خلف ابو ب [email protected] 5349950 5332000 ABU KHALAF خلف بو معاخلدامج- 4 والحج والسفر للسياحة اجنادين ب [email protected] 5671842 5680600 AJNADIN TRAVEL حسين لملك شارعا
& [email protected] 5821284 5521601 ARTEMIS TOURS الصويفية-
TRAVEL
5 والسفر للسياحة ارتيمس ا 6 والسفر للسياحة اسفار ب [email protected] 5857292 5857998 ASFAAR TRAVEL لصويفية لوكاالتا عمانشارعا-
& [email protected] 5656582 5656601 ASYAD TOURS الشميساني
TRAVEL
7 والسفر للسياحة اسياد ا لبيتا مطعما لحسينمقابل جبال/
لصيني
[email protected] 5693292 5693291 TRAVEL HOUSE 8 والسفر للسياحة الھجرة دار افاق ب 9 والحج والسفر للسياحة االء ب AL ALAI 5602703 5602708 لتل وصفيا شارع
10 والسفر للسياحة االبدية ب AL ABADEYAH 5677965 5677963 العبدلي 11 والسفر للسياحة االبطال ب [email protected] 5682255 5677702 CHAMPIONS TRAVEL شرف لحميد عبدا عمانشارع-
[email protected] 5815902 5815910 JORDAN TOURISM لثامن الدوارا
COALITION
12 للسياحة الردنيا االئتالف ب & [email protected] 5562767 5562766 AL ATHAR TRAVEL الجاردنز
TOURISM
13 والسفر للسياحة االثر ب [email protected] 5659054 5659051 GOLDEN HOLIDAY ور لملكةن شارعا
TOURS
14 الذھبية االجازة ب 15 للسياحة الخضراء االجنحة ب [email protected] 5699097 5699083 GREEN WINGS لعجلوني عصاما عمانشارع-
[email protected] 553613 5536012 SILVER WINGS لتل وصفيا
TRAVEL & TOURISM
16 والسفر للسياحة الفضية االجنحة ب 17 والسفر للسياحة االجواء ب [email protected] 4616592 4637205 SKYWAYS حسين لملك شا
[email protected] 5863619 5813232 FIRST CHOICE الصويفية
TRAVEL
18 للسياحة االول االختيار ب 19 والسفر للسياحة االخوين ا info@brothers_tours.com 5678019 5678025 BROTHERS TOURS لحسين جبال 20 االھلي االردن ا [email protected] 5815765 5815562 JORDAN NATIONAL شةغو هلل عبد
21 الدولي االزرق ب [email protected] 5824778 5824767 AZURE INT. T. T الصويفية- [email protected] 5698183 5697998 DESCOVERY الول عمانالدوارا-
TOURISM
22 افاالستكش ب 23 االستوائية ب [email protected] 5623745 5623744 TROPICANA الشميساني
info@isra tours .com 5549236 5549236 AL ISRAA FOR مكة شارع
TRAVEL
24 للسياحة العالمية االسراء ب 25 / االسطورةفرع ب [email protected] 5665212 LEGENED TOURS لحسين عمانجبال-
26 للسياحة االسطورة ب [email protected] 5829428 5858888 LEGENED TOURS الصويفية 27 للسياحة االصدقاء ب [email protected] 4617507 4617506 FRIENDS TOURS حسين لملك عمانشارعا-
28 للسياحة االصول ب [email protected] 5533035 5522322 ALOSOOL TRAVEL لمنورة لمدينةا شارعا 29 / للسياحة فرعاالصول ب [email protected] 4652242 4652241 ALOSOOL TRAVEL العبدلي
30 والسفر احةللسي االضافية ب [email protected] 5810688 5854555 TRAVEL PLUS لحمراء الصويفيةشارعا- 31 السياحية للخدمات االقدمون ب [email protected] 5850463 5850461 ANCIENT TOURS الصويفية
32 االوائل ا [email protected] 5529111 5535777 TRAVEL ONE الشميساني 33 / الشمالياالوائل عبدون فرع ا [email protected] 5820817 5820820 TRAVEL ONE لشمالي عبدونا
& alamir-travel@ flyjordan .com .jo 5514710 5514705 PRINCE TRAVEL لعقادالجاردينز مجمعا/
TOURS
34 والسفر للسياحة األمير ب 35 البادية ب [email protected] 5512486 5529025 AL BADIYAH لتل وصفيا ش 36 البدوية ب [email protected] 5541630 5541631 LA BEDUINA لتل وصفيا ش 37 والسفر للسياحة البديع ب AL BADEI 4645080 4645080 لحسين عمانجبال- 38 ةللسياح البركة ب [email protected] 5334020 5335235 AL BARAKEH لتل وصفيا ش
39 والسفر للسياحة البسمة ب [email protected] 5543713 5543712 AL BASMA TRAVEL مكة شارع [email protected] 5686505 5652205 FLAMINGO TRAVEL لثقافة الشميسانيشارعا-
& TOURISM
40 والسفر للسياحة البشروس ا 41 والسفر للسياحة البندقية ج [email protected] 5538844 5519994 VENICE TRAVEL لمنورة المدينةا 42 للسياحة الغربية البوابة ب [email protected] 4652362 4652361 WEST GATE العبدلي
& [email protected] 5659690 5659691 ALBAYAN TRAVEL الشميساني
TOURISM
43 والسفر للسياحة البيان ب
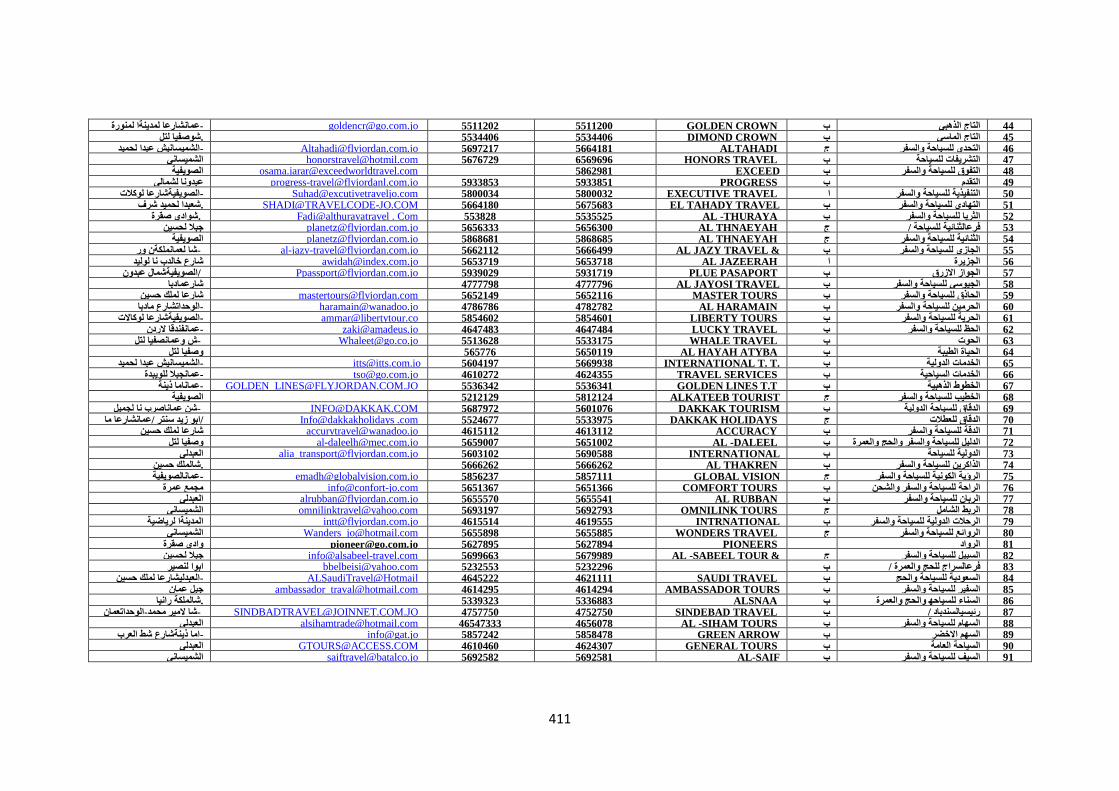
411
44 الذھبي التاج ب [email protected] 5511202 5511200 GOLDEN CROWN لمنورة لمدينةا عمانشارعا- 45 الماسي التاج ب DIMOND CROWN 5534406 5534406 لتل شوصفيا. لحميد عبدا الشميسانيش-
شومان
[email protected] 5697217 5664181 ALTAHADI 46 والسفر للسياحة التحدي ج 47 للسياحة التشريفات ب [email protected] 5676729 6569696 HONORS TRAVEL الشميساني [email protected] 5862981 EXCEED الصويفية
WORLDTRAVEL AND
TOURISM
48 والسفر للسياحة التفوق ب 49 التقدم ب [email protected] 5933853 5933851 PROGRESS لشمالي عبدونا
50 والسفر للسياحة التنفيذية ا [email protected] 5800034 5800032 EXECUTIVE TRAVEL لوكالت الصويفيةشارعا- [email protected] 5664180 5675683 EL TAHADY TRAVEL شرف لحميد شعبدا.
AND TOURISM
51 والسفر للسياحة التھادي ب 52 والسفر للسياحة الثريا ب Fadi@althurayatravel . Com 553828 5535525 AL -THURAYA صقرة شوادي .
53 / للسياحة فرعالثنائية ج [email protected] 5656333 5656300 AL THNAEYAH لحسين جبال 54 والسفر للسياحة الثنائية ج [email protected] 5868681 5868685 AL THNAEYAH لصويفيةا
& [email protected] 5662112 5666499 AL JAZY TRAVEL ور لعمانملكةن شا -
TOURS
55 والسفر للسياحة الجازي ب 56 الجزيرة ا [email protected] 5653719 5653718 AL JAZEERAH لوليد نا خالدب شارع
57 االزرق الجواز ب [email protected] 5939029 5931719 PLUE PASAPORT عبدون الصويفيةشمال / AL JAYOSI TRAVEL 4777796 4777798 شارعمادبا
AND TOURISM
58 والسفر للسياحة الجيوسي ب 59 والسفر للسياحة الحاذق ب [email protected] 5652149 5652116 MASTER TOURS نحسي لملك شارعا
60 والسفر للسياحة الحرمين ب [email protected] 4786786 4782782 AL HARAMAIN مادبا الوحداتشارع- 61 والسفر للسياحة الحرية ب [email protected] 5854602 5854601 LIBERTY TOURS لوكاالت الصويفيةشارعا- 62 والسفر للسياحة الحظ ب [email protected] 4647483 4647484 LUCKY TRAVEL الردن عمانفندقا-
63 الحوت ب [email protected] 5513628 5533175 WHALE TRAVEL لتل وعمانصفيا ش - 64 الطيبة الحياة ب AL HAYAH ATYBA 5650119 565776 لتل وصفيا
لحميد عبدا الشميسانيش-
شومان
[email protected] 5604197 5669938 INTERNATIONAL T. T.
SERVICES
65 الدولية الخدمات ب 66 السياحية دماتالخ ب [email protected] 4610272 4624355 TRAVEL SERVICES للويبدة عمانجبال- 67 الذھبية الخطوط ب [email protected] 5536342 5536341 GOLDEN LINES T.T ذينة عماناما-
ALKATEEB TOURIST 5812124 5212129 الصويفية
&TRAVEL
68 والسفر للسياحة الخطيب ج [email protected] 5687972 5601076 DAKKAK TOURISM لجميل نا عماناصرب شن -
INT.
69 الدولية للسياحة الدقاق ب ما عمانشارعا /سنتر زيد ابو/
ذينة
Info@dakkakholidays .com 5524677 5533975 DAKKAK HOLIDAYS 70 للعطالت الدقاق ج 71 والسفر حةللسيا الدقة ب [email protected] 4615112 4613112 ACCURACY حسين لملك شارعا 72 والعمرة والحج والسفر للسياحة الدليل ب [email protected] 5659007 5651002 AL -DALEEL لتل وصفيا [email protected] 5603102 5690588 INTERNATIONAL العبدلي
TOURS
73 للسياحة الدولية ب 74 والسفر للسياحة الذاكرين ب AL THAKREN 5666262 5666262 حسين شالملك. [email protected] 5856237 5857111 GLOBAL VISION عمانالصويفية-
TOURIST &TRAVEL
75 والسفر للسياحة الكونية الرؤية ج 76 والشحن روالسف للسياحة الراحة ب [email protected] 5651367 5651366 COMFORT TOURS عمرة مجمع
77 والسفر للسياحة الربان ب [email protected] 5655570 5655541 AL RUBBAN العبدلي 78 الشامل الربط ج [email protected] 5693197 5692793 OMNILINK TOURS الشميساني
[email protected] 4615514 4619555 INTRNATIONAL لرياضية المدينةا
TOURS
79 والسفر للسياحة الدولية الرحالت ب 80 والسفر للسياحة الروائع ج [email protected] 5655898 5655885 WONDERS TRAVEL الشميساني
81 الرواد [email protected] 5627895 5627894 PIONEERS صقرة وادي & [email protected] 5699663 5679989 AL -SABEEL TOUR لحسين جبال
TRAVEL
82 والسفر للسياحة السبيل ج 83 / والعمرة للحج فرعالسراج ب [email protected] 5232553 5232296 لنصير ابوا
84 والحج ياحةللس السعودية ب ALSaudiTravel@Hotmail 4645222 4621111 SAUDI TRAVEL حسين لملك العبدليشارعا- [email protected] 4614295 4614294 AMBASSADOR TOURS عمان جبل
AND TRAVEL
85 والسفر للسياحة السفير ب 86 والعمرة والحج للسياحھ السناء ب ALSNAA 5336883 5339323 رانيا شالملكة.
87 / رئيسيالسندباد ب [email protected] 4757750 4752750 SINDEBAD TRAVEL الوحداتعمان-محمد المير شا - 88 والسفر للسياحة السھام ب [email protected] 46547333 4656078 AL -SIHAM TOURS العبدلي
[email protected] 5857242 5858478 GREEN ARROW العرب شط ذينةشارع اما-
TOURS
89 راالخض السھم ب 90 العامة السياحة ب [email protected] 4610460 4624307 GENERAL TOURS العبدلي
[email protected] 5692582 5692581 AL-SAIF الشميساني
TRAVEL&TOURS
91 والسفر للسياحة السيف ب
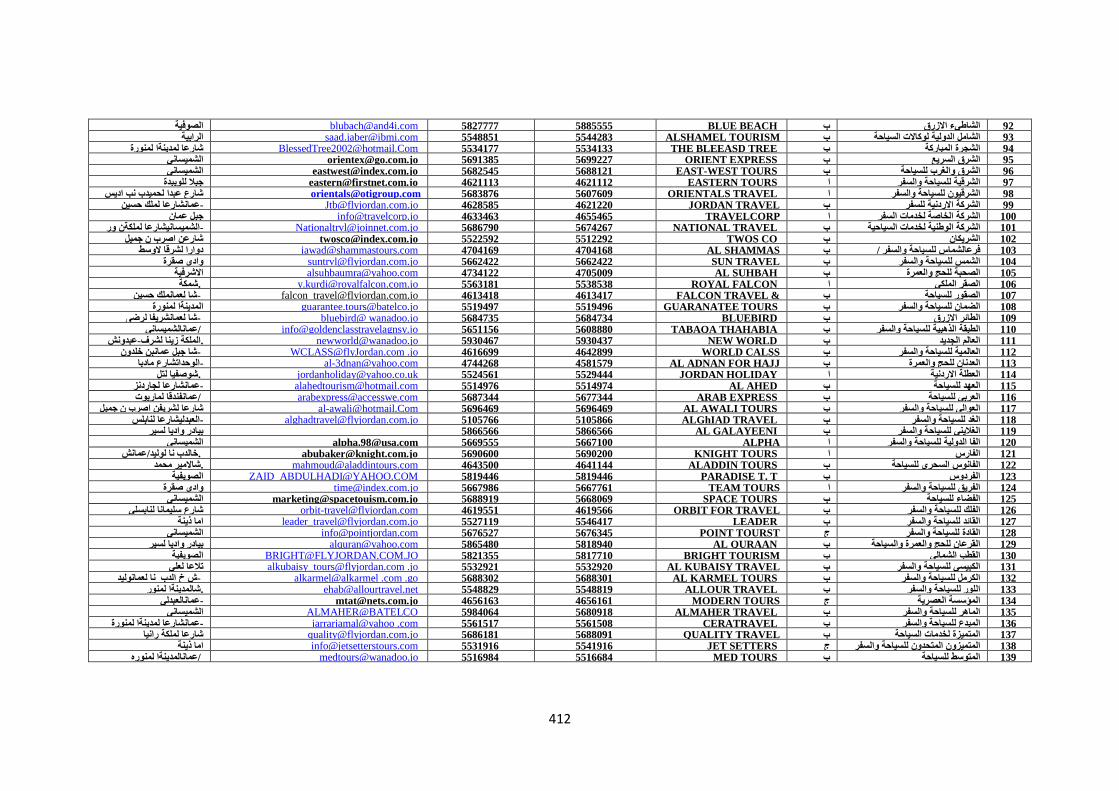
412
92 االزرق الشاطيء ب [email protected] 5827777 5885555 BLUE BEACH الصوفية [email protected] 5548851 5544283 ALSHAMEL TOURISM الرابية
&TRAVEL
السياحة لوكاالت الدولية الشامل ب
والطيران
93 94 المباركة الشجرة ب [email protected] 5534177 5534133 THE BLEEASD TREE لمنورة لمدينةا شارعا
95 السريع الشرق ب [email protected] 5691385 5699227 ORIENT EXPRESS الشميساني 96 للسياحة والغرب الشرق ب [email protected] 5682545 5688121 EAST-WEST TOURS الشميساني
97 السفرو للسياحة الشرقية ا [email protected] 4621113 4621112 EASTERN TOURS للويبدة جبال 98 والسفر للسياحة الشرقيون ا [email protected] 5683876 5607609 ORIENTALS TRAVEL اديس نب لحميدب عبدا شارع
[email protected] 4628585 4621220 JORDAN TRAVEL حسين لملك عمانشارعا-
BUREAU
99 للسفر االردنية الشركة ب [email protected] 4633463 4655465 TRAVELCORP عمان جبل
TRAVEL&TOURISM
100 السفر لخدمات الخاصة الشركة ا 101 احيةالسي لخدمات الوطنية الشركة ب [email protected] 5686790 5674267 NATIONAL TRAVEL ور لملكةن الشميسانيشارعا-
102 الشريكان ب [email protected] 5522592 5512292 TWOS CO جميل ن اصرب شارعن [email protected] 4704169 4704168 AL SHAMMAS الوسط لشرقا دوارا
TRAVEL & TOURISM
103 / والسفر للسياحة فرعالشماس ب [email protected] 5662422 5662422 SUN TRAVEL صقرة وادي
&TOURISM
104 والسفر للسياحة الشمس ب 105 والعمرة للحج الصحبة ب [email protected] 4734122 4705009 AL SUHBAH االشرفية
106 الملكي الصقر ا [email protected] 5563181 5538538 ROYAL FALCON شمكة . & [email protected] 4613418 4613417 FALCON TRAVEL حسين كلعمانمل شا -
TOURISM
107 للسياحة الصقور ب 108 والسفر للسياحة الضمان ب [email protected] 5519497 5519496 GUARANATEE TOURS لمنورة المدينةا
109 االزرق الطائر ب bluebird@ wanadoo.jo 5684735 5684734 BLUEBIRD لرضى لعمانشريفا شا - 110 والسفر للسياحة الذھبية الطبقة ب [email protected] 5651156 5608880 TABAQA THAHABIA عمانالشميساني / 111 الجديد العالم ب [email protected] 5930467 5930437 NEW WORLD عبدونش-لشرف زينا الملكة.
[email protected] .jo 4616699 4642899 WORLD CALSS خلدون عمانبن جبل شا -
TRAVEL
112 والسفر للسياحة العالمية ب [email protected] 4744268 4581579 AL ADNAN FOR HAJJ مادبا الوحداتشارع-
& UMRAH
113 والعمرة للحج العدنان ب 114 االردنية العطلة ا [email protected] 5524561 5529444 JORDAN HOLIDAY للت شوصفيا . 115 للسياحة العھد ب [email protected] 5514976 5514974 AL AHED لجاردنز عمانشارعا- 116 للسياحة العربي ب [email protected] 5687344 5677344 ARAB EXPRESS لماريوت عمانفندقا /
117 والسفر للسياحة العوالي ب [email protected] 5696469 5696469 AL AWALI TOURS جميل ن اصرب لشريفن شارعا 118 والسفر للسياحة الغد ب [email protected] 5105766 5105866 ALGhIAD TRAVEL لنابلس العبدليشارعا-
119 والسفر للسياحة الغاليني ب AL GALAYEENI 5866566 5866566 لسير واديا دربيا [email protected] 5669555 5667100 ALPHA الشميساني
INTERNATIONAL FOR
TRAVEL
120 والسفر للسياحة الدولية الفا ا 121 الفارس ا [email protected] 5690600 5690200 KNIGHT TOURS عمانش/لوليد نا خالدب . 122 للسياحة السحري الفانوس ب [email protected] 4643500 4641144 ALADDIN TOURS محمد شاالمير.
123 الفردوس ب [email protected] 5819446 5819446 PARADISE T. T الصويفية [email protected] 5667986 5667761 TEAM TOURS صقرة وادي
&TRAVEL
124 والسفر للسياحة الفريق ا 125 للسياحة الفضاء ب [email protected] 5688919 5668069 SPACE TOURS الشميساني
[email protected] 4619551 4619566 ORBIT FOR TRAVEL لنابسلي سليمانا شارع
& TOURISM
126 والسفر للسياحة الفلك ب 127 والسفر للسياحة القائد ب [email protected] 5527119 5546417 LEADER ذينة اما
[email protected] 5676527 5676345 POINT TOURST الشميساني
&TRAVEL
128 والسفر للسياحة القادة ج 129 والسياحة والعمرة للحج القرعان ب [email protected] 5865480 5818940 AL QURAAN لسير واديا بيادر
[email protected] 5821355 5817710 BRIGHT TOURISM الصويفية
&TRAVEL
130 الشمالي القطب ب [email protected] .jo 5532921 5532920 AL KUBAISY TRAVEL لعلي تالعا
& TOURISM
131 والسفر للسياحة الكبيسي ب 132 والسفر للسياحة الكرمل ب alkarmel@alkarmel .com .go 5688302 5688301 AL KARMEL TOURS لعمانوليد نا الدب خ ش - 133 والسفر للسياحة اللور ب [email protected] 5548829 5548819 ALLOUR TRAVEL لمنور شالمدينةا. [email protected] 4656163 4656161 MODERN TOURS مانالعبدليع-
&TRAVEL
134 العصرية المؤسسة ج 135 والسفر للسياحة الماھر ب ALMAHER@BATELCO 5984064 5680918 ALMAHER TRAVEL الشميساني
136 والسفر للسياحة المبدع ب jarrarjamal@yahoo .com 5561517 5561508 CERATRAVEL لمنورة لمدينةا عمانشارعا- [email protected] 5686181 5688091 QUALITY TRAVEL رانيا لملكة شارعا
SERVESE
137 السياحة لخدمات المتميزة ب 138 روالسف للسياحة المتحدون المتميزون ج [email protected] 5531916 5541916 JET SETTERS ذينة اما 139 للسياحة المتوسط ب [email protected] 5516984 5516684 MED TOURS لمنوره عمانالمدينةا /
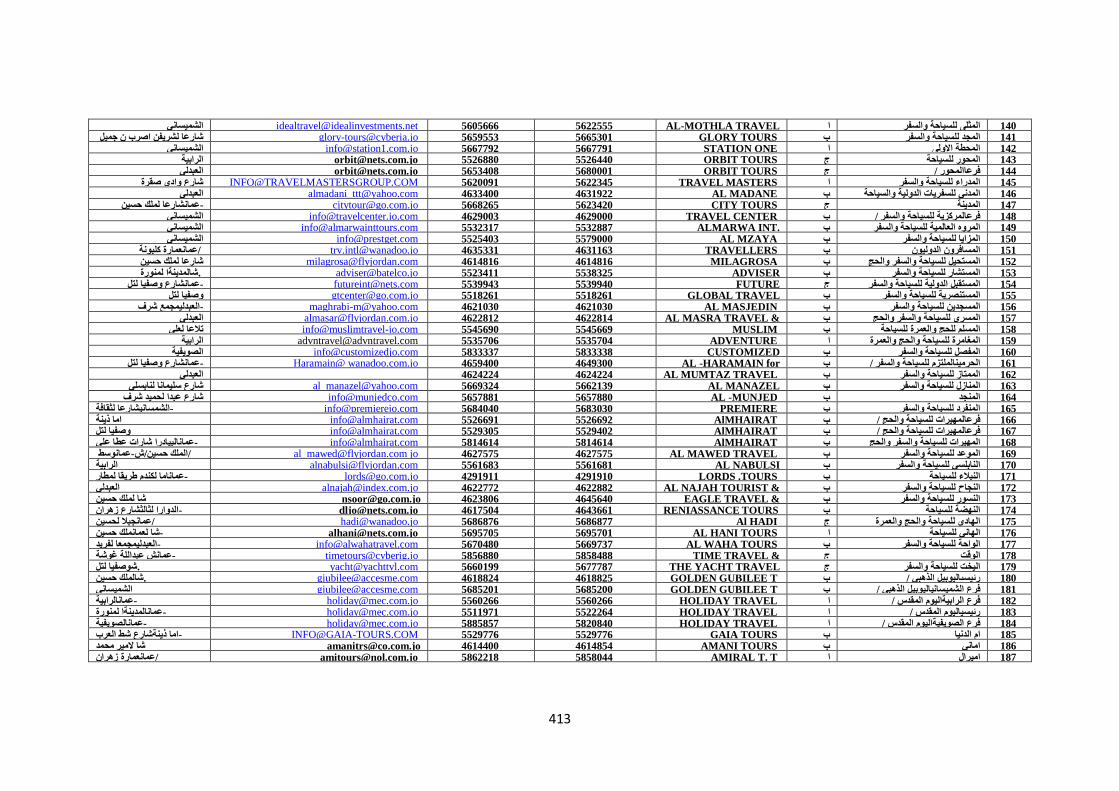
413
[email protected] 5605666 5622555 AL-MOTHLA TRAVEL الشميساني
& TOURISM
140 والسفر للسياحة المثلى ا 141 والسفر للسياحة المجد ب [email protected] 5659553 5665301 GLORY TOURS جميل ن اصرب لشريفن شارعا
142 االولى المحطة ا [email protected] 5667792 5667791 STATION ONE الشميساني 143 للسياحة المحور ج [email protected] 5526880 5526440 ORBIT TOURS الرابية 144 / فرعاالمحور ج [email protected] 5653408 5680001 ORBIT TOURS العبدلي 145 والسفر للسياحة المدراء ا [email protected] 5620091 5622345 TRAVEL MASTERS صقرة وادي شارع
146 والسياحة لدوليةا للسفريات المدني ب [email protected] 4633400 4631922 AL MADANE العبدلي 147 المدينة ج [email protected] 5668265 5623420 CITY TOURS حسين لملك عمانشارعا-
148 / والسفر للسياحة فرعالمركزية ب [email protected] 4629003 4629000 TRAVEL CENTER الشميساني [email protected] 5532317 5532887 ALMARWA INT الشميساني
TOURIST &TRAVEL
149 والسفر للسياحة العالمية المروه ب 150 والسفر للسياحة المزايا ب [email protected] 5525403 5579000 AL MZAYA الشميساني
151 وليونالد المسافرون ب [email protected] 4635331 4631163 TRAVELLERS كلبونة عمانعمارة / 152 والحج والسفر للسياحة المستحيل ب [email protected] 4614816 4614816 MILAGROSA حسين لملك شارعا
[email protected] 5523411 5538325 ADVISER لمنورة شالمدينةا .
TRAVEL&TOURISM
153 والسفر للسياحة المستشار ب [email protected] 5539943 5539940 FUTURE لتل وصفيا عمانشارع-
INTRNATIONAL
154 والسفر للسياحة الدولية المستقبل ج [email protected] 5518261 5518261 GLOBAL TRAVEL لتل وصفيا
CENTER
155 والسفر للسياحة المستنصرية ب 156 والسفر للسياحة المسجدين ب [email protected] 4621030 4621030 AL MASJEDIN شرف العبدليمجمع-
& [email protected] 4622812 4622814 AL MASRA TRAVEL العبدلي
TOURS
157 والحج والسفر للسياحة المسرى ب 158 للسياحة والعمرة للحج المسلم ب [email protected] 5545690 5545669 MUSLIM لعلي تالعا
159 والعمرة والحج للسياحة المغامرة ا [email protected] 5535706 5535704 ADVENTURE الرابية [email protected] 5833337 5833338 CUSTOMIZED الصويفية
JORDAN TRAVEL
160 والسفر للسياحة المفصل ب Haramain@ wanadoo.com.jo 4659400 4649300 AL -HARAMAIN for لتل وصفيا عمانشارع-
HAJJ and OMRA
161 / والسفر للسياحة الحرمينالملتزم ب 162 والسفر للسياحة الممتاز ب AL MUMTAZ TRAVEL 4624224 4624224 العبدلي [email protected] 5669324 5662139 AL MANAZEL لنابسلي سليمانا شارع
TRAVEL
163 والسفر للسياحة لالمناز ب 164 المنجد ب [email protected] 5657881 5657880 AL -MUNJED شرف لحميد عبدا شارع
165 والسفر للسياحة المنفرد ب [email protected] 5684040 5683030 PREMIERE لثقافة الشمسانيشارعا- 166 / والحج للسياحة فرعالمھيرات ب [email protected] 5526691 5526692 AlMHAIRAT ذينة اما
167 / والحج للسياحة فرعالمھيرات ب [email protected] 5529305 5529402 AlMHAIRAT لتل وصفيا 168 والحج والسفر للسياحة المھيرات ب [email protected] 5814614 5814614 AlMHAIRAT علي عطا شارات عمانالبيادرا-
عمانوسط-ش/حسين الملك /
البلد
[email protected] jo 4627575 4627575 AL MAWED TRAVEL 169 والسفر للسياحة الموعد ب [email protected] 5561683 5561681 AL NABULSI الرابية
TOURISM & TRAVEL
170 والسفر للسياحة النابلسي ب 171 للسياحة النبالء ب [email protected] 4291911 4291910 LORDS .TOURS لمطار طريقا لكندم عماناما-
& [email protected] 4622772 4622882 AL NAJAH TOURIST العبدلي
HAJJ
172 والسفر للسياحة النجاح ب & [email protected] 4623806 4645640 EAGLE TRAVEL حسين لملك شا
TOURISM
173 والسفر للسياحة النسور ب 174 للسياحة النھضة ب [email protected] 4617504 4643661 RENIASSANCE TOURS زھران لثالثشارع الدوارا-
175 والعمرة والحج للسياحة الھادي ج [email protected] 5686876 5686877 Al HADI لحسين عمانجبال / 176 للسياحة الھاني ا [email protected] 5695705 5695701 AL HANI TOURS حسين لعمانملك شا - 177 والسفر للسياحة الواحة ب [email protected] 5670480 5669737 AL WAHA TOURS لفريد العبدليمجمعا-
& [email protected] 5856880 5858488 TIME TRAVEL غوشة عبداللة عمانش-
TOURISM
178 الوقت ج [email protected] 5660199 5677787 THE YACHT TRAVEL لتل شوصفيا.
& TOURISM
179 والسفر للسياحة اليخت ج 180 / الذھبي رئيسىاليوبيل ب [email protected] 4618824 4618825 GOLDEN GUBILEE T حسين شالملك .
181 / الذھبي الشميسانياليوبيل فرع ب [email protected] 5685201 5685200 GOLDEN GUBILEE T الشميساني 182 / المقدس الرابيةاليوم فرع ا [email protected] 5560266 5560266 HOLIDAY TRAVEL عمانالرابية-
183 / المقدس رئيسياليوم ا [email protected] 5511971 5522264 HOLIDAY TRAVEL لمنورة عمانالمدينةا- 184 / المقدس الصويفيةاليوم فرع ا [email protected] 5885857 5820840 HOLIDAY TRAVEL عمانالصويفية-
185 الدنيا ام ب [email protected] 5529776 5529776 GAIA TOURS العرب شط ذينةشارع اما- 186 اماني ب [email protected] 4614400 4614854 AMANI TOURS محمد المير شا
187 اميرال ا [email protected] 5862218 5858044 AMIRAL T. T زھران عمانعمارة/
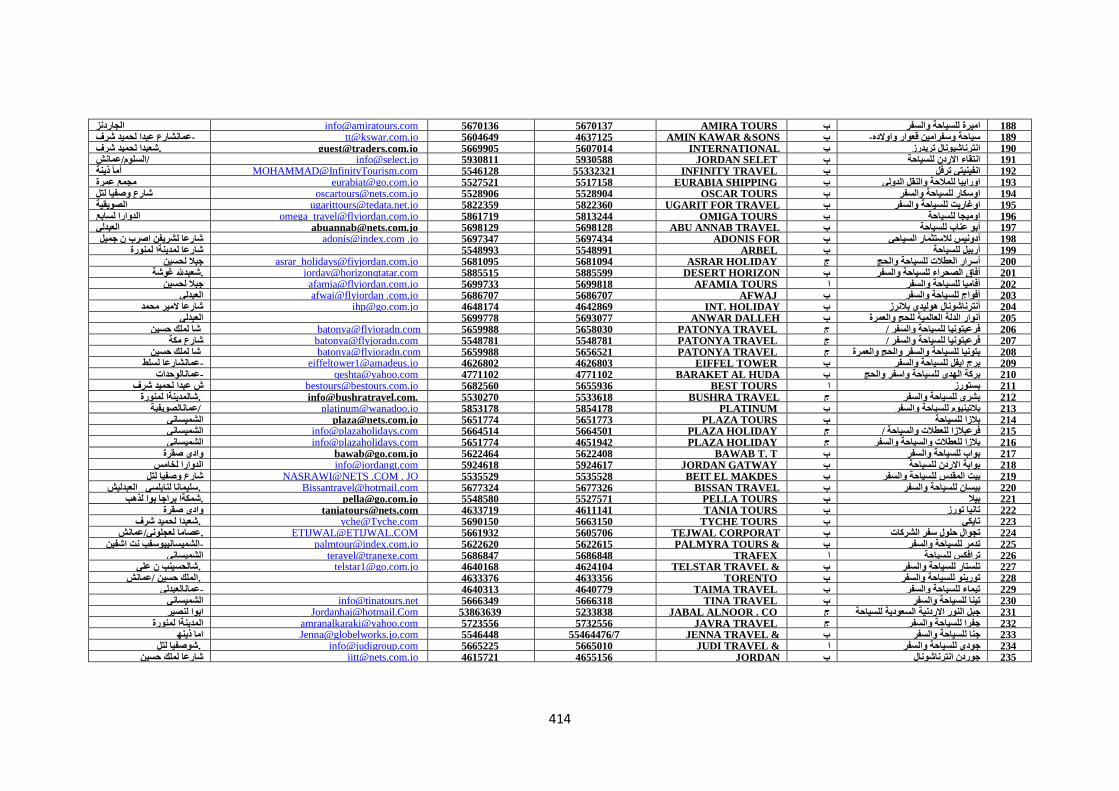
414
188 والسفر للسياحة اميرة ب [email protected] 5670136 5670137 AMIRA TOURS الجاردنز [email protected] 5604649 4637125 AMIN KAWAR &SONS شرف لحميد عبدا عمانشارع-
/ TRAVEL & TOUR
189 - واوالده قعوار وسفرامين سياحة ب [email protected] 5669905 5607014 INTERNATIONAL شرف لحميد شعبدا .
TRADERS
190 تريدرز انترناشيونال ب 191 للسياحة االردن انتقاء ب [email protected] 5930811 5930588 JORDAN SELET عمانش/السلوم/
192 ترفل انفينيتي ب [email protected] 5546128 55332321 INFINITY TRAVEL ذينة أمأ 193 الدولي والنقل للمالحة اورابيا ب [email protected] 5527521 5517158 EURABIA SHIPPING عمرة مجمع
194 والسفر للسياحة اوسكار ب [email protected] 5528906 5528904 OSCAR TOURS للت وصفيا شارع [email protected] 5822359 5822360 UGARIT FOR TRAVEL الصويقية
& TOURISM
195 والسفر للسياحة اوغاريت ب 196 للسياحة اوميجا ب [email protected] 5861719 5813244 OMIGA TOURS لسابع الدوارا
[email protected] 5698129 5698128 ABU ANNAB TRAVEL العبدلي
& TOURISM
197 للسياحة عناب أبو ب [email protected] .jo 5697347 5697434 ADONIS FOR جميل ن اصرب لشريفن شارعا
TOURISM
INVISTMENT
198 السياحي مارلالستث أدونيس ب 199 للسياحة أربيل ب ARBEL 5548991 5548993 لمنورة لمدينةا شارعا
200 والحج للسياحة العطالت أسرار ج [email protected] 5681095 5681094 ASRAR HOLIDAY لحسين جبال [email protected] 5885515 5885599 DESERT HORIZON غوشة شعبدهلل.
TRAVEL & TOURISM
201 والسفر للسياحة الصحراء أفاق ب 202 والسفر للسياحة أفاميا ا [email protected] 5699733 5699818 AFAMIA TOURS لحسين جبال
203 والسفر للسياحة أفواج ب afwaj@flyjordan .com.jo 5686707 5686707 AFWAJ العبدلي [email protected] 4648174 4642869 INT. HOLIDAY محمد المير شارعا
PLANERS
204 بالنرز ھوليدي أنترناشونال ب ANWAR DALLEH 5693077 5699778 العبدلي
INTER. FOR HAJJ
والعمرة للحج العالمية الدلة أنوار ب
والسياح
205 206 / والسفر للسياحة فرعبتونيا ج [email protected] 5659988 5658030 PATONYA TRAVEL حسين لملك شا
207 / والسفر للسياحة فرعبتونيا ج [email protected] 5548781 5548781 PATONYA TRAVEL مكة شارع 208 والعمرة والحج فروالس للسياحة بتونيا ج [email protected] 5659988 5656521 PATONYA TRAVEL حسين لملك شا 209 والسفر للسياحة ايفل برج ب [email protected] 4626802 4626803 EIFFEL TOWER لسلط عمانشارعا- [email protected] 4771102 4771102 BARAKET AL HUDA عمانالوحدات-
CO.
210 والحج واسفر للسياحة الھدى بركة ب 211 بستورز ا [email protected] 5682560 5655936 BEST TOURS شرف لحميد عبدا ش [email protected]. 5530270 5533618 BUSHRA TRAVEL لمنورة شالمدينةا .
TOURSM
212 والسفر للسياحة بشرى ج 213 والسفر للسياحة بالتينيوم ب [email protected] 5853178 5854178 PLATINUM عمانالصويفية /
214 للسياحة بالزا ب [email protected] 5651774 5651773 PLAZA TOURS الشميساني 215 / والسياحة للعطالت فرعبالزا ج [email protected] 5664514 5664501 PLAZA HOLIDAY الشميساني 216 والسفر والسياحة للعطالت بالزا ج [email protected] 5651774 4651942 PLAZA HOLIDAY الشميساني
217 والسفر للسياحة بواب ب [email protected] 5622464 5622408 BAWAB T. T صقرة وادي 218 للسياحة االردن بوابة ب [email protected] 5924618 5924617 JORDAN GATWAY لخامس الدوارا 219 والسفر للسياحة المقدس بيت ب NASRAWI@NETS .COM . JO 5535529 5535528 BEIT EL MAKDES لتل وصفيا شارع
[email protected] 5677324 5677326 BISSAN TRAVEL العبدليش _لنابلسي سليمانا .
&TOURISM
220 والسفر للسياحة بيسان ب 221 بيال ب [email protected] 5548580 5527571 PELLA TOURS لذھب بوا براجا شمكةا.
222 تورز تانيا ب [email protected] 4633719 4611141 TANIA TOURS صقرة وادي 223 تايكي ب [email protected] 5690150 5663150 TYCHE TOURS شرف لحميد شعبدا . [email protected] 5661932 5605706 TEJWAL CORPORAT عمانش/لعجلوني عصاما.
TRAVEL
224 الشركات سفر حلول تجوال ب & [email protected] 5622620 5622615 PALMYRA TOURS اشفين نت الشميسانييوسفب-
TRAVEL
225 والسفر للسياحة تدمر ب 226 للسياحة ترافكس ا [email protected] 5686847 5686848 TRAFEX الشميساني
& [email protected] 4640168 4624104 TELSTAR TRAVEL علي ن شالحسينب .
TOURISM
227 والسفر للسياحة تلستار ب 228 والسفر للسياحة تورينو ب TORENTO 4633356 4633376 عمانش /حسين الملك . 229 روالسف للسياحة تيماء ب TAIMA TRAVEL 4640779 4640313 عمانالعبدلي-
230 والسفر للسياحة تينا ب [email protected] 5666349 5666318 TINA TRAVEL الشميساني 231 للسياحة السعودية االردنية النور جبل ج [email protected] 53863639 5233838 JABAL ALNOOR . CO لنصير ابوا
232 والسفر للسياحة جفرا ج [email protected] 5723556 5732556 JAVRA TRAVEL لمنورة المدينةا & [email protected] 5546448 55464476/7 JENNA TRAVEL ذينھ اما
TOURISM
233 والسفر للسياحة جنا ب & [email protected] 5665225 5665010 JUDI TRAVEL لتل شوصفيا .
TOURISM
234 لسفروا للسياحة جودي ا [email protected] 4615721 4655156 JORDAN حسين لملك شارعا
INTERNATIONAL
235 انترناشونال جوردن ب

415
[email protected] 5353509 5344993 HAJJAT FOR TRAVEL رانيا لملكة شارعا
& TOURS
236 والحج للسياحة حجات ب HERBAWI 5355701 5340394 صويلح
INTRENATIONAL
237 العالمية حرباوي ب 238 للسياحة حسام ب [email protected] 5531060 5510209 HUSSAM لسماق اما
239 الشرق حنين ب [email protected] 5868694 5868693 ORIENTAL PASSION الصويفية 240 الدولية للسياحة الشرق حول ب [email protected] 5685421 5673361 PAN EAST الشميساني
[email protected] 4776067 4787334 ARAOUND THE الوسط لشرقا دوارا
WORLD
241 للسياحة العالم حول ب 242 والسفر للسياحة الھادي المحيط حول ب [email protected] 4652669 4652663 PAN PACIFIC حسين لملك شارعا
[email protected] 5604474 5604464 JORDAN VISITORS لتل مانوصفياع/
SERVICES
243 االردن زوار خدمات ب 244 والسفر للسياحة نجوم خمس ج [email protected] 5662148 5662145 5 STARS الغبدلي
245 والسفر للسياحة خوري ب [email protected] 4622684 4623430 KHOURY حسين شالملك . 246 / والسفر للسياحة فرعخوري ب [email protected] 5370232 5370226 KHOURY خلدا
[email protected] 4655983 4655982 KHIRY AND AL
SMADI TRAVEL
247 والصمادي خيري ب [email protected] 5857161 5858160 DAR ESSALAM لسابع الدوارا
TOURISM
248 للسياحة السالم دار ب [email protected] 4614150 4652150 TRAVEL & TOURISM عمان جبل
HOUSE
249 السياحة دار ب 250 والسفر للسياحة كرمة دار ب [email protected] .jo 4631183 4631654 KARMA HOUSE محمد عمانالمير شا -
251 والسفر للسياحة دارنا ب [email protected] 4613638 4655514 DARNA T.T لحسين جبال [email protected] 5674561 5622222 DALLAS TOURISM دوارفراس لحسين عمانجبال-
CLUB
252 والسفر للسياحة داالس ا [email protected] 5933959 5933150 DALLAS TOURISM مول عمانعبدون-
CLUB
253 / السياحي مولداالس عبدون فرع ا [email protected] 5666307 5105003 DALLAS TOURISM عمانالعبدلي-
CLUB
254 / والسفر للسياحة العبدليداالس ا & [email protected] 5857008 5810400 DAUD TOURISM عمانالصويفية-
TRAVEL
255 فروالس للسياحة داود ا & [email protected] 5679700 5662914 DAJANI TRAVEL حسين لملك شا
TOURISM
256 والسفر للسياحة دجاني ب 257 / للسياحة فرعدحالن ا [email protected] 56281422 5627311 DAHLAN الشميساني
258 والسفر للسياحة دحالن ا [email protected] 5532895 5535841 DAHLAN لتلع شاروصفيا- & [email protected] 5822471 5855369 DA"D TRAVEL الصويفية
TOURISM
259 والسفر للسياحة دعد ب & [email protected] .jo 5511116 5511112 DALLAH TRAVEL لعزيز عبدا ن فيصلب
TOURISM
260 والسفر للسياحة دلھ ب 261 والسفر للسياحة دھشان ب [email protected] 4653353 4653355 DAHSHAN لعبدليشا /حسين الملك . 262 للسياحة دوف ب [email protected] 5674676 5697683 DOVE لرابع عمانالدوارا جبل-
263 والسفر للسياحة رانيا ب [email protected] 5627995 5658350 RANIA TOURS لرياضية المدينةا [email protected] 4642692 4642692 JORDAN صقرة وادي
LANDSCAPES TOURS
264 والسفر للسياحة االردن ربوع ب 265 والسفر للسياحة رفادة ا [email protected] 5658557 5658556 REFADAH TRAVEL عمانش /شرف لحميد عبدا .
266 والسفر السياحة ركن ب [email protected] 5697755 5697766 TRAVEL ZONE الشميساني 267 / الدولية فرعرم ا [email protected] 4123300 4123300 RUM INTER. TRAVEL الشميساني
268 والسفر للسياحة الدولية رم ا [email protected] 4633346 4646300 RUM INTER. TRAVEL العبدلي 269 الجوية للخدمات رم ج [email protected] 4654982 4641108 RUM AIR SERVICES عبدليعمانال- 270 / الجوية للخدمات فرعرم ج [email protected] 5864340 5810581 RUM AIR SERVICES لسابع عمانالدوارا- 271 والعمرة والحج للسياحة رمادا ب [email protected] 4659205 4639050 RAMADA حسين لملك عمانشارعا- 272 / والعمرة للسياحة العبدليرمادا فرع ب [email protected] 4625999 4650555 RAMADA عمانالعبدلي-
273 والسفر للسياحة رمال ا [email protected] 5511820 5511835 RIMAL TOURS لمنورة لمدينةا شارعا 274 والسفر للسياحة رنا ب [email protected] 5542586 5542587 RANA TOURS الجاردنز
& [email protected] 4655939 4655136 RAHAF TARVEL حسين شالملك.
TOURISM
275 والسفر للسياحة رھف ب 276 للسياحة تراءالب رواد ب [email protected] 5060717 5060122 PETRA PIONEERS طبربور
RWAD AL MANTEKA 5885071 588072 عمانالصويفيھ /
AL ALAMYAH
277 للسياحة العالمية المنطقة رواد ب & [email protected] 5682235 5682236 RAWAN TRAVEL عمانش /شرف لحميد عبدا .
TOURISM
278 والسفر للسياحة روان ب & [email protected] 5859700 5859700 RAWAND TOURS غوشة شعبدهلل .
TRAVEL
279 والسفر للسياحة روند ب 280 رويال ا [email protected] 5857154 5856845 ROYAL TOURS لسابع عمانالدوارا /
281 / فرعرويال ا [email protected] 4451007 4451007 ROYAL TOURS علياء لملكة مطارا & [email protected] 5921495 5921493 ZEIN TRAVEL لخامس الدوارا
TOURISM
282 والسفر للسياحة زين ب 283 والسفر للسياحة سابا ا [email protected] 5504077 5504877 SABA TRAVEL ذينة أما
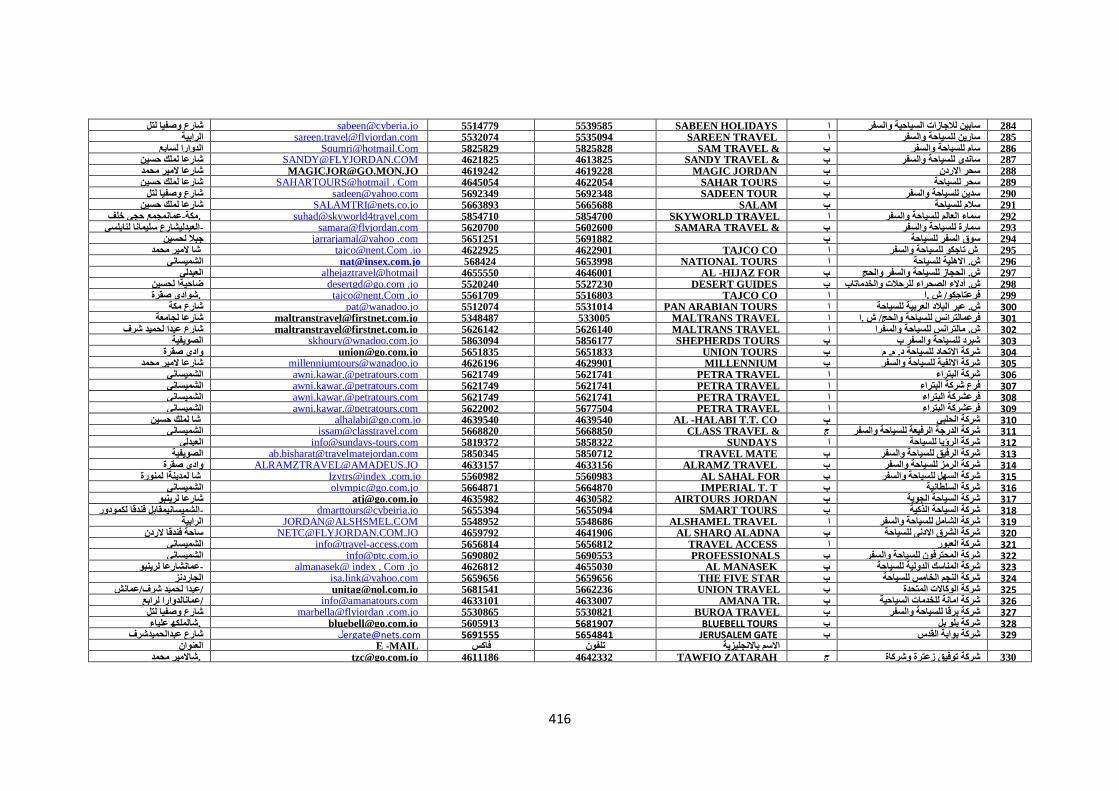
416
284 والسفر السياحية لالجازات سابين ا [email protected] 5514779 5539585 SABEEN HOLIDAYS لتل وصفيا شارع 285 والسفر للسياحة سارين ا [email protected] 5532074 5535094 SAREEN TRAVEL الرابية & [email protected] 5825829 5825828 SAM TRAVEL لسابع الدوارا
TOURISM
286 والسفر للسياحة سام ب & [email protected] 4621825 4613825 SANDY TRAVEL حسين لملك رعاشا
TOURISM
287 والسفر للسياحة ساندي ب 288 االردن سحر ب [email protected] 4619242 4619228 MAGIC JORDAN محمد المير شارعا 289 للسياحة سحر ب SAHARTOURS@hotmail . Com 4645054 4622054 SAHAR TOURS حسين لملك شارعا 290 والسفر للسياحة سدين ب [email protected] 5692349 5692348 SADEEN TOUR لتل وصفيا شارع 291 للسياحة سالم ب [email protected] 5663893 5665688 SALAM حسين لملك شارعا
خلف حجي عمانمجمع-مكة .
ش
[email protected] 5854710 5854700 SKYWORLD TRAVEL
& TOURISM
292 والسفر للسياحة العالم سماء ا & [email protected] 5620700 5602600 SAMARA TRAVEL لنابلسي سليمانا العبدليشارع-
TOURISM
293 والسفر للسياحة سمارة ب 294 للسياحة السفر سوق ب jarrarjamal@yahoo .com 5651251 5691882 لحسين جبال
295 والسفر للسياحة تاجكو ش ا [email protected] .jo 4622925 4622901 TAJCO CO محمد المير شا 296 للسياحة االھلية. ش ا [email protected] 568424 5653998 NATIONAL TOURS الشميساني
alhejaztravel@hotmail 4655550 4646001 AL -HIJAZ FOR ليالعبد
TRAVEL
والحج والسفر للسياحة الحجاز. ش ب
والعمرب
297 298 والخدماتاب للرحالت الصحراء أدالء. ش ب [email protected] .jo 5520240 5527230 DESERT GUIDES لحسين ضاحيةا
299 ا .ش/ فرعتاجكو ا [email protected] .jo 5561709 5516803 TAJCO CO صقرة شوادي . للسياحة العربية البالد عبر. ش ا [email protected] 5512074 5531014 PAN ARABIAN TOURS مكة شارع
والسفرب
300 [email protected] 5348487 533005 MALTRANS TRAVEL لجامعة شارعا
& TOURISM
301 ا .ش/ والحج للسياحة لترانسفرعما ا [email protected] 5626142 5626140 MALTRANS TRAVEL شرف لحميد عبدا شارع
& TOURISM
302 والسفرا للسياحة مالترانس. ش ا [email protected] 5863094 5856177 SHEPHERDS TOURS الصويفية
TRAVEL
303 ب السفرو للسياحة شبرد ب 304 م. م. د للسياحة االتحاد شركة ب [email protected] 5651835 5651833 UNION TOURS صقرة وادي
305 والسفر للسياحة االلفية شركة ب [email protected] 4626196 4629901 MILLENNIUM محمد المير شارعا [email protected] 5621749 5621741 PETRA TRAVEL الشميساني
TOURS
306 البتراء شركة ا [email protected] 5621749 5621741 PETRA TRAVEL الشميساني
TOURS
307 البتراء شركة فرع ا [email protected] 5621749 5621741 PETRA TRAVEL الشميساني
TOURS
308 ءالبترا فرعشركة ا [email protected] 5622002 5677504 PETRA TRAVEL الشميساني
TOURS
309 البتراء فرعشركة ا 310 الحلبي شركة ب [email protected] 4639540 4639540 AL -HALABI T.T. CO حسين لملك شا
& [email protected] 5668820 5668850 CLASS TRAVEL الشميساني
TOURISM
311 والسفر للسياحة الرفيعة الدرجة شركة ج 312 للسياحة الرؤيا شركة ا [email protected] 5819372 5858322 SUNDAYS العبدلي
313 والسفر للسياحة الرفيق شركة ب [email protected] 5850345 5850712 TRAVEL MATE الصويفية 314 والسفر للسياحة الرمز شركة ب [email protected] 4633157 4633156 ALRAMZ TRAVEL صقرة وادي
Izytrs@index .com.jo 5560982 5560983 AL SAHAL FOR لمنورة لمدينةا شا
TRAVEL & TOURISM
315 والسفر للسياحة السھل شركة ب 316 السلطانية شركة ب [email protected] 5664871 5664870 IMPERIAL T. T الشميساني
317 الجوية السياحة شركة ب [email protected] 4635982 4630582 AIRTOURS JORDAN لرينبو شارعا 318 ذكيةال السياحة شركة ب [email protected] 5655394 5655094 SMART TOURS لكمودور فندقا الشميسانيمقابل-
والسفر للسياحة الشامل شركة ا [email protected] 5548952 5548686 ALSHAMEL TRAVEL الرابية
واالستثمار
319 [email protected] 4659792 4641906 AL SHARQ ALADNA الردن فندقا ساحة
FOR TOURISM CO L
320 للسياحة االدنى الشرق شركة ب 321 العبور شركة ا [email protected] 5656814 5656812 TRAVEL ACCESS انيالشميس
[email protected] 5690802 5690553 PROFESSIONALS الشميساني
TRAVEL
322 والسفر للسياحة المحترفون شركة ب 323 للسياحة الدولية المناسك شركة ب almanasek@ index . Com .jo 4626812 4655030 AL MANASEK لرينبو عمانشارعا-
[email protected] 5659656 5659656 THE FIVE STAR الجاردنز
COMPANY
324 للسياحة الخامس النجم شركة ب [email protected] 5681541 5662236 UNION TRAVEL عمانش/شرف لحميد عبدا/
TOURS
325 المتحدة الوكاالت شركة ب [email protected] 4633101 4633007 AMANA TR لرابع عمانالدوارا/
SERVICES
326 السياحية للخدمات امانة شركة ب marbella@flyjordan .com.jo 5530865 5530821 BURQA TRAVEL لتل وصفيا شارع
&TOURS
327 والسفر للسياحة برقا شركة ب 328 بل بلو شركة ب [email protected] 5605913 5681907 BLUEBELL TOURS علياء شالملكھ .
329 القدس بوابة شركة ب JERUSALEM GATE 5654841 5691555 ل[email protected] عبدالحميدشرف شارع باالنجليزية االسم تلفون فاكس E -MAIL العنوان
330 وشركاة زعترة توفيق شركة ج [email protected] 4611186 4642332 TAWFIQ ZATARAH محمد شاالمير .
417
331 السياحية لالستثمارات جدارا شركة ب [email protected] 5627090 5627080 GADARA TOURS الشميساني & [email protected] 4656351 4656350 GARZIM TRAVEL حسين لملك شارعا
TOURISM
332 والسفر للسياحة جرزيم شركة ب 333 /مكة حياة شركة فرع ب [email protected] 4601800 4601800 HYATT MAKKAH العبدلي
334 مكة حياة شركة فرع ب [email protected] 4128085 78752437 HYATT MAKKAH خريبةالسوق 335 والعمرة للحج مكة حياة شركة [email protected] 4601800 4601800 HYATT MAKKAH العبدلي
336 للسفر داليا شركة ب [email protected] 5664430 5620231 DALIA لحسين جبال [email protected] 4655850 4625150 RAWABI -BAYT Al حسن لملك شارعا
MAQEDS
337 المقدس بيت روابي شركة ب 338 العلمين سفريات شركة ب AL -ALAMAIN 4625000 4626262 لسفريات مجمعا قابلالعبدليم- 339 للسياحة ضانا شركة ب [email protected] 4611077 4611066 DANA -TRAVEL حسين شالملك عمان/ & [email protected] 5059379 5075631 AMMAR TRAVEL لشمالي عمانالھاشميا-
TOURISM
340 السفر للسياحة عمار شركة ب 341 للسياحة وشركاة يعيش قصي شركة ب [email protected] 4634415 4634414 QUSAI YAISH PAR حسين لعمانملك شا - & [email protected] 5857006 5857003 MA`AB TRAVEL عمانالجندويل-
TOURISM
العمر والحج والسفر للسياحة ماب ركةش ب
ة
342 [email protected] 8675766 5004444 DESTINATION OF لتل وصفيا شارع
THE WORLD
343 للسياحة العالم محطات شركة ا 344 ب والحج للسياحة مينا شركة ب [email protected] 5654079 5652199 MENA TOURS لحسين جبال [email protected] 5699094 5699093 NASA TRAVEL نلحسي جبال
&TOURISM CO.
345 ب والسفر للسياحة ناسا شركة ب 346 ب نعواس شركة ب [email protected] 5604618 5665718 NAWAS TOURS لتل شوصفيا . 347 الخضراء لمروجشركةا ا [email protected] 5675766 5698184 GREEN MEADOWS لتل شوصفيا . 348 ب والسفر للسياحة شقرة ب [email protected] 5657092 5675031 SHAQRA TOURISM فراس لحسيندوار جبال-
349 العطالت شمس ج [email protected] 5692666 5692416 SUN HOLIDAY شرف لحميد عبدا ش 350 ب الميت البحر شواطىء ب [email protected] 5692800 5661871 DEAD SEA BEACH الشميساني
351 ب للسياحة النحاس شفيق صائب ب [email protected] 4629333 4630879 SAEEB NAHAAS T.T شومان لحميد عبدا & [email protected] 5682868 5688886 SAHARA TRAVEL العبدلي
TOURISM
352 والسفر للسياحة صحارى ا [email protected] 4657508 4657507 MOON LIGHT محمد شاالمير .
TRAVEL & TOURISM
353 القمر ضوء ب 354 للسياحة البوادي طيبة ب [email protected] 5343116 4611350 TEEBEH ALBWADI عمان جبل
355 / للسياحة البوادي طيبة صويلح فرع ب [email protected] 5343116 5343325 TEEBEH ALBWADI صويلح 356 والسفر للسياحة واحد عالم ب [email protected] 5818118 5822260 ONE WORLD TRAVEL الصويفية
& [email protected] 5532632 5533666 ABOUD TRAVEL لتل وصفيا شارع
TOURISM
357 عبود ب 358 والسفر للسياحة عتيق ب [email protected] 5682338 5690449 ATIC T. T لحميد عبدا ارعش WONDWRS TRAVEL 7 5625422 5625433 لمنورة شالمدينةا .
&TOURISM
359 والسفر للسياحة السبع الدنيا عجائب ب 360 للسياحة عدوان ب [email protected] 4655182 4655180 ADWAN TOURS الول الدوارا
361 عشتار ب [email protected] 4616428 4616413 ASHTAR TOURS لثالث عمانالدوارا / 362 للسياحة عصام ب [email protected] 5510613 5510611 ISSAM TOURS لمنورة لمدينةا شارعا
363 والعمرة والحج للسياحة عفانة ب [email protected] 4774919 7481812 AFANEH TOURS مادبا الوحداتشارع- & [email protected] 4646190 4659945 ELWAN TRAVEL عمانالعبدلي-
TOURISM
364 والسفر للسياحة علوان ب 365 لسياحةل علياء ا [email protected] 5829293 5829494 ALIA TOURS عمانالصوفيھ / [email protected] 4658018 4644321 AMMAN TOURISM عمان جشبل-البحتري .
BUREAU
366 للسياحة عمان ب [email protected] 5687940 5692620 AMRA TRAVEL لنابلسي سالعبدليليمانا ش -
TOURISM
367 والسفر للسياحة عمرة ب 368 للسياحة عمون ب [email protected] 4656995 4639995 AMMON TOURS حسين شالملك . [email protected] 5373272 5372272 GHADER UNIVERSAL حسين شالملك .
TRAVEL
369 للسياحة العالمية غدير ب 370 والسفر للسياحة غرناطة ب granada-travel@fly jordan .com .jo 4638419 4638126 GRANADA T. T حسين لملك شارعا
371 ديبة فضل ب [email protected] 4617614 4625646 FADEL DIBEH حسين شالملك . 372 والسفر للسياحة فينوس ب [email protected] 5681728 5681732 VENUS الشميساني
373 والسفر للسياحة قرطاج ب [email protected] 4657051 4657050 CARTAHGE TRAVEL لسلط عمانشارعا- 374 والسفر للسياحة قيصر ب CAESAR TRAVEL 553530 5510092 هلل عبد لملك عمانحدائقا-
[email protected].,jo 4647182 4647181 CAPRI TRAVEL العبدلي
&TOURISM
375 الشحنو والسفر للسياحة كابري ب 376 للسياحة كاردو ب info@cardotours . Com 5339211 5330408 CARDO TOURS لتل شوصفيا .
377 والسفر للسياحة كاميرا ب [email protected] 4655111 4616007 CAMERA TOURS العبدلي 378 للسياحة كايد ب [email protected] 5620305 5602302 KAYED TOURS صقرة وادي

418
379 والسفر للسياحة كريستال ا walid@crystaltours_jo.com 5544140 5510610 CRYSTAL TOURS لمنورة المدينةا &Kkareem -travel @flyjordan.com .jo 4772337 4735944 KARIM TRAVEL مادبا الوحداتشارع-
TOURIM
380 والسفر للسياحة كريم ب & classictoor2003@yahoo .com 5833500 5833400 CLASSIC TRAVEL لسابع عمانالدوارا-
TOURISM
381 والسفر للسياحة كالسيك ب 382 والسفر للسياحة لبيبة ب [email protected] 5885873 5885870 LABIBEH TRAVEL الصويفية
383 لميس ج [email protected] 4657569 4657570 LAMEES عمانش /لشريعة كليةا . 384 / فرعلميس ج [email protected] 5510198 5510198 LAMEES لتل وصفيا
385 والسفر للسياحة لورنس ب [email protected] 5683439 5664916 LAWRENCE TOURS الس جالشميسانيراندب ف - 386 والسفر للسياحة لوزان ب [email protected] 4641861 4614839 LOUZANE TRAVEL لثالث الدوارا
387 االسالمية االصالح مؤسسة ب [email protected] 5624461 5624893 ISLAH ISLAMIC الردنية عمانالجامعةا- [email protected] 4659330 4641350 BISHARAT TOURS زھران عمانشارع-
CORPORATION
388 البشارات مؤسسة ب 389 والحج للسياحة الدولية التيسير مؤسسة ب AL TAISER 4901137 4901213 لشمالي الھاشميا
[email protected] 5623979 5683773 AL RAHHAL TRAVEL لنابلسي سالعبدليليمانا ش -
& TOURS
390 والسفر للسياحة الرحال مؤسسة ب [email protected] 5699174 5694616 INTERNATIONAL لعمانوليد نا الدب خ ش -
TOURS
391 الدولية السياحة مؤسسة ب للسياحة االوسط الشرق مؤسسة ج MIDDLE [email protected] 5531903 5533494 MIDDLEEAST TOURS لتل وصفيا شارع
والشحن
392 393 للسياحة الفريحات مؤسسة ب [email protected] 5650317 5650316 جادنزل شارعا 394 والحج للسياحة االلباب اولي مؤسسة ب OLY AL ALBAB 4632029 4632027 العبدلي
& [email protected] 4778588 4777283 HALA TRAVEL مادبا الوحداتشارع-
TOURISM
395 والسفر للسياحة ھال مؤسسة ب لملك مسجدا العبدليمقابل /
عبدهلل
algalayinitravel@flyjordanl .com.jo 4649494 5680619 WALID GHALLINE والحج للسياحة الغاليني وليد مؤسسة ب
فر/
396 397 والحج للسياحة الغالييني وليد مؤسسة ب algalayinitravel@flyjordanl .com.jo 4639293 4649494 WALID GHALLINE شرف العبدليمجمع /
398 / والحج للسياحة الغالييني وليد مؤسسة ب algalayinitravel@flyjordanl .com.jo 46392917 5359777 WALID GHALLINE صويلح [email protected] 5862277 5828801 HASHWEH عمان-الصويفية
CORPORATION
399 مؤسسةحشوة ب MARA TOURSM AND 5518024 5518028 لواحة دوارا
TRAVEL
400 والسفر للسياحة مارا ب 401 للسياحة ماغي ج [email protected] 5695757 5676787 MAGI TOURS لحسين جبال
[email protected] 5655400 5655401 DESTINATION الشميساني
JORDAN & EASTMID
402 المتوسط وشرق االردن محطات ب 403 والسفر للسياحة الشرق مذاق ب [email protected] 5337864 5337863 FLAVOR TOURS الشميساني
404 للسياحة مرجان ا [email protected] 5827990 5822261 MURJAN TOURS غوشة عبداللة عمانش- [email protected] 4647425 4647424 MARAH TRAVEL حسين شالملك .
&TOURS
405 والسفر للسياحة مرح ب 406 والسفر للسياحة السفر مركز ب [email protected] 4629003 4629000 TRAVEL CENTER حسين لملك شارعا
& [email protected] 4396606 4396555 MESK TOURIST عمانالياسمين-
TRAVEL
407 والسفر للسياحة مسك ب 408 السياحية للعطالت مشاوير ج 5639639 5636307 لحسين جبال
409 للسياحة معان ب [email protected] 4645969 4645969 MAAN TOURS حسين لملك شارعا & [email protected] 5531666 5531666 EBONY TRAVEL لتل وعمانصفيا ش -
TOURISM
410 ابنوس مكتب ب ashurafa_travel@ flyjordan .com .jo 4636293 4623388 NATIONAL TOURISM عمانش /حسين الملك .
OFFICE
411 الوطني السياحة مكتب ب 412 والسفر للسياحة جوي مكتب ب [email protected] 4635666 4633444 JOY TRAVEL حسين لملك شارعا
413 للسياحة ديوان مكتب ب [email protected] 5511960 5511950 DIWAN TOURS لتل وعمانصفيا ش - 414 والسفر للسياحة مشتھى مكتب ب [email protected] 4611509 4636410 MUSHTAHA حسين لملك شا 415 للسياحة ھاواي مكتب ج hawaitoura2003@hotmail .com 5602011 5602010 HAWAI TR. TOURS لتل وصفيا ش 416 ملحس ب [email protected] 4629709 4629708 MALHAAS TOURS م عمانشارع-علياء .
417 الدولية للسياحة منى ب [email protected] 5343726 5343724 MUNA INT الجبيھة 418 والسفر للسياحة مھنا ب [email protected] 5334885 5335885 MUHANNA TOURS الردنية لجامعةا شا
[email protected] 5811877 5861431 NEAR EAST الصويفية
RESOURCES
TOURISM
419 االدنى الشرق موارد ب 420 والسفر للسياحة مواكب ب MWAKEB 4642925 4642926 العبدلي [email protected] 5677403 5677402 MOSAICS FOR حسين لملك شارعا
TRAVEL
421 والسفر للسياحة موزييك ب 422 والسفر للسياحة موناليزا ب [email protected] 5631000 5150415 MONALEZA الشميساني
[email protected] 5673333 5673333 MILANO FOR لحسين جبال
TOURISM
423 / للسياحة فرعميالنو ج [email protected] 5863388 5863388 MILANO FOR الصويفية
TOURISM
424 والسفر للسياحة ميالنو ج-لرياضة كليةا شارع-
عمانعرجان
naser-travel@flyjordan .com.jo 5699876 5699887 NASER TOURS 425 للسياحة ناصر ب & [email protected] 5885667 5885668 NAV TRAVEL الصويفيةش-باريس .
TOURS
426 والسفر للسياحة ناف ب
419
427 والسفر للسياحة ويارا نانا ب [email protected] 562518 5625215 NANA&YARA لتل وصفيا 428 القمر نصف ب [email protected] 5377046 5377045 HALF MOON لعلي عمانتالعا-
[email protected] 4632277 4632255 SYSTEMS FOR حسين لملك شارعا
TRAVEL& TOURISM
429 والسفر للسياحة نظم ب 430 / عواسفرعن ب [email protected] 4622185 4622184 NAWAS TOURS حسين شالملك .
& [email protected] 4741115 4741114 NEHAD TRAVEL الوسط لشرقا دوارا
TOURISM
431 والسفر للسياحة نھاد ب 432 والسفر للسياحة االردن نھر ب riverjordan@flyjordan .com .jo 5654350 5654330 RIVER JORDAN لريماوي الشميسانيمجمعا-
433 / االيمان نور فرع ب [email protected] 4650894 4640630 NOOR ALIMAN العبدلي 434 والحج للسياحة االيمان نور ب [email protected] 4650894 4640630 NOOR ALIMAN العبدلي 435 للسياحھ ننيبتو ب [email protected] 5521495 5521493 NEPTUNE TOURS الجادرز
436 نيبو ب [email protected] 5679950 5679957 NEBO TOURS الشميساني 437 والسفر للسياحة ھدمي ب [email protected] 5549693 5549690 TRAVEL NOW الرابية 438 / والسفر للسياحة ھدمي فرع ب TRAVEL NOW 5549690 5549693 الرابية
439 والسفر للسياحة ھوازن ب [email protected] 4642926 4642925 HAWAZIN TRAVEL لعبدلي لؤلؤةا دليعمارةالعب- & [email protected] .jo 5699264 5669336 HAYA TRAVEL حسين لملك عمانشارعا-
TOURISM SERVICES
440 السياحة لخدمات ھيا ب 441 والسفر للسياحة ھيرمس ب [email protected] 5411786 5411785 HERMES دابوق
442 والحج للسياحة العقيق وادي ب AQIQ-JO@YAHOO .COM 4655901 4655900 WADI ALAQEEQ العبدلي 443 والسفر للسياحة وزان ب alwazzan-travelflyJordan.Com .jo 4637339 4623180 WAZZAN . TRAVEL حسين شالملك .
& [email protected] 4657999 4641083 APOLLO TOURIST لثالث الدوارا
TRAVEL AGENCY
444 والسفر للسياحة للو ابو وكالة ب & [email protected]. 4617614 4654046 ATLAS TRAVEL حسين لملك شارعا
TOURIST AGENCY
445 / والسفر للسياحة اطلس وكالة رئيسي ب & [email protected]. 4610198 4656647 ATLAS TRAVEL حسين لملك شارعا
TOURIST AGENCY
446 / والسفر للسياحة اطلس وكالة فرع ب [email protected] 4616670 4616690 AL ETIMAD INT لحسين جبال
AGENCY
447 االعتماد وكالة ب 448 / البوادي وكالة رئيسي ا [email protected] 5521257 5522421 BAWADI AGENCY لتل شوصفيا .
449 / البوادي وكالة فرع ا [email protected] 5939400 5922488 BAWADI AGENCY لخامس الدوارا [email protected] 5685100 5687878 TRUST TOURS الشميساني
AGENCY
450 والسفر للسياحة الثقة وكالة ا للسياحة الدقاق السابعوكالة الدوار فرع ب [email protected] 5824490 5817711 DAKKAK TOURS لسابع عمانالدوارا-
/
451 ياحةللس الدقاق بريستولوكالة فندق فرع ب [email protected] 5920024 5920025 DAKKAK TOURS ريستول عمانفندقب-
/
452 453 والعمرة والحج للسياحة الدقاق وكالة ب [email protected] 5621920 5684002 DAKKAK TOURS عمانالشميساني- [email protected] 4610095 4641959 UNITED TRAVEL الول عمانالدوارا-
AGENCY
454 المتحدة السفر وكالة ب 455 القريب الشرق وكالة ب NET@JO .COM JO 5685490 5662518 NET AGENCY علياء لملكة شارعا
& [email protected] 5814720 5817736 ASALI TRAVEL عمانالصوفية /
TOURISM AGENCY
456 والسفر للسياحة العسلي وكالة ب 457 / الفرسان فرعوكالة ب [email protected] 5666535 5655737 AL FURSAN الشميسانيش-الكومودور .
458 والسفر للسياحة الفرسان وكالة ب [email protected] 4651284 4651283 AL FURSAN حسين لملك شارعا [email protected] 5688126 5685195 JERUSALEM EXP العبدلي
AGENCY
459 / القدس العبدليوكالة ا [email protected] 4651125 4622151 JERUSALEM EXP حسين شالملك .
AGENCY
460 / القدس رئيسيوكالة ا [email protected] 5827474 5829333 THE GUIDING STAR الصويفية
AGENCY
461 الدليلة النجمة وكالة ب [email protected] 4618208 4618283 BETHLEHEM INT محمد المير شا
AGENCY
462 لحم بيت وكالة ب حسين الملك.
ش
[email protected] 4611860 4610933 DERBI T. A AGENCY 463 دربي وكالة ب ztt@flyjordan. com.jo 4625197 4637827 ZAID TOURISM حسين لملك شارعا
AGENCY
رئيسي /زايد وكالة ب
464 ztt@flyjordan. com.jo 4641391 4641392 ZAID TOURISM حسين لملك شارعا
AGENCY
فرع /زايد وكالة ب
465 [email protected] 4655011 4654001 ZATARAH CO . T. T حسين لملك شا
AGENCY
رئيسي / زعترة وكالة ب
466 [email protected] 5863816 5863818 ZATARAH CO . T. T الصويفية
AGENCY
فرع صويفية /زعترة وكالة/ ب
467 468 للسياحة الشمس وھج ب WAHJ ALSHAMS 4169966 4169955 سحاب
& [email protected] 4636036 4636036 YAGHI TOURISM لنزھھ جبال
TRAVEL
469 والسفر للسياحة ياغي ب لفيصلي اديا مجمعن /
واحةل دوارا
[email protected] 5603302 5603301 YALLA JORDAN
TOURS
470 والسفر للسياحة اردن يال ب 471 يونيتورز ب [email protected] 4671047 5683260 UNITOURS لحسين جبال
420
اربد الرقم يةبالعرب االسم الفئة باالنجليزية االسم تلفون فاكس E -MAIL العنوان
1 الروزنا ج [email protected] 7256331 7256330 AL ROZANA اربدش/رشيدات شفيقا. 2 والسفر للسياحة البديع ب AL BADEI 7240787 7240787 اربد 3 المعم البيت ب 7262231 7262231 اربد 4 عمرةوال للحج المھند ب AL MOHANAD 7426942 7246942 اربد
5 والعمرة للحج االستقامة ب 7258600 7259900 لھاشمي اربدشارعا- 6 الصابرين ب 7250588 725288 لحسن سطعانا اربدشارع-
7 والعمرة والحج للسياحة الفاروق ب AL FAROOK 7252323 7252424 شوتراربدش مجمع/بغداد/ / 8 والعمرة للحج الفيحاء ب AL FAYHA 7261023 7261021 اربد
9 / المقدس رئيسيبيت ب [email protected] 7276555 7242521 BEIT EL MAKDES غداد شارعب & HIJAZI TRAVEL 7204986 7240721 لجيش شارعا
TOURISM
10 والسفر للسياحة حجازي ب 11 والعمرة للحج وحيدونال ب ALWAHEDON 7250665 7250665 غاندي اربدشارع-
12 والحج للسياحة الغزاوي مؤسسة ب [email protected] 7250020 7279685 ALGZAWI FOR TOURISM لزھراوي عمارةا almanasek@ index . Com .jo 7246711 7244711 AL MANASEK 13 السياحية للخدمات مؤسسةالمناسك ب
[email protected] 7242416 7242199 TELL TRAVEL & TOURISM حسين لملك شارعا
AGENCY
14 والسفر للسياحة التل وكالة ب 15 القدس وكالة ا [email protected] 7277607 7277607 JERUSALEM EXP AGENCY غداد شارعب [email protected] 7247187 7243995 ZAATRAH &CO TOURIST لبريد شارعا
AND TRAVEL A
16 زعترة وكالة ب [email protected] 7242733 7242733 AKKA TRAVEL &TOURISM ايف الميرن شا
AGENCY
17 عكا وكالة ب [email protected] 7252716 7279007 KHIRY AND AL SMADI لھاشمي شارعا
TRAVEL
18 والصمادي خيري ب 19 والعمرة للحج السادة ب AL SADAH 7241578 7241578 اربد
20 والسفر للسياحة الثقة وكالة ا [email protected] 7253316 7253315 TRUST TOURS AGENCY اربدش-عبدهلل الملك. 21 فروالس للسياحة رنا ب [email protected] 7245207 7245206 RANA TOURS اربد [email protected] 7424909 7242707 RAWABI -BAYT Al اربد
MAQEDS
22 المقدس بيت روابي شركة ب [email protected] 7271238 7271236 NEFERTITI TOURISM AND اربد
TRAVEL
23 والسفر للسياحة نفرتيتي ب 24 والسفر للسياحة أضواء ب ADWA A 7242381 7242381 طالل لملك اربدشارعا-
البلقاء الرقم بالعربية االسم الفئة باالنجليزية االسم تلفون فاكس E -MAIL العنوان 1 والحج والسفر للسياحة التوبة مؤسسة ب [email protected] 3532011 3550801 ATTAWBA السلط [email protected] 3554466 3553388 RAWABI -BAYT Al السلط
MAQEDS
2 المقدس بيت روابي شركة ب 3 فرع / مكة حياة شركة ب [email protected] 3555800 3552800 HYATT MAKKAH السلط
لرصيفة الرقم بالعربية االسم الفئة باالنجليزية االسم تلفون فاكس E -MAIL العنوان
لرئيسي االشارع-
الرصيفة
[email protected] 3753555 3753555 AL -DEFETAIN
TRAVEL TOURISM
SER.
السياحة لخدمات الضفتين مؤسسة ب
والسفر
1 SHTAT 3754640 3754640 الرصيفة
FOR TOURS & HAJJ
&UMRAH
2 والعمرة والحج للسياحة شتات ب 3 فرع /للسياحة مواكب ب MWAKEB 3747231 3747231 الرصيفة

421
الرمثا الرقم بالعربية االسم الفئة باالنجليزية االسم تلفون فاكس E -MAIL العنوان
1 والسفر للسياحة أضواء ADWA A 7385446 7385446 الرمثا
جرش قمالر بالعربية االسم الفئة باالنجليزية االسم تلفون فاكس E -MAIL العنوان
1 ةالسياحة للحج الزاھر رضا ب 6340880 6340880 جرش 2 والحج للسياحة مينا شركة ب [email protected] 6340889 6351889 MENA TOURS جرش
عجلون الرقم بالعربية االسم الفئة باالنجليزية االسم تلفون فاكس E -MAIL العنوان 1 والسفر للسياحة السالم ارض ب 6422300 642233 عجلون
المفرق الرقم بالعربية االسم الفئة باالنجليزية االسم تلفون فاكس E -MAIL العنوان 1 الشمالية البادية ب 26236698 26234172 المفرق
الزرقاء الرقم بالعربية االسم الفئة باالنجليزية االسم تلفون فاكس E -MAIL العنوان
& SUNDOS TRAVEL 3996776 3938996 رقاءالز
TOURISM
1 رئيسي والسفر للسياحة السندس ب & SUNDOS TRAVEL 3939192 3939196 الزرقاء
TOURISM
2 فرع للسياحة السندس ب 3 والحج والسفر للسياحة الراية ب [email protected] 3963353 3963353 ALRAYAH الزرقاء الحج ولخدمات والسفر للسياحة الغيث ب [email protected] 3964843 3964242 ALGHAITH الزرقاء
وا
4 [email protected] 3984014 3992744 AL SHAMMAS طالل لملك شا
TRAVEL & TOURISM
5 / الشماس رئيسي ب 6 والعمرة للحج النور مشاعل ب [email protected] 3659400 3659500 MSHAEL ALNOOR لتل وصفيا ش
7 والسفر للسياحة السراج مؤسسة ب 3966619 3988660 والحج للسياحة مكة ابراج موسسة ب ABRAJ MAKAH 3935000 3863639 لحاوز دوارا
والعمر
8 [email protected] 3996000 3938444 ESTITIAH FOR TOURS
& HAJJ &UMRAH
9 والحج والسفر للسياحة استيتية مؤسسة ب [email protected] 3981860 3981860 ALATAAA FOR
TOURS
10 والعمرة واللحج للسياحة العطاء شركة ب 11 للسياحة نخلة ب nak_tours@hotmail .com 3931910 3936960 NAKHLEH TOURS لقديم عمانا الزرقاءش-
12 / للسياحة فرعنخلة ب nak_tours@hotmail .com 3931414 3931313 NAKHLEH TOURS الزرقاء [email protected] 3991858 3982516 JERUSALEM EXP طالل لملك شا
AGENCY
13 القدس وكالة ا 14 زعترة لةوكا ب [email protected] 3908939 3983089 ZATARAH CO . T. T لقديم عمانا الزرقاءش- [email protected].,jo 3824446 38424445 CAPRI TRAVEL الرزقاءالضليل-
&TOURISM
15 والشحن والسفر للسياحة كابري ب SAFEIR AL ARABI 3974040 3974040 الزرقاء
COMP.
16 والعمرة للحج العربي السفير ب

422
البتراء الرقم بالعربية االسم الفئة باالنجليزية االسم تلفون كسفا E -MAIL العنوان
1 البدوية ب [email protected] 2156931 2157099 LA BEDUINA موسى وادي 2 والسفر للسياحة البدول ب [email protected] 2157016 2157016 ALBEDOOL TRAVEL صيحون ام / موسى وادي 3 االنباط جوھرة ب [email protected] 2156994 20157100 JOHARET AL ANBAT موسى وادي JO@JORDANEXPERIENCE .COM 2155004 2155005 JORDAN موسى وادي
EXPERIENCE
4 للسياحة االردن خبراء ب 5 للسياحة زمان ب [email protected] 2157722 2157723 ZAMAN TOURS موسى وادي 6 البتراء قمر ب [email protected] 2156666 2156665 PETRA MOON موسى وادي [email protected] 2156435 2155412 PETRA CARAVAN موسى وادي
TOURS
7 البتراء قوافل ب [email protected] 2157317 2157317 JORDAN موسى وادي
INSPIRATION
8 للسياحة االردن وحي ب 9 البتراء ليالي ب [email protected] 2154015 2154010 PETRA NIGHTS موسى وادي 10 للسياحة الجميل االردن ب [email protected] 2154999 795581644 JORDAN Beauty Tours موسى وادي 11 للسياحة الرخاء نقرو ب [email protected] 2154441 2154440 CORNA COPIA TOURS موسى وادي 12 والسفر للسياحة االردن ب [email protected] 5154666 2154600 JORDAN TOURS موسى وادي 13 للسياحة الرفيد مؤسسة ب [email protected] 2154135 2154135 RAFEED TRAVEL موسى وادي 14 والسفر للسياحة رامي ب [email protected] 2154551 2154551 RAAMI TOURS صيحون ام / موسى وادي 15 والسفر للسياحة الفنان ب [email protected] 2154561 2157561 ARTIST TOURS موسى وادي [email protected] 2155400 2155200 SEE JORDAN FOR موسى وادي
TOURS & TRAVEL
16 والسفر لسياحةل االردن شاھد ب 17 والسفر للسياحة الصحراء عشاق ب [email protected] 2155955 2155955 DESERT PARAMOURS موسى وادي 18 والسفر للسياحة ايدوم ب [email protected] 2155355 2155355 EDOM موسى وادي 19 السياحة لخدمات فالحات ب [email protected] 2155798 2155799 JEZRA TRAVEL موسى وادي
رم وادي الرقم بالعربية االسم الفئة باالنجليزية االسم تلفون فاكس E -MAIL العنوان
[email protected] 03/20148889 796482801 JORDAN TRACKS 1 االردن اثر ب
الكرك الرقم بالعربية االسم الفئة باالنجليزية سماال تلفون فاكس E -MAIL العنوان 1 الطيار جعفر ب [email protected] 2351281 2355983 JAFAR AL TAYYAR االيطالي الشارع
2 والعمرة للحج الجنوب موسسة 2353721 2353721
مأدبا الرقم بالعربية االسم الفئة باالنجليزية االسم تلفون فاكس E -MAIL العنوان
1 الوادي ب [email protected] 05/3241112 05/3241113 WADI TOURS لنزھة ا شارع– مأدبا لقدس ا شارع-
مادبا
05/3246655 05/3246655 ABU KAFF 2 والسياحة والعمرة للحج كف ابو ب 3 السياحة والعمرة الماسيةللحج ب [email protected] 05/3253860 05/3253860 لبتراء ا شارع
4 والعمرة للحج الرواجيح شركة ب 3244626 3244626 5 والسفر للسياحة ترحال ب [email protected] 3251005 3251008 TERHAAL TRAVEL مادبا 6 فرع / مكة حياة شركة ب [email protected] 3247094 3247094 HYATT MAKKAH مادبا
والعمرة والحج للسياحة السراج ب 3253994 3253995
423
العقبة الرقم بالعربية االسم الفئة باالنجليزية االسم تلفون فاكس E -MAIL العنوان
2033631 2015165 AQUAMARINA 1 اكوامارينا 2015654 2022655 GOLDEN HOLIDAY 2 الذھبية االجازة [email protected] 2018701 2018700 JORDAN SINAI HOTELS
& TOURS
3 والسياحة للفنادق سينا االردن [email protected] 2035950 2039009 BRIDGE 4 الجسر [email protected] 2014338 2014337 AL -JAWAD T.T 5 الجواد 2016603 2016601 UNITED CO. FOR TOURS 6 رئيسي / الموحدة الشركة 2016603 2016601 UNITED CO. FOR TOURS 7 الموحدة الشركة 2018837 2016887 AL KARNAK 8 رئيسي / الكرنك 2018837 2016887 AL KARNAK 9 الكرنك 2019085 2030822 ORBIT TOURS 10 رئيسي / المحور 2019085 2030822 ORBIT TOURS 11 المحور 2013841 2013841 HILLAWI TOURS 12 السياحية للخدمات الھالوي [email protected] 2014217 AMIN KAWAR 13 قعوار أمين 2015003 2015003 PALKEES TOURS 14 بلقيس [email protected] 2015316 2013757 INTERNATIONAL
TRADERS
15 تريدرز [email protected] 2013377 2013377 DALLY 16 داليا 2014133 2014131 TRANS DESERT AND
SEA
17 والبحار الصحراء عبر 2013392 2013391 GREEN MEADOWS 18 الخضراء المروج. ش 2033711 2033711 WADI RUM DESRT 19 رم وادي صحراء 2018900 2032996 SAHARA T.T 20 صحارى 2013055 2013055 TABA TOURS 21 طابا [email protected] 2022990 2012299 Via Jordan 22 االردن خالل 2017676 2017676 ALBER AND AL TAQWA 23 والسياحة والعمرة للحج والتقوى البر 2030788 2030188 ADONIS 24 ادونيس [email protected] 2062440 2062444 AQABA SKY TRAVEL
&TOURISM
25 والسفر للسياحة العقبة سماء 2013047 2013046 PAN EAST 26 الدولية للسياحة الشرق حول ب 2013111 MOTION TOURS 27 التحرك [email protected] 2019461 2022801 NYAZI TOURS 28 نيازي 29 والسفر للسياحة القمة ب 2050420 2050430 2058816 2018816 ARTIS SPACE 30 والسفر للسياحة الفضاء فن ب 2030690 2030690 PERFECT LIFE RTAVEL
AND TOURISM
31 والسفر للسياحة الطيبة الحياة ب 2058022 2058011 TRUST TOURSM 32 والسفر للسياحة الثقة ا
424
Appendix A-2
English Questionnaire
E-commerce Adoption among Travel Agents’ Owners/Managers in Jordan
Dear Manager/Owner
This questionnaire is a part of my PhD research at Cardiff Metropolitan University.
This research entitled E-commerce adoption among Travel Agents’ owners/managers
in Jordan is attempting to study the use of e-commerce among Jordanian travel agents
in order to have a better explanation of the factors that affect decision makers toward
e-commerce adoption levels among these companies. E-commerce adoption gives
opportunities to travel agents to survive in the global travel market at the time
traditional travel agents are facing a threat to disintermediation if they did not have
any future actions regarding to e-commerce adoption. The results of this work would
fill the gap by developing a model to explain how owners/managers of small and
medium sized travel agencies in Jordan might adopt levels of e-commerce to facilitate
decision-making and business operations.
Your participation is voluntary, and you are free to withdraw at any time without
giving any reasons. Filling the questionnaire will not take more than 20 minutes.
There are no right or a wrong answer, your answers is your own opinion. I would be
glad to answer all questions related to the questionnaire. Your participation in this
research is very important for successful completion of this research.
425
Your identity will be anonymous and I will assure you that your responses and
company information will be kept in the strictest confidence. I will provide you the
results of this research if you indicate your interest. You participation in this survey
will be accepted as your consent
Thank you in advance for your cooperation and effort in completing this
questionnaire.
If you have any questions about the research or how I intend to conduct the study,
please contact me.
Mohammad Alrousan ,PhD student.
e-mail:[email protected]
Mobile No: UK - +44 (0) 779 490 7794,
Jordan - +962 (0) 795 226 105
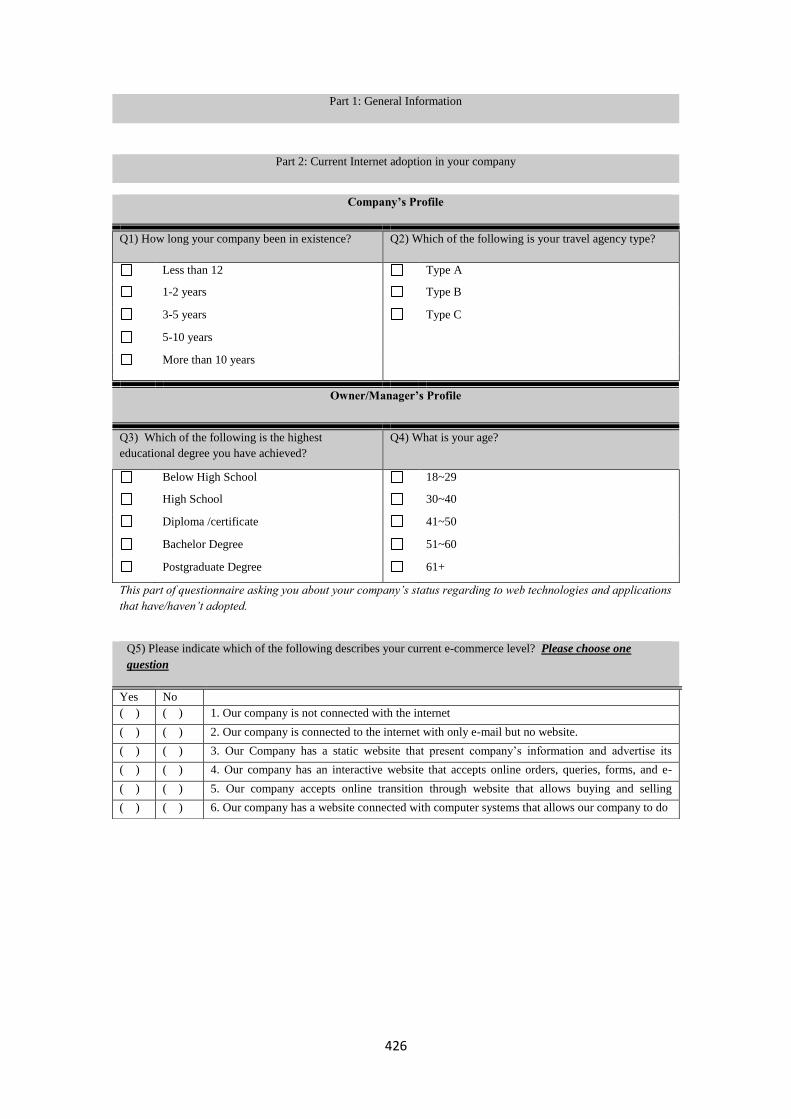
426
Part 1: General Information
This part of questionnaire asking you about your company’s status regarding to web technologies and applications
that have/haven’t adopted.
This part of questionnaire asking about yourself and your company’s profile.
Company’s Profile
Q1) How long your company been in existence? Q2) Which of the following is your travel agency type?
Less than 12 Type A
1-2 years Type B
3-5 years Type C
5-10 years
More than 10 years
Owner/Manager’s Profile
Q3) Which of the following is the highest
educational degree you have achieved?
Q4) What is your age?
Below High School 18~29
High School 30~40
Diploma /certificate 41~50
Bachelor Degree 51~60
Postgraduate Degree 61+
Part 2: Current Internet adoption in your company
Q5) Please indicate which of the following describes your current e-commerce level? Please choose one
question
Yes No
( ) ( ) 1. Our company is not connected with the internet
( ) ( ) 2. Our company is connected to the internet with only e-mail but no website.
( ) ( ) 3. Our Company has a static website that present company’s information and advertise its
products with one way communication using e-mail and without any interactivity. ( ) ( ) 4. Our company has an interactive website that accepts online orders, queries, forms, and e-
mails from customers and suppliers but online payment is not integrated on the website. ( ) ( ) 5. Our company accepts online transition through website that allows buying and selling
products and services to customers and suppliers including customer services. ( ) ( ) 6. Our company has a website connected with computer systems that allows our company to do
the most of business processes such as accounting system, inventory system, CRM, and any
traditional paperwork to electronic one.
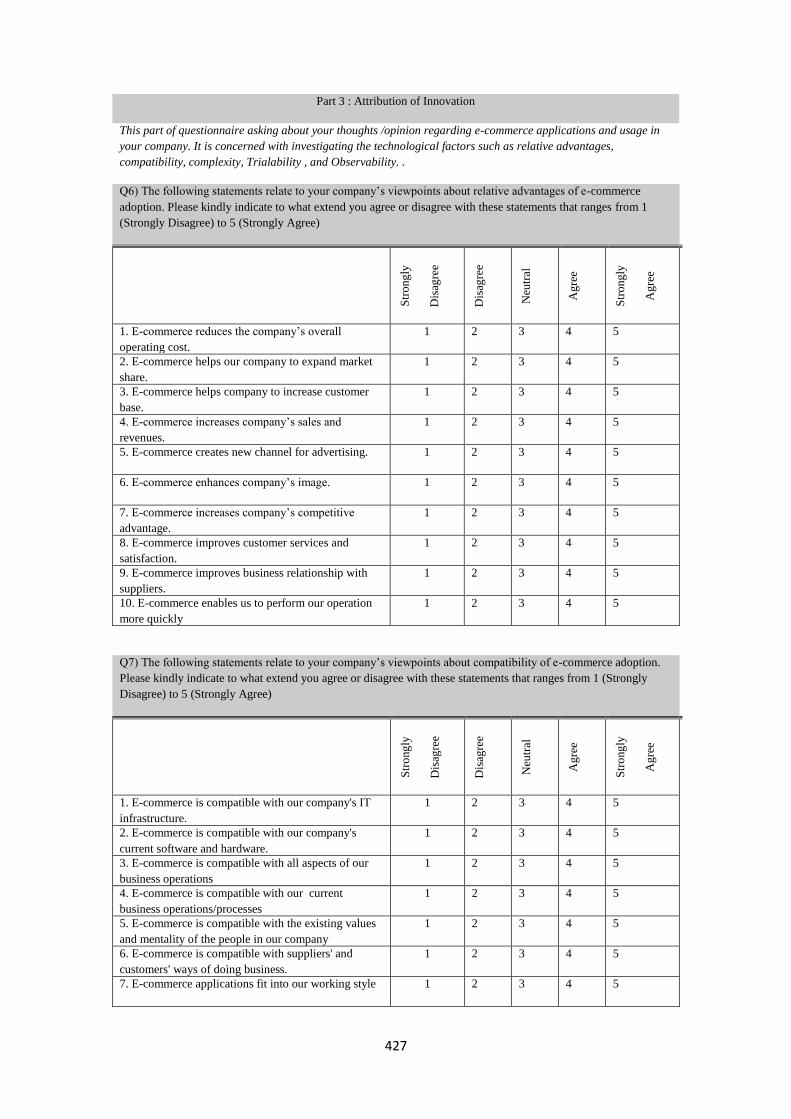
427
Part 3 : Attribution of Innovation
This part of questionnaire asking about your thoughts /opinion regarding e-commerce applications and usage in
your company. It is concerned with investigating the technological factors such as relative advantages,
compatibility, complexity, Trialability , and Observability. .
Q6) The following statements relate to your company’s viewpoints about relative advantages of e-commerce
adoption. Please kindly indicate to what extend you agree or disagree with these statements that ranges from 1
(Strongly Disagree) to 5 (Strongly Agree)
Str
ong
ly
Dis
agre
e
Dis
agre
e
Neu
tral
Ag
ree
Str
ong
ly
Ag
ree
1. E-commerce reduces the company’s overall
operating cost.
1 2 3 4 5
2. E-commerce helps our company to expand market
share.
1 2 3 4 5
3. E-commerce helps company to increase customer
base.
1 2 3 4 5
4. E-commerce increases company’s sales and
revenues.
1 2 3 4 5
5. E-commerce creates new channel for advertising. 1 2 3 4 5
6. E-commerce enhances company’s image.
1 2 3 4 5
7. E-commerce increases company’s competitive
advantage.
1 2 3 4 5
8. E-commerce improves customer services and
satisfaction.
1 2 3 4 5
9. E-commerce improves business relationship with
suppliers.
1 2 3 4 5
10. E-commerce enables us to perform our operation
more quickly
1 2 3 4 5
Q7) The following statements relate to your company’s viewpoints about compatibility of e-commerce adoption.
Please kindly indicate to what extend you agree or disagree with these statements that ranges from 1 (Strongly
Disagree) to 5 (Strongly Agree)
Str
ong
ly
Dis
agre
e
Dis
agre
e
Neu
tral
Ag
ree
Str
ong
ly
Ag
ree
1. E-commerce is compatible with our company's IT
infrastructure.
1 2 3 4 5
2. E-commerce is compatible with our company's
current software and hardware.
1 2 3 4 5
3. E-commerce is compatible with all aspects of our
business operations
1 2 3 4 5
4. E-commerce is compatible with our current
business operations/processes
1 2 3 4 5
5. E-commerce is compatible with the existing values
and mentality of the people in our company
1 2 3 4 5
6. E-commerce is compatible with suppliers' and
customers' ways of doing business.
1 2 3 4 5
7. E-commerce applications fit into our working style 1 2 3 4 5
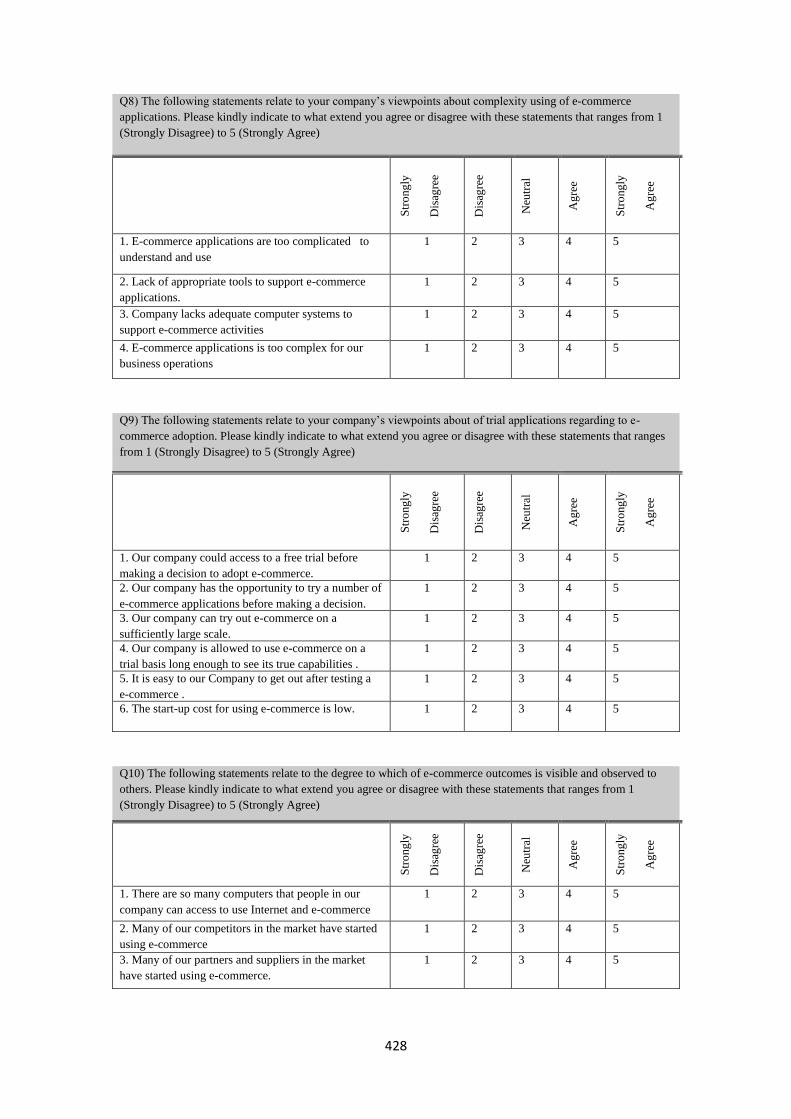
428
Q8) The following statements relate to your company’s viewpoints about complexity using of e-commerce
applications. Please kindly indicate to what extend you agree or disagree with these statements that ranges from 1
(Strongly Disagree) to 5 (Strongly Agree)
Str
ong
ly
Dis
agre
e
Dis
agre
e
Neu
tral
Ag
ree
Str
ong
ly
Ag
ree
1. E-commerce applications are too complicated to
understand and use
1 2 3 4 5
2. Lack of appropriate tools to support e-commerce
applications.
1 2 3 4 5
3. Company lacks adequate computer systems to
support e-commerce activities
1 2 3 4 5
4. E-commerce applications is too complex for our
business operations
1 2 3 4 5
Q9) The following statements relate to your company’s viewpoints about of trial applications regarding to e-
commerce adoption. Please kindly indicate to what extend you agree or disagree with these statements that ranges
from 1 (Strongly Disagree) to 5 (Strongly Agree)
Str
ong
ly
Dis
agre
e
Dis
agre
e
Neu
tral
Ag
ree
Str
ong
ly
Ag
ree
1. Our company could access to a free trial before
making a decision to adopt e-commerce.
1 2 3 4 5
2. Our company has the opportunity to try a number of
e-commerce applications before making a decision.
1 2 3 4 5
3. Our company can try out e-commerce on a
sufficiently large scale.
1 2 3 4 5
4. Our company is allowed to use e-commerce on a
trial basis long enough to see its true capabilities .
1 2 3 4 5
5. It is easy to our Company to get out after testing a
e-commerce .
1 2 3 4 5
6. The start-up cost for using e-commerce is low. 1 2 3 4 5
Q10) The following statements relate to the degree to which of e-commerce outcomes is visible and observed to
others. Please kindly indicate to what extend you agree or disagree with these statements that ranges from 1
(Strongly Disagree) to 5 (Strongly Agree)
Str
ong
ly
Dis
agre
e
Dis
agre
e
Neu
tral
Ag
ree
Str
ong
ly
Ag
ree
1. There are so many computers that people in our
company can access to use Internet and e-commerce
1 2 3 4 5
2. Many of our competitors in the market have started
using e-commerce
1 2 3 4 5
3. Many of our partners and suppliers in the market
have started using e-commerce.
1 2 3 4 5
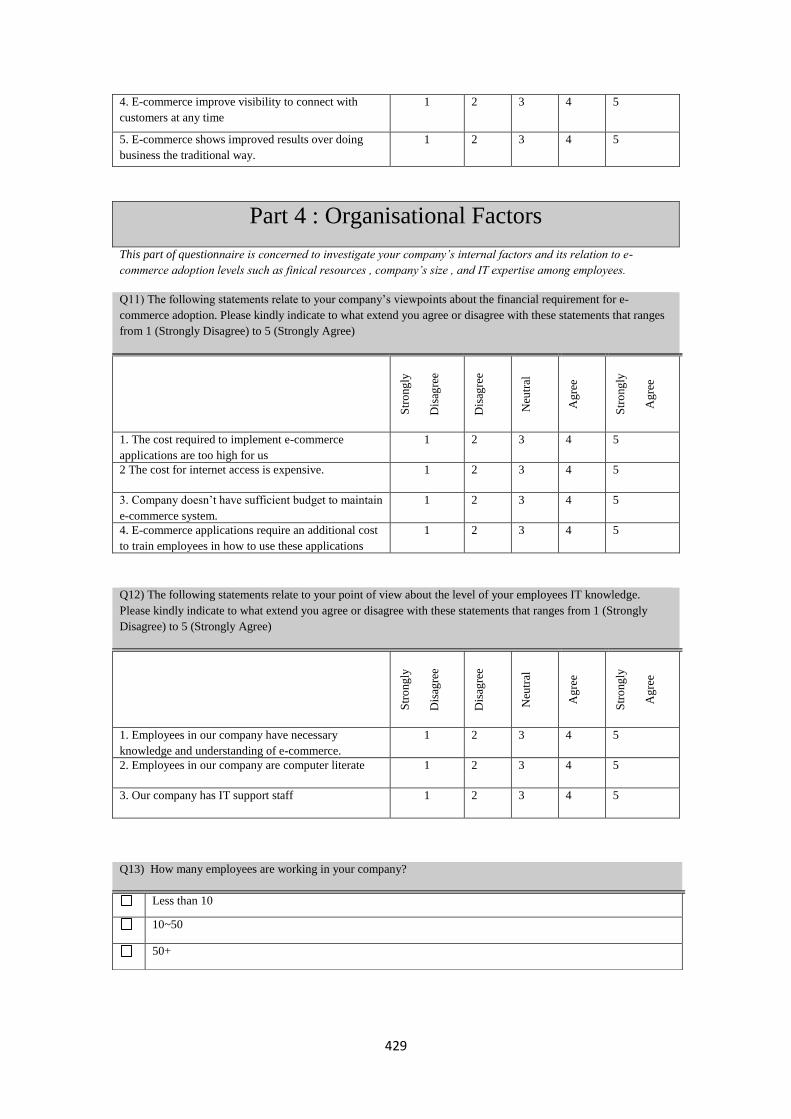
429
4. E-commerce improve visibility to connect with
customers at any time
1 2 3 4 5
5. E-commerce shows improved results over doing
business the traditional way.
1 2 3 4 5
Part 4 : Organisational Factors
This part of questionnaire is concerned to investigate your company’s internal factors and its relation to e-
commerce adoption levels such as finical resources , company’s size , and IT expertise among employees.
Q11) The following statements relate to your company’s viewpoints about the financial requirement for e-
commerce adoption. Please kindly indicate to what extend you agree or disagree with these statements that ranges
from 1 (Strongly Disagree) to 5 (Strongly Agree)
S
tro
ng
ly
Dis
agre
e
Dis
agre
e
Neu
tral
Ag
ree
Str
ong
ly
Ag
ree
1. The cost required to implement e-commerce
applications are too high for us
1 2 3 4 5
2 The cost for internet access is expensive. 1 2 3 4 5
3. Company doesn’t have sufficient budget to maintain
e-commerce system.
1 2 3 4 5
4. E-commerce applications require an additional cost
to train employees in how to use these applications
1 2 3 4 5
Q12) The following statements relate to your point of view about the level of your employees IT knowledge.
Please kindly indicate to what extend you agree or disagree with these statements that ranges from 1 (Strongly
Disagree) to 5 (Strongly Agree)
Str
ong
ly
Dis
agre
e
Dis
agre
e
Neu
tral
Ag
ree
Str
ong
ly
Ag
ree
1. Employees in our company have necessary
knowledge and understanding of e-commerce.
1 2 3 4 5
2. Employees in our company are computer literate 1 2 3 4 5
3. Our company has IT support staff 1 2 3 4 5
Q13) How many employees are working in your company?
Less than 10
10~50
50+
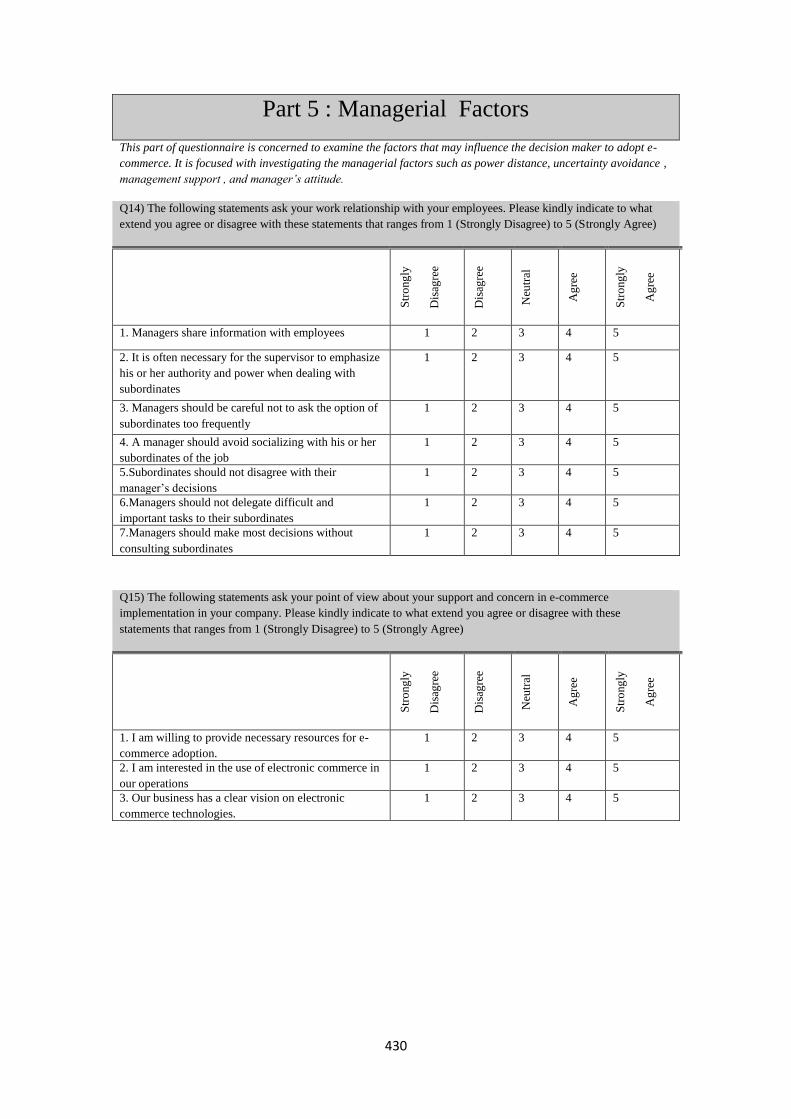
430
Part 5 : Managerial Factors
This part of questionnaire is concerned to examine the factors that may influence the decision maker to adopt e-
commerce. It is focused with investigating the managerial factors such as power distance, uncertainty avoidance ,
management support , and manager’s attitude.
Q14) The following statements ask your work relationship with your employees. Please kindly indicate to what
extend you agree or disagree with these statements that ranges from 1 (Strongly Disagree) to 5 (Strongly Agree)
Str
ong
ly
Dis
agre
e
Dis
agre
e
Neu
tral
Ag
ree
Str
ong
ly
Ag
ree
1. Managers share information with employees 1 2 3 4 5
2. It is often necessary for the supervisor to emphasize
his or her authority and power when dealing with
subordinates
1 2 3 4 5
3. Managers should be careful not to ask the option of
subordinates too frequently
1 2 3 4 5
4. A manager should avoid socializing with his or her
subordinates of the job
1 2 3 4 5
5.Subordinates should not disagree with their
manager’s decisions
1 2 3 4 5
6.Managers should not delegate difficult and
important tasks to their subordinates
1 2 3 4 5
7.Managers should make most decisions without
consulting subordinates
1 2 3 4 5
Q15) The following statements ask your point of view about your support and concern in e-commerce
implementation in your company. Please kindly indicate to what extend you agree or disagree with these
statements that ranges from 1 (Strongly Disagree) to 5 (Strongly Agree)
Str
ong
ly
Dis
agre
e
Dis
agre
e
Neu
tral
Ag
ree
Str
ong
ly
Ag
ree
1. I am willing to provide necessary resources for e-
commerce adoption.
1 2 3 4 5
2. I am interested in the use of electronic commerce in
our operations
1 2 3 4 5
3. Our business has a clear vision on electronic
commerce technologies.
1 2 3 4 5

431
Q16) The following statements look for your opinion about dealing with uncertain situations regarding to e-
commerce implementation. Please kindly indicate to what extend you agree or disagree with these statements that
ranges from 1 (Strongly Disagree) to 5 (Strongly Agree)
Str
ong
ly
Dis
agre
e
Dis
agre
e
Neu
tral
Ag
ree
Str
ong
ly
Ag
ree
1. I am not willing to take risk to adopt e-commerce
application in my business.
1 2 3 4 5
2. I am not able to accept change from traditional
business process to electronic one.
1 2 3 4 5
3.I don’t have confidence about the security of e-
commerce transactions
1 2 3 4 5
Q17) The following statements relate to your feeling toward internet and e-commence applications. Please kindly
indicate to what extend you agree or disagree with these statements that ranges from 1 (Strongly Disagree) to 5
(Strongly Agree)
Str
ong
ly
Dis
agre
e
Dis
agre
e
Neu
tral
Ag
ree
Str
ong
ly
Ag
ree
I have fun interacting with the Internet 1 2 3 4 5
Using the web provides me with a lot of enjoyment 1 2 3 4 5
I like the idea of adopting e-commerce in my company 1 2 3 4 5
I think that e-commerce will be adopted in most of
SMEs in the near future.
1 2 3 4 5
I think adopting e-commerce would beneficial to my
company
1 2 3 4 5
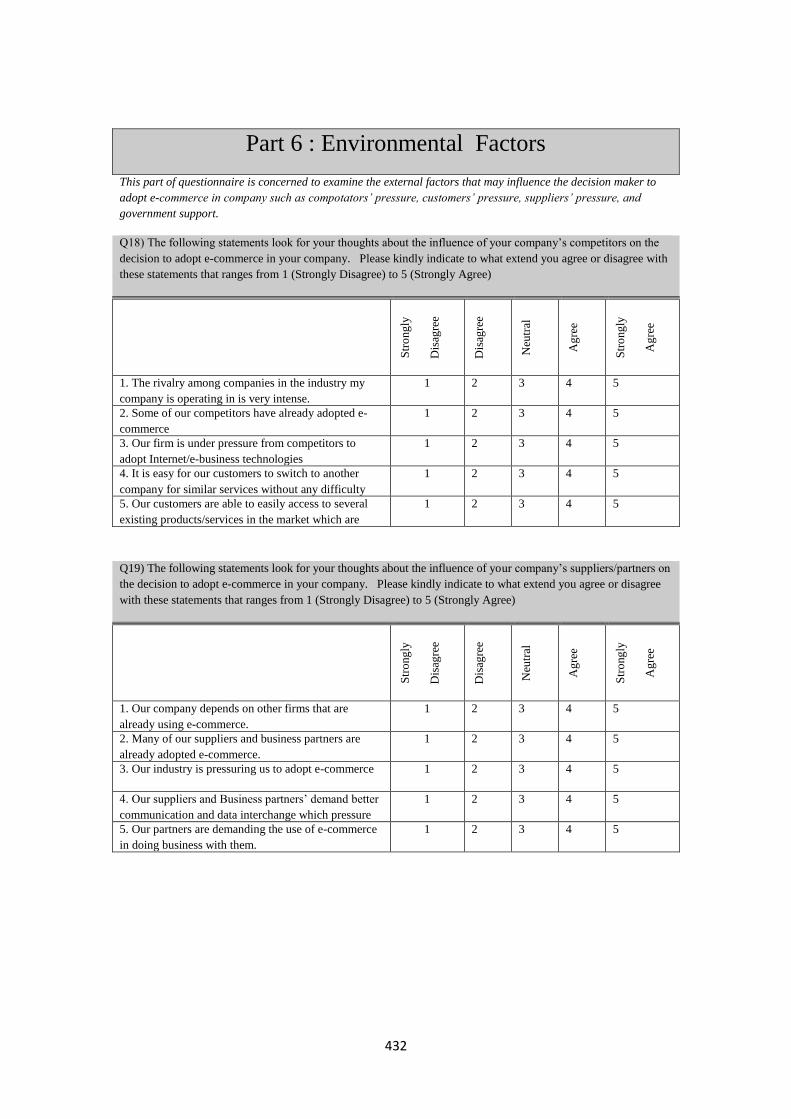
432
Part 6 : Environmental Factors
This part of questionnaire is concerned to examine the external factors that may influence the decision maker to
adopt e-commerce in company such as compotators’ pressure, customers’ pressure, suppliers’ pressure, and
government support.
Q18) The following statements look for your thoughts about the influence of your company’s competitors on the
decision to adopt e-commerce in your company. Please kindly indicate to what extend you agree or disagree with
these statements that ranges from 1 (Strongly Disagree) to 5 (Strongly Agree)
Str
ong
ly
Dis
agre
e
Dis
agre
e
Neu
tral
Ag
ree
Str
ong
ly
Ag
ree
1. The rivalry among companies in the industry my
company is operating in is very intense.
1 2 3 4 5
2. Some of our competitors have already adopted e-
commerce
1 2 3 4 5
3. Our firm is under pressure from competitors to
adopt Internet/e-business technologies
1 2 3 4 5
4. It is easy for our customers to switch to another
company for similar services without any difficulty
1 2 3 4 5
5. Our customers are able to easily access to several
existing products/services in the market which are
different from ours but perform the same functions
1 2 3 4 5
Q19) The following statements look for your thoughts about the influence of your company’s suppliers/partners on
the decision to adopt e-commerce in your company. Please kindly indicate to what extend you agree or disagree
with these statements that ranges from 1 (Strongly Disagree) to 5 (Strongly Agree)
Str
ong
ly
Dis
agre
e
Dis
agre
e
Neu
tral
Ag
ree
Str
ong
ly
Ag
ree
1. Our company depends on other firms that are
already using e-commerce.
1 2 3 4 5
2. Many of our suppliers and business partners are
already adopted e-commerce.
1 2 3 4 5
3. Our industry is pressuring us to adopt e-commerce 1 2 3 4 5
4. Our suppliers and Business partners’ demand better
communication and data interchange which pressure
us to adopt e-commerce.
1 2 3 4 5
5. Our partners are demanding the use of e-commerce
in doing business with them.
1 2 3 4 5
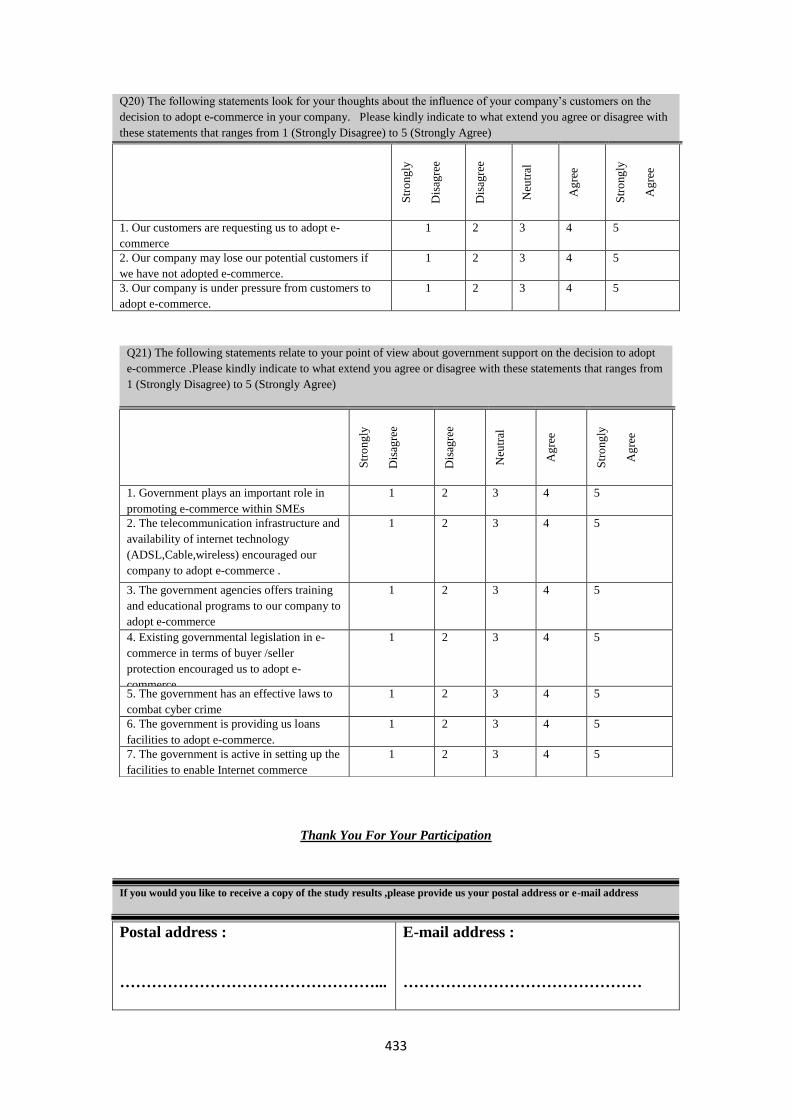
433
Q20) The following statements look for your thoughts about the influence of your company’s customers on the
decision to adopt e-commerce in your company. Please kindly indicate to what extend you agree or disagree with
these statements that ranges from 1 (Strongly Disagree) to 5 (Strongly Agree)
Str
ong
ly
Dis
agre
e
Dis
agre
e
Neu
tral
Ag
ree
Str
ong
ly
Ag
ree
1. Our customers are requesting us to adopt e-
commerce
1 2 3 4 5
2. Our company may lose our potential customers if
we have not adopted e-commerce.
1 2 3 4 5
3. Our company is under pressure from customers to
adopt e-commerce.
1 2 3 4 5
Q21) The following statements relate to your point of view about government support on the decision to adopt
e-commerce .Please kindly indicate to what extend you agree or disagree with these statements that ranges from
1 (Strongly Disagree) to 5 (Strongly Agree)
Str
ong
ly
Dis
agre
e
Dis
agre
e
Neu
tral
Ag
ree
Str
ong
ly
Ag
ree
1. Government plays an important role in
promoting e-commerce within SMEs
1 2 3 4 5
2. The telecommunication infrastructure and
availability of internet technology
(ADSL,Cable,wireless) encouraged our
company to adopt e-commerce .
1 2 3 4 5
3. The government agencies offers training
and educational programs to our company to
adopt e-commerce
1 2 3 4 5
4. Existing governmental legislation in e-
commerce in terms of buyer /seller
protection encouraged us to adopt e-
commerce
1 2 3 4 5
5. The government has an effective laws to
combat cyber crime
1 2 3 4 5
6. The government is providing us loans
facilities to adopt e-commerce.
1 2 3 4 5
7. The government is active in setting up the
facilities to enable Internet commerce
1 2 3 4 5
Thank You For Your Participation
Postal address :
…………………………………………...
…………………………………………...
…………………………………………...
E-mail address :
………………………………………
If you would you like to receive a copy of the study results ,please provide us your postal address or e-mail address

434
Appendix A-3
Initial Version of Arabic Questionnaire
تبني التجارة اإللكترونية من قبل مدراء ومالك وكاآلت السفر في األردن
عزيزي المالك / المدير
Cardiff Metropolitanدرجة الدكتوراه في جامعة كارديف مترويوليتان لأن ھذه االستبانة جزء من بحثي
University إللكترونية من قبل مدراء ومالك وكاالت السفر في ھذا البحث بعنوان تبني التجارة ا . في المملكة المتحدة/برطانيا
األردن وھي محاولة لدراسة استتخدام التجارة اإللكترونية عبر وكاالت السفر األردنية من أجل الحصول على أفضل االيضاحات
ني التجارة اإللكترونية للعوامل المؤثرة على صناع القرار بإتجاه التجارة اإللكترونية ومستويات تبنيھا عبر ھذه الشركات. أن تب
لوكاالت السفر للحافظ على بقائھا في السوق السياحة العالمي في حين أن الوكالء التقليديون يواجھون تھديد يعطي فرصا
نموذج إن نتائج ھذا العمل سيجسر الھوة بتطوير الالوسائطية أوالزوال إذا لم يكن لديھم أفعاال مستقبلية تجاه التجارة اإللكترونية.
يوضح الكيفية للمالك / المدراء لوكاالت السفر صغيرة ومتوسطة الحجم في األردن من احتمالية مدى درجة تبني التجارة االلكترونية
.عملية صنع القرار والعمليات التجارية لتسھيل
لن يستغرق أكثر من أن مشاركتك تطوعية، ولك الحرية باالنسحاب في أي وقت دون أبداء األسباب.إن تعبئة االستبيان
دقيقة وال يوجد إجابات صحيحة أو خاطئة، وإجابتك ھي رأيك. ٢٠
سوف أكون سعيدا إذا اجبت عن جميع األسئلة المتعلقة باالستبيان. أن مشاركتك في ھذا البحث مھمة جدا إلتمام ھذا
البحث بنجاح.
كتك ستبقى محافظ عليھا بأعلى درجات السرية. ھويتك ستبقى غير معروفة وأوكد لك بأن إستجاباتك ومعلومات شر
وسأزودك بنتائج ھذا البحث إذا اشعرتني بذلك.إن تعبئة ھذا االستبيان ستكون موافقة على مشاركتكم .
شكرا لكم مقدما لتعاونكم وجھدكم في تعبئة ھذا االستبيان.
أو ماذا أنوي عمله من ھذه الدراسة . الرجاء عدم التردد في التواصل معي إذا كان لديك أي أسئلة عن البحث
محمد الروسان ـ طالب دكتوراه
جامعة كارديف متروبوايتان
٠٠۹٦٢٧۹٨٦٨٨٧٣١االردن: –موبايل
٠٠٤٤٧٧۹٤۹٠٧٧۹٤بريطانيا: –موبايل
.cardiffmet.ac.uk@20024308 البريدااللكتروني:
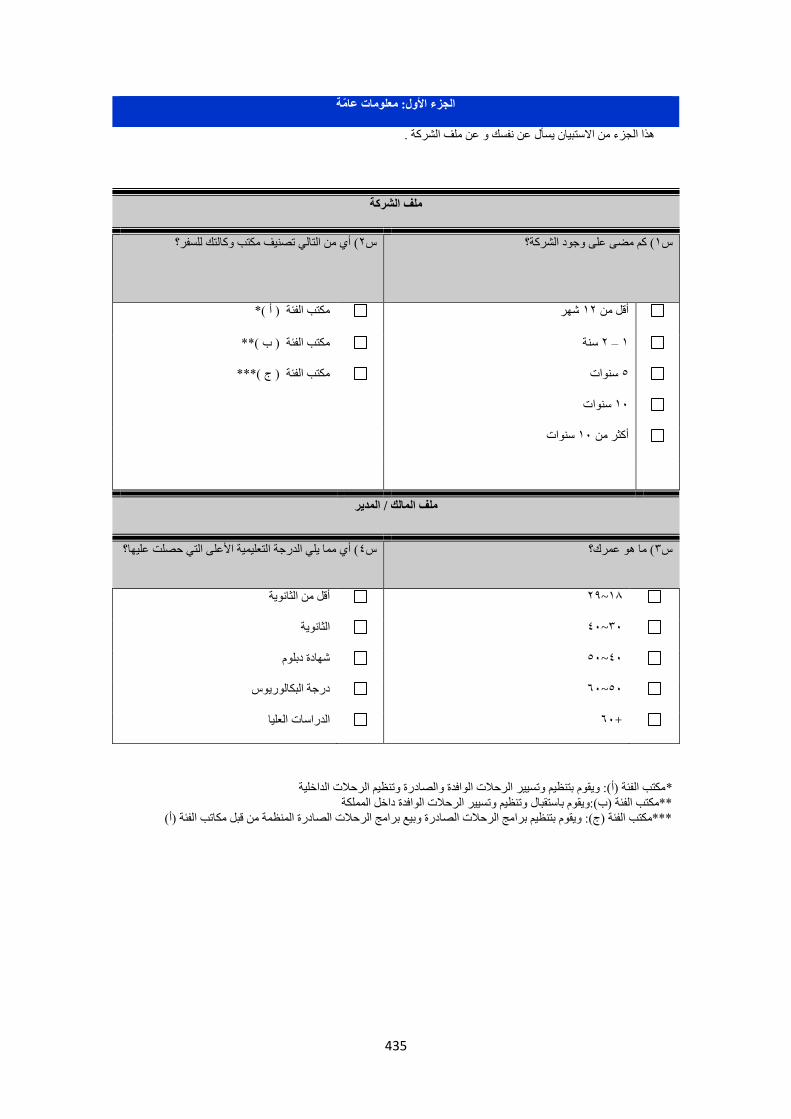
435
.نفسك و عن ملف الشركة يسأل عن هذا الجزء من االستبيان
مكتب الفئة )أ(: ويقوم بتنظيم وتسيير الرحالت الوافدة والصادرة وتنظيم الرحالت الداخلية *
مملكة**مكتب الفئة )ب(:ويقوم باستقبال وتنظيم وتسيير الرحالت الوافدة داخل ال
***مكتب الفئة )ج(: ويقوم بتنظيم برامج الرحالت الصادرة وبيع برامج الرحالت الصادرة المنظمة من قبل مكاتب الفئة )أ(
الجزء األول: معلومات عامة
ملف الشركة
( أي من التالي تصنيف مكتب وكالتك للسفر؟٢س
( كم مضى على وجود الشركة؟ ١س
شهر ١٢أقل من مكتب الفئة ) أ (*
نةس ٢ – ١ مكتب الفئة ) ب (**
سنوات ٥ مكتب الفئة ) ج (***
سنوات ١٠
سنوات ١٠أكثر من
ملف المالك / المدير
يها؟( أي مما يلي الدرجة التعليمية األعلى التي حصلت عل٤س
( ما هو عمرك؟٣س
١٨~٢٩ أقل من الثانوية
٣٠~٤٠ الثانوية
٤٠~٥٠ شهادة دبلوم
٥٠~٦٠ درجة البكالوريوس
+٦٠ الدراسات العليا
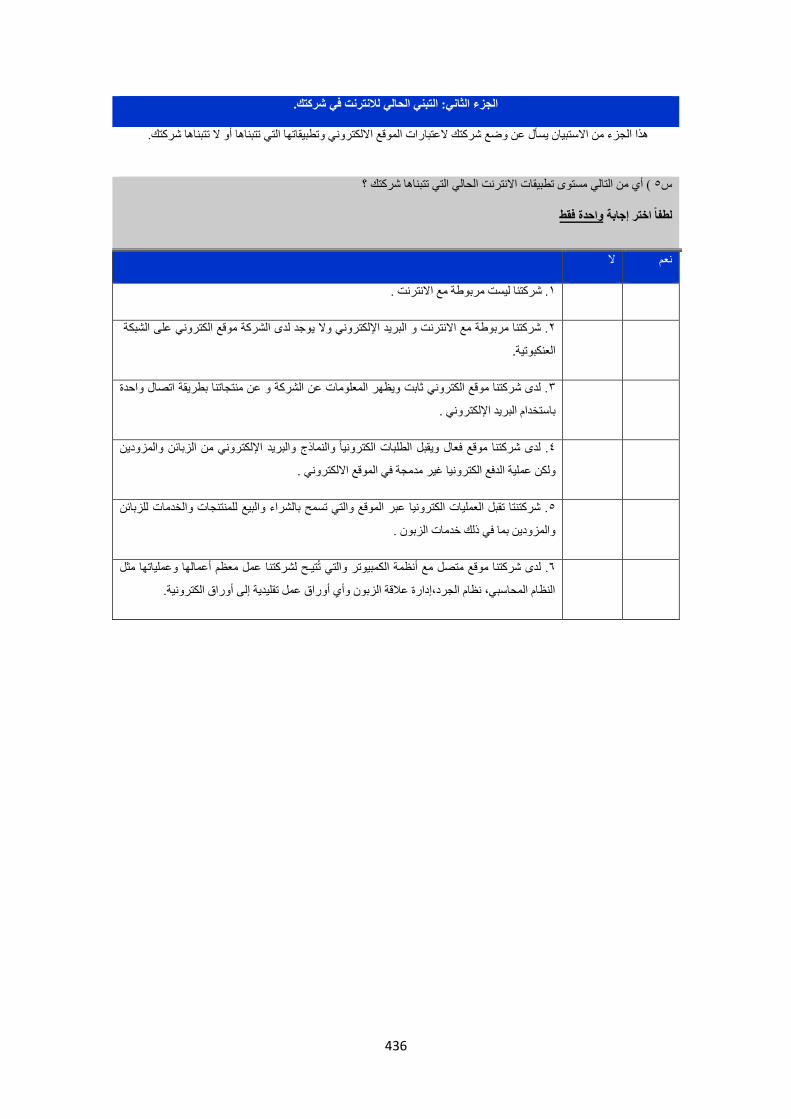
436
تتبناها أو ال تتبناها شركتك.هذا الجزء من االستبيان يسأل عن وضع شركتك العتبارات الموقع االلكتروني وتطبيقاتها التي
الجزء الثاني: التبني الحالي لالنترنت في شركتك.
مستوى تطبيقات االنترنت الحالي التي تتبناها شركتك ؟أي من التالي ( ٥س
لطفا اختر إجابة واحدة فقط
نعم ال
. شركتنا ليست مربوطة مع االنترنت .١
الشبكة على . شركتنا مربوطة مع االنترنت و البريد اإللكتروني وال يوجد لدى الشركة موقع الكتروني٢
.العنكبوتية
. لدى شركتنا موقع الكتروني ثابت ويظهر المعلومات عن الشركة و عن منتجاتنا بطريقة اتصال واحدة ٣
باستخدام البريد اإللكتروني .
والنماذج والبريد اإللكتروني من الزبائن والمزودين ٤ . لدى شركتنا موقع فعال ويقبل الطلبات الكترونيا
لية الدفع الكترونيا غير مدمجة في الموقع االلكتروني .ولكن عم
. شركتنتا تقبل العمليات الكترونيا عبر الموقع والتي تسمح بالشراء والبيع للمنتنجات والخدمات للزبائن ٥
والمزودين بما في ذلك خدمات الزبون .
ا عمل معظم أعمالها وعملياتها مثل . لدى شركتنا موقع متصل مع أنظمة الكمبيوتر والتي تتيـح لشركتن٦
النظام المحاسبي، نظام الجرد،إدارة عالقة الزبون وأي أوراق عمل تقليدية إلى أوراق الكترونية.
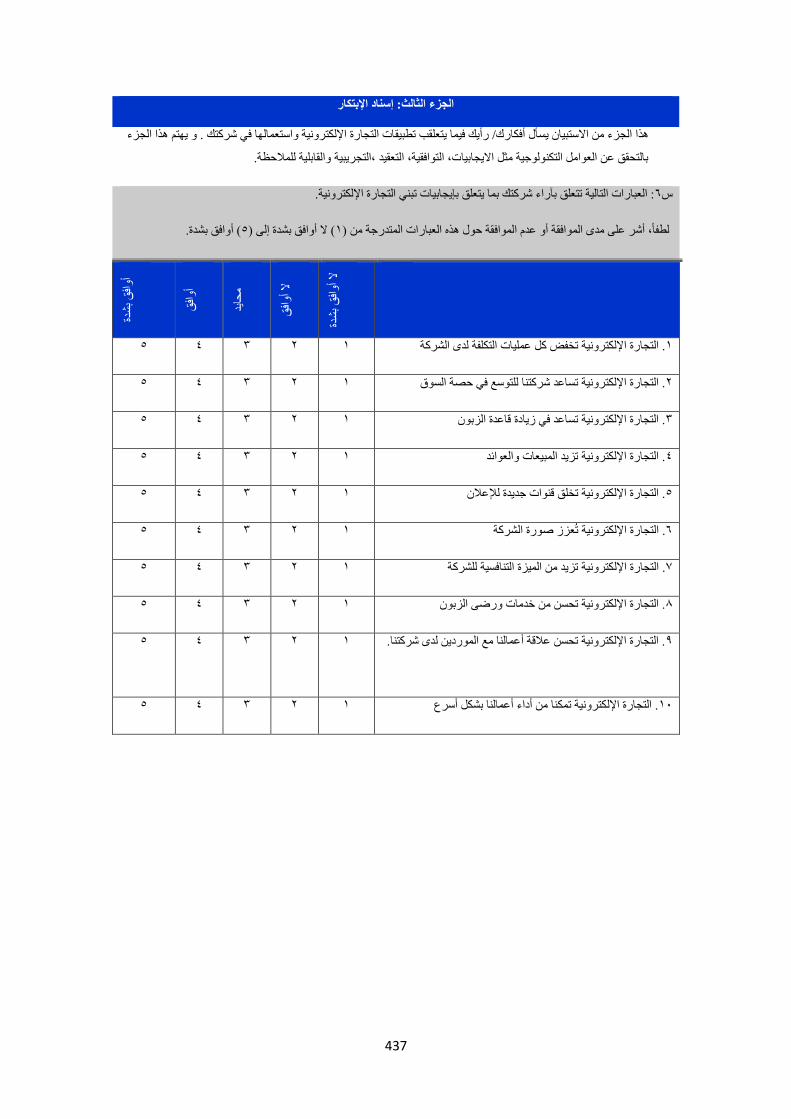
437
ها في شركتك . و يهتم هذا الجزء تطبيقات التجارة اإللكترونية واستعمال رأيك فيما يتعلقب/ هذا الجزء من االستبيان يسأل أفكارك
بالتحقق عن العوامل التكنولوجية مثل االيجابيات، التوافقية، التعقيد ،التجريبية والقابلية للمالحظة.
: العبارات التالية تتعلق بآراء شركتك بما يتعلق بإيجابيات تبني التجارة اإللكترونية.٦س
( أوافق بشدة.٥( ال أوافق بشدة إلى )١قة حول هذه العبارات المتدرجة من )لطفا، أشر على مدى الموافقة أو عدم المواف
دةش
بق
افأو
قافأو
يدحا
م
قافأو
ال
دةش
بق
افأو
ال
. التجارة اإللكترونية تخفض كل عمليات التكلفة لدى الشركة١ ١ ٢ ٣ ٤ ٥
. التجارة اإللكترونية تساعد شركتنا للتوسع في حصة السوق ٢ ١ ٢ ٣ ٤ ٥
. التجارة اإللكترونية تساعد في زيادة قاعدة الزبون٣ ١ ٢ ٣ ٤ ٥
. التجارة اإللكترونية تزيد المبيعات والعوائد ٤ ١ ٢ ٣ ٤ ٥
. التجارة اإللكترونية تخلق قنوات جديدة لإلعالن٥ ١ ٢ ٣ ٤ ٥
. التجارة اإللكترونية تعزز صورة الشركة ٦ ١ ٢ ٣ ٤ ٥
كترونية تزيد من الميزة التنافسية للشركة. التجارة اإلل٧ ١ ٢ ٣ ٤ ٥
. التجارة اإللكترونية تحسن من خدمات ورضى الزبون٨ ١ ٢ ٣ ٤ ٥
. التجارة اإللكترونية تحسن عالقة أعمالنا مع الموردين لدى شركتنا.٩ ١ ٢ ٣ ٤ ٥
. التجارة اإللكترونية تمكنا من أداء أعمالنا بشكل أسرع ١٠ ١ ٢ ٣ ٤ ٥
الجزء الثالث: إسناد اإلبتكار
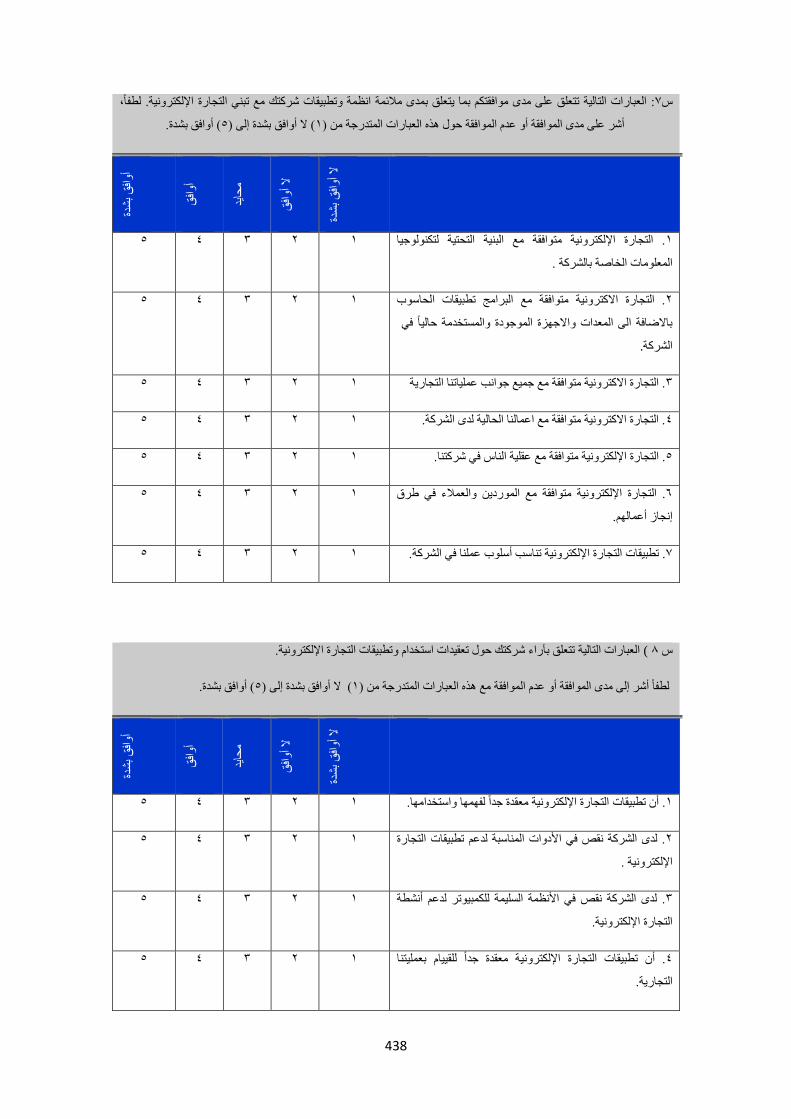
438
العبارات التالية تتعلق على مدى موافقتكم بما يتعلق بمدى مالئمة انظمة وتطبيقات شركتك مع تبني التجارة اإللكترونية. لطفا، :٧س
( أوافق بشدة.٥( ال أوافق بشدة إلى )١أشر على مدى الموافقة أو عدم الموافقة حول هذه العبارات المتدرجة من )دة
ش ب
قافأو
قافأو
يدحا
م
وا أال
قف
دةش
بق
افأو
ال
. التجارة اإللكترونية متوافقة مع البنية التحتية لتكنولوجيا ١ ١ ٢ ٣ ٤ ٥
المعلومات الخاصة بالشركة .
. التجارة االكترونية متوافقة مع البرامج تطبيقات الحاسوب ٢ ١ ٢ ٣ ٤ ٥
في حاليا والمستخدمة باالضافة الى المعدات واالجهزة الموجودة
.الشركة
عملياتنا التجارية جميع جوانب . التجارة االكترونية متوافقة مع٣ ١ ٢ ٣ ٤ ٥
. التجارة االكترونية متوافقة مع اعمالنا الحالية لدى الشركة.٤ ١ ٢ ٣ ٤ ٥
في شركتنا. عقلية الناس مع . التجارة اإللكترونية متوافقة٥ ١ ٢ ٣ ٤ ٥
في طرق والعمالء الموردين متوافقة مع . التجارة اإللكترونية٦ ١ ٢ ٣ ٤ ٥
إنجاز أعمالهم.
عملنا في الشركة. أسلوب تناسب التجارة اإللكترونية . تطبيقات٧ ١ ٢ ٣ ٤ ٥
العبارات التالية تتعلق بآراء شركتك حول تعقيدات استخدام وتطبيقات التجارة اإللكترونية. ) ٨ س
( أوافق بشدة.٥( ال أوافق بشدة إلى )١ه العبارات المتدرجة من )لطفا أشر إلى مدى الموافقة أو عدم الموافقة مع هذ
دةش
بق
افأو
قافأو
يدحا
م
قافأو
ال
دةش
بق
افأو
ال
. أن تطبيقات التجارة اإللكترونية معقدة جدا لفهمها واستخدامها. ١ ١ ٢ ٣ ٤ ٥
. لدى الشركة نقص في األدوات المناسبة لدعم تطبيقات التجارة ٢ ١ ٢ ٣ ٤ ٥
اإللكترونية .
. لدى الشركة نقص في األنظمة السليمة للكمبيوتر لدعم أنشطة ٣ ١ ٢ ٣ ٤ ٥
التجارة اإللكترونية.
. أن تطبيقات التجارة اإللكترونية معقدة جدا للقييام بعمليتنا ٤ ١ ٢ ٣ ٤ ٥
التجارية.

439
علقة بتبني التجارة اإللكترونية.( العبارات التالية تتعلق بآراء شركتك حول تجريب التطبقات المت٩س
( بشدة أوافق.٥( ال أوافق بشدة إلى )١لطفا أشر على مدى الموافقة أو عدم الموافقة حول هذه العبارات المتدرجة من )
دةش
بق
افأو
قافأو
يدحا
م
قافأو
ال
دةش
بق
افأو
ال
ار . تستطيع شركتنا الوصول إلى التجريب المجاني قبل عمل قر١ ١ ٢ ٣ ٤ ٥
تبني التجارة اإللكترونية
. لدى شركتنا فرصة تجريب عدد من تطبيقات التجارة ٢ ١ ٢ ٣ ٤ ٥
اإللكترونية قبل صنع القرار.
. تستطيع شركتنا تجريب التجارة اإللكترونية بمدى واسع الفعالية٣ ١ ٢ ٣ ٤ ٥
جريب . تسمح شركتنا بإستخدام التجارة اإللتكرونية على أساس الت٤ ١ ٢ ٣ ٤ ٥
لمدة كافية لترى مدى فعاليتها
. أنه من السهولة لشركتنا الخروج بعد تجربة استخدام التجارة ٥ ١ ٢ ٣ ٤ ٥
اإللكترونية
. تكلفة التشغيل التجريبي للتجارة االكترونية منخفضة٦ ١ ٢ ٣ ٤ ٥
أشر بما يوافق أو ال ( العبارات التالية تتعلق بأي درجة وضوح ومالحظة من قبل اآلخرين لمنتجا١٠س ت التجارة اإللكترونية. لطفا
( أوافق بشدة٥( ال أوافق بشدة إلى )١يوافق العبارات المتدرجة من )
دةش
بق
افأو
قافأو
يدحا
م
قافأو
ال
دةش
بق
افأو
ال
. يوجد عدد كبير من أجهزة الكمبيوتر حيث يستطيع الناس في ١ ١ ٢ ٣ ٤ ٥
استخدام التجارة اإللكترونية.شركتنا الوصول إلى االنترنت و
. أن العديد من منافسينا في السوق بدأوا بإستخدام التجارة ٢ ١ ٢ ٣ ٤ ٥
اإللكترونية.
. العديد من شركائنا ومزودينا في السوق بدأوا باستخدام التجارة ٣ ١ ٢ ٣ ٤ ٥
اإللكترونية.
ائنا في جميع . حسنت التجارة اإللكترونية التواصل الواضح مع زب٤ ١ ٢ ٣ ٤ ٥
االوقات.
.أظهرت التجارة اإللكترونية نتائج أفضل لألعمال عن الطرق ٥ ١ ٢ ٣ ٤ ٥

440
عوامل المنشأة/الشركةالجزء الرابع:
هذا الجزء من االستبيان معني بالتحقيق من العوامل الداخلية لشركتك وعالقاتها بمستويات تبني التجارة اإللكترونية مثل
، حجم الشركة وخبرات تكنولوجيا المعلومات عبر الموظفين. المصادر المالية
( هذه العبارات تتعلق بآراء شركتك حول المتطلبات المالية لتبني التجارة اإللكترونية. لطفا أشر على مدى الموافقة أو عدم ١١س
( بشدة أوافق.٥( ال أوافق بشدة إلى )١الموافقة حول هذه العبارات المتدرجة من )
افأو
دةش
بق
قافأو
يدحا
م
قافأو
ال
دةش
بق
افأو
ال
. يتطلب تنفيذ تطبيقات التجارة اإللكترونية كلفة عالية جدا على ١ ١ ٢ ٣ ٤ ٥
شركتنا.
. كلفة الوصول لالنترنت عالية .٢ ١ ٢ ٣ ٤ ٥
.ليس لدى الشركة ميزانية كافيه لتطبيق وتتبني و الحفاظ على ٣ ١ ٢ ٣ ٤ ٥
رونية .نظام التجارة اإللكت
. تتطلب تطبيقات التجارة اإللكترونية كلف إضافية لتدريب ٤ ١ ٢ ٣ ٤ ٥
الموظفين عن كيفية استخدامها .
( العبارات التالية تتعلق برأيك عن مستوى المعرفة بتكنولوجيا المعلومات لدى الموظفين العاملين لديك. لطفا أشر على مدى ١٢س
( بشدة أوافق٥( ال أوافق بشدة إلى )١لموافقة حول هذه العبارات المتدرجة من )الموافقة أو عدم ا
ق افأو
دةش
ب
قافأو
يدحا
م
ال قافأو
ال
ق افأو
دةش
ب
المعرفة الضرورية والفهم للتجارة . لدى الموظفين في شركتنا١ ١ ٢ ٣ ٤ ٥
اإللكترونية
باستخدام الحاسب . الموظفين في شركتنا لديهم خبرة و معرفة ٢ ١ ٢ ٣ ٤ ٥
اآللي
موظفين متخصصين وعلى دراية في تكنولوجيا . يوجد٣ ١ ٢ ٣ ٤ ٥
شركتنا . في المعلومات
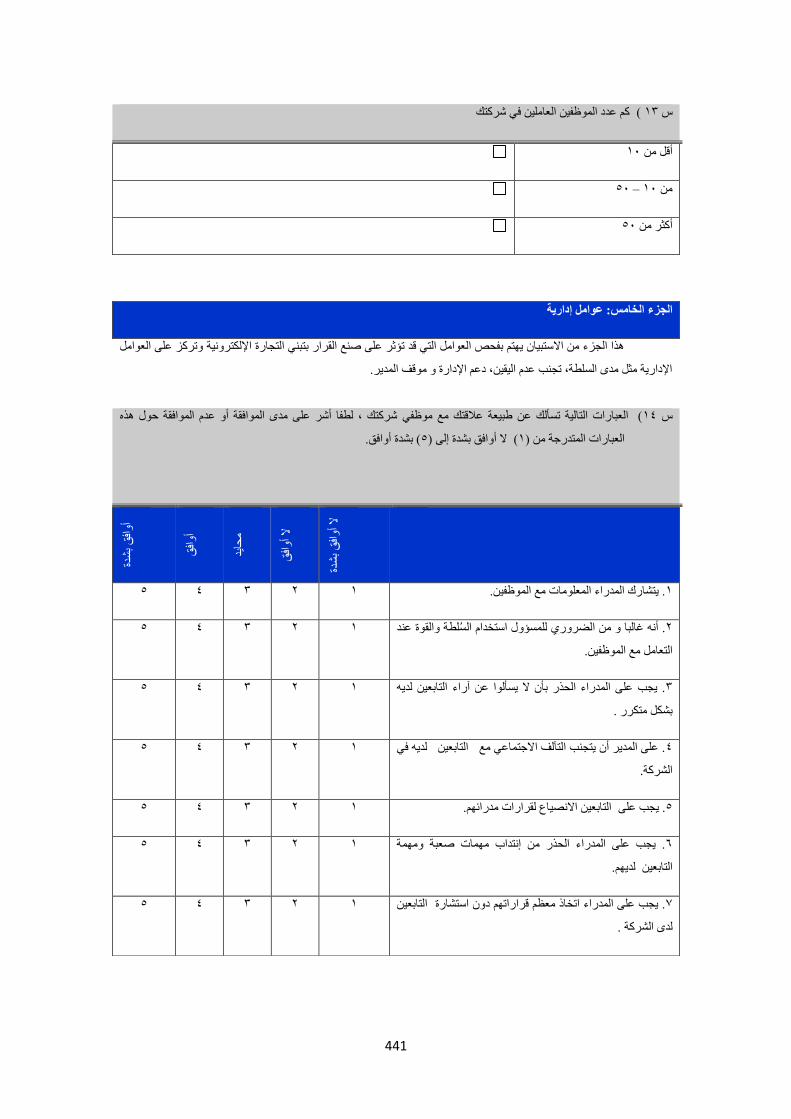
441
س: عوامل إدارية الجزء الخام
هذا الجزء من االستبيان يهتم بفحص العوامل التي قد تؤثر على صنع القرار بتبني التجارة اإللكترونية وتركز على العوامل
اإلدارية مثل مدى السلطة، تجنب عدم اليقين، دعم اإلدارة و موقف المدير.
كم عدد الموظفين العاملين في شركتك ( ١٣س
١٠أقل من
٥٠ – ١٠من
٥٠أكثر من
شركتك ، لطفا أشر على مدى الموافقة أو عدم الموافقة حول هذه ( العبارات التالية تسألك عن طبيعة عالقتك مع موظفي ١٤س
( بشدة أوافق.٥( ال أوافق بشدة إلى )١العبارات المتدرجة من )
دةش
بق
افأو
قافأو
يدحا
م
قافأو
ال
دةش
بق
افأو
ال
. يتشارك المدراء المعلومات مع الموظفين. ١ ١ ٢ ٣ ٤ ٥
للمسؤول استخدام السلطة والقوة عند . أنه غالبا و من الضروري٢ ١ ٢ ٣ ٤ ٥
التعامل مع الموظفين.
لديهالتابعين . يجب على المدراء الحذر بأن ال يسألوا عن آراء٣ ١ ٢ ٣ ٤ ٥
بشكل متكرر .
في لديه التابعين . على المدير أن يتجنب التآلف االجتماعي مع ٤ ١ ٢ ٣ ٤ ٥
الشركة.
ن االنصياع لقرارات مدرائهم.التابعي . يجب على ٥ ١ ٢ ٣ ٤ ٥
. يجب على المدراء الحذر من إنتداب مهمات صعبة ومهمة ٦ ١ ٢ ٣ ٤ ٥
التابعين لديهم.
التابعين . يجب على المدراء اتخاذ معظم قراراتهم دون استشارة ٧ ١ ٢ ٣ ٤ ٥
. لدى الشركة
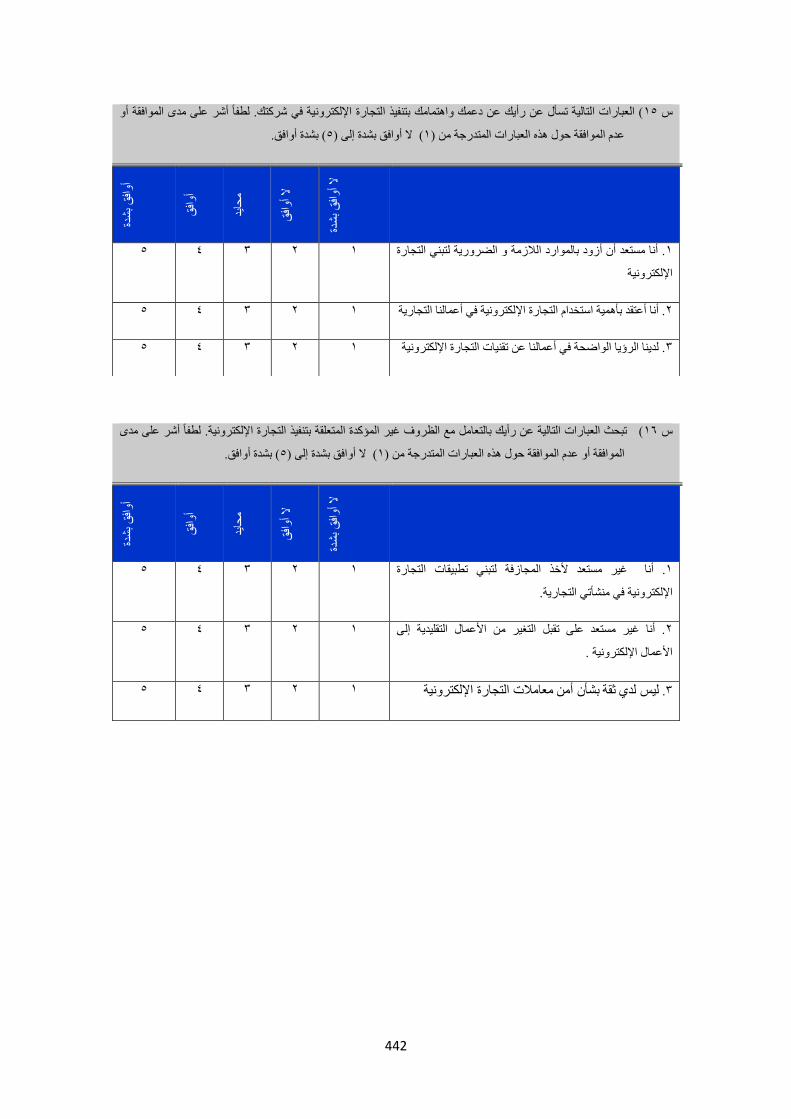
442
التجارة اإللكترونية في شركتك. لطفا أشر على مدى الموافقة أو ( العبارات التالية تسأل عن رأيك عن دعمك واهتمامك بتنفيذ ١٥س
( بشدة أوافق.٥( ال أوافق بشدة إلى )١عدم الموافقة حول هذه العبارات المتدرجة من )دة
ش ب
قافأو
قافأو
يدحا
م
قافأو
ال
دةش
بق
افأو
ال
لتجارة . أنا مستعد أن أزود بالموارد الالزمة و الضرورية لتبني ا١ ١ ٢ ٣ ٤ ٥
اإللكترونية
. أنا أعتقد بأهمية استخدام التجارة اإللكترونية في أعمالنا التجارية ٢ ١ ٢ ٣ ٤ ٥
. لدينا الرؤيا الواضحة في أعمالنا عن تقنيات التجارة اإللكترونية٣ ١ ٢ ٣ ٤ ٥
تنفيذ التجارة اإللكترونية. لطفا أشر على مدى ( تبحث العبارات التالية عن رأيك بالتعامل مع الظروف غير المؤكدة المتعلقة ب١٦س
( بشدة أوافق.٥( ال أوافق بشدة إلى )١الموافقة أو عدم الموافقة حول هذه العبارات المتدرجة من )
دةش
بق
افأو
قافأو
يدحا
م
قافأو
ال
دةش
بق
افأو
ال
غير مستعد ألخذ المجازفة لتبني تطبيقات التجارة . أنا١ ١ ٢ ٣ ٤ ٥
التجارية. منشأتيترونية في اإللك
. أنا غير مستعد على تقبل التغير من األعمال التقليدية إلى ٢ ١ ٢ ٣ ٤ ٥
األعمال اإللكترونية .
معامالت التجارة اإللكترونية بشأن أمن ثقة ليس لدي. ٣ ١ ٢ ٣ ٤ ٥

443
الجزء السادس: العوامل البيئية
هذا الجزء من االستبيان معني بفحص العوامل الخارجية التي يمكن أن تؤثر على صنع القرار بتبني التجارة اإللكترونية في
الشركة مثل ضغط المنافسين، ضغط الزبائن، ضغط المزودين والدعم الحكومي.
لتجارة اإللكترونية، لطفا أشر على مدى الموافقة أو عدم ( : العبارات التالية تتعلق بمشاعرك اتجاه االنترنت وتطبيقات ا١٧س
( بشدة أوافق.٥( ال أوافق بشدة إلى )١الموافقة حول هذه العبارات المتدرجة من )دة
ش ب
قافأو
قافأو
يدحا
م
قافأو
ال
دةش
بق
افأو
ال
. أجد المتعة في التفاعل مع االنترنت١ ١ ٢ ٣ ٤ ٥
اللكتروني يزودني بمتعة كبيرة . استخدام الموقع ا٢ ١ ٢ ٣ ٤ ٥
. أنا أحب فكرة تبني التجارة اإللكترونية في شركتي ٣ ١ ٢ ٣ ٤ ٥
. أعتقد أن التجارة اإللكترونية سوف تطبق على الشركات ٤ ١ ٢ ٣ ٤ ٥
الصغيرة ومتوسطة الحجم في المستقبل القريب
مفيدا لشركتي . اعتقد أن تبني التجارة اإللكترونية سوف يكون ٥ ١ ٢ ٣ ٤ ٥
لية عن أفكارك حول تأثير المنافسين لشركتك على قرارتك في تبني التجارة اإللكترونية. لطفا أشر على ( تبحث العبارات التا١٨س
( بشدة أوافق.٥( ال أوافق بشدة إلى )١مدى الموافقة أو عدم الموافقة حول هذه العبارات المتدرجة من )
دةش
بق
افأو
قافأو
يدحا
م
قافأو
ال
دةش
بق
افأو
ال
جد منافسة شديدة بين شركتي و الشركات األخرى في نفس .تو١ ١ ٢ ٣ ٤ ٥
مجال العمل.
. بعض منافسينا قد تبنى التجارة اإللكترونية.٢ ١ ٢ ٣ ٤ ٥
. أن مؤسستنا تحت ضغط المنافسين لتبني االنترنت و التجارة ٣ ١ ٢ ٣ ٤ ٥
االكترونية.
أخرى ذات . أنه من السهل على زبائننا أن يغيروا إلى شركة ٤ ١ ٢ ٣ ٤ ٥
خدمات مشابهة دون أي صعوبة.
. يستطيع زبائننا بسهولة الوصول إلى العديد من المنتجات ٥ ١ ٢ ٣ ٤ ٥
والخدمات الموجودة لدينا من مصادر مختلفة اخرى.
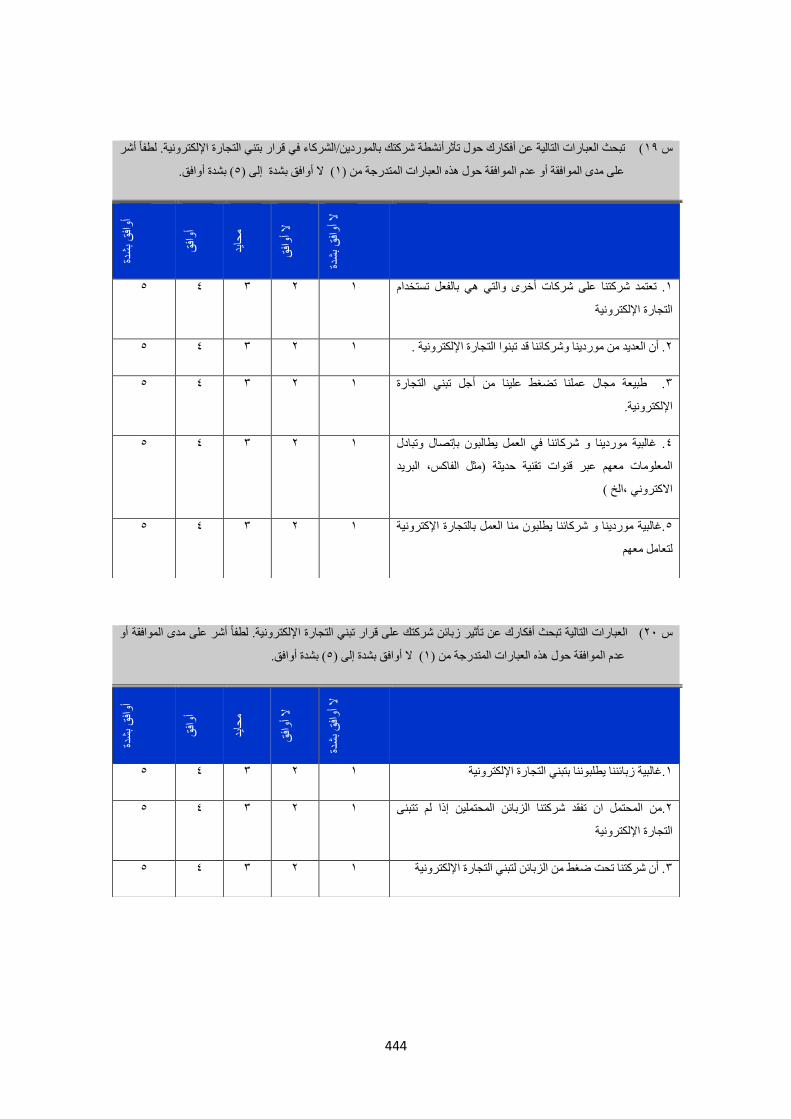
444
ترونية. لطفا أشر ( تبحث العبارات التالية عن أفكارك حول تأثرأنشطة شركتك بالموردين/الشركاء في قرار بتني التجارة اإللك١٩س
( بشدة أوافق.٥( ال أوافق بشدة إلى )١على مدى الموافقة أو عدم الموافقة حول هذه العبارات المتدرجة من )
دةش
بق
افأو
قافأو
يدحا
م
قافأو
ال
دةش
بق
افأو
ال
. تعتمد شركتنا على شركات أخرى والتي هي بالفعل تستخدام ١ ١ ٢ ٣ ٤ ٥
التجارة اإللكترونية
. أن العديد من موردينا وشركائنا قد تبنوا التجارة اإللكترونية .٢ ١ ٢ ٣ ٤ ٥
. طبيعة مجال عملنا تضغط علينا من أجل تبني التجارة ٣ ١ ٢ ٣ ٤ ٥
اإللكترونية.
. غالبية موردينا و شركائنا في العمل يطالبون بإتصال وتبادل ٤ ١ ٢ ٣ ٤ ٥
ة )مثل الفاكس، البريد المعلومات معهم عبر قنوات تقنية حديث
االكتروني ،الخ (
.غالبية موردينا و شركائنا يطلبون منا العمل بالتجارة اإلكترونية ٥ ١ ٢ ٣ ٤ ٥
لتعامل معهم
( العبارات التالية تبحث أفكارك عن تأثير زبائن شركتك على قرار تبني التجارة اإللكترونية. لطفا أشر على مدى الموافقة أو ٢٠س
( بشدة أوافق.٥( ال أوافق بشدة إلى )١الموافقة حول هذه العبارات المتدرجة من )عدم
دةش
بق
افأو
قافأو
يدحا
م
قافأو
ال
دةش
بق
افأو
ال
.غالبية زبائننا يطلبوننا بتبني التجارة اإللكترونية ١ ١ ٢ ٣ ٤ ٥
نى .من المحتمل ان تفقد شركتنا الزبائن المحتملين إذا لم تتب٢ ١ ٢ ٣ ٤ ٥
التجارة اإللكترونية
. أن شركتنا تحت ضغط من الزبائن لتبني التجارة اإللكترونية ٣ ١ ٢ ٣ ٤ ٥

445
شكرا لمشاركتك
العنوان البريدي................................
....................................................
....................................................
.اسم المنشأة : ................................................................
البريد االكتروني :............................................................
رقم الفاكس :..................................................................
( العبارات التالية تتعلق برأيك حول الدعم الحكومي لقرار تبني التجارة اإللكترونية. لطفا أشر على مدى الموافقة أو عدم ٢١س
( بشدة أوافق.٥( ال أوافق بشدة إلى )١)الموافقة حول هذه العبارات المتدرجة من دة
ش ب
قافأو
قافأو
يدحا
م
قافأو
ال
دةش
بق
افأو
ال
في تشجيع التجارة اإللكترونية ضمن ١ ١ ٢ ٣ ٤ ٥ . تلعب الحكومة دورا مهما
الشركات الصغيرة ومتوسطة الحجم.
مثل . البنية التحتية لالتصاالت وتوفرها وتكنولوجيا االنترنت٢ ١ ٢ ٣ ٤ ٥
)االنترنت السلكي واالسلكي( فعالة لدعم و تشجيع الشركات على
تبني التجارة اإللكترونية
وبرامج تعليمية لشركتنا لتبني ٣ ١ ٢ ٣ ٤ ٥ . تقدم الوكاالت الحكومية تدريبا
التجارة اإللكترونية.
ئع . وجود التشريعات الحكومية للتجارة اإللكترونية في حماية البا٤ ١ ٢ ٣ ٤ ٥
والمشتري شجعتنا على تبني التجارة اإللكترونية .
. يوجد لدى الحكومة قوانين فعالة لمنع جرائم االنترنت.٥ ١ ٢ ٣ ٤ ٥
دةش
بق
افأو
قافأو
يدحا
م
قافأو
ال
دةش
بق
افأو
ال
. تقدم الحكومة لنا قروضا لتسهيل تبني التجارة اإللكترونية .٦ ١ ٢ ٣ ٤ ٥
فعالة في وضع التسهيالت لتمكين التجارة باالنترنت. . الحكومة٧ ١ ٢ ٣ ٤ ٥
كمشارك في هذا البحث ،لك الخيار في استقبال نسخة من نتائج هذة الدراسة، لطفا زودنا بعنوانك البريدي أو بريدك اإللكترونية أو رقم
.امةت وسرية بخصوصية تعامل سوف المعلومات جميع أن ونؤكد ونقدرلكم مشاركتكم الفاكس. هذا

446
Appendix A-4
Final Version of Arabic Questionnaire
ك وكاآلت السفر في األردنتبني التجارة اإللكترونية من قبل مدراء ومال
عزيزي المالك / المدير
Cardiffدرجة الدكتوراه في جامعة كارديف مترويوليتان لأن ھذه االستبانة جزء من بحثي
Metropolitan University ھذا البحث بعنوان تبني التجارة اإللكترونية من قبل . في المملكة المتحدة/برطانيا
في األردن وھي محاولة لدراسة استتخدام التجارة اإللكترونية عبر وكاالت السفر األردنية مدراء ومالك وكاالت السفر
من أجل الحصول على أفضل االيضاحات للعوامل المؤثرة على صناع القرار بإتجاه التجارة اإللكترونية ومستويات تبنيھا
لوكاالت السفر للحافظ على بقائھا في السوق السياحة عبر ھذه الشركات. أن تبني التجارة اإللكترونية يعطي فرصا
العالمي في حين أن الوكالء التقليديون يواجھون تھديد الالوسائطية أوالزوال إذا لم يكن لديھم أفعاال مستقبلية تجاه
ت السفر إن نتائج ھذا العمل سيجسر الھوة بتطوير نموذج يوضح الكيفية للمالك / المدراء لوكاال التجارة اإللكترونية.
عملية صنع القرار صغيرة ومتوسطة الحجم في األردن من احتمالية مدى درجة تبني التجارة االلكترونية لتسھيل
.والعمليات التجارية
أن مشاركتك تطوعية، ولك الحرية باالنسحاب في أي وقت دون أبداء األسباب.إن تعبئة االستبيان لن يستغرق
ت صحيحة أو خاطئة، وإجابتك ھي رأيك. دقيقة وال يوجد إجابا ٢٠أكثر من
سوف أكون سعيدا إذا اجبت عن جميع األسئلة المتعلقة باالستبيان. أن مشاركتك في ھذا البحث مھمة جدا
إلتمام ھذا البحث بنجاح.
ھويتك ستبقى غير معروفة وأوكد لك بأن إستجاباتك ومعلومات شركتك ستبقى محافظ عليھا بأعلى درجات
وسأزودك بنتائج ھذا البحث إذا اشعرتني بذلك.إن تعبئة ھذا االستبيان ستكون موافقة على مشاركتكم . السرية.
شكرا لكم مقدما لتعاونكم وجھدكم في تعبئة ھذا االستبيان.
الرجاء عدم التردد في التواصل معي إذا كان لديك أي أسئلة عن البحث أو ماذا أنوي عمله من ھذه الدراسة .
الروسان ـ طالب دكتوراه محمد
جامعة كارديف متروبوايتان
٠٠۹٦٢٧۹٨٦٨٨٧٣١االردن: –موبايل
٠٠٤٤٧٧۹٤۹٠٧٧۹٤بريطانيا: –موبايل
.cardiffmet.ac.uk@20024308 البريدااللكتروني:

447
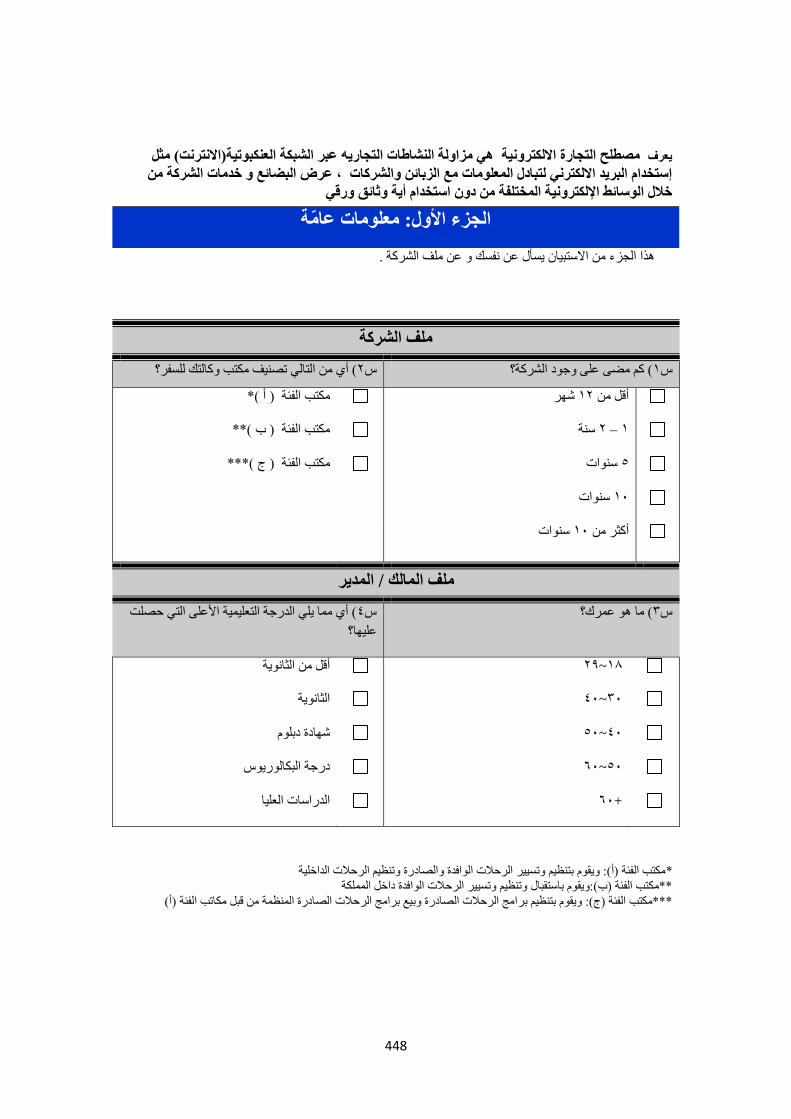
448
.نفسك و عن ملف الشركة يسأل عن هذا الجزء من االستبيان
مكتب الفئة )أ(: ويقوم بتنظيم وتسيير الرحالت الوافدة والصادرة وتنظيم الرحالت الداخلية*
**مكتب الفئة )ب(:ويقوم باستقبال وتنظيم وتسيير الرحالت الوافدة داخل المملكة
)أ(امج الرحالت الصادرة وبيع برامج الرحالت الصادرة المنظمة من قبل مكاتب الفئة ***مكتب الفئة )ج(: ويقوم بتنظيم بر
مثل ھي مزاولة النشاطات التجاريه عبر الشبكة العنكبوتية)االنترنت( مصطلح التجارة االلكترونية يعرف
، عرض البضائع و خدمات الشركة من إستخدام البريد االلكترني لتبادل المعلومات مع الزبائن والشركات
خالل الوسائط اإللكترونية المختلفة من دون استخدام أية وثائق ورقي
الجزء األول: معلومات عامة
كةملف الشر
( أي من التالي تصنيف مكتب وكالتك للسفر؟٢س
( كم مضى على وجود الشركة؟ ١س
شهر ١٢أقل من مكتب الفئة ) أ (*
سنة ٢ – ١ مكتب الفئة ) ب (**
(***مكتب الفئة ) ج سنوات ٥
سنوات ١٠
سنوات ١٠أكثر من
ملف المالك / المدير
( أي مما يلي الدرجة التعليمية األعلى التي حصلت ٤س
عليها؟
( ما هو عمرك؟٣س
١٨~٢٩ أقل من الثانوية
٣٠~٤٠ الثانوية
٤٠~٥٠ شهادة دبلوم
٥٠~٦٠ درجة البكالوريوس
+٦٠ العليا الدراسات

449
هذا الجزء من االستبيان يسأل عن وضع شركتك العتبارات الموقع االلكتروني وتطبيقاتها التي تتبناها أو ال تتبناها
شركتك.
الجزء الثاني: التبني الحالي لالنترنت في شركتك.
مستوى تطبيقات االنترنت الحالي التي تتبناها شركتك ؟التالي أي من ( ٥س
لطفا اختر إجابة واحدة فقط
نعم ال
. شركتنا ليست مربوطة مع االنترنت .١
. شركتنا مربوطة مع االنترنت و البريد اإللكتروني وال يوجد لدى الشركة موقع الكتروني على٢
.العنكبوتية الشبكة
موقع الكتروني ثابت ويظهر المعلومات عن الشركة و عن منتجاتنا بطريقة . لدى شركتنا٣
اتصال واحدة باستخدام البريد اإللكتروني .
والنماذج والبريد اإللكتروني من الزبائن ٤ . لدى شركتنا موقع فعال ويقبل الطلبات الكترونيا
االلكتروني .والمزودين ولكن عملية الدفع الكترونيا غير مدمجة في الموقع
. شركتنتا تقبل العمليات الكترونيا عبر الموقع والتي تسمح بالشراء والبيع للمنتنجات والخدمات ٥
للزبائن والمزودين بما في ذلك خدمات الزبون .
. لدى شركتنا موقع متصل مع أنظمة الكمبيوتر والتي تتيـح لشركتنا عمل معظم أعمالها ٦
المحاسبي، نظام الجرد،إدارة عالقة الزبون وأي أوراق عمل تقليدية إلى وعملياتها مثل النظام
أوراق الكترونية.

450
تطبيقات التجارة اإللكترونية واستعمالها في شركتك . و يهتم رأيك فيما يتعلقب/ هذا الجزء من االستبيان يسأل أفكارك
عوامل التكنولوجية مثل االيجابيات، التوافقية، التعقيد ،التجريبية والقابلية للمالحظة. هذا الجزء بالتحقق عن ال
: العبارات التالية تتعلق بآراء شركتك بما يتعلق بإيجابيات تبني التجارة اإللكترونية.٦س
( أوافق بشدة.٥بشدة إلى ) ( ال أوافق١لطفا، أشر على مدى الموافقة أو عدم الموافقة حول هذه العبارات المتدرجة من )
أوافق
بشدة
ال محايد أوافق
أوافق
ال أوافق
بشدة
. التجارة اإللكترونية تخفض كل عمليات التكلفة لدى الشركة١ ١ ٢ ٣ ٤ ٥
. التجارة اإللكترونية تساعد شركتنا للتوسع في حصة السوق ٢ ١ ٢ ٣ ٤ ٥
دة قاعدة الزبون. التجارة اإللكترونية تساعد في زيا٣ ١ ٢ ٣ ٤ ٥
. التجارة اإللكترونية تزيد المبيعات والعوائد ٤ ١ ٢ ٣ ٤ ٥
. التجارة اإللكترونية تخلق قنوات جديدة لإلعالن٥ ١ ٢ ٣ ٤ ٥
. التجارة اإللكترونية تعزز صورة الشركة ٦ ١ ٢ ٣ ٤ ٥
. التجارة اإللكترونية تزيد من الميزة التنافسية للشركة٧ ١ ٢ ٣ ٤ ٥
. التجارة اإللكترونية تحسن من خدمات ورضى الزبون٨ ١ ٢ ٣ ٤ ٥
. التجارة اإللكترونية تحسن عالقة أعمالنا مع الموردين لدى ٩ ١ ٢ ٣ ٤ ٥
شركتنا.
. التجارة اإللكترونية تمكنا من أداء أعمالنا بشكل أسرع ١٠ ١ ٢ ٣ ٤ ٥
بمدى مالئمة انظمة وتطبيقات شركتك مع تبني التجارة العبارات التالية تتعلق على مدى موافقتكم بما يتعلق :٧س
( ال أوافق بشدة ١اإللكترونية. لطفا، أشر على مدى الموافقة أو عدم الموافقة حول هذه العبارات المتدرجة من )
( أوافق بشدة.٥إلى )
أوافق
بشدة
ال محايد أوافق
أوافق
ال أوافق
بشدة
متوافقة مع البنية التحتية لتكنولوجيا . التجارة اإللكترونية ١ ١ ٢ ٣ ٤ ٥
المعلومات الخاصة بالشركة .
. التجارة االكترونية متوافقة مع البرامج تطبيقات الحاسوب ٢ ١ ٢ ٣ ٤ ٥
والمستخدمة باالضافة الى المعدات واالجهزة الموجودة حاليا
.الشركة في
عملياتنا بجميع جوان . التجارة االكترونية متوافقة مع٣ ١ ٢ ٣ ٤ ٥
التجارية
. التجارة االكترونية متوافقة مع اعمالنا الحالية لدى الشركة.٤ ١ ٢ ٣ ٤ ٥
في شركتنا. عقلية الناس مع . التجارة اإللكترونية متوافقة٥ ١ ٢ ٣ ٤ ٥
في والعمالء الموردين متوافقة مع . التجارة اإللكترونية٦ ١ ٢ ٣ ٤ ٥
طرق إنجاز أعمالهم.
عملنا في أسلوب تناسب التجارة اإللكترونية . تطبيقات٧ ١ ٢ ٣ ٤ ٥
الشركة.
الجزء الثالث: إسناد اإلبتكار
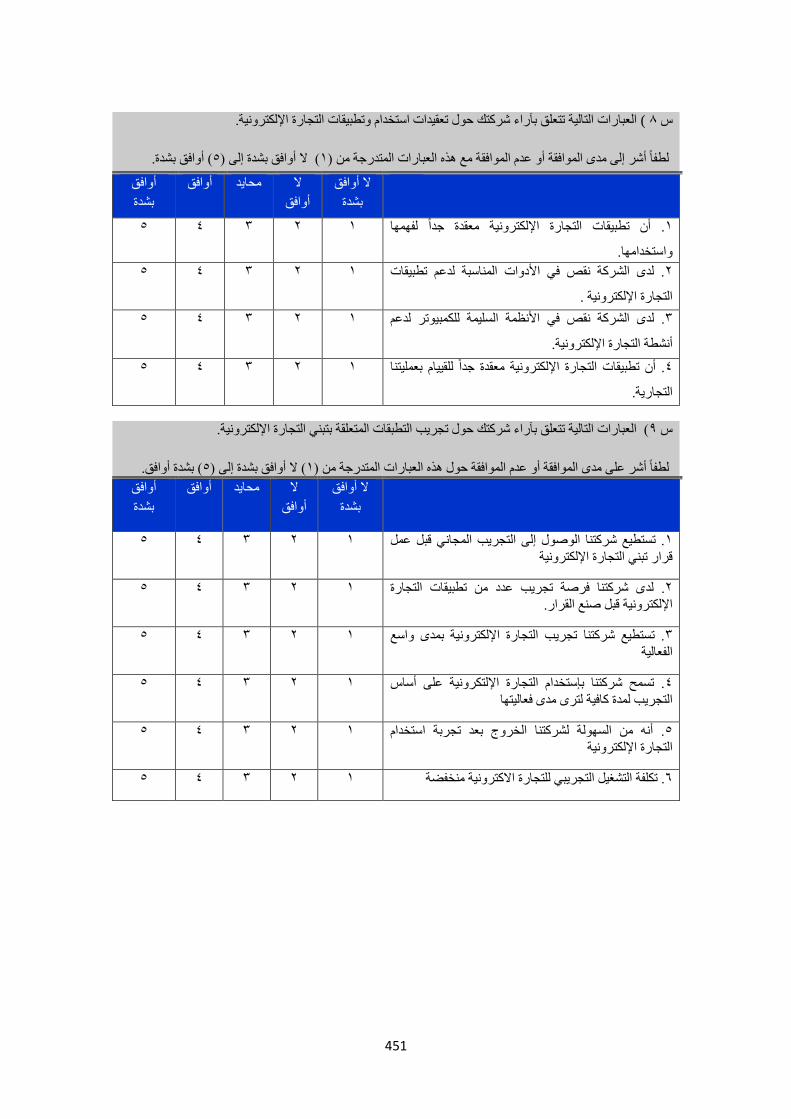
451
( العبارات التالية تتعلق بآراء شركتك حول تجريب التطبقات المتعلقة بتبني التجارة اإللكترونية.٩س
( بشدة أوافق.٥( ال أوافق بشدة إلى )١ى مدى الموافقة أو عدم الموافقة حول هذه العبارات المتدرجة من )لطفا أشر عل
أوافق
بشدة
ال محايد أوافق
أوافق
ال أوافق
بشدة
. تستطيع شركتنا الوصول إلى التجريب المجاني قبل عمل ١ ١ ٢ ٣ ٤ ٥
قرار تبني التجارة اإللكترونية
ى شركتنا فرصة تجريب عدد من تطبيقات التجارة . لد٢ ١ ٢ ٣ ٤ ٥
اإللكترونية قبل صنع القرار.
. تستطيع شركتنا تجريب التجارة اإللكترونية بمدى واسع ٣ ١ ٢ ٣ ٤ ٥
الفعالية
. تسمح شركتنا بإستخدام التجارة اإللتكرونية على أساس ٤ ١ ٢ ٣ ٤ ٥
التجريب لمدة كافية لترى مدى فعاليتها
. أنه من السهولة لشركتنا الخروج بعد تجربة استخدام ٥ ١ ٢ ٣ ٤ ٥
التجارة اإللكترونية
. تكلفة التشغيل التجريبي للتجارة االكترونية منخفضة٦ ١ ٢ ٣ ٤ ٥
العبارات التالية تتعلق بآراء شركتك حول تعقيدات استخدام وتطبيقات التجارة اإللكترونية. ) ٨ س
( أوافق بشدة.٥) ( ال أوافق بشدة إلى١لطفا أشر إلى مدى الموافقة أو عدم الموافقة مع هذه العبارات المتدرجة من )
أوافق
بشدة
ال محايد أوافق
أوافق
ال أوافق
بشدة
. أن تطبيقات التجارة اإللكترونية معقدة جدا لفهمها ١ ١ ٢ ٣ ٤ ٥
واستخدامها.
. لدى الشركة نقص في األدوات المناسبة لدعم تطبيقات ٢ ١ ٢ ٣ ٤ ٥
التجارة اإللكترونية .
األنظمة السليمة للكمبيوتر لدعم . لدى الشركة نقص في٣ ١ ٢ ٣ ٤ ٥
أنشطة التجارة اإللكترونية.
. أن تطبيقات التجارة اإللكترونية معقدة جدا للقييام بعمليتنا ٤ ١ ٢ ٣ ٤ ٥
التجارية.
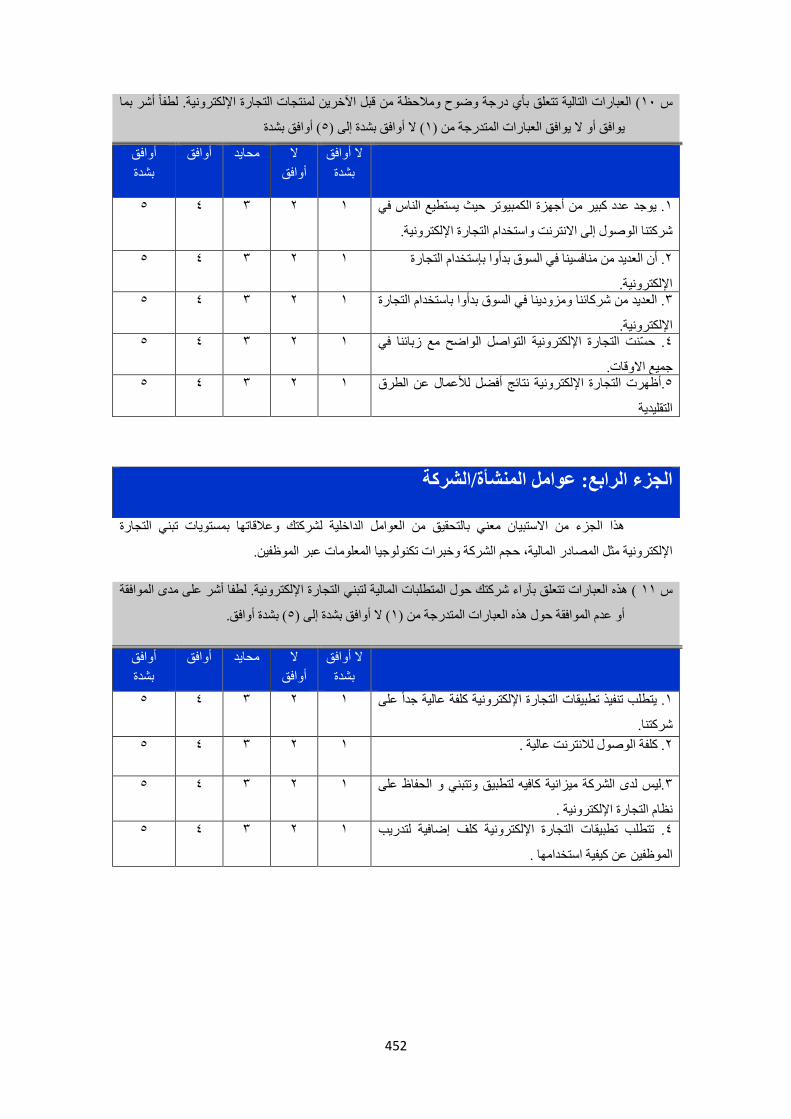
452
( العبارات التالية تتعلق بأي درجة وضوح ومالحظة من قبل اآلخرين لمنتجات التجارة اإللكترونية. لطفا أشر بما ١٠س
( أوافق بشدة٥( ال أوافق بشدة إلى )١أو ال يوافق العبارات المتدرجة من ) يوافق
أوافق
بشدة
ال محايد أوافق
أوافق
ال أوافق
بشدة
. يوجد عدد كبير من أجهزة الكمبيوتر حيث يستطيع الناس في ١ ١ ٢ ٣ ٤ ٥
شركتنا الوصول إلى االنترنت واستخدام التجارة اإللكترونية.
أن العديد من منافسينا في السوق بدأوا بإستخدام التجارة .٢ ١ ٢ ٣ ٤ ٥
اإللكترونية.. العديد من شركائنا ومزودينا في السوق بدأوا باستخدام التجارة ٣ ١ ٢ ٣ ٤ ٥
اإللكترونية.. حسنت التجارة اإللكترونية التواصل الواضح مع زبائنا في ٤ ١ ٢ ٣ ٤ ٥
جميع االوقات.لتجارة اإللكترونية نتائج أفضل لألعمال عن الطرق .أظهرت ا٥ ١ ٢ ٣ ٤ ٥
التقليدية
عوامل المنشأة/الشركةالجزء الرابع:
هذا الجزء من االستبيان معني بالتحقيق من العوامل الداخلية لشركتك وعالقاتها بمستويات تبني التجارة
علومات عبر الموظفين. اإللكترونية مثل المصادر المالية، حجم الشركة وخبرات تكنولوجيا الم
( هذه العبارات تتعلق بآراء شركتك حول المتطلبات المالية لتبني التجارة اإللكترونية. لطفا أشر على مدى الموافقة ١١س
( بشدة أوافق.٥( ال أوافق بشدة إلى )١أو عدم الموافقة حول هذه العبارات المتدرجة من )
أوافق
بشدة
ال محايد أوافق
أوافق
افق ال أو
بشدة
. يتطلب تنفيذ تطبيقات التجارة اإللكترونية كلفة عالية جدا على ١ ١ ٢ ٣ ٤ ٥
شركتنا.
. كلفة الوصول لالنترنت عالية .٢ ١ ٢ ٣ ٤ ٥
.ليس لدى الشركة ميزانية كافيه لتطبيق وتتبني و الحفاظ على ٣ ١ ٢ ٣ ٤ ٥
نظام التجارة اإللكترونية .
ات التجارة اإللكترونية كلف إضافية لتدريب . تتطلب تطبيق٤ ١ ٢ ٣ ٤ ٥
الموظفين عن كيفية استخدامها .

453
الجزء الخامس: عوامل إدارية
هذا الجزء من االستبيان يهتم بفحص العوامل التي قد تؤثر على صنع القرار بتبني التجارة اإللكترونية وتركز على العوامل
اإلدارية مثل مدى السلطة، تجنب عدم اليقين، دعم اإلدارة و موقف المدير.
على مدى الموافقة أو عدم الموافقة حول ( العبارات التالية تسألك عن طبيعة عالقتك مع موظفي شركتك ، لطفا أشر ١٤س
( بشدة أوافق.٥( ال أوافق بشدة إلى )١هذه العبارات المتدرجة من )
ال أوافق
بشدة
ال
أوافق
أوافق بشدة أوافق محايد
٥ ٤ ٣ ٢ ١ . يتشارك المدراء المعلومات مع الموظفين. ١
لقوة . أنه غالبا و من الضروري للمسؤول استخدام السلطة وا٢
عند التعامل مع الموظفين.
٥ ٤ ٣ ٢ ١
الموظفين . يجب على المدراء الحذر بأن ال يسألوا عن آراء٣
بشكل متكرر . لديه
٥ ٤ ٣ ٢ ١
. على المدير أن يتجنب التآلف االجتماعي مع الموظفين٤
في الشركة. لديه
٥ ٤ ٣ ٢ ١
٥ ٤ ٣ ٢ ١ االنصياع لقرارات مدرائهم. . يجب على الموظفين٥
. يجب على المدراء الحذر من إنتداب مهمات صعبة ومهمة ٦
للموظفين لديهم.
٥ ٤ ٣ ٢ ١
. يجب على المدراء اتخاذ معظم قراراتهم دون استشارة ٧
. لدى الشركة الموظفين
٥ ٤ ٣ ٢ ١
( العبارات التالية تتعلق برأيك عن مستوى المعرفة بتكنولوجيا المعلومات لدى الموظفين العاملين لديك. لطفا أشر ١٢س
( بشدة أوافق٥( ال أوافق بشدة إلى )١ة من )على مدى الموافقة أو عدم الموافقة حول هذه العبارات المتدرج
أوافق
بشدة
ال محايد أوافق
أوافق
ال أوافق
بشدة
المعرفة الضرورية والفهم للتجارة . لدى الموظفين في شركتنا١ ١ ٢ ٣ ٤ ٥
اإللكترونية
. الموظفين في شركتنا لديهم خبرة و معرفة باستخدام الحاسب ٢ ١ ٢ ٣ ٤ ٥
اآللي
موظفين متخصصين وعلى دراية في تكنولوجيا . يوجد٣ ١ ٢ ٣ ٤ ٥
شركتنا . في المعلومات
كم عدد الموظفين العاملين في شركتك ( ١٣س
موظف ٥٠أكثر من موظف ٥٠إلى ١٠من موظفين ١٠أقل من
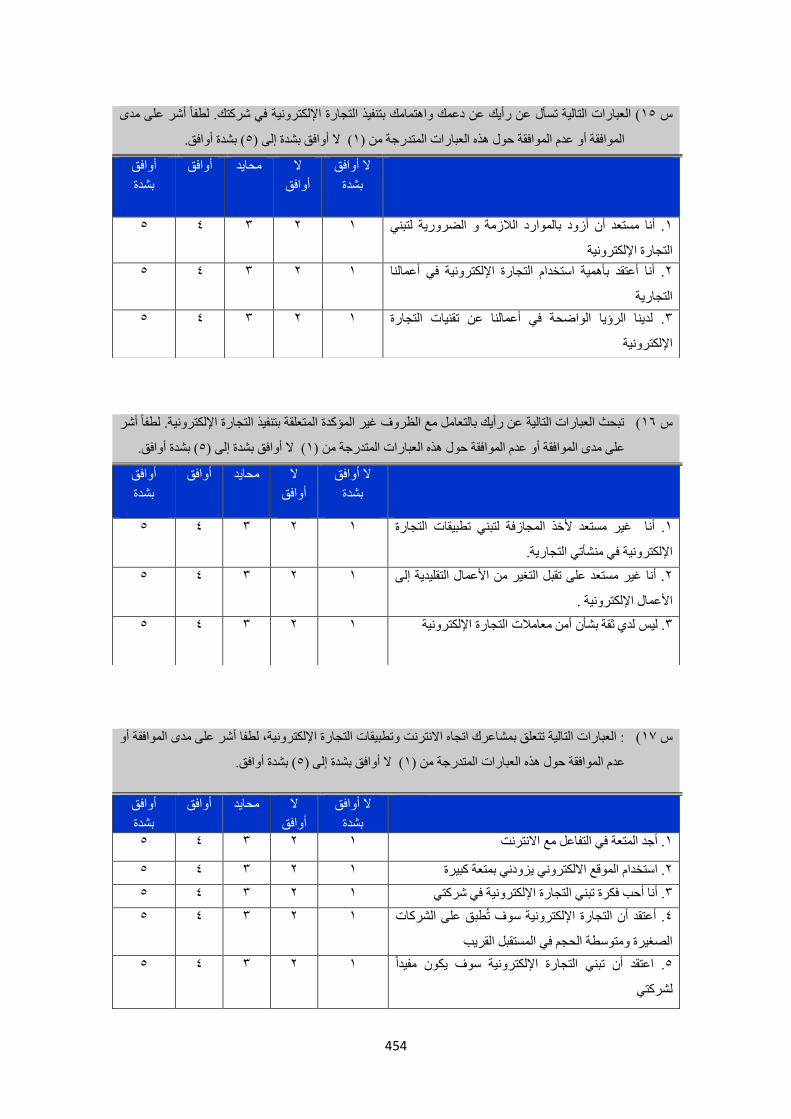
454
في شركتك. لطفا أشر على مدى ( العبارات التالية تسأل عن رأيك عن دعمك واهتمامك بتنفيذ التجارة اإللكترونية١٥س
( بشدة أوافق.٥( ال أوافق بشدة إلى )١الموافقة أو عدم الموافقة حول هذه العبارات المتدرجة من )
أوافق
بشدة
ال محايد أوافق
أوافق
ال أوافق
بشدة
. أنا مستعد أن أزود بالموارد الالزمة و الضرورية لتبني ١ ١ ٢ ٣ ٤ ٥
التجارة اإللكترونية
. أنا أعتقد بأهمية استخدام التجارة اإللكترونية في أعمالنا ٢ ١ ٢ ٣ ٤ ٥
التجارية
. لدينا الرؤيا الواضحة في أعمالنا عن تقنيات التجارة ٣ ١ ٢ ٣ ٤ ٥
اإللكترونية
ترونية. لطفا أشر ( تبحث العبارات التالية عن رأيك بالتعامل مع الظروف غير المؤكدة المتعلقة بتنفيذ التجارة اإللك١٦س
( بشدة أوافق.٥( ال أوافق بشدة إلى )١على مدى الموافقة أو عدم الموافقة حول هذه العبارات المتدرجة من )
أوافق
بشدة
ال محايد أوافق
أوافق
ال أوافق
بشدة
غير مستعد ألخذ المجازفة لتبني تطبيقات التجارة . أنا١ ١ ٢ ٣ ٤ ٥
تجارية.ال منشأتياإللكترونية في
. أنا غير مستعد على تقبل التغير من األعمال التقليدية إلى ٢ ١ ٢ ٣ ٤ ٥
األعمال اإللكترونية .
معامالت التجارة اإللكترونية بشأن أمن ثقة ليس لدي. ٣ ١ ٢ ٣ ٤ ٥
شر على مدى الموافقة أو ( : العبارات التالية تتعلق بمشاعرك اتجاه االنترنت وتطبيقات التجارة اإللكترونية، لطفا أ١٧س
( بشدة أوافق.٥( ال أوافق بشدة إلى )١عدم الموافقة حول هذه العبارات المتدرجة من )
أوافق
بشدة
ال محايد أوافق
أوافق
ال أوافق
بشدة
. أجد المتعة في التفاعل مع االنترنت١ ١ ٢ ٣ ٤ ٥
رة . استخدام الموقع االلكتروني يزودني بمتعة كبي٢ ١ ٢ ٣ ٤ ٥
. أنا أحب فكرة تبني التجارة اإللكترونية في شركتي ٣ ١ ٢ ٣ ٤ ٥
. أعتقد أن التجارة اإللكترونية سوف تطبق على الشركات ٤ ١ ٢ ٣ ٤ ٥
الصغيرة ومتوسطة الحجم في المستقبل القريب
. اعتقد أن تبني التجارة اإللكترونية سوف يكون مفيدا ٥ ١ ٢ ٣ ٤ ٥
لشركتي
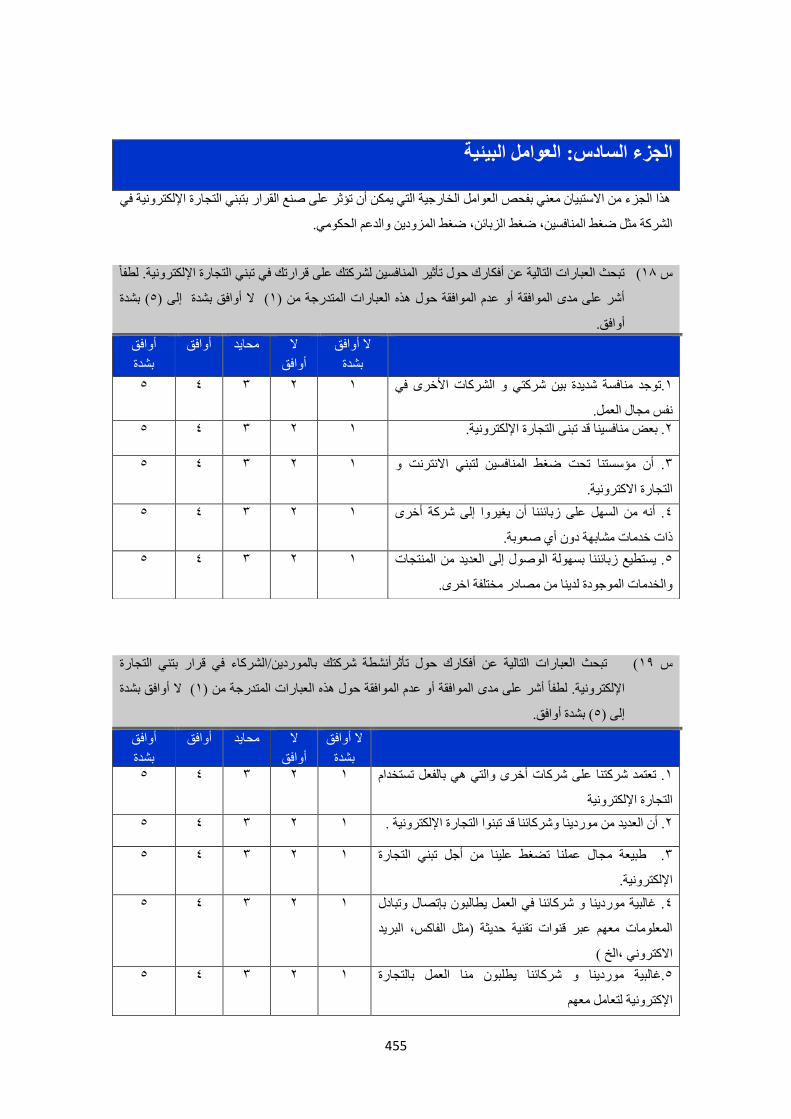
455
ادس: العوامل البيئيةالجزء الس
هذا الجزء من االستبيان معني بفحص العوامل الخارجية التي يمكن أن تؤثر على صنع القرار بتبني التجارة اإللكترونية في
الشركة مثل ضغط المنافسين، ضغط الزبائن، ضغط المزودين والدعم الحكومي.
منافسين لشركتك على قرارتك في تبني التجارة اإللكترونية. لطفا ( تبحث العبارات التالية عن أفكارك حول تأثير ال١٨س
( بشدة ٥( ال أوافق بشدة إلى )١أشر على مدى الموافقة أو عدم الموافقة حول هذه العبارات المتدرجة من )
أوافق.
أوافق
بشدة
ال محايد أوافق
أوافق
ال أوافق
بشدة
و الشركات األخرى في .توجد منافسة شديدة بين شركتي ١ ١ ٢ ٣ ٤ ٥
نفس مجال العمل.
. بعض منافسينا قد تبنى التجارة اإللكترونية.٢ ١ ٢ ٣ ٤ ٥
. أن مؤسستنا تحت ضغط المنافسين لتبني االنترنت و ٣ ١ ٢ ٣ ٤ ٥
التجارة االكترونية.
. أنه من السهل على زبائننا أن يغيروا إلى شركة أخرى ٤ ١ ٢ ٣ ٤ ٥
أي صعوبة.ذات خدمات مشابهة دون
. يستطيع زبائننا بسهولة الوصول إلى العديد من المنتجات ٥ ١ ٢ ٣ ٤ ٥
والخدمات الموجودة لدينا من مصادر مختلفة اخرى.
( تبحث العبارات التالية عن أفكارك حول تأثرأنشطة شركتك بالموردين/الشركاء في قرار بتني التجارة ١٩س
( ال أوافق بشدة ١الموافقة أو عدم الموافقة حول هذه العبارات المتدرجة من )اإللكترونية. لطفا أشر على مدى
( بشدة أوافق.٥إلى )
أوافق
بشدة
ال محايد أوافق
أوافق
ال أوافق
بشدة
. تعتمد شركتنا على شركات أخرى والتي هي بالفعل تستخدام ١ ١ ٢ ٣ ٤ ٥
التجارة اإللكترونية
وردينا وشركائنا قد تبنوا التجارة اإللكترونية .. أن العديد من م٢ ١ ٢ ٣ ٤ ٥
. طبيعة مجال عملنا تضغط علينا من أجل تبني التجارة ٣ ١ ٢ ٣ ٤ ٥
اإللكترونية.
. غالبية موردينا و شركائنا في العمل يطالبون بإتصال وتبادل ٤ ١ ٢ ٣ ٤ ٥
المعلومات معهم عبر قنوات تقنية حديثة )مثل الفاكس، البريد
تروني ،الخ (االك
.غالبية موردينا و شركائنا يطلبون منا العمل بالتجارة ٥ ١ ٢ ٣ ٤ ٥
اإلكترونية لتعامل معهم

456
شكرا لمشاركتك
( العبارات التالية تبحث أفكارك عن تأثير زبائن شركتك على قرار تبني التجارة اإللكترونية. لطفا أشر على مدى ٢٠س
( بشدة أوافق.٥( ال أوافق بشدة إلى )١المتدرجة من )الموافقة أو عدم الموافقة حول هذه العبارات
أوافق
بشدة
ال محايد أوافق
أوافق
ال أوافق
بشدة
.غالبية زبائننا يطلبوننا بتبني التجارة اإللكترونية ١ ١ ٢ ٣ ٤ ٥
.من المحتمل ان تفقد شركتنا الزبائن المحتملين إذا لم تتبنى ٢ ١ ٢ ٣ ٤ ٥
التجارة اإللكترونية
. أن شركتنا تحت ضغط من الزبائن لتبني التجارة ٣ ١ ٢ ٣ ٤ ٥
اإللكترونية
( العبارات التالية تتعلق برأيك حول الدعم الحكومي لقرار تبني التجارة اإللكترونية. لطفا أشر على مدى الموافقة ٢١س
شدة أوافق.( ب٥( ال أوافق بشدة إلى )١أو عدم الموافقة حول هذه العبارات المتدرجة من )
أوافق
بشدة
ال محايد أوافق
أوافق
ال أوافق
بشدة
. تلعب الحكومة دورا مهما في تشجيع التجارة اإللكترونية ١ ١ ٢ ٣ ٤ ٥
ضمن الشركات الصغيرة ومتوسطة الحجم.
. البنية التحتية لالتصاالت وتوفرها وتكنولوجيا االنترنت٢ ١ ٢ ٣ ٤ ٥
لكي( فعالة لدعم و تشجيع مثل )االنترنت السلكي واالس
الشركات على تبني التجارة اإللكترونية
وبرامج تعليمية لشركتنا ٣ ١ ٢ ٣ ٤ ٥ . تقدم الوكاالت الحكومية تدريبا
لتبني التجارة اإللكترونية.
. وجود التشريعات الحكومية للتجارة اإللكترونية في حماية ٤ ١ ٢ ٣ ٤ ٥
التجارة اإللكترونية .البائع والمشتري شجعتنا على تبني
. يوجد لدى الحكومة قوانين فعالة لمنع جرائم االنترنت.٥ ١ ٢ ٣ ٤ ٥
. تقدم الحكومة لنا قروضا لتسهيل تبني التجارة اإللكترونية ٦ ١ ٢ ٣ ٤ ٥
. . الحكومة فعالة في وضع التسهيالت لتمكين التجارة ٧ ١ ٢ ٣ ٤ ٥
باالنترنت.

457
العنوان البريدي................................
....................................................
....................................................
اسم المنشأة : .................................................................
..... البريد االكتروني :.......................................................
رقم الفاكس :..................................................................
زودنا بعنوانك البريدي أو بريدك كمشارك ف ي هذا البحث ،لك الخيار في استقبال نسخة من نتائج هذة الدراسة، لطفا
.تامة وسرية بخصوصية تعامل سوف المعلومات جميع أن ونؤكد ونقدرلكم مشاركتكم اإللكترونية أو رقم الفاكس. هذا
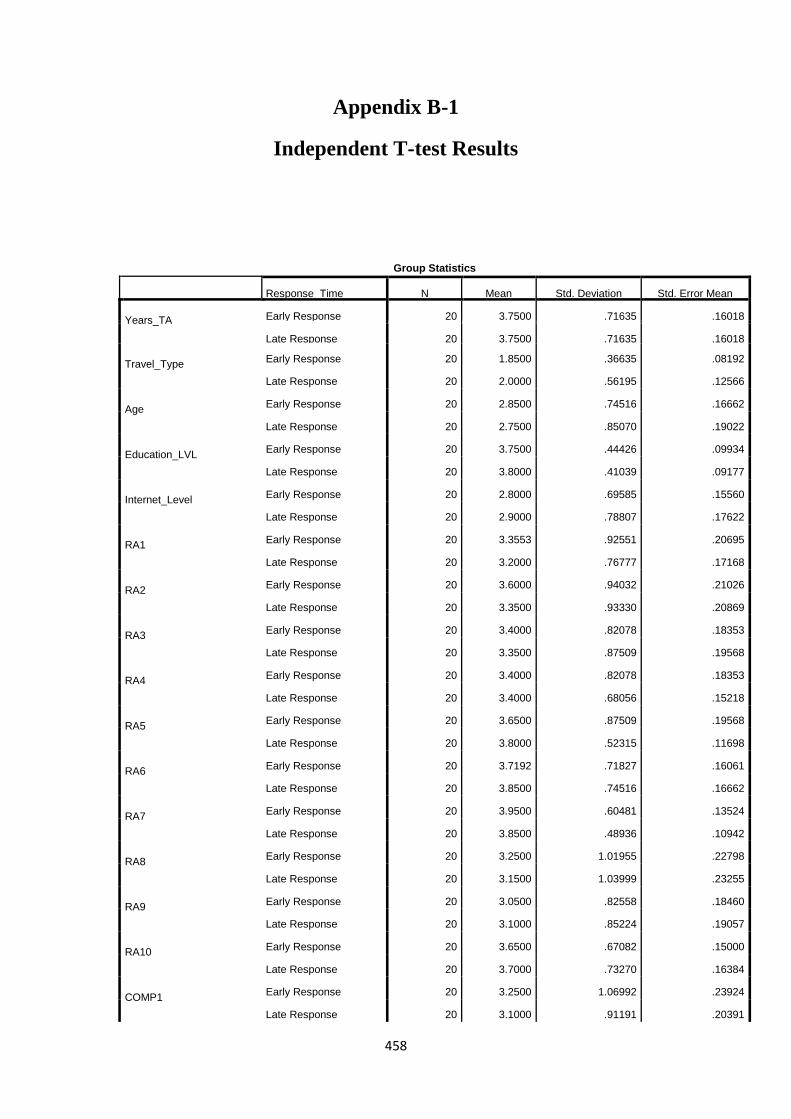
458
Appendix B-1
Independent T-test Results
Group Statistics
Response_Time N Mean Std. Deviation Std. Error Mean
Years_TA Early Response 20 3.7500 .71635 .16018
Late Response 20 3.7500 .71635 .16018
Travel_Type Early Response 20 1.8500 .36635 .08192
Late Response 20 2.0000 .56195 .12566
Age Early Response 20 2.8500 .74516 .16662
Late Response 20 2.7500 .85070 .19022
Education_LVL Early Response 20 3.7500 .44426 .09934
Late Response 20 3.8000 .41039 .09177
Internet_Level Early Response 20 2.8000 .69585 .15560
Late Response 20 2.9000 .78807 .17622
RA1 Early Response 20 3.3553 .92551 .20695
Late Response 20 3.2000 .76777 .17168
RA2 Early Response 20 3.6000 .94032 .21026
Late Response 20 3.3500 .93330 .20869
RA3 Early Response 20 3.4000 .82078 .18353
Late Response 20 3.3500 .87509 .19568
RA4 Early Response 20 3.4000 .82078 .18353
Late Response 20 3.4000 .68056 .15218
RA5 Early Response 20 3.6500 .87509 .19568
Late Response 20 3.8000 .52315 .11698
RA6 Early Response 20 3.7192 .71827 .16061
Late Response 20 3.8500 .74516 .16662
RA7 Early Response 20 3.9500 .60481 .13524
Late Response 20 3.8500 .48936 .10942
RA8 Early Response 20 3.2500 1.01955 .22798
Late Response 20 3.1500 1.03999 .23255
RA9 Early Response 20 3.0500 .82558 .18460
Late Response 20 3.1000 .85224 .19057
RA10 Early Response 20 3.6500 .67082 .15000
Late Response 20 3.7000 .73270 .16384
COMP1 Early Response 20 3.2500 1.06992 .23924
Late Response 20 3.1000 .91191 .20391

459
COMP2 Early Response 20 3.8000 .61559 .13765
Late Response 20 3.8500 .36635 .08192
COMP3 Early Response 20 3.2000 .95145 .21275
Late Response 20 3.2500 1.01955 .22798
COMP4 Early Response 20 3.3500 .81273 .18173
Late Response 20 3.4000 .68056 .15218
COMP5 Early Response 20 3.2000 .95145 .21275
Late Response 20 3.0000 1.07606 .24061
COMP6 Early Response 20 3.9500 .51042 .11413
Late Response 20 3.6500 .67082 .15000
COMP7 Early Response 20 4.0000 .00000 .00000
Late Response 20 4.0000 .56195 .12566
COMPX1 Early Response 20 3.1500 1.08942 .24360
Late Response 20 3.2500 1.20852 .27023
COMPX2 Early Response 20 3.7500 .63867 .14281
Late Response 20 3.5000 .88852 .19868
COMPX3 Early Response 20 3.0000 .97333 .21764
Late Response 20 2.8500 .87509 .19568
COMPX4 Early Response 20 2.9500 1.31689 .29447
Late Response 20 3.1500 1.18210 .26433
TRIAL1 Early Response 20 2.2500 .78640 .17584
Late Response 20 2.3492 .81205 .18158
TRIAL2 Early Response 20 2.6000 .68056 .15218
Late Response 20 2.5500 .94451 .21120
TRIAL3 Early Response 20 2.6000 .68056 .15218
Late Response 20 2.7500 .85070 .19022
TRIAL4 Early Response 20 3.5000 .76089 .17014
Late Response 20 3.4500 .68633 .15347
TRIAL5 Early Response 20 3.2000 .52315 .11698
Late Response 20 3.0500 .68633 .15347
TRIAL6 Early Response 20 2.9000 .71818 .16059
Late Response 20 2.7500 .85070 .19022
OBSRV1 Early Response 20 3.9000 .44721 .10000
Late Response 20 3.8500 .48936 .10942
OBSRV2 Early Response 20 4.0500 .39403 .08811
Late Response 20 3.8000 .69585 .15560
OBSRV3 Early Response 20 4.0500 .39403 .08811
Late Response 20 3.8500 .74516 .16662
OBSRV4 Early Response 20 3.3000 .73270 .16384
Late Response 20 3.4500 .68633 .15347
OBSRV5 Early Response 20 4.1000 .44721 .10000

460
Late Response 20 3.9000 .55251 .12354
FINANCE1 Early Response 20 3.5500 .82558 .18460
Late Response 20 3.5500 .68633 .15347
FINANCE2 Early Response 20 2.1000 .64072 .14327
Late Response 20 2.2500 .85070 .19022
FINANCE3 Early Response 20 3.4305 .86471 .19335
Late Response 20 3.3551 1.03329 .23105
FINANCE4 Early Response 20 3.3500 .87509 .19568
Late Response 20 3.4000 .99472 .22243
IT_KNO_EMP1 Early Response 20 3.0500 1.05006 .23480
Late Response 20 3.2000 1.05631 .23620
IT_KNO_EMP2 Early Response 20 4.0500 .60481 .13524
Late Response 20 4.1000 .85224 .19057
IT_KNO_EMP3 Early Response 20 4.0000 .32444 .07255
Late Response 20 3.9000 .64072 .14327
NUM_EMP Early Response 20 1.1500 .36635 .08192
Late Response 20 1.3500 .58714 .13129
PD1 Early Response 20 3.1000 1.11921 .25026
Late Response 20 3.7000 .73270 .16384
PD2 Early Response 20 3.7000 .86450 .19331
Late Response 20 3.6000 .75394 .16859
PD3 Early Response 20 4.0500 .68633 .15347
Late Response 20 3.4500 .88704 .19835
PD4 Early Response 20 2.9500 .99868 .22331
Late Response 20 2.7500 1.06992 .23924
PD5 Early Response 20 3.5500 .82558 .18460
Late Response 20 3.5000 .60698 .13572
PD6 Early Response 20 3.8655 .81869 .18306
Late Response 20 3.2000 .69585 .15560
PD7 Early Response 20 3.3000 .73270 .16384
Late Response 20 3.0000 .79472 .17770
MGMTSUP1 Early Response 20 3.5500 .68633 .15347
Late Response 20 3.5000 .51299 .11471
MGMTSUP2 Early Response 20 3.4000 .68056 .15218
Late Response 20 3.3000 .73270 .16384
MGMTSUP3 Early Response 20 3.9000 .64072 .14327
Late Response 20 3.7000 .65695 .14690
UA1 Early Response 20 3.5500 .68633 .15347
Late Response 20 3.1500 .93330 .20869
UA2 Early Response 20 3.1000 .78807 .17622
Late Response 20 3.3500 .81273 .18173
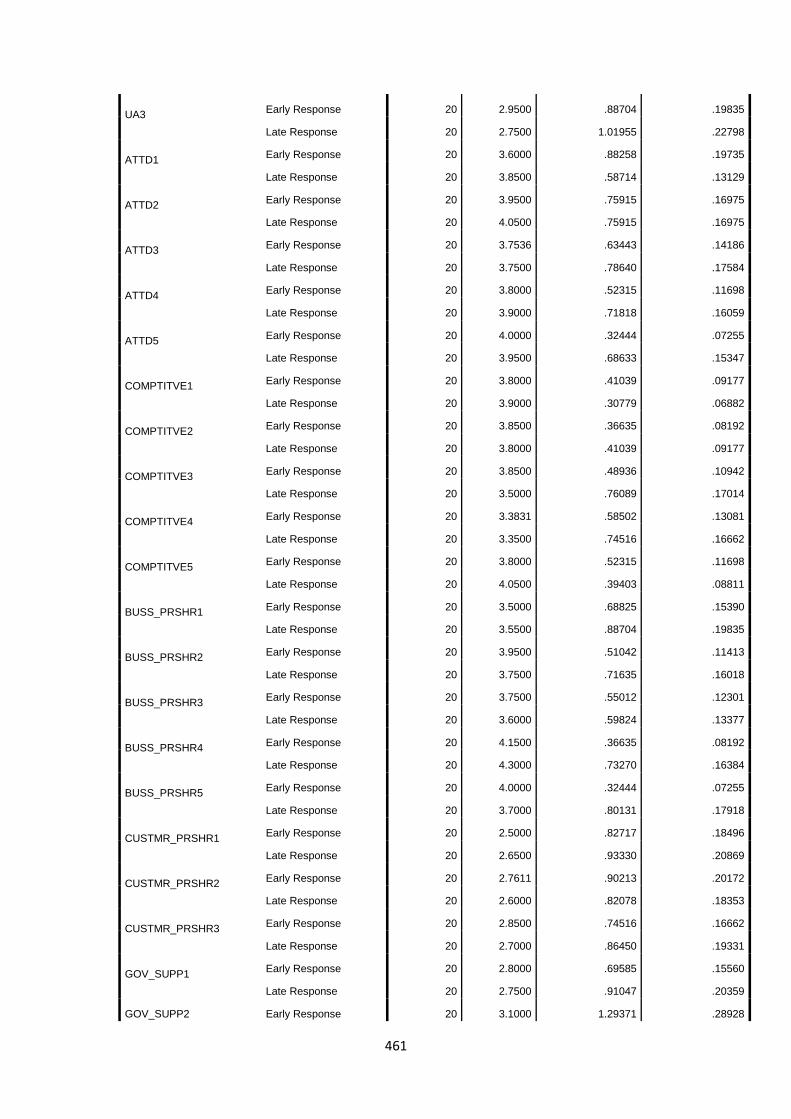
461
UA3 Early Response 20 2.9500 .88704 .19835
Late Response 20 2.7500 1.01955 .22798
ATTD1 Early Response 20 3.6000 .88258 .19735
Late Response 20 3.8500 .58714 .13129
ATTD2 Early Response 20 3.9500 .75915 .16975
Late Response 20 4.0500 .75915 .16975
ATTD3 Early Response 20 3.7536 .63443 .14186
Late Response 20 3.7500 .78640 .17584
ATTD4 Early Response 20 3.8000 .52315 .11698
Late Response 20 3.9000 .71818 .16059
ATTD5 Early Response 20 4.0000 .32444 .07255
Late Response 20 3.9500 .68633 .15347
COMPTITVE1 Early Response 20 3.8000 .41039 .09177
Late Response 20 3.9000 .30779 .06882
COMPTITVE2 Early Response 20 3.8500 .36635 .08192
Late Response 20 3.8000 .41039 .09177
COMPTITVE3 Early Response 20 3.8500 .48936 .10942
Late Response 20 3.5000 .76089 .17014
COMPTITVE4 Early Response 20 3.3831 .58502 .13081
Late Response 20 3.3500 .74516 .16662
COMPTITVE5 Early Response 20 3.8000 .52315 .11698
Late Response 20 4.0500 .39403 .08811
BUSS_PRSHR1 Early Response 20 3.5000 .68825 .15390
Late Response 20 3.5500 .88704 .19835
BUSS_PRSHR2 Early Response 20 3.9500 .51042 .11413
Late Response 20 3.7500 .71635 .16018
BUSS_PRSHR3 Early Response 20 3.7500 .55012 .12301
Late Response 20 3.6000 .59824 .13377
BUSS_PRSHR4 Early Response 20 4.1500 .36635 .08192
Late Response 20 4.3000 .73270 .16384
BUSS_PRSHR5 Early Response 20 4.0000 .32444 .07255
Late Response 20 3.7000 .80131 .17918
CUSTMR_PRSHR1 Early Response 20 2.5000 .82717 .18496
Late Response 20 2.6500 .93330 .20869
CUSTMR_PRSHR2 Early Response 20 2.7611 .90213 .20172
Late Response 20 2.6000 .82078 .18353
CUSTMR_PRSHR3 Early Response 20 2.8500 .74516 .16662
Late Response 20 2.7000 .86450 .19331
GOV_SUPP1 Early Response 20 2.8000 .69585 .15560
Late Response 20 2.7500 .91047 .20359
GOV_SUPP2 Early Response 20 3.1000 1.29371 .28928

462
Late Response 20 3.7000 .86450 .19331
GOV_SUPP3 Early Response 20 3.0122 .67230 .15033
Late Response 20 2.8162 .71173 .15915
GOV_SUPP4 Early Response 20 2.6466 .59123 .13220
Late Response 20 2.9500 .60481 .13524
GOV_SUPP5 Early Response 20 2.4500 .60481 .13524
Late Response 20 2.7500 .78640 .17584
GOV_SUPP6 Early Response 20 2.1481 .67423 .15076
Late Response 20 2.1154 .55387 .12385
GOV_SUPP7 Early Response 20 2.0500 .51042 .11413
Late Response 20 2.0000 .64889 .14510
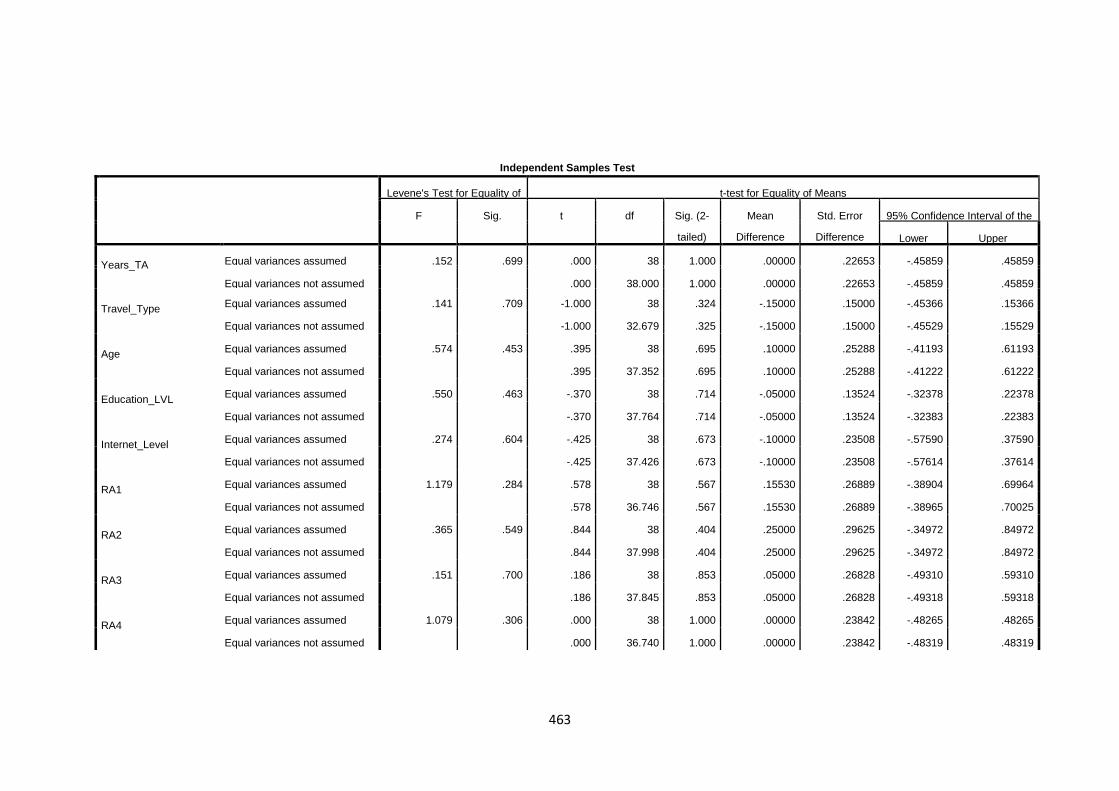
463
Independent Samples Test
Levene's Test for Equality of
Variances
t-test for Equality of Means
F Sig. t df Sig. (2-
tailed)
Mean
Difference
Std. Error
Difference
95% Confidence Interval of the
Difference Lower Upper
Years_TA Equal variances assumed .152 .699 .000 38 1.000 .00000 .22653 -.45859 .45859
Equal variances not assumed
.000 38.000 1.000 .00000 .22653 -.45859 .45859
Travel_Type Equal variances assumed .141 .709 -1.000 38 .324 -.15000 .15000 -.45366 .15366
Equal variances not assumed
-1.000 32.679 .325 -.15000 .15000 -.45529 .15529
Age Equal variances assumed .574 .453 .395 38 .695 .10000 .25288 -.41193 .61193
Equal variances not assumed
.395 37.352 .695 .10000 .25288 -.41222 .61222
Education_LVL Equal variances assumed .550 .463 -.370 38 .714 -.05000 .13524 -.32378 .22378
Equal variances not assumed
-.370 37.764 .714 -.05000 .13524 -.32383 .22383
Internet_Level Equal variances assumed .274 .604 -.425 38 .673 -.10000 .23508 -.57590 .37590
Equal variances not assumed
-.425 37.426 .673 -.10000 .23508 -.57614 .37614
RA1 Equal variances assumed 1.179 .284 .578 38 .567 .15530 .26889 -.38904 .69964
Equal variances not assumed
.578 36.746 .567 .15530 .26889 -.38965 .70025
RA2 Equal variances assumed .365 .549 .844 38 .404 .25000 .29625 -.34972 .84972
Equal variances not assumed
.844 37.998 .404 .25000 .29625 -.34972 .84972
RA3 Equal variances assumed .151 .700 .186 38 .853 .05000 .26828 -.49310 .59310
Equal variances not assumed
.186 37.845 .853 .05000 .26828 -.49318 .59318
RA4 Equal variances assumed 1.079 .306 .000 38 1.000 .00000 .23842 -.48265 .48265
Equal variances not assumed
.000 36.740 1.000 .00000 .23842 -.48319 .48319
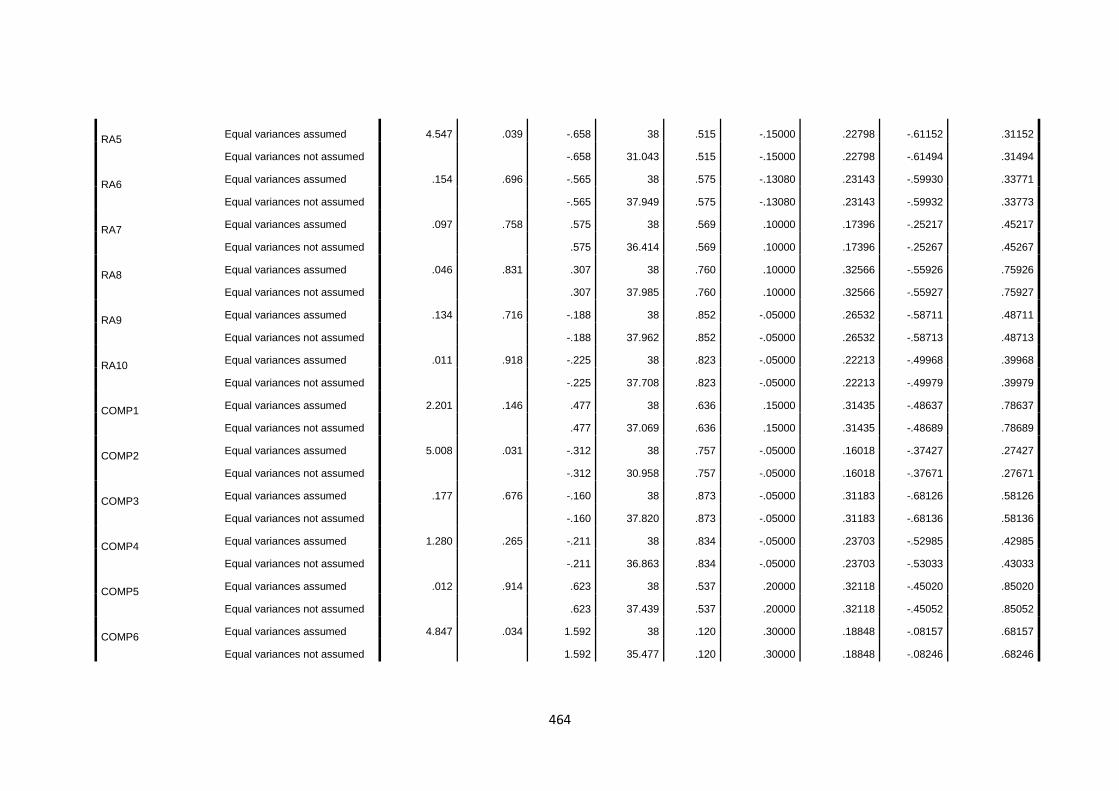
464
RA5 Equal variances assumed 4.547 .039 -.658 38 .515 -.15000 .22798 -.61152 .31152
Equal variances not assumed
-.658 31.043 .515 -.15000 .22798 -.61494 .31494
RA6 Equal variances assumed .154 .696 -.565 38 .575 -.13080 .23143 -.59930 .33771
Equal variances not assumed
-.565 37.949 .575 -.13080 .23143 -.59932 .33773
RA7 Equal variances assumed .097 .758 .575 38 .569 .10000 .17396 -.25217 .45217
Equal variances not assumed
.575 36.414 .569 .10000 .17396 -.25267 .45267
RA8 Equal variances assumed .046 .831 .307 38 .760 .10000 .32566 -.55926 .75926
Equal variances not assumed
.307 37.985 .760 .10000 .32566 -.55927 .75927
RA9 Equal variances assumed .134 .716 -.188 38 .852 -.05000 .26532 -.58711 .48711
Equal variances not assumed
-.188 37.962 .852 -.05000 .26532 -.58713 .48713
RA10 Equal variances assumed .011 .918 -.225 38 .823 -.05000 .22213 -.49968 .39968
Equal variances not assumed
-.225 37.708 .823 -.05000 .22213 -.49979 .39979
COMP1 Equal variances assumed 2.201 .146 .477 38 .636 .15000 .31435 -.48637 .78637
Equal variances not assumed
.477 37.069 .636 .15000 .31435 -.48689 .78689
COMP2 Equal variances assumed 5.008 .031 -.312 38 .757 -.05000 .16018 -.37427 .27427
Equal variances not assumed
-.312 30.958 .757 -.05000 .16018 -.37671 .27671
COMP3 Equal variances assumed .177 .676 -.160 38 .873 -.05000 .31183 -.68126 .58126
Equal variances not assumed
-.160 37.820 .873 -.05000 .31183 -.68136 .58136
COMP4 Equal variances assumed 1.280 .265 -.211 38 .834 -.05000 .23703 -.52985 .42985
Equal variances not assumed
-.211 36.863 .834 -.05000 .23703 -.53033 .43033
COMP5 Equal variances assumed .012 .914 .623 38 .537 .20000 .32118 -.45020 .85020
Equal variances not assumed
.623 37.439 .537 .20000 .32118 -.45052 .85052
COMP6 Equal variances assumed 4.847 .034 1.592 38 .120 .30000 .18848 -.08157 .68157
Equal variances not assumed
1.592 35.477 .120 .30000 .18848 -.08246 .68246
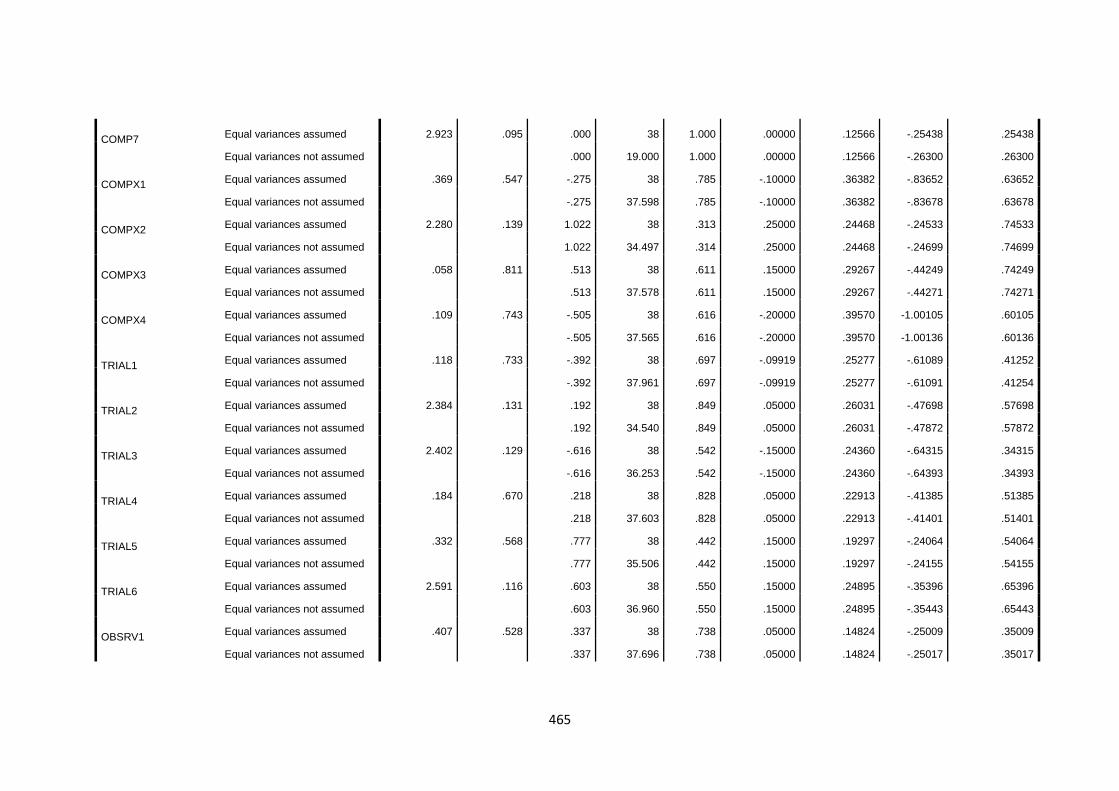
465
COMP7 Equal variances assumed 2.923 .095 .000 38 1.000 .00000 .12566 -.25438 .25438
Equal variances not assumed
.000 19.000 1.000 .00000 .12566 -.26300 .26300
COMPX1 Equal variances assumed .369 .547 -.275 38 .785 -.10000 .36382 -.83652 .63652
Equal variances not assumed
-.275 37.598 .785 -.10000 .36382 -.83678 .63678
COMPX2 Equal variances assumed 2.280 .139 1.022 38 .313 .25000 .24468 -.24533 .74533
Equal variances not assumed
1.022 34.497 .314 .25000 .24468 -.24699 .74699
COMPX3 Equal variances assumed .058 .811 .513 38 .611 .15000 .29267 -.44249 .74249
Equal variances not assumed
.513 37.578 .611 .15000 .29267 -.44271 .74271
COMPX4 Equal variances assumed .109 .743 -.505 38 .616 -.20000 .39570 -1.00105 .60105
Equal variances not assumed
-.505 37.565 .616 -.20000 .39570 -1.00136 .60136
TRIAL1 Equal variances assumed .118 .733 -.392 38 .697 -.09919 .25277 -.61089 .41252
Equal variances not assumed
-.392 37.961 .697 -.09919 .25277 -.61091 .41254
TRIAL2 Equal variances assumed 2.384 .131 .192 38 .849 .05000 .26031 -.47698 .57698
Equal variances not assumed
.192 34.540 .849 .05000 .26031 -.47872 .57872
TRIAL3 Equal variances assumed 2.402 .129 -.616 38 .542 -.15000 .24360 -.64315 .34315
Equal variances not assumed
-.616 36.253 .542 -.15000 .24360 -.64393 .34393
TRIAL4 Equal variances assumed .184 .670 .218 38 .828 .05000 .22913 -.41385 .51385
Equal variances not assumed
.218 37.603 .828 .05000 .22913 -.41401 .51401
TRIAL5 Equal variances assumed .332 .568 .777 38 .442 .15000 .19297 -.24064 .54064
Equal variances not assumed
.777 35.506 .442 .15000 .19297 -.24155 .54155
TRIAL6 Equal variances assumed 2.591 .116 .603 38 .550 .15000 .24895 -.35396 .65396
Equal variances not assumed
.603 36.960 .550 .15000 .24895 -.35443 .65443
OBSRV1 Equal variances assumed .407 .528 .337 38 .738 .05000 .14824 -.25009 .35009
Equal variances not assumed
.337 37.696 .738 .05000 .14824 -.25017 .35017
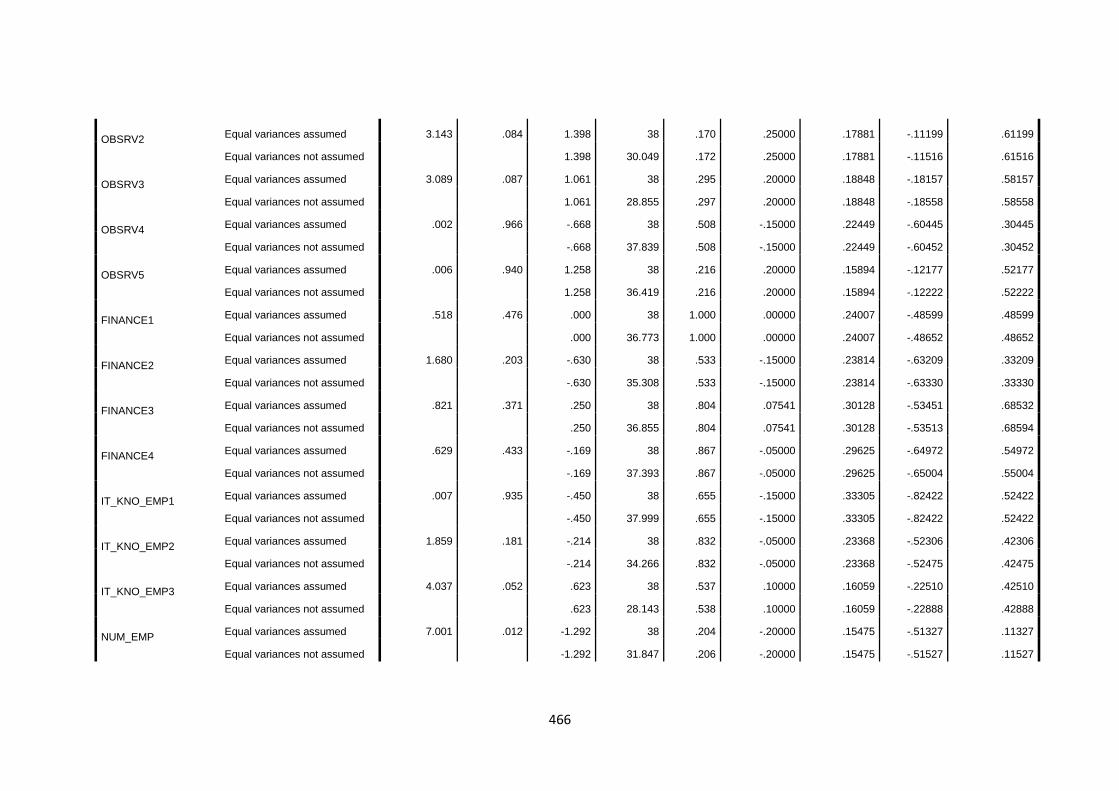
466
OBSRV2 Equal variances assumed 3.143 .084 1.398 38 .170 .25000 .17881 -.11199 .61199
Equal variances not assumed
1.398 30.049 .172 .25000 .17881 -.11516 .61516
OBSRV3 Equal variances assumed 3.089 .087 1.061 38 .295 .20000 .18848 -.18157 .58157
Equal variances not assumed
1.061 28.855 .297 .20000 .18848 -.18558 .58558
OBSRV4 Equal variances assumed .002 .966 -.668 38 .508 -.15000 .22449 -.60445 .30445
Equal variances not assumed
-.668 37.839 .508 -.15000 .22449 -.60452 .30452
OBSRV5 Equal variances assumed .006 .940 1.258 38 .216 .20000 .15894 -.12177 .52177
Equal variances not assumed
1.258 36.419 .216 .20000 .15894 -.12222 .52222
FINANCE1 Equal variances assumed .518 .476 .000 38 1.000 .00000 .24007 -.48599 .48599
Equal variances not assumed
.000 36.773 1.000 .00000 .24007 -.48652 .48652
FINANCE2 Equal variances assumed 1.680 .203 -.630 38 .533 -.15000 .23814 -.63209 .33209
Equal variances not assumed
-.630 35.308 .533 -.15000 .23814 -.63330 .33330
FINANCE3 Equal variances assumed .821 .371 .250 38 .804 .07541 .30128 -.53451 .68532
Equal variances not assumed
.250 36.855 .804 .07541 .30128 -.53513 .68594
FINANCE4 Equal variances assumed .629 .433 -.169 38 .867 -.05000 .29625 -.64972 .54972
Equal variances not assumed
-.169 37.393 .867 -.05000 .29625 -.65004 .55004
IT_KNO_EMP1 Equal variances assumed .007 .935 -.450 38 .655 -.15000 .33305 -.82422 .52422
Equal variances not assumed
-.450 37.999 .655 -.15000 .33305 -.82422 .52422
IT_KNO_EMP2 Equal variances assumed 1.859 .181 -.214 38 .832 -.05000 .23368 -.52306 .42306
Equal variances not assumed
-.214 34.266 .832 -.05000 .23368 -.52475 .42475
IT_KNO_EMP3 Equal variances assumed 4.037 .052 .623 38 .537 .10000 .16059 -.22510 .42510
Equal variances not assumed
.623 28.143 .538 .10000 .16059 -.22888 .42888
NUM_EMP Equal variances assumed 7.001 .012 -1.292 38 .204 -.20000 .15475 -.51327 .11327
Equal variances not assumed
-1.292 31.847 .206 -.20000 .15475 -.51527 .11527
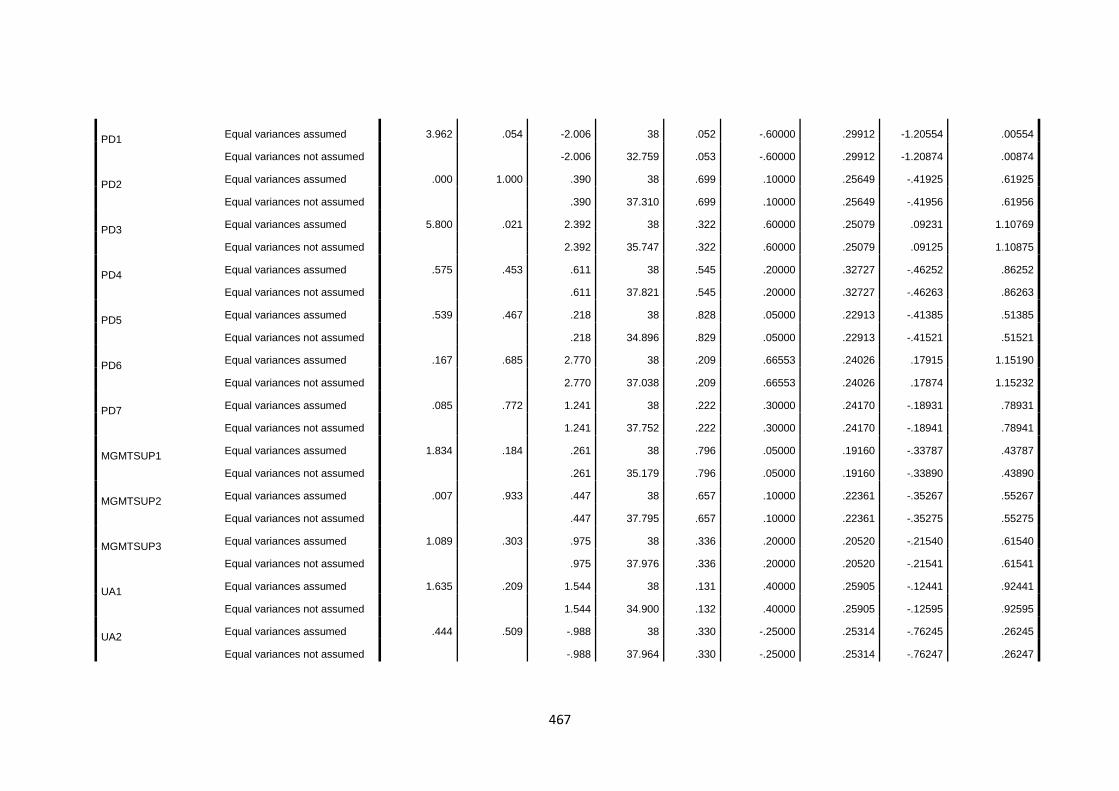
467
PD1 Equal variances assumed 3.962 .054 -2.006 38 .052 -.60000 .29912 -1.20554 .00554
Equal variances not assumed
-2.006 32.759 .053 -.60000 .29912 -1.20874 .00874
PD2 Equal variances assumed .000 1.000 .390 38 .699 .10000 .25649 -.41925 .61925
Equal variances not assumed
.390 37.310 .699 .10000 .25649 -.41956 .61956
PD3 Equal variances assumed 5.800 .021 2.392 38 .322 .60000 .25079 .09231 1.10769
Equal variances not assumed
2.392 35.747 .322 .60000 .25079 .09125 1.10875
PD4 Equal variances assumed .575 .453 .611 38 .545 .20000 .32727 -.46252 .86252
Equal variances not assumed
.611 37.821 .545 .20000 .32727 -.46263 .86263
PD5 Equal variances assumed .539 .467 .218 38 .828 .05000 .22913 -.41385 .51385
Equal variances not assumed
.218 34.896 .829 .05000 .22913 -.41521 .51521
PD6 Equal variances assumed .167 .685 2.770 38 .209 .66553 .24026 .17915 1.15190
Equal variances not assumed
2.770 37.038 .209 .66553 .24026 .17874 1.15232
PD7 Equal variances assumed .085 .772 1.241 38 .222 .30000 .24170 -.18931 .78931
Equal variances not assumed
1.241 37.752 .222 .30000 .24170 -.18941 .78941
MGMTSUP1 Equal variances assumed 1.834 .184 .261 38 .796 .05000 .19160 -.33787 .43787
Equal variances not assumed
.261 35.179 .796 .05000 .19160 -.33890 .43890
MGMTSUP2 Equal variances assumed .007 .933 .447 38 .657 .10000 .22361 -.35267 .55267
Equal variances not assumed
.447 37.795 .657 .10000 .22361 -.35275 .55275
MGMTSUP3 Equal variances assumed 1.089 .303 .975 38 .336 .20000 .20520 -.21540 .61540
Equal variances not assumed
.975 37.976 .336 .20000 .20520 -.21541 .61541
UA1 Equal variances assumed 1.635 .209 1.544 38 .131 .40000 .25905 -.12441 .92441
Equal variances not assumed
1.544 34.900 .132 .40000 .25905 -.12595 .92595
UA2 Equal variances assumed .444 .509 -.988 38 .330 -.25000 .25314 -.76245 .26245
Equal variances not assumed
-.988 37.964 .330 -.25000 .25314 -.76247 .26247
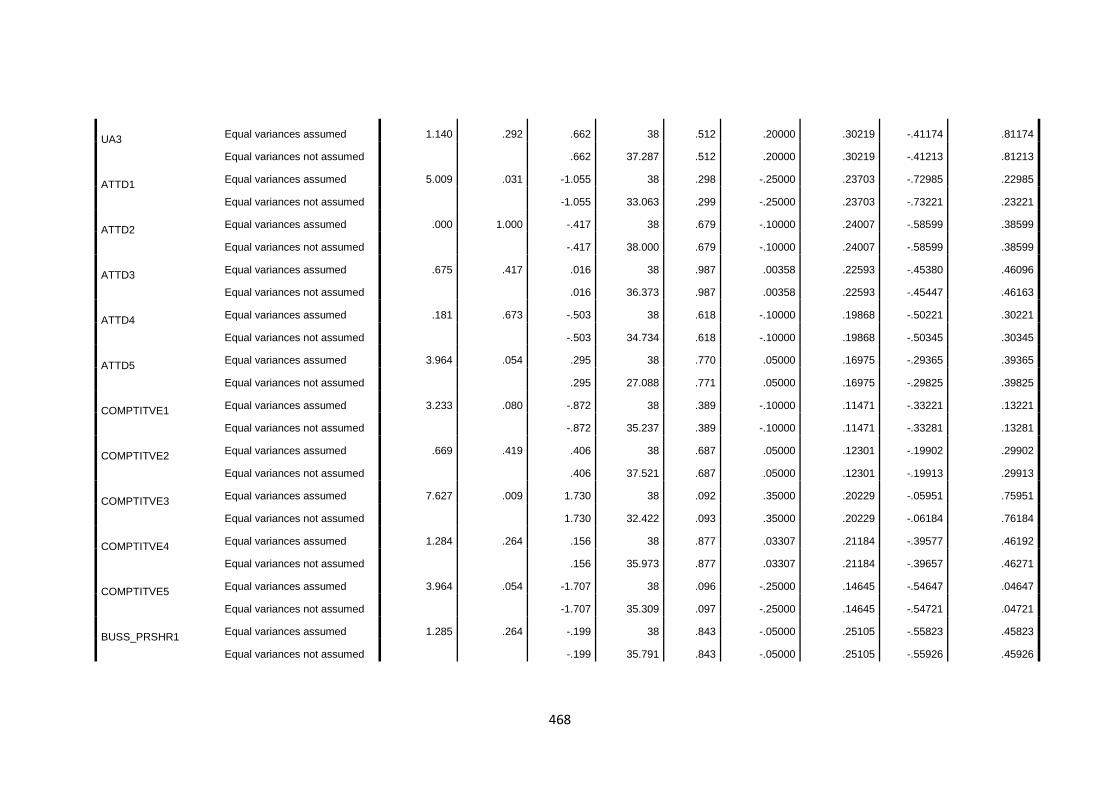
468
UA3 Equal variances assumed 1.140 .292 .662 38 .512 .20000 .30219 -.41174 .81174
Equal variances not assumed
.662 37.287 .512 .20000 .30219 -.41213 .81213
ATTD1 Equal variances assumed 5.009 .031 -1.055 38 .298 -.25000 .23703 -.72985 .22985
Equal variances not assumed
-1.055 33.063 .299 -.25000 .23703 -.73221 .23221
ATTD2 Equal variances assumed .000 1.000 -.417 38 .679 -.10000 .24007 -.58599 .38599
Equal variances not assumed
-.417 38.000 .679 -.10000 .24007 -.58599 .38599
ATTD3 Equal variances assumed .675 .417 .016 38 .987 .00358 .22593 -.45380 .46096
Equal variances not assumed
.016 36.373 .987 .00358 .22593 -.45447 .46163
ATTD4 Equal variances assumed .181 .673 -.503 38 .618 -.10000 .19868 -.50221 .30221
Equal variances not assumed
-.503 34.734 .618 -.10000 .19868 -.50345 .30345
ATTD5 Equal variances assumed 3.964 .054 .295 38 .770 .05000 .16975 -.29365 .39365
Equal variances not assumed
.295 27.088 .771 .05000 .16975 -.29825 .39825
COMPTITVE1 Equal variances assumed 3.233 .080 -.872 38 .389 -.10000 .11471 -.33221 .13221
Equal variances not assumed
-.872 35.237 .389 -.10000 .11471 -.33281 .13281
COMPTITVE2 Equal variances assumed .669 .419 .406 38 .687 .05000 .12301 -.19902 .29902
Equal variances not assumed
.406 37.521 .687 .05000 .12301 -.19913 .29913
COMPTITVE3 Equal variances assumed 7.627 .009 1.730 38 .092 .35000 .20229 -.05951 .75951
Equal variances not assumed
1.730 32.422 .093 .35000 .20229 -.06184 .76184
COMPTITVE4 Equal variances assumed 1.284 .264 .156 38 .877 .03307 .21184 -.39577 .46192
Equal variances not assumed
.156 35.973 .877 .03307 .21184 -.39657 .46271
COMPTITVE5 Equal variances assumed 3.964 .054 -1.707 38 .096 -.25000 .14645 -.54647 .04647
Equal variances not assumed
-1.707 35.309 .097 -.25000 .14645 -.54721 .04721
BUSS_PRSHR1 Equal variances assumed 1.285 .264 -.199 38 .843 -.05000 .25105 -.55823 .45823
Equal variances not assumed
-.199 35.791 .843 -.05000 .25105 -.55926 .45926
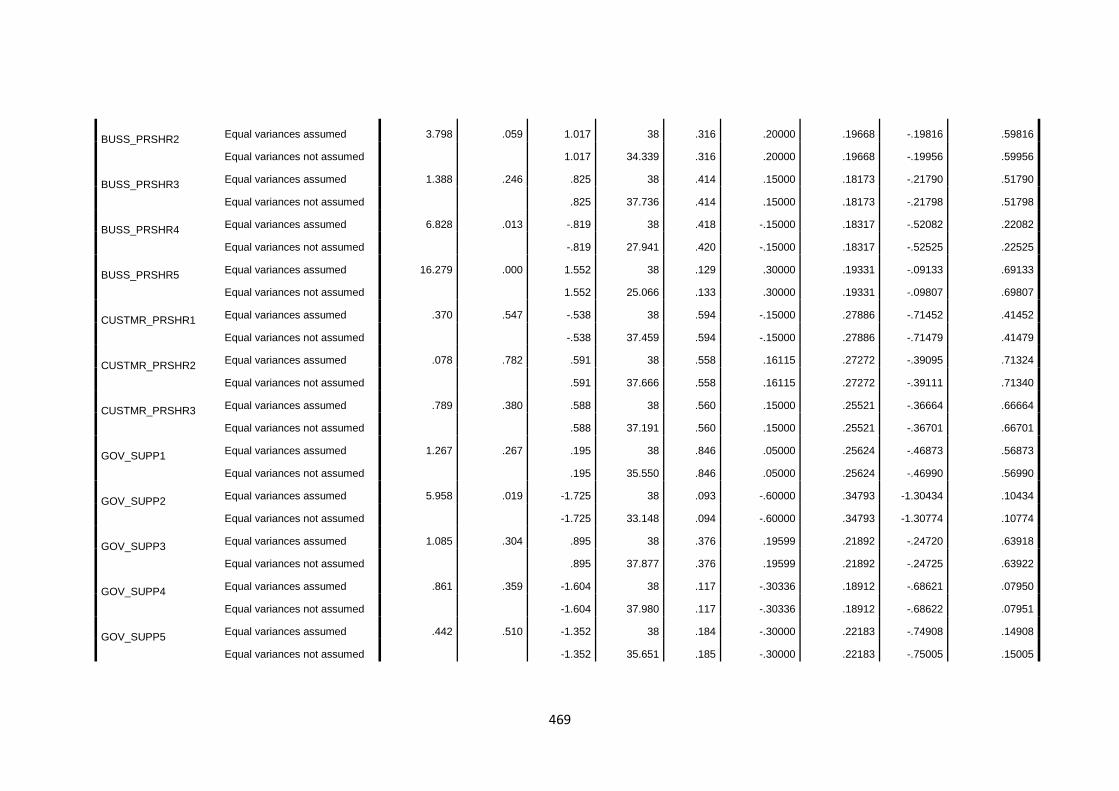
469
BUSS_PRSHR2 Equal variances assumed 3.798 .059 1.017 38 .316 .20000 .19668 -.19816 .59816
Equal variances not assumed
1.017 34.339 .316 .20000 .19668 -.19956 .59956
BUSS_PRSHR3 Equal variances assumed 1.388 .246 .825 38 .414 .15000 .18173 -.21790 .51790
Equal variances not assumed
.825 37.736 .414 .15000 .18173 -.21798 .51798
BUSS_PRSHR4 Equal variances assumed 6.828 .013 -.819 38 .418 -.15000 .18317 -.52082 .22082
Equal variances not assumed
-.819 27.941 .420 -.15000 .18317 -.52525 .22525
BUSS_PRSHR5 Equal variances assumed 16.279 .000 1.552 38 .129 .30000 .19331 -.09133 .69133
Equal variances not assumed
1.552 25.066 .133 .30000 .19331 -.09807 .69807
CUSTMR_PRSHR1 Equal variances assumed .370 .547 -.538 38 .594 -.15000 .27886 -.71452 .41452
Equal variances not assumed
-.538 37.459 .594 -.15000 .27886 -.71479 .41479
CUSTMR_PRSHR2 Equal variances assumed .078 .782 .591 38 .558 .16115 .27272 -.39095 .71324
Equal variances not assumed
.591 37.666 .558 .16115 .27272 -.39111 .71340
CUSTMR_PRSHR3 Equal variances assumed .789 .380 .588 38 .560 .15000 .25521 -.36664 .66664
Equal variances not assumed
.588 37.191 .560 .15000 .25521 -.36701 .66701
GOV_SUPP1 Equal variances assumed 1.267 .267 .195 38 .846 .05000 .25624 -.46873 .56873
Equal variances not assumed
.195 35.550 .846 .05000 .25624 -.46990 .56990
GOV_SUPP2 Equal variances assumed 5.958 .019 -1.725 38 .093 -.60000 .34793 -1.30434 .10434
Equal variances not assumed
-1.725 33.148 .094 -.60000 .34793 -1.30774 .10774
GOV_SUPP3 Equal variances assumed 1.085 .304 .895 38 .376 .19599 .21892 -.24720 .63918
Equal variances not assumed
.895 37.877 .376 .19599 .21892 -.24725 .63922
GOV_SUPP4 Equal variances assumed .861 .359 -1.604 38 .117 -.30336 .18912 -.68621 .07950
Equal variances not assumed
-1.604 37.980 .117 -.30336 .18912 -.68622 .07951
GOV_SUPP5 Equal variances assumed .442 .510 -1.352 38 .184 -.30000 .22183 -.74908 .14908
Equal variances not assumed
-1.352 35.651 .185 -.30000 .22183 -.75005 .15005
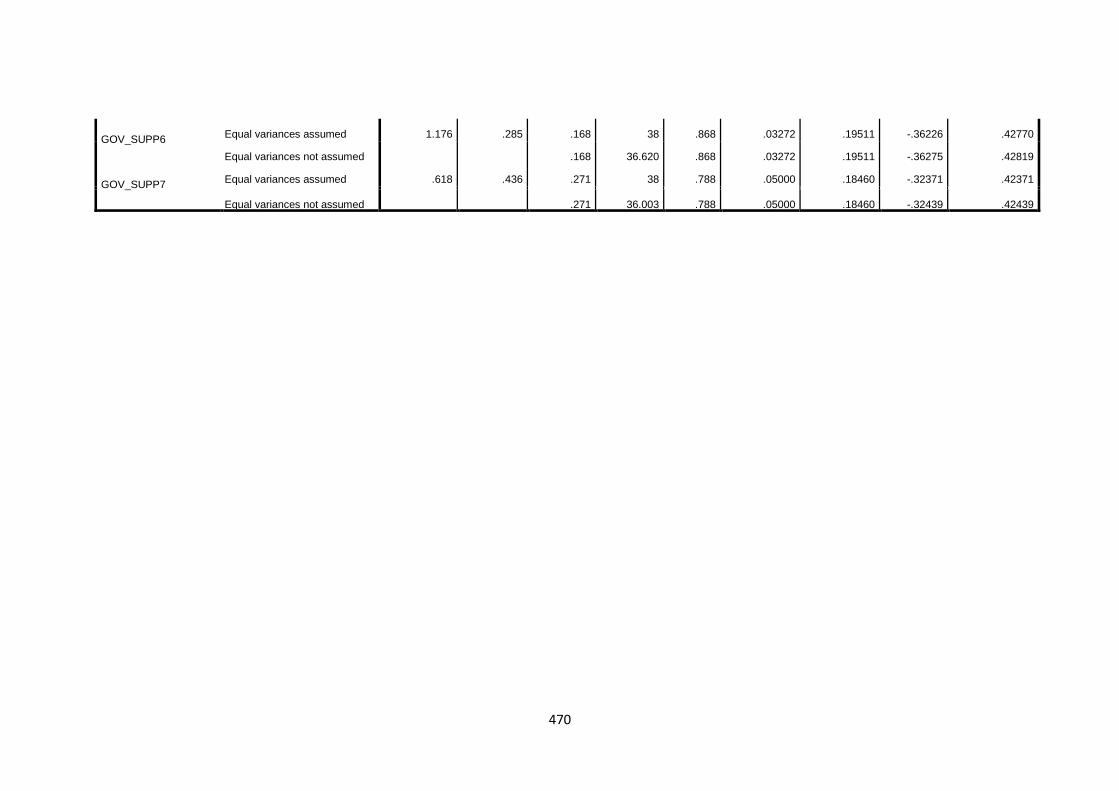
470
GOV_SUPP6 Equal variances assumed 1.176 .285 .168 38 .868 .03272 .19511 -.36226 .42770
Equal variances not assumed
.168 36.620 .868 .03272 .19511 -.36275 .42819
GOV_SUPP7 Equal variances assumed .618 .436 .271 38 .788 .05000 .18460 -.32371 .42371
Equal variances not assumed
.271 36.003 .788 .05000 .18460 -.32439 .42439
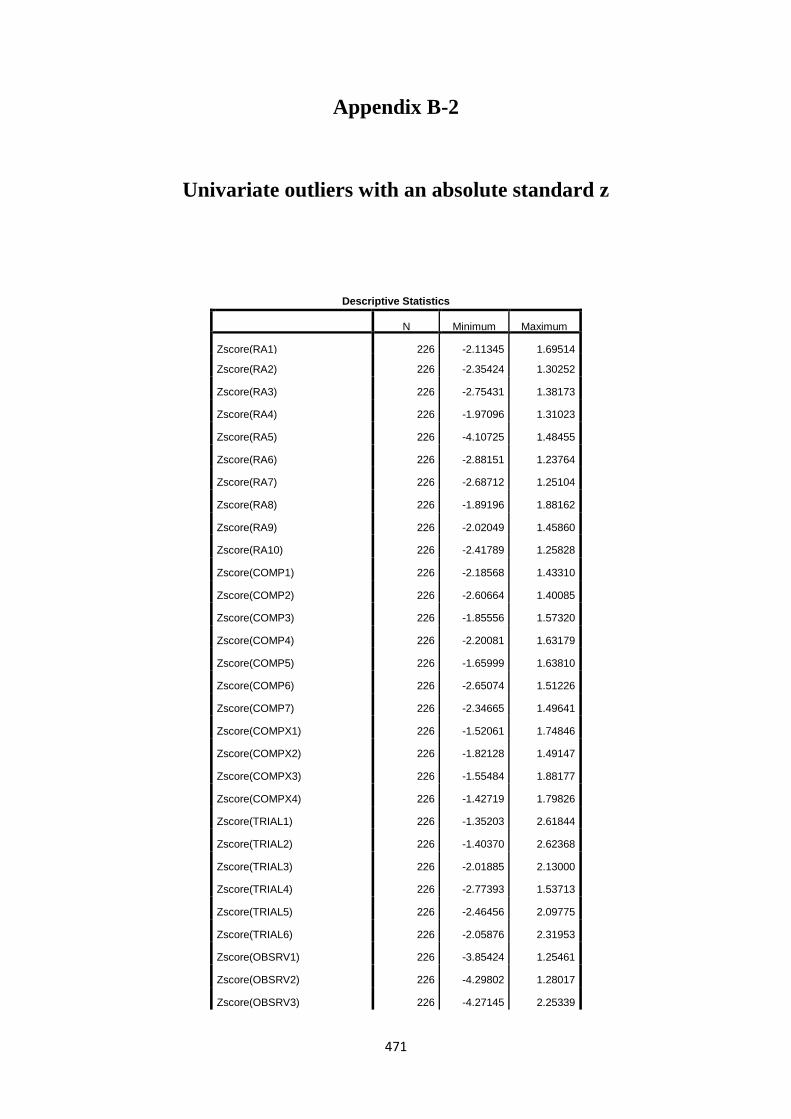
471
Appendix B-2
Univariate outliers with an absolute standard z
Descriptive Statistics
N Minimum Maximum
Zscore(RA1) 226 -2.11345 1.69514
Zscore(RA2) 226 -2.35424 1.30252
Zscore(RA3) 226 -2.75431 1.38173
Zscore(RA4) 226 -1.97096 1.31023
Zscore(RA5) 226 -4.10725 1.48455
Zscore(RA6) 226 -2.88151 1.23764
Zscore(RA7) 226 -2.68712 1.25104
Zscore(RA8) 226 -1.89196 1.88162
Zscore(RA9) 226 -2.02049 1.45860
Zscore(RA10) 226 -2.41789 1.25828
Zscore(COMP1) 226 -2.18568 1.43310
Zscore(COMP2) 226 -2.60664 1.40085
Zscore(COMP3) 226 -1.85556 1.57320
Zscore(COMP4) 226 -2.20081 1.63179
Zscore(COMP5) 226 -1.65999 1.63810
Zscore(COMP6) 226 -2.65074 1.51226
Zscore(COMP7) 226 -2.34665 1.49641
Zscore(COMPX1) 226 -1.52061 1.74846
Zscore(COMPX2) 226 -1.82128 1.49147
Zscore(COMPX3) 226 -1.55484 1.88177
Zscore(COMPX4) 226 -1.42719 1.79826
Zscore(TRIAL1) 226 -1.35203 2.61844
Zscore(TRIAL2) 226 -1.40370 2.62368
Zscore(TRIAL3) 226 -2.01885 2.13000
Zscore(TRIAL4) 226 -2.77393 1.53713
Zscore(TRIAL5) 226 -2.46456 2.09775
Zscore(TRIAL6) 226 -2.05876 2.31953
Zscore(OBSRV1) 226 -3.85424 1.25461
Zscore(OBSRV2) 226 -4.29802 1.28017
Zscore(OBSRV3) 226 -4.27145 2.25339

472
Zscore(OBSRV4) 226 -1.99668 1.46781
Zscore(OBSRV5) 226 -2.83992 1.30883
Zscore(FINANCE1) 226 -2.26958 1.40730
Zscore(FINANCE2) 226 -1.23459 2.61125
Zscore(FINANCE3) 226 -2.17188 1.60947
Zscore(FINANCE4) 226 -2.33923 1.48591
Zscore(IT_KNO_EMP1) 226 -1.37555 1.92660
Zscore(IT_KNO_EMP2) 226 -3.97612 1.10792
Zscore(IT_KNO_EMP3) 226 -3.19085 1.33745
Zscore(NUM_EMP) 226 -.60244 4.50324
Zscore(PD1) 226 -2.57598 1.28937
Zscore(PD2) 226 -2.02060 1.42586
Zscore(PD3) 226 -1.84405 1.55435
Zscore(PD4) 226 -1.22472 2.66508
Zscore(PD5) 226 -2.24492 1.61738
Zscore(PD6) 226 -1.67212 1.69964
Zscore(PD7) 226 -1.23876 2.22875
Zscore(MGMTSUP1) 226 -3.27044 1.64882
Zscore(MGMTSUP2) 226 -3.12475 1.43030
Zscore(MGMTSUP3) 226 -2.87985 1.41616
Zscore(UA1) 226 -2.16431 1.54636
Zscore(UA2) 226 -2.81629 1.46525
Zscore(UA3) 226 -1.84519 1.70204
Zscore(ATTD1) 226 -3.30896 1.05790
Zscore(ATTD2) 226 -3.36283 1.07512
Zscore(ATTD3) 226 -2.95800 1.17622
Zscore(ATTD4) 226 -3.18350 1.14167
Zscore(ATTD5) 226 -3.11100 1.07559
Zscore(COMPTITVE1) 226 -5.28406 1.35960
Zscore(COMPTITVE2) 226 -4.54569 1.51523
Zscore(COMPTITVE3) 226 -3.00415 1.54485
Zscore(COMPTITVE4) 226 -2.63260 1.45891
Zscore(COMPTITVE5) 226 -3.99296 1.29201
Zscore(BUSS_PRSHR1) 226 -2.19856 1.43446
Zscore(BUSS_PRSHR2) 226 -3.75750 1.43635
Zscore(BUSS_PRSHR3) 226 -2.60166 1.55364
Zscore(BUSS_PRSHR4) 226 -2.93117 .98283
Zscore(BUSS_PRSHR5) 226 -2.28184 1.20849
Zscore(CUSTMR_PRSHR1) 226 -1.54505 2.24523
Zscore(CUSTMR_PRSHR2) 226 -1.64773 2.06479
Zscore(CUSTMR_PRSHR3) 226 -1.44006 2.36641

473
Zscore(GOV_SUPP1) 226 -1.66488 2.36798
Zscore(GOV_SUPP2) 226 -2.90766 1.18088
Zscore(GOV_SUPP3) 226 -1.70301 2.67146
Zscore(GOV_SUPP4) 226 -1.96577 2.46082
Zscore(GOV_SUPP5) 226 -1.70737 2.42522
Zscore(GOV_SUPP6) 226 -.91805 4.23953
Zscore(GOV_SUPP7) 226 -.96601 3.91806
Valid N (listwise) 226
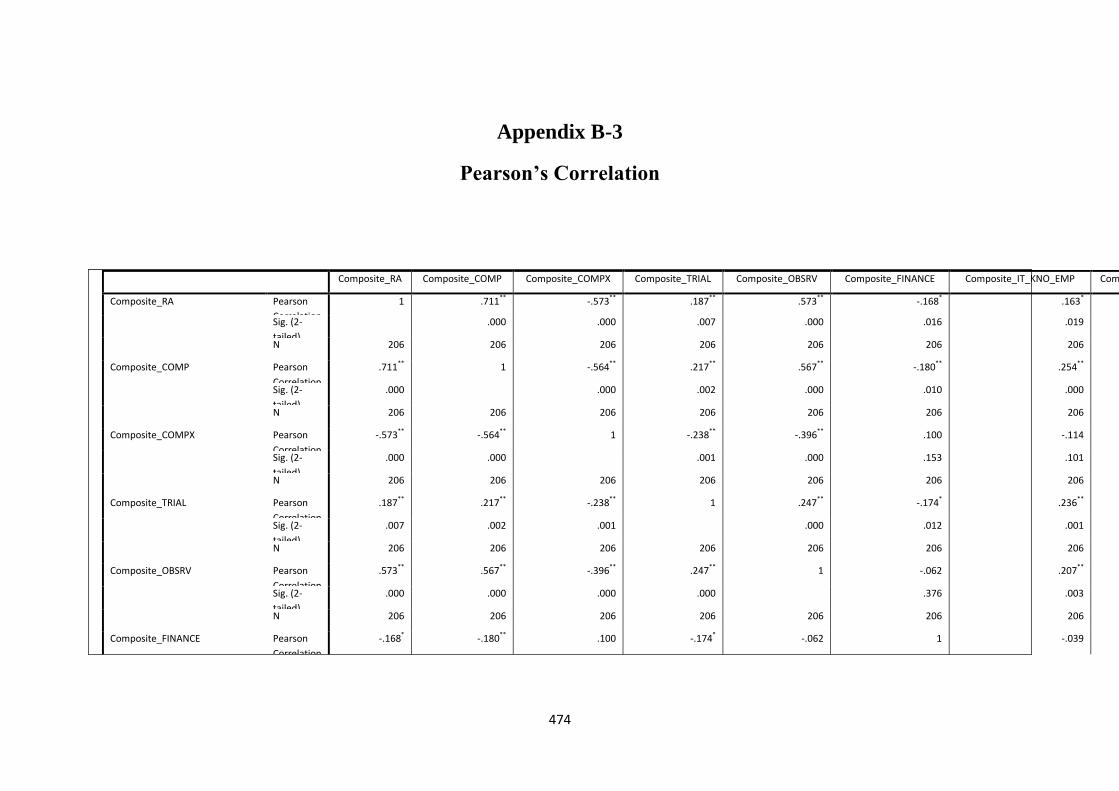
474
Appendix B-3
Pearson’s Correlation
Composite_RA Composite_COMP Composite_COMPX Composite_TRIAL Composite_OBSRV Composite_FINANCE Composite_IT_KNO_EMP Composite_PD Composite_MGMTSUP Composite_UA Composite_ATTD Composite_COMPTITVE Composite_BUSS_PRSHR Composite_CUSTMR_PRSHR Composite_GOV_SUPP NUM_EMP
Composite_RA Pearson
Correlation
1 .711** -.573** .187** .573** -.168* .163* -.045 .477** .556** .660** .260** .357** .409** .063 .261**
Sig. (2-
tailed)
.000 .000 .007 .000 .016 .019 .516 .000 .000 .000 .000 .000 .000 .369 .000
N 206 206 206 206 206 206 206 206 206 206 206 206 206 206 206 206
Composite_COMP Pearson
Correlation
.711** 1 -.564** .217** .567** -.180** .254** .045 .428** .492** .552** .121 .343** .468** .097 .120
Sig. (2-
tailed)
.000 .000 .002 .000 .010 .000 .521 .000 .000 .000 .084 .000 .000 .164 .086
N 206 206 206 206 206 206 206 206 206 206 206 206 206 206 206 206
Composite_COMPX Pearson
Correlation
-.573** -.564** 1 -.238** -.396** .100 -.114 .057 -.386** -.528** -.406** -.118 -.200** -.401** -.128 -.048
Sig. (2-
tailed)
.000 .000 .001 .000 .153 .101 .413 .000 .000 .000 .092 .004 .000 .067 .496
N 206 206 206 206 206 206 206 206 206 206 206 206 206 206 206 206
Composite_TRIAL Pearson
Correlation
.187** .217** -.238** 1 .247** -.174* .236** -.044 .227** .224** .033 .213** .145* .333** .120 -.027
Sig. (2-
tailed)
.007 .002 .001 .000 .012 .001 .531 .001 .001 .637 .002 .037 .000 .085 .698
N 206 206 206 206 206 206 206 206 206 206 206 206 206 206 206 206
Composite_OBSRV Pearson
Correlation
.573** .567** -.396** .247** 1 -.062 .207** .014 .469** .313** .463** .428** .510** .444** -.032 .262**
Sig. (2-
tailed)
.000 .000 .000 .000 .376 .003 .845 .000 .000 .000 .000 .000 .000 .651 .000
N 206 206 206 206 206 206 206 206 206 206 206 206 206 206 206 206
Composite_FINANCE Pearson
Correlation
-.168* -.180** .100 -.174* -.062 1 -.039 -.218** -.134 -.101 -.125 -.077 -.009 -.223** -.015 -.052

475
Sig. (2-
tailed)
.016 .010 .153 .012 .376 .577 .002 .056 .149 .074 .270 .901 .001 .830 .456
N 206 206 206 206 206 206 206 206 206 206 206 206 206 206 206 206
Composite_IT_KNO_EMP Pearson
Correlation
.163* .254** -.114 .236** .207** -.039 1 -.068 .278** .178* .187** .034 .121 .159* .157* .071
Sig. (2-
tailed)
.019 .000 .101 .001 .003 .577 .331 .000 .011 .007 .627 .083 .023 .024 .307
N 206 206 206 206 206 206 206 206 206 206 206 206 206 206 206 206
Composite_PD Pearson
Correlation
-.045 .045 .057 -.044 .014 -.218** -.068 1 -.122 -.084 .025 -.204** .151* .135 .159* .137*
Sig. (2-
tailed)
.516 .521 .413 .531 .845 .002 .331 .080 .232 .717 .003 .031 .054 .022 .050
N 206 206 206 206 206 206 206 206 206 206 206 206 206 206 206 206
Composite_MGMTSUP Pearson
Correlation
.477** .428** -.386** .227** .469** -.134 .278** -.122 1 .547** .530** .464** .424** .337** .058 .257**
Sig. (2-
tailed)
.000 .000 .000 .001 .000 .056 .000 .080 .000 .000 .000 .000 .000 .411 .000
N 206 206 206 206 206 206 206 206 206 206 206 206 206 206 206 206
Composite_UA Pearson
Correlation
.556** .492** -.528** .224** .313** -.101 .178* -.084 .547** 1 .556** .258** .248** .410** .218** .155*
Sig. (2-
tailed)
.000 .000 .000 .001 .000 .149 .011 .232 .000 .000 .000 .000 .000 .002 .026
N 206 206 206 206 206 206 206 206 206 206 206 206 206 206 206 206
Composite_ATTD Pearson
Correlation
.660** .552** -.406** .033 .463** -.125 .187** .025 .530** .556** 1 .354** .464** .388** .050 .383**
Sig. (2-
tailed)
.000 .000 .000 .637 .000 .074 .007 .717 .000 .000 .000 .000 .000 .474 .000
N 206 206 206 206 206 206 206 206 206 206 206 206 206 206 206 206
Composite_COMPTITVE Pearson
Correlation
.260** .121 -.118 .213** .428** -.077 .034 -.204** .464** .258** .354** 1 .444** .285** -.216** .139*
Sig. (2-
tailed)
.000 .084 .092 .002 .000 .270 .627 .003 .000 .000 .000 .000 .000 .002 .046
N 206 206 206 206 206 206 206 206 206 206 206 206 206 206 206 206
Composite_BUSS_PRSHR Pearson
Correlation
.357** .343** -.200** .145* .510** -.009 .121 .151* .424** .248** .464** .444** 1 .373** .091 .125
Sig. (2-
tailed)
.000 .000 .004 .037 .000 .901 .083 .031 .000 .000 .000 .000 .000 .191 .074
N 206 206 206 206 206 206 206 206 206 206 206 206 206 206 206 206
Composite_CUSTMR_PRSHR Pearson
Correlation
.409** .468** -.401** .333** .444** -.223** .159* .135 .337** .410** .388** .285** .373** 1 .006 .234**
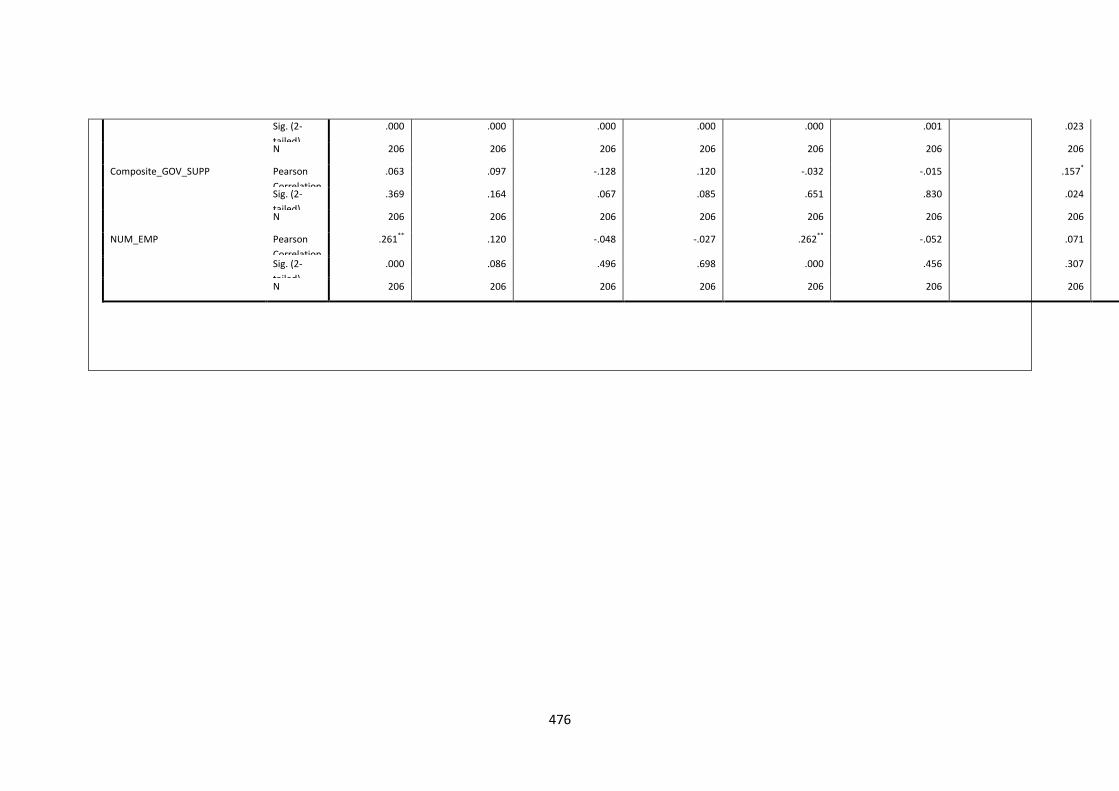
476
Sig. (2-
tailed)
.000 .000 .000 .000 .000 .001 .023 .054 .000 .000 .000 .000 .000 .931 .001
N 206 206 206 206 206 206 206 206 206 206 206 206 206 206 206 206
Composite_GOV_SUPP Pearson
Correlation
.063 .097 -.128 .120 -.032 -.015 .157* .159* .058 .218** .050 -.216** .091 .006 1 .002
Sig. (2-
tailed)
.369 .164 .067 .085 .651 .830 .024 .022 .411 .002 .474 .002 .191 .931 .974
N 206 206 206 206 206 206 206 206 206 206 206 206 206 206 206 206
NUM_EMP Pearson
Correlation
.261** .120 -.048 -.027 .262** -.052 .071 .137* .257** .155* .383** .139* .125 .234** .002 1
Sig. (2-
tailed)
.000 .086 .496 .698 .000 .456 .307 .050 .000 .026 .000 .046 .074 .001 .974
N 206 206 206 206 206 206 206 206 206 206 206 206 206 206 206 206

477
Appendix B-4
Factor analysis
Table A6.1 Total Variance explained of Attributes of Innovation
Total Variance Explained
Component Initial Eigenvalues Rotation Sums of Squared Loadings
Total % of Variance Cumulative % Total % of Variance Cumulative %
1 9.815 37.750 37.750 5.086 19.563 19.563
2 2.173 8.357 46.107 4.423 17.013 36.577
3 1.886 7.252 53.359 2.509 9.652 46.228
4 1.725 6.636 59.995 2.177 8.374 54.603
5 1.477 5.679 65.674 2.058 7.917 62.519
6 1.221 4.697 70.371 2.041 7.851 70.371
7 .919 3.534 73.905
8 .818 3.147 77.051
9 .716 2.752 79.803
10 .641 2.466 82.269
11 .561 2.159 84.428
12 .485 1.866 86.295
13 .466 1.793 88.087
14 .393 1.511 89.598
15 .348 1.337 90.935
16 .327 1.256 92.191
17 .302 1.161 93.352
18 .293 1.126 94.477
19 .249 .959 95.437
20 .228 .877 96.314
21 .203 .781 97.095
22 .189 .729 97.824
23 .182 .701 98.524
24 .147 .565 99.089
25 .133 .511 99.599
26 .104 .401 100.000
Extraction Method: Principal Component Analysis.
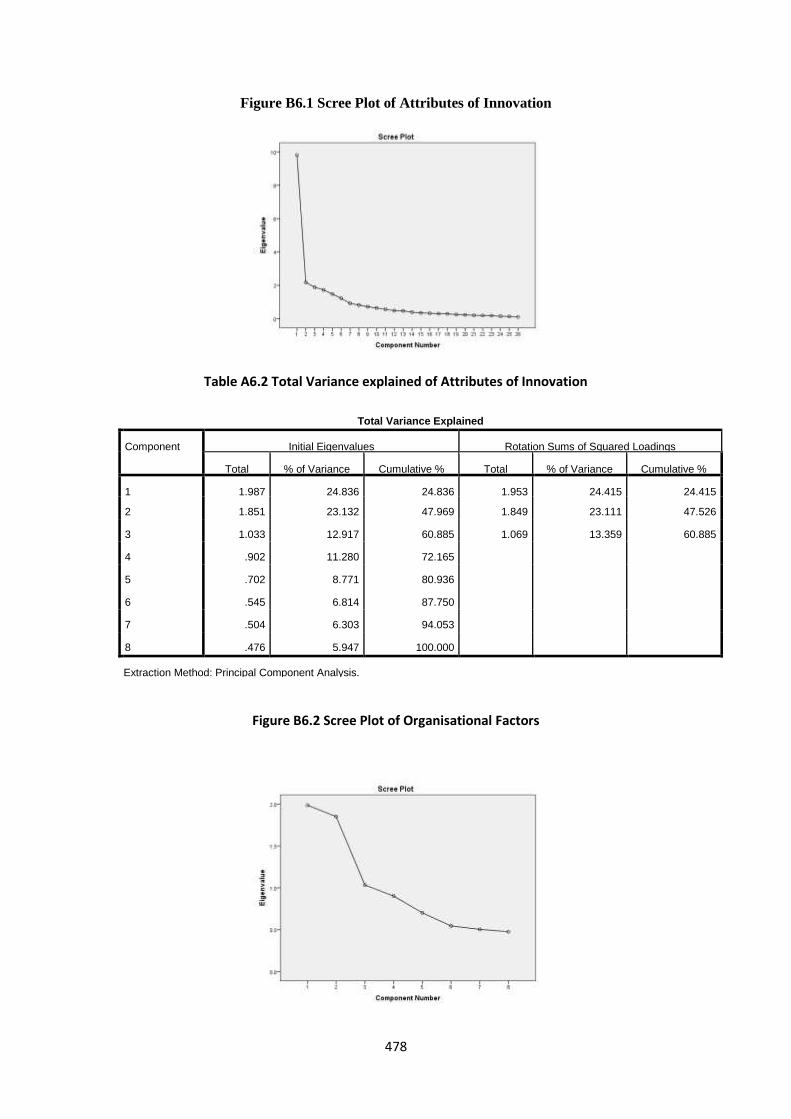
478
Figure B6.1 Scree Plot of Attributes of Innovation
Table A6.2 Total Variance explained of Attributes of Innovation
Total Variance Explained
Component Initial Eigenvalues Rotation Sums of Squared Loadings
Total % of Variance Cumulative % Total % of Variance Cumulative %
1 1.987 24.836 24.836 1.953 24.415 24.415
2 1.851 23.132 47.969 1.849 23.111 47.526
3 1.033 12.917 60.885 1.069 13.359 60.885
4 .902 11.280 72.165
5 .702 8.771 80.936
6 .545 6.814 87.750
7 .504 6.303 94.053
8 .476 5.947 100.000
Extraction Method: Principal Component Analysis.
Figure B6.2 Scree Plot of Organisational Factors
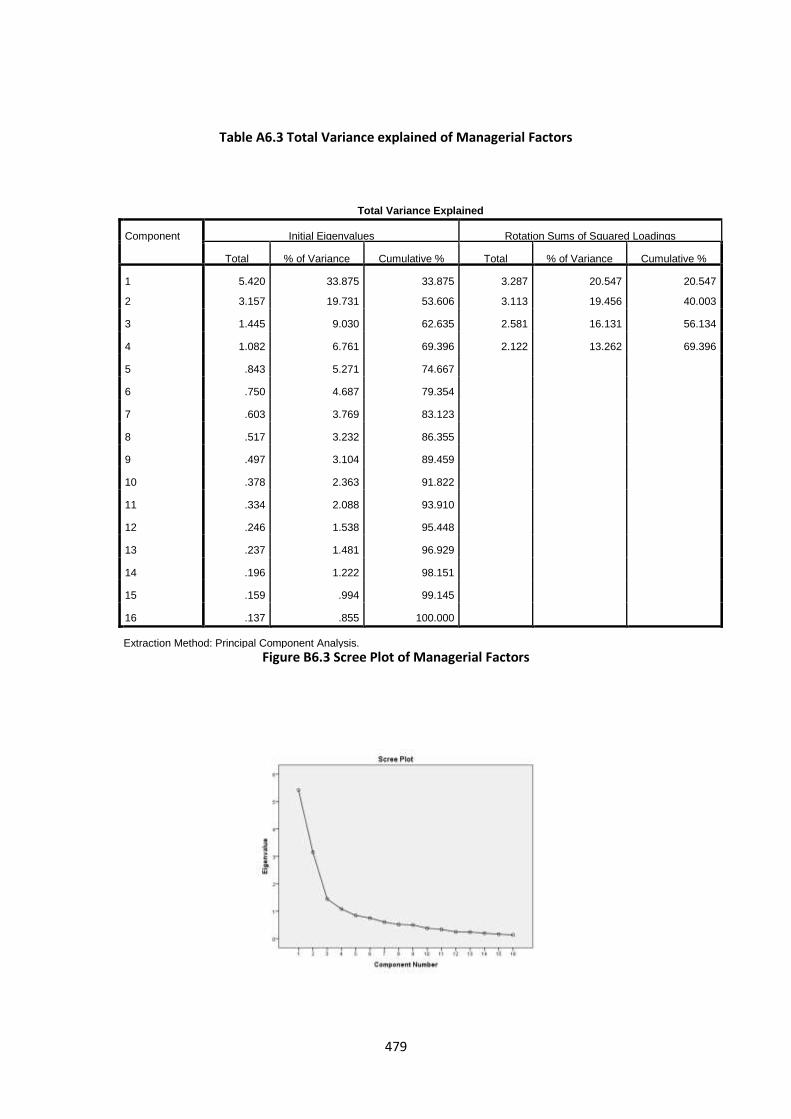
479
Table A6.3 Total Variance explained of Managerial Factors
Total Variance Explained
Component Initial Eigenvalues Rotation Sums of Squared Loadings
Total % of Variance Cumulative % Total % of Variance Cumulative %
1 5.420 33.875 33.875 3.287 20.547 20.547
2 3.157 19.731 53.606 3.113 19.456 40.003
3 1.445 9.030 62.635 2.581 16.131 56.134
4 1.082 6.761 69.396 2.122 13.262 69.396
5 .843 5.271 74.667
6 .750 4.687 79.354
7 .603 3.769 83.123
8 .517 3.232 86.355
9 .497 3.104 89.459
10 .378 2.363 91.822
11 .334 2.088 93.910
12 .246 1.538 95.448
13 .237 1.481 96.929
14 .196 1.222 98.151
15 .159 .994 99.145
16 .137 .855 100.000
Extraction Method: Principal Component Analysis.
Figure B6.3 Scree Plot of Managerial Factors

480
Table A6.4 Total Variance explained of Environmental Factors
Total Variance Explained
Component Initial Eigenvalues Rotation Sums of Squared Loadings
Total % of Variance Cumulative % Total % of Variance Cumulative %
1 4.177 26.107 26.107 2.608 16.302 16.302
2 2.440 15.249 41.356 2.374 14.839 31.141
3 1.593 9.956 51.312 2.253 14.080 45.222
4 1.369 8.559 59.871 1.805 11.282 56.503
5 1.060 6.623 66.493 1.598 9.990 66.493
6 .959 5.996 72.489
7 .759 4.744 77.233
8 .661 4.129 81.362
9 .583 3.641 85.003
10 .527 3.292 88.295
11 .398 2.486 90.780
12 .392 2.448 93.228
13 .336 2.099 95.327
14 .306 1.911 97.238
15 .242 1.512 98.749
16 .200 1.251 100.000
Extraction Method: Principal Component Analysis.
Figure B6.4 Scree Plot of Environmental Factors

481
Note : 1. Bold values refers to square root of average variance extracted from observed constructs
Table A.6.5 Comparison of AVE and Correlations with other Constructs
Construct
Name
Re
lative
Ad
vantages
Co
mp
atibilit
y
Co
mp
lexity
Trialability
Ob
servab
ility
Finan
cial
Sup
po
rt
Emp
loyee
’s
IT
Kn
ow
ledge
Firm Size
Po
wer
Distan
ce
Top
Man
ageme
nt
Sup
po
rt
Un
certainty
Avo
idan
ce
Man
ager’s
Attitu
de
Co
mp
etitive
Pressu
re
Bu
sine
ss/Par
tne
r Pre
ssure
Cu
stom
er
pre
ssure
Go
vern
men
t
Sup
po
rt
Relative
Advantages
0.71
Compatibility 0.711 0.75
Complexity -
0.573
-
0.564
0.84
Trialability 0.187 0.217 -0.238 0.80
Observability 0.573 0.567 -0.396 0.247 0.91
Financial
Support
-
0.168
-
0.180
0.100 -0.174 -
0.062
0.77
Employee’s
IT
Knowledge
0.163 0.254 -0.114 0.236 0.207 -0.039 0.76
Firm Size 0.261 0.120 -0.048 -0.027 0.262 -0.052 0.071 0.88
Power
Distance
-
0.045
0.045 0.057 -0.044 0.014 -0.218 -0.068 0.137 0.79
Top
Management
Support
0.477 0.428 -0.386 0.227 0.469 -0.134 0.278 0.257 -0.122 0.79
Uncertainty
Avoidance
0.556 0.492 -0.528 0.224 0.313 -0.101 0.178 0.155 -0.084 0.547 0.72
Manager’s
Attitude
0.660 0.552 -0.406 0.033 0.463 -0.125 0.187 0.383 0.025 0.530 0.556 0.78
Competitive
Pressure
0.260 0.121 -0.118 0.213 0.428 -0.077 0.034 0.139 -0.204 0.464 0.258 0.354 0.81
Business/Part
ner Pressure
0.357 0.343 -0.200 0.145 0.510 -0.009 0.121 0.125 0.151 0.424 0.248 0.464 0.444 0.81
Customer
Pressure
0.409 0.468 -0.401 0.333 0.444 -0.223 0.159 0.234 0.135 0.337 0.410 0.388 0.285 0.373 0.80
Government
Support
0.063 0.097 -0.128 0.120 -
0.032
-0.015 0.157 0.002 0.159 0.058 0.218 0.050 -0.216 0.091 0.006 0.77
2. Other values refers the correlations between constructs

482
Appendix B-5
Multinominal Logisrt Regression Results
Table A.6.6 Parameter Estimates , The reference category : e-window
adoption_levela B Std. Error Wald df Sig. Exp(B) 95% Confidence Interval for Exp(B)
Lower Bound Upper Bound
e-window
Intercept -21.006 9.389 5.005 1 .025
Composite_RA 1.472 .710 4.299 1 .038 4.356 1.084 17.507
Composite_COMP 1.287 .855 2.264 1 .132 3.622 .677 19.365
Composite_COMPX -.331 .499 .439 1 .508 .718 .270 1.911
Composite_TRIAL 1.468 .780 3.538 1 .060 4.339 .940 20.024
Composite_OBSRV 2.827 .975 8.408 1 .004 16.899 2.500 114.243
Composite_FINANCE -.851 .808 1.107 1 .293 .427 .088 2.083
Composite_IT_KNO_EMP -1.488 .793 3.524 1 .060 .226 .048 1.068
Composite_PD -.711 .668 1.133 1 .287 .491 .133 1.819
Composite_MGMTSUP -.444 .882 .254 1 .615 .641 .114 3.615
Composite_UA -1.448 .671 4.655 1 .031 .235 .063 .876
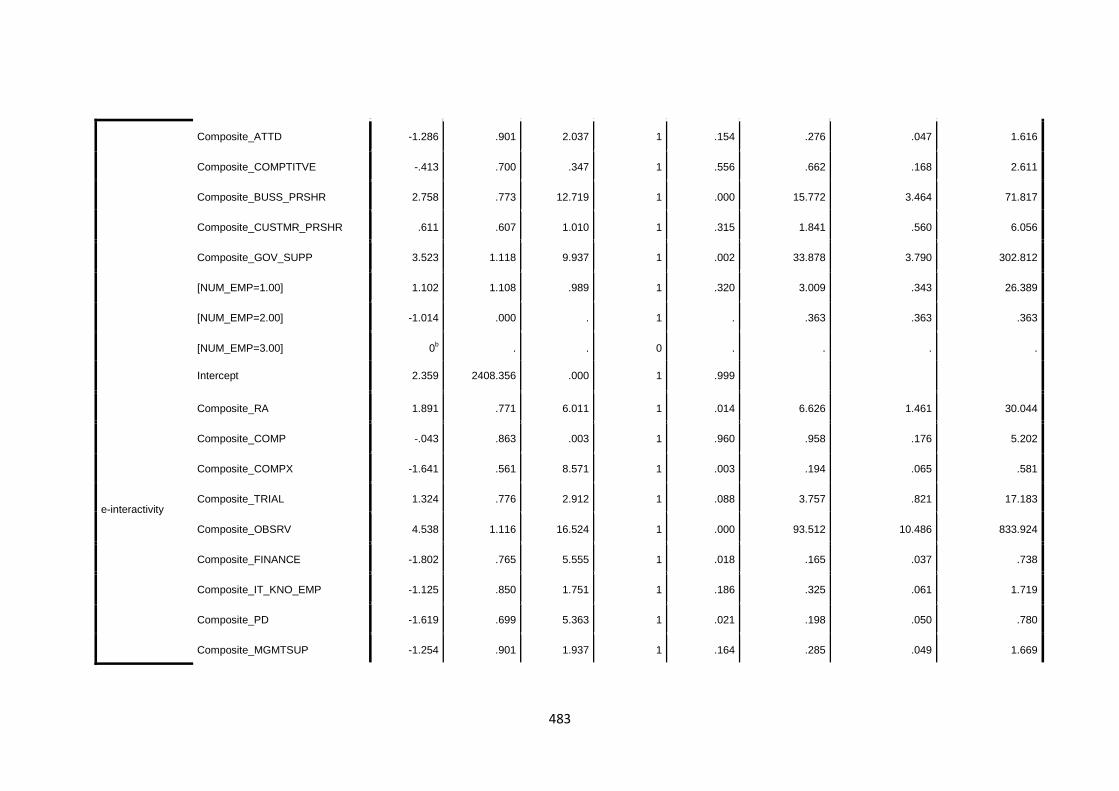
483
Composite_ATTD -1.286 .901 2.037 1 .154 .276 .047 1.616
Composite_COMPTITVE -.413 .700 .347 1 .556 .662 .168 2.611
Composite_BUSS_PRSHR 2.758 .773 12.719 1 .000 15.772 3.464 71.817
Composite_CUSTMR_PRSHR .611 .607 1.010 1 .315 1.841 .560 6.056
Composite_GOV_SUPP 3.523 1.118 9.937 1 .002 33.878 3.790 302.812
[NUM_EMP=1.00] 1.102 1.108 .989 1 .320 3.009 .343 26.389
[NUM_EMP=2.00] -1.014 .000 . 1 . .363 .363 .363
[NUM_EMP=3.00] 0b . . 0 . . . .
e-interactivity
Intercept 2.359 2408.356 .000 1 .999
Composite_RA 1.891 .771 6.011 1 .014 6.626 1.461 30.044
Composite_COMP -.043 .863 .003 1 .960 .958 .176 5.202
Composite_COMPX -1.641 .561 8.571 1 .003 .194 .065 .581
Composite_TRIAL 1.324 .776 2.912 1 .088 3.757 .821 17.183
Composite_OBSRV 4.538 1.116 16.524 1 .000 93.512 10.486 833.924
Composite_FINANCE -1.802 .765 5.555 1 .018 .165 .037 .738
Composite_IT_KNO_EMP -1.125 .850 1.751 1 .186 .325 .061 1.719
Composite_PD -1.619 .699 5.363 1 .021 .198 .050 .780
Composite_MGMTSUP -1.254 .901 1.937 1 .164 .285 .049 1.669
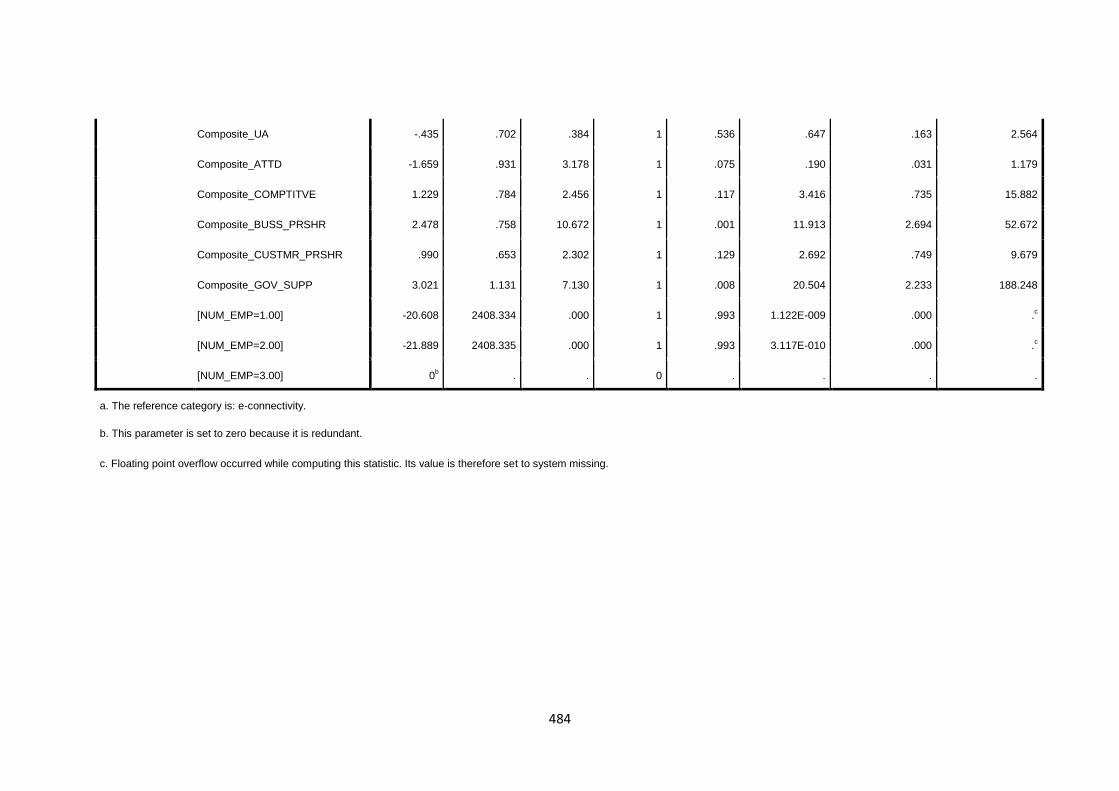
484
Composite_UA -.435 .702 .384 1 .536 .647 .163 2.564
Composite_ATTD -1.659 .931 3.178 1 .075 .190 .031 1.179
Composite_COMPTITVE 1.229 .784 2.456 1 .117 3.416 .735 15.882
Composite_BUSS_PRSHR 2.478 .758 10.672 1 .001 11.913 2.694 52.672
Composite_CUSTMR_PRSHR .990 .653 2.302 1 .129 2.692 .749 9.679
Composite_GOV_SUPP 3.021 1.131 7.130 1 .008 20.504 2.233 188.248
[NUM_EMP=1.00] -20.608 2408.334 .000 1 .993 1.122E-009 .000 .c
[NUM_EMP=2.00] -21.889 2408.335 .000 1 .993 3.117E-010 .000 .c
[NUM_EMP=3.00] 0b . . 0 . . . .
a. The reference category is: e-connectivity.
b. This parameter is set to zero because it is redundant.
c. Floating point overflow occurred while computing this statistic. Its value is therefore set to system missing.
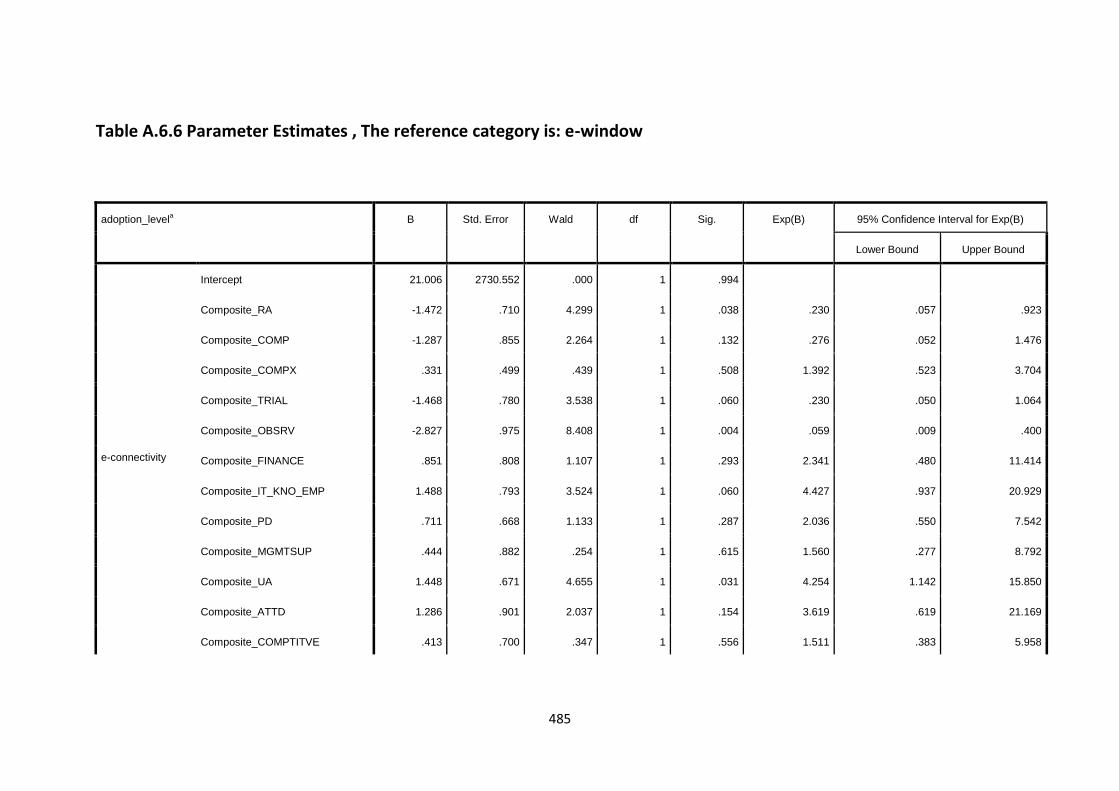
485
Table A.6.6 Parameter Estimates , The reference category is: e-window
adoption_levela B Std. Error Wald df Sig. Exp(B) 95% Confidence Interval for Exp(B)
Lower Bound Upper Bound
e-connectivity
Intercept 21.006 2730.552 .000 1 .994
Composite_RA -1.472 .710 4.299 1 .038 .230 .057 .923
Composite_COMP -1.287 .855 2.264 1 .132 .276 .052 1.476
Composite_COMPX .331 .499 .439 1 .508 1.392 .523 3.704
Composite_TRIAL -1.468 .780 3.538 1 .060 .230 .050 1.064
Composite_OBSRV -2.827 .975 8.408 1 .004 .059 .009 .400
Composite_FINANCE .851 .808 1.107 1 .293 2.341 .480 11.414
Composite_IT_KNO_EMP 1.488 .793 3.524 1 .060 4.427 .937 20.929
Composite_PD .711 .668 1.133 1 .287 2.036 .550 7.542
Composite_MGMTSUP .444 .882 .254 1 .615 1.560 .277 8.792
Composite_UA 1.448 .671 4.655 1 .031 4.254 1.142 15.850
Composite_ATTD 1.286 .901 2.037 1 .154 3.619 .619 21.169
Composite_COMPTITVE .413 .700 .347 1 .556 1.511 .383 5.958
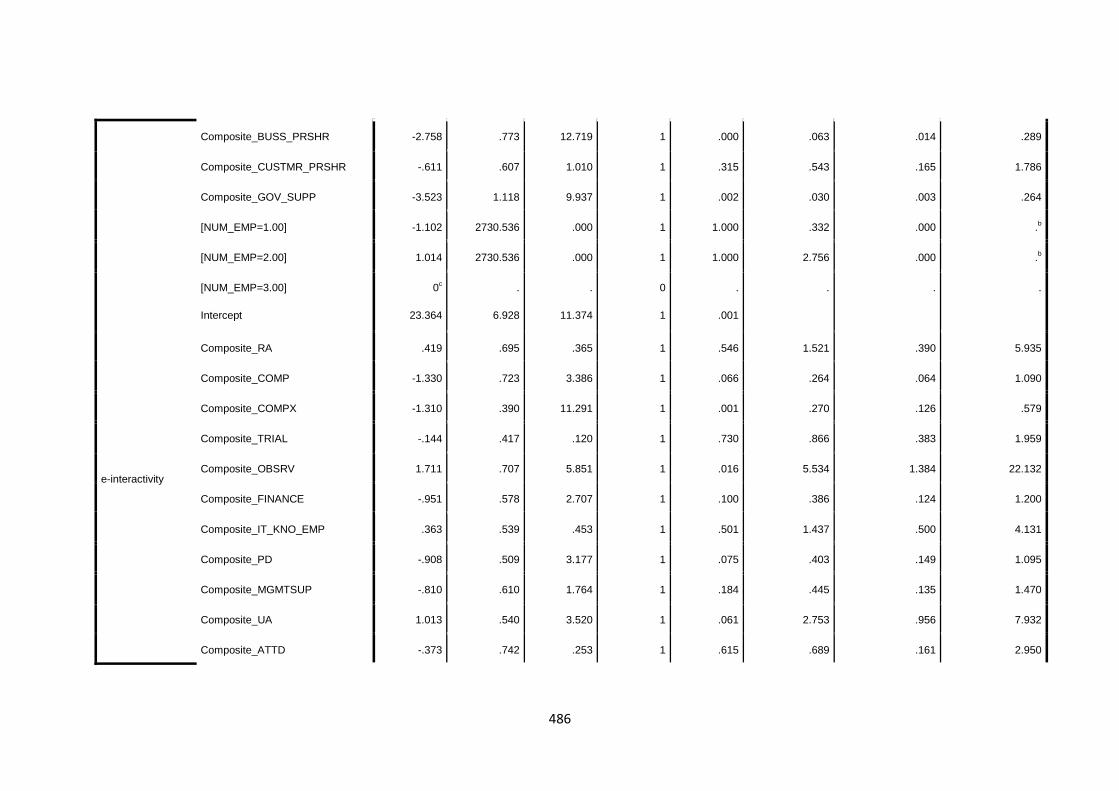
486
Composite_BUSS_PRSHR -2.758 .773 12.719 1 .000 .063 .014 .289
Composite_CUSTMR_PRSHR -.611 .607 1.010 1 .315 .543 .165 1.786
Composite_GOV_SUPP -3.523 1.118 9.937 1 .002 .030 .003 .264
[NUM_EMP=1.00] -1.102 2730.536 .000 1 1.000 .332 .000 .b
[NUM_EMP=2.00] 1.014 2730.536 .000 1 1.000 2.756 .000 .b
[NUM_EMP=3.00] 0c . . 0 . . . .
e-interactivity
Intercept 23.364 6.928 11.374 1 .001
Composite_RA .419 .695 .365 1 .546 1.521 .390 5.935
Composite_COMP -1.330 .723 3.386 1 .066 .264 .064 1.090
Composite_COMPX -1.310 .390 11.291 1 .001 .270 .126 .579
Composite_TRIAL -.144 .417 .120 1 .730 .866 .383 1.959
Composite_OBSRV 1.711 .707 5.851 1 .016 5.534 1.384 22.132
Composite_FINANCE -.951 .578 2.707 1 .100 .386 .124 1.200
Composite_IT_KNO_EMP .363 .539 .453 1 .501 1.437 .500 4.131
Composite_PD -.908 .509 3.177 1 .075 .403 .149 1.095
Composite_MGMTSUP -.810 .610 1.764 1 .184 .445 .135 1.470
Composite_UA 1.013 .540 3.520 1 .061 2.753 .956 7.932
Composite_ATTD -.373 .742 .253 1 .615 .689 .161 2.950
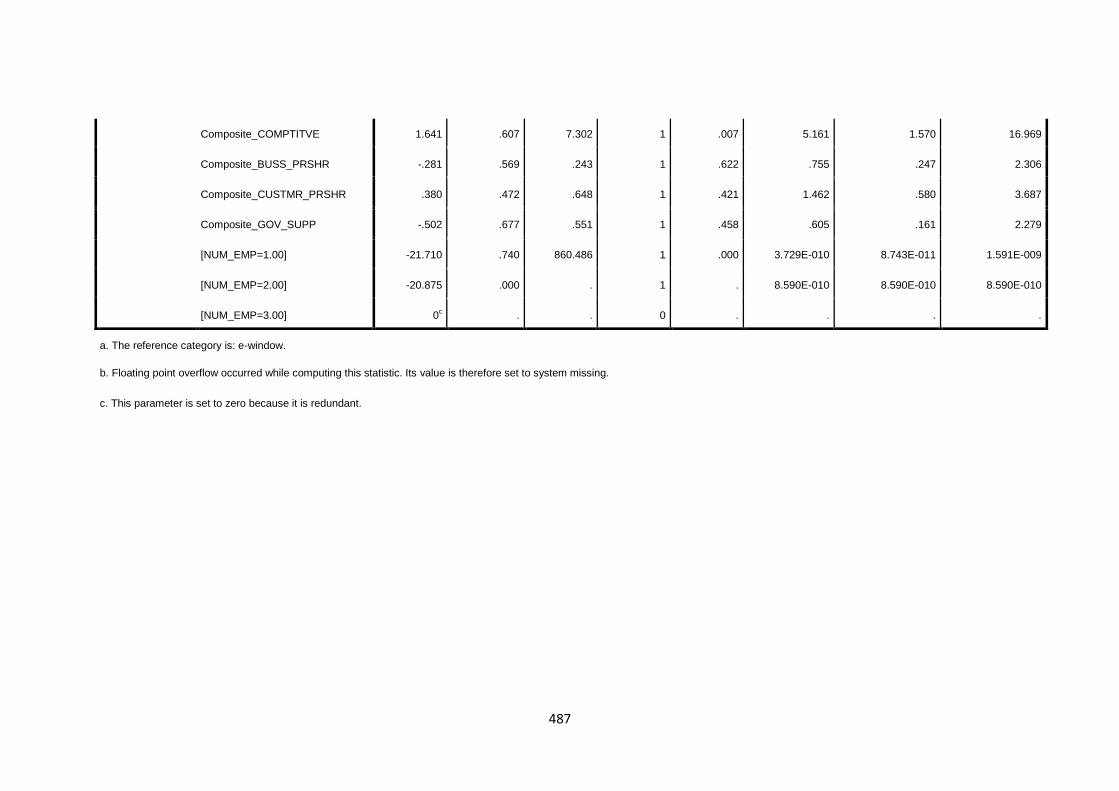
487
Composite_COMPTITVE 1.641 .607 7.302 1 .007 5.161 1.570 16.969
Composite_BUSS_PRSHR -.281 .569 .243 1 .622 .755 .247 2.306
Composite_CUSTMR_PRSHR .380 .472 .648 1 .421 1.462 .580 3.687
Composite_GOV_SUPP -.502 .677 .551 1 .458 .605 .161 2.279
[NUM_EMP=1.00] -21.710 .740 860.486 1 .000 3.729E-010 8.743E-011 1.591E-009
[NUM_EMP=2.00] -20.875 .000 . 1 . 8.590E-010 8.590E-010 8.590E-010
[NUM_EMP=3.00] 0c . . 0 . . . .
a. The reference category is: e-window.
b. Floating point overflow occurred while computing this statistic. Its value is therefore set to system missing.
c. This parameter is set to zero because it is redundant.

488
Appendix C-1
Operationalisation of the constructs used in this research
Construct Label Measures Adopted from
E-commerce Adoption Level
Lev
el 0
0
(No
n
Ad
op
ter )
LVL00 - Our company is not connected with the internet. Molla and Licker (2004)
Lev
el 0
(e-
co
nn
ectiv
ity)
LVL01 - Our company connected to the internet with only e-mail but no
website. Molla and Licker (2004)
Lev
el 1
(e-
win
do
w)
LVL1 - Our company has a static website that present company’s
information and advertise its products with one way communication using e-mail and without any interactivity.
Molla and Licker (2004)
Lev
el 2
(e-
inte
ractiv
ity )
LVL2 - Our company has an interactive website that accepts online
orders, queries, forms, and e-mails from customers and suppliers but online payment is not integrated on the website.
Molla and Licker (2004)
Lev
el 3
(e-
tra
nsa
ctio
n )
LVL3 - Our company accepts online transition through website that
allows buying and selling products and services to customers and
suppliers including customer services.
Molla and Licker (2004)
Lev
el 4
(e-
en
terp
rise)
LVL4 -Our company has a website connected with computer systems
that allows our company to do the most of business processes such as accounting system, inventory system, CRM, and any
traditional paperwork to electronic one.
Molla and Licker (2004)
Attributes of Innovation
Rela
tive A
dv
an
tage
RA1 E-commerce reduces the company’s overall operating cost. -Kamaroddin et al.(2009)
-Ifinedo (2011) RA2 E-commerce helps our company to expand market share.
RA3 E-commerce helps company to increase customer base.
RA4 E-commerce increases company’s sales and revenues.
RA5 E-commerce creates new channel for advertising.
RA6 E-commerce enfances company’s image.
RA7 E-commerce increases company’s competitive advantage
RA8 E-commerce improves customer services and satisfaction
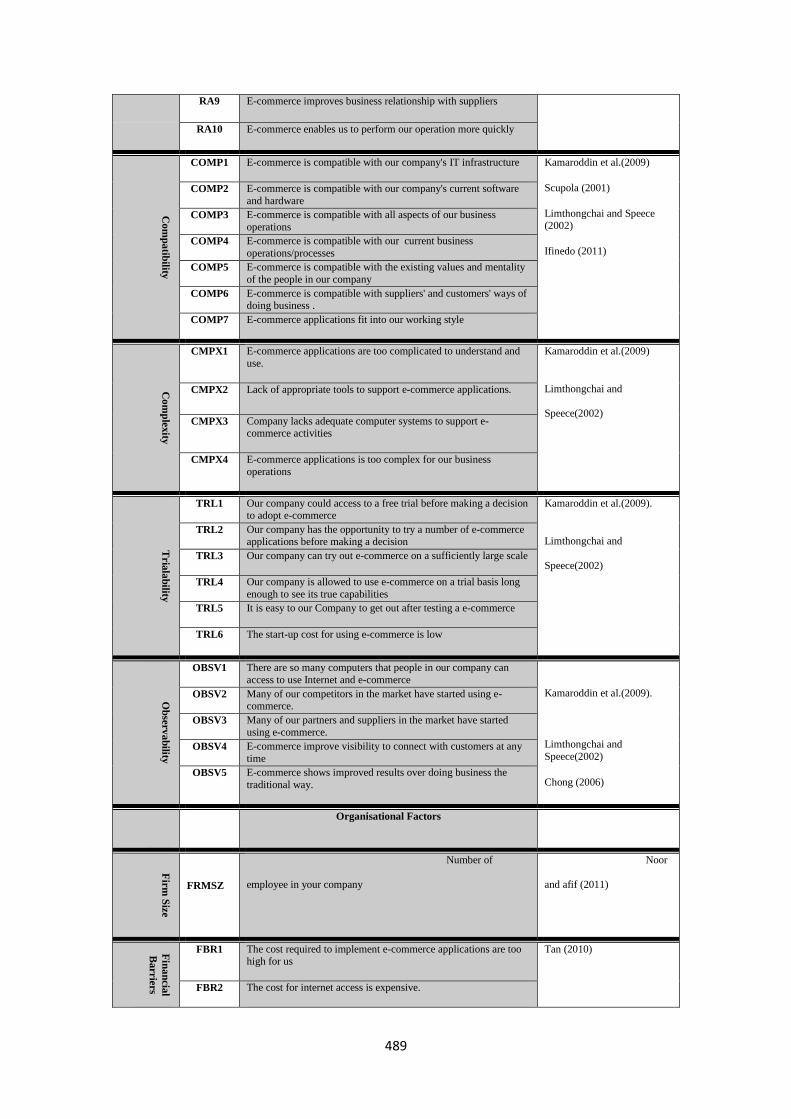
489
RA9 E-commerce improves business relationship with suppliers
RA10 E-commerce enables us to perform our operation more quickly
Co
mp
atib
ility
COMP1 E-commerce is compatible with our company's IT infrastructure Kamaroddin et al.(2009)
Scupola (2001)
Limthongchai and Speece (2002)
Ifinedo (2011)
COMP2 E-commerce is compatible with our company's current software
and hardware
COMP3 E-commerce is compatible with all aspects of our business
operations
COMP4 E-commerce is compatible with our current business
operations/processes
COMP5 E-commerce is compatible with the existing values and mentality
of the people in our company
COMP6 E-commerce is compatible with suppliers' and customers' ways of doing business .
COMP7 E-commerce applications fit into our working style
Co
mp
lexity
CMPX1 E-commerce applications are too complicated to understand and
use.
Kamaroddin et al.(2009)
Limthongchai and
Speece(2002)
CMPX2 Lack of appropriate tools to support e-commerce applications.
CMPX3 Company lacks adequate computer systems to support e-commerce activities
CMPX4 E-commerce applications is too complex for our business
operations
Tria
lab
ility
TRL1 Our company could access to a free trial before making a decision to adopt e-commerce
Kamaroddin et al.(2009).
Limthongchai and
Speece(2002)
TRL2 Our company has the opportunity to try a number of e-commerce applications before making a decision
TRL3 Our company can try out e-commerce on a sufficiently large scale
TRL4 Our company is allowed to use e-commerce on a trial basis long
enough to see its true capabilities
TRL5 It is easy to our Company to get out after testing a e-commerce
TRL6 The start-up cost for using e-commerce is low O
bserv
ab
ility
OBSV1 There are so many computers that people in our company can
access to use Internet and e-commerce
Kamaroddin et al.(2009).
Limthongchai and
Speece(2002)
Chong (2006)
OBSV2 Many of our competitors in the market have started using e-commerce.
OBSV3 Many of our partners and suppliers in the market have started
using e-commerce.
OBSV4 E-commerce improve visibility to connect with customers at any
time
OBSV5 E-commerce shows improved results over doing business the
traditional way.
Organisational Factors
Firm
Siz
e
FRMSZ
Number of
employee in your company
Noor
and afif (2011)
Fin
an
cia
l
Barrie
rs
FBR1 The cost required to implement e-commerce applications are too high for us
Tan (2010)
FBR2 The cost for internet access is expensive.
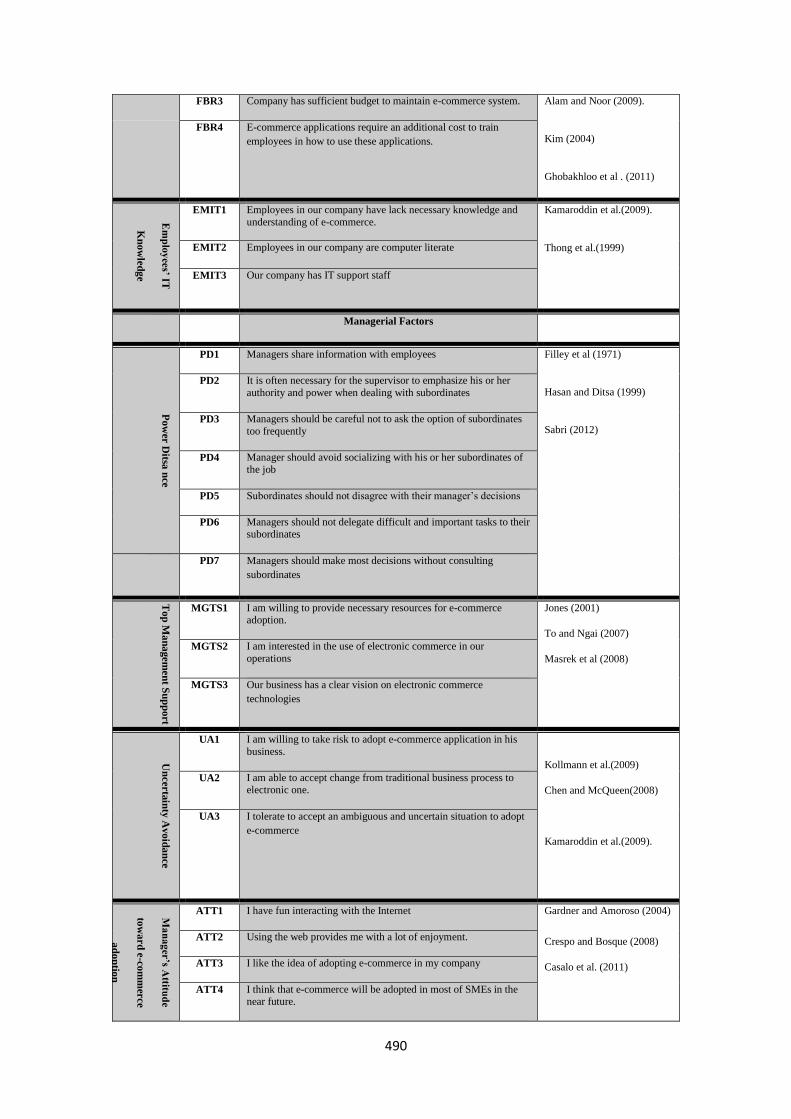
490
FBR3 Company has sufficient budget to maintain e-commerce system. Alam and Noor (2009).
Kim (2004)
Ghobakhloo et al . (2011)
FBR4 E-commerce applications require an additional cost to train
employees in how to use these applications.
Em
plo
yee
s’ IT
Kn
ow
led
ge
EMIT1 Employees in our company have lack necessary knowledge and
understanding of e-commerce.
Kamaroddin et al.(2009).
Thong et al.(1999) EMIT2 Employees in our company are computer literate
EMIT3 Our company has IT support staff
Managerial Factors
Po
wer
Ditsa
nce
PD1 Managers share information with employees Filley et al (1971)
Hasan and Ditsa (1999)
Sabri (2012)
PD2 It is often necessary for the supervisor to emphasize his or her
authority and power when dealing with subordinates
PD3 Managers should be careful not to ask the option of subordinates
too frequently
PD4 Manager should avoid socializing with his or her subordinates of the job
PD5 Subordinates should not disagree with their manager’s decisions
PD6 Managers should not delegate difficult and important tasks to their subordinates
PD7 Managers should make most decisions without consulting
subordinates
To
p M
an
agem
en
t Su
pp
ort
MGTS1 I am willing to provide necessary resources for e-commerce adoption.
Jones (2001)
To and Ngai (2007)
Masrek et al (2008)
MGTS2 I am interested in the use of electronic commerce in our
operations
MGTS3 Our business has a clear vision on electronic commerce
technologies
Un
certa
inty
Avo
ida
nce
UA1 I am willing to take risk to adopt e-commerce application in his
business.
Kollmann et al.(2009)
Chen and McQueen(2008)
Kamaroddin et al.(2009).
UA2 I am able to accept change from traditional business process to electronic one.
UA3 I tolerate to accept an ambiguous and uncertain situation to adopt
e-commerce
Ma
nag
er’s A
ttitud
e
tow
ard
e-co
mm
erce
ad
op
tion
ATT1 I have fun interacting with the Internet Gardner and Amoroso (2004)
Crespo and Bosque (2008)
Casalo et al. (2011)
ATT2 Using the web provides me with a lot of enjoyment.
ATT3 I like the idea of adopting e-commerce in my company
ATT4 I think that e-commerce will be adopted in most of SMEs in the near future.

491
ATT5 I think adopting e-commerce would beneficial to my company
Environmental Factors
Co
mp
etitive P
ressu
re
CMPR1 The rivalry among companies in the industry my company is operating in is very intense
Thong and Yap(1995) cited in Ghobakhloo et al .(2011)
Ifinedo (2011) CMPR2 Some of our competitors have already adopted e-commerce
CMPR3 Our firm is under pressure from competitors to adopt Internet/e-business technologies
CMPR4 It is easy for our customers to switch to another company for similar services without any difficulty
CMPR5 Our customers are able to easily access to several existing
products/services in the market which are different from ours but
perform the same functions
Bu
siness/ P
artn
er P
ressu
re
BPPR1 Our company depends on other firms that are already using e-commerce.
Grandon and
Pearson (2004)
AlQirim (2007)
Safuu et al. (2008) cited in
Ghobakhloo et al .(2011)
Ifinedo (2011)
BPPR2 Many of our suppliers and business partners are already adopted e-commerce.
BPPR3 Our industry is pressuring us to adopt e-commerce
BPPR4 Our suppliers and business partners’ demands for better communication and data interchange are pressuring us to adopt e-
commerce.
BPPR5 Our partners are demanding the use of e-commerce in doing
business with them.
Cu
stom
er P
ressu
re
CSPR1 Our customers are requesting us to adopt e-commerce Adapted from Al-Somali et al
.(2011)
Ifinedo (2011) CSPR2 Our company may lose our potential customers if we have not
adopted e-commerce.
CSPR3 Our company is under pressure from customers to adopt e-
commerce.
Go
vern
men
t Su
pp
ort
GOVSUP
1
Government plays an important role in promoting e-commerce
within SMEs
Seyal and Rahim(2006)
Thatcher et al (2006)
Tan and Eze (2008)
Gibbs et al. (2003)
Ifinedo (2011)
GOVSUP
2
The telecommunication infrastructure and availability of internet
technology (ADSL,Cable,wireless) encouraged our company to adopt e-commerce .
GOVSUP
3
The government agencies offers training and educational programs to our company to adopt e-commerce
GOVSUP
4
Existing governmental legislation in e-commerce in terms of
buyer /seller protection encouraged us to adopt e-commerce
GOVSUP
5
Government is providing us loans facilities to to adopt e-
commerce.
GOVSUP
6
The government is active in setting up the facilities to enable
Internet commerce
GOVSUP
7
The government has an effective laws to combat cyber crime

492
General Information of travel agency
Travel Agency Type The type of travel agency Developed by researcher
Travel Agency Age The number of years has your company operate business.
Manager/Owner
Education Level
The highest education that you have
Manager/Owner Age The age of owner/manager
Related Documents