Adoption of Telecommuting in Two California State Agencies Patricia L. Mokhtarian Institute of Transportation Studies University of California, Davis Davis, CA 95616 Ilan Salomon Department of Geography Hebrew University Jerusalem 91905 ISRAEL Somitra Saxena Srikanth Sampath Peter Cheung Kate Le Michael Bagley Institute of Transportation Studies University of California, Davis Davis, California 95616 Working Paper September 1996 UCTC No. 338 The University of California Transportation Center University of California at Berkeley

Welcome message from author
This document is posted to help you gain knowledge. Please leave a comment to let me know what you think about it! Share it to your friends and learn new things together.
Transcript

Adoption of Telecommuting in Two California StateAgencies
Patricia L. Mokhtarian
Institute of Transportation StudiesUniversity of California, Davis
Davis, CA 95616
Ilan Salomon
Department of Geography Hebrew University
Jerusalem 91905 ISRAEL
Somitra SaxenaSrikanth Sampath
Peter CheungKate Le
Michael Bagley
Institute of Transportation StudiesUniversity of California, Davis
Davis, California 95616
Working PaperSeptember 1996
UCTC No. 338
The University of California Transportation CenterUniversity of California at Berkeley

The University of CaliforniaTransportation Center
The University of CaliforniaTransportation Center (UCTC)is one of ten regional unitsmandated by Congress andestablished in Fall 1988 tosupport research, education,and training in surface trans-portation. The UC Centerserves federal Region IX andis supported by matchinggrants from the U.S. Depart-ment of Transportation, theCalifornia Department ofTransportation (Caltrans), andthe University.
Based on the BerkeleyCampus, UCTC draws uponexisting capabilities andresources of the Institutes ofTransportation Studies atBerkeley, Davis, Irvine, andLos Angeles; the Institute ofUrban and Regional Develop-ment at Berkeley; and severalacademic departments at theBerkeley, Davis, Irvine, andLos Angeles campuses.Faculty and students on otherUniversity of Californiacampuses may participate in
Center activities. Researchersat other universities within theregion also have opportunitiesto collaborate with UC facultyon selected studies.
UCTCÕs educational andresearch programs are focusedon strategic planning forimproving metropolitanaccessibility, with emphasison the special conditions inRegion IX. Particular attentionis directed to strategies forusing transportation as aninstrument of economicdevelopment, while also ac-commodating to the regionÕspersistent expansion andwhile maintaining and enhanc-ing the quality of life there.
The Center distributes reportson its research in workingpapers, monographs, and inreprints of published articles.It also publishes Access, amagazine presenting sum-maries of selected studies. Fora list of publications in print,write to the address below.
University of CaliforniaTransportation Center
108 Naval Architecture BuildingBerkeley, California 94720Tel: 510/643-7378FAX: 510/643-5456
The contents of this report reflect the views of the author who is responsiblefor the facts and accuracy of the data presented herein. The contents do notnecessarily reflect the official views or policies of the State of California or theU.S. Department of Transportation. This report does not constitute a standard,specification, or regulation.

ADOPTION OF TELECOMMUTINGIN TWO CALIFORNIA STATE AGENCIES
by
Patricia L. MokhtarianIlan Salomon
Somitra SaxenaSrikanth Sampath
Peter CheungKate Le
Michael Bagley
ABSTRACT
This paper presents results from the field test of a survey designed to collect data on theindividual decision to telecommute. The field test was conducted primarily to assess whether acover letter from the employer would induce a response bias. The survey was administered withtwo cover letters to the Sacramento-based Franchise Tax Board (FTB) and the San Francisco-based Public Utilities Commission (PUC). The cover letter type had a small (insignificant)impact on the response rate, but in the opposite direction than expected. The cover letter hadlittle effect on reasons for wanting to telecommute: "to get more work done" was still the mostimportant advantage for both cover letter groups. Differences in commute characteristicsbetween the two agencies resulted in differences in perceived advantages of telecommuting. ForPUC employees, reducing commute stress was the most important advantage of telecommuting,although getting more work done was a close second. For FTB employees, reducing commutestress was in ninth place. The combined sample showed a marked preference for home-basedrather than center-based telecommuting.

ADOPTION OF TELECOMMUTINGIN TWO CALIFORNIA STATE AGENCIES
1. INTRODUCTION
Telecommuting, defined as working at home or at a location close to home instead of commutingto a conventional work location, has received increasing attention as a work alternative withpotential benefits to the individual, the employer, and society at large (see, e.g., Gray, et al.,1993). It remains to be seen whether the ultimate adoption of telecommuting will be sufficientlygreat to achieve these benefits, especially the social ones, on a large scale. A causal modelforecasting the aggregate adoption of telecommuting will be useful to policy-makers seeking tounderstand the social impacts of telecommuting, as well as to industries seeking to estimate thedemand for relevant products and services (Handy and Mokhtarian, 1996a, b).
Several researchers have begun to develop disaggregate models of telecommuting choice (or statedpreference), that can provide a foundation for future behavior-based aggregate models(Bernardino, et al., 1993; Sullivan, et al., 1993). The authors of this paper are also studying theindividual choice to telecommute (Mokhtarian and Salomon, 1994; 1996a, b, c), and the workreported here presents an early analysis from that project. In particular, this paper discussessome key decisions in the design of a survey instrument to obtain data on the choice totelecommute, and describes some interesting results of the survey field test. The field testincorporated significant changes to the study questionnaire as the result of a pre-test. The pre-test prompted an effort to assess the presence of a certain type of response bias, and refinementsto question wording in response to some unexpected findings. Conducting the subsequent fieldtest also permitted an interesting comparison between two state government agencies Ð located indifferent types of metropolitan areas and with different organizational cultures Ð on some aspectsof the choice to telecommute. Section 2 provides additional information on the conceptualcontext of this project, and on the survey pre-test. Section 3 describes the sampling design andadministration for the field test, and Section 4 presents some useful results. A summary sectionconcludes the paper.
2. BACKGROUND OF THIS PAPER
The ongoing University of California, Davis study of the choice to telecommute has as itsfoundation a conceptual model of the individual decision process (Mokhtarian and Salomon,1994). Key elements of that process include drives or motivators to telecommute (e.g., to reducecommute stress, to have more time for oneself or one's family, to get more work done), andconstraints on or facilitators of that choice (e.g., awareness, understanding, job suitability,employer or supervisorial support, cost, technology). It is assumed that the absence of bindingconstraints is a necessary but not sufficient condition for telecommuting to be chosen: a drive tomake the choice must also be present.
Roughly in parallel with the development of the conceptual model sketched above, a writtenquestionnaire was also developed. The survey was designed to obtain quantitative data on theelements of the model, with a view to mathematically operationalizing the hypothesized

relationships among those elements. This self-administered questionnaire was pre-tested on thestaff of the Telecommunications Office at UC Davis, plus some State employee acquaintances ofthe researchers. The pre-test sample of 35 (30 from UCD) was by no means representative,consisting primarily of affluent professionals (median household annual income $55,000 - 75,000;62% of the respondents classifying themselves as professional, technical, or managerial).Nevertheless, several findings from the analysis of the pre-test data were perhaps unexpected,and motivated us to make changes in the survey design beyond the anticipated minor refinementsin wording.
Two findings in particular were notable: the first dealing with reasons for wanting totelecommute, and the second dealing with the comparative preference for telecommuting fromhome versus from centers. Regarding the first finding, it was striking that the primary reasongiven for wanting to telecommute was neither "to reduce the stress of commuting" (selected asmost important by 7%) nor "to spend more time with my family" (3%, or one person) Ð twooften-cited benefits Ð but rather, overwhelmingly, "to get more work done" (62%).
This is certainly a plausible result for highly-motivated professionals with relatively benign, ifsomewhat lengthy, commutes (one-way medians of 18 miles and 25 minutes) and relatively fewchild care concerns (the sample being 46% female, but with 49% of the households having no oneyounger than 16, 77% having no one younger than 6, and 86% having no one younger than 2years old at home). It is not inconsistent with findings of Duxbury, et al. (1987) that employeesperceived reduction of job stress and improved quality of work life as important advantages oftelecommuting. However, the pre-test questionnaire was accompanied by a strong cover letterfrom the director of the UCD Telecommunications Office, intended to maximize the responserate (and therefore stressing the importance of the study to the Office and urging cooperation).The hypothesis could not be ruled out that this letter had the unintended effect of biasingresponses toward what people believed their employer wanted to hear (even though the surveyscould be completed anonymously and returned directly to the Institute of TransportationStudies, and it was stressed that only aggregate data would be reported). As described further inSection 3, the research team decided to try to test this hypothesis in a second, fieldadministration of the survey, by using multiple versions of a cover letter and evaluating theimpact on responses.
The second notable finding from the UCD pre-test was a marked preference for home-basedtelecommuting over the center-based form. For example, only 4% of the sample said they wouldnot like to telecommute from home at all, whereas 53% said they would not like to telecommutefrom a center at all. Again, given the sample characteristics, this result is credible: therespondents were mostly professionals (i) whose job fulfillment presumably derived more fromthe intrinsic satisfaction of the work itself than from the social opportunities it afforded (andwho therefore would be inclined to weigh the social interaction advantages of a telecenter lessheavily); and (ii)Êwho had ample space at home for an office (97% of the respondents had alreadyset aside space, or could do so if the opportunity arose to work from home).
However, it was also considered likely that uncertainty about what a "telecommuting center"was, compared to the relative familiarity of "working from home", contributed to the lukewarm

and sometimes inexplicable response. For example, contrary to conventional wisdom,respondents felt that their jobs would permit them to work from home more frequently thanfrom a telecommuting center, and they believed that their supervisor would generally let themtelecommute more frequently from home than from a center. As a further indication ofuncertainty, there was an item non-response rate of 11% for the group of questions relating touse of a telecenter, compared to full completion of the parallel questions relating to work fromhome.
To partly counteract that familiarity differential, the revised field test version of the surveytreated telecommuting centers preferentially in two ways. First, the description oftelecommuting centers present in the pre-test version was enhanced by adding a sentence andsetting it apart from the other instructions for answering the questions in that section. Therevised description, with the new sentence shown in italics here (but not in the survey itself),was as follows:
"There are two forms of telecommuting: working from home, and working from atelecommuting center... A telecommuting center may simply be a workstation in anexisting facility operated by your employer, or it may be an entire building dedicated totelecommuters. Assume that a telecommuting center will be closer to your home thanyour main workplace is. For some people, a telecommuting center may have someadvantages over working from home, such as: more space, access to needed equipment,and the chance to interact with other people."
The second way in which the revised survey tested the relative preference for working fromhome was to force a (hypothetical) choice between paying to work at home, versus working froma telecenter. The pre-test survey contained the following question, among others in the section:
"Assuming that there are no work-related constraints, how much would you like totelecommute (a) from home; (b) from a telecommuting center?", with categoricalfrequency responses.
The field test survey contained the above question, plus two additional ones. The first oneasked,
"Assuming that there are no work-related constraints, and that telecommuting fromhome would require you to buy up to $1000 worth of equipment, how much would youlike to telecommute (a) from home; (b) from a telecommuting center?",
while the second question was identical except for a cost of $3000 to telecommute from home.
3. FIELD TEST SAMPLING DESIGN AND ADMINISTRATION
The cover letter could affect survey response in at least two important ways: response rate, andresponse content. A strongly-worded letter from upper management could increase the numberof people who respond, a desirable result. Heberlein and Baumgartner (1978), for example, foundthat employees were more likely to return surveys than the general population. Here, eventhough both cover letters were addressed to respondents as employees, the one signed by theiremployer may be more likely to reinforce the respondents' employee status.
However, a letter from management could also bias the way in which people respond (towardanswers considered acceptable to the employer), an undesirable result. Conversely, a letter froma neutral party (such as a research university) may have little effect on response content, but isalso likely not to attract as high a response rate.
To test the impact of the cover letter on survey response, three alternate versions of the coverletter were originally envisioned: one on employer letterhead, signed by a senior manager anddistributed (with the survey) at the worksite; one on UC Davis letterhead, signed by the projectdirector and distributed at the worksite; and one on UC Davis letterhead and signed by theproject director, but mailed to the employee's home with no mention of the employer by nameanywhere. These three alternatives are in descending order (i.e., high to low) for both theexpected response rate and the expected bias in response content.
A relatively small initial sample of about 300 people was planned. We decided to approach theCalifornia State government as the employer, for several reasons: physical proximity of UCDavis to Sacramento, the state capital; an expectation of receptivity in view of the State's well-known telecommuting program (see, e.g., Kitamura, et al., 1990); and the cordial relationshipbetween UC Davis and the manager of the State telecommuting program. Inquiries on behalf ofthe university by the State's telecommuting program manager yielded several agencies who wouldbe willing to serve as field test sites. Two agencies were selected, as a balance betweenminimizing the burden on any one office and minimizing the logistics of involving multipleorganizations. The two agencies were the Franchise Tax Board (FTB), based in Sacramento, andthe Public Utilities Commission (PUC), based in San Francisco.
The third alternative cover letter strategy (UCD letterhead, and mailing to the employee's home)could not be implemented. For privacy reasons, both agencies declined either to provide homeaddresses of their employees or to mail the surveys themselves so that home addresses wouldnot be disclosed outside the agency. Doing a purely random mail survey was considered butrejected for two reasons: it was expected that the response rate would be sufficiently low that alarge number of surveys would need to be mailed out to achieve a useful number of responses;and comparability to the results obtained from the other two versions of the cover letter wouldbe compromised since the third group of respondents would belong to many different employers.
Thus, the field test of the survey had a 2x2 sample design: two organizations, each with twoversions of the cover letter. A sample of 80 employees in each of those four categories wasdrawn, for a total of 320 surveys distributed. By design, the sampling procedure was partly non-random and partly random. Employees were somewhat non-randomly selected, to maximize theresponse rate for the small test, but randomly assigned to cover letter group. Specifically, allknown telecommuters in both agencies were included, with half in each agency randomly assignedto each cover letter group. Non-telecommuters were chosen by selecting every nth name from analphabetical list of all agency employees, and eliminating those whose occupations were knownto be unsuitable for telecommuting. However, the sampling frame included clerical as well asprofessional occupations. Within each agency, half of each group of non-telecommuters wasrandomly assigned to each cover letter group.

The field test was conducted in November and December 1992. The employer cover letter forPUC was signed by the agency executive director. FTB chose to have its employeetransportation coordinator (ETC) sign its cover letter, arguing that employees were accustomedto seeing surveys come from the ETC which they were expected to complete to comply withlocal trip reduction regulations. For all four categories, the survey was labeled and distributed in-house, accompanied by a business reply mail envelope addressed to the UC Davis Institute ofTransportation Studies (ITS-Davis), so that it could be returned directly and anonymously to theuniversity researchers. Follow-up reminder notices, on the same letterhead as the original coverletters and signed by the same people, were distributed in-house about two weeks after thesurveys went out (later for PUC, due to uncontrollable circumstances).
4. RESULTS
The following subsections respectively discuss results of the field test relating to the responserate, sample demographics, amount of telecommuting, and advantages of telecommuting. In allsubsections, responses are compared by organization. In the first and fourth subsections,responses are also compared by cover letter.
4.1 Response Rate
Table 1 classifies the number of surveys received by cover letter (employer versus UC Davis)and organization (FTB versus PUC). The overall response rate of 56.3% is excellent for a 14-page questionnaire, simply photocopied and corner-stapled, with no incentive offered. Theresponse rate suggests a high level of interest in telecommuting among the employees surveyed.
The response rate was coincidentally identical between the two agencies. It is interesting that thePUC response rate was as high as FTB's, in view of the facts that: (a) the PUC surveys weredistributed one week later than FTB's, and were due November 20, the Friday beforeThanksgiving; (b) the PUC reminder notices were not distributed until December 11; and (c) PUCstaff were asked to complete another, unrelated, long survey at the same time as this one wentout. One could speculate that PUC's response rate would have been even higher had these threefactors not been in effect.
The type of cover letter somewhat affected response rates, but in the opposite direction thanexpected. For FTB the response rates were identical between the two cover letters (56.3%), butfor PUC the UC Davis cover letter attracted a higher response rate (61.3%) than the cover lettersigned by the employer representative (51.3%). This was despite the fact that the PUC coverletter was signed by the highest ranking official of the agency. A logical inference might be that apervasive negative or neutral attitude toward management would inhibit the response to amanagement-supported survey. Nevertheless, an analysis of variance (ANOVA) determined thatneither the main nor the interactive effects of cover letter and agency on response rate werestatistically significant.
4.2 Demographic Characteristics of the Sample
The combined sample of 180 respondents was 47% male; with median age falling into thecategory of 41-50 years old; predominantly professional/technical (67%, with 22% management,8% clerical, and 4% other); having a median annual household income of $55,000 - 74,999; a meanhousehold size of 2.8 people; and a mean of 2.2 licensed drivers per household. The PUCsubsample of 90 respondents was more likely to be male (64% male, versus 30% for FTB),slightly older, in a management occupation, have higher household income, and more educationthan the FTB subsample. There were no significant differences between the two agencies interms of mean household size and mean number of licensed drivers. FTB had a slightly highermean number of vehicles per household (2.2, compared to 1.8 for PUC) and vehicles per licenseddriver (0.99, versus 0.85 for PUC), but these differences were not statistically significant at the5% level.
There were, however, noteworthy variations in commute patterns between the two subsamples.PUC respondents lived significantly farther from work than FTB respondents (22.3 miles onaverage, compared to 16.3 miles), and had significantly longer and slower commutes (morningmean travel times of 50.8 minutes, compared to 27.4 minutes for FTB). TableÊ2 shows that PUCrespondents were much less likely to drive alone to work (14.2%) than FTB respondents(60.4%), and much more likely to share a ride or use transit. These results are consistent withthe observation that San Francisco (the location of the PUC office) is a larger, denser, morecongested metropolitan area, more heavily served by transit, than Sacramento (the location ofFTB).
4.3 Amount of Telecommuting
Six questions on the survey related to the amount of telecommuting suited to the respondent.The first asked how much their job would permit them to telecommute, the second asked howmuch their supervisor would permit them to telecommute, the third asked how much they werecurrently telecommuting, the fourth asked how much they would like to telecommute, and (asdescribed in Section 2) the fifth and sixth questions asked how much they would like totelecommute if it cost them $1000 and $3000, respectively, to telecommute from home. Eachquestion asked for separate answers for home-based and center-based telecommuting, andprovided frequency categories to be checked off. The discussion below first focuses on theanswers regarding the frequency of home-based telecommuting. Later, the telecommuting centerresponses are discussed.
4.3.1 Home-Based Telecommuting
Figure 1 compares the responses of the two agencies on each of the six questions above, forhome-based telecommuting. The predominant observation is that for every question, FTBemployees responded with higher frequencies, on average, than PUC employees. On the firstquestion, FTB employees believed their jobs permit them to telecommute from home more oftenthan PUC employees do (although a one-way ANOVA of the organization effect indicates thatthe differences between the two agencies are not statistically significant). This may be partly dueto the higher proportion of management staff in the PUC sample (29%, versus 16% for FTB).

PUC respondents also spent more time in work-related travel and in site-specific work than didtheir FTB counterparts.
On the second question, FTB employees believed that their supervisors would let themtelecommute from home more often than did PUC employees, the difference being significant atthe 0.01 level. This could partly be due to the job suitability differential identified above. It isalso possible, in keeping with the lower PUC response rate for the employer-signed cover letter,that there is a more adversarial relationship between staff and supervisors at PUC.
On the third question, the amount of current telecommuting is worth discussing in some detail.Given the fact that PUC employees face a longer and more congested commute, as shown inSection 4.2, it might be expected that more of them would telecommute, and that they wouldtelecommute more often, than FTB employees. Neither of those hypotheses are supported bythese data. Regarding the number of telecommuters, slightly more PUC employees do nottelecommute from home at all (58%) than FTB employees (53%). Interestingly, however, basedon the response to a question elsewhere in the survey, more PUC respondents havetelecommuted at one time or another (57%) than FTB respondents (50%), although FTBrespondents are more likely than PUC to have telecommuted regularly (29% and 21%,respectively) as opposed to occasionally. Some of that may be due to the increased (butsomewhat ad hoc and temporary) adoption of telecommuting at PUC following the 1989 LomaPrieta earthquake (Pratt, 1991), an event that affected commutes in the San Francisco Bay Areabut not in Sacramento.
As for frequency of current telecommuting, 27% of the FTB staff telecommutes from home atleast 1-2 days a week, compared to 8% of the PUC staff. None of the PUC staff telecommutemore than 1-2 days per week, whereas 8% of the FTB staff do. The differences between the twoagencies are significant at the 0.07 level. Pratt's (1991) case study of PUC states thattelecommuting was officially permitted up to three days a week. However, she identifies threemanagement policies that placed de facto limits on the amount of telecommuting that could occur:not allowing employees both to telecommute and to have a compressed work schedule (9/80 or4/40); requiring a fixed telecommuting schedule and not allowing missed days to be made up; androtating some types of staff into new positions every six months.
It is possible that a sort of halo effect is at work among the answers to these first three questions.That is, the fact that more telecommuting is actually occurring at FTB may lead bothtelecommuters and non-telecommuters in that sample to perceive telecommuting to be morepossible when considering both job characteristics and supervisor attitude.
On the fourth question, one might expect the unconstrained desired amount of telecommuting tobe similar between the two agencies. Indeed, there is no statistically significant differencebetween the two organizations in the desired amount of telecommuting from home (p= 0.21).About the same proportion of employees in each sample want to telecommute to some degree:only 6% of FTB and 4% of PUC respondents do not want to telecommute from home at all (5and 4 respondents, respectively). However, on average PUC employees do not want totelecommute as frequently as FTB employees do, although both groups overwhelmingly want totelecommute more frequently than they currently are (this is true for both telecommuters and

non-telecommuters). PUC respondents may be taking their job suitability into account inindicating that they want to telecommute less often than FTB, even though the question said,"Assuming there are no work-related constraints..." In-depth analysis of other parts of thesurvey is necessary to determine whether there are variations in attitudes and drives between thetwo samples that further explain the difference.
Finally, requiring the employee to pay something to work from home does dampen the desire totelecommute for both groups. For a cost of $1000, the proportions not wanting to telecommuteat all rise to 33% for FTB and 26% for PUC. Note that while more FTB staff than PUC staff donot want to telecommute in this situation, those FTB staff that do want to telecommute tend towant to do so more often than PUC. However, there is no statistical difference between the twoorganizations (p=0.61).
When the cost to telecommute from home rises to $3000, the proportions not wanting totelecommute at all rise to 58% for FTB and 47% for PUC. Overall, there is no significantdifference between the two agencies (p=0.43). Note that more people are lost from the 1-2 daysper week category than from the higher frequencies. This suggests that the people who arewilling to telecommute even at a high cost will naturally want to telecommute often, to maximizethe return on their investment. Put another way, it probably would not be worth it to mostpeople to pay $3000 to telecommute only one or two days a week or less. The group who iswilling to pay a lot to telecommute may constitute a "hard core" of people who are stronglymotivated to telecommute, for whatever reason (Sullivan, et al., 1993). This type of persondeserves further study, especially in a larger sample.
4.3.2 Center-Based Telecommuting
In analyzing the amount of center-based telecommuting that is suited to the individual, theprimary comparison of interest is between the home-based and center-based responses for thecombined sample (rather than a breakdown by organization or cover letter). Despite the attemptto clarify the telecommuting center concept, and to force a choice between working from a centerand paying to work from home (Section 2), the results for the field test do not differsubstantively from those for the pre-test. First, the item non-response for the telecenterquestions ranges from 7 to 13% (compared to 1 - 2% for telecommuting from home), suggestingsome remaining uncertainty about the telecenter concept.
Second, working from home still dominates center-based telecommuting on every question. Onthe first question, 20% believed their jobs did not permit working from a telecenter at all, whereasonly 10% believed their jobs did not permit working from home at all. A c2 -test found asignificant difference in distribution of responses between home and center, at p=0.09. On thesecond question, 28% felt their supervisor would not let them work from a center at all,compared to 22% for working from home. The c 2 -test for this question was not significant,however (p=0.37). Again, these two findings are contrary to conventional wisdom, which holds(a) that managers will be more comfortable with allowing their staff to telecommute from a centerthan from home, and (b) that centers are likely to more closely replicate the equipment, services,
and working environment of the main office, thus allowing more of one's job to be doneeffectively from a center than from home (Mokhtarian, 1991a).
A few respondents both gave counterintuitive answers to these first two questions and providedphone numbers indicating they were willing to be interviewed further. These respondents werecontacted and asked to clarify their answers. Most of them were able to give logical explanationsfor their responses. One cited personality characteristics: as an independent but shy person, thesupervisor believed that home was a more appropriate telecommuting base than a center for thisworker. Others cited job characteristics: one's job demanded quiet concentration that thesupervisor feared would not be available at a center. Another's work involved long waits betweensubmission of batch jobs, and the supervisor agreed that this time between jobs could be moreproductively and flexibly spent at home than in a center.
On the third question, not surprisingly, a c 2 -test found a significant difference in the distributionof the amounts of current telecommuting from home versus from a center (p=0.00). However,five people (2.8%) indicated at least some amount of current telecommuting from a center. Asneither of the agencies had officially-sanctioned telecenters available, this result was questionable.We were able to contact two of the five people regarding their responses, and they indicated thattheir answer must have been a mistake. This disconcerting (but not necessarily surprising)finding can perhaps serve as an informal benchmark as to how seriously other responses (in anysurvey) should be taken.
The fourth question reveals a preference for home-based over center-based telecommuting: only5% of the sample did not want to work from home at all, whereas 37% did not want to workfrom a center at all. A c 2 -test found a highly significant difference in distribution of responsesfor the home compared to a center (p=0.00). The cross-tabulation of responses to home andcenter for this question are also of interest, though. Only 9% of the sample wanted totelecommute from a center more often than from home (and therefore could be saidunambiguously to prefer the center to home). But for 38% of the sample, the two frequencyresponses were the same, and thus they could be presumed to be roughly indifferent between thetwo options. Thirty-nine percent of the sample wanted to telecommute more from home thanfrom a center, and for 13% a preference could not be determined due to missing data in one orboth answers. Note that as with the pre-test, this sample predominantly contains affluentprofessionals and managers, so for the reasons discussed in Section 2 the preference for home-based telecommuting is not surprising.
The fifth and sixth questions (paying to work from home) were expected to shift people awayfrom home-based and toward center-based telecommuting. Instead, respondents rejected bothforms of telecommuting. When asked to pay $1000 to work from home, 29% did not want towork from home at all, and 51% did not want to work from a center. The difference indistributions is significant at p=0.008. At $3000, 55% did not want to work from home, and61% did not want to work from a center. Here, since most of the sample did not want totelecommute at all from either location, the distributions are not statistically different (p=0.30).A logical explanation for these results is that the questions were misunderstood to mean thateither form of telecommuting would cost the stated amount, even though the phrase

"telecommuting from home" was in boldface type (as shown in Section 2). This was confirmedby several of the respondents contacted about their answers. However, five of the nine contactedregarding this question indicated a deliberate "home-or-nothing" preference. These respondentshad strong (if sometimes suspect) reasons for wanting to work at home (one expressed the needto do chores around the horse ranch while telecommuting; another believed a center would be toonoisy to concentrate), and apparently did not desire to work from a center at all.
4.4 Perceived Advantages of Telecommuting
The questionnaire listed 15 (plus "other") potential advantages of telecommuting, andrespondents were asked to rate the importance of each advantage to them personally. Inaddition, respondents were asked to select the first, second, and third most important advantagesof telecommuting. Table 3 classifies by cover letter and by organization the eight advantages oftelecommuting most often selected as most important. Table 4 classifies the top eight advantagesas determined by a composite ranking, giving three points to each respondent's first choice, twopoints to the second choice, and one point to the third choice. The differences in responsesbetween cover letter groups are discussed in Subsection 4.4.1, and the differences betweenorganization groups are analyzed in Subsection 4.4.2.
4.4.1 Cover Letter Effect
It was seen in Section 4.1 that (for PUC) the cover letter signed by the employer representativeachieved a lower response rate than the UC Davis cover letter. However, it may still be the casethat those who did respond to the employer cover letter are more likely to give answers expectedto please management. In particular, the hypothesis is that those responding to the cover letterare more likely to answer "to get more work done" as the most important reason fortelecommuting.
Table 3 shows that "to get more work done" is still in first place by a sizable margin, for bothcover letters. However, a higher proportion of respondents gave that answer for the employercover letter (29.1%) than for the UCD cover letter (25.5%). Also, the gap between the first- andsecond-most-often-cited advantages is larger for the employer letter than for the UCD letter.Thus, there is some evidence of a mild cover letter effect on stated reasons for wanting totelecommute. However, a two-way ANOVA of cover letter and organization effects on thisattribute found no significant main or interaction effects.
There are a few differences in ranking for the remaining advantages of telecommuting: the secondand third place reasons ("to reduce the stress of commuting" and "to have more time for myself")are reversed between the two cover letter groups, and the employer letter group was more likelythan the UCD letter group to cite "to help the environment by driving less" as the mostimportant advantage of telecommuting. There are no compelling hypotheses for thesedifferences, and a c 2 -test found no significant difference (p=0.59) between cover letter groups indistribution of responses across the top eight advantages. Separate two-way (cover letter andorganization) ANOVAs on each of the eight advantages found no significant cover letter orinteraction effects. Organization main effects were significant in only two instances, as discussedin Subsection 4.4.2 below.
Table 4 presents the top eight advantages of telecommuting, according to the composite rankingtaking into account the first, second and third most important reasons cited by each respondent.Again, "to get more work done" is the highest-ranked advantage, this time with no differencebetween cover letter groups (20.7% of the total points of the group in each case). There are againminor differences in ranking between groups for some of the other advantages, but they are notstatistically significant (p=0.97). There is one advantage in Table 4 that did not appear in Table3: "to save money" comes into the top eight at number 6, and "to make it easier to pursueeducational or personal interests" drops to number 11 in the composite rankings.
4.4.2 Organization Effect
We now turn to Table 3 to examine the differences between the two agencies in the mostimportant advantage of telecommuting, and here some major variations are seen. First, "to getmore work done" is number 1 for FTB (cited as most important by 30.0%), but only in secondplace (although a close second) for PUC (cited by 24.4%). For PUC, the most importantadvantage of telecommuting is "to reduce the stress of commuting" (cited by 27.8%), whereasthat advantage for FTB is in a distant ninth place (4.4%).
Although one previous study of non-telecommuters (DeSanctis, 1984) found no relationshipbetween objective commute characteristics and attitudes toward telecommuting, another study(Yap and Tng, 1990) found that the perceived frustration/relaxation of the commute was stronglyrelated to a positive view of telecommuting. Here, the prominence of commute concerns is notsurprising for the San Francisco-based PUC employees, who (as discussed in Subsection 4.2)face longer and more congested work trips than the Sacramento-based FTB respondents.However, it is all the more interesting since it was PUC who had its highest-ranking official signthe cover letter, and hence, PUC that might have been expected to have a greater cover-letter-induced bias toward the "to get more work done" response. Other advantages were ratedrelatively similarly between the two agencies, except that FTB employees (8.9%) were muchmore likely than PUC (2.2%) to cite "to be able to work while disabled or otherwise on parentalleave" as the most important advantage of telecommuting. The commute stress anddisability/parental leave attributes were the two for which there was a significant organizationmain effect in the two-way ANOVA mentioned above. A c 2 -test of the difference indistribution between the two agencies found no significant effect, however the p-value wasrelatively small at 0.13.
Similar results appear from the composite rankings tabulated in Table 4. For PUC, reducingcommute stress is in first place (20.4% of the total points of the group), closely followed bygetting more work done (20.2%). For FTB, getting more work done is first (21.3%), with allother responses garnering less than 10% of the total points each. Interestingly, second place forFTB is "to save money" (9.6% of the points), which is in seventh place for the more affluentPUC respondents. These differences in ranking were not statistically significant (p=0.23).
5. CONCLUSIONS
This paper presents results from the field test of a survey designed to collect data on theindividual decision to telecommute. The field test was conducted primarily to assess whether acover letter from the employer would induce a response bias. In particular, it was hypothesizedthat an individual would be more likely to cite getting more work done as the most importantadvantage of telecommuting when the cover letter came from the employer than when it camefrom the University of California, Davis. While a response bias would be an undesirable result, itwas also hypothesized that a cover letter from the employer would increase the response rate, adesirable result.
The survey was administered with two cover letters to each of two State of Californiagovernment agencies: the Sacramento-based Franchise Tax Board and the San Francisco-basedPublic Utilities Commission. The respondents from the two agencies differed primarily in theircommute characteristics: the FTB sample had a shorter, less congested commute, and was muchmore likely to drive alone to work than the PUC sample.
The cover letter had some impact on the response rate, but in the opposite direction thanexpected: for PUC, the response rate was higher for the UCD cover letter than for the employercover letter. A post hoc hypothesis is that an adversarial relationship between management andstaff might make employees less likely to respond to an appeal from the employer.
The cover letter seemed to have at most a small effect on stated reasons for wanting totelecommute: "to get more work done" was still the most important advantage for both coverletter groups. This is a significant finding, since commuting and family concerns are more oftencited by the conventional wisdom as reasons individuals want to telecommute. Increasingproductivity is frequently cited as an advantage to the employer, but the frustration of theemployee with the distractions of the typical workplace seems to be underplayed in importance.However, the unrepresentativeness of the sample should be noted again. Productivity may bemore valued by these mostly professional, technical, and managerial workers, whereas otherconcerns may be paramount in other occupations.
In view of the negative impact on response rate, and small but negative impact on responsecontent, of the employer cover letter, the evidence from this study suggests that future surveysof this type be accompanied by a cover letter from a neutral research institution rather than fromthe employer.
There were some revealing differences between respondents from the two agencies. For PUCemployees, reducing commute stress was the most important advantage of telecommuting,although getting more work done was a close second. For FTB employees on the other hand,getting more work done was decidedly the number one advantage, and reducing commute stressonly in ninth place. PUC employees were currently telecommuting less often than FTBrespondents, and believed that their jobs and supervisors permitted less telecommuting than FTBrespondents did. These results are probably partly due to true differences in job contentbetween the two agencies, but may also be partly due to a more supportive environment fortelecommuting at FTB.

A final comparison of interest was between home-based and center-based telecommuting. Thecombined sample showed a marked inclination toward home-based telecommuting. For example,39% wanted to telecommute from home more frequently than from a center, while only 9%wanted to telecommute from a center more frequently than from home. Counter to expectations,respondents also believed that their jobs and their supervisors would permit them to work morefrom home than from a center. These results may be partly due to uncertainty about what atelecommuting center is, but they are apparently also partly due to job and personalitycharacteristics more conducive to work from home, as well as a strong personal preference forworking from home. If there is adequate space and equipment at home (as was the case for thepredominantly affluent professionals that comprised the sample), and if there are not too manydistractions at home, many people would choose not to dress up and go somewhere to workwhen they could work from home. Thus, future research into the potential of telecommutingcenters should focus carefully on identifying the market niche that those centers are likely to fill.
A full-scale administration of this survey has also been conducted, among employees of the Cityof San Diego. This larger sample (more than 600 respondents) contains a wider variety ofoccupations, across six departments. This diverse sample permits an in-depth analysis of theindividual telecommuting decision process. In particular, the relative preference for home versustelecommuting center is examined in greater detail. Results from this analysis are reported inBagley (1995). Other results of the project are found in Mannering and Mokhtarian (1995) andMokhtarian and Salomon (1996 a, b, c).
ACKNOWLEDGMENTS
The work reported here is funded by the USDOT University Transportation Centers program,through the University of California Transportation Center. Thanks are due to David Fleming,formerly with the State of California Department of General Services, for his assistance inobtaining cooperation from the two agencies studied here. Many thanks also go to Sue Teranishiof the Franchise Tax Board, Judith Toledano of the Public Utilities Commission, and others fromeach agency, who permitted and facilitated the data collection process. Danna Young lentvaluable assistance in identifying and correcting data entry errors, developing the list ofinterviewees, and providing editorial review. Irena Asmundson prepared the figure and checkedthe final tabulations. Laura Laidet performed some of the tabulations and statistical tests.

REFERENCES
Bagley, Michael N. (1995) Binary and Multinomial Models of the Preference for Center-BasedTelecommuting. Master's Thesis, Department of Civil and Environmental Engineering,University of California, Davis. UCD Institute of Transportation Studies Research ReportUCD-ITS-RR-95-16, September.
Bernardino, Adriana T., Moshe Ben-Akiva, and Ilan Salomon (1993) Stated-preference approachto modeling the adoption of telecommuting. Transportation Research Record 1413, 22-30.
DeSanctis, Gerardine (1984) Attitudes toward telecommuting: Implications for work-at-homeprograms. Information and Management 7, 133-139.
Duxbury, Linda E., Chris A. Higgins, and Ric H. Irving (1987) Attitudes of managers andemployees to telecommuting. INFOR 25(3), 273-285.
Gray, Mike, Noel Hodson and Gil Gordon (1993) Teleworking Explained. New York: JohnWiley and Sons.
Handy, Susan L. and Patricia L. Mokhtarian (1996a) Forecasting telecommuting: Anexploration of methodologies and research needs. Transportation 23, 163-190.
Handy, Susan L. and Patricia L. Mokhtarian (1996b) The future of telecommuting. Futures28(3), 227-240.
Heberlein, Thomas A. and Robert Baumgartner (1978) Factors affecting response rates to mailedquestionnaires: A quantitative analysis of the published literature. American SociologicalReview 43(4), 447-462.
Kitamura, Ryuichi, Jack Nilles, David Fleming, and Patrick Conroy (1990) Telecommuting as atransportation planning measure: Initial results of State of California pilot project.Transportation Research Record 1285, 98-104.
Mannering, Jill S. and Mokhtarian, Patricia L. (1995) Modeling the choice of telecommutingfrequency in California: An exploratory analysis. Technological Forecasting and Social Change49(1), 49-73.
Mokhtarian, Patricia Lyon (1991) Defining telecommuting. Transportation Research Record1305, 273-281.
Mokhtarian, Patricia L. and Ilan Salomon (1994) Modeling the choice of telecommuting: Settingthe context. Environment and Planning A 26(5), 749-766.
Mokhtarian, Patricia L. and Ilan Salomon (1996a) Modeling the choice of telecommuting 2: Acase of the preferred impossible alternative. Environment and Planning A 28.
Mokhtarian, Patricia L. and Ilan Salomon (1996b) Modeling the desire to telecommute: Theimportance of attitudinal factors in behavioral models. Transportation Research A.
Mokhtarian, Patricia L. and Ilan Salomon (1996c) Modeling the choice of telecommuting 3:Identifying the choice set and estimating binary choice models for technology-based alternatives.Environment and Planning A, Vol. 28.

Pratt, Joanne H. (1991) The travel behavior impact of telecommuting following the SanFrancisco earthquake: A case study. Transportation Research Record 1305, 282-290.
Sullivan, Mark A., Hani S. Mahmassani, and Jin-Ru Yen (1993) Choice model of employeeparticipation in telecommuting under a cost-neutral scenario. Transportation Research Record1413, 42-48.
Yap, Chee Sing and Helen Tng (1990) Factors associated with attitudes toward telecommuting.Information and Management 19, 227-235.
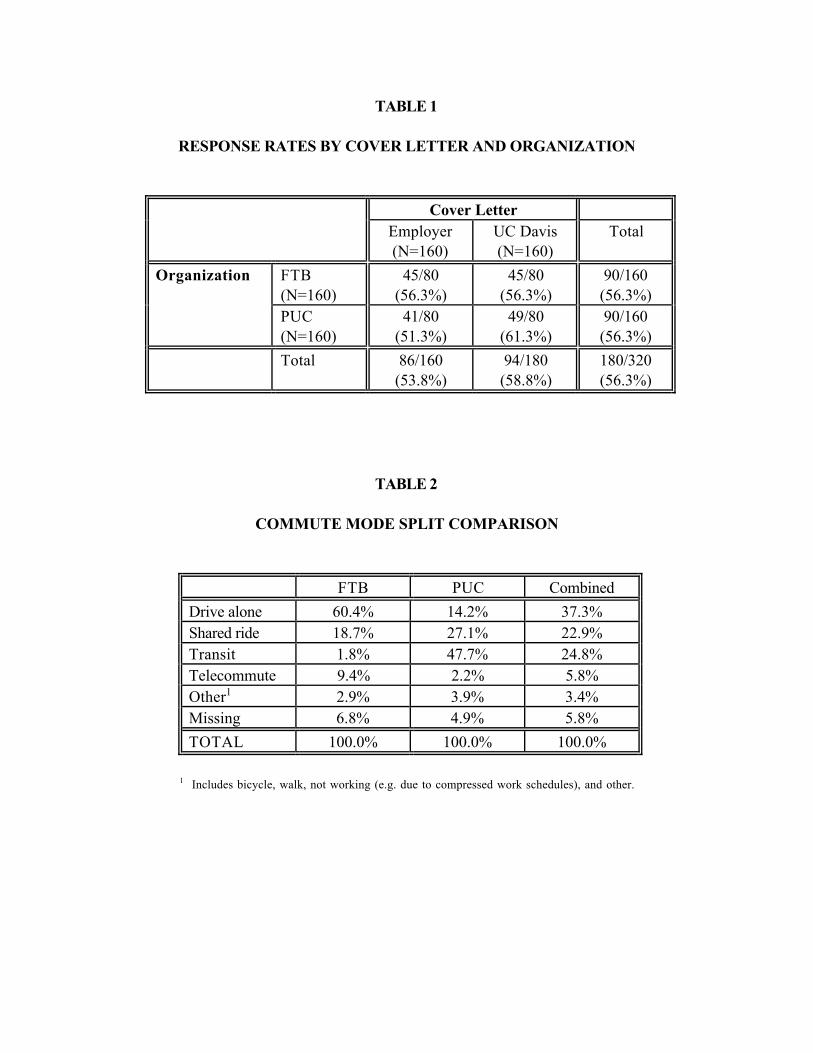
TABLE 1
RESPONSE RATES BY COVER LETTER AND ORGANIZATION
Cover LetterEmployer(N=160)
UC Davis(N=160)
Total
Organization FTB(N=160)
45/80(56.3%)
45/80(56.3%)
90/160(56.3%)
PUC(N=160)
41/80(51.3%)
49/80(61.3%)
90/160(56.3%)
Total 86/160(53.8%)
94/180(58.8%)
180/320(56.3%)
TABLE 2
COMMUTE MODE SPLIT COMPARISON
FTB PUC Combined
Drive alone 60.4% 14.2% 37.3%Shared ride 18.7% 27.1% 22.9%Transit 1.8% 47.7% 24.8%Telecommute 9.4% 2.2% 5.8%Other1 2.9% 3.9% 3.4%Missing 6.8% 4.9% 5.8%
TOTAL 100.0% 100.0% 100.0%
1 Includes bicycle, walk, not working (e.g. due to compressed work schedules), and other.
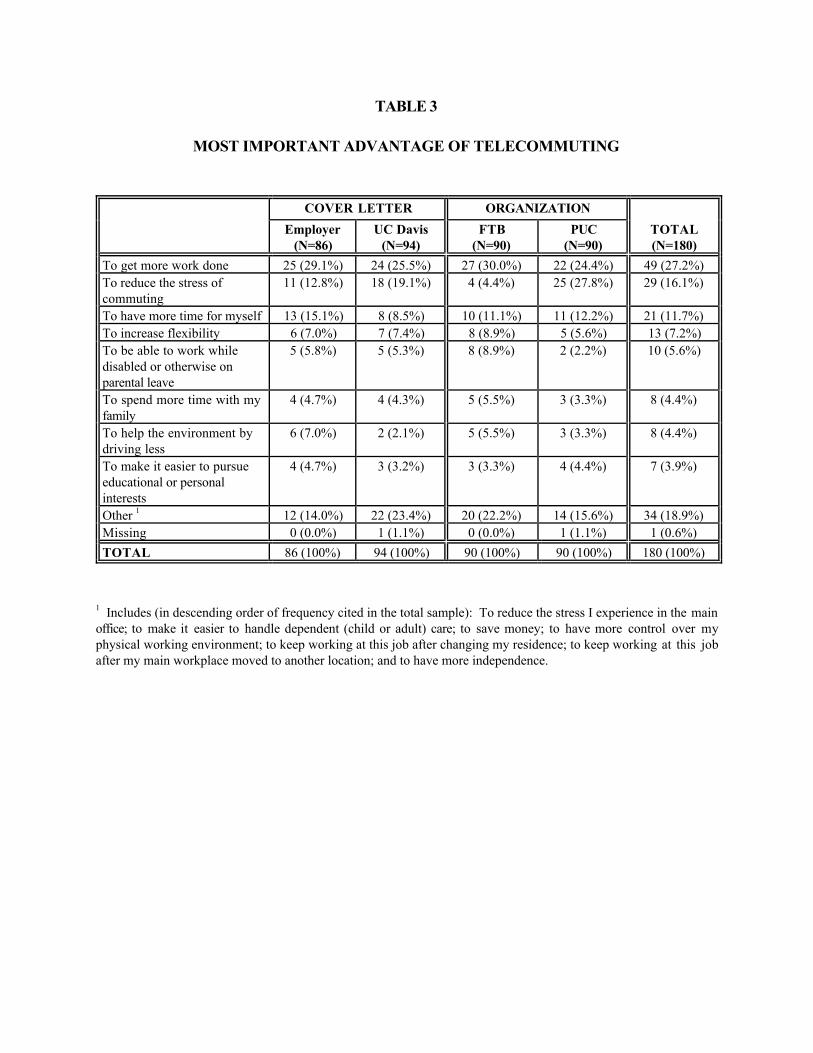
TABLE 3
MOST IMPORTANT ADVANTAGE OF TELECOMMUTING
COVER LETTER ORGANIZATION
Employer(N=86)
UC Davis(N=94)
FTB(N=90)
PUC(N=90)
TOTAL(N=180)
To get more work done 25 (29.1%) 24 (25.5%) 27 (30.0%) 22 (24.4%) 49 (27.2%)To reduce the stress ofcommuting
11 (12.8%) 18 (19.1%) 4 (4.4%) 25 (27.8%) 29 (16.1%)
To have more time for myself 13 (15.1%) 8 (8.5%) 10 (11.1%) 11 (12.2%) 21 (11.7%)To increase flexibility 6 (7.0%) 7 (7.4%) 8 (8.9%) 5 (5.6%) 13 (7.2%)To be able to work whiledisabled or otherwise onparental leave
5 (5.8%) 5 (5.3%) 8 (8.9%) 2 (2.2%) 10 (5.6%)
To spend more time with myfamily
4 (4.7%) 4 (4.3%) 5 (5.5%) 3 (3.3%) 8 (4.4%)
To help the environment bydriving less
6 (7.0%) 2 (2.1%) 5 (5.5%) 3 (3.3%) 8 (4.4%)
To make it easier to pursueeducational or personalinterests
4 (4.7%) 3 (3.2%) 3 (3.3%) 4 (4.4%) 7 (3.9%)
Other 1 12 (14.0%) 22 (23.4%) 20 (22.2%) 14 (15.6%) 34 (18.9%)Missing 0 (0.0%) 1 (1.1%) 0 (0.0%) 1 (1.1%) 1 (0.6%)
TOTAL 86 (100%) 94 (100%) 90 (100%) 90 (100%) 180 (100%)
1 Includes (in descending order of frequency cited in the total sample): To reduce the stress I experience in the mainoffice; to make it easier to handle dependent (child or adult) care; to save money; to have more control over myphysical working environment; to keep working at this job after changing my residence; to keep working at this jobafter my main workplace moved to another location; and to have more independence.
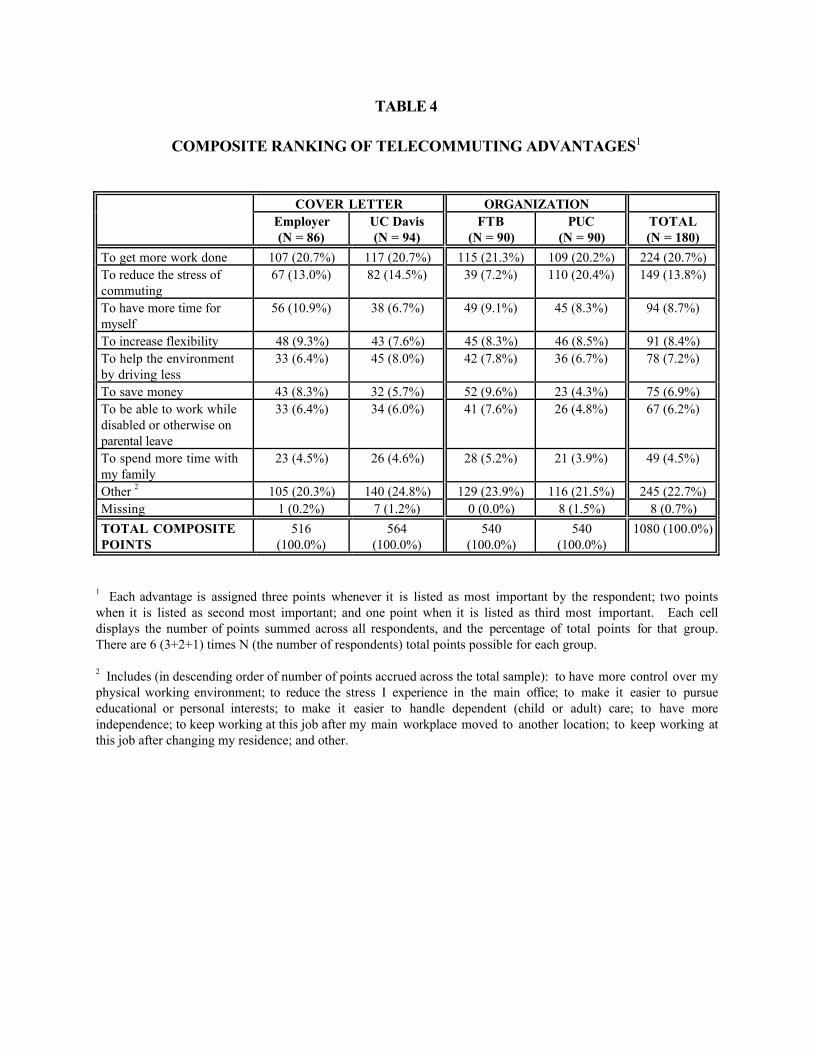
TABLE 4
COMPOSITE RANKING OF TELECOMMUTING ADVANTAGES1
COVER LETTER ORGANIZATIONEmployer(N = 86)
UC Davis(N = 94)
FTB(N = 90)
PUC(N = 90)
TOTAL(N = 180)
To get more work done 107 (20.7%) 117 (20.7%) 115 (21.3%) 109 (20.2%) 224 (20.7%)To reduce the stress ofcommuting
67 (13.0%) 82 (14.5%) 39 (7.2%) 110 (20.4%) 149 (13.8%)
To have more time formyself
56 (10.9%) 38 (6.7%) 49 (9.1%) 45 (8.3%) 94 (8.7%)
To increase flexibility 48 (9.3%) 43 (7.6%) 45 (8.3%) 46 (8.5%) 91 (8.4%)To help the environmentby driving less
33 (6.4%) 45 (8.0%) 42 (7.8%) 36 (6.7%) 78 (7.2%)
To save money 43 (8.3%) 32 (5.7%) 52 (9.6%) 23 (4.3%) 75 (6.9%)To be able to work whiledisabled or otherwise onparental leave
33 (6.4%) 34 (6.0%) 41 (7.6%) 26 (4.8%) 67 (6.2%)
To spend more time withmy family
23 (4.5%) 26 (4.6%) 28 (5.2%) 21 (3.9%) 49 (4.5%)
Other 2 105 (20.3%) 140 (24.8%) 129 (23.9%) 116 (21.5%) 245 (22.7%)Missing 1 (0.2%) 7 (1.2%) 0 (0.0%) 8 (1.5%) 8 (0.7%)
TOTAL COMPOSITEPOINTS
516(100.0%)
564(100.0%)
540(100.0%)
540(100.0%)
1080 (100.0%)
1 Each advantage is assigned three points whenever it is listed as most important by the respondent; two pointswhen it is listed as second most important; and one point when it is listed as third most important. Each celldisplays the number of points summed across all respondents, and the percentage of total points for that group.There are 6 (3+2+1) times N (the number of respondents) total points possible for each group.
2 Includes (in descending order of number of points accrued across the total sample): to have more control over myphysical working environment; to reduce the stress I experience in the main office; to make it easier to pursueeducational or personal interests; to make it easier to handle dependent (child or adult) care; to have moreindependence; to keep working at this job after my main workplace moved to another location; to keep working atthis job after changing my residence; and other.

Related Documents