1355 Q 2002 Estuarine Research Federation Estuaries Vol. 25, No. 6B, p. 1355–1371 December 2002 Dynamics of Pink Shrimp (Farfantepenaeus duorarum) Recruitment Potential in Relation to Salinity and Temperature in Florida Bay JOAN A. BROWDER 1, *, ZOULA ZEIN-ELDIN 2 ,MARIA M. CRIALES 3 ,MICHAEL B. ROBBLEE 4 , STEVEN WONG 1 ,THOMAS L. JACKSON 1 , and DARLENE JOHNSON 1 1 National Oceanic and Atmospheric Administration, Fisheries, 75 Virginia Beach Drive, Miami, Florida 33149 2 National Oceanic and Atmospheric Administration, Fisheries, 4700 Avenue U, Galveston, Texas 77550 3 Department of Marine Biology and Fisheries and Cooperative Institute for Marine and Atmospheric Research, Rosenstiel School of Marine and Atmospheric Science, University of Miami, Miami, Florida 33149 4 United States Geological Survey, Biological Research Division, Everglades National Park, 40001 State Road 9336, Homestead, Florida 33046 ABSTRACT: Progress is reported in relating upstream water management and freshwater flow to Florida Bay to a valuable commercial fishery for pink shrimp (Farfantepenaeus duorarum), which has major nursery grounds in Florida Bay. Changes in freshwater inflow are expected to affect salinity patterns in the bay, so the effect of salinity and tem- perature on the growth, survival, and subsequent recruitment and harvest of this ecologically and economically important species was examined with laboratory experiments and a simulation model. Experiments were conducted to determine the response of juvenile growth and survival to temperature (158C to 338C) and salinity (2‰ to 55‰), and results were used to refine an existing model. Results of these experiments indicated that juvenile pink shrimp have a broad salinity tolerance range at their optimal temperature, but the salinity tolerance range narrows with distance from the optimal temperature range, 20–308C. Acclimation improved survival at extreme high salinity (55‰), but not at extremely low salinity (i.e., 5‰, 10‰). Growth rate increases with temperature until tolerance is exceeded beyond about 358C. Growth is optimal in the mid-range of salinity (30‰) and decreases as salinity increases or decreases. Potential recruitment and harvests from regions of Florida Bay were simulated based on local observed daily temperature and salinity. The simu- lations predict that potential harvests might differ among years, seasons, and regions of the bay solely on the basis of observed temperature and salinity. Regional differences in other characteristics, such as seagrass cover and tidal trans- port, may magnify regional differences in potential harvests. The model predicts higher catch rates in the September– December fishery, originating from the April and July settlement cohorts, than in the January–June fishery, originating from the October and January settlement cohorts. The observed density of juveniles in western Florida Bay during the same years simulated by the model was greater in the fall than the spring, supporting modeling results. The observed catch rate in the fishery, a rough index of abundance, was higher in the January–June fishery than the July–December fishery in most of the biological years from 1989–1990 through 1997–1998, contrary to modeling results and observed juvenile density in western Florida Bay. Introduction The pink shrimp, Farfantepenaeus duorarum, is a good indicator of the health and productivity of the Florida Bay ecosystem. Pink shrimp in South Florida spawn offshore near the Dry Tortugas about 150 km southwest of Florida Bay, where the pink shrimp supports the multi-million dollar Tor- tugas shrimp fishery (Upton et al. 1992). Pink shrimp immigrate to Florida Bay as postlarvae and * Corresponding author; tele: 305/361-4270; fax: 305/361- 4478; e-mail: [email protected]. spend several months as juveniles feeding and growing before leaving the bay and recruiting to the commercial fishery (Costello and Allen 1966). While in Florida Bay the pink shrimp is important as a major link between the base of the food web and top consumers (Palmer 1962; Rutherford et al. 1982, 1983; Schmidt 1986, 1989; Hettler 1989). Major changes have occurred in Florida Bay and in the harvest and recruitment characteristics of the Tortugas fishery across decades (Sheridan 1996; Ehrhardt and Legault 1999; Fourqurean and Robblee 1999). In 1987 a seagrass die-off began in western Florida Bay that was characterized by the

Welcome message from author
This document is posted to help you gain knowledge. Please leave a comment to let me know what you think about it! Share it to your friends and learn new things together.
Transcript
1355Q 2002 Estuarine Research Federation
Estuaries Vol. 25, No. 6B, p. 1355–1371 December 2002
Dynamics of Pink Shrimp (Farfantepenaeus duorarum)
Recruitment Potential in Relation to Salinity and Temperature in
Florida Bay
JOAN A. BROWDER1,*, ZOULA ZEIN-ELDIN2, MARIA M. CRIALES3, MICHAEL B. ROBBLEE4,STEVEN WONG1, THOMAS L. JACKSON1, and DARLENE JOHNSON1
1 National Oceanic and Atmospheric Administration, Fisheries, 75 Virginia Beach Drive, Miami,Florida 33149
2 National Oceanic and Atmospheric Administration, Fisheries, 4700 Avenue U, Galveston, Texas77550
3 Department of Marine Biology and Fisheries and Cooperative Institute for Marine andAtmospheric Research, Rosenstiel School of Marine and Atmospheric Science, University ofMiami, Miami, Florida 33149
4 United States Geological Survey, Biological Research Division, Everglades National Park, 40001State Road 9336, Homestead, Florida 33046
ABSTRACT: Progress is reported in relating upstream water management and freshwater flow to Florida Bay to avaluable commercial fishery for pink shrimp (Farfantepenaeus duorarum), which has major nursery grounds in FloridaBay. Changes in freshwater inflow are expected to affect salinity patterns in the bay, so the effect of salinity and tem-perature on the growth, survival, and subsequent recruitment and harvest of this ecologically and economically importantspecies was examined with laboratory experiments and a simulation model. Experiments were conducted to determinethe response of juvenile growth and survival to temperature (158C to 338C) and salinity (2‰ to 55‰), and results wereused to refine an existing model. Results of these experiments indicated that juvenile pink shrimp have a broad salinitytolerance range at their optimal temperature, but the salinity tolerance range narrows with distance from the optimaltemperature range, 20–308C. Acclimation improved survival at extreme high salinity (55‰), but not at extremely lowsalinity (i.e., 5‰, 10‰). Growth rate increases with temperature until tolerance is exceeded beyond about 358C. Growthis optimal in the mid-range of salinity (30‰) and decreases as salinity increases or decreases. Potential recruitment andharvests from regions of Florida Bay were simulated based on local observed daily temperature and salinity. The simu-lations predict that potential harvests might differ among years, seasons, and regions of the bay solely on the basis ofobserved temperature and salinity. Regional differences in other characteristics, such as seagrass cover and tidal trans-port, may magnify regional differences in potential harvests. The model predicts higher catch rates in the September–December fishery, originating from the April and July settlement cohorts, than in the January–June fishery, originatingfrom the October and January settlement cohorts. The observed density of juveniles in western Florida Bay during thesame years simulated by the model was greater in the fall than the spring, supporting modeling results. The observedcatch rate in the fishery, a rough index of abundance, was higher in the January–June fishery than the July–Decemberfishery in most of the biological years from 1989–1990 through 1997–1998, contrary to modeling results and observedjuvenile density in western Florida Bay.
Introduction
The pink shrimp, Farfantepenaeus duorarum, is agood indicator of the health and productivity ofthe Florida Bay ecosystem. Pink shrimp in SouthFlorida spawn offshore near the Dry Tortugasabout 150 km southwest of Florida Bay, where thepink shrimp supports the multi-million dollar Tor-tugas shrimp fishery (Upton et al. 1992). Pinkshrimp immigrate to Florida Bay as postlarvae and
* Corresponding author; tele: 305/361-4270; fax: 305/361-4478; e-mail: [email protected].
spend several months as juveniles feeding andgrowing before leaving the bay and recruiting tothe commercial fishery (Costello and Allen 1966).While in Florida Bay the pink shrimp is importantas a major link between the base of the food weband top consumers (Palmer 1962; Rutherford etal. 1982, 1983; Schmidt 1986, 1989; Hettler 1989).
Major changes have occurred in Florida Bay andin the harvest and recruitment characteristics ofthe Tortugas fishery across decades (Sheridan1996; Ehrhardt and Legault 1999; Fourqurean andRobblee 1999). In 1987 a seagrass die-off began inwestern Florida Bay that was characterized by the
1356 J. A. Browder et al.
rapid death of turtlegrass, Thalassia testudinum(Zieman et al. 1988; Robblee and DiDomenico1991; Robblee et al. 1991a). Seagrass die-off wasfollowed by extensive and persistent algal and tur-bidity blooms over much of the bay (Fourqureanet al. 1993). Loss of the estuarine nature of the bayover time and chronic hypersalinity (Zieman et al.1988) are among the many factors hypothesized tohave led to seagrass die-off. Shrimp harvests de-clined to period-of-record lows during the latter1980s (Nance 1994), roughly coincident with sea-grass die-off and other environmental changes inFlorida Bay. This decline may in part be due tochanges in freshwater inflow affecting salinity inthe bay. Browder (1985) and Sheridan (1996)found statistical relationships between pink shrimpharvests and various indices of freshwater flow tothe bay. Other factors affect pink shrimp in FloridaBay. Juvenile densities are strongly linked to sea-grass habitats (Costello et al. 1986). Loss of sea-grass habitat in the die-off resulted in local de-clines in seagrass-associated fishes and inverte-brates including the pink shrimp (Robblee et al.1991b; Sheridan 1992; Matheson et al. 1999).
Florida Bay lies at the downstream end of southFlorida’s extensive water management system. Wa-ter management to control floods, drain wetlands,and sequester water for urban and agricultural useshas altered the volume, timing, and distribution offreshwater inflow to the bay (Fennema et al. 1994;Obeysekera et al. 1999). The objective of this pa-per is to evaluate the relationships among fresh-water inflow to Florida Bay, juvenile pink shrimpproduction within the bay, and shrimp harvests inthe Tortugas fishery. Connecting freshwater inflow,salinity, and ecological conditions is a special chal-lenge because of the bay’s geographic complexity(Fourqurean and Robblee 1999). This paper ex-tends the modeling work described in Browder etal. (1999). The modeling objective is to evaluateproduction of pink shrimp in representative re-gions of the bay by simulating survival and growthas functions of local water temperature and salinity.Spatial extensions of model results were made toestimate relative total potential harvests from ma-jor regions of the bay. Adjustments were thenmade to provide a first approximation of how bot-tom habitat and tidal transport might interact withsalinity to affect juvenile shrimp abundance in thebay and potential harvests in the fishery.
Materials and Methods
FLORIDA BAY
Florida Bay is a complex shallow water ecosystemat the southern tip of Florida with distinct physicaland biological zones that influence the distribution
and abundance of pink shrimp and other species(Fourqurean and Robblee 1999). Physically the bayis composed of many shallow basins partially sep-arated by banks variously exposed at low tide(Holmquist et al. 1989). Banks are most extensivein the west but are more effective barriers to waterexchange in the east (Enos and Perkins 1979). Theprincipal benthic habitats in Florida Bay are sea-grass beds, generally dominated by turtle grass andhard-bottom areas supporting sponges, gorgoni-ans, corals, and macroalgae (Zieman et al. 1989;Hall et al. 1999). Seagrass development is greatestin western Florida Bay and decreases to the eastfollowing a general gradient in sediment depth.Mixed species beds are common and include bothmanatee grass, Syringodium filiformi, and shoalgrass, Halodule wrightii. Seagrass development is lo-cally greatest over the banks (Zieman et al. 1989).Pink shrimp occur throughout the bay (Costelloand Allen 1966). Shrimp density is seasonally veryhigh in western Florida Bay and always low in theeast, closely following the patterns of seagrass. Lo-cally pink shrimp are most abundant on bank-topswhile very high densities of early settlement pinkshrimp are often observed in Halodule grass beds(Costello et al. 1986; Robblee et al. 1991b).
Salinity patterns in the bay are influenced by thewet-dry cycle in south Florida, freshwater inflowand upstream water management, evaporation,mixing with waters of the Gulf of Mexico and theAtlantic Ocean, and internally by restricted circu-lation (Robblee et al. 2001). Freshwater enterseastern Florida Bay from Taylor Slough throughTaylor River and other small coastal creeks (Hittleet al. 2001). Freshwater from Shark Slough and BigCypress enter western Florida Bay after mixingwith coastal waters along the southwest Floridacoast (Lee et al. 2001). Because the bay is shallow,evaporation has a major influence on the bay’s saltbudget (Smith 2000a). Hypersaline conditions of-ten occur by the end of the dry season (April andMay). Highest salinities occur in the northern in-terior, where freshwater inflow is restricted by anatural coastal berm (Hittle et al. 2001) and ex-tensive banks. Salinities exceeding 50‰ are notuncommon and can extend over much of the bayduring multiyear regional droughts.
Tides, circulation, and transport in and near thebay affect not only salinity patterns but also theaccessibility of various parts of the bay to pinkshrimp postlarvae. Tides in Florida Bay are pre-dominantly mixed semi-diurnal and are propagat-ed from west to east across the bay; net water flowacross the western boundary of the bay is west toeast from the Gulf of Mexico to the Atlantic Ocean(Smith 2000b). Postlarval pink shrimp may maxi-mize directional tidal transport by rising in the wa-
Dynamics of Pink Shrimp Recruitment 1357
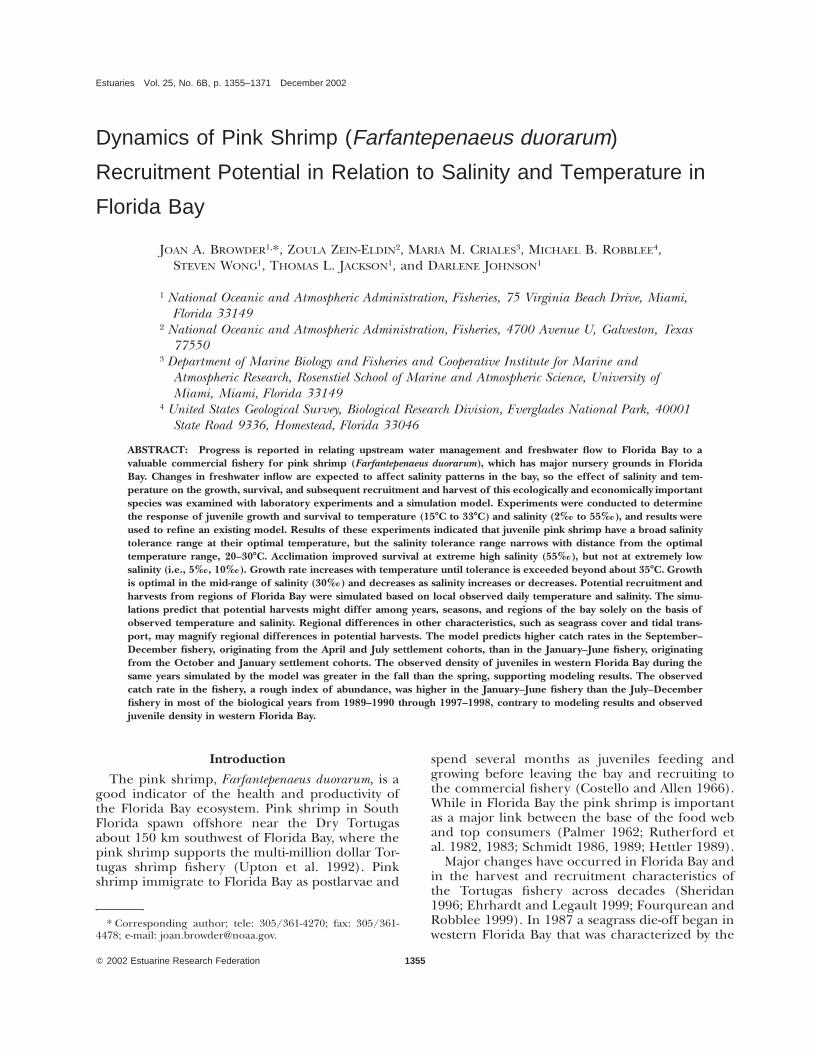
Fig. 1. Conceptual diagram of simulation model of potentialrecruitment from Florida Bay. Shading indicates extent of ourresearch to date on the various model components from white(most work) to dark gray (least work).
ter column on the flood tide and falling to thebottom on the ebb tide (Hughes 1967, 1969).Strong flood tidal currents across mud-banks andthrough inter-island and inter-bank channels facil-itate transport into the bay (Wang et al. 1994;Wang 1998). Tidal amplitude decreases from about60 cm in the west to a few centimeters in the east(Holmquist et al. 1989; Smith 1997). Local windshave a great influence on water level in the bayand may also influence postlarval transport (Wanget al. 1994; Wang 1998). The banks and islandchains that attenuate the tide also retard mixingand transport by winds. Larval transport into in-terior and eastern parts of the bay may be restrict-ed, although pink shrimp postlarvae do reach thebay’s interior (Criales unpublished data).
Two routes have been proposed for transport ofpink shrimp postlarvae from Tortugas spawninggrounds to Florida Bay. One is that postlarvae maydrift downstream with the Florida Current, enter-ing the bay across the Lower and Middle FloridaKeys. The other is that they may move northeastacross the southwest Florida shelf, entering the bayat its western boundary with the Gulf of Mexicosouth of Cape Sable (Munro et al. 1968; Jones etal. 1970; Criales and McGowan 1994; Criales andLee 1995). Subtidal currents are the primarymechanism linking adjacent and remote ecosys-tems on the inner shelf (Wang 1998) and may pro-vide postlarval transport into Florida Bay. They aredriven by local winds and offshore currents (i.e.,Loop Current-Florida Current-Gulf Stream) andare strongly influenced by bathymetry and coast-line orientation (Lee et al. 1994, 2001; Weisberg etal. 1996).
MODELING APPROACH
The full concept of the model under develop-ment is shown in Fig. 1. The core of the model isa unit model that simulates growth and survival ofa cohort of shrimp in relation to salinity and tem-perature. Growth and survival are both fundamen-tal biological processes that affect abundance andrecruitment. The influence of upstream watermanagement is expected to express itself throughchanges in salinity associated with change in fresh-water inflow, and sensitivity to salinity variation hasbeen demonstrated in macroinvertebrates (Kinne1971), including other penaeids (Williams 1955,1984; Zein-Eldin and Renaud 1986; Dall et al.1990). Temperature was included because it is themain environmental factor affecting growth andsurvival, and salinity and temperature interactionshave been reported in penaeids (Bielsa et al. 1983;Dall et al. 1990) and other crustaceans (Hartnoll1982). In model simulations, shrimp that surviveand attain sufficient size are considered potential
recruits to the Tortugas fishery. The outcome ofthe simulations is potential harvests (mt km22)from Florida Bay. Results for each region of thebay are determined from the unit model and thenexpanded to the landscape scale by multiplying bythe region’s total area. Other conditions in FloridaBay must also be favorable to pink shrimp in orderfor salinity to affect growth and survival (Browderand Moore 1981; Browder 1991). For perspectiveon these effects, expanded results were adjustedfor regional differences in physical habitat (bank,basin, or near-key), seagrass density, and an indexof accessibility to postlarvae immigrating into thebay. Adjustment factors were obtained from a mul-tiple regression analysis of existing juvenile densitydata.
PINK SHRIMP MODEL
The mathematical structure and scientific basisof the pink shrimp simulation model are describedin detail in Browder et al. (1999). The model, writ-ten in BASIC, simulates daily growth and survivalas a function of temperature and salinity. Whenindividuals reach the age at first capture in the fish-ery, they are harvested at a constant fishing rate asthey continue to grow and experience natural mor-tality, but at rates no longer affected by bay tem-
1358 J. A. Browder et al.
perature and salinity. Model results are dominatedby three functions: growth in relation to salinityand temperature, survival in relation to salinity andtemperature, and survival in relation to totallength, which is a function of growth rate. Thesebasic equations are the same as in Browder et al.(1999), however the rate coefficients, which arevariables in the model, have been modified andupdated as follows:
In the equation governing exponential growthas a function of salinity and temperature
D1 5 Lt21(eB(t) 2 1)eB(t21), and Lt 5 Lt21 1 D1,(1)
where D1 is change in total length (mm), Lt islength at day t, and Lt21 is length the previous day,B, the growth rate coefficient, previously B 5 Con-stant 1 T 1 T2, is now
B ; Constant 1 T 1 T2 1 S 1 S2 1 ln Lt21, (2)
where T is water temperature, S is salinity, andLt21 is total length the previous time step (day).The von Bertalanffy equation for growth (D2 inthe previous model) was eliminated in this modelbecause it was unnecessary once the variable Lt21
was added to the equation for B, providing a re-lationship between growth and size that approach-es an asymptote.
In the exponential equation for the instanta-neous mortality rate,
M1 5 2lneLP (eLP 1 1)21/28, (3)
where LP, the logit transform of the survival rate,previously LP ; Constant 1 T 1 S 1 T2 1 S2 (anddivision was by 10), is now
LP ; Constant 1 T 1 S 1 T2 1 S2 1 T S. (4)
The equation for M1 back-transforms the logit toobtain the instantaneous 28-d mortality rate andthen divides by 28 to obtain the instantaneous dailymortality rate. The daily survival rate from thissource of mortality is calculated as
SV 5 e2M1, (5)
Regression coefficients are associated with each ofthe independent variables in the equations for Band LP.
The other source of mortality, predation mor-tality (M2), is the same in this model as in Browderet al. (1999) and is
M2 5 A2eB2 L, (6)
where A2 5 predation mortality rate at 0 mm andB2 5 (ln M290 2 ln A2)/90 (where M290 is pre-dation mortality rate at 90 mm of total length).
SALINITY AND TEMPERATURE EXPERIMENTS
Two thousand juvenile pink shrimp, ranging ininitial total length (TL) from 16–67 mm (mean,36.6 mm), were collected from Florida Bay. Surviv-al and growth were tested over a temperaturerange from 158C to 338C (158C to 308C at 58C in-tervals) and a salinity range from 2‰ to 55‰(5‰ intervals from 5‰ to 55‰). A treatment at258C and 25‰ was included in each experimentto facilitate comparisons of treatments across ex-periments. Ten experiments, each consisting of 43 5 combinations of temperature and salinity (20treatments) were conducted. There were 200shrimp to each experiment, with 10 assigned toeach treatment, for a total of 200 trials. Animalswere weighed (nearest mg) and total length wasmeasured (nearest 0.5 mm) initially and at 7-d in-tervals through 28 d. Survival was determined foreach trial as the percent of total individuals (ad-justed by handling deaths and jump out) survivingthe 28-d period. The last three experiments wereconducted to compare tolerance to extreme salin-ity (5‰, 10‰, 45‰, 50‰, or 55‰) with andwithout acclimation. To acclimate, animals were in-troduced to the test salinity after being held at in-termediate salinities for 24 to 48 h. Length of timeand the number and levels of intermediate salinitywere determined by the amount of difference be-tween the ambient and test salinity.
Experimental animals were placed in individual1000-ml beakers with aeration and fed a commer-cial shrimp food (Rangen 30% protein) daily, adlibidum; and feces, excess feed, exuviae, and deadanimals were removed daily and recorded. Test sa-linities were prepared using south Florida waters,both seawater and freshwater. Salinities greaterthan 35‰ were prepared by adding concentratedseawater prepared from Fritz sea salts to the nat-ural water.
Results of the 10 experiments were integrated bymultiple regression analyses into equations thatformed the core of the simulation model. A sur-vival rate was obtained from the data by regressionof the percent surviving at the end of each trial(logit-transformation) against temperature (sec-ond order), salinity (second order), and their in-teraction term. A regression equation that fittedthe length-at-day (since initiation of experiment)data of each individual to an exponential equationwas used to determine individual growth rate co-efficients. Then a regression analysis was per-formed to relate individual growth rate coefficientsto temperature (second order), salinity (second or-der), and initial total length of the individual (asthe natural log). Since the data were obtainedfrom 10 experiments, experiment was included as
Dynamics of Pink Shrimp Recruitment 1359
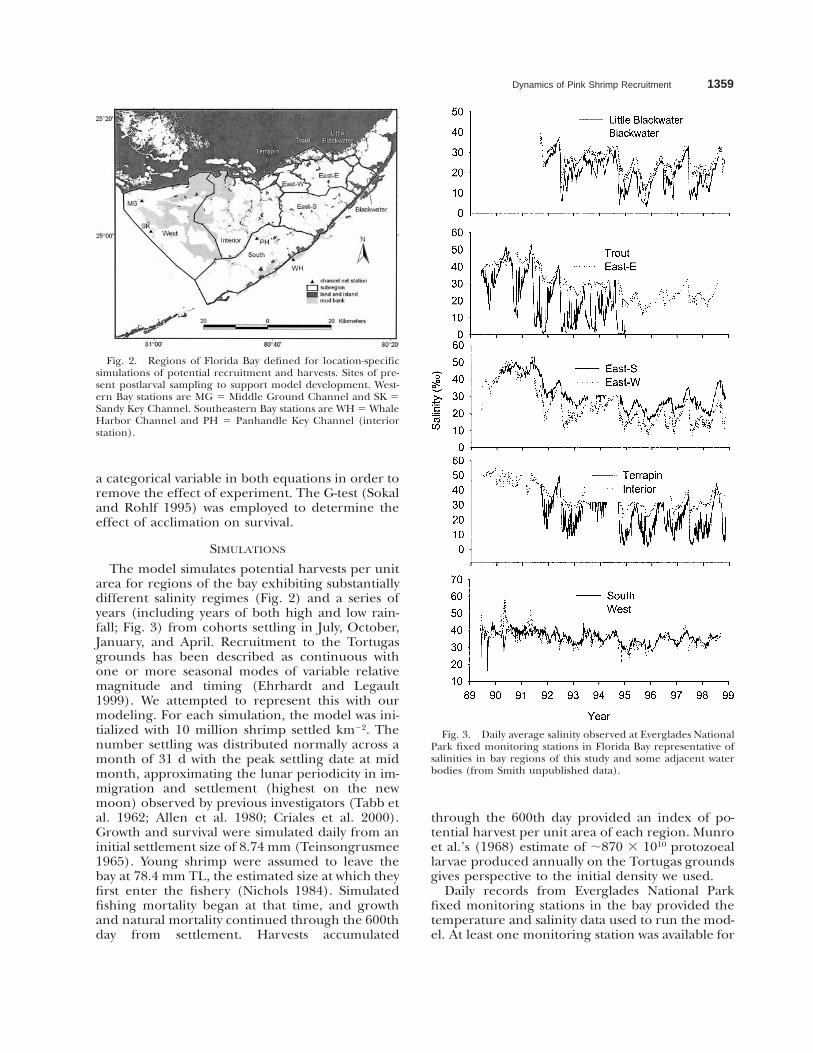
Fig. 2. Regions of Florida Bay defined for location-specificsimulations of potential recruitment and harvests. Sites of pre-sent postlarval sampling to support model development. West-ern Bay stations are MG 5 Middle Ground Channel and SK 5Sandy Key Channel. Southeastern Bay stations are WH 5 WhaleHarbor Channel and PH 5 Panhandle Key Channel (interiorstation).
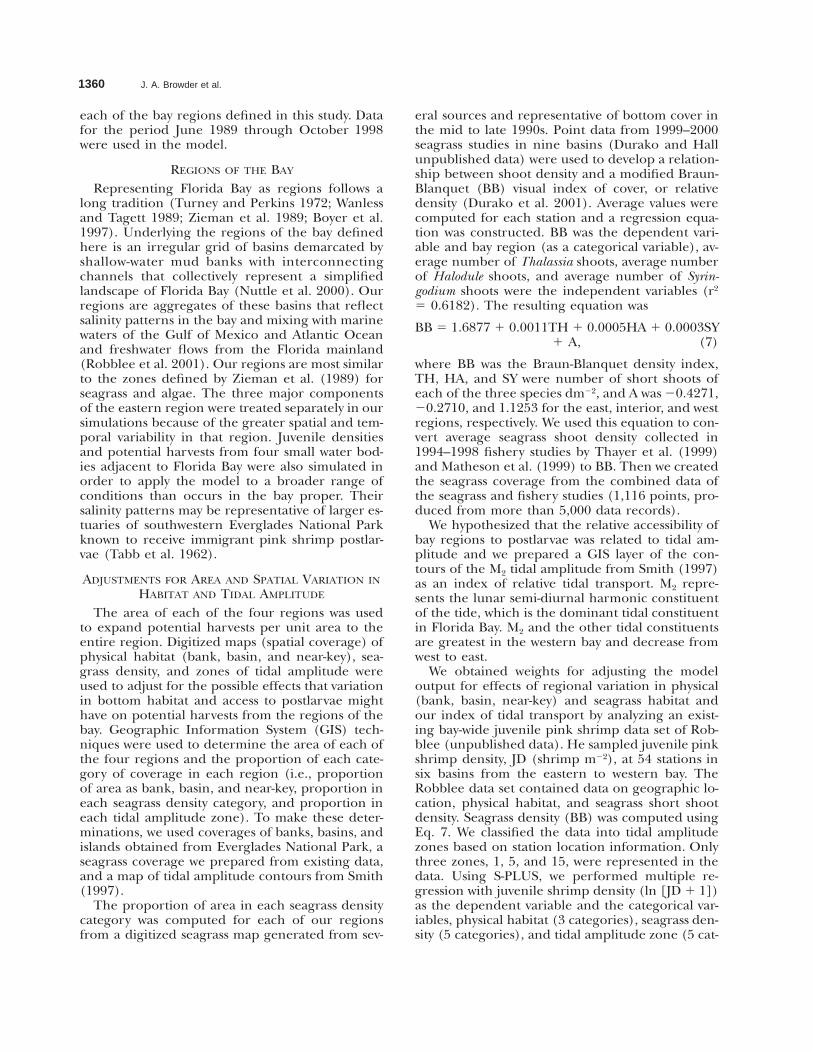
Fig. 3. Daily average salinity observed at Everglades NationalPark fixed monitoring stations in Florida Bay representative ofsalinities in bay regions of this study and some adjacent waterbodies (from Smith unpublished data).
a categorical variable in both equations in order toremove the effect of experiment. The G-test (Sokaland Rohlf 1995) was employed to determine theeffect of acclimation on survival.
SIMULATIONS
The model simulates potential harvests per unitarea for regions of the bay exhibiting substantiallydifferent salinity regimes (Fig. 2) and a series ofyears (including years of both high and low rain-fall; Fig. 3) from cohorts settling in July, October,January, and April. Recruitment to the Tortugasgrounds has been described as continuous withone or more seasonal modes of variable relativemagnitude and timing (Ehrhardt and Legault1999). We attempted to represent this with ourmodeling. For each simulation, the model was ini-tialized with 10 million shrimp settled km22. Thenumber settling was distributed normally across amonth of 31 d with the peak settling date at midmonth, approximating the lunar periodicity in im-migration and settlement (highest on the newmoon) observed by previous investigators (Tabb etal. 1962; Allen et al. 1980; Criales et al. 2000).Growth and survival were simulated daily from aninitial settlement size of 8.74 mm (Teinsongrusmee1965). Young shrimp were assumed to leave thebay at 78.4 mm TL, the estimated size at which theyfirst enter the fishery (Nichols 1984). Simulatedfishing mortality began at that time, and growthand natural mortality continued through the 600thday from settlement. Harvests accumulated
through the 600th day provided an index of po-tential harvest per unit area of each region. Munroet al.’s (1968) estimate of ;870 3 1010 protozoeallarvae produced annually on the Tortugas groundsgives perspective to the initial density we used.
Daily records from Everglades National Parkfixed monitoring stations in the bay provided thetemperature and salinity data used to run the mod-el. At least one monitoring station was available for
1360 J. A. Browder et al.
each of the bay regions defined in this study. Datafor the period June 1989 through October 1998were used in the model.
REGIONS OF THE BAY
Representing Florida Bay as regions follows along tradition (Turney and Perkins 1972; Wanlessand Tagett 1989; Zieman et al. 1989; Boyer et al.1997). Underlying the regions of the bay definedhere is an irregular grid of basins demarcated byshallow-water mud banks with interconnectingchannels that collectively represent a simplifiedlandscape of Florida Bay (Nuttle et al. 2000). Ourregions are aggregates of these basins that reflectsalinity patterns in the bay and mixing with marinewaters of the Gulf of Mexico and Atlantic Oceanand freshwater flows from the Florida mainland(Robblee et al. 2001). Our regions are most similarto the zones defined by Zieman et al. (1989) forseagrass and algae. The three major componentsof the eastern region were treated separately in oursimulations because of the greater spatial and tem-poral variability in that region. Juvenile densitiesand potential harvests from four small water bod-ies adjacent to Florida Bay were also simulated inorder to apply the model to a broader range ofconditions than occurs in the bay proper. Theirsalinity patterns may be representative of larger es-tuaries of southwestern Everglades National Parkknown to receive immigrant pink shrimp postlar-vae (Tabb et al. 1962).
ADJUSTMENTS FOR AREA AND SPATIAL VARIATION INHABITAT AND TIDAL AMPLITUDE
The area of each of the four regions was usedto expand potential harvests per unit area to theentire region. Digitized maps (spatial coverage) ofphysical habitat (bank, basin, and near-key), sea-grass density, and zones of tidal amplitude wereused to adjust for the possible effects that variationin bottom habitat and access to postlarvae mighthave on potential harvests from the regions of thebay. Geographic Information System (GIS) tech-niques were used to determine the area of each ofthe four regions and the proportion of each cate-gory of coverage in each region (i.e., proportionof area as bank, basin, and near-key, proportion ineach seagrass density category, and proportion ineach tidal amplitude zone). To make these deter-minations, we used coverages of banks, basins, andislands obtained from Everglades National Park, aseagrass coverage we prepared from existing data,and a map of tidal amplitude contours from Smith(1997).
The proportion of area in each seagrass densitycategory was computed for each of our regionsfrom a digitized seagrass map generated from sev-
eral sources and representative of bottom cover inthe mid to late 1990s. Point data from 1999–2000seagrass studies in nine basins (Durako and Hallunpublished data) were used to develop a relation-ship between shoot density and a modified Braun-Blanquet (BB) visual index of cover, or relativedensity (Durako et al. 2001). Average values werecomputed for each station and a regression equa-tion was constructed. BB was the dependent vari-able and bay region (as a categorical variable), av-erage number of Thalassia shoots, average numberof Halodule shoots, and average number of Syrin-godium shoots were the independent variables (r2
5 0.6182). The resulting equation was
BB 5 1.6877 1 0.0011TH 1 0.0005HA 1 0.0003SY1 A, (7)
where BB was the Braun-Blanquet density index,TH, HA, and SY were number of short shoots ofeach of the three species dm22, and A was 20.4271,20.2710, and 1.1253 for the east, interior, and westregions, respectively. We used this equation to con-vert average seagrass shoot density collected in1994–1998 fishery studies by Thayer et al. (1999)and Matheson et al. (1999) to BB. Then we createdthe seagrass coverage from the combined data ofthe seagrass and fishery studies (1,116 points, pro-duced from more than 5,000 data records).
We hypothesized that the relative accessibility ofbay regions to postlarvae was related to tidal am-plitude and we prepared a GIS layer of the con-tours of the M2 tidal amplitude from Smith (1997)as an index of relative tidal transport. M2 repre-sents the lunar semi-diurnal harmonic constituentof the tide, which is the dominant tidal constituentin Florida Bay. M2 and the other tidal constituentsare greatest in the western bay and decrease fromwest to east.
We obtained weights for adjusting the modeloutput for effects of regional variation in physical(bank, basin, near-key) and seagrass habitat andour index of tidal transport by analyzing an exist-ing bay-wide juvenile pink shrimp data set of Rob-blee (unpublished data). He sampled juvenile pinkshrimp density, JD (shrimp m22), at 54 stations insix basins from the eastern to western bay. TheRobblee data set contained data on geographic lo-cation, physical habitat, and seagrass short shootdensity. Seagrass density (BB) was computed usingEq. 7. We classified the data into tidal amplitudezones based on station location information. Onlythree zones, 1, 5, and 15, were represented in thedata. Using S-PLUS, we performed multiple re-gression with juvenile shrimp density (ln [JD 1 1])as the dependent variable and the categorical var-iables, physical habitat (3 categories), seagrass den-sity (5 categories), and tidal amplitude zone (5 cat-
Dynamics of Pink Shrimp Recruitment 1361
egories), as independent variables. A high corre-lation of seagrass density with tidal amplitude andphysical habitat among sites in this data set pre-vented us from using seagrass density in the sameequation with the other two categorical variables;we made a separate equation for seagrass density.In the multiple regression analyses, computationsfor categorical variables were performed using theHelmert contrast matrix, which is orthogonal andproduces independent contrasts unbiased by un-even sampling design (Mathsoft 1999). Once thelevels were obtained for each category, we addedeach level to the equation’s intercept and thenback-transformed to obtain a predicted JD for eachcategory. For each categorical variable, we selectedthe highest predicted JD and scaled the other pre-dicted JDs to it. These computations were as fol-lows:
JD 5 eI1L 2 1, (8)
where JD, the predicted juvenile density, is the un-scaled weight for each category, I is the intercept,and L is the level for each category. The scaledweight of each category was simply JDi/JDmax,where JDmax is the highest predicted JD for eachcategorical variable. The scaled weights were 1 orless.
To adjust potential harvests from our simula-tions for the effect of each of variable (i.e., physicalhabitat, BB, and tide) separately, we multiplied thescaled weight of each category (e.g., BB 5 1, 2, 3,4, or 5) by the proportion of each region coveredby that category and summed the resulting prod-ucts to obtain a weighting factor for that region, asfollows:
WFa 5 S(PhaSWh), (9)
where WFa is the weighting factor for each regiona, Pha is the proportion of region a as habitat h,and SWh is the scaled weight for habitat h. Theweighting factor for a region would equal one ifthe most favorable category (with a scaled weightof one) covered 100% of that region. We then ad-justed our simulation results for each region andyear by multiplying by the region’s weighting factorfor that variable. We had no data for tidal ampli-tude zones T25 and T35, so we assigned them thesame weight computed for zone T15. We did notattempt to adjust for all three variables simulta-neously because the effect of seagrass density wascorrelated with the effects of the other two vari-ables. It is possible that salinity regime was respon-sible for some of the variation attributed to physi-cal habitat, seagrass density, and tidal-amplitude-related transport.
POSTLARVAL IMMIGRATION
In January 2000 we began monthly sampling atthree sites to quantify concentrations of near-set-tlement-stage pink shrimp postlarvae in the watercolumn in channels connecting Florida Bay to theGulf of Mexico and the Atlantic Ocean (Fig. 2). Afourth site was added in June 2000. Sandy Key (SK)and Middle Ground (MG) channels are two majorpasses connecting the Southwest Florida Shelf topink shrimp nursery grounds in western FloridaBay. Whale Harbor Channel (WH) connects thebay to the Atlantic Ocean, has a relatively highspeed current (Smith 1998), and is the site of pre-vious studies of pink shrimp postlarvae (Allen etal. 1980; Criales et al. 2000). Panhandle Key Chan-nel (PH) connects the bay’s interior to the outerbay and has velocities comparable to those atWhale Harbor. Based on previous studies, we sam-pled at night during the new moon period (Tabbet al. 1962; Allen et al. 1980; Criales et al. 2000).Two moored subsurface plankton channel nets(0.75 m2 opening, 1-mm mesh net, 500-mm meshin the cod end) were set simultaneously at eachsite on two consecutive nights. Nets were attachedto fixed moorings and suspended with floats ;0.5m from the surface. Cod ends were placed on thenets before dusk, and samples were collected fromthe cod ends shortly after dawn. A General Oce-anic flow meter was mounted at the net mouth tomeasure velocity and flow volume through the net.Pink shrimp postlarvae were sorted from the sam-ple, identified, and preserved in 95% ethanol. Theraw catch in each sample was standardized to den-sity per 1,000 m3 of water filtered in hours of dark-ness during flood tide based on Tabb et al. (1962).Mean monthly density was calculated as the aver-age over the two sampling nights. Densities weretested for normality and homogeneity of variance.
Results
SURVIVAL IN RELATION TO SALINITY ANDTEMPERATURE
Response surfaces from the 10 salinity and tem-perature experiments are shown in Fig. 4a,b. Theregression equation for survival rate explained46% of the variation in the predicted variable andwas highly significant (Table 1). Although temper-ature and salinity were not significant (p . 0.05),both squared terms were highly significant, as wasthe interaction term (Table 1). The experimentsindicated that pink shrimp have a wide salinity tol-erance range but are sensitive to temperature ex-tremes (Fig. 4a). They are especially sensitive tohigh salinities at low temperatures and low salini-ties at high temperatures. Acclimation at interme-diate salinity before exposure to extreme salinity

1362 J. A. Browder et al.
Fig. 4. Juvenile pink shrimp response surfaces to tempera-ture (8C) and salinity (‰): experimentally-derived 28-d survival(proportion) (A) and daily growth rate coefficient (B) andmodel-simulated potential pink shrimp harvests through 600thd at constant values of temperature and salinity (C).
(5‰, 10‰, 45‰, 50‰, 55‰) had a significant(p , 0.05) beneficial effect only at 55‰. The dif-ference was not significant at 50‰, and at 45‰the unacclimated shrimp had higher survival ratesthan the acclimated shrimp. We substituted datafrom acclimated treatments at salinity extremes inthe regression analyses in place of correspondingdata from unacclimated treatments.
GROWTH IN RELATION TO SALINITY ANDTEMPERATURE
The regression equation explained 71% of thevariation in the individual exponential growth ratecoefficients of 1,220 individuals (Table 1). This re-gression equation suggests that growth rate is pos-itively related to temperature beyond 35‰ (al-though experiments only went to 33‰) and thesalinity optimum for growth is 30‰ (Fig. 4b). Thelowest growth rates were at salinity extremes at lowtemperatures.
GROWTH IN RELATION TO TOTAL LENGTH
The regression analysis indicated a highly signif-icant relationship of the growth rate coefficient tototal length (ln [Lt21]) (Table 1). When used inEq. 2 of our simulation model, the length-relatedcoefficient of the regression equation, 20.01145(Table 1), had such a strong negative effect ongrowth that shrimp did not reach recruitment size(defined as 78.4 mm TL, based on Nichols 1984)at favorable salinities and temperatures. We as-sumed that a size-related negative influence of con-finement on growth, an artifact of the experiments(Teinsongrusmee 1965), was inflating the value ofthe coefficient. We substituted a smaller value,20.00929, which allowed the model to simulateshrimp growth to a size approaching the 177.75mm TL (maximum size [L`] for the von Berta-lanffy growth equation in Phares 1981) within 600d at 30‰ and 278C.
SIMULATION MODELING
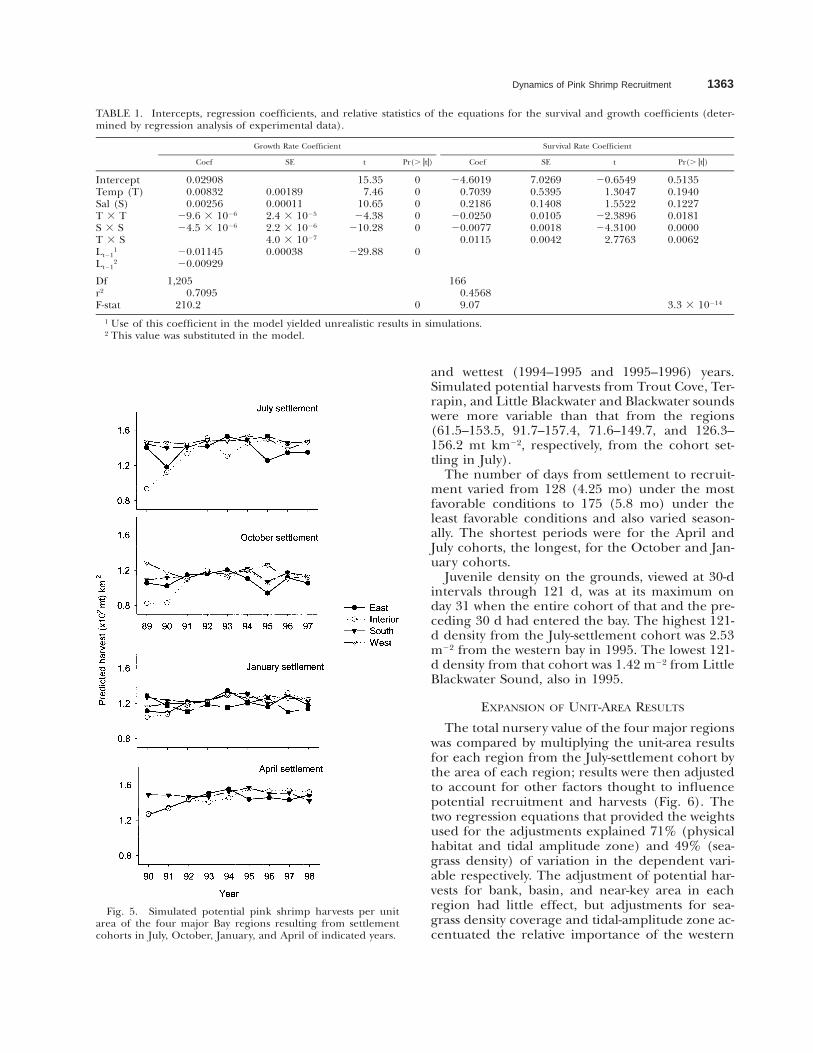
Model simulations holding temperature and sa-linity constant at 58C increments from 08C to 358Cand 5‰ intervals from 0‰ to 70‰ suggestedthat potential harvests are sensitive to salinity ex-tremes (0–15‰), especially at temperatures of158C and lower (Fig. 4c). Simulations using ob-served daily temperature and salinity records fromthe regions of the bay (Fig. 5) suggested that po-tential harvests from July and April cohorts arehigher and vary more than those from Octoberand January cohorts. Year-to-year variation is great-est from the interior (93.6–151 mt km22 from theJuly cohort) region; simulated potential harvestsfrom the west and south regions showed a re-sponse to the driest (1989–1990 and 1990–1991)
Dynamics of Pink Shrimp Recruitment 1363
TABLE 1. Intercepts, regression coefficients, and relative statistics of the equations for the survival and growth coefficients (deter-mined by regression analysis of experimental data).
Growth Rate Coefficient
Coef SE t Pr(. ztz)
Survival Rate Coefficient
Coef SE t Pr(. ztz)
InterceptTemp (T)Sal (S)T 3 TS 3 ST 3 S
0.029080.008320.00256
29.6 3 1026
24.5 3 1026
0.001890.000112.4 3 1025
2.2 3 1026
4.0 3 1027
15.357.46
10.6524.38
210.28
00000
24.60190.70390.2186
20.025020.0077
0.0115
7.02690.53950.14080.01050.00180.0042
20.65491.30471.5522
22.389624.3100
2.7763
0.51350.19400.12270.01810.00000.0062
Lt211
Lt212
20.0114520.00929
0.00038 229.88 0
Dfr2
F-stat
1,2050.7095
210.2 0
1660.45689.07 3.3 3 10214
1 Use of this coefficient in the model yielded unrealistic results in simulations.2 This value was substituted in the model.
Fig. 5. Simulated potential pink shrimp harvests per unitarea of the four major Bay regions resulting from settlementcohorts in July, October, January, and April of indicated years.
and wettest (1994–1995 and 1995–1996) years.Simulated potential harvests from Trout Cove, Ter-rapin, and Little Blackwater and Blackwater soundswere more variable than that from the regions(61.5–153.5, 91.7–157.4, 71.6–149.7, and 126.3–156.2 mt km22, respectively, from the cohort set-tling in July).
The number of days from settlement to recruit-ment varied from 128 (4.25 mo) under the mostfavorable conditions to 175 (5.8 mo) under theleast favorable conditions and also varied season-ally. The shortest periods were for the April andJuly cohorts, the longest, for the October and Jan-uary cohorts.
Juvenile density on the grounds, viewed at 30-dintervals through 121 d, was at its maximum onday 31 when the entire cohort of that and the pre-ceding 30 d had entered the bay. The highest 121-d density from the July-settlement cohort was 2.53m22 from the western bay in 1995. The lowest 121-d density from that cohort was 1.42 m22 from LittleBlackwater Sound, also in 1995.
EXPANSION OF UNIT-AREA RESULTS
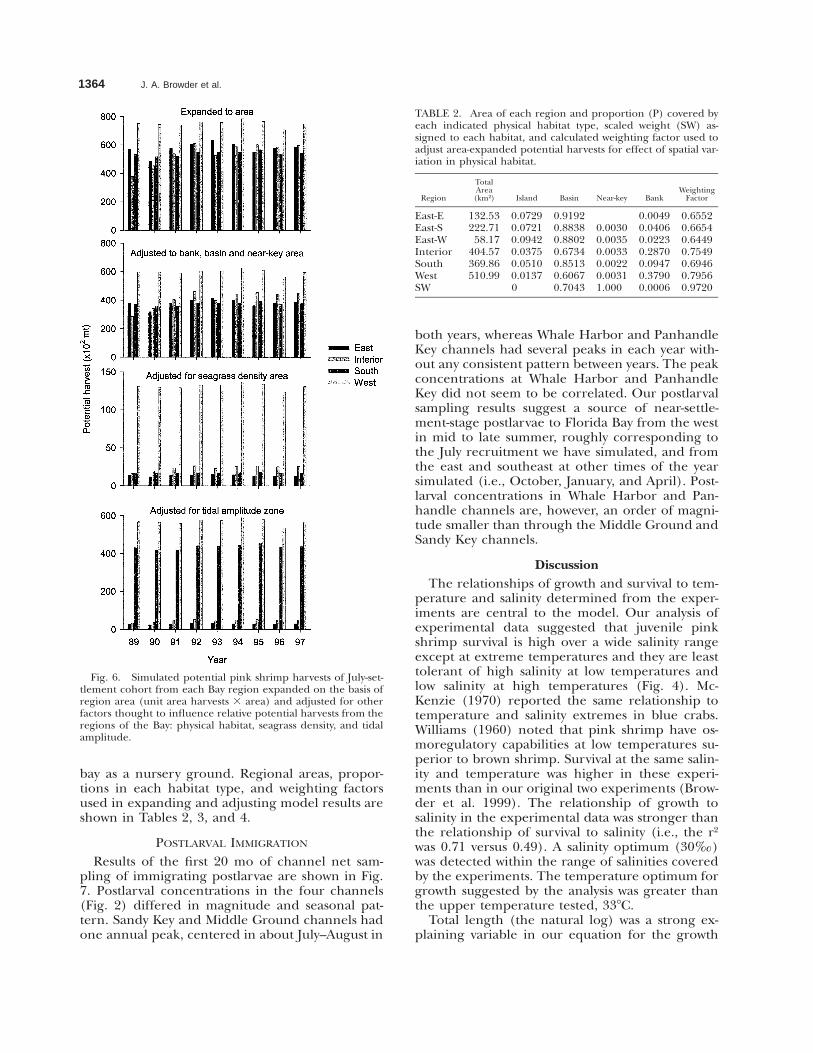
The total nursery value of the four major regionswas compared by multiplying the unit-area resultsfor each region from the July-settlement cohort bythe area of each region; results were then adjustedto account for other factors thought to influencepotential recruitment and harvests (Fig. 6). Thetwo regression equations that provided the weightsused for the adjustments explained 71% (physicalhabitat and tidal amplitude zone) and 49% (sea-grass density) of variation in the dependent vari-able respectively. The adjustment of potential har-vests for bank, basin, and near-key area in eachregion had little effect, but adjustments for sea-grass density coverage and tidal-amplitude zone ac-centuated the relative importance of the western
1364 J. A. Browder et al.
Fig. 6. Simulated potential pink shrimp harvests of July-set-tlement cohort from each Bay region expanded on the basis ofregion area (unit area harvests 3 area) and adjusted for otherfactors thought to influence relative potential harvests from theregions of the Bay: physical habitat, seagrass density, and tidalamplitude.
TABLE 2. Area of each region and proportion (P) covered byeach indicated physical habitat type, scaled weight (SW) as-signed to each habitat, and calculated weighting factor used toadjust area-expanded potential harvests for effect of spatial var-iation in physical habitat.
Region
TotalArea
(km2) Island Basin Near-key BankWeighting
Factor
East-EEast-SEast-WInteriorSouthWestSW
132.53222.7158.17
404.57369.86510.99
0.07290.07210.09420.03750.05100.01370
0.91920.88380.88020.67340.85130.60670.7043
0.00300.00350.00330.00220.00311.000
0.00490.04060.02230.28700.09470.37900.0006
0.65520.66540.64490.75490.69460.79560.9720
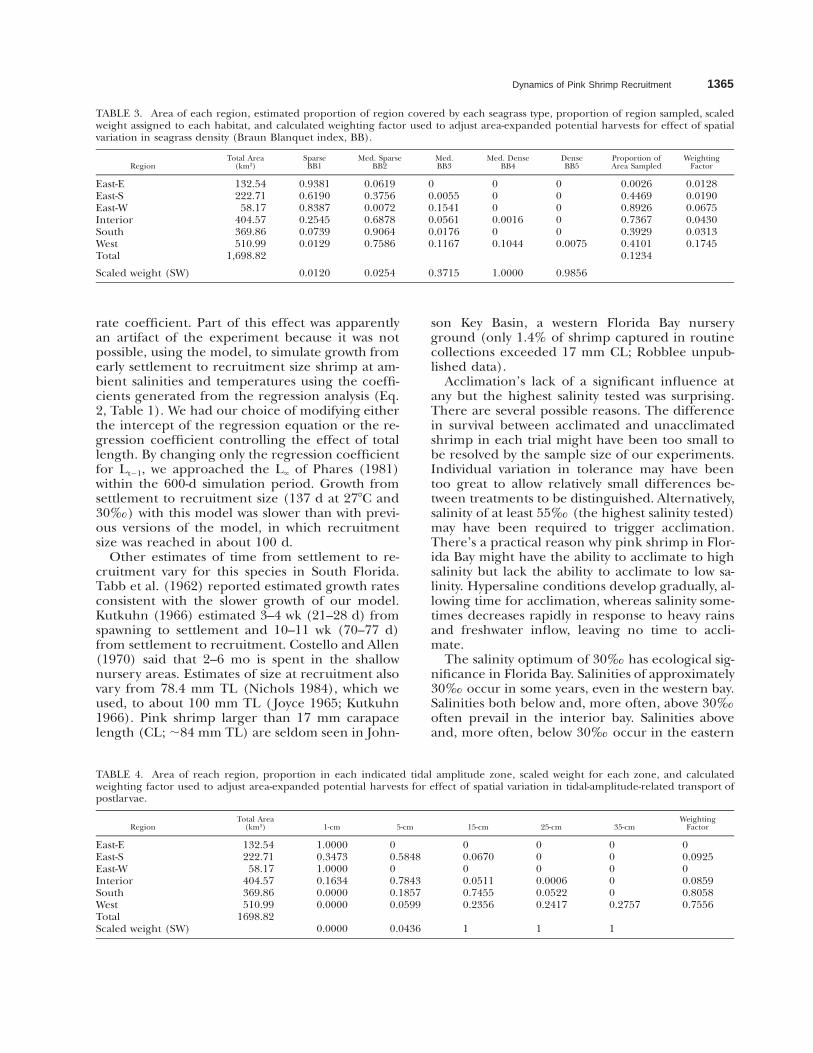
bay as a nursery ground. Regional areas, propor-tions in each habitat type, and weighting factorsused in expanding and adjusting model results areshown in Tables 2, 3, and 4.
POSTLARVAL IMMIGRATION
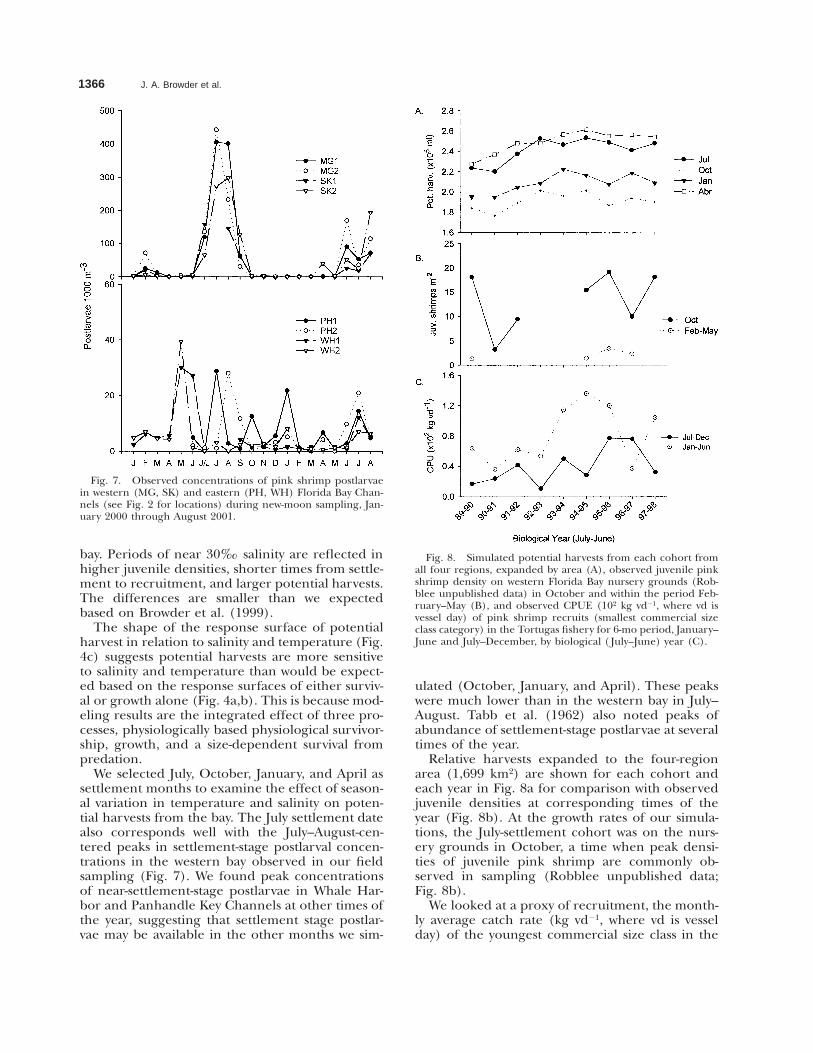
Results of the first 20 mo of channel net sam-pling of immigrating postlarvae are shown in Fig.7. Postlarval concentrations in the four channels(Fig. 2) differed in magnitude and seasonal pat-tern. Sandy Key and Middle Ground channels hadone annual peak, centered in about July–August in
both years, whereas Whale Harbor and PanhandleKey channels had several peaks in each year with-out any consistent pattern between years. The peakconcentrations at Whale Harbor and PanhandleKey did not seem to be correlated. Our postlarvalsampling results suggest a source of near-settle-ment-stage postlarvae to Florida Bay from the westin mid to late summer, roughly corresponding tothe July recruitment we have simulated, and fromthe east and southeast at other times of the yearsimulated (i.e., October, January, and April). Post-larval concentrations in Whale Harbor and Pan-handle channels are, however, an order of magni-tude smaller than through the Middle Ground andSandy Key channels.
DiscussionThe relationships of growth and survival to tem-
perature and salinity determined from the exper-iments are central to the model. Our analysis ofexperimental data suggested that juvenile pinkshrimp survival is high over a wide salinity rangeexcept at extreme temperatures and they are leasttolerant of high salinity at low temperatures andlow salinity at high temperatures (Fig. 4). Mc-Kenzie (1970) reported the same relationship totemperature and salinity extremes in blue crabs.Williams (1960) noted that pink shrimp have os-moregulatory capabilities at low temperatures su-perior to brown shrimp. Survival at the same salin-ity and temperature was higher in these experi-ments than in our original two experiments (Brow-der et al. 1999). The relationship of growth tosalinity in the experimental data was stronger thanthe relationship of survival to salinity (i.e., the r2
was 0.71 versus 0.49). A salinity optimum (30‰)was detected within the range of salinities coveredby the experiments. The temperature optimum forgrowth suggested by the analysis was greater thanthe upper temperature tested, 338C.
Total length (the natural log) was a strong ex-plaining variable in our equation for the growth
Dynamics of Pink Shrimp Recruitment 1365
TABLE 3. Area of each region, estimated proportion of region covered by each seagrass type, proportion of region sampled, scaledweight assigned to each habitat, and calculated weighting factor used to adjust area-expanded potential harvests for effect of spatialvariation in seagrass density (Braun Blanquet index, BB).
RegionTotal Area
(km2)SparseBB1
Med. SparseBB2
Med.BB3
Med. DenseBB4
DenseBB5
Proportion ofArea Sampled
WeightingFactor
East-EEast-SEast-WInteriorSouthWestTotal
132.54222.7158.17
404.57369.86510.99
1,698.82
0.93810.61900.83870.25450.07390.0129
0.06190.37560.00720.68780.90640.7586
00.00550.15410.05610.01760.1167
0000.001600.1044
000000.0075
0.00260.44690.89260.73670.39290.41010.1234
0.01280.01900.06750.04300.03130.1745
Scaled weight (SW) 0.0120 0.0254 0.3715 1.0000 0.9856
TABLE 4. Area of reach region, proportion in each indicated tidal amplitude zone, scaled weight for each zone, and calculatedweighting factor used to adjust area-expanded potential harvests for effect of spatial variation in tidal-amplitude-related transport ofpostlarvae.
RegionTotal Area
(km2) 1-cm 5-cm 15-cm 25-cm 35-cmWeighting
Factor
East-EEast-SEast-WInteriorSouthWest
132.54222.7158.17
404.57369.86510.99
1.00000.34731.00000.16340.00000.0000
00.584800.78430.18570.0599
00.067000.05110.74550.2356
0000.00060.05220.2417
000000.2757
00.092500.08590.80580.7556
TotalScaled weight (SW)
1698.820.0000 0.0436 1 1 1
rate coefficient. Part of this effect was apparentlyan artifact of the experiment because it was notpossible, using the model, to simulate growth fromearly settlement to recruitment size shrimp at am-bient salinities and temperatures using the coeffi-cients generated from the regression analysis (Eq.2, Table 1). We had our choice of modifying eitherthe intercept of the regression equation or the re-gression coefficient controlling the effect of totallength. By changing only the regression coefficientfor Lt21, we approached the L` of Phares (1981)within the 600-d simulation period. Growth fromsettlement to recruitment size (137 d at 278C and30‰) with this model was slower than with previ-ous versions of the model, in which recruitmentsize was reached in about 100 d.
Other estimates of time from settlement to re-cruitment vary for this species in South Florida.Tabb et al. (1962) reported estimated growth ratesconsistent with the slower growth of our model.Kutkuhn (1966) estimated 3–4 wk (21–28 d) fromspawning to settlement and 10–11 wk (70–77 d)from settlement to recruitment. Costello and Allen(1970) said that 2–6 mo is spent in the shallownursery areas. Estimates of size at recruitment alsovary from 78.4 mm TL (Nichols 1984), which weused, to about 100 mm TL ( Joyce 1965; Kutkuhn1966). Pink shrimp larger than 17 mm carapacelength (CL; ;84 mm TL) are seldom seen in John-
son Key Basin, a western Florida Bay nurseryground (only 1.4% of shrimp captured in routinecollections exceeded 17 mm CL; Robblee unpub-lished data).
Acclimation’s lack of a significant influence atany but the highest salinity tested was surprising.There are several possible reasons. The differencein survival between acclimated and unacclimatedshrimp in each trial might have been too small tobe resolved by the sample size of our experiments.Individual variation in tolerance may have beentoo great to allow relatively small differences be-tween treatments to be distinguished. Alternatively,salinity of at least 55‰ (the highest salinity tested)may have been required to trigger acclimation.There’s a practical reason why pink shrimp in Flor-ida Bay might have the ability to acclimate to highsalinity but lack the ability to acclimate to low sa-linity. Hypersaline conditions develop gradually, al-lowing time for acclimation, whereas salinity some-times decreases rapidly in response to heavy rainsand freshwater inflow, leaving no time to accli-mate.
The salinity optimum of 30‰ has ecological sig-nificance in Florida Bay. Salinities of approximately30‰ occur in some years, even in the western bay.Salinities both below and, more often, above 30‰often prevail in the interior bay. Salinities aboveand, more often, below 30‰ occur in the eastern
1366 J. A. Browder et al.
Fig. 7. Observed concentrations of pink shrimp postlarvaein western (MG, SK) and eastern (PH, WH) Florida Bay Chan-nels (see Fig. 2 for locations) during new-moon sampling, Jan-uary 2000 through August 2001.
Fig. 8. Simulated potential harvests from each cohort fromall four regions, expanded by area (A), observed juvenile pinkshrimp density on western Florida Bay nursery grounds (Rob-blee unpublished data) in October and within the period Feb-ruary–May (B), and observed CPUE (102 kg vd21, where vd isvessel day) of pink shrimp recruits (smallest commercial sizeclass category) in the Tortugas fishery for 6-mo period, January–June and July–December, by biological ( July–June) year (C).
bay. Periods of near 30‰ salinity are reflected inhigher juvenile densities, shorter times from settle-ment to recruitment, and larger potential harvests.The differences are smaller than we expectedbased on Browder et al. (1999).
The shape of the response surface of potentialharvest in relation to salinity and temperature (Fig.4c) suggests potential harvests are more sensitiveto salinity and temperature than would be expect-ed based on the response surfaces of either surviv-al or growth alone (Fig. 4a,b). This is because mod-eling results are the integrated effect of three pro-cesses, physiologically based physiological survivor-ship, growth, and a size-dependent survival frompredation.
We selected July, October, January, and April assettlement months to examine the effect of season-al variation in temperature and salinity on poten-tial harvests from the bay. The July settlement datealso corresponds well with the July–August-cen-tered peaks in settlement-stage postlarval concen-trations in the western bay observed in our fieldsampling (Fig. 7). We found peak concentrationsof near-settlement-stage postlarvae in Whale Har-bor and Panhandle Key Channels at other times ofthe year, suggesting that settlement stage postlar-vae may be available in the other months we sim-
ulated (October, January, and April). These peakswere much lower than in the western bay in July–August. Tabb et al. (1962) also noted peaks ofabundance of settlement-stage postlarvae at severaltimes of the year.
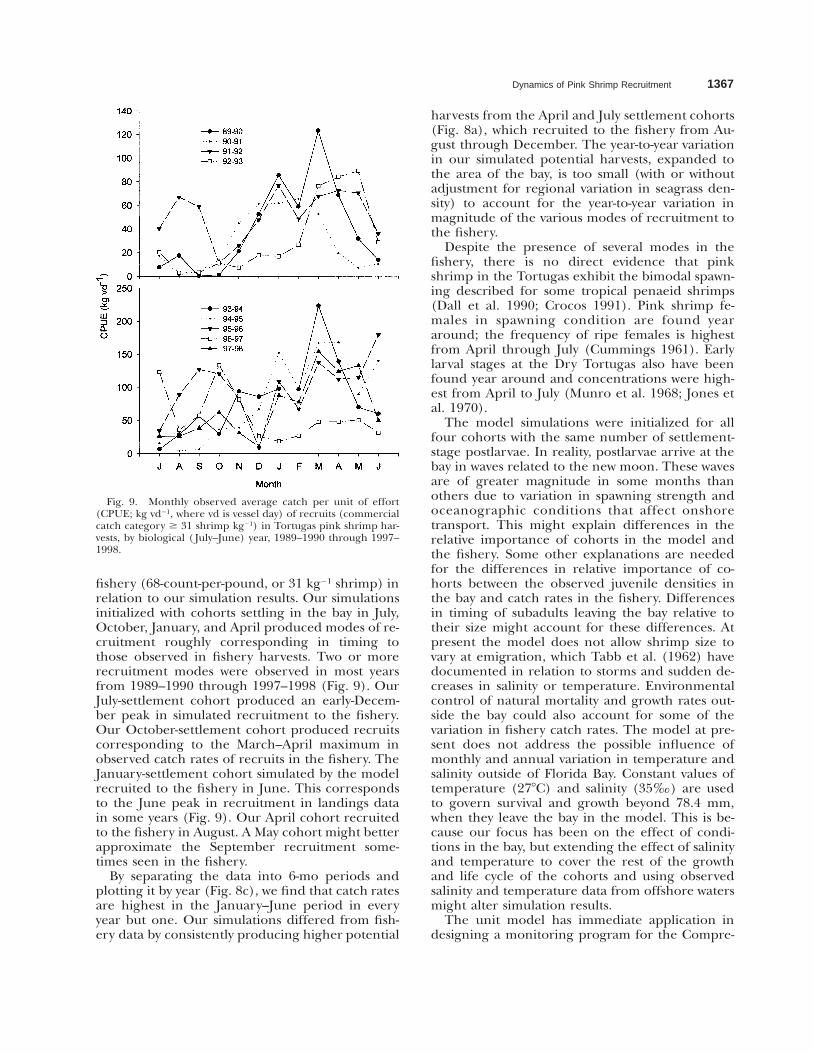
Relative harvests expanded to the four-regionarea (1,699 km2) are shown for each cohort andeach year in Fig. 8a for comparison with observedjuvenile densities at corresponding times of theyear (Fig. 8b). At the growth rates of our simula-tions, the July-settlement cohort was on the nurs-ery grounds in October, a time when peak densi-ties of juvenile pink shrimp are commonly ob-served in sampling (Robblee unpublished data;Fig. 8b).
We looked at a proxy of recruitment, the month-ly average catch rate (kg vd21, where vd is vesselday) of the youngest commercial size class in the
Dynamics of Pink Shrimp Recruitment 1367
Fig. 9. Monthly observed average catch per unit of effort(CPUE; kg vd21, where vd is vessel day) of recruits (commercialcatch category $ 31 shrimp kg21) in Tortugas pink shrimp har-vests, by biological ( July–June) year, 1989–1990 through 1997–1998.
fishery (68-count-per-pound, or 31 kg21 shrimp) inrelation to our simulation results. Our simulationsinitialized with cohorts settling in the bay in July,October, January, and April produced modes of re-cruitment roughly corresponding in timing tothose observed in fishery harvests. Two or morerecruitment modes were observed in most yearsfrom 1989–1990 through 1997–1998 (Fig. 9). OurJuly-settlement cohort produced an early-Decem-ber peak in simulated recruitment to the fishery.Our October-settlement cohort produced recruitscorresponding to the March–April maximum inobserved catch rates of recruits in the fishery. TheJanuary-settlement cohort simulated by the modelrecruited to the fishery in June. This correspondsto the June peak in recruitment in landings datain some years (Fig. 9). Our April cohort recruitedto the fishery in August. A May cohort might betterapproximate the September recruitment some-times seen in the fishery.
By separating the data into 6-mo periods andplotting it by year (Fig. 8c), we find that catch ratesare highest in the January–June period in everyyear but one. Our simulations differed from fish-ery data by consistently producing higher potential
harvests from the April and July settlement cohorts(Fig. 8a), which recruited to the fishery from Au-gust through December. The year-to-year variationin our simulated potential harvests, expanded tothe area of the bay, is too small (with or withoutadjustment for regional variation in seagrass den-sity) to account for the year-to-year variation inmagnitude of the various modes of recruitment tothe fishery.
Despite the presence of several modes in thefishery, there is no direct evidence that pinkshrimp in the Tortugas exhibit the bimodal spawn-ing described for some tropical penaeid shrimps(Dall et al. 1990; Crocos 1991). Pink shrimp fe-males in spawning condition are found yeararound; the frequency of ripe females is highestfrom April through July (Cummings 1961). Earlylarval stages at the Dry Tortugas also have beenfound year around and concentrations were high-est from April to July (Munro et al. 1968; Jones etal. 1970).
The model simulations were initialized for allfour cohorts with the same number of settlement-stage postlarvae. In reality, postlarvae arrive at thebay in waves related to the new moon. These wavesare of greater magnitude in some months thanothers due to variation in spawning strength andoceanographic conditions that affect onshoretransport. This might explain differences in therelative importance of cohorts in the model andthe fishery. Some other explanations are neededfor the differences in relative importance of co-horts between the observed juvenile densities inthe bay and catch rates in the fishery. Differencesin timing of subadults leaving the bay relative totheir size might account for these differences. Atpresent the model does not allow shrimp size tovary at emigration, which Tabb et al. (1962) havedocumented in relation to storms and sudden de-creases in salinity or temperature. Environmentalcontrol of natural mortality and growth rates out-side the bay could also account for some of thevariation in fishery catch rates. The model at pre-sent does not address the possible influence ofmonthly and annual variation in temperature andsalinity outside of Florida Bay. Constant values oftemperature (278C) and salinity (35‰) are usedto govern survival and growth beyond 78.4 mm,when they leave the bay in the model. This is be-cause our focus has been on the effect of condi-tions in the bay, but extending the effect of salinityand temperature to cover the rest of the growthand life cycle of the cohorts and using observedsalinity and temperature data from offshore watersmight alter simulation results.
The unit model has immediate application indesigning a monitoring program for the Compre-
1368 J. A. Browder et al.
hensive Everglades Restoration Project (U.S. ArmyCorps of Engineers 1999), which will restructureSouth Florida’s water management system and maychange the volume, timing, and distribution offreshwater flows to Florida Bay. A dynamic moni-toring strategy could be guided by model predic-tions of where and when peak densities of juvenilepink shrimp at various stages of growth and devel-opment will appear and the relative magnitudeand timing of potential recruitment. The modelmay also be used in a hindcasting mode to helpinterpret monitoring results in terms of impacts.Predictions and hindcasts would be based on cur-rent information on rainfall, freshwater inflow, andother environmental factors.
We expanded results of our unit model to thefull area of the bay to better evaluate their impli-cations. Using information from field studies to ad-just our modeling results for other factors knownto affect pink shrimp densities in the bay contrib-uted further perspective. Our conclusion followingadjustments is that salinity variation in the easternbay may be irrelevant to shrimp production be-cause of the relatively low bank area, seagrass den-sity, and tidal-amplitude-related access to postlar-vae. The salinity extremes (especially high salinity)prone to occur in interior Florida Bay diminish itsvalue as a pink shrimp nursery ground. A reduc-tion in the frequency, duration, and spatial extentof hypersaline conditions would improve the pro-duction potential of the interior bay. Even with op-timal salinities, the interior bay probably would notbe as valuable a pink shrimp nursery ground aswestern Florida because of lower seagrass densitiesand lower tidal-amplitude-related postlarval immi-gration opportunity. The production potential ofwestern Florida Bay is relatively stable from year toyear, but an increase in the frequency and durationof salinities of about 30‰ would be expected toincrease the potential harvests from this area if itdid not detrimentally affect seagrass habitat.
Both growth and survival of juvenile pink shrimpare favored by an absence of salinity extremes. Be-cause of spatial and temporal variability in condi-tions and habitat and given its broad salinity tol-erance range, this species should be able to surviveand grow somewhere in Florida Bay or nearby es-tuaries whenever postlarvae arrive from offshorespawning grounds. One key to maintaining a highproduction of this species is maintaining freshwa-ter inflow that will provide a favorable salinityrange over the greatest amount of suitable and ac-cessible habitat at these critical times. Conditionsalso must be maintained to promote moderatelyhigh to high seagrass density and cover in areasaccessible to pink shrimp postlarvae. Model resultssuggested that the higher freshwater flows associ-
ated with higher rainfall that occurred from late1994 through 1996 extended favorable salinitiesfor pink shrimp over the greatest area of FloridaBay. Lower flows associated with the lower rainfallof 1989 through 1991 reduced the area of favor-able salinities. Fundamental changes in water man-agement would increase the productive capacity ofthe bay to the extent it could decrease the fre-quency, intensity, duration, and spatial coverage ofhypersaline events in the bay. Extremely low salin-ities have an even more detrimental effect on pinkshrimp than do high salinities; however, over thenine years examined, salinities low enough to bedetrimental occurred in the bay only where unfa-vorable habitat and low accessibility would also re-strict pink shrimp production. Production fromthe estuaries of southwestern Everglades NationalPark might be detrimentally affected by high flows.Timing of flows in relation to postlarval immigra-tions is important.
Our integration of laboratory experiments witha simulation model and comparison with field andfishery observations raises questions that will guidenew investigations. Relative abundance and thetiming of abundance peaks at various life stageswarrant further work. More detailed field obser-vations of the reproductive output of the Dry Tor-tugas pink shrimp population are necessary to de-termine seasonal and annual patterns of the avail-ability of postlarvae. Longer time series are neededto better characterize the timing and magnitude ofimmigration into the bay and determine influenc-ing factors. The timing and pattern of juvenile em-igration from Florida Bay is an unknown and pri-ority need. Addressing timing issues by integratingfield and fishery observations is an appropriate fu-ture role for the simulation model. Results of ouradjustments suggest that a landscape-based modelis needed to more fully examine the dynamic over-lap of salinity, bottom habitat, and accessibility topostlarvae. More bay-wide data on the distributionof juvenile density should be acquired to jointlyestimate effects of spatial variation in physical hab-itat, seagrass density, and tidal-amplitude-relatedaccess to postlarvae.
ACKNOWLEDGMENTS
Those who generously shared spatial and temporal data onFlorida Bay include DeWitt Smith, Troy Mullens, and Kevin Ko-tun at Everglades National Park, Homestead, Florida; MichaelJ. Durako, Center for Marine Science, University of North Car-olina at Wilmington, Wilmington, North Carolina; James Four-qurean, Southeast Environmental Research Center, Florida In-ternational University; and Frank Sargent and Margaret Hall,Florida Marine Institute, Florida Fish and Wildlife ConservationCommission, St. Petersburg, Florida. Robert Schroeder, Miami,Florida, helped collect, maintain, and package small juvenileshrimp for shipment to Galveston, Texas. Financial and logisticsupport was provided by the Southeast Fisheries Science Center

Dynamics of Pink Shrimp Recruitment 1369
of Miami and Galveston, the Coastal Ocean Program of the Na-tional Oceanic and Atmospheric Administration, the CriticalEcosystems Studies Initiative of the Department of the Interior,the National Park Service, the U.S. Geological Survey, and theCooperative Institute for Marine and Atmospheric Studies, Ro-senstiel School of Marine and Atmospheric Science, Universityof Miami.
LITERATURE CITED
ALLEN, D. M., J. H. HUDSON, AND T. J. COSTELLO. 1980. Postlarvalshrimp (Penaeus) in the Florida Keys, species, size, and sea-sonality. Bulletin of Marine Science 30:21–33.
BIELSA, L. M., W. H. MURDICH, AND R. F. LABISKY. 1983. Speciesprofiles: Life histories and environmental requirements ofcoastal fishes and invertebrates (South Florida) pink shrimp.Biological Report FWS/OBS-82/11. U.S. Fish and WildlifeService, Washington, D.C.
BOYER, J. N., J. W. FOURQUREAN, AND R. D. JONES. 1997. Spatialcharacterization of water quality in Florida Bay and White-water Bay by multivariate analyses: Zones of similar influence.Estuaries 20:743–758.
BROWDER, J. A. 1985. Relationship between pink shrimp pro-duction on the Tortugas grounds and water flow patterns inthe Florida Everglades. Bulletin of Marine Science 37:839–856.
BROWDER, J. A. 1991. Watershed management and the impor-tance of freshwater flow to estuaries, p. 7–22. In S. F. Treatand P. A. Clark (eds.). BASIS II, Proceedings of the TampaBay Area Scientific Information Symposium 2, 27 February–1 March 1991. TEXT, Tampa, Florida.
BROWDER, J. A. AND D. MOORE. 1981. A new approach to deter-mining the quantitative relationship between fishery produc-tion and the flow of fresh water to estuaries, p. 403–430. InR. Cross and D. Williams (eds.). Proceedings of the NationalSymposium on Freshwater Inflow to Estuaries, Volume 1,FWS/OBS-81/04. U.S. Fish and Wildlife Service, Washington,D.C.
BROWDER, J. A., V. R. RESTREPO, J. K. RICE, M. B. ROBBLEE, AND
Z. ZEIN-ELDIN. 1999. Environmental influences on potentialrecruitment of pink shrimp, Farfantepenaeus duorarum, fromFlorida Bay nursery grounds. Estuaries 22:484–499.
COSTELLO, T. J. AND D. M. ALLEN. 1966. Migrations and geo-graphic distribution of pink shrimp, Penaeus duorarum, of theTortugas and Sanibel grounds, Florida. Fishery Bulletin U.S. 65:449–459.
COSTELLO, T. J. AND D. M. ALLEN. 1970. Synopsis of biologicaldata on pink shrimp, Penaeus duorarum duorarum Burkenroad,1939. FAO Fishery Report No. 57, p. 1499–1537, Volume 4.Food and Agricultural Organization, Rome, Italy.
COSTELLO, T. J., D. M. ALLEN, AND J. H. HUDSON. 1986. Distri-bution, seasonal abundance, and ecology of juvenile northernpink shrimp, Penaeus duorarum, in the Florida Bay area. NOAATechnical Memorandum NMFS-SEFC-161. National MarineFisheries Service, Southeast Fisheries Science Center, Miami,Florida.
CRIALES, M. M., M. J. BELLO, AND C. YEUNG. 2000. Diversity andrecruitment of penaeoid shrimps at Bear Cut, Biscayne Bay,Florida, USA. Bulletin of Marine Science 67:773–788.
CRIALES, M. M. AND T. N. LEE. 1995. Larval distribution andtransport of penaeid shrimps during the presence of the Tor-tugas Gyre in May–June 1991. Fishery Bulletin U.S. 93:471–482.
CRIALES, M. M. AND M. F. MCGOWAN. 1994. Horizontal and ver-tical distribution of penaeidean and caridean larvae and mi-cronektonic shrimps in the Florida Keys. Bulletin of MarineScience 54:843–856.
CROCOS, P. 1991. Reproductive dynamics of three species of Pen-aeidae in tropical Australia, and the role of reproductive stud-ies in fisheries management, p. 317–331. In A. Wenner andA. Kuris (eds.). Crustacean Egg Production, Crustacean Issues7. Balkema, Rotterdam, Netherlands.
CUMMINGS, W. C. 1961. Maturation and spawning of the pinkshrimp, Penaeus duorarum Burkenroad. Transactions of the Amer-ican Fishery Society 90:462–468.
DALL, W., B. J. HILL, P. C. ROTHLISBERG, AND D. J. SHARPLES.1990. The Biology of the Penaeidae. Advances in Marine Bi-ology, Volume 27. Academic Press, London, U.K.
DURAKO, M. J., M. O. HALL, AND M. MERELLO. 2001. Patterns ofchange in the seagrass-dominated Florida Bay hydroscape, p.523–538. In J. W. Porter and K. G. Porter (eds.). The Ever-glades, Florida Bay, and Coral Reefs of the Florida Keys. CRCPress, Boca Raton, Florida.
EHRHARDT, N. M. AND C. M. LEGAULT. 1999. Pink shrimp, Far-fantepenaeus duorarum, recruitment variability as an indicatorof Florida Bay dynamics. Estuaries 22:471–483.
ENOS, P. AND R. D. PERKINS. 1979. Evolution of Florida Bay fromisland stratigraphy. Geological Society of America Bulletin 90:59–83.
FENNEMA, R. J., C. J. NEIDRAUER, R. A. JOHNSON, T. K. MACVICAR,AND W. A. PERKINS. 1994. A computer model to simulate nat-ural Everglades hydrology, p. 249–289. In S. M. Davis and J.C. Ogden (eds.). Everglades: The Ecosystem and Its Resto-ration. St. Lucie Press, Delray Beach, Florida.
FOURQUREAN, J. W., R. D. JONES, AND J. C. ZIEMAN. 1993. Pro-cesses influencing water column nutrient characteristics andphosphorus limitation of phytoplankton biomass in FloridaBay, FL, USA: Inferences from spatial distributions. Estuarine,Coastal and Shelf Science 36:295–314.
FOURQUREAN, J. W. AND M. B. ROBBLEE. 1999. Florida Bay: Ahistory of recent ecological changes. Estuaries 22:345–357.
HALL, M. O., M. J. DURAKO, J. W. FOURQUREAN, AND J. C. ZIEMAN.1999. Decadal changes in seagrass distribution and abun-dance in Florida Bay. Estuaries 22:445–459.
HARTNOLL, R. G. 1982. Growth, p. 111–196. In D. Bliss (ed.).The Biology of Crustacea. Embryology, Morphology, and Ge-netics, Volume 2. Academic Press, London, U.K.
HETTLER, JR., W. F. 1989. Food habits of juveniles of spottedseatrout and gray snapper in western Florida Bay. Bulletin ofMarine Science 44:155–162.
HITTLE, C. D., E. PATINO, AND M. ZUCKER. 2001. Freshwater flowfrom estuarine creeks into northeastern Florida Bay. WaterResources Investigation Report No. 01-4164. U.S. GeologicalSurvey, Miami, Florida.
HOLMQUIST, J. G., G. V. N. POWELL, AND S. M. SOGARD. 1989.Sediment, water level and water temperature characteristicsof Florida Bay’s grass-covered mud banks. Bulletin of MarineScience 44:348–364.
HUGHES, D. A. 1967. On the mechanisms underlying tide asso-ciated movements of Penaeus duorarum. Contribution to theFood and Agricultural Organization World Scientific Confer-ence on the Biology and Culture of Shrimps and Prawns,Mexico City, Food and Agricultural Organization, Rome. FAOFishery Report 67:971–981.
HUGHES, D. A. 1969. Responses to salinity changes as a tidaltransport mechanism of pink shrimp, Penaeus duorarum. Bio-logical Bulletin 136:43–53.
JONES, A. C., D. E. DIMITRIOU, J. J. EWALD, AND J. H. TWEEDY.1970. Distribution of early developmental stages of pinkshrimp, Penaeus duorarum, in Florida waters. Bulletin of MarineScience 20:634–661.
JOYCE, JR., E. A. 1965. The commercial shrimps of the northeastcoast of Florida. Professional Paper Series No. 6. Florida StateBoard of Conservation Marine Laboratory, St. Petersburg,Florida.
KINNE, O. 1971. Invertebrates, p. 821–995. In H. Barnes (ed.).Marine Ecology, Volume 1, Part 2. Wiley-Interscience, NewYork.
KUTKUHN, J. H. 1966. Dynamics of a penaeid shrimp populationand management implications. Fishery Bulletin U.S. 65:313–338.
1370 J. A. Browder et al.
LEE, T., M. E. CLARKE, E. WILLIAMS, A. F. SZMANT, AND T. BERGER.1994. Evolution of the Tortugas Gyre and its influence onrecruitment in the Florida Keys. Bulletin of Marine Science 54:621–646.
LEE, T. N., E. JOHNS, D. WILSON, E. WILLIAMS, AND N. P. SMITH.2001. Transport processes linking south Florida coastal eco-systems, p. 309–342. In J. W. Porter and K. G. Porter (eds.).The Everglades, Florida Bay, and Coral Reefs of the FloridaKeys: An Ecosystem Sourcebook. CRC Press, Boca Raton, Flor-ida.
MATHESON, JR., R. E., D. K. CAMP, S. M. SOGARD, AND K. A.BJORGO. 1999. Changes in seagrass-associated fish and crus-tacean communities on Florida Bay mud banks: The effectsof recent ecosystem changes? Estuaries 22:534–551.
MATHSOFT. 1999. S-PLUS 2000 Modern Statistics and AdvancedGraphics Guide to Statistics, Volume 1. Insightful, Seattle,Washington.
MCKENZIE, M. D. 1970. Fluctuations in abundance of the bluecrab and factors affecting mortalities. South Carolina MarineResearch Division Technical Report 1. South Carolina De-partment of Natural Resources, Charleston, South Carolina.
MUNRO, J. L., A. C. JONES, AND D. DIMITRIOU. 1968. Abundanceand distribution of the larvae of the pink shrimp (Penaeusduorarum) on the Tortugas Shelf of Florida, August 1962–Oc-tober 1964. Fishery Bulletin U.S. 67:165–181.
NANCE, J. M. 1994. A biological review of the Tortugas pinkshrimp fishery through December 1993. Galveston Labora-tory, Southeast Fisheries Science Center, National MarineFisheries Service, Galveston, Texas.
NICHOLS, S. 1984. Updated assessment of brown, white, andpink shrimp in the United States Gulf of Mexico. Miami Lab-oratory, Southeast Fisheries Science Center, National MarineFisheries service, Miami, Florida.
NUTTLE, W. K., J. W. FOURQUREAN, B. J. COSBY, J. C. ZIEMAN, AND
M. B. ROBBLEE. 2000. Influence of net freshwater supply onsalinity in Florida Bay. Water Resources Research 36:1805–1822.
OBEYSEKERA, J., J. A. BROWDER, L. HORNUNG, AND M. A. HAR-WELL. 1999. The natural South Florida system I: Climate, ge-ology, and hydrology. Urban Ecosystems 3:223–244.
PALMER, R. S. 1962. Handbook of North American Birds I. YaleUniversity Press, New Haven, Connecticut.
PHARES, P. L. 1981. Aspects of the pink shrimp fishery in theeastern Gulf of Mexico for the years 1960–1979. Miami Lab-oratory, Southeast Fisheries Science Center, National MarineFisheries Service, Miami, Florida.
ROBBLEE, M. B., T. R. BARBER, P. R. CARLSON, JR., M. J. DURAKO,J. W. FOURQUREAN, L. K. MUEHLSTEIN, D. PORTER, L. A. YAR-BRO, R. T. ZIEMAN, AND J. C. ZIEMAN. 1991a. Mass mortality ofthe tropical seagrass Thalassia testudinum in Florida Bay(USA). Marine Ecology Progress Series 71:297–299.
ROBBLEE, M. B., G. CLEMENT, D. SMITH, AND R. HALLEY. 2001.Salinity pattern in Florida Bay: A synthesis (1900–2000), p.34–36. In Proceedings 2001 Florida Bay Science Conference,Key Largo, Florida, April 23–26, 2001. University of Florida,Gainesville, Florida.
ROBBLEE, M. B. AND W. J. DIDOMENICO. 1991. Seagrass die-offthreatens ecology of Florida Bay. Park Science 11:21–22.
ROBBLEE, M., S. D. JEWELL, AND T. W. SCHMIDT. 1991b. Temporaland spatial variation in the pink shrimp, Penaeus duorarum, inFlorida Bay and adjacent waters of Everglades National Park.Annual Report. South Florida Research Center, EvergladesNational Park, Homestead, Florida.
RUTHERFORD, E. S., E. B. THUE, AND D. G. BUKER. 1982. Popu-lation characteristics, food habitats and spawning activity ofthe spotted seatrout, Cynoscion nebulosus, in Everglades Na-tional Park, Florida. U.S. National Park Service. South FloridaResearch Center Report T-688. Everglades National Park,Homestead, Florida.
RUTHERFORD, E. S., E. B. THUE, AND D. G. BUKER. 1983. Popu-
lation characteristics, food habitats and spawning activity ofthe gray snapper, Lutjanus griseus, in Everglades NationalPark, Florida. U.S. National Park Service. South Florida Re-search Center Report SFRC-83/02. Everglades National Park,Homestead, Florida.
SCHMIDT, T. W. 1986. Food of young juvenile lemon sharks, Ne-gaprion brevirostris, near Sandy Key, western Florida Bay. FloridaScientist 49:7–10.
SCHMIDT, T. W. 1989. Food habits, length-weight relationship,and condition factor of young great barracuda, Sphyraena bar-racuda, (Walbaum) from Florida Bay, Everglades NationalPark, Florida. Bulletin of Marine Science 44:163–170.
SHERIDAN, P. F. 992. Comparative habitat utilization by estuarinemacrofauna within the mangrove ecosystem of Rookery Bay,Florida. Bulletin of Marine Science 50:21–39.
SHERIDAN, P. F. 1996. Forecasting the fishery for pink shrimp,Penaeus duorarum, on the Tortugas grounds, Florida. FisheryBulletin U.S. 94:743–755.
SMITH, N. P. 1997. An introduction to the tides of Florida Bay.Florida Scientist 60:53–67.
SMITH, N. P. 1998. Tidal and long-term exchanges throughchannels in the middle and upper Florida Keys. Bulletin ofMarine Science 62:199–211.
SMITH, N. P. 2000a. Evaporation and the precipitation-evapora-tion balance in Florida Bay. Florida Scientist 63:72–83.
SMITH, N. P. 2000b. Transport across the western boundary ofFlorida Bay. Bulletin of Marine Science 66:291–304.
SOKAL, R. R. AND F. J. ROHLF. 1995. Biometry, 3rd edition. W.H. Freeman, New York.
TABB, D. C., D. L. DUBROW, AND A. E. JONES. 1962. Studies onthe biology of the pink shrimp, Penaeus duorarum Burkenroad,in Everglades National Park, Florida. Florida Board of Con-servation Technical Series No. 37. Florida State Board of Con-servation, Tallahassee, Florida.
TEINSONGRUSMEE, B. 1965. The effect of temperature ongrowth of post-larval pink shrimp, Penaeus duorarum Bur-kenroad. Masters Thesis, University of Miami, Coral Ga-bles, Florida.
THAYER, G. W., A. B. POWELL, AND D. E. HOSS. 1999. Composi-tion of larval, juvenile, and small adult fishes relative tochanges in environmental conditions in Florida Bay. Estuaries22:518–533.
TURNEY, W. J. AND B. F. PERKINS. 1972. Molluscan Distributionin Florida Bay. Sediments III. University of Miami, Miami,Florida.
U.S. ARMY CORPS OF ENGINEERS. 1999. Central and southernFlorida project comprehensive review study. Final report. U.S.Army Corps of Engineers, Jacksonville District, Jacksonville,Florida.
UPTON, H. F., P. HOAR, AND M. UPTON. 1992. The Gulf of MexicoShrimp Fishery: Profile of a Valuable National Resource. Cen-ter for Marine Conservation, Washington, D.C.
WANG, J. D. 1998. Subtidal flow patterns in western Florida Bay.Estuarine, Coastal and Shelf Science 46:901–15.
WANG, J. D., J. VAN DE KREEKE, N. KRISHNAN, AND D. SMITH. 1994.Wind and tide response in Florida Bay. Bulletin of Marine Sci-ence 54:579–601.
WANLESS, H. R. AND M. G. TAGETT. 1989. Origin, growth andevolution of carbonate mudbanks in Florida Bay. Bulletin ofMarine Science 44:454–489.
WEISBERG, R. H., B. D. BLACK, AND J. YANG. 1996. Seasonal mod-ulation of the West Florida continental shelf circulation. Jour-nal of Geophysical Research 23:2247–2250.
WILLIAMS, A. B. 1955. A contribution to the life histories of com-mercial shrimps (Penaeidae) in North Carolina. Bulletin ofMarine Science Gulf and Caribbean 5:116–146.
WILLIAMS, A. B. 1960. The influence of temperature on osmoticregulation in two species of estuarine shrimps (Penaeus). Bio-logical Bulletin 118:560–571.
Dynamics of Pink Shrimp Recruitment 1371
WILLIAMS, A. B. 1984. Shrimps, Lobsters, and Crabs of theAtlantic Coast. Smithsonian Institution Press, Washington,D.C.
ZEIN-ELDIN, Z. P. AND M. L. RENAUD. 1986. Inshore environmen-tal effects on brown shrimp, Penaeus aztecus, and white shrimp,P. setiferus populations in coastal waters, particularly of Texas.Marine Fishery Reviews 48:9–19.
ZIEMAN, J. C., J. W. FOURQUREAN, AND R. L. IVERSON. 1989.Distribution, abundance and productivity of seagrasses andmacroalgae in Florida Bay. Bulletin of Marine Science 44:292–311.
ZIEMAN, J. C., J. W. FOURQUREAN, M. B. ROBBLEE, M. DURAKO, P.CARLSON, L. YARBRO, AND G. POWELL. 1988. A catastrophic die-off of seagrasses in Florida Bay and Everglades National Park:Extent, effect and potential causes. EOS 69:1111.
SOURCES OF UNPUBLISHED MATERIALS
DURAKO, M. unpublished data. Center for Marine Science, Uni-versity of North Carolina at Wilmington, Wilmington, NorthCarolina.
HALL, M. O. unpublished data. Florida Marine Research Insti-tute, Florida Fish and Wildlife Conservation Commission, St.Petersburg, Florida.
SMITH, D. unpublished data. National Park Service, EvergladesNational Park, 40001 State Road 9336, Homestead, Florida33030.
Received for consideration, January 30, 2002Accepted for publication, July 30, 2002
Related Documents