Salinity map showing areas of high salinity (36 o/oo) in green, medium salinity in blue (35 o/oo), and low salinity (34 o/oo) in purple. Salinity is rather stable but areas in the North Atlantic, South Atlantic, South Pacific, Indian Ocean, Arabian Sea, Red Sea, and Mediterranean Sea tend to be a little high (green). Areas near Antarctica, the Arctic Ocean, Southeast Asia, and the West Coast

Salinity map showing areas of high salinity (36 o/oo) in green, medium salinity in blue (35 o/oo), and low salinity (34 o/oo) in purple. Salinity is rather.
Dec 16, 2015
Welcome message from author
This document is posted to help you gain knowledge. Please leave a comment to let me know what you think about it! Share it to your friends and learn new things together.
Transcript

Salinity map showing areas of high salinity (36 o/oo) in green,medium salinity in blue (35 o/oo), and low salinity (34 o/oo) inpurple. Salinity is rather stable but areas in the North Atlantic,South Atlantic, South Pacific, Indian Ocean, Arabian Sea, Red Sea,and Mediterranean Sea tend to be a little high (green). Areas nearAntarctica, the Arctic Ocean, Southeast Asia, and the West Coastof North and Central America tend to be a little low (purple).

The Nitrogen CycleThe Nitrogen Cycle
Freshwater and Saltwater Freshwater and Saltwater AquariumsAquariums
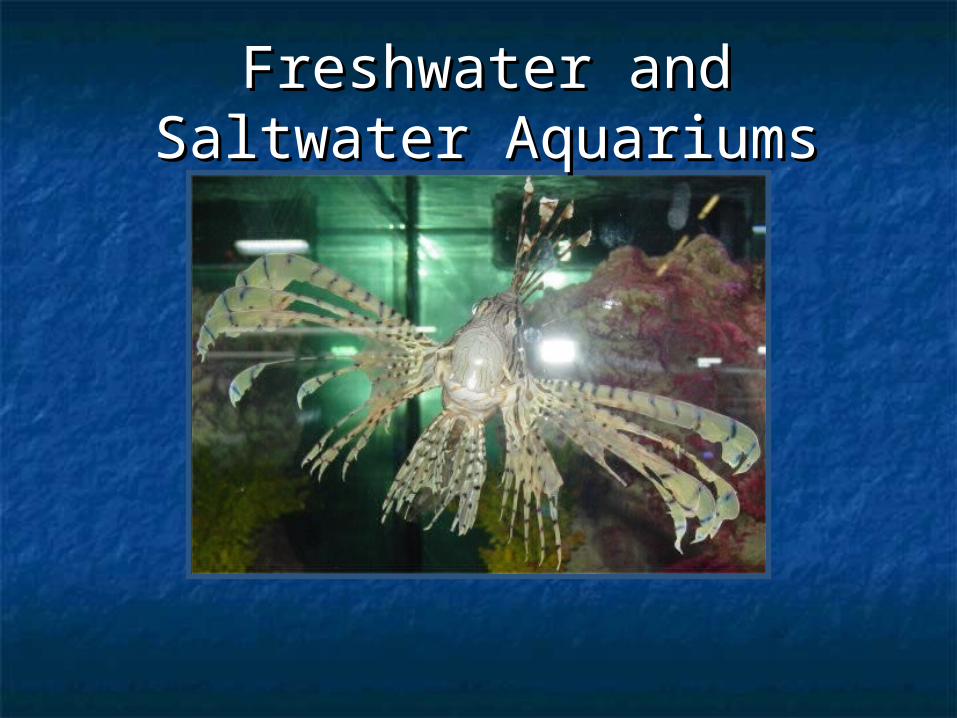
Aquarium TypesAquarium Types
C o ld w a te r
A g g ress ive C o m m u n ity
T ro p ica l
F re sh w a te r
R e e f T a nk F ish O n ly
S a ltw a te r B ra ck ish
A q u ariu m s
The specific aquarium setup will depend upon the requirements of the species you choose.
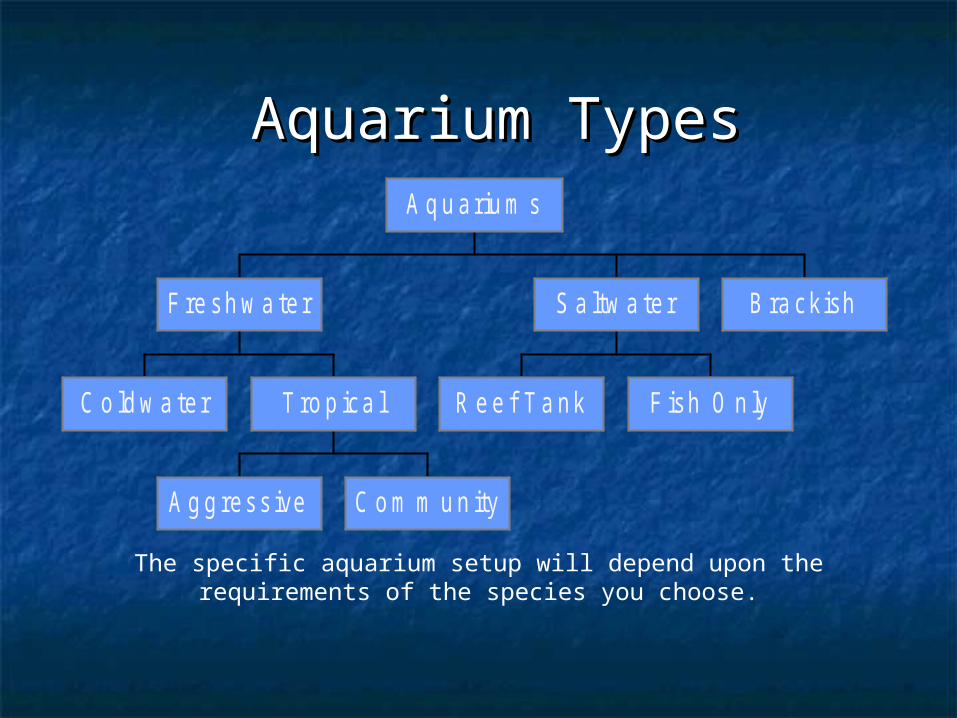
Basic NeedsBasic Needs
Appropriate Appropriate enclosure/housingenclosure/housing
NutritionNutrition HygieneHygiene Enrichment Enrichment

Reef Aquarium Reef Aquarium
PlantsPlants
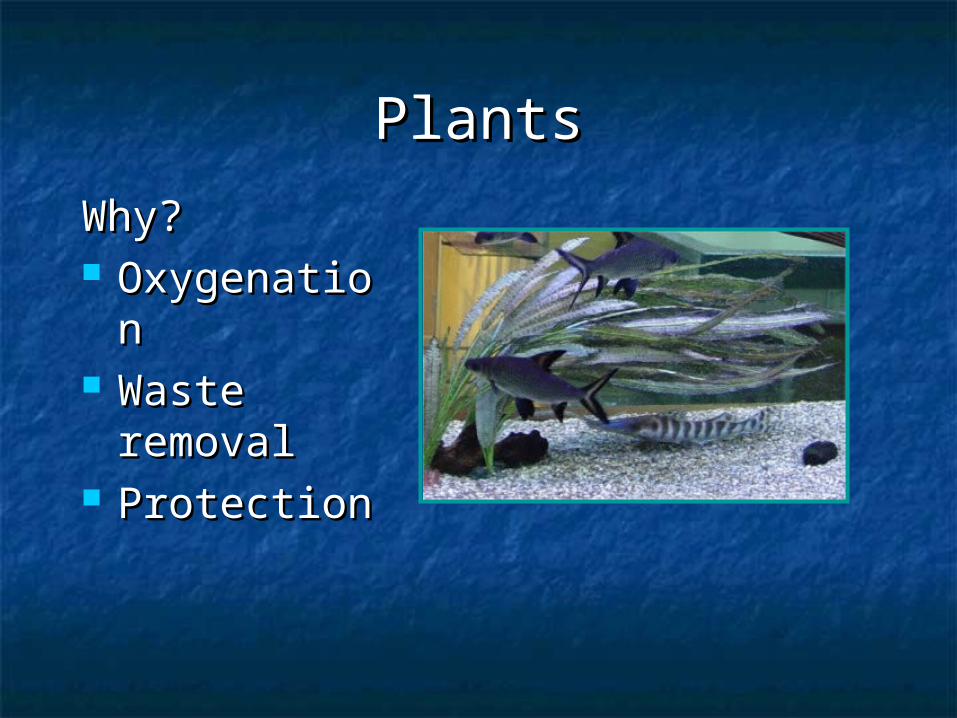
Why?Why? OxygenatioOxygenatio
nn Waste Waste
removalremoval ProtectionProtection

The Nitrogen CycleThe Nitrogen Cycle

Call it cycling, nitrification, biological cycle, startup Call it cycling, nitrification, biological cycle, startup cycle, break-in cycle, or the nitrogen cycle. No matter cycle, break-in cycle, or the nitrogen cycle. No matter what name you use, every newly set up aquarium goes what name you use, every newly set up aquarium goes through a process of establishing beneficial bacterial through a process of establishing beneficial bacterial colonies. colonies.
The Waste ProblemThe Waste ProblemUnlike nature, an aquarium is a closed environment. All Unlike nature, an aquarium is a closed environment. All the wastes excreted from the fish and uneaten food stay the wastes excreted from the fish and uneaten food stay inside the tank. If nothing eliminated those wastes, your inside the tank. If nothing eliminated those wastes, your beautiful tank would turn into a box of poison.beautiful tank would turn into a box of poison.
The Nitrogen CycleThe Nitrogen Cycle
Nitrogen Cycle Stages Nitrogen Cycle Stages SummarySummary
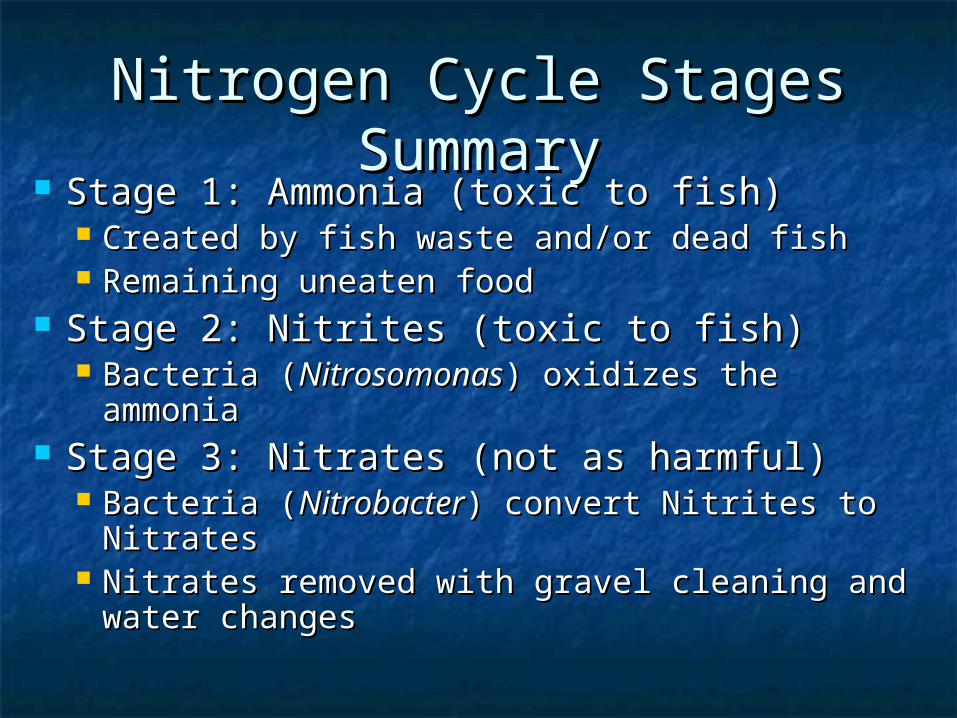
Stage 1: Ammonia (toxic to fish)Stage 1: Ammonia (toxic to fish) Created by fish waste and/or dead fishCreated by fish waste and/or dead fish Remaining uneaten foodRemaining uneaten food
Stage 2: Nitrites (toxic to fish)Stage 2: Nitrites (toxic to fish) Bacteria (Bacteria (NitrosomonasNitrosomonas) oxidizes the ammonia) oxidizes the ammonia
Stage 3: Nitrates (not as harmful)Stage 3: Nitrates (not as harmful) Bacteria (Bacteria (NitrobacterNitrobacter) convert Nitrites to ) convert Nitrites to
NitratesNitrates Nitrates removed with gravel cleaning and Nitrates removed with gravel cleaning and
water changeswater changes
The cycle begins when your fish start producing waste. The cycle begins when your fish start producing waste. Their waste is quickly broken down into either ionized or Their waste is quickly broken down into either ionized or unionized ammonia. unionized ammonia. The ionized form, Ammonium (NH4), is present if the The ionized form, Ammonium (NH4), is present if the pH is below 7, and is not toxic to fish. The unionized form, pH is below 7, and is not toxic to fish. The unionized form, Ammonia (NH3), is present if the pH is 7 or above, and is Ammonia (NH3), is present if the pH is 7 or above, and is highly toxic to fish. Any amount of unionized Ammonia highly toxic to fish. Any amount of unionized Ammonia (NH3) is dangerous. Your tank should be at 8.3 pH. (NH3) is dangerous. Your tank should be at 8.3 pH. Your tank needs the beneficial bacteria to break it Your tank needs the beneficial bacteria to break it down. Nitrosomonas and Nitrobacter bacteria can be down. Nitrosomonas and Nitrobacter bacteria can be added to the tank through an additive– or fish. added to the tank through an additive– or fish. When testing for Ammonia the result should always be When testing for Ammonia the result should always be 0, and the color yellow. 0, and the color yellow.
The Nitrogen Cycle – Stage The Nitrogen Cycle – Stage 11
During this stage Nitrosomonas bacteria will During this stage Nitrosomonas bacteria will oxidize the ammonia, thus eliminating it. oxidize the ammonia, thus eliminating it.
However, the by-product of ammonia oxidation However, the by-product of ammonia oxidation is nitrite, which is also highly toxic to fish. Nitrites is nitrite, which is also highly toxic to fish. Nitrites levels as low as low as 1mg/l can be lethal to levels as low as low as 1mg/l can be lethal to some fish. some fish.
When testing Nitrites they should always be 0, When testing Nitrites they should always be 0, and the test result should be light blue.and the test result should be light blue.
The Nitrogen Cycle – Stage The Nitrogen Cycle – Stage 22

In the last stage of the cycle, Nitrobacter bacteria In the last stage of the cycle, Nitrobacter bacteria convert the nitrites into nitrates. Nitrates are not convert the nitrites into nitrates. Nitrates are not highly toxic to fish in low to moderate levels. When highly toxic to fish in low to moderate levels. When testing your tank they should not be above and testing your tank they should not be above and should be orange with no red hues. should be orange with no red hues.
Routine water changes (10% to 20% a week) will Routine water changes (10% to 20% a week) will keep the nitrate levels within the safe range. keep the nitrate levels within the safe range. ..
The Nitrogen Cycle – Stage The Nitrogen Cycle – Stage 33
The Beneficial BacterialThe Beneficial Bacterial
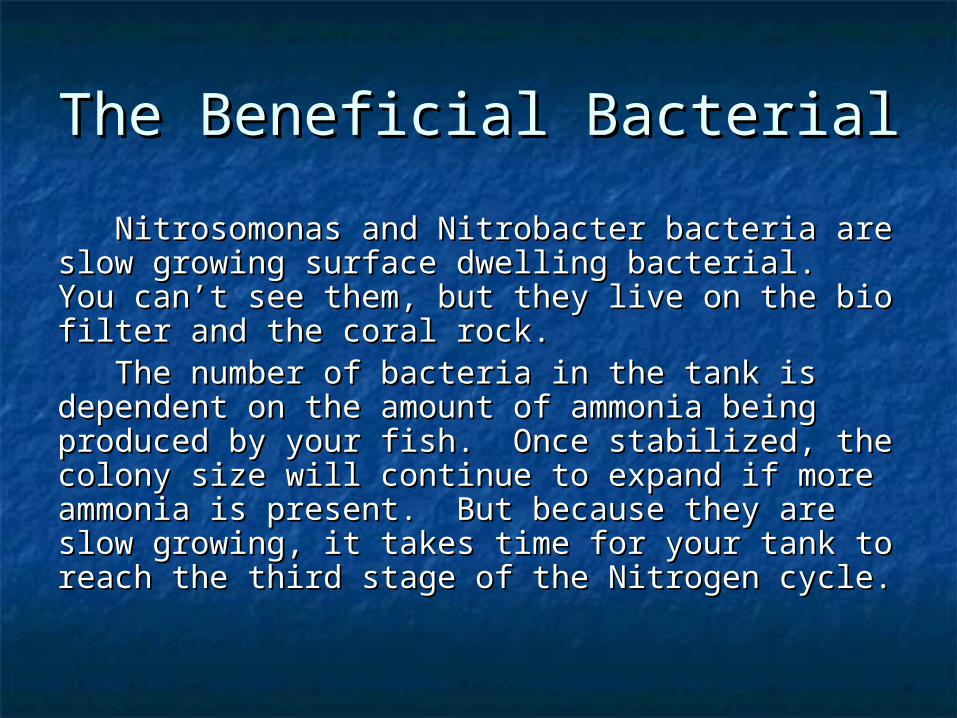
Nitrosomonas and Nitrobacter bacteria are Nitrosomonas and Nitrobacter bacteria are slow growing surface dwelling bacterial. You slow growing surface dwelling bacterial. You cancan’’t see them, but they live on the bio filter t see them, but they live on the bio filter and the coral rock. and the coral rock. The number of bacteria in the tank is The number of bacteria in the tank is dependent on the amount of ammonia being dependent on the amount of ammonia being produced by your fish. Once stabilized, the produced by your fish. Once stabilized, the colony size will continue to expand if more colony size will continue to expand if more ammonia is present. But because they are ammonia is present. But because they are slow growing, it takes time for your tank to slow growing, it takes time for your tank to reach the third stage of the Nitrogen cycle.reach the third stage of the Nitrogen cycle.

Water Quality: Nitrogen Water Quality: Nitrogen CycleCycle
www.cichlid-forum.com
Unexplained DeathUnexplained Death
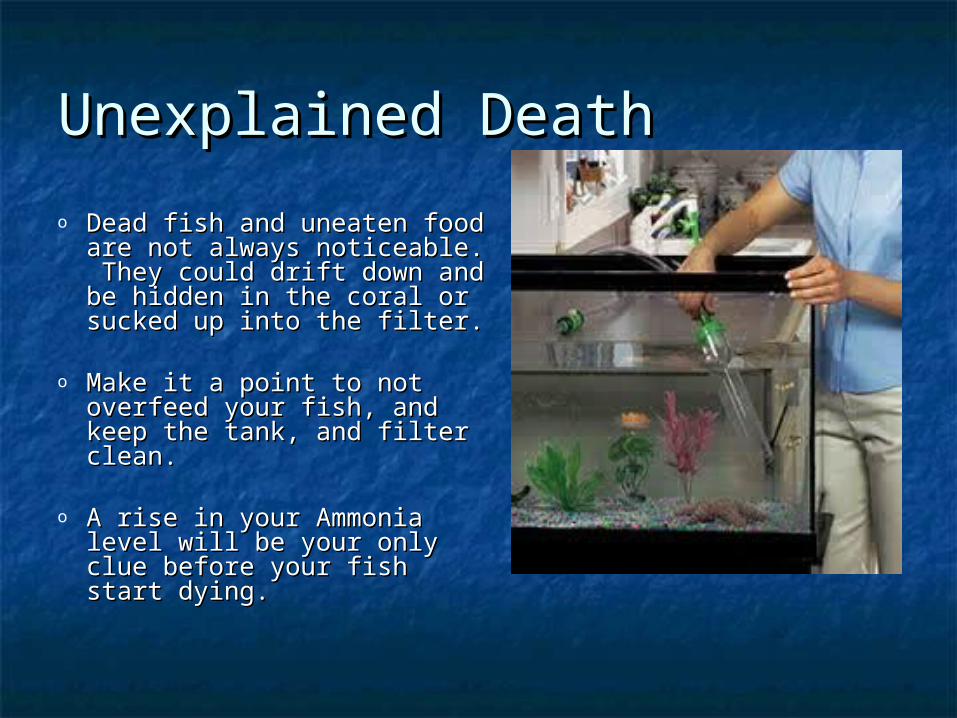
o Dead fish and uneaten food Dead fish and uneaten food are not always noticeable. are not always noticeable. They could drift down and They could drift down and be hidden in the coral or be hidden in the coral or sucked up into the filter.sucked up into the filter.
o Make it a point to not Make it a point to not overfeed your fish, and overfeed your fish, and keep the tank, and filter keep the tank, and filter clean.clean.
o A rise in your Ammonia A rise in your Ammonia level will be your only clue level will be your only clue before your fish start dying.before your fish start dying.
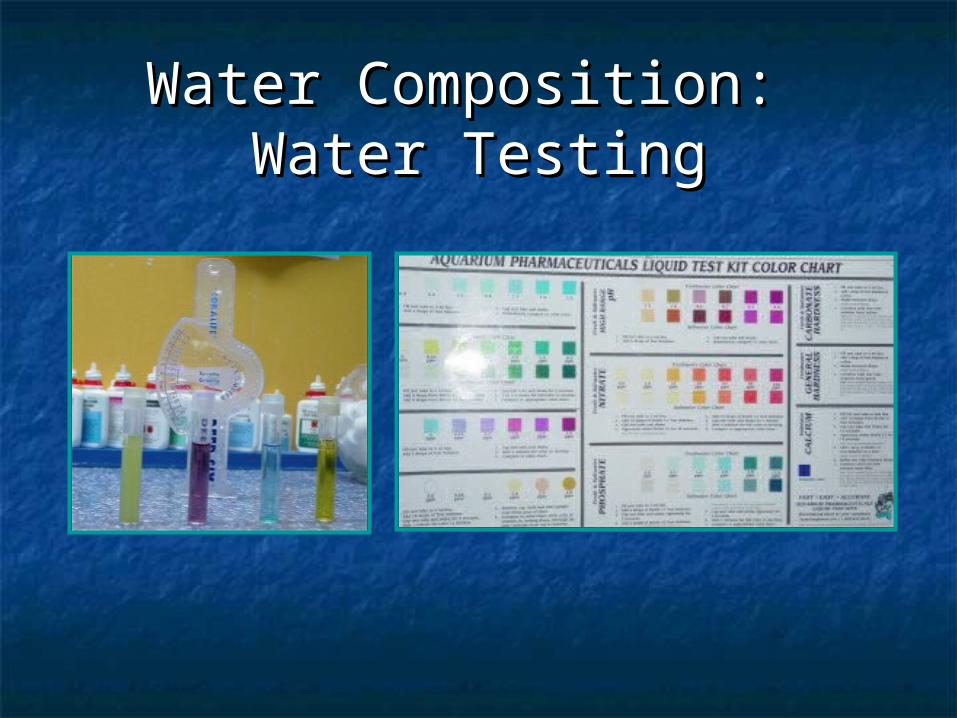
Water Composition: Water Composition: Water TestingWater Testing
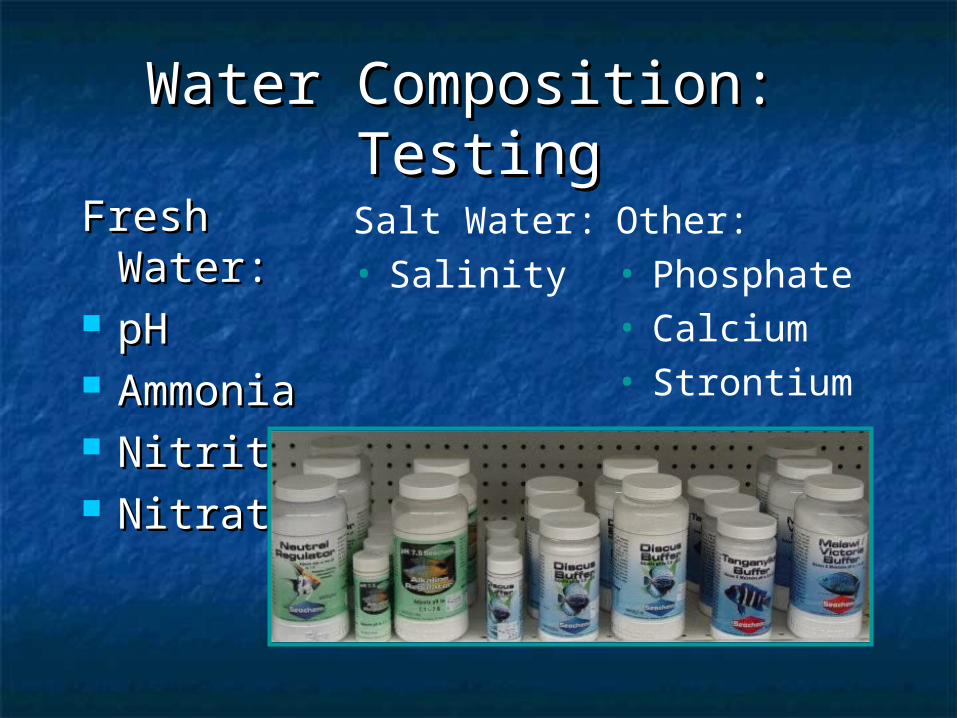
Water Composition: Water Composition: TestingTesting
Fresh Water:Fresh Water: pHpH AmmoniaAmmonia NitriteNitrite NitrateNitrate
Salt Water:• Salinity
Other:• Phosphate• Calcium• Strontium

Water ChangesWater Changes
Why?Why? Dilutes waste Dilutes waste
productsproducts Corrects pH Corrects pH
imbalancesimbalances Can reduce algae Can reduce algae
growthgrowth
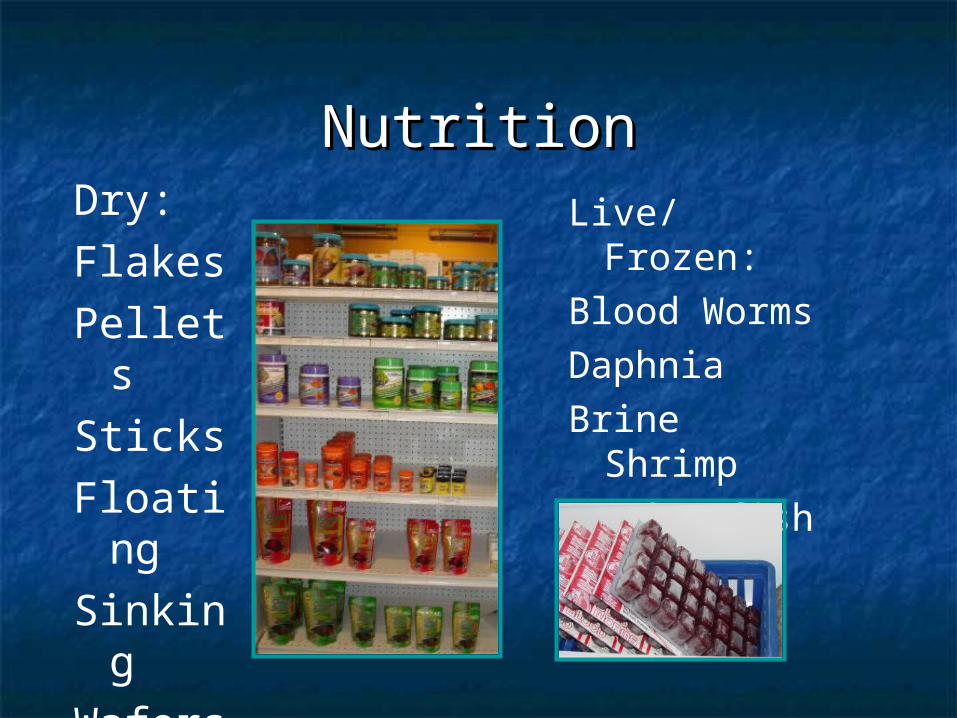
NutritionNutritionDry:FlakesPelletsSticksFloatingSinkingWafersSeawee
d
Live/Frozen:Blood WormsDaphniaBrine ShrimpFeeder fishPlants
Related Documents


![(1) YAMAHA H 30 El oo o 00 0 0 00 0 2.ñ 1 oa o oo oo oo o ... · 00 -2 12B F] 30 o 000 00 00 0 o oo o o 0 00 00 o oo oo oo 00 0 (2) 0 00 00 o oo o oo oo oo o 0 00 00 00 oo o oo o](https://static.cupdf.com/doc/110x72/5ffe50972fd0a110ae2411d9/1-yamaha-h-30-el-oo-o-00-0-0-00-0-2-1-oa-o-oo-oo-oo-o-00-2-12b-f-30-o.jpg)