Dynamic cerebral autoregulation during exhaustive exercise in humans Shigehiko Ogoh 1 , Mads K. Dalsgaard 2 , Chie C. Yoshiga 2 , Ellen A. Dawson 2 , David M. Keller 1 , Peter B. Raven 1 , and Niels H. Secher 2 1 Department of Integrative Physiology, University of North Texas Health Science Center, Fort Worth, Texas 76107, U.S.A. and 2 Department of Anesthesia, The Copenhagen Muscle Research Center, Rigshospitalet, University of Copenhagen, DK-2100 Copenhagen, Denmark Running Title: Dynamic CA during exhaustive exercise Keywords: carbon dioxide, cerebral blood flow, cerebral metabolism Please send correspondence to: Shigehiko Ogoh, Ph.D. Department of Integrative Physiology University of North Texas Health Science Center 3500 Camp Bowie Boulevard Fort Worth, Texas, 76107, U.S.A. Phone: 817-735-2088 Fax: 817-735-5084 e-mail: [email protected] Articles in PresS. Am J Physiol Heart Circ Physiol (October 21, 2004). doi:10.1152/ajpheart.00948.2004 Copyright © 2004 by the American Physiological Society.

Welcome message from author
This document is posted to help you gain knowledge. Please leave a comment to let me know what you think about it! Share it to your friends and learn new things together.
Transcript
Dynamic cerebral autoregulation during exhaustive exercise in humans
Shigehiko Ogoh1, Mads K. Dalsgaard2, Chie C. Yoshiga2, Ellen A. Dawson2, David M.
Keller1, Peter B. Raven1, and Niels H. Secher2
1Department of Integrative Physiology, University of North Texas Health Science Center,
Fort Worth, Texas 76107, U.S.A. and 2Department of Anesthesia, The Copenhagen
Muscle Research Center, Rigshospitalet, University of Copenhagen, DK-2100
Copenhagen, Denmark
Running Title: Dynamic CA during exhaustive exercise
Keywords: carbon dioxide, cerebral blood flow, cerebral metabolism
Please send correspondence to:
Shigehiko Ogoh, Ph.D.
Department of Integrative Physiology
University of North Texas Health Science Center
3500 Camp Bowie Boulevard
Fort Worth, Texas, 76107, U.S.A.
Phone: 817-735-2088
Fax: 817-735-5084
e-mail: [email protected]
Articles in PresS. Am J Physiol Heart Circ Physiol (October 21, 2004). doi:10.1152/ajpheart.00948.2004
Copyright © 2004 by the American Physiological Society.

2H-00948-2004.R2
ABSTRACT
We investigated whether dynamic CA is affected by exhaustive exercise using transfer
function gain and phase shift between oscillations in mean arterial pressure (MAP) and
middle cerebral artery mean blood flow velocity (MCA Vmean). Seven subjects were
instrumented with a brachial artery catheter for measures of MAP and determination of
PaCO2, while jugular venous oxygen saturation (SvO2) was determined to assess changes
in whole brain blood flow. After a 10 min resting period, the subjects performed
dynamic leg cycle ergometry at 168 ± 5 W (mean ± SE) continued to exhaustion with a
group average time of 26.8 ± 5.8 min. Despite no significant change in MAP during
exercise, MCA Vmean decreased from 70.2 ± 3.6 to 57.4 ± 5.4 cm/s and SvO2 from 68 ±
1% to 58 ± 2% at exhaustion and both correlated to PaCO2 (5.5 ± 0.2 to 3.9 ± 0.2 kPa; r =
0.47, P = 0.04 and r=0.74, P<0.001, respectively). An effect on brain metabolism was
indicated by a decrease in the cerebral metabolic ratio of O2/ (glucose + ½ lactate) from
5.6 to 3.8 (P<0.05). At the same time, the normalized low frequency gain between MAP
and MCA Vmean was increased (P<0.05), while the phase shift tended to decrease. These
findings suggest that dynamic CA was impaired by exhaustive exercise despite a
hyperventilation-induced reduction in PaCO2.
3H-00948-2004.R2
INTRODUCTION
Blood flow to the brain is controlled by regional changes in neural activity versus global
influences including cerebral autoregulation (CA; 28). However, CA is itself subjected to
global influences which help to maintain a stable flow despite marked changes in whole
body metabolism and arterial blood pressure (ABP), e.g. during exercise. For instance,
CA is attenuated by hypercapnia and enhanced by hypocapnia (1, 8, 9, 27), while
sympathetic activation shifts the CA curve to the right (22) and prevents cerebral hyper-
perfusion during exercise (13). During the progression towards a maximal effort, with
either a constant or an incremental increase in workload, there is a lowering of arterial
carbon dioxide tension (PaCO2) which occurs as a result of hyperventilation (16) and
there is an exponential increase in plasma catecholamines (19). Collectively, the
decrease in PaCO2 and the sympathetic activation suggest that, especially during intense-
exercise, CA will be enhanced.
Although acute changes in ABP are transmitted to the cerebral circulation, under
normal conditions the cerebral blood flow tends to return to its original value within a
few seconds (1, 26). This is usually referred to as dynamic CA and it correlates well with
assessments of static autoregulation (26, 37). During mild to heavy exercise, dynamic
CA is maintained and may reflect a balance between the influence of sympathetic activity
and PaCO2 (5). However, it remains unknown whether dynamic CA becomes enhanced
during exhaustive exercise when PaCO2 decreases. To test this question subjects
exercised to exhaustion on a bicycle ergometer, while measures of middle cerebral artery
mean blood flow velocity (MCA Vmean) and mean arterial pressure (MAP) were made
beat-to-beat and analyzed using linear dynamic analysis (26, 39, 41). At the same time

4H-00948-2004.R2
jugular venous oxygen saturation (SvO2) was determined to assess changes in whole
brain blood flow.

5H-00948-2004.R2
METHODS
Seven men with a mean age of 23 ± 2 yr, height of 180 ± 10 cm, and weight of 72 ± 9 kg
(mean ± SD) were recruited to participate in the study. All subjects were free of
cardiovascular and pulmonary disorders and were not using prescribed or over the
counter medications. Each subject provided written informed consent as approved by the
Ethics Committee of Copenhagen (KF 01-369/97) and they were requested to abstain
from caffeinated beverages for 12 h and strenuous physical activity and alcohol for at
least 24 h before the experiment.
Protocol
The subjects arrived at the laboratory after an overnight fast. Following catherization,
they were seated in a semi-recumbent position on a modified Krogh cycle ergometer.
After a 10 min resting period, the subjects began cycling at 10 W, which was
subsequently adjusted to the target heart rate (HR; 160 beats·min-1, i.e. to 168 ± 5 W;
mean ± SE) which was continued until they could no longer maintain a pedaling
frequency of 60 r.p.m. despite strong verbal encouragement.
Measurements
A catheter (1.1 mm ID, 20 gauge) was placed in the brachial artery of the non-dominant
arm and ABP was measured with a Bentley transducer (Uden, The Netherlands)
positioned at the level of the right atrium and connected to a pressure monitoring system
(Hewlett Packard M1275A, Germany). Beat-to-beat data acquisition of cardiovascular
variables was collected by a personal computer with customized software. The HR,
6H-00948-2004.R2
stroke volume (SV) and thus cardiac output (Q) were calculated from the blood pressure
waveform using the Modelflow software program incorporating age, sex, height and
weight (BeatScope version 1.0 software, TNO-TPD, Biomedical Instrumentation,
Amsterdam, The Netherlands). Modelflow provides a reliable estimate of changes in Q
during exercise in healthy young humans (36) and SV and Q were expressed relative to
rest. Arterial blood samples were obtained at rest and during exercise and stored in ice-
water until analyzed for pH, oxygen (PaO2) and carbon dioxide (PaCO2) tensions, oxygen
saturation (SaO2), glucose and lactate (ABL725, Radiometer, Copenhagen, Denmark). In
addition, a catheter (14 gauge, 2.2 mm) was placed in the right internal jugular vein for
the measurement of internal jugular venous pressure, venous pH, oxygen (PvO2) and
carbon dioxide (PvCO2) tensions, oxygen saturation (SvO2), glucose and lactate. The
MCA Vmean was obtained by transcranial Doppler ultrasonography (Multidop X, DWL,
Sipplingen, Germany) with a 2−MHz probe placed over the temporal window and fixed
with an adjustable headband and adhesive ultrasonic gel (Tensive, Parker Laboratories,
Orange, NJ). Cerebral vascular resistance index (CVRi) was expressed as (MAP at MCA
level − the jugular venous pressure)/MCA Vmean. The MAP at the MCA level was
calculated as the vertical distance from the fourth intercostal space in the midclavicular
line (heart level) to the Doppler probe and the mass of blood (1.06 g/cm3): hydrostatic
pressure = the vertical length×0.77 mmHg/cm. To evaluate changes in brain activation,
the cerebral metabolic ratio was calculated from the arterial-venous differences across the
brain for O2/(glucose + ½ lactate) as published (7).
Data analysis

7H-00948-2004.R2
Analog signals of ABP and the spectral envelope of MCA Vmean were sampled at 100 Hz
and digitized at 12 bits for off-line analysis. Beat-to-beat MAP and MCA Vmean were
obtained by integrating analog signals within each cardiac cycle and linearly interpolated
and re-sampled at 2 Hz for spectral analysis of dynamic CA (39). At rest and during
exercise dynamic CA was calculated as the transfer function gain and phase shift between
fluctuations in MAP and MCA Vmean (39). The transfer gain and phase shift reflect the
relative amplitude and time relationship between the changes in MAP and MCA Vmean
over a specified frequency range. From the temporal sequences of MAP and MCA Vmean,
the frequency-domain transformations are computed with a Fast Fourier Transformation
(FFT) algorithm. The transfer function H(f) between the two signals was calculated as
H(f) = Sxy(f) / Sxx(f), where Sxx(f) is the autospectrum of changes in MAP and Sxy(f) is the
cross-spectrum between the two signals. The transfer function magnitude H(f) and
phase spectrum Ф(f) were obtained from the real part HR(f) and imaginary part HI(f) of
the complex function:
H(f) = [HR(f)2 +HI(f) 2]1/2
Ф (f) = tan-1[HI(f) / HR(f)]
Moreover, the transfer function H(f) was normalized to the mean values of input
(x) and output (y) variables as H’(f) = [Sxy(f)·x] / [Sxx(f)·y] and the normalized gain was
calculated as 20 log H’(f) to provide values in decibels (dB). A value of 0 indicates
that the output varies by the same fraction of the mean value as the input, and a negative
and positive value indicate that the output varies less or more than the input.
The squared coherence function MSC(f) was estimated as:

8H-00948-2004.R2
MSC(f) = Sxy(f)2 / [Sxx(f)·Syy(f)],
where Syy(f) is the autospectrum of changes in MCA Vmean. The squared coherence
function reflects the fraction of output power (MCA Vmean) that can be linearly related to
the input power (MAP) at each frequency. Similarly to a correlation coefficient, it varies
between 0 and 1.
Spectral power of MAP, MCA Vmean, mean value of transfer function gain, phase,
and coherence function were calculated in the very low (VLF, 0.02 to 0.07 Hz), low (LF,
0.07 to 0.20 Hz), and high (HF, 0.20 to 0.30 Hz) frequency ranges to reflect different
patterns of the dynamic pressure-flow relationship (39, 40). The ABP fluctuations in the
HF range, including those induced by the respiratory frequency, are transferred to MCA
Vmean, whereas ABP fluctuations in the LF range are independent of the respiratory
frequency and the LF transfer analysis reflects CA mechanisms (8, 39). Furthermore, the
VLF range of both the flow and the pressure variabilities appears to reflect multiple
physiological mechanisms that confound interpretation. Thus, we used the LF range for
the spectral analysis to identify the dynamic CA during exercise.
Resting measurements were made during a 3-min data collection segment, while
during exercise, the data segments of the 6-9th min, 12-15th min and the 3-min period
prior to exhaustion were used. The power spectra, transfer function gain, phase and
coherence of 12-15th min segment could be calculated for only five subjects because in 2
subjects the period prior to exhaustion overlapped.
Statistical Analysis

9H-00948-2004.R2
One-way analysis of variance (ANOVA; SigmaStat; Jandel Scientific Software, SPSS
Inc., Chicago, IL, USA) with repeated measures was used to assess the differences in the
steady-state hemodynamic variables, spectral power of HR, MAP and MCA Vmean,
transfer function gain, phase and coherence function in each frequency range between
rest and the three exercise segments. A Student Newman-Keul test was employed post
hoc when main effects were significant, i.e. P<0.05. Data are expressed as mean ± SE
and the relationships between SvO2, MCA Vmean and PaCO2 were described using linear
regression analysis.

10H-00948-2004.R2
RESULTS
Exercise increased ABP, HR, SV and Q (Table 1) and exhaustion was reached after 26.8
± 5.8 min. The HR continued to increase with time from 5-min (166 ± 4 bpm) to
exhaustion (185 ± 3 bpm) (P<0.05), while SV and Q did not change significantly during
exercise.
Blood gas variables
Throughout exercise the arterial lactate concentration increased and pH decreased
(P<0.05), while PaO2 remained stable (Table 1). However, SaO2 decreased at the
beginning of exercise (P<0.05), while SvO2 increased at minute five (P<0.05) and then
decreased to a value smaller than at rest (P<0.05). Thus, the arterial-venous difference
(a-v diff.) across the brain in SO2 decreased at the beginning of exercise (P<0.05) and
then increased at 15-min and at exhaustion to values similar to those obtained at rest.
The a-v diff. across the brain for lactate demonstrated a small release at rest (−0.45 ± 0.25
mmol/L), however at 15-min and at exhaustion there was an uptake (a-v diff.; 1.06 ± 0.23
and 1.00 ± 0.24 mmol/L, respectively; P<0.05). Thus, the cerebral metabolic ratio of
O2/(glucose + ½ lactate) decreased from 5.6 ± 0.7 at rest to 3.0 ± 0.4 and 3.8 ± 0.7 at 15-
min and at exhaustion, respectively (P<0.05).
MAP, MCA Vmean, SvO2 and PaCO2
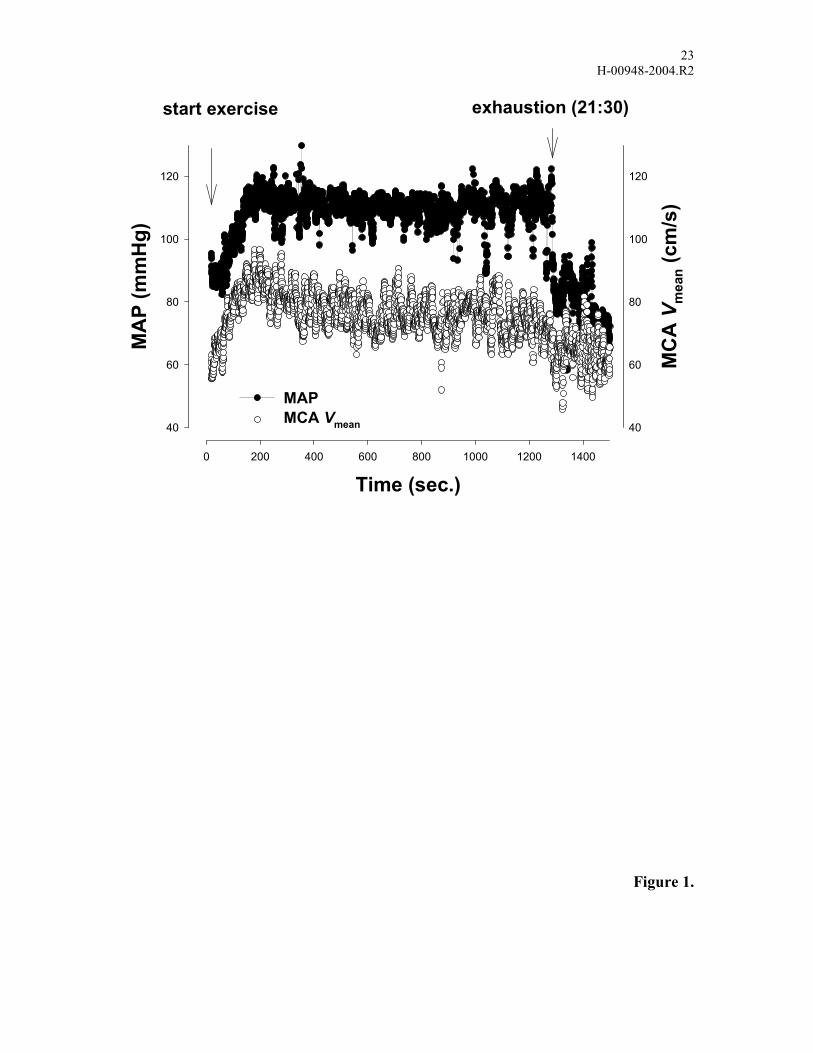
Representative changes in MAP and MCA Vmean during exercise are outlined for one
subject (Fig. 1). Despite no significant change in MAP throughout exercise to
exhaustion, MCA Vmean decreased gradually towards exhaustion. The increase in MAP
11H-00948-2004.R2
from rest to exercise was by 23.5 ± 3.2% at 5-min, 19.4 ± 3.8% at 15-min and 18.3 ±
4.3% at exhaustion (P<0.05), while the changes in MCA Vmean were by 19.7 ± 5.3%, 12.8
± 7.5% and -2.0 ± 9.0%, respectively (Table 1, P<0.05). Thus, CVRi tended to increase
from 1.16 ± 0.06 mmHg/cm/s at rest to 1.51 ± 0.23 mmHg/cm/s (P = 0.11) at exhaustion.
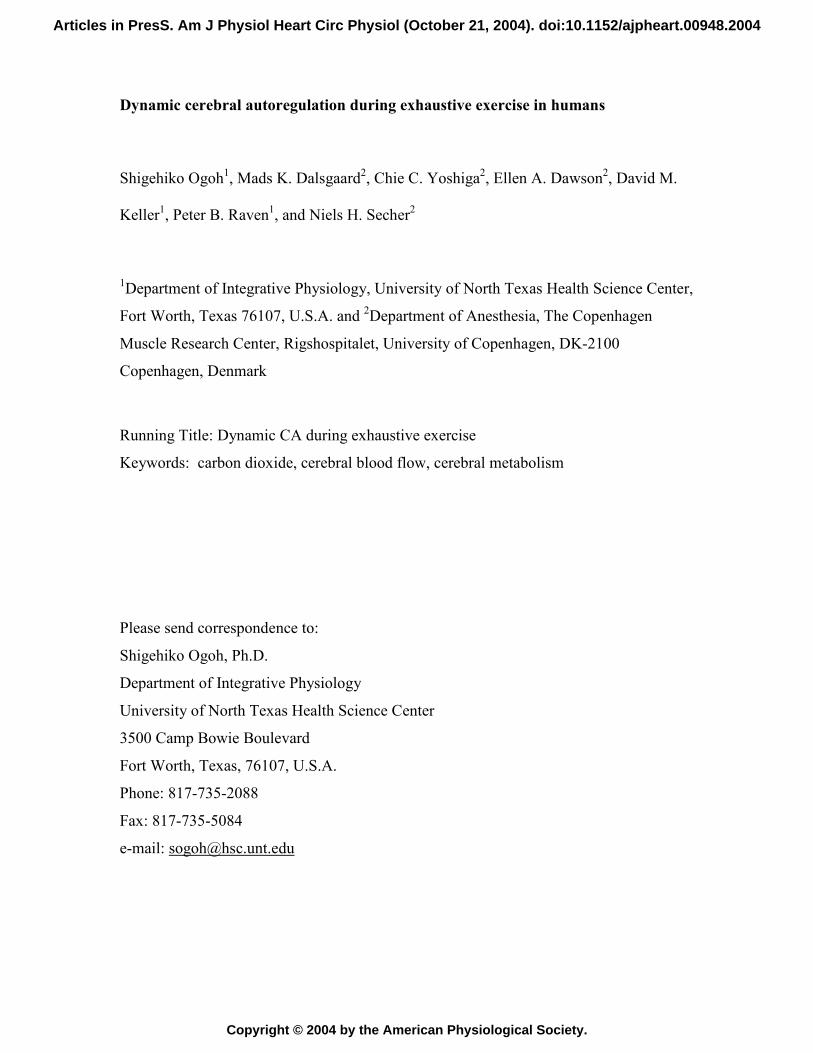
There was a small increase in PaCO2 at the beginning of exercise, but PaCO2 decreased to
below the resting value at exhaustion (P<0.05). Thus, during exercise the reduction in
MCA Vmean was related to the decrease in PaCO2 (MCA Vmean = 33 + 6.8 × PaCO2;
r=0.47, P=0.04; Fig. 2A). Similarly, SvO2 decreased from 68 ± 1% to 58 ± 2% at
exhaustion and was also related to the decrease in PaCO2 (SvO2 = 34 + 5.0 × PaCO2;
r=0.74, P<0.001; Fig. 2B).
Spectral and transfer function analyses
During exercise to exhaustion, there were no significant changes in the spectral power of
MCA Vmean across all frequency ranges nor with the spectral power of MAP, with the
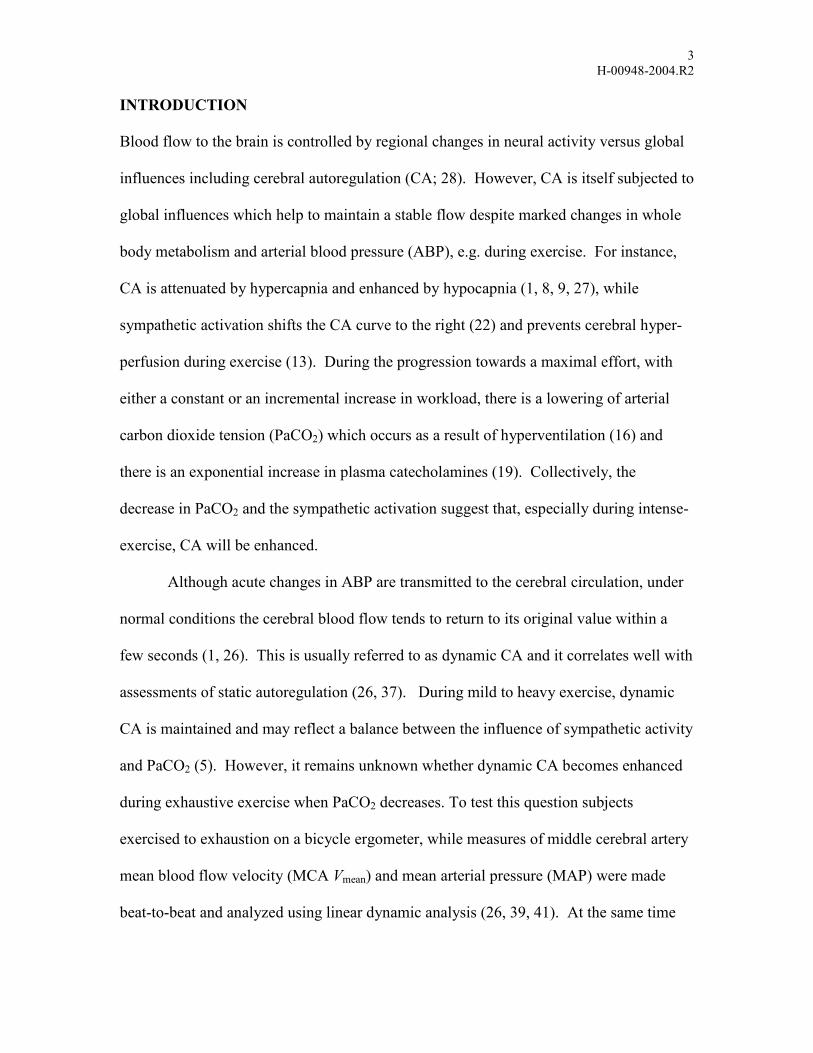
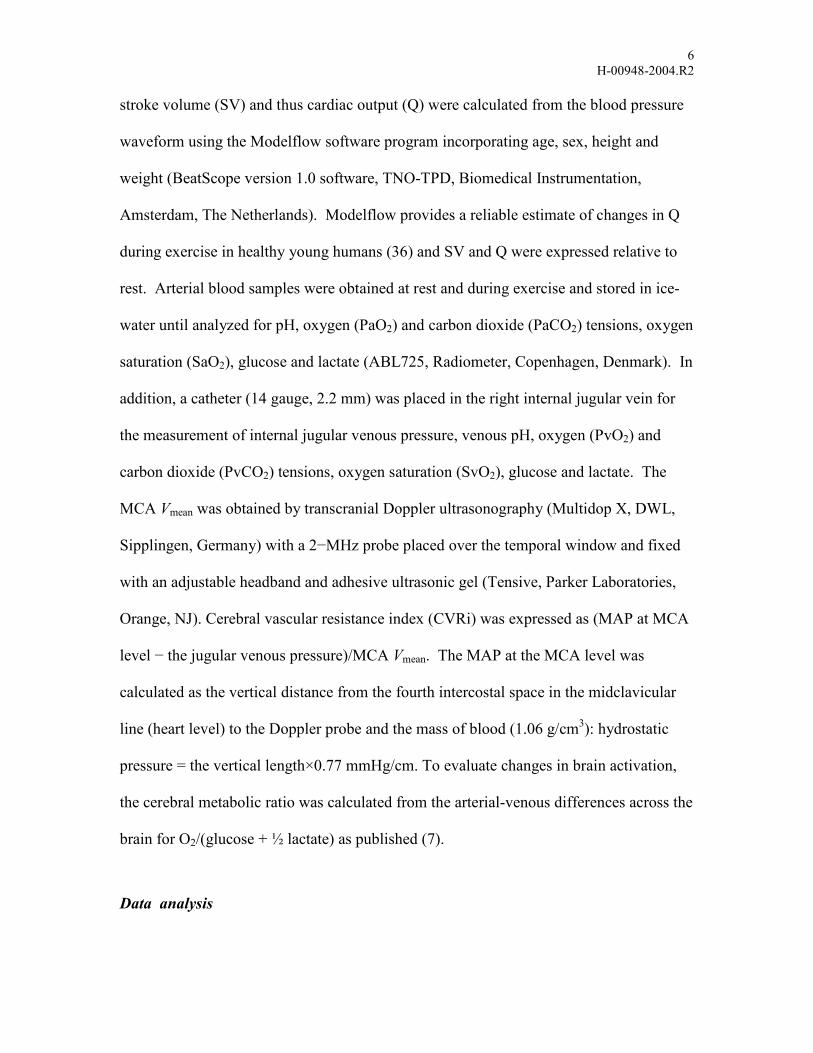
exception of the HF range at exhaustion (Table 2, P<0.05). The transfer function phase
shift tended to decrease over time (Figs. 3, 4), but at the 12-15th min and at exhaustion the
transfer function gain, as well as the normalized values for each frequency range,
increased from the resting value (P<0.05). The coherence between MAP and MCA Vmean
decreased compared to rest, but there was no significant difference between the values
obtained during exercise (Fig. 4). Despite this, throughout exercise the coherence
remained above 0.5, i.e. it remained statistically significant.
12H-00948-2004.R2
DISCUSSION
The main finding of the present investigation was that the effectiveness of dynamic CA
was reduced by exhaustive exercise despite a reduction in PaCO2 and a presumed marked
increase in sympathetic activity. Furthermore, the slope of the linear relationship
between MCA Vmean and PaCO2 throughout the range of PaCO2 (5.5~3.9 kPa) that was
developed by exercise to exhaustion appeared to be markedly less than at rest, i.e.
12%/kPa vs. 29%/kPa (12).
The CA maintains a constant cerebral blood flow and is considered to operate within a
MAP range of 60 to 150 mmHg as long as Q and PaCO2 remain stable (28). However,
cerebral blood flow is highly sensitive to alterations in PaCO2 (1, 8, 9, 12, 14, 27, 31).
For example, at rest, increases in PaCO2 dilates the cerebral resistance vessels and
promotes blood flow, whereas a decrease causes vasoconstriction of the cerebral
resistance vessels (14, 17, 31), which consequently produce marked changes in MCA
Vmean without changes in diameter (12, 14, 31). The relationship between MCA Vmean and
PaCO2 is unclear and has been reported to be linear (12), sigmoidal (31) or exponential
(14). The cerebral metabolic demand for oxygen also contributes to changes in MCA
Vmean (4). Throughout exercise to exhaustion, SvO2 decreased and correlated to the
decrease in PaCO2 (Fig. 2B) suggesting that PaCO2 maintains its ability to cause
vasoconstriction of the cerebral resistance vessels during exhaustive exercise. With both
MAP and Q remaining stable during exercise, the relationship between individual MCA
Vmean and PaCO2 ranging from 5.5 to 3.9 kPa was linear (Fig. 2A), but the slope was
approximately half of that found both at rest (12) and during exercise combined with the
13H-00948-2004.R2
administration of CO2 to the inspired air (24). Moreover, during exercise MCA Vmean was
higher than expected for a given PaCO2.
The cerebral metabolic rate of oxygen remains stable during cerebral activation
(23). Therefore, during the initial five minutes of exercise, a decrease in the a-v diff. in
blood oxygen saturation across the brain indicates an enhanced perfusion (Table 1).
However, at 15 min and at exhaustion, the a-v diff. in SO2 across the brain was not
significantly different from rest, suggesting normalization of cerebral blood flow. In
addition, the a-v diff. of lactate concentration across the brain indicated an increased
uptake as the subject became tired, particularly at exhaustion. Moreover, the cerebral
metabolic ratio decreased during exercise to exhaustion. These results substantiate the
hypothesis that cerebral metabolism is enhanced by intense exercise. Ide et al. (13, 15)
found that changes in Q, independent of MAP, affect MCA Vmean. However, in the
present study both Q and MAP remained stable during exhaustive exercise and the
decreases in PaCO2 with exercise-induced hyperventilation therefore played a major role
in regulation of MCA Vmean.
By using linear dynamic analysis between MAP and MCA Vmean, an increase in
the LF transfer function gain and normalized gain was identified during exhaustive
exercise. Such an increase in transfer function gain between beat-to-beat MAP and
MCA Vmean indicates a reduction in dynamic CA (26, 39, 40), while at rest dynamic CA
increases when PaCO2 is reduced (8, 27). By deflating thigh blood pressure cuffs, the
rate of regulation, which is an index of dynamic CA has been calculated as 0.38, 0.20,
and 0.11/sec in hypocapnia, normocapnia , and hypercapnia, respectively (1). Equally,
Edwards et al. (9) using transfer function analysis demonstrated that dynamic CA is
14H-00948-2004.R2
improved at a low end-tidal PCO2. In the present investigation the sympathoexcitation
associated with exhaustive exercise (10, 11, 33) and hyperventilatory response to
metabolic acidosis and its resultant hypocapnia (16) would be expected to enhance
dynamic CA (1, 8, 9, 27). However, the transfer function gain was increased indicating
an impairment of dynamic CA. The impairment in dynamic CA may be related to the
altered milieu of cerebral vessels associated with the efflux of metabolites into the
vascular tissue related to increased brain metabolism (7). In the systemic circulation such
increases in metabolites have been found to alter vasomotor tone (18). However, brain
metabolism may not be the only reason why dynamic CA becomes impaired during
exercise.
Another possible explanation of an impaired dynamic CA is acute
hyperammonemia during exhaustive exercise. In patients with acute liver failure,
sympathetic regulation of cerebral blood flow is impaired (21) and CA becomes impaired
in response to stepwise hypotensive stimuli (20), which may be related to ammonia-
induced perturbations of brain metabolism (6, 25). Similarly, intense exercise increases
the blood content of ammonia which easily penetrates the blood-brain-barrier (2). Thus,
impaired dynamic CA and a reduced responsiveness of MCA Vmean to changes in PaCO2
could result from elevated ammonia in the brain during exhaustive exercise.
The range, or set point, of the function representing both static and dynamic CA is
influenced by the prevailing perfusion pressure (35). In chronic hypertension, the limits
of the CA function curve are shifted to the higher MAP (28), while chronic cerebral
hypoperfusion shifts the curve to a lower pressure (38). Acute exposure to orthostatic
stress, such as head-up tilt and lower body negative pressure results in a downward (3) or
15H-00948-2004.R2
rightward (41, 42) shift in the CA curve. Levine et al. (22) speculate that sympathetic
activation during lower body negative pressure shifts the CA curve to the right and
compromises CA during orthostatic hypotension and may contribute to symptoms of pre-
syncope. However, it has been reported that during heavy exercise the prospect of hyper-
perfusion of the brain was prevented by sympathoexcitation (13) and may be reflective of
a rightward shift in the CA function curve. In the present investigation, although a
rightward shift in the CA curve may have been present, especially at exhaustion, dynamic
CA was impaired. This impairment was associated with the hyperventilatory response to
metabolic acidosis producing hypocapinia, therefore we conclude that the interaction
between sympathoexcitation and decreases in PaCO2 are changed by exhaustive exercise
by an unidentified mechanism.
Potential Limitations
Estimating changes in cerebral blood flow via MCA Vmean could be influenced by
changes in diameter of the insonated vessel. However, MCA diameter remains relatively
constant under a variety of conditions (32, 34). Nonetheless, sympathetic activity may
induce constriction of MCA during submaximal and, more particularly, during maximal
exercise (16). However, sympathetic activation produced during muscle ischemia
following rhythmic handgrip exercise does not change the luminar diameter of a systemic
conduit artery (30). Pott et al. (29) has suggested that the 50% increase of MCA Vmean
during strenuous exercise (at >80% of maximal work capacity) may reflect MCA
constriction when compared with the only 20% increase of MCA Vmean observed in
athletes during low workload exercise. However, these differences can be explain by the
16H-00948-2004.R2
increase in sympathoexcitation producing a constrictions of the cerebral resistance
vessels more at the higher workload without changing MCA diameter. Hence, we
contend that the beat-to-beat changes in MCA Vmean during steady-state exercise
primarily reflect changes in flow and is confirmed by the changes in SvO2. It should also
be noted that during intense exercise, the MAP profile includes a considerable increase in
pulse pressure. Considering that the fluctuations in MCA Vmean encompass both changes
in peak systolic and diastolic flow velocities, it is important to consider the potential
differences that may occur during these two distinct phases of the MCA V profile. This is
particularly important in regard to the increase in the systolic pressure wave that must be
countered by CA.
In conclusion, the MCA Vmean-PaCO2 relationship appeared to be linear
throughout the range of PaCO2 that was produced by exercise to exhaustion. However,
the slope of the relationship was markedly less during exercise than at rest and despite the
large reduction in PaCO2 resulting from hyperventilation dynamic CA was impaired.

17H-00948-2004.R2
ACKOWLEDGEMENTS
The authors appreciate the time and effort expended by the subjects. We thank Peter
Nissen for his expert technical assistance and Lisa Marquez for her assistance in
preparing the document.
18H-00948-2004.R2
REFERENCES
1. Aaslid R, Lindegaard KF, Sorteberg W, and Nornes H. Cerebral autoregulation dynamics in humans. Stroke 20: 45-52, 1989. 2. Bachmann C. Mechanisms of hyperammonemia. Clin Chem Lab Med 40: 653-662, 2002. 3. Bondar RL, Dunphy PT, Moradshahi P, Dai H, Kassam MS, Stein F, Schneider S, and Rubin M. Vertical shift in cerebral autoregulation curve: a graded head-up tilt study. Can Aeronaut Space J 45: 3-8, 1999. 4. Brown MM, Wade JP, and Marshall J. Fundamental importance of arterial oxygen content in the regulation of cerebral blood flow in man. Brain 108 ( Pt 1): 81-93, 1985. 5. Brys M, Brown CM, Marthol H, Franta R, and Hilz MJ. Dynamic cerebral autoregulation remains stable during physical challenge in healthy persons. Am J Physiol Heart Circ Physiol 285: H1048-1054, 2003. 6. Butterworth RF, Girard G, and Giguere JF. Regional differences in the capacity for ammonia removal by brain following portocaval anastomosis. J Neurochem 51: 486-490, 1988. 7. Dalsgaard MK, Ogoh S, Dawson EA, Yoshiga CC, Quistorff B, and Secher NH. The cerebral carbohydrate cost of physical exertion in humans. Am J Physiol Regul Integr Comp Physiol, 2004. 8. Diehl RR, Linden D, Lucke D, and Berlit P. Phase relationship between cerebral blood flow velocity and blood pressure. A clinical test of autoregulation. Stroke 26: 1801-1804, 1995. 9. Edwards MR, Shoemaker JK, and Hughson RL. Dynamic modulation of cerebrovascular resistance as an index of autoregulation under tilt and controlled PET(CO(2)). Am J Physiol Regul Integr Comp Physiol 283: R653-662, 2002. 10. Fadel PJ, Ogoh S, Watenpaugh DE, Wasmund W, Olivencia-Yurvati A, Smith ML, and Raven PB. Carotid baroreflex regulation of sympathetic nerve activity during dynamic exercise in humans. Am J Physiol Heart Circ Physiol 280: H1383-1390, 2001. 11. Hartley LH, Mason JW, Hogan RP, Jones LG, Kotchen TA, Mougey EH, Wherry FE, Pennington LL, and Ricketts PT. Multiple hormonal responses to graded exercise in relation to physical training. J Appl Physiol 33: 602-606, 1972. 12. Hauge A, Thoresen M, and Walloe L. Changes in cerebral blood flow during hyperventilation and CO2-breathing measured transcutaneously in humans by a bidirectional, pulsed, ultrasound Doppler blood velocitymeter. Acta Physiol Scand 110: 167-173, 1980. 13. Ide K, Boushel R, Sorensen HM, Fernandes A, Cai Y, Pott F, and Secher NH. Middle cerebral artery blood velocity during exercise with beta-1 adrenergic and unilateral stellate ganglion blockade in humans. Acta Physiol Scand 170: 33-38, 2000. 14. Ide K, Eliasziw M, and Poulin MJ. The relationship between middle cerebral artery blood velocity and end-tidal PCO2 in the hypocapnic-hypercapnic range in humans. J Appl Physiol, 2003. 15. Ide K, Pott F, Van Lieshout JJ, and Secher NH. Middle cerebral artery blood velocity depends on cardiac output during exercise with a large muscle mass. Acta Physiol Scand 162: 13-20, 1998. 16. Ide K and Secher NH. Cerebral blood flow and metabolism during exercise. Prog Neurobiol 61: 397-414, 2000. 17. Imms FJ, Russo F, Iyawe VI, and Segal MB. Cerebral blood flow velocity during and after sustained isometric skeletal muscle contractions in man. Clin Sci (Lond) 94: 353-358, 1998. 18. Keller DM, Wasmund WL, Wray DW, Ogoh S, Fadel PJ, Smith ML, and Raven PB. Carotid baroreflex control of leg vascular conductance at rest and during exercise. J Appl Physiol 94: 542-548, 2003. 19. Kjaer M and Secher NH. Neural influence on cardiovascular and endocrine responses to static exercise in humans. Sports Med 13: 303-319, 1992. 20. Lagi A, La Villa G, Barletta G, Cencetti S, Bacalli S, Cipriani M, Foschi M, Lazzeri C, Del Bene R, Gentilini P, and Laffi G. Cerebral autoregulation in patients with cirrhosis and ascites. A transcranial Doppler study. J Hepatol 27: 114-120, 1997. 21. Lagi A, Laffi G, Cencetti S, Barletta G, Foschi M, Vizzutti F, Bandinelli R, Pantaleo P, Tosti Guerra C, Gentilini P, and La Villa G. Impaired sympathetic regulation of cerebral blood flow in patients with cirrhosis of the liver. Clin Sci (Lond) 103: 43-51, 2002.
19H-00948-2004.R2
22. Levine BD, Giller CA, Lane LD, Buckey JC, and Blomqvist CG. Cerebral versus systemic hemodynamics during graded orthostatic stress in humans. Circulation 90: 298-306, 1994. 23. Madsen PL, Sperling BK, Warming T, Schmidt JF, Secher NH, Wildschiodtz G, Holm S, and Lassen NA. Middle cerebral artery blood velocity and cerebral blood flow and O2 uptake during dynamic exercise. J Appl Physiol 74: 245-250, 1993. 24. Nybo L and Nielsen B. Middle cerebral artery blood velocity is reduced with hyperthermia during prolonged exercise in humans. J Physiol 534: 279-286, 2001. 25. Ott P and Larsen FS. Blood-brain barrier permeability to ammonia in liver failure: a critical reappraisal. Neurochem Int 44: 185-198, 2004. 26. Panerai RB, Dawson SL, and Potter JF. Linear and nonlinear analysis of human dynamic cerebral autoregulation. Am J Physiol 277: H1089-1099, 1999. 27. Panerai RB, Deverson ST, Mahony P, Hayes P, and Evans DH. Effects of CO2 on dynamic cerebral autoregulation measurement. Physiol Meas 20: 265-275, 1999. 28. Paulson OB, Strandgaard S, and Edvinsson L. Cerebral autoregulation. Cerebrovasc Brain Metab Rev 2: 161-192, 1990. 29. Pott F, Jensen K, Hansen H, Christensen NJ, Lassen NA, and Secher NH. Middle cerebral artery blood velocity and plasma catecholamines during exercise. Acta Physiol Scand 158: 349-356, 1996. 30. Pott F, Ray CA, Olesen HL, Ide K, and Secher NH. Middle cerebral artery blood velocity, arterial diameter and muscle sympathetic nerve activity during post-exercise muscle ischaemia. Acta Physiol Scand 160: 43-47, 1997. 31. Ringelstein EB, Sievers C, Ecker S, Schneider PA, and Otis SM. Noninvasive assessment of CO2-induced cerebral vasomotor response in normal individuals and patients with internal carotid artery occlusions. Stroke 19: 963-969, 1988. 32. Schreiber SJ, Gottschalk S, Weih M, Villringer A, and Valdueza JM. Assessment of blood flow velocity and diameter of the middle cerebral artery during the acetazolamide provocation test by use of transcranial Doppler sonography and MR imaging. AJNR Am J Neuroradiol 21: 1207-1211., 2000. 33. Seals DR and Victor RG. Regulation of muscle sympathetic nerve activity during exercise in humans. Exerc Sport Sci Rev 19: 313-349, 1991. 34. Serrador JM, Picot PA, Rutt BK, Shoemaker JK, and Bondar RL. MRI measures of middle cerebral artery diameter in conscious humans during simulated orthostasis. Stroke 31: 1672-1678., 2000. 35. Serrador JM, Wood SJ, Picot PA, Stein F, Kassam MS, Bondar RL, Rupert AH, and Schlegel TT. Effect of acute exposure to hypergravity (GX vs. GZ) on dynamic cerebral autoregulation. J Appl Physiol 91: 1986-1994, 2001. 36. Sugawara J, Tanabe T, Miyachi M, Yamamoto K, Takahashi K, Iemitsu M, Otsuki T, Homma S, Maeda S, Ajisaka R, and Matsuda M. Non-invasive assessment of cardiac output during exercise in healthy young humans: comparison between Modelflow method and Doppler echocardiography method. Acta Physiol Scand 179: 361-366, 2003. 37. Tiecks FP, Lam AM, Aaslid R, and Newell DW. Comparison of static and dynamic cerebral autoregulation measurements. Stroke 26: 1014-1019., 1995. 38. Young WL, Pile-Spellman J, Prohovnik I, Kader A, and Stein BM. Evidence for adaptive autoregulatory displacement in hypotensive cortical territories adjacent to arteriovenous malformations. Columbia University AVM Study Project. Neurosurgery 34: 601-610; discussion 610-611, 1994. 39. Zhang R, Zuckerman JH, Giller CA, and Levine BD. Transfer function analysis of dynamic cerebral autoregulation in humans. Am J Physiol 274: H233-241, 1998. 40. Zhang R, Zuckerman JH, Iwasaki K, Wilson TE, Crandall CG, and Levine BD. Autonomic neural control of dynamic cerebral autoregulation in humans. Circulation 106: 1814-1820., 2002. 41. Zhang R, Zuckerman JH, and Levine BD. Deterioration of cerebral autoregulation during orthostatic stress: insights from the frequency domain. J Appl Physiol 85: 1113-1122, 1998. 42. Zhang R, Zuckerman JH, Pawelczyk JA, and Levine BD. Effects of head-down-tilt bed rest on cerebral hemodynamics during orthostatic stress. J Appl Physiol 83: 2139-2145, 1997.

20H-00948-2004.R2
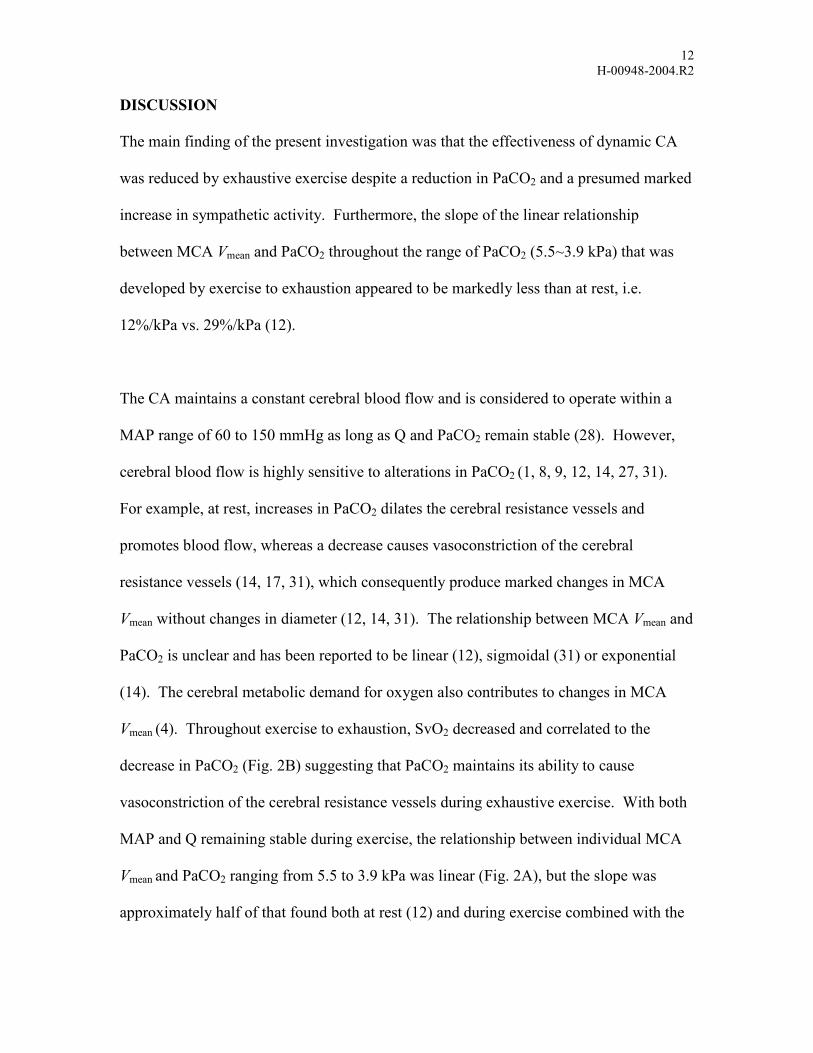
FIGURE LEGENDS Figure 1. Mean arterial pressure (MAP) and middle cerebral artery mean blood flow
velocity (MCA Vmean) during exercise for one subject.
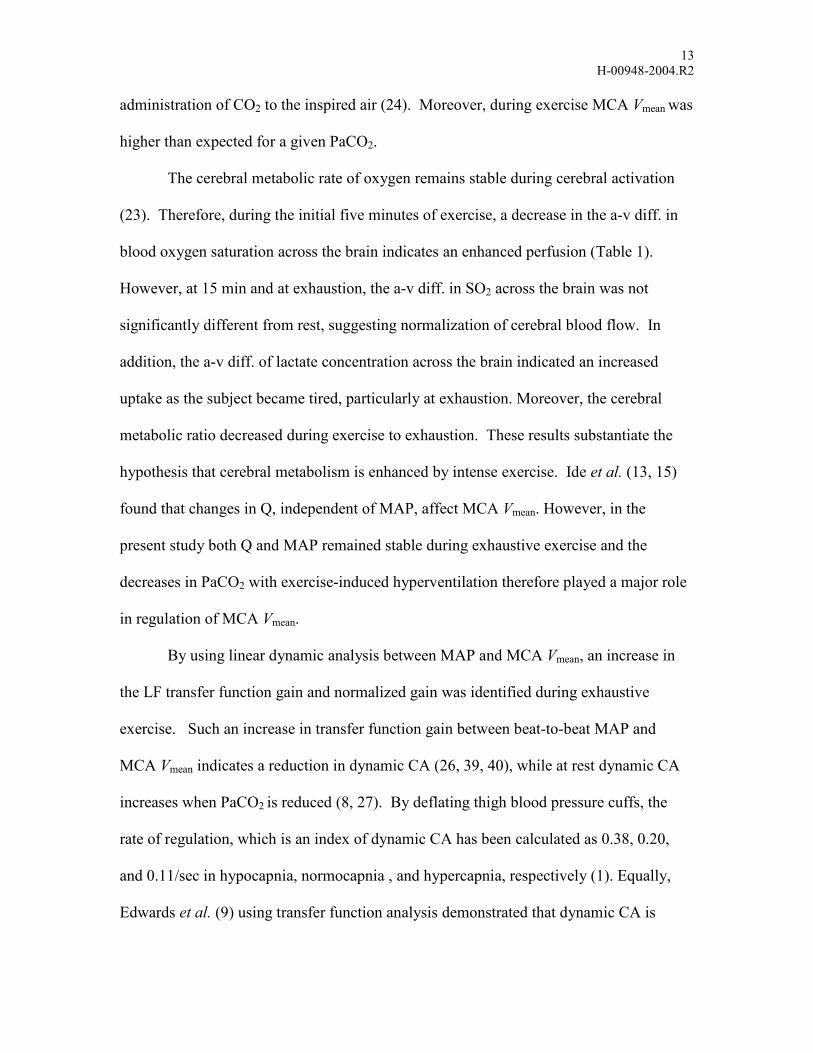
Figure 2. A; The relationship between middle cerebral artery mean blood flow velocity
(MCA Vmean) and arterial CO2 tension (PaCO2), B; The relationship between venous O2
saturation (SvO2) and PaCO2 at rest and during exercise. Values are mean ± SE.
Figure 3. Cross-spectral analysis in the entire spectrum from 0.02 to 0.3 Hz at rest, 6-9
min, 12-15 min and exhaustion. Group-averaged phase (A), gain (B) and normalized
gain (C) between MAP and MCA Vmean are shown. Values are means. N=7.
Figure 4. Group-averaged low frequency (LF; 0.07-0.2 Hz) transfer function phase (A),
gain (B), normalized gain (C) and coherence (D) between MAP and MCA Vmean at rest
and during exercise. *different from rest (P<0.05); †different from 6-9 min (P<0.05).
Values are mean ± SE.

21H-00948-2004.R2
Table 1. Cardiovascular and blood gas variables at rest and during exercise to exhaustion.
Rest 5 min 15 min Exhaustion MAP (mmHg) 93 ± 2 115 ± 3* 110 ± 2* 110 ± 4*
MAP at MCA (mmHg) 64 ± 2 86 ± 3* 81 ± 3* 81 ± 4* JVP (mmHg) -3.2 ± 0.7 0.3 ± 0.5* -1.5 ± 0.4 -1.0 ± 0.6
MCA Vmean (cm/s) 59 ± 3 70 ± 4* 66 ± 4 57 ± 5† CVRi (mmHg s/cm) 1.16 ± 0.07 1.27 ± 0.10 1.29 ± 0.13 1.51 ± 0.23 HR (bpm) 69 ± 2 166 ± 4* 174 ± 4*† 185 ± 3*†‡ SV (%) 100 ± 0 143 ± 2* 147 ± 3* 138 ± 5* Q (%) 100 ± 0 349 ± 11* 380 ± 13* 377 ± 12*†
pH (a) 7.41 ± 0.01 7.35 ± 0.01* 7.34 ± 0.01* 7.32 ± 0.03* pH (v) 7.35 ± 0.01 7.32 ± 0.01 7.29 ± 0.02* 7.26 ± 0.03*† PaO2 (kPa) 14.3 ± 0.5 12.1 ± 1.3 12.9 ± 0.3 13.0 ± 0.4 PvO2 (kPa) 4.6 ± 0.1 6.4 ± 1.4 4.4 ± 0.1 4.5 ± 0.1
PaCO2 (kPa) 5.2± 0.2 5.5 ± 0.2 4.5 ± 0.2*† 3.9 ± 0.2*†‡ PvCO2 (kPa) 6.7± 0.1 6.4 ± 0.3 6.0 ± 0.1 5.8 ± 0.2* SaO2 (%) 98.4 ± 0.2 97.6 ± 0.2* 97.2 ± 0.1* 97.0 ± 0.2* SvO2 (%) 62.7 ± 1.7 68.1 ± 0.7* 58.3 ± 1.8*† 58.0 ± 2.0†
SO2 a-v diff. (%) 35.7 ± 1.7 29.5 ± 0.8* 38.9 ± 1.7† 39.1 ± 1.8† La (a) (mmol/L) 0.74 ± 0.09 4.71 ± 0.51* 9.27 ± 1.35*† 12.26 ± 1.98*† La (v) (mmol/L) 1.23 ± 0.32 4.88 ± 0.32* 8.80 ± 1.46*† 11.55 ± 2.16*†
La a-v diff. (mmol/L) -0.45 ± 0.25 0.10 ± 0.28 1.06 ± 0.23*† 1.00 ± 0.24*† Glu (a) (mmol/L) 5.99 ± 0.40 5.83 ± 0.41 5.57 ± 0.38 5.53 ± 0.40 Glu (v) (mmol/L) 5.33 ± 0.42 5.42 ± 0.47 4.70 ± 0.48*† 4.83 ± 0.43*†
a-v diff.[O2/(Glu +1/2 La)] 5.6 ± 0.7 4.2 ± 0.5* 3.0 ± 0.4* 3.8 ± 0.7*
Values are mean ± SE. MAP, mean arterial pressure; MCA, middle cerebral artery; JVP, juglular venous pressure; CVRi, cerebral vascular resistance index; HR, heart rate; SV, stroke volume; Q, cardiac output; pH (a) and pH (v), arterial and venous hydrogen ion concentration; PaO2 and PvO2, arterial and venous O2 tension; SaO2 and SvO2, arterial and venous O2 saturation; SO2 a-v diif., arterial-venous difference of O2 saturation; La (a) and La (v), arterial and venous lactate concentration; La a-v diif., arterial-venous difference of lactate concentration; Glu (a) and Glu (v), arterial and venous glucose concentration; a-v diif. [O2/(Glu + ½ La)], cerebral metabolic ratio of O2/(glucose + ½ lactate). *different from rest (P<0.05); †different from 5 min (P<0.05); ‡different from 15 min (P<0.05).
22H-00948-2004.R2
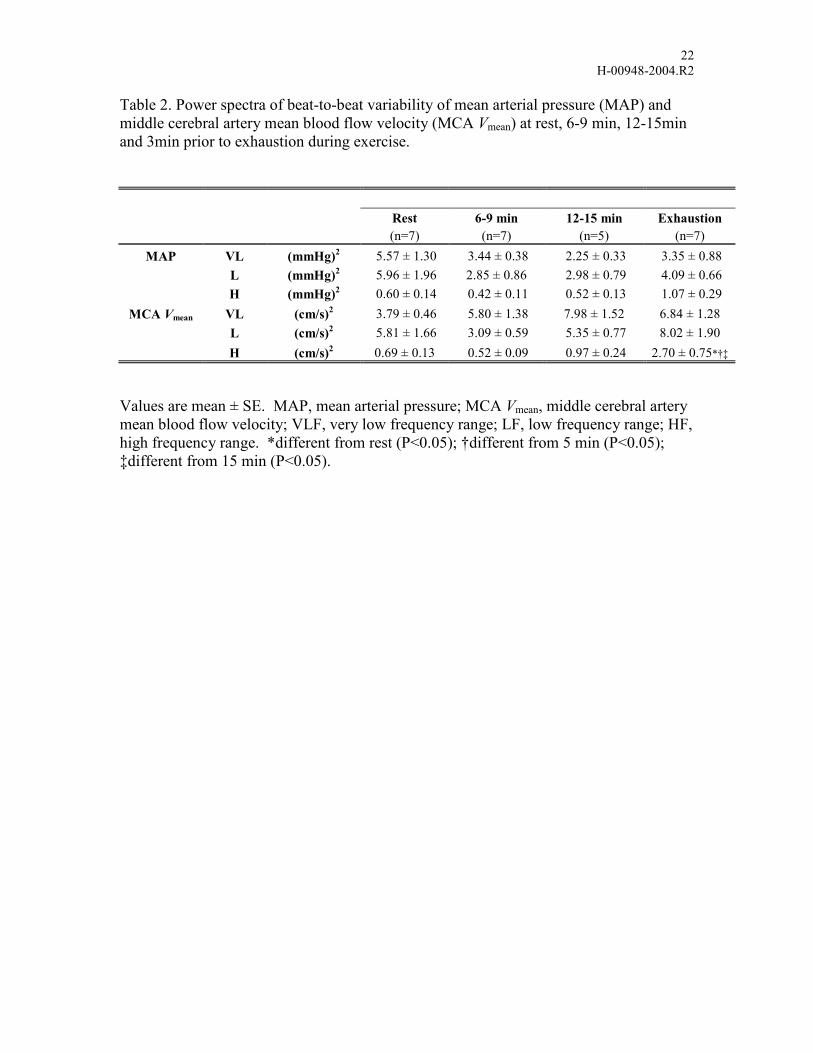
Table 2. Power spectra of beat-to-beat variability of mean arterial pressure (MAP) and middle cerebral artery mean blood flow velocity (MCA Vmean) at rest, 6-9 min, 12-15min and 3min prior to exhaustion during exercise.
Rest 6-9 min 12-15 min Exhaustion (n=7) (n=7) (n=5) (n=7)
MAP VL (mmHg)2 5.57 ± 1.30 3.44 ± 0.38 2.25 ± 0.33 3.35 ± 0.88 L (mmHg)2 5.96 ± 1.96 2.85 ± 0.86 2.98 ± 0.79 4.09 ± 0.66
H (mmHg)2 0.60 ± 0.14 0.42 ± 0.11 0.52 ± 0.13 1.07 ± 0.29 MCA Vmean VL (cm/s)2 3.79 ± 0.46 5.80 ± 1.38 7.98 ± 1.52 6.84 ± 1.28
L (cm/s)2 5.81 ± 1.66 3.09 ± 0.59 5.35 ± 0.77 8.02 ± 1.90 H (cm/s)2 0.69 ± 0.13 0.52 ± 0.09 0.97 ± 0.24 2.70 ± 0.75*†‡
Values are mean ± SE. MAP, mean arterial pressure; MCA Vmean, middle cerebral artery mean blood flow velocity; VLF, very low frequency range; LF, low frequency range; HF, high frequency range. *different from rest (P<0.05); †different from 5 min (P<0.05); ‡different from 15 min (P<0.05).
23H-00948-2004.R2
Figure 1.
Time (sec.)0 200 400 600 800 1000 1200 1400
MA
P(m
mH
g)
40
60
80
100
120
MC
AV m
ean
(cm
/s)
40
60
80
100
120
MAPMCA Vmean
exhaustion (21:30)start exercise

24H-00948-2004.R2
Figure 2.
A
3 4 5 6
MC
AV m
ean
(cm
/s)
40
50
60
70
80
RestExerciseRegression line
MCA Vmean = 33 + PaCO2 * 6.8 (r = 0.47, P=0.04)
5 min
15 min
Exhaustion
B
PaCO2 (kPa)3 4 5 6
SvO
2(%
)
50
55
60
65
70
75SvO2 = 34 + PaCO2 *5 (r = 0.74, P<0.001)
5 min
15 min
Exhaustion

25H-00948-2004.R2
Figure 3.
A
Phas
e(r
adia
n)
-2
-1
0
1
2
Rest6-9 min12-15 minexhaustion
B
Gai
n(c
m/s
/mm
Hg)
0
1
2
3
C
Frequency (Hz)0.05 0.10 0.15 0.20 0.25 0.30
Nor
mal
ized
Gai
n(d
b)
-4-202468
101214
LF range

26H-00948-2004.R2
Figure 4.
A
LFPh
ase
(rad
ian)
0.0
0.1
0.2
0.3
0.4
0.5
0.6
B
LFG
ain
(cm
/s/m
mH
g)
0
1
2
C
Nor
mal
ized
LFG
ain
(db)
0
2
4
6
8
10
D
Rest 6-9 min 12-15 min exhaustion
LFC
oher
anec
(U)
0.500.550.600.650.700.750.800.85
*†*†
* *†
**
*
Related Documents


![Cerebral Perfusion and Cerebral Autoregulation after Cardiac ...downloads.hindawi.com/journals/bmri/2018/4143636.pdftic hypothermia a er cardiac arrest []. Previously, Yenari et al.](https://static.cupdf.com/doc/110x72/60541d03139eb04f8664781d/cerebral-perfusion-and-cerebral-autoregulation-after-cardiac-tic-hypothermia.jpg)