ORIGINAL ARTICLE Dynamic brain functional connectivity modulated by resting-state networks Xin Di • Bharat B. Biswal Received: 5 March 2013 / Accepted: 31 August 2013 Ó Springer-Verlag Berlin Heidelberg 2013 Abstract Studies of large-scale brain functional connectivity using the resting-state functional magnetic resonance imaging have advanced our understanding of human brain functions. Although the evidence of dynamic functional connectivity is accumulating, the variations of functional connectivity over time have not been well characterized. In the present study, we aimed to associate the variations of functional connectivity with the intrinsic activities of resting-state networks during a single resting- state scan by comparing functional connectivity differences between when a network had higher and lower intrinsic activities. The activities of the salience network, default mode network (DMN), and motor network were associated with changes of resting-state functional connectivity. Higher activity of the salience network was accompanied by greater functional connectivity between the fronto- parietal regions and the DMN regions, and between the regions within the DMN. Higher DMN activity was asso- ciated with less connectivity between the regions within the DMN, and greater connectivity between the regions within the fronto-parietal network. Higher motor network activity was correlated with greater connectivity between the regions within the motor network, and smaller connectivity between the DMN regions and fronto-parietal regions, and between the DMN regions and the motor regions. In addition, the whole brain network modularity was positively correlated with the motor network activity, suggesting that the brain is more segregated as sub-systems when the motor network is intrinsically activated. Toge- ther, these results demonstrate the association between the resting-state connectivity variations and the intrinsic activities of specific networks, which can provide insights on the dynamic changes in large-scale brain connectivity and network configurations. Keywords Default mode network Á Dynamic connectivity Á fMRI Á Nonlinear connectivity Á Resting-state Á Salience network Introduction Studies of localization of specific brain regions and their association to cognitive and affective functions have shaped our understanding of the human brain. Recent studies of large-scale brain networks using the resting-state functional magnetic resonance imaging (fMRI) have pro- vided novel insights on how distributed brain regions are functionally integrated (e.g., Biswal et al. 1995, 2010; Fox et al. 2005). Generally, studies on the functional connec- tivity are based upon the temporal correlations between spatially remote neurophysiological events (Friston 1994) with an implicit assumption that the functional connectivity is constant during the observation period. Recent studies demonstrate that the functional connectivity (Allen et al. 2012; Chang and Glover 2010; Handwerker et al. 2012) as well as the spatial extent of the resting-state networks (Kang et al. 2011; Kiviniemi et al. 2011) can vary peri- odically. However, the dynamic changes in functional connectivity have hitherto been overlooked in fMRI studies most likely due to the poor temporal resolution of fMRI. Electronic supplementary material The online version of this article (doi:10.1007/s00429-013-0634-3) contains supplementary material, which is available to authorized users. X. Di Á B. B. Biswal (&) Department of Biomedical Engineering, New Jersey Institute of Technology, University Height, 607 Fenster Hall, Newark, NJ 07102, USA e-mail: [email protected] 123 Brain Struct Funct DOI 10.1007/s00429-013-0634-3

Welcome message from author
This document is posted to help you gain knowledge. Please leave a comment to let me know what you think about it! Share it to your friends and learn new things together.
Transcript

ORIGINAL ARTICLE
Dynamic brain functional connectivity modulatedby resting-state networks
Xin Di • Bharat B. Biswal
Received: 5 March 2013 / Accepted: 31 August 2013
� Springer-Verlag Berlin Heidelberg 2013
Abstract Studies of large-scale brain functional
connectivity using the resting-state functional magnetic
resonance imaging have advanced our understanding of
human brain functions. Although the evidence of dynamic
functional connectivity is accumulating, the variations of
functional connectivity over time have not been well
characterized. In the present study, we aimed to associate
the variations of functional connectivity with the intrinsic
activities of resting-state networks during a single resting-
state scan by comparing functional connectivity differences
between when a network had higher and lower intrinsic
activities. The activities of the salience network, default
mode network (DMN), and motor network were associated
with changes of resting-state functional connectivity.
Higher activity of the salience network was accompanied
by greater functional connectivity between the fronto-
parietal regions and the DMN regions, and between the
regions within the DMN. Higher DMN activity was asso-
ciated with less connectivity between the regions within the
DMN, and greater connectivity between the regions within
the fronto-parietal network. Higher motor network activity
was correlated with greater connectivity between the
regions within the motor network, and smaller connectivity
between the DMN regions and fronto-parietal regions, and
between the DMN regions and the motor regions. In
addition, the whole brain network modularity was
positively correlated with the motor network activity,
suggesting that the brain is more segregated as sub-systems
when the motor network is intrinsically activated. Toge-
ther, these results demonstrate the association between the
resting-state connectivity variations and the intrinsic
activities of specific networks, which can provide insights
on the dynamic changes in large-scale brain connectivity
and network configurations.
Keywords Default mode network � Dynamic
connectivity � fMRI � Nonlinear connectivity �Resting-state � Salience network
Introduction
Studies of localization of specific brain regions and their
association to cognitive and affective functions have
shaped our understanding of the human brain. Recent
studies of large-scale brain networks using the resting-state
functional magnetic resonance imaging (fMRI) have pro-
vided novel insights on how distributed brain regions are
functionally integrated (e.g., Biswal et al. 1995, 2010; Fox
et al. 2005). Generally, studies on the functional connec-
tivity are based upon the temporal correlations between
spatially remote neurophysiological events (Friston 1994)
with an implicit assumption that the functional connectivity
is constant during the observation period. Recent studies
demonstrate that the functional connectivity (Allen et al.
2012; Chang and Glover 2010; Handwerker et al. 2012) as
well as the spatial extent of the resting-state networks
(Kang et al. 2011; Kiviniemi et al. 2011) can vary peri-
odically. However, the dynamic changes in functional
connectivity have hitherto been overlooked in fMRI studies
most likely due to the poor temporal resolution of fMRI.
Electronic supplementary material The online version of thisarticle (doi:10.1007/s00429-013-0634-3) contains supplementarymaterial, which is available to authorized users.
X. Di � B. B. Biswal (&)
Department of Biomedical Engineering,
New Jersey Institute of Technology, University Height,
607 Fenster Hall, Newark, NJ 07102, USA
e-mail: [email protected]
123
Brain Struct Funct
DOI 10.1007/s00429-013-0634-3

Given that dynamic changes in connectivity have been well
documented in electroencephalography (EEG) and mag-
netoencephalography (MEG) studies (Dimitriadis et al.
2012; Rubinov et al. 2009), there is a need to study the
dynamic changes in functional connectivity during the
resting-state.
To better understand the dynamic changes in functional
connectivity, it is critical to identify the factors that mod-
ulate the functional connectivity. Vanhaudenhuyse and
colleagues used a behavioral sampling method to demon-
strate that the awareness of the environment or of self
varies at an approximate frequency of 0.05 Hz, which is
similar to the low-frequency fluctuations that are typically
observed in the resting-state fMRI (Vanhaudenhuyse et al.
2011). Most interestingly, these fluctuations associated
with awareness of self were positively and negatively
correlated with the activities of the default mode network
(DMN) and task positive network, respectively, and vice
versa for the fluctuations associated with awareness of the
environment. As it is difficult to monitor the mental state
during the resting-state fMRI scan, Fan and colleagues
proposed that recording the skin conductance response
during fMRI can reflect psychophysiological states of
autonomic arousal. They demonstrated that the functional
connectivity during the resting-state was modulated by
autonomic arousal (Fan et al. 2012). Similarly, we
hypothesize that changes in the intrinsic activities (low
versus high activities) may reflect the changes in mental
state and therefore be used as an index to determine whe-
ther the mental state modulates the functional connectivity.
Specifically, we divided the fMRI images into two condi-
tions based upon the low and high intrinsic activities of a
particular network. This analysis strategy is similar to the
recent ideas of point process analysis or spontaneous event-
related process (Liu and Duyn 2013; Tagliazucchi et al.
2012; Wu et al. 2013); however, our analysis provides a
mean to associate the changes in the intrinsic activities of a
specific network to the changes in functional connectivity
that may extend to other brain systems.
In the present study, we systematically investigated
whether and how the functional connectivity changes
across the whole brain were associated with different brain
network activities. Spatial independent component analysis
(ICA) was first used to identify brain networks (Beckmann
et al. 2005). Functional connectivity between 160 regions
of interest (ROIs) was then calculated separately when a
network had high or low activities. We characterized the
functional connectivity using simple correlation coefficient
and network properties based on the graph theory (Bull-
more and Sporns 2009). Therefore, we not only investi-
gated single connections that were correlated with network
activity, but also studied how the whole brain integration
and segregation were correlated with network activity.
We were particularly interested in the networks that
were related to the resting-state functions such as the DMN
and salience network (Seeley et al. 2007) among the
commonly studied resting-state networks (Cole et al.
2010). The DMN regions exhibit higher energy consump-
tion and neural activity during the resting-state (Raichle
et al. 2001; Shulman et al. 1997), and receive information
from widely distributed brain regions (Liao et al. 2010;
Yan and He 2011). The salience network is suggested to be
critical when switching (activating and deactivating) dif-
ferent brain networks (Sridharan et al. 2008). Our
hypothesis is that higher salience network activity would
be correlated with increased functional connectivity and
network efficiency of large-scale brain networks, while
higher DMN activity would be correlated with decreased
functional connectivity and network efficiency of brain
networks.
Materials and methods
MRI data set
The resting-state fMRI and anatomical MRI dataset was
derived from the Beijing_Zang dataset of the 1,000 func-
tional connectomes project (http://fcon_1000.projects.
nitrc.org/) (Biswal et al. 2010) (Biswal et al. 2010). This
dataset originally included 198 subjects. Only 191 subject
data remained after removing data due to large head motion,
poor coverage, or failure of image registration. The current
analysis only used the last one-third of the subjects (n = 63,
35F/28 M). The mean age of these subjects was 21.3 years
(range from 18 to 25 years). The MRI data were scanned
using a SIEMENS Trio 3-Tesla scanner at Beijing Normal
University. Two hundred and thirty resting-state functional
images were acquired for each subject with TR of 2 s. The
resolution of the fMRI images was 3.125 9 3.125 9 3 mm
with 64 9 64 9 36 voxels. The T1-weighted three-
dimensional magnetization-prepared rapid gradient echo
(MPRAGE) image was acquired using the following
parameters: 128 slices, TR = 2,530 ms, TE = 3.39 ms,
slice thickness = 1.33 mm, flip angle = 7�, inversion
time = 1,100 ms, FOV = 256 9 256 mm2.
Data analysis overview
The data analysis strategy is illustrated in Fig. 1. After
preprocessing, spatial ICA was first performed on the fMRI
data to identify resting-state networks. For each network of
interest, the correspondent time course was used to divide
the time points into two groups: higher and lower activity
of the network. The time courses of 160 ROIs across whole
brain were then divided into two sets according to the
Brain Struct Funct
123
network activity separation. Correlation differences among
the 160 ROIs were compared between the two sets, and
subsequent network analysis was also performed.
Functional MRI preprocessing
The resting-state fMRI images were preprocessed using the
SPM8 package (http://www.fil.ion.ucl.ac.uk/spm/) under
MATLAB 7.6 environment. After discarding the first two
images of each subject, the remaining functional images
were motion corrected and co-registered to the subject’s
own high-resolution anatomical image. For all the subjects
included in the current analysis, the largest head motion
parameters were smaller than 2 mm or 2�. The anatomical
images were then normalized to the T1 template provided
by SPM8, which was in the Montreal Neurological Institute
(MNI) space. The parameters of anatomical image nor-
malization were then applied to the functional images to
normalize them into the MNI space. At this step, all the
functional images were resampled into 3 9 3 9 3 mm3
voxel size. Finally, all the functional images were spatially
smoothed using a Gaussian kernel with 8 mm full-width at
half-maximum (FWHM). In addition, the anatomical ima-
ges were segmented using the new segment routine in
SPM8 to generate subject specific white matter (WM) and
cerebrospinal fluid (CSF) masks.
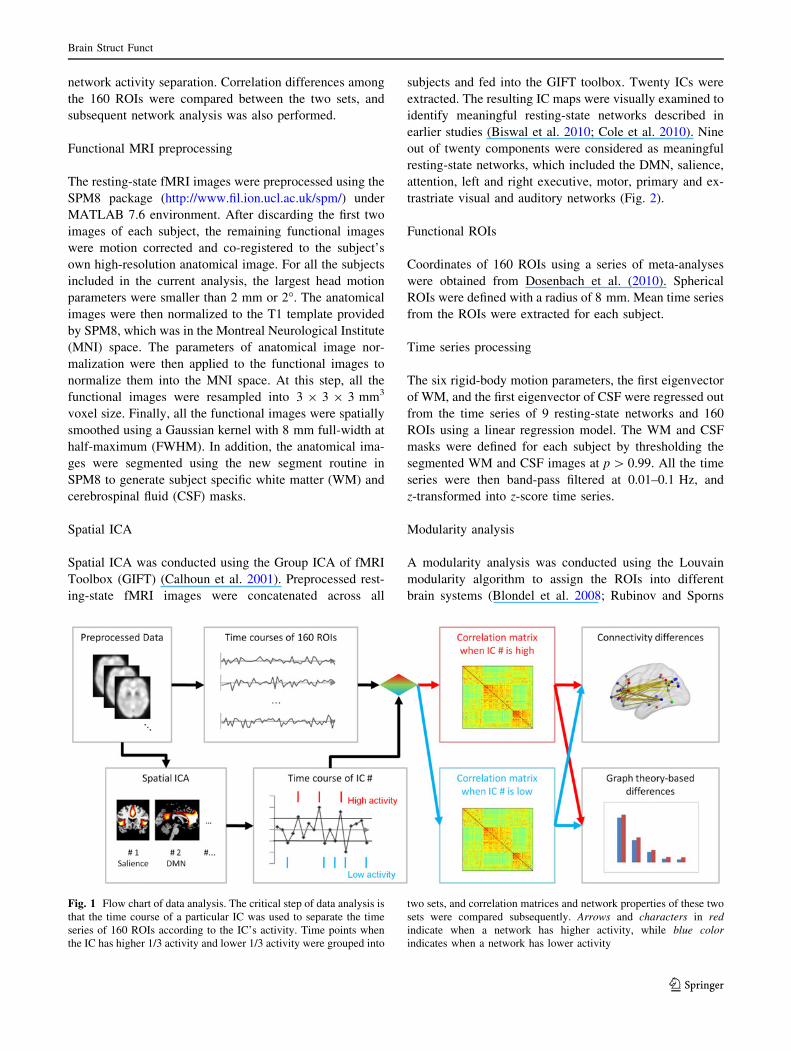
Spatial ICA
Spatial ICA was conducted using the Group ICA of fMRI
Toolbox (GIFT) (Calhoun et al. 2001). Preprocessed rest-
ing-state fMRI images were concatenated across all
subjects and fed into the GIFT toolbox. Twenty ICs were
extracted. The resulting IC maps were visually examined to
identify meaningful resting-state networks described in
earlier studies (Biswal et al. 2010; Cole et al. 2010). Nine
out of twenty components were considered as meaningful
resting-state networks, which included the DMN, salience,
attention, left and right executive, motor, primary and ex-
trastriate visual and auditory networks (Fig. 2).
Functional ROIs
Coordinates of 160 ROIs using a series of meta-analyses
were obtained from Dosenbach et al. (2010). Spherical
ROIs were defined with a radius of 8 mm. Mean time series
from the ROIs were extracted for each subject.
Time series processing
The six rigid-body motion parameters, the first eigenvector
of WM, and the first eigenvector of CSF were regressed out
from the time series of 9 resting-state networks and 160
ROIs using a linear regression model. The WM and CSF
masks were defined for each subject by thresholding the
segmented WM and CSF images at p [ 0.99. All the time
series were then band-pass filtered at 0.01–0.1 Hz, and
z-transformed into z-score time series.
Modularity analysis
A modularity analysis was conducted using the Louvain
modularity algorithm to assign the ROIs into different
brain systems (Blondel et al. 2008; Rubinov and Sporns
Fig. 1 Flow chart of data analysis. The critical step of data analysis is
that the time course of a particular IC was used to separate the time
series of 160 ROIs according to the IC’s activity. Time points when
the IC has higher 1/3 activity and lower 1/3 activity were grouped into
two sets, and correlation matrices and network properties of these two
sets were compared subsequently. Arrows and characters in red
indicate when a network has higher activity, while blue color
indicates when a network has lower activity
Brain Struct Funct
123
2011). The modularity analysis was based on the mean
correlation matrix between 160 time series. This algorithm
takes into account both positive and negative weights of the
network edges and avoids biased thresholding of the net-
works. This analysis identified three modules for the 160
ROIs: the default mode module, the fronto-parietal module,
and the visuomotor module (supplementary Figure S1).
The number of modules is smaller than six, which was
originally reported by Dosenbach et al. (2010), most likely
due to the differences in image preprocessing steps and
modularity algorithm. We adopted the three modules
solution to roughly classify these ROIs into either DMN or
task positive networks. Other task-positive networks, such
as the executive control and dorsal attention networks, are
difficult to separate because these networks are vulnerable
to preprocessing steps as well as different mental states
(Spreng et al. 2013).
Time points separation analysis
Z-transformed time series of each subject from each of the
nine networks were divided into two data sets based on the
amplitude of the time points. The time point with greater
than a z-value of 0.43 (upper 33 %) was categorized into
the high activity dataset, whereas the time point with less
than -0.43 (lower 33 %) were stratified into the low
activity dataset. On average, a single data set comprised of
76 time points. The time points separating analysis was
performed separately for each of the nine networks. We
also conducted time point separation based on upper 50 %
and lower 50 % z-values. The subsequent analysis gener-
ally gave similar results but with less statistical signifi-
cance. Therefore, we only report the results of the upper
and lower 33 % separation.
Comparison of connectivity matrices
The correlation matrices of a given resting-state network
during high or low activity were initially transformed into
Fisher’s z scores. Then, we used a paired t test to compare
the differences in correlation values between high and low
activities for each pair of ROIs. We used a threshold of
p \ 0.0056 (0.05/9) to correct for multiple comparisons of
the nine resting-state network. Then, a false discovery rate
(FDR) correction was used for each analysis to correct for
multiple comparisons of correlations (12,720 edges). The
connections that showed significant changes of functional
connectivity were visualized using the BrainNet Viewer
toolbox (http://www.nitrc.org/projects/bnv/). Given that
the multiple comparison correction may be too stringent,
we used a less stringent correction threshold that corrected
for only the number of edges to illustrate general trends of
functional connectivity changes. These results are reported
in the supplementary materials section.
Fig. 2 Resting-state networks used in the time points separation analysis, which were identified by spatial ICA. The IC maps were spatially
z transformed, and thresholded at z [ 1.96
Brain Struct Funct
123
Comparison of network properties
In addition to the individual correlation coefficients, we
also compared the graph theory-based measures, which
characterize the whole brain functional segregation and
integration (Bullmore and Sporns 2009). These network
properties included modularity (Newman 2006), mean
clustering coefficients, and global efficiency (Watts and
Strogatz 1998). Modularity estimates the extent the whole
network is segregated into sub-communities. The cluster-
ing coefficient measures the efficiency of the local infor-
mation transmission of every node, whereas the global
efficiency measures the information transmission efficiency
of the entire network. Binary unidirectional networks were
built for each condition and for each subject by thres-
holding the absolute correlation matrices to maintain 10, 20
and 30 % of connections (a.k.a., sparsity). These sparsities
were chosen because the brain network was typically fallen
within this range (Achard and Bullmore 2007; He et al.
2008). Network measures were calculated using the brain
connectivity toolbox (Rubinov and Sporns 2010). Differ-
ences between high and low activity of these network
parameters were compared using a paired t test. FDR
correction was applied to a total of 27 comparisons
(3 sparsity 9 3 networks 9 3 parameters).
Results
Out of the nine networks, three networks were associated
with significant functional connectivity changes at the
threshold of p \ 0.05 after correction for the number of
edges and networks, including the salience network, DMN,
and motor network. We observed no significant association
between changes in functional connectivity and network
activities for the other six networks at the threshold of
p \ 0.05 after correcting for the number of edges and
networks.
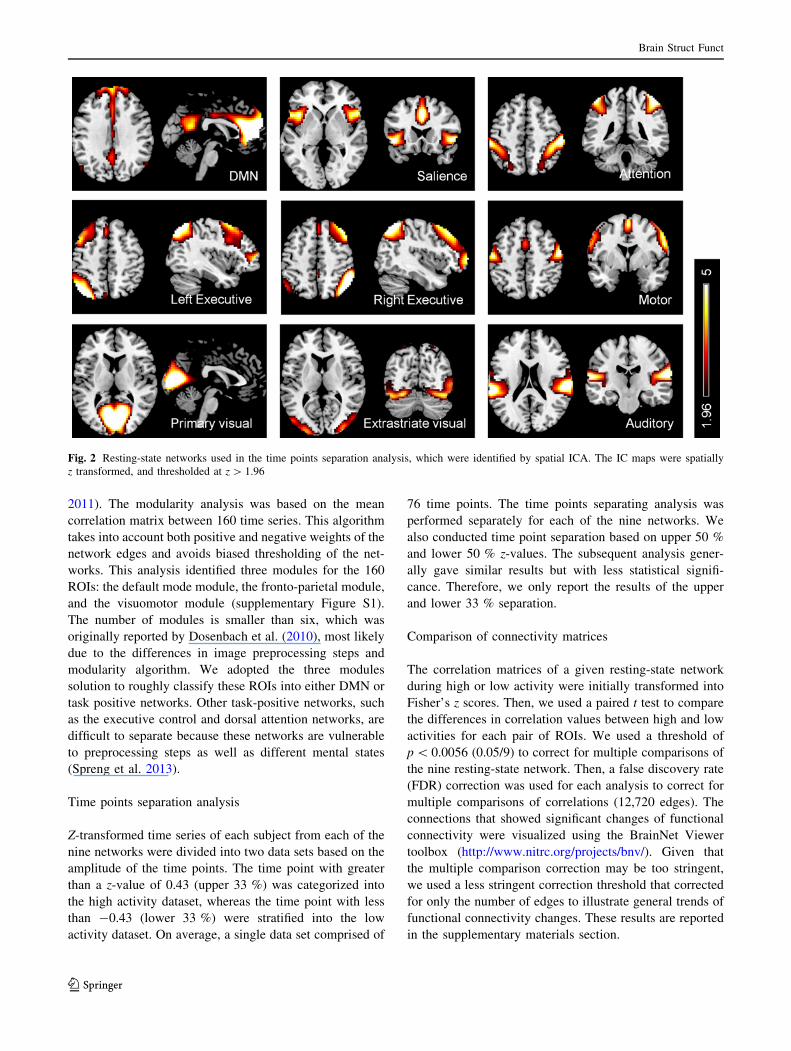
The salience network
The connectivity changes related to the salience network
activity are visualized in Fig. 3. Forty-eight connections
were positively associated with the salience network
activity. A set of connections that exhibited differences in
functional connectivity between the regions of the fronto-
parietal module which were mainly located in the lateral
prefrontal and parietal regions, and the regions of the
default mode module which were mainly located in the
medial prefrontal cortex and the left inferior temporal
lobule. Another set of connections that showed differences
in functional connectivity was mainly among the regions
within the default mode module. Using a less stringent
threshold, an obvious pattern is observable in the functional
connectivity difference matrix (the right panel of the sup-
plementary Figure S2A). These connections that revealed
positive association with the salience network activity
appeared to be predominantly left lateralized (Fig. 3);
however, when using a less stringent threshold, the later-
alized pattern was unclear (supplementary Figure S3). In
contrast, there was only one connection between the left
middle insula and the right temporal region that was neg-
atively correlated with the salience network activity. None
of the modularity, mean clustering coefficient, and global
efficiency measures at the three sparsity levels was asso-
ciated with the salience network activity (Fig. 4a).
The DMN
The functional connectivity changes related to the DMN
activity are shown in Fig. 5. Ten functional connections
revealed weaker functional connectivity when the DMN
exhibited higher compared with lower activity. These
connections were mainly between the posterior cingulate
cortex (PCC) of the default mode module with other
regions of the default mode module. When we applied a
less stringent threshold, we observed that the decrease in
functional connectivity was also among other regions of
the default mode module, including the medial prefrontal
cortex (supplementary Figure S2 and S4). In contrast,
seven connections exhibited increased functional connec-
tivity when the DMN was higher than lower, mainly
between the regions in the fronto-parietal module. When
using a less stringent threshold, it was more apparent that
the increased functional connectivity was mainly between
the fronto-parietal regions, and between the cerebellar and
the default mode regions (Figure S4). Lastly, the global
efficiency was positively associated with the DMN activity
Fig. 3 Functional connectivity differences associated with the
salience network activity. Differences were thresholded at p \ 0.05
after correction for the number of edges and networks
Brain Struct Funct
123

at the sparsity level of 10 % (Fig. 4b). Specifically, the
global efficiency was 0.011 higher when the DMN activity
was higher (t = 3.05, SD = 0.030, p = 3.40 9 10-3).
The motor network
The functional connectivity changes related to the motor
network activity are illustrated in Fig. 6. Twenty-six con-
nections demonstrated higher functional connectivity when
the motor network exhibited higher activity. These regions
involved mainly the bilateral sensorimotor regions. In
contrast, 43 connections showed lower functional connec-
tivity when the motor network had higher activity, which
were between the regions in the default mode module and
the regions in the fronto-parietal module, and between the
regions in the default mode module and the regions in the
visuomotor module. These patterns were more obvious
when using a less stringent threshold (Figure S2 and S5).
Fig. 4 Network properties
associated with the intrinsic
activities of the salience
network (a), DMN (b), and
motor network (c), respectively.
*p \ 0.05 after FDR correction
for all the 27 comparisons
Fig. 5 Functional connectivity differences associated with the DMN
activity. Differences were thresholded at p \ 0.05 after correction for
the number of edges and networks
Fig. 6 Functional connectivity differences associated with the motor
network activity. Differences were thresholded at p \ 0.05 after
correction for the number of edges and networks
Brain Struct Funct
123
In addition, the motor network activity was also asso-
ciated with the network properties (Fig. 4c). For all the
sparsity levels tested, the modularity was higher when the
motor network exhibited high activity. At the sparsity of
10, 20, and 30 % the modularity was 0.025 (t = 3.46,
SD = 0.058, p = 9.82 9 10-4), 0.023 (t = 4.17, SD =
0.044, p = 9.49 9 10-5), and 0.021 (t = 4.08, SD =
0.041, p = 1.33 9 10-4) greater, respectively, when the
motor network exhibited high activity. Lastly, the mean
clustering coefficient was 0.14 higher when the motor
network activity was high at the sparsity level of 10 %
(t = 3.78, SD = 0.030, p = 3.60 9 10-4).
Discussion
The current study systematically examined the association
between the resting-state functional connectivity and the
intrinsic activities of the different resting-state networks by
separating the time points into high and low intrinsic
activities. Three of the nine networks, including the sal-
ience, the DMN, and the motor networks, demonstrated
associations between their intrinsic activities and the rest-
ing-state functional connectivity. In addition, network
properties were also observed to be associated with the
intrinsic activities of different brain networks.
The salience network
The salience network generally comprises of the bilateral
anterior insula and the anterior cingulate cortex, and was
first distinguished from other task-positive networks by
Seeley and colleagues (Seeley et al. 2007). The salience
network is involved in bottom-up detection of salience
events, and plays a key role in switching between large-
scale networks to facilitate the access of resources from
attention and working memory (Menon and Uddin 2010).
One of the roles of the anterior insula was to activate the
executive network and deactivate the DMN across visual,
auditory modalities and in the resting-state as revealed by
Granger causality analysis (Sridharan et al. 2008). Our
result demonstrates that the high activity of the salience
network is associated with increased functional connec-
tivity between the default mode and fronto-parietal exec-
utive networks. This result suggests that the salience
network not only modulates the activities of the two net-
works, but may also modulate the relationships between
them. Given that the causal relationship between the sal-
ience network activity and the changes of functional con-
nectivity is difficult to infer, an alternative explanation may
be that the increased synchrony among these regions in the
default mode and fronto-parietal modules yields higher
salience network activity. The former explanation is more
plausible, because the regions in the salience network are
generally the driving hubs of the whole brain, which sends
information to various regions of the whole brain (Sridh-
aran et al. 2008; Yan and He 2011). Furthermore, the sal-
ience network contains a special type of neurons termed
von Economo neurons, which have large axons to facilitate
rapid relay of salience network signals to other brain
regions (Allman et al. 2005, 2010; Cauda et al. 2013). This
type of neuron may support the special function of the
salience network during modulation of large-scale brain
networks.
The current results also reveal an association between
the salience network activity and the functional connec-
tivity between the regions within the default mode module.
Together with the previous Granger causality studies
showing that the salience network regions are mainly the
driving hubs, whereas the DMN regions are generally the
driven hubs of the brain (Sridharan et al. 2008; Yan and He
2011), these evidences suggest that the salience network
may modulate the DMN integration. This association is in
line with a recent finding that demonstrates a correlation
between the salience network white matter integrity and
DMN functions (Bonnelle et al. 2012). Even though the
subjects are in the resting-state, the salience network con-
tinuously monitors salience events in other sensory
modalities including autonomic arousal (Critchley et al.
2000; Fan et al. 2012). As reported by Fan and colleagues,
the association between increased DMN functional con-
nectivity and increased skin conductance response (Fan
et al. 2012) may be partially explained by the association
between the increased DMN functional connectivity and
increased salience network activity in our current result.
The DMN
The DMN, mainly comprised of the PCC/precuneus,
medial prefrontal cortex, and bilateral inferior parietal lobe,
was first defined by Raichle and colleagues based on the
observation that this set of brain regions showed higher
energy consumption during the resting-state compared with
when performing tasks (Raichle et al. 2001). The regions in
this network are usually deactivated during task execution
(Laird et al. 2009; Shulman et al. 1997), and their activities
are anticorrelated with task positive regions during the
resting-state (Fox et al. 2005). Surprisingly, the current
study demonstrates that the increase in DMN activity is
mainly accompanied by smaller functional connectivity
between the regions within the default mode module. The
decrease of within-DMN functional connectivity extends to
other regions in the default mode modules when using a
less stringent threshold (Supplementary Figure S4). This is
in contrast with the finding from other networks, e.g., the
motor network, where the network activity is positively
Brain Struct Funct
123
associated with the within-network functional connectivity.
One possible explanation of the negative correlation may
be that the DMN is heterogeneous, and is comprised of
different fractions (Andrews-Hanna et al. 2010; Laird et al.
2009); thus, the increased DMN activity is accompanied by
relative independence of these sub-networks within the
DMN to support heterogeneous functions.
Increased activity of the DMN is positively associated
with wide spread functional connectivity between the
regions in the fronto-parietal module, and between the
default mode and the cerebellar regions. However, the
connections that conveyed increased functional connec-
tivity did not show a clear pattern (the right panel of Figure
S2B) as compared with those in the salience and the motor
network (the right panels of Figure S2A and S2C). Net-
work analysis further reveals that the increase of functional
connectivity may result in higher global efficiency that
facilitates global information transmission. This may sug-
gest that higher internal oriented state as indexed by higher
DMN intrinsic activity (Vanhaudenhuyse et al. 2011) may
be associated with high integration across the whole brain.
However, we note that the increase of global efficiency was
only observed at the specific sparsity level of 10 %, and
therefore, these effects warrant future studies.
The motor network
The motor network activity was positively covaried with
the functional connectivity between the motor network
regions, while negatively correlated with the functional
connectivity between the default mode and the fronto-
parietal regions, and between the default mode and the
visuomotor regions. The associations between the motor
network activity and within-motor network synchroniza-
tion is reasonable, and is in line with the studies showing
that performing of a motor task is accompanied by both the
activations of the motor areas and increase in functional
connectivity between them (e.g., Zhuang et al. 2005).
However, it is interesting to observe that the functional
connectivity decreases between regions from different
brain systems when the motor network activity increases,
especially between the default mode and the fronto-parietal
regions, and between the default mode and the visuomotor
regions. Further, graph theory-based analysis reveals that
the modularity of the whole brain network increases at all
the three sparsity levels, and the mean clustering coeffi-
cient increases at the sparsity level of 10 % as the motor
network activity increases. These results suggest that the
brain network is more segregated as independent modules
and more locally organized when the motor network has
higher intrinsic activity (Bullmore and Sporns 2009). Thus,
we show within a single resting-state session, network
reconfiguration occurs to facilitate local information
processing and suppress information from other systems.
Whether the same network configuration will occur when
subjects explicitly perform a motor task needs further in-
depth exploration.
Dynamic connectivity
In addition to the recent findings that showed dynamic
functional connectivity in the resting-state (Allen et al.
2012; Chang and Glover 2010; Handwerker et al. 2012),
the current study demonstrates that the variations of rest-
ing-state functional connectivity are correlated with the
activity of other networks. The current results suggest a
functional significance of the dynamic functional connec-
tivity, and motivate theories based upon the dynamics of
connectivity to explain complex brain function. In addition,
the framework presented in the current analysis may be
used to understand the mechanisms underlying mental
disorders, such as schizophrenia (Menon 2011; Palani-
yappan and Liddle 2012). For example, alterations of the
salience network structures and functions (Chan et al.
2011; Palaniyappan and Liddle 2012) and impaired func-
tional connectivity between the DMN and the central
executive network (Manoliu et al. 2013a, b) were both
observed in patients with schizophrenia. The present results
directly revealed a link between the salience network
activity and the functional connectivity between the DMN
and the fronto-parietal regions, which may shed light on
the mechanism of schizophrenia.
One outcome of dynamic connectivity is the reconfigura-
tion of brain networks. In addition to previous studies
showing brain network reconfiguration during learning or
different cognitive loads (Bassett et al. 2011; Kitzbichler et al.
2011), the current study reveals for the first time that whole
brain network properties, especially the modularity, varied
within a single resting-state scan session. The link between
modularity changes and the activity of a specific network may
provide new insight on the dynamic organization of the brain
network. Further in-depth analyses of whether modularity
structures or hub organizations change during the resting-
state are needed. The method used in the present study pro-
vides a framework to study network reconfigurations in
resting-state as well as conventional task fMRI data.
Lastly, the method adopted in the present study is only
an approximate measure of modulation effects. Such
method is limited by both statistical power and causal
inferences. More sophisticated models such as nonlinear
dynamic causal model (DCM) (Friston et al. 2003; Seghier
and Friston 2013; Stephan et al. 2008), and Granger cau-
sality (Goebel et al. 2003; Liao et al. 2009, 2010, 2011)
may be used in the future to study dynamic connectivity to
provide a more accurate and valuable causal information of
the modulation effects.
Brain Struct Funct
123

Acknowledgments This study was supported by a National Institute
of Health grant 5R01AG032088. We thank Suril Gohel and Dr. Eun
H. Kim for discussions on data analysis and comments on an earlier
version of this manuscript.
References
Achard S, Bullmore E (2007) Efficiency and cost of economical brain
functional networks. PLoS Comput Biol 3:e17. doi:10.1371/
journal.pcbi.0030017
Allen EA, Damaraju E, Plis SM, et al. (2012) Tracking whole-brain
connectivity dynamics in the resting state. Cereb cortex (New
York, NY: 1991). doi:10.1093/cercor/bhs352
Allman JM, Watson KK, Tetreault NA, Hakeem AY (2005) Intuition
and autism: a possible role for Von Economo neurons. Trends
Cogn Sci 9:367–373. doi:10.1016/j.tics.2005.06.008
Allman JM, Tetreault NA, Hakeem AY et al (2010) The von
Economo neurons in frontoinsular and anterior cingulate cortex
in great apes and humans. Brain Struct Funct 214:495–517.
doi:10.1007/s00429-010-0254-0
Andrews-Hanna JR, Reidler JS, Sepulcre J et al (2010) Functional-
anatomic fractionation of the brain’s default network. Neuron
65:550–562
Bassett DS, Wymbs NF, Porter MA et al (2011) Dynamic reconfig-
uration of human brain networks during learning. Proc Natl Acad
Sci USA 108:7641–7646. doi:10.1073/pnas.1018985108
Beckmann CF, DeLuca M, Devlin JT, Smith SM (2005) Investiga-
tions into resting-state connectivity using independent compo-
nent analysis. Philos Trans R Soc Lond B Biol Sci
360:1001–1013. doi:10.1098/rstb.2005.1634
Biswal B, Yetkin FZ, Haughton VM, Hyde JS (1995) Functional
connectivity in the motor cortex of resting human brain using echo-
planar MRI. Magn Reson Med: Off J Soc Magn Reson Med/Soc
Magn Reson Med 34:537–541. doi:10.1002/mrm.1910340409
Biswal BB, Mennes M, Zuo X-N et al (2010) Toward discovery
science of human brain function. Proc Natl Acad Sci USA
107:4734–4739. doi:10.1073/pnas.0911855107
Blondel VD, Guillaume J-L, Lambiotte R, Lefebvre E (2008) Fast
unfolding of communities in large networks. J Stat Mech: Theory
Exp 2008:P10008. doi:10.1088/1742-5468/2008/10/P10008
Bonnelle V, Ham TE, Leech R, et al. (2012) Salience network
integrity predicts default mode network function after traumatic
brain injury. Proc Natl Acad Sci 109(12):4690–4695. doi:10.
1073/pnas.1113455109
Bullmore E, Sporns O (2009) Complex brain networks: graph
theoretical analysis of structural and functional systems. Nat Rev
Neurosci 10:186–198. doi:10.1038/nrn2575
Calhoun VD, Adali T, Pearlson GD, Pekar JJ (2001) A method for
making group inferences from functional MRI data using
independent component analysis. Hum Brain Mapp 14:140–151
Cauda F, Torta DME, Sacco K et al (2013) Functional anatomy of
cortical areas characterized by Von Economo neurons. Brain
Struct Funct 218:1–20. doi:10.1007/s00429-012-0382-9
Chan RCK, Di X, McAlonan GM, Gong Q (2011) Brain anatomical
abnormalities in high-risk individuals, first-episode, and chronic
schizophrenia: an activation likelihood estimation meta-analysis
of illness progression. Schizophr Bull 37:177–188. doi:10.1093/
schbul/sbp073
Chang C, Glover GH (2010) Time-frequency dynamics of resting-
state brain connectivity measured with fMRI. NeuroImage
50:81–98. doi:10.1016/j.neuroimage.2009.12.011
Cole DM, Smith SM, Beckmann CF (2010) Advances and pitfalls in
the analysis and interpretation of resting-state FMRI data.
Frontiers Syst Neurosci 4:8. doi:10.3389/fnsys.2010.00008
Critchley HD, Elliott R, Mathias CJ, Dolan RJ (2000) Neural activity
relating to generation and representation of galvanic skin
conductance responses: a functional magnetic resonance imaging
study. J Neurosci 20:3033–3040
Dimitriadis SI, Laskaris NA, Tsirka V et al (2012) An EEG study of
brain connectivity dynamics at the resting state. Nonlinear
Dynamics, Psychol Life Sci 16:5–22
Dosenbach NUF, Nardos B, Cohen AL et al (2010) Prediction of
individual brain maturity using fMRI. Science (New York, NY)
329:1358–1361. doi:10.1126/science.1194144
Fan J, Xu P, Van Dam NT et al (2012) Spontaneous brain activity
relates to autonomic arousal. J Neurosci 32:11176–11186
Fox MD, Snyder AZ, Vincent JL et al (2005) The human brain is
intrinsically organized into dynamic, anticorrelated functional
networks. Proc Natl Acad Sci USA 102:9673–9678
Friston KJ (1994) Functional and effective connectivity in neuroim-
aging: a synthesis. Hum Brain Mapp 2:56–78. doi:10.1002/hbm.
460020107
Friston KJ, Harrison L, Penny W (2003) Dynamic causal modelling.
NeuroImage 19:1273–1302
Goebel R, Roebroeck A, Kim D-S, Formisano E (2003) Investigating
directed cortical interactions in time-resolved fMRI data using
vector autoregressive modeling and Granger causality mapping.
Magn Reson Imaging 21:1251–1261
Handwerker DA, Roopchansingh V, Gonzalez-Castillo J, Bandettini
PA (2012) Periodic changes in fMRI connectivity. NeuroImage.
doi:10.1016/j.neuroimage.2012.06.078
He Y, Chen Z, Evans A (2008) Structural insights into aberrant
topological patterns of large-scale cortical networks in Alzhei-
mer’s disease. J Neurosci: Off J Soc Neurosci 28:4756–4766.
doi:10.1523/JNEUROSCI.0141-08.2008
Kang J, Wang L, Yan C et al (2011) Characterizing dynamic
functional connectivity in the resting brain using variable
parameter regression and Kalman filtering approaches. Neuro-
Image 56:1222–1234. doi:10.1016/j.neuroimage.2011.03.033
Kitzbichler MG, Henson RNA, Smith ML et al (2011) Cognitive
effort drives workspace configuration of human brain functional
networks. J Neurosci: Off J Soc Neurosci 31:8259–8270. doi:10.
1523/JNEUROSCI.0440-11.2011
Kiviniemi V, Vire T, Remes J et al (2011) A sliding time-window
ICA reveals spatial variability of the default mode network
in time. Brain Connect 1:339–347. doi:10.1089/brain.2011.
0036
Laird AR, Eickhoff SB, Li K et al (2009) Investigating the functional
heterogeneity of the default mode network using coordinate-
based meta-analytic modeling. J Neurosci: Off J Soc Neurosci
29:14496–14505. doi:10.1523/JNEUROSCI.4004-09.2009
Liao W, Marinazzo D, Pan Z et al (2009) Kernel Granger causality
mapping effective connectivity on FMRI data. IEEE Trans Med
Imaging 28:1825–1835. doi:10.1109/TMI.2009.2025126
Liao W, Mantini D, Zhang Z et al (2010) Evaluating the effective
connectivity of resting state networks using conditional Granger
causality. Biol Cybern 102:57–69
Liao W, Ding J, Marinazzo D et al (2011) Small-world directed
networks in the human brain: multivariate Granger causality
analysis of resting-state fMRI. NeuroImage 54:2683–2694.
doi:10.1016/j.neuroimage.2010.11.007
Liu X, Duyn JH (2013) Time-varying functional network information
extracted from brief instances of spontaneous brain activity. Proc
Natl Acad Sci 110(11):4392–4397. doi:10.1073/pnas.1216856110
Manoliu A, Riedl V, Doll A et al (2013a) Insular dysfunction reflects
altered between-network connectivity and severity of negative
symptoms in schizophrenia during psychotic remission. Frontiers
Humn Neurosci. doi:10.3389/fnhum.2013.00216
Manoliu A, Riedl V, Zherdin A, et al. (2013b) Aberrant dependence
of default mode/central executive network interactions on
Brain Struct Funct
123

anterior insular salience network activity in Schizophrenia.
Schizophr Bull. doi:10.1093/schbul/sbt037
Menon V (2011) Large-scale brain networks and psychopathology: a
unifying triple network model. Trends Cogn Sci 15:483–506.
doi:10.1016/j.tics.2011.08.003
Menon V, Uddin LQ (2010) Saliency, switching, attention and
control: a network model of insula function. Brain Struct Funct
214:655–667. doi:10.1007/s00429-010-0262-0
Newman MEJ (2006) Modularity and community structure in
networks. Proc Natl Acad Sci USA 103:8577–8582. doi:10.
1073/pnas.0601602103
Palaniyappan L, Liddle PF (2012) Does the salience network play a
cardinal role in psychosis? An emerging hypothesis of insular
dysfunction. J Psychiatry Neurosci: JPN 37:17–27. doi:10.1503/
jpn.100176
Raichle ME, MacLeod AM, Snyder AZ et al (2001) A default mode
of brain function. Proc Natl Acad Sci USA 98:676–682. doi:10.
1073/pnas.98.2.676
Rubinov M, Sporns O (2010) Complex network measures of brain
connectivity: uses and interpretations. NeuroImage 52:1059–1069.
doi:10.1016/j.neuroimage.2009.10.003
Rubinov M, Sporns O (2011) Weight-conserving characterization of
complex functional brain networks. NeuroImage 56:2068–2079.
doi:10.1016/j.neuroimage.2011.03.069
Rubinov M, Knock SA, Stam CJ et al (2009) Small-world properties
of nonlinear brain activity in schizophrenia. Hum Brain Mapp
30:403–416. doi:10.1002/hbm.20517
Seeley WW, Menon V, Schatzberg AF et al (2007) Dissociable intrinsic
connectivity networks for salience processing and executive
control. J Neurosci: Off J Soc Neurosci 27:2349–2356. doi:10.
1523/JNEUROSCI.5587-06.2007
Seghier ML, Friston KJ (2013) Network discovery with large DCMs.
NeuroImage 68:181–191. doi:10.1016/j.neuroimage.2012.12.005
Shulman GL, Fiez JA, Corbetta M et al (1997) Common blood flow
changes across visual tasks: II. decreases in cerebral cortex.
J Cogn Neurosci 9:648–663. doi:10.1162/jocn.1997.9.5.648
Spreng RN, Sepulcre J, Turner GR et al (2013) Intrinsic architecture
underlying the relations among the default, dorsal attention, and
frontoparietal control networks of the human brain. J Cogn
Neurosci 25:74–86. doi:10.1162/jocn_a_00281
Sridharan D, Levitin DJ, Menon V (2008) A critical role for the right
fronto-insular cortex in switching between central-executive and
default-mode networks. Proc Natl Acad Sci USA 105:12569–12574.
doi:10.1073/pnas.0800005105
Stephan KE, Kasper L, Harrison LM et al (2008) Nonlinear dynamic
causal models for fMRI. NeuroImage 42:649–662. doi:10.1016/
j.neuroimage.2008.04.262
Tagliazucchi E, Balenzuela P, Fraiman D, Chialvo DR (2012)
Criticality in large-scale brain FMRI dynamics unveiled by a
novel point process analysis. Frontiers Physiol 3:15. doi:10.
3389/fphys.2012.00015
Vanhaudenhuyse A, Demertzi A, Schabus M et al (2011) Two distinct
neuronal networks mediate the awareness of environment and of
self. J Cogn Neurosci 23:570–578. doi:10.1162/jocn.2010.21488
Watts DJ, Strogatz SH (1998) Collective dynamics of ‘‘small-world’’
networks. Nature 393:440–442. doi:10.1038/30918
Wu G-R, Liao W, Stramaglia S et al (2013) A blind deconvolution
approach to recover effective connectivity brain networks from
resting state fMRI data. Med Image Anal 17:365–374. doi:10.
1016/j.media.2013.01.003
Yan C, He Y (2011) Driving and driven architectures of directed
small-world human brain functional networks. PLoS ONE
6:e23460. doi:10.1371/journal.pone.0023460
Zhuang J, LaConte S, Peltier S et al (2005) Connectivity exploration
with structural equation modeling: an fMRI study of bimanual
motor coordination. NeuroImage 25:462–470. doi:10.1016/j.
neuroimage.2004.11.007
Brain Struct Funct
123
Related Documents